CN1251609A - Method and product for analyzing polymers - Google Patents
Method and product for analyzing polymers Download PDFInfo
- Publication number
- CN1251609A CN1251609A CN98803852A CN98803852A CN1251609A CN 1251609 A CN1251609 A CN 1251609A CN 98803852 A CN98803852 A CN 98803852A CN 98803852 A CN98803852 A CN 98803852A CN 1251609 A CN1251609 A CN 1251609A
- Authority
- CN
- China
- Prior art keywords
- polymer
- station
- signal
- unit
- light
- Prior art date
- Legal status (The legal status is an assumption and is not a legal conclusion. Google has not performed a legal analysis and makes no representation as to the accuracy of the status listed.)
- Pending
Links
Images


Classifications
-
- C—CHEMISTRY; METALLURGY
- C12—BIOCHEMISTRY; BEER; SPIRITS; WINE; VINEGAR; MICROBIOLOGY; ENZYMOLOGY; MUTATION OR GENETIC ENGINEERING
- C12Q—MEASURING OR TESTING PROCESSES INVOLVING ENZYMES, NUCLEIC ACIDS OR MICROORGANISMS; COMPOSITIONS OR TEST PAPERS THEREFOR; PROCESSES OF PREPARING SUCH COMPOSITIONS; CONDITION-RESPONSIVE CONTROL IN MICROBIOLOGICAL OR ENZYMOLOGICAL PROCESSES
- C12Q1/00—Measuring or testing processes involving enzymes, nucleic acids or microorganisms; Compositions therefor; Processes of preparing such compositions
- C12Q1/68—Measuring or testing processes involving enzymes, nucleic acids or microorganisms; Compositions therefor; Processes of preparing such compositions involving nucleic acids
- C12Q1/6869—Methods for sequencing
-
- C—CHEMISTRY; METALLURGY
- C12—BIOCHEMISTRY; BEER; SPIRITS; WINE; VINEGAR; MICROBIOLOGY; ENZYMOLOGY; MUTATION OR GENETIC ENGINEERING
- C12Q—MEASURING OR TESTING PROCESSES INVOLVING ENZYMES, NUCLEIC ACIDS OR MICROORGANISMS; COMPOSITIONS OR TEST PAPERS THEREFOR; PROCESSES OF PREPARING SUCH COMPOSITIONS; CONDITION-RESPONSIVE CONTROL IN MICROBIOLOGICAL OR ENZYMOLOGICAL PROCESSES
- C12Q1/00—Measuring or testing processes involving enzymes, nucleic acids or microorganisms; Compositions therefor; Processes of preparing such compositions
- C12Q1/68—Measuring or testing processes involving enzymes, nucleic acids or microorganisms; Compositions therefor; Processes of preparing such compositions involving nucleic acids
- C12Q1/6809—Methods for determination or identification of nucleic acids involving differential detection
-
- G—PHYSICS
- G01—MEASURING; TESTING
- G01N—INVESTIGATING OR ANALYSING MATERIALS BY DETERMINING THEIR CHEMICAL OR PHYSICAL PROPERTIES
- G01N21/00—Investigating or analysing materials by the use of optical means, i.e. using sub-millimetre waves, infrared, visible or ultraviolet light
- G01N21/01—Arrangements or apparatus for facilitating the optical investigation
- G01N21/03—Cuvette constructions
- G01N21/05—Flow-through cuvettes
-
- G—PHYSICS
- G01—MEASURING; TESTING
- G01N—INVESTIGATING OR ANALYSING MATERIALS BY DETERMINING THEIR CHEMICAL OR PHYSICAL PROPERTIES
- G01N21/00—Investigating or analysing materials by the use of optical means, i.e. using sub-millimetre waves, infrared, visible or ultraviolet light
- G01N21/62—Systems in which the material investigated is excited whereby it emits light or causes a change in wavelength of the incident light
- G01N21/63—Systems in which the material investigated is excited whereby it emits light or causes a change in wavelength of the incident light optically excited
- G01N21/64—Fluorescence; Phosphorescence
- G01N21/6428—Measuring fluorescence of fluorescent products of reactions or of fluorochrome labelled reactive substances, e.g. measuring quenching effects, using measuring "optrodes"
-
- G—PHYSICS
- G01—MEASURING; TESTING
- G01N—INVESTIGATING OR ANALYSING MATERIALS BY DETERMINING THEIR CHEMICAL OR PHYSICAL PROPERTIES
- G01N33/00—Investigating or analysing materials by specific methods not covered by groups G01N1/00 - G01N31/00
- G01N33/48—Biological material, e.g. blood, urine; Haemocytometers
- G01N33/483—Physical analysis of biological material
- G01N33/487—Physical analysis of biological material of liquid biological material
- G01N33/48707—Physical analysis of biological material of liquid biological material by electrical means
- G01N33/48721—Investigating individual macromolecules, e.g. by translocation through nanopores
-
- B—PERFORMING OPERATIONS; TRANSPORTING
- B01—PHYSICAL OR CHEMICAL PROCESSES OR APPARATUS IN GENERAL
- B01J—CHEMICAL OR PHYSICAL PROCESSES, e.g. CATALYSIS OR COLLOID CHEMISTRY; THEIR RELEVANT APPARATUS
- B01J2219/00—Chemical, physical or physico-chemical processes in general; Their relevant apparatus
- B01J2219/00274—Sequential or parallel reactions; Apparatus and devices for combinatorial chemistry or for making arrays; Chemical library technology
- B01J2219/0068—Means for controlling the apparatus of the process
- B01J2219/00702—Processes involving means for analysing and characterising the products
- B01J2219/00707—Processes involving means for analysing and characterising the products separated from the reactor apparatus
-
- B—PERFORMING OPERATIONS; TRANSPORTING
- B01—PHYSICAL OR CHEMICAL PROCESSES OR APPARATUS IN GENERAL
- B01L—CHEMICAL OR PHYSICAL LABORATORY APPARATUS FOR GENERAL USE
- B01L3/00—Containers or dishes for laboratory use, e.g. laboratory glassware; Droppers
- B01L3/50—Containers for the purpose of retaining a material to be analysed, e.g. test tubes
- B01L3/502—Containers for the purpose of retaining a material to be analysed, e.g. test tubes with fluid transport, e.g. in multi-compartment structures
- B01L3/5027—Containers for the purpose of retaining a material to be analysed, e.g. test tubes with fluid transport, e.g. in multi-compartment structures by integrated microfluidic structures, i.e. dimensions of channels and chambers are such that surface tension forces are important, e.g. lab-on-a-chip
-
- G—PHYSICS
- G01—MEASURING; TESTING
- G01N—INVESTIGATING OR ANALYSING MATERIALS BY DETERMINING THEIR CHEMICAL OR PHYSICAL PROPERTIES
- G01N21/00—Investigating or analysing materials by the use of optical means, i.e. using sub-millimetre waves, infrared, visible or ultraviolet light
- G01N21/01—Arrangements or apparatus for facilitating the optical investigation
- G01N21/03—Cuvette constructions
- G01N2021/0346—Capillary cells; Microcells
-
- G—PHYSICS
- G01—MEASURING; TESTING
- G01N—INVESTIGATING OR ANALYSING MATERIALS BY DETERMINING THEIR CHEMICAL OR PHYSICAL PROPERTIES
- G01N21/00—Investigating or analysing materials by the use of optical means, i.e. using sub-millimetre waves, infrared, visible or ultraviolet light
- G01N21/62—Systems in which the material investigated is excited whereby it emits light or causes a change in wavelength of the incident light
- G01N21/63—Systems in which the material investigated is excited whereby it emits light or causes a change in wavelength of the incident light optically excited
- G01N21/64—Fluorescence; Phosphorescence
- G01N21/6428—Measuring fluorescence of fluorescent products of reactions or of fluorochrome labelled reactive substances, e.g. measuring quenching effects, using measuring "optrodes"
- G01N2021/6432—Quenching
-
- G—PHYSICS
- G01—MEASURING; TESTING
- G01N—INVESTIGATING OR ANALYSING MATERIALS BY DETERMINING THEIR CHEMICAL OR PHYSICAL PROPERTIES
- G01N21/00—Investigating or analysing materials by the use of optical means, i.e. using sub-millimetre waves, infrared, visible or ultraviolet light
- G01N21/62—Systems in which the material investigated is excited whereby it emits light or causes a change in wavelength of the incident light
- G01N21/63—Systems in which the material investigated is excited whereby it emits light or causes a change in wavelength of the incident light optically excited
- G01N21/64—Fluorescence; Phosphorescence
- G01N21/6428—Measuring fluorescence of fluorescent products of reactions or of fluorochrome labelled reactive substances, e.g. measuring quenching effects, using measuring "optrodes"
- G01N2021/6439—Measuring fluorescence of fluorescent products of reactions or of fluorochrome labelled reactive substances, e.g. measuring quenching effects, using measuring "optrodes" with indicators, stains, dyes, tags, labels, marks
- G01N2021/6441—Measuring fluorescence of fluorescent products of reactions or of fluorochrome labelled reactive substances, e.g. measuring quenching effects, using measuring "optrodes" with indicators, stains, dyes, tags, labels, marks with two or more labels
-
- G—PHYSICS
- G01—MEASURING; TESTING
- G01N—INVESTIGATING OR ANALYSING MATERIALS BY DETERMINING THEIR CHEMICAL OR PHYSICAL PROPERTIES
- G01N21/00—Investigating or analysing materials by the use of optical means, i.e. using sub-millimetre waves, infrared, visible or ultraviolet light
- G01N21/62—Systems in which the material investigated is excited whereby it emits light or causes a change in wavelength of the incident light
- G01N21/63—Systems in which the material investigated is excited whereby it emits light or causes a change in wavelength of the incident light optically excited
- G01N21/64—Fluorescence; Phosphorescence
- G01N21/645—Specially adapted constructive features of fluorimeters
- G01N2021/6482—Sample cells, cuvettes
-
- Y—GENERAL TAGGING OF NEW TECHNOLOGICAL DEVELOPMENTS; GENERAL TAGGING OF CROSS-SECTIONAL TECHNOLOGIES SPANNING OVER SEVERAL SECTIONS OF THE IPC; TECHNICAL SUBJECTS COVERED BY FORMER USPC CROSS-REFERENCE ART COLLECTIONS [XRACs] AND DIGESTS
- Y10—TECHNICAL SUBJECTS COVERED BY FORMER USPC
- Y10S—TECHNICAL SUBJECTS COVERED BY FORMER USPC CROSS-REFERENCE ART COLLECTIONS [XRACs] AND DIGESTS
- Y10S435/00—Chemistry: molecular biology and microbiology
- Y10S435/97—Test strip or test slide
-
- Y—GENERAL TAGGING OF NEW TECHNOLOGICAL DEVELOPMENTS; GENERAL TAGGING OF CROSS-SECTIONAL TECHNOLOGIES SPANNING OVER SEVERAL SECTIONS OF THE IPC; TECHNICAL SUBJECTS COVERED BY FORMER USPC CROSS-REFERENCE ART COLLECTIONS [XRACs] AND DIGESTS
- Y10—TECHNICAL SUBJECTS COVERED BY FORMER USPC
- Y10S—TECHNICAL SUBJECTS COVERED BY FORMER USPC CROSS-REFERENCE ART COLLECTIONS [XRACs] AND DIGESTS
- Y10S435/00—Chemistry: molecular biology and microbiology
- Y10S435/973—Simultaneous determination of more than one analyte
Abstract
Methods and products for analyzing polymers are provided. The methods include methods for determining various other structural properties of the polymers.
Description
Background of the invention
Research into molecular and cellular biology is focusing on the macroscopic structure of cells. It is now known that cells have complex microstructures that determine their function. The great diversity associated with cell structure and function depends on the ability of the cell to assemble various building blocks into various compounds. It is by cells that this task is accomplished by assembling a limited number of building blocks called monomers into polymers. The key to the diversification of polymer function is based on the primary sequence of the monomers within the polymer and is essential to understanding the basis of cellular function, e.g., why cells differ in a certain behavior, or how they will respond to a certain drug treatment.
The ability to determine the structure of the polymer by determining its sequence is essential for understanding each active ingredient and the role that this ingredient plays in the cell. By determining the sequence of the polymer, one can map its expression, determine the protein it expresses, and understand why certain mutations cause disease, and determine whether the deletion or mutation of a monomer results in a polysaccharide with better or no function.
Expression profiling involves the determination of the expression pattern of the mRNA. For understanding genetic programming, both temporal and spatial, it is highly desirable to identify differently expressed mrnas. During the different time sequences of organism life growth, different genes are sometimes turned on or off, including embryonic, growth, and old age. In addition to these changes in growth period, there are transient changes in responsiveness to various stimuli, such as injury, drugs, xenobiotics, and stress. If one can map changes in a cell's response to a stimulus or in growth in time, one can generate a so-called transient expression profile. On the other hand, there are also so-called ontological expression maps, which include a discriminatory knowledge of gene expression for different tissues and cell types. Expression profiles vary not only between individuals and species, but also between diseased and healthy. Examination of differential gene expression can lead to findings critical to a variety of genes, such as signaling (Smith et al, 1990), circadian rhythm (Loros et al, 1989), fruit ripening (Wilinson et al, 1995), starvation (Qu et al, 1996), cell cycle control (el-Deiry et al, 1993), andischemic injury (Wang et al, 1995), among others. Since making expression profiles involves sequencing and identifying cDNA or mRNA, faster sequencing means that many gene expression profiles can be made more quickly.
Currently, only about 1% of the human genome is sequenced, while less has been done on other genomes. In addition, there is only one human expression map that has been mapped incompletely using expression sequence markers (Adams et al, 1995). Current methods of genome sequencing are slow and involve numerous laboratory tasks, such as cloning, establishing genomic libraries, selecting colonies, and sequencing, among others. The time taken to build a partial genomic library is on the order of several months. Even after the genomic library is established, it takes time to prepare DNA for sequencing and to perform the respective steps of actual sequencing. Due to the increasing effects of these disadvantages, it is clear that sequencing a genome also requires a significant investment of money, time, and labor.
In general, DNA sequencing is currently performed in one of two ways. The first method is relatively popular, the dideoxy chain termination method described by Sanger et al in 1977. The method involves enzymatically synthesizing a DNA molecule that terminates in a dideoxynucleotide. Using ddntps, a population of DNA molecules can be synthesized that terminate at each position of the target DNA. Subsequent analysis can yield information about the length of the DNA molecule and the base at which the molecule terminates (i.e., A, C, G or T). From this information, the sequence of the DNA can be determined. The second method is the Maxam-Gilbert sequencing method (Maxam and Gilbert, 1977), which utilizes chemical degradation to generate molecules that degrade at certain positions of the target DNA. Knowing the specific cleavage of the chemical reaction and the length of the fragment, the sequence of the DNA can be generated. Both methods rely on polyacrylamide gel electrophoresis and photographic recognition of radioactive DNA fragments. Each method requires 1-3 days. Sanger sequencing reactions only yielded 300-800 bases at a time.
Various methods have been proposed to improve the results of sequencing information using Sanger method. These Sanger-based methods include multiplex sequencing, capillary gel electrophoresis, and automated gel electrophoresis, among others. Recently, there has been much interest in developing various methods independent of the Sanger method. These various methods, which are independent of Sanger's method, employ completely different mechanisms to obtain base information. Such methods include the latest techniques, including Scanning Electron Microscopy (SEM), mass spectrometry, Enzymatic fluorescent inorganic Pyrophosphate Detection Assay sequencing (ELIDA), exogenous nuclease sequencing, and sequencing by hybridization. A brief summary of these methods is provided in the relevant sections later herein.
Currently, automated gel electrophoresis is the most widely used method for large-scale sequencing. This automated method requires real-time reading of fluorescently labeled Sanger fragments using a Charge Coupled Device (CCD) detector. Four different dideoxy chain termination reactions were performed using different labeled primers. The reaction mixtures were combined and electrophoresed together on a polyacrylamide plate. Using laser excitation at the end of the gel, separate DNA fragments can be obtained and sequence information can be obtained using a computer. There are many commercially available automated sequencers, each of which uses different detection methods and labels. Of these, the most effective is the practical biosystem Model 377XI (Applied Biosystems Model 377XI) which can handle the maximum practical amount of 115,200 bases per day.
In the capillary gel electrophoresis method, a reaction sample is analyzed by a capillary having a small diameter and filled with a gel. The capillary (50 μm) with a small diameter allows heat to be effectively dissipated during electrophoresis. Thus, the separation time per reaction can be reduced to about 20 minutes using very high field strengths without excessive Joule heating (400V/m). They not only separate bases more rapidly, but also have higher resolution than conventional gel electrophoresis. Furthermore, a large number of capillaries were analysed in parallel (Wooley and Mathies, 1995), and the resulting base information was enhanced (the actual efficiency was equal to 200,000 bases/day). The greatest disadvantage is that it is not possible to load the capillary continuously, since a newly filled capillary must be prepared as soon as each reaction is carried out. Capillary gel electrophoresis instruments have recently been commercialized.
Multiplex sequencing is a more efficient method of using electrophoretic gels (Churchand Kieffer-Higgins, 1988). Samples of the Sanger reaction were first labeled with unique oligomers and then up to 20 different samples were processed on each electrophoretic lane. The samples were then blotted onto membranes. The blotting membrane was then probed sequentially with oligomers corresponding to the labels on the Sanger reaction samples. The blotting membrane was then repeatedly washed and probed until the sequence was determined for all 20 samples. Although the number of gel runs is significantly reduced, the washing and hybridization steps required are as laborious as gel electrophoresis. The actual sequencing rate is similar to that of automated gel electrophoresis.
The sequencing method of the mass spectrometer was introduced for the first time in the late eighties. Recent developments in this area have allowed better sequencing (Crain, 1990; Little et al, 1994; Keugh et al, 1993; Smirnov et al, 1996). Massspectrometer sequencing first requires the creation of nested DNAs that differ in length from each other by only one base. In one example, a 33-mer is partially digested with exogenous nucleases (Smirnov, 1996). A population of molecules with similar 5 'ends but different 3' termination points is then generated. The reaction mixture was then analyzed. The sensitivity of the mass spectrometer is sufficient to distinguish the difference in mass between the individual fragments, thereby obtaining information about the sequence.
Mass spectrometer sequencing is a highly accurate, inexpensive, and rapid method compared to conventional methods. However, the main limitation is that the length of the bases read is in the order of 10. Even the best methods, such as Matrix-Assisted Laser Desorption Ionization Time-of-Flight (MALDITOF) mass spectrometers, read only up to 80-90 base pairs in length. Reading of longer DNA is practically impossible because those longer DNA fragments at the place of guanidine in the analysis step. Therefore, mass spectrometry sequencing is limited to very short primer sequences and has no practical application value for large-scale sequencing.
Scanning tunneling electron microscopy (STM) sequencing (Ferrell, 1997) was developed at the time STM was commercialized. It was originally thought that it could be used to directly read base pair information by electron microscopy, but this was no longer possible. Because the DNA molecules must be placed on a conductor, typically graphite (HOPG) or gold, which is highly pyrolyzed. However, these materials lack binding sites that firmly retain the DNA against the electronic and physical forces generated at the tunnel end. Electrostatic forces can be used to adsorb DNA molecules to the relevant surface, but this is difficult. Even if DNA is successfully immobilized, it is difficult to distinguish information of bases because the required resolution is very high. According to current technology, purines can be separated from pyrimidines, however, no specific purine as well as pyrimidine can be identified. To achieve this result, electron microscopy was required to distinguish between the aldehyde and amine groups on purines and whether the pyrimidine had a methyl group on it.
Enzymatic fluorescent inorganic pyrophosphate detection assay (ELIDA) sequencing employs detection of pyrophosphate released from DNA polymerization to determine the successive bases added. Pyrophosphate released by DNA polymerization is converted to ATP by ATP sulfurylase, and ATP production is continuously monitored with firefly luciferase. To determine the base specificity, the method employs successive washes with ATP, CTP, GTP, and TTP. If the washing of ATP produces pyrophosphate, 1 or more adenosine is added. The number of bases added is directly proportional to the pyrophosphate produced. The reaction of many ELIDA can be analyzed simultaneously in parallel to improve the information on the sequences produced.
The main drawback is the short length of the read. Ronaghi et al (Ronaghi et al, 1996) only successfully read a length of 15 bases because multiple washes were required. Since each base read requires 4 washes, this means that every 100 bases read requires 400 washes. If 1% of the starting material is lost per wash, only 1.85 of the starting material remains after 400 washes, which is insufficient for detection.
Exogenous nuclease sequencing involves single-stranded DNA molecules labeled with a fluorescent substance, which are suspended in a fluid and sequentially cleaved by an exogenous nuclease. The single fluorescent base is released and passed through a single molecular detection system. The order of detection of the labeled nucleotides corresponds to the sequence of the DNA (Ambrose et al, 1993; Davis et al, 1992; jet et al, 1989). Large fragments of 10,000bp can theoretically be sequenced at a rate of 10 base pairs per second using a continuous exogenous nuclease.
In fact, exogenous nuclease sequencing suffers from a number of problems at each step. The labeling step requires that all 4 bases in the DNA be labeled with different fluorophores. This is very disadvantageous in terms of the spatial structure. Ambrose et al obtained a complete marker for both bases on the 7kb strand of M13 DNA in 1993. Furthermore, suspending DNA in a fluid also requires difficult optical capture. This step is time consuming and requires a high degree of expertise. Furthermore, there is a need for efficient detection of individual fluorophore molecules. The 1% error is significant at this time. The detection efficiency was improved from 65% to 95% when it had been obtained. This increase in efficiency has reached a limit and it is difficult to obtain further improvements.
In the method of sequencing by hybridization, the target DNA is probed sequentially with sequences that include all possible oligomers. The sequence of the target DNA is obtained based on the hybridization pattern between the oligomer and the target (Bains, 1991; Cantor et al, 1992; Drmanac et al, 1994) as grasped. There are two possible approaches to probing for target DNA. One is the so-called "Probe Up" method, in which the target DNA is immobilized on a substrate and probed with a series of oligomers. Yet another is the so-called "Probe Down" method, which requires a series of oligomers to be immobilised on a substrate and then hybridised to the target DNA. With the advent of "DNA chips", the use of microchip synthesis technology for DNA probes, thousands of different DNA probes are arrayed over an area of 1 square centimeter, making the down-line probing method more practical. The up-line probing method requires 8-mer, 65,536 consecutive probes and washes, which requires a significant amount of time. On the other hand, down-probing hybridization yields data ina few seconds. In the case of good hybridization, a 65,536 8-mer would be defined as a maximum of 170 bases. 700 base pairs can be sequenced using 65,536 "mixed" 11-mers.
In practice, the up-line probing method has been used to sequence sequences of about 100 base pairs. Due to the non-integrity of the hybridization, it is difficult to generate an accurate sequence. The bias in hybridization is amplified by many times. An error rate of 1% reduces the maximum length that can be sequenced by at least 10%. Thus, if 1% of 65,536 oligonucleotides produce false positive hybridization signals in hybridizing to a 200-mer DNA target, 75% of the resulting "hybridizations" are false (Bains, 1997). In this case, the sequence cannot be determined. The conclusion is that hybridization must be extremely efficient to generate reasonable data. Furthermore, the sequencing by hybridization has a problem when there is duplication in a sequence one base less than the probe. When such sequences are present, there are multiple possible sequences for the hybridization data.
The most common limitation to these methods is the short length of the read. In practice, a short read length means that the linear order to the target DNA is also determined beforeAdditional information on the genetic sequence needs to be obtained. The short fragment is bridged with additional overlapping sequences. Theoretically, a minimum of 9X 10 is required for a read length of 500 bases9The individual bases are sequenced first and then can be applied to all 3X 10 of the human genome9The individual bases were correctly sequenced. In reality, the base sequence required to generate a reliable genome is approximately 2X 10¹⁰A single base. In comparison to the various prior art, only that unrealistic exogenous nuclease method has a theoretical long-chain read-out capability. Other methods have only short-chain theoretical read-out capabilities andin practice have shorter read-out capabilities. In order to reduce the number of bases that need to be sequenced, it is clear that the read length is improved.
Protein sequencing generally involves the removal of chemically induced sequences and the determination of terminal amino acid residues, for example, the Edman degradation method [ see, Stryer, L., biochemistry, W.H.Freeman and Co., San Francisco (1981) pp.24-27]. The Edman degradation method requires polypeptides having free amino groups capable of reacting with isocyanates. The isocyanate is typically phenyl isocyanate. This intramolecular adduct reacts with the nearest amino group on the polymer backbone to form a five-membered ring. This addition causes rearrangement and the terminal amino acid residue is subsequently cleaved with strong acid. The released Phenylthiohydantoin (PTH) of amino acids was identified and the shortened polymers were subjected to repeated cycles of degradation and analysis.
Further, several new methods have been developed to sequence the carboxy terminal ends of polypeptides [ see, Inglis, a.s., anal. biochem.195: 183-196(1991)]. Carboxyl terminal sequencing mimics Edman degradation, however, degradation is involved in order from the other end of the polymer [ see, Inglis, a.s., anal.biochem.195: 183-196(1991)]. Like Edman degradation, the carboxy-terminal sequencing method involves chemically induced sequential removal, as well as the determination of the terminal amino acid residue.
More recently, polypeptide sequencing methods have been described in which a set of nests of polymer fragments (a set of defined sequences) is prepared and then subjected to mass spectrometry [ see Chait, b.t.et. Science 257: 1885-94(1992)]. Comparing the difference between the mass spectrum result of the detected fragment and the mass spectrum data of the known amino acid residue to determine the sequence. Although this DNA sequencing requires the formation of a set of nests (defining sequences) of polymer fragments, this approach is essentially different from conventional protein sequencing methods which involve the sequential removal and determination of each residue. Although this method has practical potential, it has encountered some problems and has not been proven to be an effective method.
Each of these known methods of sequencing polymers has its own drawbacks. For example, most methods are slow and labor intensive. Gel-based DNA sequencing methods require about 1-3 days to sequence a 300-800 unit polymer. Whereas the mass microscopy and ELIDA methods only make it possible to sequence very short polymers.
There is a continuing need for a method of determining polymer sequence from end to end for a number of reasons. The rate of sequencing limits the ability to generate multiple individuals and transient expression profiles that undoubtedly help to rapidly determine complex genetic functions. What is also needed is an improved method of analyzing polymers that is accelerated in speed to be useful in the diagnosis of disease and in the preparation of new drugs. Summary of the invention
The present invention relates to novel methods and products for analyzing polymers, and in particular to novel methods and products for determining polymer sequences. The present invention surprisingly possesses further advantages over the prior art in polymer sequencing. Prior to the present invention, no method or methods used in combination could approach the sequencing rates obtained by the present invention. By using the method of the invention, the sequencing speed of the whole human genome can be improved by several orders of magnitude compared with the conventional method. In addition to sequencing the entire genome, the methods and products of the invention can also be used to establish exhaustive and multiplexed expressionprofiles for disease processes and their development. The ability to sequence an individual's genome and generate multiple expression profiles would greatly enhance the ability to determine the abnormal basis of the course and appearance of any disease.
The method of analyzing a polymer according to the present invention is based on the individual analysis of each unit of the polymer. By examining each unit individually, the type of unit and its position on the polymer backbone can be determined. This can be done by placing a unit on the station and checking for changes that occur when the unit approaches the station. These changes may be the result of interactions occurring between the unit and the station or its ligand and are specific for that particular unit. For example, if the polymer is a nucleic acid molecule, when T is in close proximity to the station, then a change specific for T occurs. On the other hand, if G is in a close-to-station position, then a change specific to G will occur. The specificity changes that occur depend on the station used and the type of polymer being analyzed. For example, the change may be a change in the electromagnetic signal as a result of the interaction.
The methods of the present invention broadly include two types of methods for analyzing a polymer by determining a unit (or sometimes a group of units) within the polymer. The first category of methods involves the analysis of at least one single polymer. The individual units of a single polymer, on the one hand, cause an interaction with the agent, produce a change, such as energy transfer or quenching, and produce a signal. The signal is indicative of the identity of the unit. In another aspect, an individual unit arrives at a station, producing a physical change that is detectable to the unit or station. This change in the cell or station produces a signal characteristic of that cell that can be detected. The second category of methods involves the analysis of numerous polymers. One unit of each polymer is placed at a position where interaction can occur at the station. This interaction produces a polymer-dependent impulse and is specifically representative of the unit. The polymer-dependent pulses may result from, for example, energy transfer, quenching, changes in conductivity, mechanical changes, changes in resistance, or other physical changes.
The method of analyzing polymers of the present invention is particularly useful for determining sequence units within DNA molecules and can eliminate the need to create genomic libraries, clones, and colony picks, which are major limiting factors in sequencing methods at the genomic level. The methods described herein provide for longer sequence reads than are possible with the prior art, as well as millions of faster sequence reads. The read lengths provided are on the order of hundreds of thousands of nucleotides. This means that the need for overlapping and redundant sequences is significantly reduced, as well as the actual amount of DNA that needs to be sequenced before the genome can be established.
The invention also relates to a method for preparing the polymer for analysis. The long read length is combined with the new preparation method to obtain a more rational and efficient method. Furthermore, the actual read time for a given unit of polymer is several million times faster than the prior art because the novel device of the present invention provides a very large amount of parallel amplification, which is called a nanochannel plate (nanochannel plate) or microchannel plate (microchannel plate). Combining these components results in a method of analysis of polymers including sequencing that would bring great improvements to the fields of molecular biology and cell biology.
The sequencing capability of the methods described herein for polymers such as genomic DNA will have a tremendous impact on biomedicine. Acquiring genetic information at such a rapid rate will speed up the completion of the human genome project. The methods and products of the invention will enable the establishment of multiple expression profiles for each individual, thereby allowing an understanding of the complete human genetic program. Comparing the genetic data of a population of individuals at the same time would be the first to be able to easily discover not only single gene diseases, but also complex polygenic diseases quickly when the DNA is sequenced.
One aspect of the invention relates to a method of analyzing linked units. The method involves contacting a plurality of individual units of the polymer with a reagent comprising electromagnetic radiation, a quenching source, a fluorescence excitation source, and the like, wherein the interaction of the individual units with the reagent produces a detectable signal, and sequentially detecting the signal from said interaction, thereby analyzing the polymer. In one embodiment, the signal is electromagnetic radiation. In another embodiment, the agent is electromagnetic radiation. According to another embodiment of the invention, the individual units of the polymer are labeled with a fluorescent substance.
A plurality of units of the polymer can be sequentially exposed to electromagnetic radiation, positioned proximate to the light-emitting compound, and irradiated with the electromagnetic radiation, wherein the plurality of units of the polymer have a detectable effect on the electromagnetic radiation of the light-emitting compound. In another embodiment, the plurality of individual units of the polymer are exposed to electromagnetic radiation, wherein the electromagnetic radiation produces a detectable signal to the electromagnetic radiation of the plurality of individual units of the polymer.
According to another embodiment of the invention, the method of the invention involves moving a polymer through nanochannels in a Wall Material (Wall Material) to capture a detectable signal. The plurality of individual units of the polymer are sequentially exposed to the agent by moving the polymer through a nanochannel in the wall material, leaving the plurality of individual units of the polymer exposed to the agent at the interaction station of the nanochannel. The agent may be attached (embedded, covalently bound, or surface coated) to the wall material. In one embodiment, the wall material comprises a plurality of nanochannels, each nanochannel having an interaction station, a plurality of polymers being moved through the nanochannels, only one polymer passing through the interaction station at any given time (if there is no overlap, more than one polymer may be present in a nanochannel), and signals resulting from the interaction of individual units of the polymer with the reagent at the interaction station being detected. The nanochannel is preferably fixed in the wall material.
The detected signals may be stored in a database for further analysis. In one analytical method, these signals can be compared to the signal of the other polymer to determine the correlation of the two polymers. In addition, the detected signal can also be compared to known signal characteristics of known polymers to determine a correlation between the detected polymer and the known polymer. The analysis may also involve measuring the time interval between the detection of a first signal from a first unit and the detection of a second signal from a second unit. In one embodiment, the plurality of individual units is two units, the first unit at one end of the polymer and the second unit at the other end of the polymer. The time interval between successive detection signals at this time can indicate the distance between two units or the length of the polymer.
The polymer may be any type of polymer known in the art. In a preferred embodiment, the polymer is selected from the group consisting of nucleic acids and proteins. In a more preferred embodiment, the polymer is a nucleic acid.
The units of the polymer that interact with the reagent to produce the signal are labeled. These cells may be internally marked or externally marked. In one embodiment, only a portion of the units of the polymer are labeled. In another embodiment, all units are labeled. In yet another embodiment, at least two units of the polymer are labeled differently to produce two different detectable signals. The units of the polymer may be labeled such that each unit or a particular portion of the units is labeled, or may be randomly labeled.
In another embodiment, a plurality of individual units of the polymer are exposed to at least two stations in different regions of the nanochannel, wherein interaction between the units of the polymer and the at least two stations produces at least two signals.
In one embodiment, individual units of the polymer are radiation labeled and the signal is electromagnetic radiation in the form of fluorescence.
In another embodiment, the units are exposed to reagents at a testing station. The preferred station is a non-liquid material.
In another embodiment, a plurality of individual units of the polymer are exposed to at least two agents, and the units of the polymer and the at least two agents generate at least two signals. The at least two agents may be located in different regions of the nanochannel through which the polymer passes. In one embodiment, the at least two signals are different signals. In another embodiment, the at least two signals are the same signal.
According to another aspect of the present invention, a method of analyzing a polymer of linked units is also provided. Themethod includes the steps of moving a plurality of individual units of the polymer of linked units relative to the station and analyzing the polymer by determining sequential signals produced by the detectable physical change in the polymer or station as the individual units pass through the station. This aspect of the invention also accommodates the various embodiments described above.
In another embodiment, the station is an interaction station where individual units are exposed to reagents that interact with the individual units to produce detectable electromagnetic radiation signals characteristic of the interaction. In another embodiment, the station is a signal generating station, and the characteristic signal generated is a polymer-dependent pulse. The preferred station is a non-liquid material.
In another embodiment of the invention, a method of analyzing a polymer is a linked unit by exposing a plurality of individual units of the polymer to a station attached to a wall material having a surface defining a passageway to produce a non-ionic conducting signal resulting from exposure of the units of the polymer to the station. This aspect of the invention also accommodates the various embodiments described above.
According to another aspect of the invention, there is also provided a method of identifying individual units of a polymer. The method involves the steps of temporarily exposing an individual unit of the polymer to an agent selected from the group consisting of electromagnetic radiation, a quenching source, and a fluorescence excitation source, the individual unit being unknown, producing a detectable electromagnetic radiation signal characteristic of the individual unit, detecting the signal, and distinguishing the signal from signals produced by adjacent signal producing units from the polymer as an indication of the identity of the individual unit.
The agent may be one or more fluorophores, and preferably at least three fluorophores. When an individual unit is temporarily exposed to one or more fluorophores (reagents) by being within the energy transfer region of the reagent, the transfer of fluorescent energy occurs between the reagent and the individual unit. Measurement of the fluorescence energy allows detection of the signal.
In one embodiment, the individual units of the polymer are exposed to the reagent by placing the individual units in an interaction station comprising nanochannels in the wall material. The preferred wall material comprises at least two layers, one layer capable of generating a signal and the other layer preventing generation of a signal, and the nanochannel extends through both layers.
According to another aspect of the invention, a method of identifying individual units of a polymer is provided. The method comprises the steps of temporarily moving an individual unit of the polymer, which is unknown, relative to the station, detecting a signal resulting from a detectable physical change in the unit or station, and distinguishing said signal from signals resulting from neighbouring signal producing units of the polymer relative to the station as an indication of the identity of the individual unit. This aspect of the invention accommodates each of the embodiments described above.
In one embodiment, the station is an interaction station where an individual element is exposed to a detectable electromagnetic radiation signal that interacts with the individual element and produces a characteristic of the interaction. In another embodiment, the station is a signal generating station and the characteristic signal generated is a polymer dependent pulse.
Another aspect of the invention is a method of determining the proximity of two individual units of a polymer of linked units.The method comprises the steps of moving the polymer relative to the station, exposing the individual units to the station to generate a characteristic signal resulting from a detectable physical change of the unit or station, detecting the generated characteristic signal, measuring the time interval between the detection points of each characteristic signal, the amount of the time interval being indicative of the proximity of the two individual units.
In another embodiment, the station is an interaction station. In yet another embodiment, the interaction station comprises a reagent, and the reagent is selected from the group consisting of electromagnetic radiation, a quenching source, and a fluorescence excitation source, and the characteristic signal is a detectable electromagnetic radiation signal. In another embodiment, the interaction station is a nanochannel in the wall material.
In certain other embodiments, the station is a signal generating station. In another embodiment, the signal producing station includes a physical pulse source that interacts with the polymer to produce a signal characteristic of the physical pulse. In one embodiment, the physical pulse results from a change in a physical quantity, such as a change in resistance or conductivity caused by exposure of a physical pulse source to a unit of the polymer. In one embodiment, the physical pulse results from a change in capacitance or resistance caused by movement of a unit of the polymer between a microelectrode or nanoelectrode located in its vicinity. These changes in resistance or conductivity that occur as a result of the cell passing through the electrodes are specific to the cell. In another embodiment, the physical pulse is generated from a radioactive signal released by the unit. In another embodiment, they are generated from piezoelectric patches, direct physical contact, and NMR-nuclear spin signals.
The polymer may be of any type known in the art. In a preferred embodiment, the polymer is selected from the group consisting of nucleic acids and proteins. In a more preferred embodiment, the polymer is a nucleic acid. The polymers may be randomly or non-randomly labeled. Different labels may be used for different cells to generate different signals. In one embodiment, individual units of the polymer are labeled with fluorophores.
Another aspect of the invention provides a method of determining the order of two individual units of a polymer of linked units. The method involves the steps of linearly moving the polymer relative to the station, exposing one individual element to the station to produce a signal resulting from a detectable physical change in the element or station, exposing another individual element to the station to produce a second detectable signal different from the first signal resulting from a detectable physical change in the element or station, and determining the order of the signals as an indication of the order of the two individual elements.
In one embodiment, the stations are interaction stations. In another embodiment, the interaction station comprises reagents selected from the group consisting of electromagnetic radiation, a quenching source, and a fluorescence excitation source, and the characteristic signal produced is an electromagnetic radiation signal. In another embodiment, the interaction station is a nanochannel in the wall material.
In some other embodiments, the station is a signal generating station. In another embodiment, the signal producing station comprises a physical pulse source that interacts with the polymer to produce a characteristic signal, i.e., a physical pulse. In one embodiment, the unit exposing the physical pulse source to the polymer causes a change in physical quantities such as resistance and capacitance, thereby generating a physical pulse. In one embodiment, the physical pulse results from a change in capacitance or resistance caused by movement of a unit of polymer between microelectrodes or nanoelectrodes positioned in proximity thereto. For example, the signal generating station may comprise a microelectrode or nanoelectrode positioned at an end opposite the polymer unit. The changes in resistance and capacitance caused by movement of a unit that is a polymer through the electrodes will be specific to that unit. In another embodiment, the physical pulse is generated from a radioactive signal released by the unit. In another embodiment, it is generated from piezoelectric pads, direct physical contact, and NMR-nuclear spin signals.
The polymer may be of any type known in the art. In a preferred embodiment, the polymer is selected from the group consisting of nucleic acids and proteins. In a more preferred embodiment, the polymer is a nucleic acid. The polymers may be randomly or non-randomly labeled. Different labels may be used for different cells to generate different signals. In one embodiment, individual units of the polymer are labeled with fluorophores. In another embodiment, individual units of the polymer are radiolabeled.
According to another aspect of the invention, a method of determining the distance between two individual units of a polymer of linked units is provided. The method comprises the steps of passing the polymer linearly through the station relative to the station, detecting characteristic signals generated as each of the two units passes through the station, determining the time interval between the signals obtained, repeating steps 1, 2 and 3 for a plurality of similar polymers to generate a set of data, analyzing the set of data, and determining the distance between the two individual units based on information obtained from the plurality of similar polymers.
In one embodiment, the stations are interaction stations. In another embodiment, the interaction station comprises reagents selected from the group consisting of electromagnetic radiation, a quenching source, and a fluorescence excitation source, and the characteristic signal produced is an electromagnetic radiation signal. In another embodiment, the interaction station is a nanochannel in the wall material.
In some other embodiments, the station is a signal generating station. In another embodiment, the signal producing station comprises a physical pulse source that interacts with the polymer to produce a characteristic signal, i.e., a physical pulse. In one embodiment, the unit exposing the physical pulse source to the polymer causes a change in physical quantities such as resistance and capacitance, thereby generating a physical pulse. In one embodiment, the physical pulse results from a change in capacitance or resistance caused by movement of a unit of polymer between microelectrodes or nanoelectrodes positioned in proximity thereto. For example, the signal generating station may comprise a microelectrode or nanoelectrode positioned at an end opposite the polymer unit. The changes in resistance and capacitance caused by movement of a unit that is a polymer through the electrodes will be specific to that unit. In another embodiment, the physical pulse is generated from a radioactive signal released by the unit. In another embodiment, it is generated from piezoelectric pads, direct physical contact, and NMR-nuclear spin signals.
The polymer may be of any type known in the art. In a preferred embodiment, the polymer is selected from the group consisting of nucleic acids and proteins. In a more preferred embodiment, the polymer is a nucleic acid. The polymers may be randomly or non-randomly labeled. Different labels may be used for different cells to generate different signals. In one embodiment, individual units of the polymer are labeled with fluorophores.
According to another embodiment of the invention, the plurality of similar polymers is a homogenous population. In another embodiment, the plurality of similar polymers is a heterogeneous population.
In another embodiment, said steps 1-4 are performed substantially simultaneously.
According to another aspect of the invention, a method for performing resonance energy transfer and quenching assays for two interacting ligands that can undergo resonance energy transfer or quenching is disclosed. The method comprises the steps of placing two ligands in sufficient proximity to each other that said resonance energy transfer and quenching can occur, applying to one of the ligands an agent selected from the group consisting of electromagnetic radiation, a quenching source and a fluorescence excitation source, using a shielding material to effect resonance energy transfer and quenching of fluorescence occurring during electromagnetic radiation emission and interaction between said ligands, and detecting the emitted electromagnetic radiation. In a preferred embodiment, the shielding material is a conductive shielding material.
In another aspect of the invention is a method of analyzing a polymer of linked units. The method comprises the steps of providing a polymer of labelled linked units, detecting signals from unit-specific markers of less than all of the units, storing the detected signatures of said signals and analysing the polymer. In one embodiment, all unit specific markers are detected. In another embodiment, the polymer is partially and randomly labeled with a unit specific label. In another embodiment, only a fraction of the unit specific markers are detected. In another embodiment, all units of the polymer are labeled with unit-specific labels.
In one embodiment, the polymer of the labeled linked units is exposed to an agent selected from the group consisting of electromagnetic radiation, a quenching source, and a fluorescence excitation source, the interaction between the unit specific marker of the polymer and the agent producing a signal.
In one embodiment, the signal is detected linearly. In another embodiment, the signature of signals comprises at least 10 signals, preferably 20 signals. The signature of the signal comprises any information about the polymer. Preferably, the signature of the signal comprises information about the order, distance and unit specific markers.
In another embodiment, the polymer of the linked unit is labeled and moved relative to the station to generate a signal at the station resulting from exposure of the unit specific marker of the polymer to the station. The station may be an interaction station.
The method in some embodiments is a method of identifying a unit-specific marker of a polymer, the identification of the unit-specific marker being indicative of the identity of at least one unit of the polymer. The unit specific marker is transiently exposed to the test station and generates a signal characteristic of said unit specific marker that is distinguishable from signals generated by adjacent polymer signal generating unit specific markers and indicative of the identity of the unit specific marker. The station may be an interaction station comprising a set of sources selected from electromagnetic radiation, quenching sources and fluorescence excitation sources, and wherein the signal is a detectable electromagnetic radiation signal.
In other embodiments, the method is a method of identifying the proximity of two unit-specific markers of a polymer, wherein the proximity of the two unit-specific markers is an indication of the identity of at least one unit of the polymer. The labeled polymer is moved relative to the station, the two unit-specific markers are exposed to the station, characteristic signals resulting from a detectable physical change in the unit-specific markers or the station are generated, and the time interval between each characteristic signal is measured, which is indicative of the proximity of the two unit-specific markers.
The method may also be a method of identifying an order of two unit-specific markers of a polymer, the identity of each unit-specific marker being indicative of the identity of at least one unit of the polymer, wherein the order of the two unit-specific markers is a signature of the signal. The labeled polymer moves linearly relative to the station, exposing one unit-specific marker to the station to generate a signal for the unit-specific marker, and exposing another unit-specific marker to the station to generate a signal for the unit-specific marker that is different from the first signal that can be detected. The determination of the order of these signals is an indication of the order of the two unit-specific markers.
The method in one embodiment is a method of determining the distance between two unit-specific markers of a polymer, the identity of each unit-specific marker being indicative of the identity of at least one unit of the polymer, wherein the distance between the two unit-specific markers is a signature of said signal. The labeled polymer moves linearly relative to the station, a characteristic signal is generated as each of the two unit-specific markers passes through the station, and the distance between the two signals is determined as an indication of the distance between the two unit-specific markers.
In another embodiment of the invention, the method is a method of characterizing a tagged polymer under test, wherein a plurality of tagged polymers are exposed to a testing station, resulting in a signature of a signal for each tagged polymer. The method involves the steps of comparing signatures of the signals of the polymers, determining a degree of correlation between the polymers from the signatures of the signals of the polymers, and characterizing the tested polymers from the signatures of the signals of the correlated polymers.
According to another embodiment of the invention, a method of sequencing a polymer of linked units is provided. A signature of the signal of each of a plurality of overlapping polymers is obtained, each polymer having at least a portion with the same sequence of linked units as the other polymers, and comparing the signatures of the signals to obtain the sequence of linked units that are the same in all of the polymers.
In another embodiment, the method is a method of analyzing a set of polymers, each of said polymers being a separate polymer composed of linked units, wherein the set of polymers are arranged in parallel to each other, and detecting specific characteristics of said polymers.
The basis for the above-described methods is the interaction between the polymer and the station, which in some embodiments involves energy transfer and quenching between the unit and the reagent, resulting in the generation of a signal, and in other embodiments is a physical change in the unit or the station, resulting in the generation of a signal. Each process may be carried out on a large number of polymers simultaneously or sometimes only one polymer at a time.
It is also possible to carry out a method of analyzing a plurality of polymers at a time on the basis of interactions involving polymer-dependent pulses between the unit and the stations. These methods, discussed below, all generate any kind of polymer-dependent pulse that can be detected based on the interaction between the unit and the signal generating unit. The polymer-dependent pulses result from exposing units of the polymer to a signal-generating station, but do not require physical changes to occur in the polymer units or in the station. For example, polymer-dependent pulsing may result from energy transfer, quenching, a change in conductivity, a mechanical change, a change in resistance, or other physical change.
Another aspect of the invention is a method of characterizing a test polymer. In performing the method of characterizing a test polymer, polymer-dependent pulses are obtained for each of a plurality of polymers, the polymer-dependent pulses of the plurality of polymers are compared, a correlation of the polymers is determined based on a similarity of the polymer-dependent pulses, and the test polymer is characterized based on the polymer-dependent pulses of the correlated polymers.
The plurality of polymers may be any type of polymer, but nucleic acids are preferred. In one embodiment, the plurality of polymers is a homogenous population. In another embodiment, the plurality of polymers is a heterogeneous population. The polymers may be randomly or non-randomly labeled. Different labels may be used for different linked units to produce different polymer-dependent pulses.
Polymer-dependent pulses provide many different types of structural information about a polymer. For example, the obtained polymer-dependent pulses may comprise a sequence of polymer-dependent pulses, or the obtained polymer-dependent pulses may comprise a time interval between specific signals, or a number of polymer-dependent pulses.
In an important embodiment, the polymer-dependent pulses are obtained from a plurality of polymer transit signal generating stations.
According to another aspect of the invention, a method of determining a distance between two individual units in a polymer of linked units is provided. The method comprises the steps of (1) passing the polymer linearly through the metering station, (2) detecting the polymer-dependent pulses generated as the two individual units each pass through the metering station, (3) measuring the time interval between the detected polymer-dependent pulses, (4) repeating steps (1), (2) and (3) for a plurality of similar polymers to generate a set of data, and (5) analyzing the set of data to determine the distance between the two individual units based on information obtained from the plurality of similar polymers. In one embodiment, steps (1) to (4) are performed substantially simultaneously.
The plurality of polymers may be of any kind, however, nucleic acids are preferred. In one embodiment, the plurality of polymers is a homogenous population. In another embodiment, the plurality of polymers is a heterogeneous population. The polymers may be randomly or non-randomly labeled. Different labels may be used for different linked units to produce different polymer-dependent pulses.
In one embodiment, the polymer-dependent pulse measured is the electromagnetic radiation signal generated. In another embodiment, two linked units are detected by measuring their light emission at a signal generating station. The signal generating stations may be nanochannels.
According to another aspect of the invention, a method of determining the order of two individual units of a polymer of linked units is provided. The method comprises the steps of (1) passing the polymer linearly through a signal generating station, (2) exposing one individual unit to the station to generate a polymer-dependent pulse, (3) exposing another individual unit to the station to generate a second polymer-dependent pulse, (4) repeating steps (1), (2) and (3) on a plurality of similar polymers to generate a set of data, and (5) analyzing the set of data to determine the distance between the two individual units based on information obtained from the plurality of similar polymers. In one embodiment, steps (1) to (4) are performed substantially simultaneously. In one embodiment, the measured signal is an electromagnetic radiation signal.
The plurality of polymers may be of any kind, however, nucleic acids are preferred. In one embodiment, the plurality of polymers is a homogenous population. In another embodiment, the plurality of polymers is a heterogeneous population. The polymers may be randomly or non-randomly labeled. Different labels may be used for different linked units to produce different polymer-dependent pulses.
In one embodiment, the polymer-dependent pulse measured is the electromagnetic radiation signal generated. In another embodiment, two linked units are detected by measuring their light emission at a signal generating station. The signal generating stations may be nanochannels.
Another aspect of the invention provides a method of sequencing a polymer of linked units. The method involves the steps of obtaining polymer-dependent pulses from a plurality of overlapping polymers, at least a portion of the polymers having a sequence of linked units that is identical to other polymers, and comparing the polymer-dependent pulses to obtain a sequence of linked units that are identical in all of the plurality of polymers.
In one embodiment, the polymer-dependent pulses are optically detectable. In another embodiment, the nucleic acid is labeled with a reagent selected from the group consisting of an electromagnetic radiation source, a quenching source, a fluorescence excitation source, and a radiation source.
The plurality of polymers may be of any kind, however, nucleic acids are preferred. In one embodiment, the plurality of polymers is a homogenous population. In another embodiment, the plurality of polymers is a heterogeneous population. The polymers may be randomly or non-randomly labeled. Different labels may be used for different linked unitsto produce different polymer-dependent pulses.
The invention also provides methods for labeling nucleic acids. The method comprises the steps of contacting the meristematic cell with a nucleotide analogue, separating the nucleic acid carrying the introduced nucleotide analogue from the cellular nucleic acid, and labeling the introduced nucleotide analogue with the nucleic acid carrying the introduced nucleotide analogue. In one embodiment, the nucleotide analog is a brominated analog.
For cells in the cell cleavage cycle, meristematic cells may be brought into contact with or without nucleotide analogues by developmental arrest, and after completion of the contacting step, the cells may be allowed to re-enter the cell cleavage cycle. The nucleic acid is then isolated after the cell re-enters and completes the cell cutting cycle, but before the second cell cutting cycle is completed.
In another embodiment, the introduced nucleotide analog is labeled with an agent selected from the group consisting of a source of electromagnetic radiation, a source of quenching, and a source of fluorescence excitation.
According to another embodiment of the present invention, a method is provided for analyzing a set of polymers, each polymer in the set being a polymer of linked units. The method comprises the steps of arranging the set of polymers in parallel to each other and detecting the specific characteristics of each polymer. In one embodiment, the aligning step is performed in a solution without a gel. The polymers may be aligned by any method. A preferred method of aligning the polymers is to apply an electric field to the polymers.
The plurality of polymers may be of any kind, however, nucleic acids are preferred. In one embodiment, the plurality of polymers is a homogenous population. In another embodiment, the plurality of polymers is a heterogeneous population. The polymers may be randomly or non-randomly labeled. Different labels may be used for different linked units to produce different polymer-dependent pulses.
Polymer-specific characteristics are information about the structural features of a polymer. The specific feature of the polymer may be the order of the individual linking units in the polymer.
In one embodiment, the detecting steps are performed simultaneously for each of the polymers. In another embodiment, the detecting step comprises measuring an electromagnetic radiation signal. According to a preferred embodiment, the detecting step comprises passing the polymer linearly through the signal generating stations relative to the plurality of stations, detecting polymer-dependent pulses as said polymer passes through the signal generating stations and distinguishing between the signals.
In another embodiment of the invention, a method is provided for analyzing a set of polymers, each of which is a polymer of linked units. The method comprises the steps of aligning the set of polymers in an electric field while passing the polymers through respective channels, and detecting polymer-specific characteristics as the polymers pass through the channels. In one embodiment, the aligning step is performed in a solution without a gel. The preferred channel is a nanochannel.
The plurality of polymers may be of any kind, however, nucleic acids are preferred. In one embodiment, the plurality of polymers is a homogenous population. In another embodiment, the plurality of polymers is a heterogeneous population. The polymers may be randomly or non-randomly labeled. Different labels may be used for different linked units to produce different polymer-dependent pulses.
Polymer-specific characteristics are information about the structural features of a polymer. The specific feature of the polymer may be the order of the individual linking units in the polymer.
In one embodiment, the detecting steps are performed simultaneously for each of the polymers. In another embodiment, the detecting step comprises measuring an electromagnetic radiation signal. According to a preferred embodiment, the detecting step comprises passing the polymer linearly through the signal generating stations relative to the plurality of stations, detecting polymer-dependent pulses as said polymer passes through the signal generating stations and distinguishing between the signals.
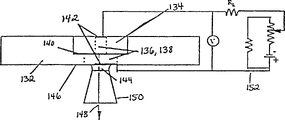
According to another aspect of the invention, an article is provided. The article comprises a wall material having a surface defining a channel, a reagent selected from the group consisting of a source of electromagnetic radiation, a source of quenching, a thin film light emitting, and a source of fluorescence excitation linked to the wall material adjacent to the channel, wherein the reagent is in sufficient proximity to the channel and in an amount sufficient to detectably interact with a ligand compound selected from the group consisting of a light emitting compound, a light receiving compound, a radioactive compound, and a quencher passing through the channel. Preferred channels are supports for polymers.
In one embodiment, the reagent is an electromagnetic radiation source and the electromagnetic radiation source is a light emitting compound. In another embodiment, the channel is selected from the group consisting of a microchannel and a nanochannel.
According to another embodiment of the invention, the surface of the wall material defining the channel is free of light-emissive compounds. In another embodiment, the light emissive compound is linked to the outer surface of the wall material. In yet another embodiment, the light emissive compound is linked to a linker, which is linked to the outer surface of the wall material. In another embodiment, the light emissive compound is embedded in the wall material, or in a layer of the wall material, or on the wall material. In another embodiment, the light emissive compound may be relatively concentrated in the portion of the outer surface area of the wall material surrounding the channel. The light emissive compound may form concentric rings in the wall material surrounding the channel. The article may also have a masking layer with openings that expose only portions of the light emissive compound.
A second light-emissive compound different from the first light-emissive compound may also be linked to the wall material adjacent the channel, wherein the light-emissive compound is in sufficient proximity to the channel and in an amount sufficient to produce a detectable interaction with the ligand light-emissive compound through the channel.
The wall material may be composed of different layers. In one embodiment, the outer surface of the wall material adjacent to the light emissive compound is a conductive layer. In another embodiment, the wall material comprises two layers, an electrically conductive layer and a non-electrically conductive layer. The wall material may also comprise at least two layers, a first layer preventing signal generation and a second layer allowing signal generation. Further, the wall material adjacent to the light emitting compound may be a light impermeable layer. In another embodiment, the wall material comprises two layers, an opaque layer and a supportive light transmitting layer. The wall material may be a second opaque layer on the second side of the light emissive compound, the first and second layers sandwiching the light emissive compound. In a preferred embodiment, the light-emissive compound is a fluorescent compound.
The channels may have various shapes and sizes. Thepreferred channel is a nanochannel, which is between 1 angstrom and 1 millimeter. In a preferred embodiment, the width of the channel is between 1 and 500 angstroms. Preferred wall materials include a plurality of channels. Preferred wall materials comprise at least two or more channels, preferably at least 50 channels.
In one embodiment, the wall material comprises two layers, a first light impermeable layer and a light emitting film layer linked to each other, wherein the channel extends through the two layers and is defined by the surfaces of the two layers. The preferred channel is a nanochannel. In some embodiments, the article includes a second opaque layer, and the light emitting film layer is positioned between the first and second opaque layers. In a preferred embodiment, the surface defining the channel comprises the surface of the light-impermeable layer and is free of light-emitting film material.
In another embodiment, the agent is a fluorescence excitation source, and wherein the fluorescence excitation source is a scintillation layer. The scintillation layer can be selected from the group consisting of NaI (TI), ZnS (Ag), anthracene, stilbene, and plastic phosphor. The preferred scintillation layer is embedded in the wall material between two layers that are impermeable to radiation, for example between lead and polymethyl methacrylate.
Another aspect of the invention is an article of manufacture which is a wall material having a surface defining a plurality of channels and linked to a station in discrete areas of the wall material at least adjacent to one of the channels, wherein the station is sufficiently close to the channel and in an amount sufficient for a signal to be generated from a detectable physical change in a polymer of the linked unit that is passing through the channel or generated in the station when the polymer is exposed to the station.
According to another aspect of the invention, an article is provided. The article is formed with a wall material defining a surface of a channel, and a plurality of stations linked within discrete areas of the wall material adjacent the channel, wherein the stations are sufficiently close to the channel and in sufficient quantity to cause a signal to be generated from a detectable physical change in a polymer of linked units passing through the channel or generated in the stations when the polymer is exposed to the stations.
Another aspect of the invention is a method of making a wall material. The method comprises the step of covalently linking a light-emissive compound or a quenching compound to a plurality of discrete regions of a wall material, each of said discrete regions being in sufficient proximity to a respective station on said wall material such that, when a single unit of polymer (which unit can interact with said light-emissive compound or quenching compound to produce a signal) is placed at said interaction station, the light-emissive compound or quenching compound interacts with the single unit to produce a signal. In one embodiment, the method includes the step of applying a conductive layer material to the wall material.
In another embodiment, the luminescent or quenching compounds are covalently linked in the wall material near the channel of discrete place, the channel defines the interaction station. The channels are preferably microchannels. In a more preferred embodiment, the channel is a nanochannel. The luminescent compound or the quenching compound may be covalently linked to the wall material in such a way that the surface of the wall material defines a channel and the channel is free of the luminescent compound and the quenching compound.
The invention also includes a method of selectively linking a chemical to the annular position of a channel in an opaque wall material. The method comprises the steps of linking a photo-protecting chemical group to the ring of the channel through the wall material, applying light to the photo-protecting chemical group to remove the photo-protection of the chemical group, and linking the chemical species to the deprotected chemical group.
In one embodiment, light is selectively applied to only certain areas of the annular surface of the wall material defining the channel. In another embodiment, the channel has a first end and a second end, the ring is located at the first end, and light is applied to the second end, the light passing through the channel and contacting the photo-protected chemical group at the ring of the first end. The channels are preferably microchannels. In a more preferred embodiment, the channel is a nanochannel.
According to another aspect of the present invention, there is provided a method of preparing a wall material having light emitting areas at a localized surface of the wall material. The method comprises the steps of providing a wall material having a surface, applying a light-emissive compound to the surface to produce at least a localized region of light emission thereon, wherein the localized region defines a target region for detection of light emission, and wherein the target region is an annular region of passage through the wall material. In one embodiment, the method further comprises the steps of attaching a photo-protecting chemical group to the surface of the wall material, applying light to the photo-protecting chemical group to remove photo-protection of the chemical group prior to attaching the light-emissive compound, and attaching the light-emissive compound to the photo-protected chemical group.
In one embodiment, the light is applied only to selective surface areas on the annular wall material defining the channel. In a preferred embodiment, the photo-protecting chemical groups are only linked to selective surface regions on the wall material defining the ring shape of the channel. In another embodiment, the channel has a first end and a second end, the ring is located at the first end, and light is applied at the second end, the light passing through the channel and contacting the photo-protected chemical group at the ring of said first end. The channels are preferably microchannels. In a more preferred embodiment, the channel is a nanochannel
The method may further comprise the step of placing a mask having openings on the surface of the wall material such that only the localized light emitting areas at the openings pass through the openings of the mask. In one embodiment, the light emissive compound is linked to a portion of the surface of the wall material.
According to another aspect of the invention, a device for detecting a signal is provided. The device has a housing with a buffer compartment, a wall defining a portion of the buffer compartment, a sensor fixed relative to the housing having a plurality of openings to align with the polymer, the sensor distinguishing a signal emitted by each opening from a sensor-dependent signal generated by another opening, and a memory to collect and store the sensor signals. In a preferred embodiment, the sensor is an optical sensor.
In one embodiment, the optical sensor detects electromagnetic radiation signals emitted from the plurality of openings. In another embodiment, the device includes a microprocessor.
In one embodiment, the openings are defined by channels in the wall material. Preferably, the openings are defined by microchannels in the wall material. More preferably, the openings are defined by nanochannels in the wall material. In one embodiment, the plurality of openings is at least two openings. In a preferred embodiment, the plurality is at least 50 openings.
In one embodiment, the apparatus comprises a second buffer chamber separated from the first buffer chamber by said wall, and wherein the buffer chambers are in fluid communication with each other through the opening. In another embodiment, the apparatus includes a pair of electrodes secured to the housing, one of the electrodes being located in the first buffer compartment and the other electrode being located in the second buffer compartment.
According to another aspect of the invention, a device for detecting a signal is provided. The apparatus includes a housing defining a first buffer compartment and a second buffer compartment, a wall enclosed by the housing separating the first and second buffer compartments, a plurality of channels defined by the wall and providing fluid communication between the first and second buffer compartments, a sensor for distinguishing and collecting channel-dependent signals. Preferred channels are microchannels. More preferred channels are nanochannels. In one embodiment, the plurality of channels is at least two channels. In a preferred embodiment, the plurality of channels is at least 50. The preferred signal is an optical signal.
In one embodiment, the wall material surrounding the channel comprises an agent linked to the wall material, the agent being selected from the group consisting of electromagnetic radiation, a quenching source, and a fluorescence excitation source. Preferred agents are electromagnetic radiation, and electromagnetic radiation is a light emitting compound. In one embodiment, the light emissive compound is concentrated on a channel in the wall material.
According to another embodiment, the apparatus comprises means for moving the biological object through the channel.
According to another aspect of the present invention, there is provided an apparatus comprising a housing with a buffer compartment, a wall material defining a portion of the buffer compartment, the wall comprising a polymer interaction station, an optical sensor secured to the housing, the optical sensor constructed and arranged to detect an electromagnetic radiation signal emitted at the interaction station.
Another aspect of the invention is a computer system that responds to received requests for characteristic information about a plurality of polymers. The system includes a memory for storing in an extractable manner a plurality of polymers based on unique polymer identification characteristics, a set of records including sequential indicative information of detected signals resulting from physical changes in stations or individual units of the plurality of polymers to which the polymers are exposed, and a microprocessor for extracting the records stored in the memory, the extracting selecting a polymer from the plurality of polymers having the characteristic based on the unique identification characteristic associated with the selected polymer.
In one embodiment, the signal results from exposure of individual units of the plurality of polymers to an agent selected from the group consisting of electromagnetic radiation, a quenching source, and a fluorescence excitation source. In another embodiment, the computer system further comprises means for comparing the sequential detected signals of the selected polymer to known signal signature patterns of known polymers to determine the degree of correlation between the selected polymer and the known polymers.
Each definition of the invention encompasses various embodiments of the invention. It should therefore be understood that each definition of the invention relates to any element or combination of elements in each method and each apparatus. Brief description of the drawings
FIG. 1: schematic representation of the random marking method.
FIG. 2: raw data, showing the variation of energy emission pattern, to determine distance information by event rate method. The change in energy form results from a sequential detectable signal, which is plotted according to the graph, with the resulting curve representing a decrease in energy intensity from left to right, followed by two increases in energy intensity. Wherein the event rate is 6.8A/s, and t1Is the time interval between the entry time of the first and second tags.
FIG. 3: a representative population of random a-tag fragments for a 16-mer with 5 'ACGTACGTACGTACGT' 3 sequence is shown, and also shows how distance information can be used to determine the base spacing between the admission tag nucleotides.
FIG. 4: schematic diagrams of various possible configurations of nanochannel plates.
FIG. 5: schematic representation of nanochannel plates for analysis of radioactive polymers.
FIG. 6: schematic of the nanochannel cross-section with concentric rings of donor fluorophores, and schematic of the donor emission and corresponding nanochannel energy transfer.
FIG. 7: a model of a nanochannel plate with multiple nanochannels is shown with a donor fluorophore layer in the plate. Fig. 7B shows an enlarged view showing a single nanochannel with a single receptor positioned adjacent to the conductive layer.
Fig. 8A and 8B: illustrating the generation of a signal as the admission flag passes through the nanochannel. Fig. 8A shows an enlarged view of one nanochannel. Fig. 8B illustrates the significant change in donor intensity as the receptive mark moves from the a position to the C position.
FIG. 9: the two base labeled DNA strand is illustrated and described as passing through a nanochannel with theappropriate thickness and radius of the donor fluorophore and sandwiched between conducting materials.
FIG. 10: volumetric plots showing the variation in donor emission intensity with one and two acceptors. Fig. 10A shows the amount of change in volume. Fig. 10B shows a modification to one of the receivers.
FIG. 11: the experimental results showing that DNA can pass through the manufactured nanochannel are shown.
FIG. 12: showing the configuration of a device holding a nanochannel (or microchannel) plate that can generate an electric field.
FIG. 13: a nanochannel device is illustrated which comprises two fused Pyrex cells and holds a nanochannel plate, upper and lower buffer regions, electrodes, immersed objects and a power source.
FIG. 14: in vitro base specific (IBSA) labeling is illustrated.
FIG. 15: the overall scheme for the recognition of DNA sequences from the IBSA markers is shown. Detailed description of the invention
The invention includes methods of analysis and identification of polymers or units of polymers by detection of a detectable signal generated by interaction between at least one unit of the polymer and a station or with a reagent, or by a physical change in the unit or station, which is dependent on a pulse of the polymer, as the unit passes the station. By "analysis" of a polymer, it is meant that some structural information of the polymer is obtained, such as its size, the order of the units, the degree of association with other polymers, the identity of each unit, and the presence or absence thereof, and the like. Since the structure and function of biological molecules are interdependent, this structural information can reveal important information about the function of the polymer.
One method according to the present invention is a method of analyzing a polymer of linked units by exposing a plurality of units of the polymer to an agent selected from the group consisting of electromagnetic radiation, a quenching source, and a fluorescence excitation source, such that each individual unit interacts with the agent to produce a detectable signal. The signals resulting from these interactions are detected sequentially.
As used herein, a unit of a polymer is "exposed to" a reagent or a station by placing or presenting the unit and the reagent or station in close enough proximity to interact with each other such that energy transfer or quenching or a physical change can occur between the unit or reagent or station to produce a detectable signal. The term sufficiently close to interact refers to close enough that the interaction or change can produce a detectable signal.
In one embodiment, the units of the polymer are sequentially exposed to the agent. The term "sequentially exposed" refers to time intervals between each other. In a preferred embodiment, the polymer and reagent are moved relative to each other in a linear fashion, such that each unit of polymer passes through a region of close proximity to the interaction of the reagent at the station. When each unit of the polymer interacts with a reagent or station, a detectable signal is generated. These detectable signals can be captured (in detection order) and recorded with a detection device. The detectable signal generated for each element may be indicative of the type of the element. In this context, signals are detected sequentially means that signals from different units of the same polymer are detected with time intervals. Not all elements need be detected or need to generate a signal that is detected in sequence.
When the units are sequentially exposed to the reagents or stations, the units and the reagents or stations move relative to each other. In this context, the term "the unit and the reagent or station are moved relative to each other" means that both the unit and the reagent or station are moved or only one of them is moved while the other is kept stationary during the interaction between the unit and the reagent or station. The unit and the reagent or station may be moved relative to each other by any mechanism. For example, the reagent or station may be held stationary while an electric current is passed through the reagent or station. Other methods of moving the polymer include, but are not limited to, by magnetic fields, mechanical forces, flowing liquid media, pressure systems, gravity, and molecular motors such as DNA polymerase or helicase when the polymer is DNA, or myosin when the polymer is a polypeptide such as actin. The movement of the polymer may be assisted by directing the polymer using channels, grooves or rings or the like. In addition, the reagent or station may be moved while the polymer remains stationary. For example, the scanning tip may be made to hold reagents or stations and move along the entire length of the polymer.
In another embodiment, the signals are detected simultaneously. As used herein, the term "simultaneously detected" refers to exposing multiple labeled units of a polymer to a reagent or station at the same time. Multiple interaction sites may be employed to allow multiple units to be exposed to reagents or stations simultaneously. Signals can be detected at each site simultaneously. For example, reagents or stations may be placed at spaced apart positions on the polymer units. When the polymer is brought into close enough interaction proximity to multiple reagents or stations, a signal is simultaneously generated. This may be done, for example, by spacing the reagents or stations linearly in an array with substantially equal spacing and equal spacing between the individual units. The location of the polymer may then be brought into close enough interaction proximity with the reagent or station to simultaneously generate a signal relative to the reagent or station.
When the signals are detected sequentially, multiple polymers may also be analyzed simultaneously. Simultaneous analysis of multiple polymers allows more than one polymer to move relative to the reagent or station at the same time. The polymers may be similar or different. If the polymers are similar, the same or different units may be detected simultaneously. Preferably, at least two polymers are analyzed simultaneously. In a more preferred embodiment, at least 50 polymers are analyzed simultaneously, and in another preferred embodiment, at least 100 polymers are detected simultaneously.
In this context, the term "polymer" refers to a compound having a linear backbone, which is made up of individual units linked together by linkages. In some cases, the backbone of the polymer may be branched. Preferred backbones are not branched. The term "backbone" refers to the meaning conventional in polymer chemistry. The polymer may be heterogeneous in the backbone, thus containing any possible combination of polymer units linked together, for example, peptide-nucleic acid (where amino acids are linked to nucleic acids with improved stability) linkages. In preferred embodiments, the backbone of the polymer is a homogeneous composition, for example, a nucleic acid, a polypeptide, a polysaccharide, a carbohydrate, a polyurethane, a polycarbohydrate, a polyurea, a polyethyleneimine, a polyarylene sulfide, a polysiloxane, a polyimide, a polyethyl acetate, a polyamide, a polyester, a polythioester, or the like. In a most preferred embodiment, the polymer is a nucleic acid or polypeptide. Herein, the term "nucleic acid" refers to a biopolymer that includes nucleotides, for example, deoxyribonucleic acid (DNA) or ribonucleic acid (RNA). Herein, a polypeptide refers to a biopolymer comprising linked amino acids.
As used herein in reference to linked units of a polymer, "linked" or "linking" means that two individuals are linked to each other by any physicochemical means, including any linkage known in the art, such as covalent or non-covalent. These links are well known to those skilled in the art. Natural linkages, i.e. linkages found in nature by those skilled in the art to link together units of a polymer, are the most common. Natural linkages include, for example, amide, ester, and thioester linkages. However, the individual units of the polymer analyzed by the methods of the present invention may be linked together by synthetic or modified linkages. Polymers in which the units are linked together by covalent bonds will be the most common, but may also include hydrogen bonds and the like.
The term "single unit" as used herein refers to a building block or monomer which may be directly or indirectly linked with other building blocks or monomers to make up a polymer.A polymer is preferably a polymer made up of at least two different linked units which may or may not be labeled to produce different signals, the detailed discussion of which is given below the specific type of each unit will depend on the type of polymer.A DNA, for example, includes a deoxyribose phosphate backbone which includes units consisting of purine ribopyrimidines, for example, adenine, cytosine, guanine, thymine, 5-methylcytosine, 2-aminopurine, 2-amino-6-chloropurine, 2, 6-diaminopurine, hypoxanthine, and other natural or non-natural nucleobases substituted or unsubstituted with aromatic groups.an RNA is a biopolymer which includes a ribose phosphate backbone which includes purine and pyrimidine units, such as those described above for DNA, but in which uracil replaces a pyrimidine unit.5 'amino acid units or a hydroxyl amide unit of a DNA polymer which may be linked with other hydroxyl amide units to form a polymer.5' or a polymer which may be modified by a hydroxyl amide unit which is linked with a hydroxyl amide unit of RNA α.
The term "plurality of individual units" means that at least two units are linked to each other.
Where nucleic acids are represented by letters of the sequence, it is understood that nucleotides are 5 'to 3' from left to right, the letters "A" for adenosine, "C" for cytidine, "G" for guanosine, "T" for thymidine, and "U" for uridine, unless otherwise noted.
The polymers may be natural polymers, which occur in nature, or may be non-naturally occurring polymers, which are not found in nature. Typically the polymer comprises at least a portion of at least a natural polymer. The polymer may be isolated or synthesized from start to end. For example, the polymer may be isolated from natural sources, such as purification, enzymatic digestion and gel separation, or synthetic, such as (i) in vitro amplification, e.g., using Polymerase Chain Reaction (PCR); (ii) synthesis, such as chemical synthesis; (iii) recombinant, such as clonal recombination, and the like.
The polymer or at least one unit thereof is in a form which is capable of interacting with a reagent or a station to produce a signal characteristic of that interaction. Units of the polymer capable of such interaction are referred to as labeled. A polymer is said to be internally labeled if its units can interact to generate a characteristic signal. In this case, no external marking of the polymer is required. However, if it is necessary to link an unnatural molecule to a single unit of the polymer to generate an interaction and generate a characteristic signal, the polymer is said to require external labeling. The term "label" may be, for example, light emission, energy acceptance, fluorescence, radioactivity, or quenching, etc.
The units of many naturally occurring polymers are light emitting compounds or quenchers. For example, nucleotides of natural nucleic acids have unique absorption profiles, e.g., A, G, T, C, and U have absorption maxima at 259nm, 252nm, 267nm, 271nm, and 258nm, respectively. Modified units including internal labels may also be incorporated into the polymer. For example, a nucleic acid molecule can include any of the following modified nucleotide units that have a characteristic energy emitting form of a light emitting compound or quencher: 2, 4-dithiouracil, 2, 4-diselenouracil, hypoxanthine, mercaptopurine, 2-aminopurine, and selenoprourine, and the like.
A unit may be considered internally labeled if it provides information about its identity through its own properties other than light emission, quenching, or radioactivity when not labeled externally. For example, the charging and shape of the cell provides information about the cell, which may be a specific characteristic signal, such as a change in conductivity caused by the cell after it has enclosed a conductive channel.
If an external label is chosen in the method according to the invention, the external label chosen will depend on various factors, including the nature of the assay being performed, the type of reagent and the type of polymer. External labeling compounds include, but are not limited to, light emitting compounds, quenching compounds, radioactive compounds, spin labels, and heavy metal compounds, among others. The labels are spatially and chemically compatible for the units of the polymer being analyzed.
As used herein, the term "light-emissive compound" refers to a compound that produces a luminescent response when irradiated with light of a particular wavelength. These compounds are capable of absorbing and emitting light by phosphor, chemiluminescence, luminescence, polarized fluorescence, scintillator, or more preferably fluorescence. The particular light emissive compound selected will depend on various factors discussed in detail below. Numerous descriptions of light-emitting compounds have been given in various documents. For example, see Haugland's manual for fluorescent Probes and Research Chemicals, sixth edition (molecular Probes, 1996) [ Haugland, R.P., Handbook of fluorescent Probes and Research Chemicals, 6thedition,MolecularProbes,Inc.,1996]The contents of this work are incorporated herein by reference as if describing a light emitting compound.
The radioactive compound is a compound emitting α, β, or gamma nuclear radiation α rays are positively charged particles of number 4 mass and are slightly attracted by electric field nuclear magnetic fieldsβ rays are negatively charged electrons and are strongly reflected by electric and magnetic fields gamma rays are negatively charged electrons but are not reflected by electric and magnetic fields and have a wavelength of 10-8To 10-9In the order of cm.
Typically, fluorescent dyes are hydrocarbon molecules having a chain of several conjugated double bonds. The emission and absorption wavelengths of the dye are substantially proportional to the number of carbon atoms in the conjugated chain. A preferred fluorescent compound is "Cy-3", see "BioDetector System" (Pittsburgh, Pa.) (Biological Detection Systems, Pittsburgh, Pa.). Other preferred fluorescent compounds that may be used in the present invention include, but are not limited to, fluorescent isothiocyanate ("FITC"), Texas Red, tetramethylrhodamine isothiocyanate ("TRITC"), 4-difluoro-4-boro-3 a, and 4 a-azido-s-indanes [4a-diaza-s-indacene, ("BODIPY")].
Chemiluminescent compounds are compounds that emit light as a result of a chemical reaction. Phosphorescent compounds are compounds that delay luminescence due to absorption of radiation. Luminescent compounds are substances that emit non-thermal electromagnetic radiation upon being excited. These compounds are well known in the art and have numerous sources of supply.
In one embodiment of the invention, the light-emissive compound is a donor fluorophore or an acceptor fluorophore. In this context, a fluorophore is a molecule capable of absorbing light at one wavelength and emitting light at another wavelength. A donor fluorophore is a fluorophore that is capable of transferring its fluorescent energy to an acceptor molecule in its vicinity. An acceptor fluorophore is a fluorophore that is capable of accepting the energy of a donor fluorophore in its vicinity (for a donor fluorophore, the acceptor may not be a fluorophore, and may be non-fluorescent). Fluorophores can be photochemically promoted to an excited state, or higher energy level, upon irradiation with light. The excitation wavelength is typically in the ultraviolet, blue, or green region of the spectrum. The fluorophore remains in the excited state for only a short time and then releases energy and returns to its original state. Those fluorophores which emit their energy as light are donor fluorophores. The wavelength distribution of the emitted photons forms an emission spectrum whose peaks are at longer wavelengths (lower energy) than the excitation spectrum, but are equally characteristic for a particular fluorophore.
In another embodiment of the invention, the units of the polymer are labeled with a radioactive compound. The radioactive compound emits nuclear radiation when passed through a reagent or station. When the reagent is a scintillation layer, the nuclear radiation interacts with the scintillation layer and causes fluorescence excitation. The indicative fluorescent signal of the radiolabeled unit can then be detected.
The external label may be added to the polymer by a number of methods well known in the art. For example, the label may be attached directly to the polymer, or linked to a linker attachedto the polymer. For example, fluorophores have been introduced directly into nucleic acids by chemical means, and have also been introduced into nucleic acids via reactive amino or thio groups. Mirabekov has been extensively discussed in its "Nucleic Acids research" [ Mirabekov, Nucleic Acids research, 24: 4535-4532(1996)]. It is also possible to incorporate into the polymer units that are susceptible to chemical derivatization or modification by inclusion of linkers to enhance this process. Modifications that can be made to the polymer, to linkages to and/or to external labels for the purpose of making bioconjugates are well known in Hermanson's Bioconjugate technology book [ Hermanson, g.t., Bioconjugate technologies, academic press, inc., San Diego, 1996], the contents of which are hereby incorporated by reference.
Several methods for direct chemical labeling of DNA are known (Hermanson, 1996; Roget et al, 1989; Proudnikov and Mirzzbekov, 1996). One of these methods is based on the introduction of aldehyde groups by partial depurination of DNA. The fluorescent label with hydrazine was efficiently bound to the aldehyde group, and the hydrazone bond was stabilized by the reduction with sodium, with a labeling efficiency of about 60%. In the presence of an excess of amine fluorophores, the reaction between cytosine and bisulfite results in N4Transamination of a site (Hermanson, 1996). Various reaction conditions, such as pH, amine fluorophore concentration, contact time and temperature, affect the yield of the product formed. At a high levelTransamination can approach 100% in the presence of concentrations of amine fluorophores (3M) (Draper and gold, 1980).
The light emissive compound may be linked to the polymer or other material by any method known in the art. For example, functional groups capable of reacting with various light-emissive compounds include, but are not limited to (functional group: reactive groupof light-emissive compound), activated esters: an amine or aniline; acyl azide: an amine or aniline; acid halide: amines, anilines, alcohols, or phenols; acyl nitrile: an alcohol or phenol; aldehyde: an amine or aniline; alkyl halide: amines, anilines, alcohols, phenols, or thiols; alkyl sulfonate salt: thiol, alcohol or phenol; anhydride: alcohols, phenols, amines or anilines; acid halide: a thiol group; aziridine: a thiol or thioester; carboxylic acid: amines, anilines, alcohols or alkyl halides; diazoalkane: a carboxylic acid; epoxide: a thiol group; halogenated acetamide: a thiol group; halogenated triazine: amines, anilines or phenols; hydrazine: an aldehyde or a ketone; hydroxylamine: an aldehyde or a ketone; imido ester: an amine or aniline; isocyanate: an amine or aniline; and isothiocyanates: an amine or an aniline.
The agent that interacts with the units of the polymer is selected from the group consisting of electromagnetic radiation, a quenching source, and a fluorescence excitation source. "electromagnetic radiation" is herein energy generated by electromagnetic waves. The electromagnetic radiation may be in the form of a direct light source or may be emitted by a light-emitting compound, such as a donor fluorophore. "light" as used herein includes electromagnetic energy of any wavelength, such as visible, infrared, and ultraviolet light.
In this context, quenching sources are those objects that alter or are capable of altering the properties of the light emitting source. The properties that are altered include fluorescence intensity, lifetime, spectrum, fluorescence, and phosphor.
In this context, fluorescence excitation sources are those substances that are capable of fluorescing or otherwise increasing to a photon emission state (i.e., electromagnetic radiation, direct electric field, temperature, fluorescence, radiation, scintillation, physical contact, mechanical disruption, and the like). For example, when the unit is labelled with a radioactive compound, the molecules of the agent which emit radioactivity and cause the scintillation layer are excited to give rise to fluorescence.
When the units of the polymer are exposed to the agent, a signal is generated between them. These signals provide information about the polymer. For example, if a particular unit of the protein polymer as a whole, such as alanine as a whole, is labeled with a light-emissive compound (either internally or externally), then a signal characteristic of the light-emissive compound is detected upon interaction with the reagent, indicating the presence of an alanine residue at a particular position in the polymer. If each unit, for example each amino acid, is labelled with a different light-emissive compound having a unique light-emissive form, then each amino acid interacts with the reagent to generate a unique signal. Based on the determination of which unit of the polymer each signal represents, the sequence of these units can be determined.
The interaction between the units and the reagents may take a variety of forms, but physical contact between the units and the reagents is not necessarily required. Examples of these interactions are as follows. In a first interaction, the agent is electromagnetic radiation and the units of the polymer are light-emissive compounds (internally or externally labelled by the light-emissive compound). When the light-emitting unit is contacted by electromagnetic radiation (e.g., a laser beam having a suitable wavelength, or electromagnetic radiation emitted from a donor fluorophore), the electromagnetic radiation causes the light-emitting compound to emit electromagnetic radiation of a particular wavelength. The signal can then be detected. The signal is characteristic of the light emission and thus indicates the presence of the specifically labeled units in the polymer. In this case, the units of the polymer are said to "detectably influence the electromagnetic radiation emitted from the light-emissive compound".
In a second form of interaction, the agent is a fluorescence excitation source and the units of the polymer are light-emitting or radioactive compounds. When the light-emitting unit is contacted by the fluorescence excitation source, the fluorescence excitation source causes the light-emitting compound to emit electromagnetic radiation of a specific wavelength. When a radioactive cell is contacted by a fluorescence excitation source, then the nuclear radiation emitted by the cell causes the fluorescence excitation source to emit electromagnetic radiation of a particular wavelength. At this point, the relevant signal can be detected.
In variations of these forms of interaction, there may be a third component of the interaction present, namely a neighbouring compound involved in generating the signal. For example, the unit may be labelled with a light-emissive compound in the form of a donor fluorophore and the approximating compound may be an acceptor fluorophore. If the light-emissive compound is allowed to be in an excited state and brought into proximity with an acceptor fluorophore, energy transfer occurs between the donor and acceptor, producing a signal that can be used as a detection scale for the presence of the light-emissive element. A light-emissive compound can be placed in an "excited state" by exposure to light (e.g., a laser beam) or to a fluorescence excitation source.
Another interaction involves a neighboring compound that is a quenching source. In this case, the light emitting unit is exposed to light to cause emission of electromagnetic radiation. If the light-emissive compound is placed in proximity to the quenching source, the signal emitted from the light-emissive unit is altered.
A series of interactions parallel to the above interactions can also be created, however, where the light-emitting compound is a neighboring compound and the unit is a quenching or acceptor source. In these cases, the reagent is electromagnetic radiation emitted by a neighboring compound, and placing the cell in interactive proximity with the neighboring compound generates a signal, characteristic of the interaction between the cell and such radiation.
The mechanisms of action by which these interactions produce detectable signals are well known in the art. For illustrative purposes, the mechanism set forth below is that the donor interacts with the acceptor fluorophore to produce a detectable signal according to the present invention, including the associated practical limitations of such interaction, as well as methods for the reduction and elimination of these limitations.
In a preferred embodiment, the signal generated by the interaction between the unit and the reagent is derived from Fluorescence Resonance Energy Transfer (FRET) between fluorophores. Compounds/agents, whether in unit or in close proximity, may be labeled with donor or acceptor fluorophores. FRET is the photon energy transfer between fluorophores. FRET is promising as a means of describing the details of the molecule because of its ability to measure two points 10 to 100 angstroms apart. The "angstrom" level resolution of FRET has been used in a number of studies of molecular kinetic and biophysical phenomena (see Clegg, 1995; Clegg, 1992; Selven, 1995; Wu and Brand, 1994). The increase in resolution of FRET caused by energy transfer between donor and acceptor fluorophores will depend on the minus 6 th power of the distance between probes. In practice, this resolution is about an order of magnitude higher than the highest resolution electron microscopy.
For FRET to occur, the emission spectrum of the donor should coincide with the excitation spectrum of the acceptor. In particular, the polymer units are specifically labeled with acceptor fluorophores. The reagent is a donor fluorophore. The laser is tuned to the excitation wavelength of the donor fluorophore. The donor fluorophore emits its characteristic wavelength as the polymer moves through the channel. When the acceptor fluorophore enters the distance of interaction with the donor fluorophore, the acceptor fluorophore is activated by energy from the donor fluorophore. The result of this interaction is that the emission of the donor fluorophore is quenched and the emission of the acceptor fluorophore is enhanced.
In order to generate the optimal FRET signal with high efficiency for detection, two conditions should be met. The first condition is that the donor provides high efficiency emission in the absence of the acceptor. The second condition is that during FRET, the emission of either the donor or acceptor is effectively changed.
In the model system, both the donor fluorophore and the acceptor fluorophore can cause photon emission indefinitely. In this case, the reduction of the donor emission during energy transfer is equal to the enhancement of the acceptor emission. In other words, the variation in emission is the same for both the donor and the acceptor. This is so because each donor emission quenching event occurs, and correspondingly, an equivalent acceptor emission event occurs. Cantor and Schimmel (1980) propose intuitive outlines of such model systems. Systems of two fluorophores (one donor and one acceptor) are contemplated. In the Forster distance range, very weak coupling occurs. The interaction between the donor and the acceptor is approximatedComprises the following steps: wherein DaAnd AaIs a basic singlet state, and DbAnd AbIs a first order excited singlet state, kTAnd k-TAre the forward and reverse energy transfer rates. The above reaction illustrates that for a given first-order excited-state donor, it will rapidly lose energy through internal conversion, eventually reaching its ground state Da. Since the absorption spectrum of the acceptor coincides with the emission spectrum of the donor, very weak coupling occurs, allowing an energy resonance transfer to occur.
Donor (D) as a result of energy resonance transferb) And receptors (A)b) Both in an excited vibrational state. The relaxation of the vibrations quickly brings these to their respective fundamental vibration levels. The relaxation of the vibration is very efficient and the average lifetime of the excited vibration state is only 10-15Second (Skoog et al, 1992). On the other hand, the internal conversion of the fluorophore molecule is about 10-9And second. This difference in rate means that even k isTIs very efficient, the reverse reaction (k)-T) Nor does it necessarily occur. Thus, in this ideal system there is a relative misalignment of the excited donor and acceptor populations.
The above analysis states a system using a single acceptor and a single donor. The same type of interaction can be achieved on systems that utilize many acceptors and many donors. Whenever the receptor is in its basal singlet state AaEnergy transfer can occur. This means that for receptors with a lifetime of 1ns (nanoseconds), 1X 10 can be excited per second9This is a very high rate compared to donor fluorophores under standard illumination conditions (excitation approximately 25,000 times per second). Since the acceptor can withstand the highest number of excitations that is much higher than that of a single donor fluorophore, multiple donors can transfer their energy to one acceptor.
Although the acceptor is excited to a higher energy level (A)b) Simultaneousdeactivation with donor can be seen as a potential problem in systems employing multiple donors and one recipient leading to interference with the generated signal, but the followingAnalysis demonstrated that this was not the case. Excitation to a higher energy level and simultaneous deactivation of the donor event will not likely interfere with the signal generation.
Excitation of the acceptor to a higher energy level means that there may in theory be further excitation, moving the acceptor from the first singlet state (A)b) Activation to a higher singlet state (A)x). If this is indeed possible, the maximum number of firing events in a given time will increase due to the shorter useful life. A shorter useful life occurs because the receptor does not have to be deactivated in order to undergo energy transfer. This energy transfer can only occur in the acceptor if the transferred energy absorbed by the acceptor is identical to the energy emitted by the donor, which is not generally the case for most molecules. Thus, energy transfer between the donor and acceptor is only possible when the acceptor is in its fundamental singlet state.
In the case of simultaneous deactivation of the donors, only one donor is able to transfer energy to the acceptor. This means that the other donors do not quench and emit radiation. If the simultaneous events occur frequently, the multiple donor quenching described above will not be as precise as the donor's share capable of emitting photons. The probability calculations described below demonstrate that such events are not statistically frequent and thus support the use of multi-donor quenching.
Probability n-P of simultaneous emission of k donors within 1nsn,k=(Pk)(nCk) Where n is the number of fluorophores.
Inability to undergo energy transfer to shortendonor emission
The purpose of these calculations is to calculate the number of simultaneous donor deactivation events in a given duration. This number is important because the larger the number of overlapping events (the number of overlapping events), the smaller the percentage of donor energy transfer. For example, it is possible to determine the probability (P) that two donor simultaneous emissions (k 2) occur in 1 nanosecond for 4 fluorophores (n 4)n,k=P4,2). In this example, each emission lasts 1 nanosecond and is represented as a blue dot in the grating. In addition, each fluorophore emits an average of 25,000 photons per second at random. These variables are defined as n ═ fluorophore number; k is the number of simultaneous emissions of the donor; p is probability; c is combination; to be provided withAnd t is time. Probability of k simultaneous events occurring within 1 nanosecond for n fluorophores (P)n,k) Probability (P) equal to k simultaneous eventsk) Multiplication by the k-fold homogeneity possible for n fluorophoresNumber of combinations of time events: (nCk). The total number of simultaneous events is given as the sum of the probabilities of all possible cases of simultaneous events. This gives the probability in units of (event number/nanosecond). Thus, the total number of fluorophores undergoing simultaneous emission is the probability calculated for 1 nanosecond multiplied by the given time (t). Taking into account the probability (P) that more simultaneous donors emit within a given time (t)4,3And P4,4) Is also necessary. From this information, the number of donor fluorophores that cannot undergo energy transfer due to simultaneous deactivation can be deduced.
The probability of two donors emitting simultaneously in 4 fluorophores in 1 nanosecond time is given by: the probability of 1 nanosecond containing 1 emission is 25,000/109. The probability of two occurrences occurring within the same nanosecond is the square of the above probability (25,000/10)9)2. Since there are 4 different fluorophores, there are 6 different combinations which can give rise to simultaneous emission (4!/2! 2!). Multiplication of these values gives 3.75X 10⁻⁹Event/nanosecond. This value is multiplied by 109Nanosecond yields 3.75 events/second. In thiscase, there are two emissions per event (k ═ 2) and one of these (k-1) cannot undergo energy transfer, so the total number of donor emissions that do not undergo FRET is 3.75 events/second.
The simple calculations described above can be applied to systems with a greater number of fluorophores. In this case, 1000 fluorophores (n 1000) can be considered. P is calculated in a similar manner1000,2Is 3.122X 10⁻⁴Event/nanosecond. The number of donor shots that could not undergo energy transfer was 3.122X 10⁵. In some cases, simultaneous emission from three donors may occur. Probability (P) of these events1000,3) Is calculated to be equal to: the number of donor emissions that cannot occur is (3-1) (10)9)(2.596×10⁻⁶) I.e. 5.192X 10³. In a similar manner, the calculation of quadruple or more simultaneous emissions needs to be included within the actual number of donor fluorophores that cannot undergo energy transfer. This number is expressed as:
solving the above equation yields a donor emission number of 3.174 × 10 without energy transfer5. The donor emission is calculated as the following value: 25000 photons/sec/fluorophore, 1000 fluorophores, and a 1 sec time interval. This means that 2.5 x 10 will be emitted per second7One photon. The conclusion was that 98.7% of the donor events were able to undergo energy transfer.
The conclusion from the above discussion of the multiple donor/single acceptor system is that one acceptor can undergo energy transfer with multiple donors. The limit of simultaneous deactivation of the donor is also taken into account, considering that the acceptor is excited to a higher energy level. Only one deactivated donor can undergo energy transfer with the acceptor when donor emission is coincident, and if this is often the case, the acceptor will not be able to undergo energy transfer with the donor emission event. Probability calculations indicate that 98.7% of the donor emission events are able to undergo energy transfer with the acceptor for a system of 1000 donors/1 acceptor under standard illumination conditions. The overall conclusion from these detailed analyses is that a multi-donor/single acceptor system can indeed exist, and that a single acceptor can undergo energy transfer with a large number of donor molecules.
The following describes how the optimal conditions are chosen for the donor and acceptor fluorophores of a multi-donor/single acceptor system. In order to optimize the system, two issues that may arise when this system is actually running should be considered. These problems are photobleaching and dissolution quenching (Rost, 1990; Menter et al, 1978; Giloh and Sedat, 1982; Vaughan and Weber, 1970; Guilbaut, 1973; Udenfriend, 1962; Pringsheim, 1963). These effects may limit the number of excitation cycles that a fluorophore can undergo. In contrast to the situation where fluorophores are capable of undergoing an infinite number of excitations in an ideal system, the number of excitation cycles that can be experienced in practice is limited, depending on the solvent conditions and the intensity of the exciting light rays. However, the signal generated in a multi-donor/single-acceptor system can be optimized under certain experimental conditions.
The theory of optimizing and generating valid signals is as follows. The basic principle is that a signal can be generated as long as the model conditions are simulated as closely as possible. Recall that an ideal fluorophore is capable of undergoing an infinite number of excitation cycles. If the actual fluorophore behaves in a similar manner, any number of fluorophores can be detected as long as the time accumulation of photon emission is sufficient. One way to achieve near ideal conditions is to immobilize the fluorophore in a solid medium. The incorporation of fluorophores in solid media eliminates photobleaching and quenching effects (Haughland, 1996; Garland and Moore, 1979; Rost, 1991), and certain types of fluorophores are particularly stable (e.g., ferulic acid, uranyl glass, and acriflavine in plant cell walls) (Rost, 1991). This will significantly increase the number of possible excitations. Despite being embedded in a solid medium, donor fluorophores can generate fluorescent signals for hours (Rost, 1991) and still undergo FRET with acceptors (Stryer, 1978; Cantor and Schimmel, 1980), and vice versa. Furthermore, it is well known that the acceptor is able to undergo energy resonance transfer with the donor under solvent conditions for several hours (Wittwer, 1997; Lee et al, 1994; Uchiyama et al, 1996; Livak et al, 1997). The ability of the acceptor to quench the donor that provides a stable signal translates into the ability to generate a very efficient signal.
It has been demonstrated that the acceptor can undergo energy transfer with the donor under solvent conditions over an extended period of time (Witter, 1997; Lee et al, 1994; Uchiyama et al, 1996; Livak et al, 1997). Evidence is derived from experiments based on protein and nucleic acid cleavage assays. In these assays, a particular substrate is labeled at one end of its band with a donor or acceptor fluorophore. Since the length of the substrate is within the Forster distance range of the donor-acceptor pair, the fluorescence of the donor is quenched. Monitoring the fluorescence of the donor allows for light-based cleavage assays to be performed. In this method, the increase in donor fluorescence is proportional to the cleavage activity of the particular enzyme. This type of analytical assay, commonly referred to as the fluorescent cleavage assay, has been used in the study of a variety of systems, including HIV protease (Matayoshi et al, 1990; Toth and Marshall, 1990), neutral protease (Ng et al, 1989), EcoRV restriction endonuclease (Erskeine and Halford, 1994), PaeR7 endonuclease (Ghosh et al, 1994), the activity of DNA polymerase I5 '-3' exonuclease (Wittwer et al, 1997; Livak, 1997), thermolysin (Yang and Van Wart, 1994), and papain (Garcia-Echeverria and Rich, 1992). The specificity of these experiments is important because they contain evidence that the acceptor is able to quench the donor over an extended period of time. In the fluorogenic cleavage assay, the control group included monitoring the uncleaved substrate for the duration of the experiment (in the absence of the cleaving enzyme). For particularly lengthy experiments, these control groups need to be monitored over an extended period of time. The lack of enhancement of donor fluorescence in these controls directly demonstrates that the acceptor is able to quench the donor for a considerable period of time.
Because the energy state of the receptor remains unchanged, the receptor retains its ability to transfer energy for an extended period of time. Energy transfer occurs when the energy absorbed by the acceptor is identical to the energy emitted by the donor. The result of the energy transfer is the basic singlet state (A)a) Towards the excited singlet state (A)b) Is performed. The acceptor loses energy through internal conversion (either fluorescent or non-radiative). The research work cited previously demonstrated that, despite non-ideal experimental conditions, the receptors retain their relative energy levels and therefore their ability to undergo energy transfer.
Fluorophores are typically subjected to a number of excitation cycles in solution of approximately 35,00 cycles (Rost, 1991). However, the number of excitation cycles of the fluorophore in solution is limited by the solvent effects discussed above (e.g., oxygen quenching, collision quenching, and excited state reactions). The number of excitation cycles can be optimized by adjusting the solvent conditions (Haughl)and, 1996). To optimize the conditions for detecting acceptor fluorescence, a variety of chemical methods can be employed. It has been found that sodium azide (NaN)3) Sodium iodide (NaI), Dithiothreitol (DTT), Dithioerythritol (DTE), sodium dithionite, propylgallate and polyvinyl alcohol (PVA) are effective against a variety of fluorophores (Bock et al, 1985; Johnson et al, 1982; Picciiolo and Kaplan, 1984; Gill, 1979; Giloh and Sedat, 1982; Valnes and Brandtaeg, 1985.) it has also been found that β -mercaptoethanol, sodium nitroprusside and the incorporation of an electron donor with a molecule bearing a SH group are also effective (Franklin and Filion, 1985; Spatz and Grabig, 1983; Hamada and Fujita, 1983.) furthermore, industrial reagents for reducing discoloration of dihydrofluorescein solutions are also available.
The term "detectable signal" in this context is any type of signal that can be detected using conventional techniques. The signal generated depends on the type of reagent, station, unit and adjacent compound (if present). In one embodiment, the signal is electromagnetic radiation generated by light emission of a polymer unit or a neighboring compound with a (endogenous or exogenous) label. In another embodiment, the signal is fluorescence generated by interaction of radioactive radiation with the scintillation layer. The detected signals may be stored in a database for analysis. One way to analyze the stored signal is to compare the stored signal with a signature from another polymer in order to determine the relationship between the two polymers. Another way to analyze the stored signal is to compare the signal under test to a known signature that is characteristic of a known polymer to determine the relatedness of the polymer being analyzed to the known polymer. The comparison of the signals will be discussed in detail below.
More than one detectable signal may be detected. For example, a first individual unit may interact with a reagent or station to produce a first detectable signal, while a second individual unit may interact with a reagent or station to produce a second detectable signal different from the first detectable signal. This allows the detection of multiple units on a single polymer.
The detectable signal is generated in the station. The term "station" herein is an area where a portion of the polymer (i.e., unit) to be detected is detected, i.e., exposed, to generate a signal or pulse that varies with the polymer. The stations may be composed of any material, including a gas. The preferred stations are of non-liquid material. "non-liquid" has its conventional meaning in the art. Liquids are non-solid, non-gaseous substances characterized by the free movement of their constituent molecules in themselves and by no tendency to separate. In another preferred embodiment, the station is a solid material. In one embodiment, the station is an interaction station when the unit interacts with a reagent. The stations may also be signal generating stations, which will be discussed in detail below. As used herein, an "interaction station or site" is a region in which a polymer unit and a reagent can be positioned sufficiently close to each other so that they can interact. For example, interaction stations suitable for fluorophores are areas where they are sufficiently close that they can undergo energetic interactions to generate a signal.
In a preferred embodiment the interaction station is a region of a nanochannel where a reagent (e.g., an acceptor fluorophore) localized on the walls forming the channel and capable of interacting with a polymer passing through the channel. The point at which the polymer passes through the reagent localization zone is the interaction station. Each labeled unit in the polymer produces a detectable signal when the reagent is bypassed. The reagent may be positioned within the channel region in various ways. For example, the reagents may be embedded in the material forming the channel walls, or the reagents may be attached to the surface of the wall material. Alternatively, the reagent may be a light source which is located at a distance from the channel but is capable of transmitting light directly to the channel region via a waveguide. It is also possible to use a device in which multiple polymers can be delivered through multiple channels. These and other embodiments related to the present invention are discussed in more detail below. Polymer movement can be assisted by the use of grooves or rings to guide the polymer.
The invention also includes other arrangements for establishing the interaction stations. For example, the polymer may be passed through a molecular motor tethered to the surface of a wall or embedded in a wall, thereby bringing the polymer units sequentially to a specific location, preferably within an interaction distance of a proximate reagent, thereby defining an interaction station. A molecular motor is a compound, such as a polymerase, helicase (helicase) or actin, that interacts with the polymer and is transported through each unit along the length of the polymer. Also, the polymer may remain stationary while the reader, which has attached reagents, moves along the polymer. For example, the reagent may be held within a scanning tip that scans along the length of the polymer. An interaction station is established when the reagent is moved into a distance where interaction with each polymer unit occurs.
Once the signal is generated, it can be detected. The particular type of detection means will depend on the type of signal generated, which of course will depend on the type of interaction that takes place between the unit and the reagent. Many of the interactions involved in the methods of the present invention will produce electromagnetic radiation signals. Many methods suitable for detecting electromagnetic radiation signals are known in the art, including two-dimensional or three-dimensional imaging systems.
Recently, three-dimensional imaging systems have been described that image fluorescence in biological systems. Three-dimensional imaging of single molecules in gel wells has been described by Dickson et al (Dickson et al, Science, 274: 966-. Dickson et al studied the effect of a defined environment on the Brownian motion of a single fluorescent molecule. Capture of free fluorescent stain with Polyacrylamide (PAA) gelA single molecule of dye and a single molecule of fluorescent dye bonded to a protein. Nile Red is incorporated into microporous polyacrylamide gelGlue, wherein the pore size is about 2 nm. Fluorophore gels are excited by a evanescent wave generated by Total Internal Reflection (TIR) and the motion or mobility inhibition of a single molecule within the pores of the gel is detected. TIR methods use an exponential drop in excitation intensity to generate three-dimensional information about the molecules in the microwells to determine the distance of the fluorophore from the interface. The difference between the observed motion and the theoretical brownian motion was studied in two cases. Brownian motion reduction 10 for the case of free fluorophore4And (4) doubling. The labeled protein remains completely stationary in space. By direct simulation, the spacing of the nanochannels should limit or eliminate brownian motion of the labeled DNA upon quenching of the nanochannel FRET. This will allow for the stable passage of the desired DNA through the nanochannel.
Examples of microscopic systems for use in accordance with the methods of the present invention are those described in Ishijima et al, Cell, 92: 161-171 (1998).
Two-dimensional imaging systems are important because they offer the advantages of low noise, high quantum efficiency, proper correlation of pixels to image, and processing time savings in terms of parameters. An example of a device for detecting signals is a two-dimensional fluorescence imaging system that detects electromagnetic radiation in the fluorescence band.
Fluorescence imaging systems based on measuring fluorescence signals have three areas, including measuring intensity, lifetime, and spectra. Various methods may be employed to capture the intensity signal, including Charge Coupled Device (CCD) cameras, fringe cameras, and silicon diode arrays. Since the CCD camera is widely used in industrial applications, it is the most common of these methods. Stripe camera provides femtoseconds (10)-15Seconds) or less. Silicon diode arrays have excellent dynamic range, signal-to-noise ratio and temporal resolution (typically at a frame rate of 1000/s.), but the pixel is large (25 μ M by 500 μ M, whereas charge coupled device CCDs have only 20 μ M by 20 μ M). Each device can be used with the method of the invention, but a CCD camera is preferred.
Lifetime and spectral imaging are accomplished by a combination of instruments, including a gated image intensifier, a pulsed laser, and a CCD camera. Time-gating, a life-related technique, involves identifying the fluorescent signal from background to autofluorescence over time. A review is provided by Periasamy et al, which is incorporated herein by reference, describing time-gated fluorescence Microscopy for clinical use [ Periasamy et al, Microcopy and Analysis, 33-35, (1995)]. Lifetime imaging uses time-gating or phase modulation techniques to determine the lifetime of the fluorescence. Spectral imaging determines the emission spectrum at each pixel. Time-gated and lifetime imaging techniques offer many advantages over simple CCD imaging, such as better signal-to-noise ratio and greater dye characteristics, and are therefore also preferred devices for use in the detection methods of the invention.
The first type of imaging technique, intensity imaging, typically involves the independent capture of intensity signals using a CDD camera or an ICCD camera. This is a method of detecting a signal that meets the requirements of the present invention because of its simplicity. CCD and ICCD cameras are readily available from commercial suppliers (i.e., Photometric, Hamamatsu, Princeton, Instruments).
CCDs are two-dimensional silicon materials having a plurality of photosensitive elements, called pixels, which are capable of storing charge generated by photon interactions. Exposure of the CCD to fluorescent photon emission will cause charge accumulation in each pixel. After exposure is complete, the entire row of accumulated charge is transferred towards the serial CCD register. In this serial register, the accumulated charge of each pixel is fed to a sense amplifier which generates a signal proportional to the amount of charge. Each row of the CCD is read in the same manner until the image is successfully converted into a two-dimensional sequence of signals. The charge transfer between the CCD and the CCD serial register is extremely efficient (99.9999% efficient). The output amplifier produces a linear response to the measured analogsignal and digitizes the image between 8 and 16 bits.
There are two options for reading the image, which CCD cameras typically use to modify the image. These two options are readout of the subarray and binning (i.e., charge grouping) of the subarray. The programmed CCD camera can selectively process pixels in a designated area of interest. The advantage of specifying regions of interest is to allow a faster formation of the readout image. Since the processing and digitization time per pixel is fixed, a higher frame rate is allowed for the smaller area required. It is possible to read out a smaller area from the sub-array. For example, 100 × 100 pixels can be read out at a pixel read-out frequency of 1MHz at a frame rate of 100 frames/second from a 1024 × 1024 pixel CCD. On the other hand, binning is the combination of several smaller pixels into one larger pixel to reduce readout time, which allows the charge from several pixels to be combined. The CCD operates at a low resolution during binning to increase dynamic range and provide a higher frame rate. The dynamic range is the ratio of the maximum signal that the CCD can detect linearly to the readout fundamental noise. For example, a 1024 x 1024 pixel CCD is 4 x 4 regressed to produce a 256 x 256 image with 16 times larger pixels than the non-regressed version. But the image can be read out at 16 times the speed. The particular operating mode of the CCD is defined by the components of the camera and the host computer.
To understand the control of the CCD, there are three typical CCD components that need to be discussed, including a camera controller, electronic circuit units, and a camera. The controller acts as an intermediate processor for input and output between the host computer and the camera. The controller contains logic that causes the camera to execute certain host commands. It also forwards the digitized pixel data to the computer. The controller hassome internal sequence necessary to determine the coordinates of the CCD phases and to time the analog signal processing unit. The electronic circuit unit converts the digitized commands into an effective clock signal and sequence. Furthermore, the unit contains an a/D converter. An 8-bit to 16-bit digitizer is typically used. The camera comprises a CCD and a cooling device. Liquid nitrogen or peltier cooling is common.
In the case of a basic understanding of the operation of a CCD camera, it is most important to consider the performance of the camera. In particular, these parameters are noise, linearity, quantum efficiency and temporal sharpness. There are four important noise components. These are dark current, reading noise, heave noise and lamp noise. Dark current is a weak current in the CCD. This is true because there is charge accumulation even in the dark. The lower the temperature of the CCD, the smaller the dark current. The thermo-electric refrigerator or liquid nitrogen can lower the temperature of the CCD, thereby reducing dark current. A temperature of-120 c can reduce dark current by several orders of magnitude. Multi-pin phasing (MPP) is a new CCD technology that reduces dark current by a factor of 100 or more. The read noise is the random charge generated at higher frame rates due to the output preamplifiers. As the collection rate increases, the reading noise also increases. The reading noise can be significantly reduced at temperatures below-60 ℃. The fluctuation noise, also commonly referred to as photon noise, arises from the quantum nature of light. Which is the square root of the photon signal. At low light levels, the relative rolling noise is high and tends to mask the desired signal. Lamp noise is caused by brightness fluctuations of the illumination source and can be controlled by using a regulated power supply. In the quantitative application of CCD cameras, the lamp noise is often very negligible.
During quantitative analysis with fluorescence microscopy, the linearity of the photometer becomes particularly important. The concept of linearity is not so important for use in the method of the invention, since generally linear operators will not be applied to CCD data. Since the charge generation mechanism of the CCD is inherently linear, the output signal is precisely proportional to the charge. The electronic circuit between the CCD and the digitizer provides room for drift. High-tech CCDs typically exhibit linearity of less than 0.1% drift. In most cases, such linearity is difficult to measure because it is higher than the technique used to verify it.
Quantum efficiency is the fraction of photons reaching the CCD that interact to produce electron-hole pairs in the CCD. The quantum efficiency ranges from 10% (low-grade CCDs) to up to 80% (back-illuminated high-tech CCDs). There is also a spectral shift in quantum efficiency and the peak typically occurs at visible wavelengths. Back-illuminated CCDs have much higher quantum efficiency at all spectral positions.
The temporal resolution of a CCD camera is important in discussing the frame rate that the camera can achieve. The exposure time varies for a given application and can be adjusted by the number of fluorophores used and the intensity of the excitation light. The limit of instantaneous sharpness in a given camera is a function of the operating frequency of the analog-to-digital converter and the image size. For example, an A/D converter operating at 1MHz can read 100 frames of 100X 100 images in 1 second. Furthermore, the greater the required dynamic range, the lower the reading frequency. For example, it is difficult for current CCD cameras that are digitized at 14 bits per pixel to operate above 1 MHz. The use of parallel serial register devices can break through the transient limitations imposed by an a/D converter. The speed increase with such devices is proportional to the number of available channels. A CCD camera operating at 1MHz with 4 output registers can obtain a 14 bit 100x 100 pixel image at a rate of 400 frames per second. The speed of non-breakthrough is determined, at the most, by the pixel readout time, which varies from 20 mus to 500 ns. Even the slowest pixel readout time can reach 500 frames/second for 100x 100 pixel images. Therefore, the frame rate is not limited by the a/D converter, unlike the read time. As a proof of this view, a frame rate of 2000 frames/sec has been obtained using a 128 × 128 array (Ichikawa et al, 1992).
CCD cameras that are particularly useful in the method of the present invention are cameras that are large in pixels, low in noise, and short in scan time. Large pixel sizes have a larger well capacity and allow more photons to be collected and thus a higher signal-to-noise maximum. The basis for identifying intensity variations is a high signal-to-noise ratio (discussed briefly below). Thus, low noise helps to improve the signal-to-noise ratio (SNR). MPP type CCD devices having a relatively small well capacity and a relatively narrow dynamic range are not suitable. Due to the short scan collection, the temporal resolution is high, allowing for a high volume data stream that should be able to be stored in real time in the RAM or hard disk of a computer. Quantum efficiency should be adequate. The linearity of the CCD is not critical, but it is assumed to be of high-tech grade (0, 1%). Because the donor fluorophores that make up the image have approximately the same intensity, dynamic range is also not critical.
An intensified CCD (iccd) camera includes, in addition to the CCD camera, an optical (electro) cathode, a microchannel plate (MCP), and a phosphor screen. Fluorescence is irradiated on the photocathode to release photoelectrons to the MCP. The MCP is a secondary electron multiplier that includes millions of glass capillaries (channels) fused into an array of thin disks. Secondary electrons are generated when photoelectrons are incident on these channels. These electrons produce a directly controlled amplification through those channels as the instrument gain. Each channel in the MCP corresponds to a pixel. The output of the MCP is focused on the phosphor screen where electrons escape as a result of the MCP discharge. The optical image is reproduced on a fluorescent screen and captured by a CCD camera.
In some instances, it is preferred to use ICCD. The additional image intensifier provides high speed gating and high gain. Gating is probably the most important aspect of ICCD. Which is an electronic shutter action produced by controlling the input voltage supplied to the image intensifier. Time resolved imaging is now quite possible with gate times of nanoseconds and less (Thomas et al, 1992). Gating will allow more signal detection because of the temporal discrimination of the background signal. Temporal discrimination and signal-to-noise improvement are seen in the pulsing of time-gated fluorescence microscopy and fluorescence lifetime imaging microscopy. The gain of the image intensifier is used to increase the sensitivity of the camera and serves as a tool in the phase modulation method of fluorescence lifetime imaging microscopy. The electronic gain can be as high as 10,000: 1. This allows the weak optical signal to be amplified above the reading noise.
Single photon events can be detected with ICCD. For example, Sase et al in 1995 have achieved single fluorophore imaging using CCD cameras, image intensifiers and epifluorescence microscopy. The ability of a Single fluorophore to image in Real Time with high detection efficiency is discussed in the Sase et al paper "Real Time Imaging of Single Fluorophores on Moving Activities with an Epifluoresence" for Single fluorophore Imaging on Moving actin by fluorescence microscopy. Other methods that have been implemented to resolve single molecule sensitivity include fluorescence correlation spectroscopy (Eigen and Rigler, 1994; Kinjo and Rigler, 1995), far-field confocal microscopy (Nie et al, 1994), cryofluorescence microscopy (Kartha et al, 1995), photon burst counting of single molecules (Haab and Mathies 1995; Castro and Shera, 1995; Goodwin et al, 1995; Peck et al, 1989; Nguyen and Keller, 1987; Lee et al, 1994; Chen and Dovichi, 1996; Shera et al, 1990; Soper et al, 1992), two-photon excited fluorescence (Mertz, 1995) and electrochemical detection (Fan and Bard, 1995).
The value of SNR can be calculated based on various requirements for the CCD camera. For example, a CCD that meets the criteria set forth above is an EEV05-20CCD (princetons instruments, Princeton, NJ) having the specifications set forth in Table 1:
| TABLE 1 | |||
| CCD format | 1152×770 | Dynamic range, bit | 14 to 17 |
| Pixel size, μ s | 22.5×22.5 | Non-linearity degree% | < 1(16 bit) |
| Full well capacity, ke' | 500 | Dark charge at-120 ℃ is obtained, electron/frame-hour | <1 |
| Reading noise, e' | 4-6,50Hz; 22,500Hz | Quantum efficiency,% peak value | 40 |
In order to calculate the SNR, equations that consider various noise values are required. There is always fundamental noise in any detection system that may prevent the detection of weak intermittent signals. Intuitively, the stronger the desired signal, the less important the underlying noise becomes. Stronger signals and higher signal-to-noise ratios can be obtained by increasing the number or excitation intensity of fluorophores. The equation for calculating SNR is: PE represents the number of photoelectrons emitted from the detector and is related to the efficiency (E) of the detector system. The higher the efficiency, the greater the number of emitted photons for a given number of photons. PE is also related to the number of fluorophores (N), the preamplifier gain (G), the summation time (t), the light intensity (I), the molar extinction coefficient (epsilon) of the fluorophores, and the fluorescence constant (p) specific to the selected fluorophore. N is a radical ofshotRepresents noise caused by random fluctuations in fluorophore emission and is related to the resulting signal amplitude. The stronger the signal, the greater the ripple noise. N is a radical ofdarkAnd NreadDark noise and reading noise. N is a radical oflampIs noise generated by the illumination source. Note that it is important that N be in SNRlampMay have a considerable effect. An illumination source with an intensity fluctuation of 1% may have a SNR as high as 100: 1. In this case, lamp noise is minimized by using a regulated power supply. For example, commercially available (Uniphase) helium-neon lasers, with improved power supplies, have intensity fluctuations of less than 0.002% of the total intensity. In addition, the tungsten lamp may be equipped with a regulated power supply such that the output fluctuation of the bulb is less than 0.001%. Table 2 lists the variables and provides reasons for selecting these particular values.
| TABLE 2 | ||
| Variables of | Numerical value | Reason for |
| I | 30W/cm2 | The intensity of the 2W laser is given by P/A. A. the Is the beam area. The intensity of the laser is 64W/cm2 |
| ε | 91,000I/Mcm | Molar extinction coefficient of fluorescein |
| ρ | 3.8×10⁻²¹Mcm3 | Fluorescence emission constant of fluorescein |
| t | 0.010s | Summation time for a CCD operating at 100 frames/second |
| E | 0.025 | Quantum efficiency including filter, objective lens and CCD The collection efficiency of the system |
| N | 1000 | Reasonable donor fluorophore number/pixel |
| G | 60 | Gain of a typical preamplifier; increase in ICCD The benefit can be as high as 10,000: 1 |
| h | 6.6261×10⁻³⁴Js | Planck constant |
| ν | 6.1224×10¹⁴s-1 | c ═ ν λ; lambda 490nm (excitation wavelength of fluorescein) |
| Nshut | 632e-1 | Nshut=PE |
| Nlamp | 8e-1 | 0.002% strength fluctuation |
| Nread | 40e-1 | For EEV05-20CCD at high read-out speed Estimation result |
| Ndark | ~0 | Value of EEV05-20CCD at-120 deg.C |
| SNR | 631∶1 | From the above equation |
The SNR of 631: 1 is high. A high SNR guarantees efficient detection of both intensity and intensity variations, in other words emission of the donor in the absence and in the presence of the acceptor. For example, a SNR of 631: 1 means thata confidence of 66% is said to detect a 0.158% (1/632 × 100) signal change. Say a 0.316% change was detected with a 95% confidence; say that a 0.475% change was detected with 99% confidence. The greater the intensity variation, the greater the detected variation. A higher reference SNR in the absence of any intensity variation allows for a greater confidence interval for a given intensity variation percentage. In order to maximize the confidence in detecting signal changes, it is important to produce a large percentage of changes in the presence of receptors.
One way to create large percentage changes is to cluster multiple donor fluorophores around the interaction station, e.g., in concentric rings through which the polymer can pass, to ensure that all donor fluorophores will undergo energy transfer with the acceptor. The appropriate width of such concentric rings of donor fluorophores is determined by the emissivity of the donor and the Forster distance of the donor-acceptor pair. The typical intensity variation distribution on passage of the receptor ranges from 30% to 50%, which corresponds unambiguously to a confidence of 100%.
Each signal generated must be captured by a pixel of the detector system before the CCD camera can process the signal. Each pixel should be able to capture a signal from a single interaction station and should have the ability to detect temporal changes in the signal. The area of the interaction station (e.g. reagent-locating region on the nanochannel) that is detected by a pixel is determined by the size of the pixel on the detector, the magnification of the image, and the diffraction limit at the wavelength of the band. The relationship between measurement area, detector pixel size and magnification is given by:
a=2d/M
the size of the region to be measured is represented by a2Where a is the side length, are given. The side length of a detector pixel is given by d. The magnification is given by M. With the conventional values of these variables: d 15 μ s and M60 x, the edge length of the measurement region is calculated to be 500nm, which is well within the range of the resolution of signals with a wavelength of 500 nm. The resolving power for a suitable microscope sample under surface illumination conditions is given by (Matsumoto, 1993):
Rf=0.61λ/NARfis the minimum distance between two bright spots being resolved. λ is the wavelength of fluorescence emitted by the donor. NA is the numerical aperture of the microscope objective. Since NA is inversely related to resolving power, the highest numerical aperture is required. NA is given by the following classical criterion for proper lens selection (Taylor and Salmon, 1989):
NA-nsin Θ n is the refractive index of the immersion medium. It is often desirable to use a medium with a higher refractive index (e.g., oil). Θ is the angle between the optical axis and the maximum edge light entering the lens. For high quality, high magnification microscope objectives, the numerical aperture can be as high as 1.4. From the two equations above, the resolving power is 218nm for a 500nm emission signal and a lens with an NA of 1.4.
The conclusion from the above calculations is that two adjacent pixels on the detector unit can each detect signals from their respective interaction stations without confusing the signal source. Crosstalk between pixels can be avoided by careful calculation of the magnification and pixel size. For example, if the smallest pixel size (d ═ 6 μ M) and the largest magnification factor (M ═ 100x) are used, the side length of the examined region is 120 nm. Since the resolving power of the system remains constant at 218nm, signal interference will be present. This can be avoided byperforming these calculations prior to determining the experimental conditions. Therefore, the optimum value of the measurement region matching the diffraction limit can be obtained by adjusting the magnification and the pixel size on the detection system. This optimum value can be determined from the simultaneous equations of the two equations by setting the side length equal to or greater than the resolving power of the detection system:
the density of the interaction stations 2d/M ≧ 0.61 λ/NA can be varied so that the interaction stations correspond one-to-one to the pixels of the detection system. For example, if 4 × 10 is adopted6A nanochannel/square centimeter plate, using a magnification of 60x and a pixel size of 15 μ M, will find each pixel to occupy 0.01 nanochannels (interaction stations). The density of the interaction stations can be adjusted lower, for example, 48 μ M minimum average distance between microwells is also within a suitable range.
In addition to intensity imaging, both time-gated fluorescence microscopy and fluorescence lifetime imaging may be used to detect signals according to the methods of the present invention. Both time-gated fluorescence microscopy and fluorescence lifetime imaging are more complex methods that have some advantages, such as temporal discrimination of the fluorescence signal and signal-to-noise ratio over intensity imaging.
Time gating is desirable if there is sufficient background scatter or autofluorescence. Background light scattering is a problem at the scattering wavelength equal to the emission wavelength of the desired fluorophore. The effect of scattering can be avoided by using fluorophores with large Stokes shifts to make the scattering wavelength shorter than the detected wavelength. In this case, the scattered light can be eliminated by using a filter. On the other hand, autofluorescence is a common problem affecting all studies using fluorescence microscopy. Autofluorescence may be caused by solvents, solutes, and optical components of the microscope system. Autofluorescence decreases the signal-to-noise ratio of the detection. This is the case even though many improvements have been made to the various components of the detector system (Periasamy and Hermen, 1994).
Time-gated fluorescence microscopy (TGFM) exploits the different fluorescence lifetimes to make a difference between autofluorescence and fluorescence. Fluorescent dyes having a longer lifetime than autofluorescence may be selected. The short-lived autofluorescence decays to zero in less than 1 μ s, while the long-lived fluorescence can show lifetimes from 1 μ s to 10ms (e.g., europium chelates, lanthanide chelates). Excitation of the sample may be performed with a brief intensity pulse that is shorter than the autofluorescence or fluorescence lifetime. Followed by an exponential decay. If the measurement is performed only after the fluorescence signal has decayed, a signal with a longer lifetime will be measured with a higher sensitivity.
An example of an imaging device suitable for TGFM is provided in article by Periasama (1995). In this reference, a fluorescence microscope with surface illumination capability and a Continuous Wave (CW) laser (Coherent or Spectra-Physics) is shown emitting at the desired excitation wavelength. The excitation light of the laser is chopped by a chopper with chopping control to form a laser pulse having a prescribed pulse width. The light intensity was controlled using variable neutral density filters (Omega Optics). To delay the measurement time, a delay pulse generator is used to generate a signal to control a high frequency gated image intensifier (Hamamatsu) or chopper in the transmit optical path. CCD cameras (Priceon instruments or Photometrics) are used to collect the signals.
Fluorescencelifetime represents the average length of time a molecule remains in an excited state before returning to its ground state. There are two methods of measuring fluorescence lifetime. These are the pulse method and the pulse modulation method (Lakowicz, 1986; McGown, 1989; Gratton and Limkema, 1983). In the pulsed method, a sample is excited with a brief pulse of light, and then the time-varying fluorescence decay is measured. In the pulse modulation method, the sample is excited with sinusoidally modulated light. Phase shift and demodulation are used to calculate lifetime. Until recently, the lifetime measurement was not used with small cup samples (cuvette samples). In the last 5 years, methods have been developed to combine the two-dimensional resolution of the microscope with high-resolution lifetime measurements (Rodgers and Firey, 1985; Wang et al, 1990; Morgan et al, 1990; Cleg et al, 1991; Lakowicz and Berndt, 1991; Burrman et al, 1992; van de Ven and Gratton, 1992; Oida et al, 1993). The development of Fluorescence Lifetime Imaging Microscopy (FLIM) has allowed detailed investigation of the location and environment of fluorescent markers in cells and other microscopic samples. Advantages, theory and application of FLIM will be discussed below.
Various fluorescence lifetime measurements have been used for a variety of reasons (Wang et al, 1996) including specificity, sensitivity, quantitative estimation, and high temporal resolution. Lifetime measurements provide high specificity because fluorescent molecules have widely different lifetimes. The lifetime provides greater molecular discrimination by comparing absorption to emission. Lifetime measurements can also be performed in small numbers of molecules, resulting in sensitivity similar to intensity measurements. Quantitative estimation of the molecule by lifetime provides a true measurement, since the fluorescence lifetime is directly related to the fluorescence quantum yield of the fluorophore. Finally, lifetime can be used to detect transient events that occur on a timescale of the biomolecular processes (typically between picoseconds and microseconds).
There are two methods of determining life. First, the pulse method is described (Lakowicz, 1986). It is contemplated that a plurality of fluorophores may be excited with a brief pulse of light. The fluorescence signal of the excited molecule decays in a first order with time, given as an exponential function:
I(t)=Ae(-t/τ)where a is an arbitrary constant, t is time, and τ is fluorescence lifetime. As can be seen from the above equation, the fluorescence lifetime is the time required for the intensity to decay to 1/e (i.e., 63%) of the original value. One method of measuring lifetime is to use pulse sampling (Herman et al, 1996). Collecting D on adjacent frames1And D2. Each frame was analyzed using the lifetime equation, thereby producing the fig. 2 and 2-D arrays. After each excitation event, a multi-channel plate-gated image intensifier (MCP-GII) attached to the CCD camera is activated for a certain time interval (t) after the excitation pulse1) Switched on for a very brief time (i.e. 4 ns). The emission signal is acquired on the CCD which is continuously switched on. The same process is repeated a plurality of times to capture sufficient signal on one frame of CCD. At the generation of the data corresponding to t1After sufficient signal, the CCD is read and the gating window is gated to the excitation pulse (t)2) Biasing and then repeating the entire process. The data of the two frames are sorted by pixel-by-pixel analysis to give each pointThe image lifetime of (1).
Wang et al introduced in 1996 a device for pulsing FLIM, which included 5 main parts: (1) a pulsed light source; (2) image detection systems (gated image intensifier and CCD camera); (3) a timing control unit; (4) fluorescence microscopy. The system is the same as the device described for time-gated fluorescence microscopy (TGFM) above, except that the pulsed light source is a fluorescent picosecond pulsed light source (Coherent) comprising a mode-locked YAG laser, a dye laser with a third harmonic generator, and a cavity unloader (cavity dump). The picosecond pulses have tunable ultraviolet or infrared wavelengths. The rate produced ranges from a single pulse up to 76 Mhz.
A second method for determining the fluorescence lifetime is by means of phase modulation. This method uses light with sinusoidally modulated intensity rather than a pulsed excitation light source. The emission of the sample therefore follows the same sinusoidal variation. The modulated emission signal is phase delayed due to the different excitation durations of the fluorescent molecules. The magnitude of the phase offset (a) is directly related to the lifetime of the fluorophore. In addition, there is demodulation of the transmitted signal. In other words, the final emission amplitude is smaller than the amplitude of the excitation light. The phase angle (I) and the demodulation factor (m) BA/BA are measured and used to calculate the phase age (tau)p) And modulation lifetime (τ)m)(lakowicz,1986)。 In a single exponential decay, τp=τmτ, actual fluorescence lifetime.
The underlying theory behind phase modulation lifetime determination can be applied to two-dimensional imaging systems. The following description will be based on reports by Gadella et al (1993) and Lakowicz and Szmaxinski (1996), which are incorporated herein by reference. The method uses a gain-modulated image intensifier that produces an image whose intensity is related to the phase shift of the transmitted signal. The lifetime image of the target can be calculated from several frames of phase sensitive images collected with different electronic retarders or phase shifts. For further understanding, it is necessary to give an equation describing the time-averaged phase-sensitive intensity from a certain point r:
I(r,θ-D)=I0(r)[1+1/2mDm(r)cos(θ(r)-θD)]where r denotes the pixel position, thetaDIs the phase angle of the gain modulated signal, θ (r) is the phase of the transmitted signal, mDIs the gain modulation of the detector, m (r) is the amplitude of the modulated transmitted signal, I0(r) is the original intensity of the pixel (which depends on concentration). This equation will beThe intensity of a given pixel is described as two control parameters (theta)DAnd mD) And three unknown parameters (I)0(r), θ (r), m (r)). Recall that if θ (r) or m (r) is known, then the lifetime (τ) can be determined. Because there are three unknown parameters, at least three different images are required to determine the lifetime of the sample. By controlling the phase angle (theta) of the gain-modulated signalD) A series of phase sensitive images will be generated and hence lifetime can also be determined.
Lakowicz and Szmaxinski (1996) have introduced devices for phase modulating FLIM. Excitation is provided by the output of a cavity unloading laser, which is fed by a mode-locked Nd: YAG laser synchronous pumping. The excitation light is expanded by a laser beam expander. A gated image intensifier is located between the target and the CCD camera. The gain of the image intensifier is modulated with the output of the frequency synthesizer. The CCD camera captures the phase-sensitive image. A computer with FLIM software processes the output to produce an image of life.
Other interactions involved in the method will produce nuclear radiation signals. When the radiolabel on the polymer passes through a defined detection zone (e.g. a station), nuclear radiation is emitted and a portion of the nuclear radiation will pass through the defined radiation detection zone. A nuclear radiation detector is positioned proximate the radiation detection zone to capture the emitted radiation signals. Many methods of measuring nuclear radiation are known in the art, including bubble chamber devices, constant current ion chambers, pulse counters, gas counters (i.e., Geiger-Muller counters), solid state detectors (surface barrier detectors, lithium drift detectors, intrinsic germanium detectors), scintillation detectors, Cerenkov detectors, and the like.
Other types of signals generated are well known in the art and there are many detection methods known to those skilled in the art. Including opposed electrodes, magnetic effects, and piezoelectric scanning tips. The opposing nanoelectrodes can function by measuring changes in capacitance. Two opposing electrodes create an energy storage zone, which is actually between the two electrodes. It is well known that when different substances are placed between the electrodes, the capacitance of the two opposing electrodes will change. This valueReferred to as the dielectric constant. The change in dielectric constant can be measured as a change in voltage between the two electrodes. In this example, different nucleotide groups, i.e., polymer units, may result in different dielectric constants. Capacitance according to equation C ═ KC0Varies with the dielectric constant of the polymer unit, where K is the dielectric constant, but the capacitance without any radicals. Then, the voltage reflection of the nanoelectrode is output to a measuring device, and the change of the signal along with the time is recorded.
Nanoscale NMR detection equipment was constructed to detect the passage of polymer units with unique spin labels. The nano-NMR detection apparatus includes a magnet that can be scanned and a means of irradiating the polymer with electromagnetic energy of constant frequency (which is the same as maintaining the magnetic field at a constant scanning electromagnetic frequency). When the magnetic field reaches the correct strength, the nuclei absorb energy and resonate. This absorption causes a very weak current to flow in the antenna coil around the sample. The signal is amplified and output to a recording device. For compounds with known labels, the detection time is much shorter than current NMR detection equipment, which requires a full spectrum of the above-mentioned compounds. The polymer units with known labels have known chemical shifts in specific regions, thereby eliminating the need to complete a full spectrum scan, thereby reducing the detection time of each base to microseconds or milliseconds.
A nanoscale piezoelectric scanning head can be used to read out different polymer elements based on the actual contact of the different polymer elements with the scanning head. Depending on the size and shape of the polymer element, different piezoelectric signals are generated, forming a series of element-dependent changes. The markings on the unit are actually different from the original unit and canform a stand-by means of detection by means of a piezoelectric scanning head. When the polymer unit contacts with the scanning head, the piezoelectric crystal changes and generates current to be output to the detection device. The magnitude and duration of the current caused by the interaction of the polymer element with the scan head reflects the characteristics of the polymer element.
After the detectable optical signal is generated, it is detected and stored in a database, and information about the structure of the polymer can be obtained by analyzing the signal. The computer may be the computer that collects the polymer data or a separate computer dedicated to data analysis. Computer systems suitable for implementing the invention typically include an output device for displaying information to a user, a host computer connected to the output device, and an input device for receiving input from a user. The host typically includes a processor connected to the memory system by an interconnect mechanism. An input device and an output device are also connected to the processor and memory system via the interconnection mechanism.
The nanochannels can be made by chemical deposition, which forms metal filaments across the entire width of the polycarbonate template membrane. The diaphragm may also be produced such that both surfaces of the diaphragm are covered with metal films to form a cluster of nanodisk electrodes, one of the metal films may be removed to expose the diaphragm surface. The metal film may be removed to expose the membrane surface. These electrodes may be linked at their base to a common current collector. This assembly is useful for studying the change in current as the polymer flows because the change in conductance is measurable. The preparation of such plates is described in the report by Martin, c.p.r. [ Science, 266: 1961-1965(1994)].
Computer programs for data analysis of the signal under test are readily available from CCD manufacturers. These programs may be executed on a general-purpose computer as described below. With the method of the present invention, only the existence of operations (dot operations) on a single pixel need be completed. The complexity of the spot operation depends on the imaging method used. Intensity-based imaging provides the fastest data processing because the computation is done only once for each pixel. Regardless of the imaging technique (intensity, TGFM, or FLIM), the algorithm performed on each pixel in each method is considered to be low-level compared to the whole frame operation of a sphere that needs to be performed under some more complex imaging conditions.
It should be appreciated that one or more output devices may be connected to the computer system. Examples of output devices include Cathode Ray Tube (CRT) displays, Liquid Crystal Displays (LCDs), printers, communication devices (such as modems), and audio outputs. It should also be appreciated that one or more input devices may be connected to the computer system. Examples of output devices include keyboards, keypads, trackballs, mice, light pens and tablets, communication devices, and data input devices (e.g., sensors). It should be appreciated that the invention is not limited by the particular input-output devices (i.e., those described herein) used in conjunction with the computer system.
The computer system may be a general-purpose computer system that is programmable using a high-level computer programming language (e.g., AC @). The computer system may also be dedicated hardware with a dedicated program. In a general purpose computer system, the processor is typically a commercially available processor, examples of which include the X86 family of processors available from Inter, similar devices available from AMD and Cyrix, the 680X0 family of microprocessors available from Motolola, the PowerPCmicroprocessor available from IBM, and the Alpha family of processors available from Digital Equipment corporation. Many other processors may be used. These microprocessors execute programs known as operating systems, examples of which include Windows NT, UNIX, DOS, VMS, and OS8, which control the execution of other computer programs and provide scheduling, debugging, input/output control, accounting, compilation, memory allocation, data management and memory management, and communication control and related services. A processor is an operating system that defines a computer platform for which application programs are written in a high-level programming language.
The memory system typically includes a computer readable portable non-volatile recording medium, examples of which include magnetic disks, flash memory, and magnetic tape. The disk may be a removable disk known as a floppy disk or a permanent disk known as a hard drive. A disk has many tracks that typically store signals in a binary format (i.e., a format that is interpreted as a sequence of 0 s and 1 s). These signals may define an application program to be executed by the microprocessor or information stored on the disk to be processed by the application program. In operation, the processor typically reads data from the non-volatile recording medium into the integrated circuit memory unit, which is typically a volatile random access memory such as a Dynamic Random Access Memory (DRAM) or a static memory (SRAM). The integrated circuit memory unit allows for the processor to access information at a faster rate than on a disk. The processor typically processes the data in the memory of the integrated circuit and copies the data to disk after processing is complete. Various mechanisms for managing the flow of data between a disk and an integrated circuit memory unit are known, and the invention is not limited by such mechanisms. It should also be understood that the present invention is not limitedto a particular memory system.
It should be appreciated that the invention is not limited by the particular computer platform, the particular processor, or the particular high-level programming language. Thus, the computer system may be a multi-processor computer system or may include multiple computers connected over a computer network.
In the memory system of a computer, data about the polymer may be stored in a database, i.e. a data file. Data for each polymer may be stored in the memory system so that the processor can access the data for the other polymers independently, for example by assigning a unique identifier to each polymer.
The information contained in the data and how they are analyzed will depend on the number and type of labeled units that interact with the reagent to produce a signal. For example, if each unit of a single polymer is labeled and each type of unit (e.g., all A units in a nucleic acid) has a particular type of label, then it is possible to determine the order of each unit in the polymer by analyzing the single polymer. However, if only one of the four types of units in a polymer (e.g., a nucleic acid) is labeled, more data will be required to determine the complete order of the nucleic acid. Several labeling protocols and methods for computer analysis of data generated by those protocols are described below. For ease of discussion, labeling strategies are described with respect to nucleic acids. However, each strategy is applicable to label all polymers.
There may be several different labeling strategies involving different types of arrangements of labeled nucleotides, different percentages of labeled nucleotides, and single-or double-stranded labeling and diversity labeling such as compounds that bind to the polymer and have a particular order (diversity labeling is discussed in more detail below in connection with specific embodiments). The simplest labeling scheme involves labeling four nucleotides differently. Labeling schemes employing three, two, or even one label are also possible.
The scheme of labeling four nucleotides is possible, in which A, C, G and T of the target DNA are labeled with different labels. Such molecules will produce a linear signal sequence corresponding to the linear nucleotide sequence on the target DNA when routed through the interaction stations. The advantage of using the four nucleotide strategy is the ease of interpretation of the data and the complete unit order that can be determined by the single polymer labeled. However, adding an external label to all four bases can present steric issues. To reduce such problems, nucleotides may be labeled with the intrinsic properties of some or all of the nucleotides. As discussed above, nucleotides are inherently labeled because each purine and pyrimidine has distinct absorption spectral properties. In each of the labelling schemes described herein, the nucleotides may be labelled either externally or internally, but it is preferred that at least some of the nucleotides are labelled internally when the method of labelling all four nucleotides is used. It is also preferred to use a label with a low or neutral charge to reduce steric hindrance when using an external label in a protocol in which all four nucleotides are labeled.
Labeling of three nucleotides, three of which are labeled, can also be accomplished. Where only three of the four nucleotides are labeled, the analysis of the data generated by the method of the invention is more complex than when all four nucleotides are labeled. This data is more complex because the number and position of the fourth unlabeled nucleotide must be determined separately. One way to determine the number and position of the fourth nucleotide is to use the results of an analysis of two different sets of labeled nucleic acid molecules. For example, one set of nucleicacid molecules may be labeled with A, C and G, while another set is labeled with C, G and T. From these two sets of data, the linear order of the labeled nucleotides was analyzed to obtain order data. As long as both sets comprise four labeled nucleotides, there are many different possibilities for selecting the three nucleotides for each set. For example, the ACG group may be paired with one of the labeled CST, ACT or AGT groups.
The order in which the fourth nucleotides are included can also be determined by identifying the position of the fourth nucleotide on the polymer using only one labeled polymer, rather than a set of at least two differently labeled polymers. This can be done by determining the distance between the labelled nucleotides on the nucleic acid molecule. For example, A, C and G are labeled and the detectable signal produced indicates that the nucleic acid molecule has the sequence AGGCAAACG. If the distance between each nucleotide in a nucleic acid molecule is equivalent to the known inter-nucleotide distance appropriate for a particular nucleotide combination except that the distance between G and G is twice the normal inter-nucleotide distance, then T will be located between the two G's and the complete molecule will have the order of AGTGCAAACG. The distance between nucleotides can be determined by several methods. First, the polymer and the reagent can be moved relative to each other in a linear fashion at a constant rate, such that individual units of the nucleic acid molecule will pass through the reagent at a single time interval. If two time intervals elapse between the detectable signals, there is an unlabeled nucleotide at that position that does not produce a detectable signal. This method of determining the distance between bases is discussed in more detail below with reference to randomly labeling a base. In addition, the polymer and the reagent may interact with each other such that each labeled unit interacts withthe reagent simultaneously, producing a detectable signal. Each detectable signal generated occurs at an anchor point of the unit along the polymer. It can be determined whether the unlabeled unit is located somewhere along the nucleic acid molecule by directly calculating the distance between the detectable signals.
The nucleic acid molecule may also be labeled according to the protocol for labeling both nucleotides. To identify data and to interpret the order of nucleotides, 6 sets of nucleic acid molecules labeled with two nucleotides can be used. Ambrose et al (1993) and Harding and Keller (1992) have discussed the synthesis of a large fluorescent DNA molecule in which both nucleotides are externally labeled. The average size of the molecule was 7 kb. There may be 6 different combinations of labeling two nucleotides: wherein, the nucleotides in n are taken as k types at a time. Possible combinations are AC, AG, AT, CG, CT and GT. Knowledge of the linear order of the tags in each combination will allow for the reconstruction of the nucleic acid sequence. This theory can be verified using the4-mer (5 'ACGT 3') as the model order. The first set of ACs gives the information that C must follow a. This gives neither information about the number of nucleotides inserted into A and C, nor any information about G or T preceding A. The second group AG indicates that G is also behind A. Group AT indicates T is after A. From these three groups, it is known that the target DNA is a 4-mer and that A is followed by a C, a G and a T. The latter sets give information about the ordering of these three nucleotides after A. Group CG indicates G is behind C. Group CT indicates T is behind C. The group GT finishes the permutation giving the final decoding order of 5 'ACGT 3'. In addition to the method using 6 sets of labeled nucleic acid molecules, the order can be established by collating information on the distance between labeled nucleotides that produce the above-described detectable signal and information obtained from less than 6 sets of nucleic acid molecules labeling two nucleotides.
A fourth labeling scheme, i.e., a scheme in which one nucleotide is labeled randomly, may also be used. In this method, distance information obtained by means of population analysis and/or the instantaneous speed of DNA movement is used to determine the number of nucleotides separating two labelled nucleotides. Analyzing 4 target molecules with different labels to obtain a complete sequence.
One assay with these labeling methods involves the use of complementary base information. FIG. 1 illustrates this labeling strategy, where two differently labeled DNA samples are required. The first sample was randomly labeled with the same fluorophore for two of the non-complementary bases. The non-complementary base pairs are AC, AG, TC and TG. The second sample has a base randomly labeled. The base selected in the second sample may be any of the four bases. In the example given, the two non-complementary bases selected are A and C. Thus, two samples wereprepared, one with labeled a and C and the other with labeled a. The DNA was genomically classified, end-labeled and purified and then analyzed by means of nano-channel FRET sequencing. The sequence-specific FRET information generated by each fragment is classified by one of two sets of complementary strands. The role of the classification is to facilitate population analysis to determine the location of all required bases. This figure illustrates the process of generating order information from sorted data. From the first set of analyzed information, the positions of all A and C on one strand are obtained. Knowledge of all A and C on one strand is obtained from the second set of analyzed information. The same method was applied to the complement chain. The knowledge of A and C on the complementary strand is consistent with the knowledge of T and G on the other strands. The result is a sequential reconstruction. To cross-validate this sequence, the process can be repeated for other non-complementary base pairs (e.g., TG, TC, and AG).
There are two methods for determining the distance between bases. One need to determine the instantaneous rate of DNA movement, which can be easily calculated from the duration of energy transfer or quenching of a particular label. Another involves analyzing populations of target DNA molecules and gaussian distance distributions corresponding thereto.
The instantaneous velocity method involves determining the separation distance based on the known instantaneous velocity (v) of DNA motion multiplied by the time interval (t) between signals. The instantaneous rate can be determined by measuring the time it takes for the labeled nucleotide to pass by the interaction station. Since the length (d) of the reagent enrichment zone is known (by calibration and actual measurement of the reagent localization zone, such as the thickness of the donor fluorophore enrichment zone), this rate is v-d/t. As shown in fig. 2, the raw data, which analyzed the changes in the energy emission profile, produced a curve representing two energy intensity drops from left to right, followed by two energy intensity rises, wherein the energy emission profile is plotted against the sequentially detectable signals. FromCurve plateau for the beginning of the first energy intensity drop (with t)1Denoted) is the second plateau (t)2) Twice as much. The length of the interaction station is given as 51 angstroms.From this given information, the number of labeled nucleotides can be known. Furthermore, by correlating the rate of DNA movement with the time of the plateau of the donor intensity curve, the distance separating the two can be determined.
The number of nucleotides is simply expressed in terms of the number of intensity drops. In fig. 2, there are two intensity drops. Thus, there must be two detectable labels on the DNA. In order to determine the distance of base separation it is necessary to know the instantaneous rate of DNA movement, which can be determined by knowing the time it takes for a labelled nucleotide to cross the reagent localisation region and the length of the reagent localisation region. The length of the reagent localization zone is given as 51 angstroms. The time taken for a labeled nucleotide to cross the reagent-localized region is limited by the first intensity drop and the first intensity rise (shown as grey shaded region, 7.5 seconds). The rate of DNA movement was 6.8 angstroms/second. Time of separation from labeled nucleotides (t)15s.) times this rate (6.8 angstroms) to deduce the base spacing, which is equal to 10 base pairs. As a method of cross-checking, 51 Angstrom-t1v obtaining the base distance.
In the population method, the entire population of labeled nucleotides is considered. It is not necessary to know the length and instantaneous rate of the reagent localization zone as is the case with the rate method. The use of population analysis statistically eliminates the need for accurate measurement of individual nucleotide molecules.
An example of population analysis using 5 nanochannel-passing nucleotide molecules is described below. 5 molecules representing the same DNA fragment were prepared. The detection time between the first and second labelled nucleotides should be the same for all DNA molecules in a constant electric field. Under experimental conditions, these times are slightly different, resulting in a gaussian distribution of time. The peak of the gaussian distribution represents the spacing (d) between two labeled nucleotides.
The concept of population analysis and determination of distance information is further illustrated by the supplementary example, which uses a population of nucleic acid molecules (the population being represented by 6 molecules) in which one nucleotide is randomly labeled. To provide a reference point, the nucleic acid is end-labeled. In the case of sufficient nucleic acid molecules, the distance between any two A's can be determined. When two molecules are considered as a sub-population, the two molecules convey the base spacing between the end-marker and the second a and between the second and third a. The number of divisions was used to establish some distributions, which are expressions of base spacing. In the same two molecules, a distribution of 4 and 6 base spacings was established. By extending the same logic to the rest of the population, the location of all A's on the DNA can be determined. Repeating this procedure for the other three bases (C, G and T) will yield the complete sequence.
In addition to labeling all units of a type, it is also possible to employ a protocol for labeling a nucleotide in which not every nucleotide of the same type is labeled. An overview of this method is shown in FIG. 3, which shows a representative population of 16-mer fragments randomly labeled A in the order 5 'ACGTACGTACGTACGT's 3. Each individually labeled DNA molecule had half of the A labeled in addition to the 5 'and 3' end labels. For a large number of randomly labeled fragments, the distance between two successive A's on the target DNA can be determined. The end-marker serves to identify the distance between the end of the DNA and the first A. Repeating the same analysis for other nucleotides will produce this 6 mer sequence. Advantages of using this method include no steric effects and ease of labeling. This type of tagging is referred to as random tagging. A "randomly labeled" polymer is one in which not all units of the specified type are labeled. It is not known which units of a given type are labeled in a randomly labeled polymer.
As briefly stated above, various combinations of these labeling schemes may be used together. In all of the methods listed above, either the ordered linearity information from the signal or the distance information between nucleotides is taken into account. These two aspects can be combined to give some approaches that rely on both the linear and distance information in order. For example, the strategy of randomly labeling one nucleotide is expanded to the strategy of randomly labeling 4 nucleotides. The 4 nucleotides are randomly labeled by labeling a portion of all 4 nucleotides. A portion of all 4 nucleotides in the population is labeled. Each of these 4 nucleotides is uniquely labeled. Analysis of randomly labeled populations resulted in the generation of sequential data.
The use of double stranded DNA allows for a variety of variations. The scheme of labeling single-stranded dinucleotides can be accomplished when both nucleotides on one strand of the DNA are replaced by labeled nucleotides. To reduce the spatial constraints imposed by two additional labeled nucleotides, it is possible to label all one nucleotide on each complementarystrand to obtain the same end when the theory underlying the labeling of dinucleotides is put forward. This method involves the use of double stranded DNA, each strand of which is labeled differently. The 6 sets of differentially labeled duplex DNA will produce a data set that is suitable for providing sequence information. Each complementary strand of DNA should have a labeled nucleotide. In each set of double-stranded DNA, the equivalent of two different nucleotides (possible combinations are AC, AG, AT, CG, CT and GT) is labeled. When both complementary strands have labeled adenine, this is the equivalent of combination AT. In labeling duplex dinucleotides, it is an advantage that only one nucleotide on each strand is labeled, allowing the synthesis of longer labeled strands compared to labeling dinucleotides on single stranded DNA. In fact, it has been demonstrated that DNA fragments of much longer than 10kb can be obtained by synthesizing DNA fragments with a fully labelled nucleotide (Ambrose et al, 1993; Harding and Keller, 1992).
One use of the method of the present invention is to determine the order of units within a polymer. Identifying the order of units in a polymer (e.g., a nucleic acid) is an important step in understanding the function of the polymer and in determining the role of the polymer in a physiological environment (e.g., a cell or tissue). Currently used sequencing methods are slow and cumbersome. The method of the present invention is much faster and can generate enough sequential data in a very short period of time.
Sequencing of the polymer may include sequencing the entire polymer or sequencing a portion of the polymer, and even identifying individual units on the polymer. One of the methods of identification of individual units of a polymer involves the following steps: temporarily exposing individual units of the polymer of unknown identity to an agent selected from the group consisting of electromagnetic radiation, a quenching source, and a fluorescence excitation source to interact with a detectable signal characteristic of the individual units; and detecting the signal and distinguishing the signal from the signal produced by a polymer unit producing a contiguous signal as an indication of the identity of the individual unit.
An individual unit is "temporarily exposed" to an agent in order to generate a detectable signal representative of a characteristic of that individual unit. The term "temporary exposure" in this context means that the unit is positioned within the interaction distance of the reagents and for a sufficient time to generate a signal and then leaves the interaction distance. The length of time required to generate a signal will depend on the individual unit and the reagents involved, but this amount of time is typically between 1 nanosecond and 1 second.
Signals characteristic of individual units are distinguished from signals generated by polymer units that generate adjacent signals. A "unit that produces a contiguous signal" is a unit that is closest to the individual unit that produces a detectable signal when exposed to an agent. It need not be an element directly linked to the individual element unless the directly linked element is labelled (internally or externally) and produces a detectable signal.
Where the agent is one or more fluorophores, the interaction distance between the agent and the unit is the energy transfer distance, and the signal generated is the fluorescence energy resonance transfer. The term "energy transfer distance" in this context is the distance between the unit and the fluorophore that allows interaction between two complementary sources if one of the sources overlaps the absorption spectrum of the other source. The term "fluorescence energy resonance transfer" herein is the photon energy transfer between fluorophores with an emission spectrum overlapping an absorption spectrum.
Another method of identifying individual units of a polymer involves the steps of: making the individual polymer units with unknown identities move instantaneously relative to a certain measuring station; detecting a signal resulting from a detectable physical change occurring in the unit or the station; and distinguishing said signal as an indication of the identity of the individual unit from signals arising from exposure of adjacent signal-producing polymer units to the station.
Thus, in one aspect, the method of the invention can be used to identify one, some or all of the polymer units. This can be accomplished by identifying the type of individual units and their location on the polymer backbone by determining whether the signal detected at a particular location on the polymer backbone is characteristic of the presence of a particular unit with a label.
The methods of the present invention are also useful for identifying other structural properties of polymers. Structural information obtained from analysis of polymers according to the methods of the present invention may include identifying characteristic properties of the polymer, for example identifying whether the polymer is present in a sample or determining the relatedness of the polymer; identifying the size of the polymer; identifying a proximity or distance between two or more individual units in the polymer; identifying an order of two or more individual units within the polymer; and/or identifying the overall composition of the polymer unit. These characteristics can be used for a variety of purposes, such as determining whether a given polymer is present in a sample. For example, when the polymer is a nucleic acid, the methods of the invention can be used to determine whether a given gene sequence is expressed in a cell or tissue. The presence of the specified sequence can be determined by determiningwhether the polymers within the sample represent a characteristic pattern of individual units that can only be found in the polymer of interest (i.e., by comparing the signal under test to known signatures representing known polymer characteristics to determine the relatedness of the polymer being analyzed to known polymers). To determine whether a polymer of interest is present in a sample, the complete order of the polymers need not be determined. Similarly, these methods can be used to compare the detected signal from one polymer to the signature from another polymer to determine the relatedness of the two polymers.
The proximity or distance between two individual units of the polymer can also be determined according to the method of the invention. It is important to be able to determine the proximity or distance between two units. Each polymer unit has its specific position along the backbone. The order of the units serves as a blueprint for the known polymers. The distance between two or more units on an unknown polymer can be compared to the blueprints of known polymers to determine whether they are related. The ability to determine the distance between two units is therefore crucial to determining how many units (if any) are between two units of interest.
To determine the proximity of two individual units of a linked-unit polymer, the polymer is moved relative to a station where each individual unit is exposed to the station, producing a characteristic signal that occurs as a result of a detectable physical change occurring in the unit or station. Then, each of the generated characteristic signals is detected and the length of time elapsed between detection of each of the characteristic signals is measured. The length of time elapsed reflects the proximity of the two individual units. The station may be an interaction station and the unit may be exposed to the reagent to generate the electromagnetic signal.
The term "signal representative of the interaction characteristics" in this context is the expected signal originating from the interaction between the station and the unit with the special mark. The particular signal generated will depend on the type of station and the type of marked cell. For example, if the station is a reagent (which is electromagnetic radiation) and the labelled unit is a fluorophore, the interaction between the two will cause the fluorophore to emit electromagnetic radiation at its known emission wavelength. If the station is a reagent (which is a scintillation layer) and the labelled units are radioactive, the interaction between the two will result in the emission of electromagnetic radiation in the form of fluorescence.
It is possible to determine the order of the polymer units using the method of the present invention. In one aspect of the invention, the order of the two individual units of the polymer can be determined by: the polymer is moved linearly relative to a station and the two individual units are exposed to the station to produce first and second detectable signals resulting from detectable physical changes occurring in the station or the units. The order of the signals is an indication of the order of the two individual units.
The overall composition of the polymer units can also be determined by means of the method of the invention. For example, if the polymer is a nucleic acid, the methods of the invention can provide information about the percentage of purines to pyrimidines or the percentage of A, C, T and G in the nucleic acid.
Quantitative information about the size of the sample can also be determined by means of the method of the invention. For example, the size of the polymer can be determined by determining the number of individual units that make up the polymer. The number of units making up the polymer can be determined by measuring the time required for the complete polymer to pass the reagent at the interaction site in a straight line and dividing by the average length of time that the individual units of that particular type of polymer pass completely through the site.
In addition to information about specific units, the methods of the invention can identify multiple units simultaneously in order to provide information about the polymer. In one aspect, the method can be accomplished by: i.e. providing a polymer of labelled linkage units, detecting signals from a marker unit specific marker in a smaller number than the total number of linkage units, and storing the signature of the detected signals for analysis of the polymer. In this aspect of the invention, each unit of the tagged polymer may be tagged with a unit-specific tag, or a portion of the units may be tagged with a unit-specific tag.
This method is particularly useful for simultaneously analyzing multiple units of a polymer. This is achieved by labelling with unit-specific tags that interact with more than one unit in a particular order. The term "unit-specific marker" in this context is a compound which interacts in a specific manner with one or more polymer units and is capable of distinguishing those units. For example, unit-specific tags for nucleic acid molecules can be labeled dimers, trimers, etc., which bind to a particular base sequence (e.g., TG, AG, ATC, etc.). By identifying the location of the presence of the marked indicia, structural information about the polymer can be deduced. For example, reproducing the mark on the polymer may reveal the identity of the polymer. This allows one to determine whether a polymer is present in a polymer solution or mixture. The order, distance, number, etc. of the markings on the polymer may provide information about the order or composition of the polymer. Other unit-specific markers include, but are not limited to, sequence-specific size groove binders and inclusions, sequence-specific DNA and peptide-linked proteins, sequence-specific peptide-nucleic acids, and the like. There are many such unit specific markers present and well known to those skilled in the art.
This type of analysis can be used in an embodiment that recognizes DNA fragments by analyzing the hybridization pattern of multiple probes to individual fragments of the polymer. The current leading edge method for DNA hybridization analysis relies on DNA chips. The method of the present invention is advantageous for a number of reasons. It can determine the number, type, order and distance of unknown DNA fragments bound between multiple probes. This information can be used to identify exactly the number of genes expressed in different ways. Current hybridization studies can only determine the type of probe bound to a given fragment. In addition, the method of the present invention enables accurate quantitative analysis of the actual number of specifically expressed genes. Current methods rely on quantitative analysis of fluorescence intensity, which often produces errors due to the non-linearity of the detection system. The method of the present invention can give a large amount of information without selecting the expressed gene or unknown nucleic acid for analysis. This is distinct from the requirement for different DNA chips to be used to analyze different genes, expressed genomes, and different organisms. The method of the present invention enables identification of an unknown gene being expressed by computer analysis of the generated hybridization patterns. The data obtained by linear analysis of the DNA probes is then matched with information in a database to determine the identity of the target DNA. Thus, these methods allow analysis of information from hybridization reactions, which are then applied to diagnosis and determination of gene expression profiles.
The term "signature" is used herein to refer to a sequence-specific signal generated by a labeled polymer. The signature includes information about the structure of the polymer. For example, the signature of a polymer can be defined by a series of contiguous units or by several distinct units spaced apart from each other by a certain distance. The signature of a polymer is considered the same as the polymer. Signatures are useful for identifying fragments exactly by identifying bases at a certain position along the length of a DNA strandIn (1). The probability of knowing any one location is 1/4. Unambiguous fragment recognition with approximately 20 recognized positions yields [ (1/4)20=9.1×120-13]. For fragments with 20 detectable labels and 10% detection/labeling, it is only necessary that the fragments be 200 base pairs in size. The suggested read length is in the order of kilobases, which should unambiguously identify any fragment. The fragment recognition allows for grouping in a similar order, thereby making it possible to perform sequential reconstruction by population analysis.
Generally, there are three types of nuclear radiation, including α, β and gamma radiation α radiation causes extensive ionization in matter and allows individual counting by means of ionization chambers and proportional counters, but more interestingly, α radiation interacting with matter may also cause molecular excitation that can produce fluorescence.
The term "scintillating" layer or material is used herein to refer to any material capable of generating fluorescence or emitting light upon excitation by nuclear radiation. Scintillating materials are known in the art. Aromatic hydrocarbons with a resonant structure are excellent scintillating materials. Anthracenes and stilbenes fall within the category of such compounds. Inorganic crystals capable of fluorescing are also known. In order for these compounds to emit light, the inorganic crystals musthave a small amount of impurities, forming several energy levels between the valence and conduction bands. Activation and deactivation may then occur. In many cases, deactivation by phosphorescent photon emission can occur, resulting in long detection lifetimes. Allowing general use of scintillating materials include NaI (TI), ZnS (Ag), anthracene, stilbene and plastic phosphor.
Many methods of measuring nuclear radiation are known in the art, including devices such as bubble chamber devices, constant current ion chambers, pulse counters, gas counters (i.e., Geiger-Muller counters), solid state detectors (surface barrier detectors, lithium drift detectors, intrinsic germanium detectors), scintillation detectors, Cerenkov detectors, and the like.
The analysis of the radiolabeled polymer is the same as the other methods of generating the polymer-dependent pulse. For example, a polymer sample with a radiolabel a can be analysed by means of a system that determines the relative spacing of a on the sample DNA. The time between detection of the respective radiation signals is characteristic of the analyzed polymer. Analysis of 4 populations of labeled DNA (A, C, G, T) gives the order of the polymers analyzed. The order of the DNA can also be analyzed by more complex protocols, including the analysis of the combination of DNA with double labeling and DNA with single labeling. Analysis of A-tagged variants after analysis of A-and C-tagged fragments will understand the location of A and C. If the procedure is repeated for the complement chain, the order is known. The system can be further used for analysis of polymer (polypeptide, RNA, saccharide, etc.), size, concentration, type, identity, presence, order, and quantity.
The various methods described above can be performed on a polymer or polymers in order to determine structural information about the polymer. The invention also includes the practice of the above-described method on a number of polymers. These processes and apparatus for simultaneously carrying out the process of the invention on a plurality of polymers are described in detail below.
Some of the above methods are based on interactions involving energy transfer and quenching that produce a detectable signal. The implications of energy transfer or quenching will be described in these embodiments of the invention in one of two limitations. A first limitation is that the reagents involved in the interaction are selected from electromagnetic radiation, quenching sources or fluorescence excitation sources. A second limitation is that the detectable signal is an electromagnetic radiation signal. It will be apparent to those skilled in the art that each method may include a second limitation rather than the first one described and still include an interaction concept involving energy transfer or quenching. For example, in addition to methods comprising analyzing a polymer by generating a detectable signal by exposing the polymer unit to an agent selected from the group consisting of electromagnetic radiation, a quenching source, and a fluorescence excitation source, the invention also includes in these embodiments methods for analyzing a polymer by generating a detectable electromagnetic signal by exposing the polymer unit to an agent.
In addition to methods involving energy transfer, quenching, or electromagnetic radiation signaling, the methods of the invention described above can detect signals generated as a result of detectable physical changes occurring in the polymer unit or in the stations. A "detectable physical change" occurring in a polymer unit or in a station as referred to herein is any type of change that occurs in the unit or station as a result of exposure of the polymer unit to the station. Once the unit is exposed to the station, a detectable signal is formed. For example, stations may be interaction stations or signal generation stations, as discussed individually below. The type of change that occurs in the station or in the unit and that can produce a detectable signal depends on the type of station and the type of unit. For illustrative purposes, several examples of station-unit combinations that undergo a change such that a detectable signal is produced are discussed herein. Those skilled in the art will be able to claim other station-unit combinations that fall within the scope of the invention.
Where the interaction between the station and the polymer unit is based on energy transfer, the unit, the station, or both may undergo a physical change such that a detectable signal is produced. In one embodiment, the station may transfer energy to the unit causing the unit to emit a signal specific to the energy unit. The physical changes that occur in the cell result from changes in energy states. In another embodiment, the unit may transfer energy to the station, causing the station to emit a unit-specific signal due to this particular energy transfer. In a third embodiment, the partner compound may cause a physical change that produces a signal. Upon interaction between the radioactive unit and the station, the unit undergoes a physical change by releasing energy.
Another aspect of the invention includes a method of analyzing a plurality of polymers. Each polymer is analyzed by sequentially detecting the interaction of a plurality of polymer units at the signal generation station. These methods include, but are not limited to, methods for characterizing test polymers, methods for sequencing polymers, methods for determining the order of polymer units, methods for determining the distance between polymer units, and analyzing a set of polymers. These methods include, but are not limited to, interactions resulting from energy transfer or quenching.
The method for characterizing a polymer is accomplished by: determining the polymer-dependent pulse for each polymer of the plurality of polymers, comparing the polymer-dependent pulses of the plurality of polymers, determining the relatedness of the polymers based on the similarity of the polymer-dependent pulses of the polymers, and then characterizing the test polymer based on the polymer-dependent pulses of the associated polymer.
The term "polymer-dependent pulse" is herein a detectable physical quantity that gives or conveys information about the structural characteristics of an individual unit of the polymer. For example, the physical quantity may be electromagnetic radiation, chemical conductivity, electrical conductance, or the like. The polymer-dependent pulse may be caused by energy transfer, quenching, a change in conductivity, a mechanical change, a change in impedance, or any other physical change. Although the polymer-dependent pulse is specific to a particular unit, the polymer will have more than one identical polymer-dependent pulse since the polymer has more than one unit with a particular label. Thus, if each particular type of cell has a different label, they can produce different polymer-dependent pulses.
The method used to detect the pulses that vary with the polymer depends on the type of physical quantity produced. For example, if the physical quantity is electromagnetic radiation, the polymer-dependent pulse can be detected optically. The term "optically detectable" polymer-dependent pulses in this context are optical signals in the form of electromagnetic radiation which can be detected by means of a photosensitive imaging system. Where the physical quantity is chemical conductivity, the pulse as a function of the polymer is detected chemically. The term "chemically detected" polymer-dependent pulse in this context is a signal in the form of a change in chemical concentration or a change such as ion conductance, which can be detectedby standard methods of measuring chemical conductivity. If the physical quantity is an electrical signal, the polymer-dependent pulse is in the form of a resistance or capacitance change.
The term "relatedness of polymers" herein can be determined by identifying the unique polymer signature of that polymer. For example, if the polymer is a nucleic acid, then virtually any sequence of 10 contiguous nucleotides within the polymer will be a unique feature of that nucleic acid molecule.
The "plurality" of polymers is at least two polymers. Preferably, the plurality of polymers is at least 50 polymers, more preferably at least 100 polymers. The polymer-dependent pulses may provide any type of structural information about the polymer. For example, these signals may provide a complete or partial polymer sequence, an order of polymer-dependent pulses, or a time interval between polymer-dependent pulses as an indication of the distance between the cells.
The polymer-dependent pulses are obtained by means of the interaction occurring between the polymer units and the environment of the signal generating stations. The term "signal generation station" is used herein to refer to a region in which the unit interacts with the environment to produce a pulse that varies with the polymer. In some aspects of the invention, the polymer-dependent pulse is derived from contacting in a defined region with an agent selected from the group consisting of electromagnetic radiation, a quenching source, and a fluorescence excitation source and capable of interacting with the unit to produce a detectable signal. In other aspects, the polymer-dependent pulse is derived from contact in a specified region with a chemical environment that is capable of undergoing a particular change in conductivity in response to interaction with a molecule. When a molecule with a particular structure interacts with the chemical environment, the conductivity will change. The particular change in a particular structure may be a transient change, such as a length of time required for a conductivity change that may reflect an interaction involving the particular structure or physical change. For example, a change in the strength of an interaction may reflect an interaction with a particular structure. In other aspects, the polymer-dependent pulse is derived from a change in capacitance or resistance caused by movement of a polymer element between microelectrodes or nanoelectrodes adjacent to the element. For example, the signal generating stations may include microelectrodes or nanoelectrodes positioned on both sides of the polymer unit. The change in resistance or conductivity due to movement of the polymer unit through the electrodes will be specific to the particular unit.
Methods of determining the distance between two individual units are also encompassed by the present invention. To determine the distance between two individual units of a polymer of linked units, the polymer is moved linearly relative to a signal generation station, and the pulses produced by each individual unit as it passes by the signal generation station are measured as a function of the polymer. When each unit of polymer in turn passes by the signal generation station, we say that the polymer is conveyed in a straight line relative to the signal generation station.
Each step is repeated for a plurality of similar polymers in order to generate a data set. The distance between two individual units can then be determined by analyzing the data set based on information obtained from a wide variety of similar polymers.
The method includes identifying an amount of polymer including a label. For example, it is possible to determine the amount of polymer that has a specific unit or combination of units in a sample. For example, in a sample of mRNA, the amount of a particular mRNA presentin the sample can be determined. This is done by identifying a pattern, i.e. signature, that represents a characteristic of the desired mRNA molecule. The RNA sample can then be analyzed according to the method of the invention and the number of mRNA molecules with a specific pattern, i.e. signature, determined.
The term "polymer-like" herein is a polymer having at least one overlapping region. The analogous polymers may be a homogeneous population of polymers or a heterogeneous population of polymers. As used herein, a "homogenous population" of polymers is a group of uniform polymers. A "heterogeneous population" of similar polymers is a group of similar polymers that are not identical but include overlapping regions where at least one unit is identical. The overlap region typically includes at least 10 contiguous nucleotides. In some cases, the overlapping region includes at least 11, 12, 13, 14, 15, 16, 17, 18, 19, 20, 21, or 22 contiguous nucleotides.
"A plurality of similar polymers" is two or more polymers. Preferably, the plurality of similar polymers is 50 or more similar polymers. More preferably, the plurality of similar polymers is 100 or more similar polymers.
The term "data set" is a set of information defining polymer-like generated pulses that vary with the polymer. This data set is analyzed as discussed previously and the method of analysis used depends on the type of labeling protocol used to generate the labeled polymer. Nucleic acid sequencing is a particularly preferred embodiment of the method of the invention.
Currently. Less than 5% of the human genome has been sequenced. This means that only a small fraction of the knowledge of human sequencing (i.e., the order of all individuals) is ideal. For example, for the human body as a whole, there is 1.4 × 10¹⁹(50 hundred million people × 3 × 10⁹Base/human). Upto now, only 2X 10⁻¹⁰% human genetic information is known. The sequencing speed of the human genome is about 3X 10 by the worldwide common effort9In the year/15, 550,000 bases/day, at a cost of>$ 1 $ @A base. Sequencing by means of the method of the invention described herein will make a dramatic breakthrough in sequencing speed. The expected time for completing a human genome with one machine is about 15 hours. Several parallel dynamic arrays can complete the sequencing of a human genome in less than 1 hour.
Methods of sequencing linked cell polymers are also encompassed by the present invention. The method is accomplished by obtaining polymer dependent pulses from each polymer in a plurality of polymer stacks, each polymer having at least a portion with a consistent sequence of linked units with the other polymers, and comparing the polymer dependent pulses to obtain a consistent sequence of linked units in the plurality of polymers.
The plurality of overlapping polymers is a group of polymers, wherein each polymer has at least one segment of linked units in the same order as the other polymers. This sequential segment is referred to as an overlap region and includes at least 10 contiguous cells.
In another aspect of the invention, the order of units of the polymer of linked units can be determined by: the polymer is moved linearly relative to the signal generation station and the polymer-dependent pulses generated are measured while each individual cell (of two types, each generating a polymer-dependent characteristic pulse) is bypassed at the signal generation station. These steps are repeated for a plurality of similar polymers, and the order of at least two individual units is determined based on information obtained from the plurality of similar polymers.
The invention includes a method of analyzing a population of polymers, wherein each polymer in the population is an independent polymer of linked units. The method involves orienting the set of polymers parallel to each other and detecting the polymer-specific characteristics of the polymers.
The polymers of this group are oriented parallel to each other. The polymers may be oriented by any means capable of positioning the polymers parallel to each other. For example, an electric field may be applied to the polymers to orient them parallel. Preferably the orientation step is carried out in a gel-free solution.
The term "polymer-specific feature" as used herein is any order-dependent structural feature of a polymer. For example, polymer-specific characteristics include, but are not limited to, information about the polymer such as the length of the polymer, the order of the linked units in the polymer, the distance between polymer units, the proximity between polymer units, the order of one, some, or all of the polymer units, and the presence or absence of the polymer.
The step of detecting the specific characteristics of the polymers can be done simultaneously for all polymers. This step involves the sequential detection of each unit of all polymers. This can be done by: each polymer is conveyed in a straight line relative to a plurality of signal generating stations, and the resulting polymer-dependent pulses are detected and identified as they pass through the signal generating stations.
The invention also includes a method of analyzing a population of polymers, each polymer in the population being an independent polymer of linked units. The method is completed by the following steps: orienting the set of polymers in an electric field; passing the set of polymers simultaneously through respective designated channels; and detecting the polymer specific feature as the polymer passes through the channel. The step of passingthe set of polymers simultaneously through their respective channels is accomplished by: one polymer flow per channel is made so that each cell passes through the station individually. If the polymers are positioned in-line with only one unit interacting with one station, more than one polymer may be present in the channel at the same time.
The term "respective designated channel" herein is a channel whose structure is determined before the polymer enters the channel, so that the polymer will follow a designated path when passing through the channel. Channels like those found in gel matrices are not the respective designated channels.
The methods of the invention can also be used to detect energy resonance transfer or quenching between two interacting partners capable of energy resonance transfer or quenching. The term "energy resonance transfer (RET)" herein is the photon energy transfer between two compounds with overlapping emission and absorption spectra. Fluorescence energy resonance transfer (FRET) is the transfer of photon energy between fluorophores. The pair of two interacting partners is any compound capable of energy transfer or quenching, i.e., a luminescent compound or quencher.
The method is completed by the following steps: introducing the pair of partners in sufficiently close proximity to allow such transfer or quenching to occur; applying an agent selected from the group consisting of electromagnetic radiation, a quenching source, and a fluorescence excitation source to one of the partners; shielding the fluorescence energy transfer and quenching that occurs due to the emission of electromagnetic radiation and interaction between the partners with a shielding material; and detecting the emitted electromagnetic radiation.
The term "shielding material" is used herein to mean any material that prevents or limits energy transfer or quenching. Such materials include, but are not limited to, conductive materials, high refractive index materials, and opaque materials. In a preferred embodiment, the shielding material is a conductive shielding material. The term "conductive shielding material" is used herein to refer to a material that is sufficiently conductive to prevent energy transfer between a donor source and a recipient source.
Each of the methods of the invention is useful in at least various aspects of polymer sequencing. Furthermore, these methods can be used with various labeling schemes described in the methods of analysis of conjugated polymers.
The methods of the invention may be accomplished using any device that produces a specific detectable signal for an individual unit of the polymer. One device capable of performing such analysis is one that facilitates the linear transfer of the polymer through an interaction station or signal generation station. According to one aspect of the invention, an article is provided that is useful for carrying out the method of the invention. The article includes a wall material having a surface defining a channel; a reagent selected from the group consisting of a source of electromagnetic radiation, a source of quenching, a layer of luminescent film, and a source of fluorescence excitation and attached to the wall material adjacent to the channel; wherein the agent is sufficiently proximal to the channel and in an amount sufficient to detectably interact with a partner compound selected from a luminescent compound or a quencher when it passes through the channel.
The term "wall material" herein is a solid or semi-solid barrier of any size capable of supporting at least one channel. The semi-solid material is a self-supporting material, for example, it may be a gel, such as a polyacrylamide gel. For example, the wall material may consist of a single support material, which may be conductive or non-conductive, transparent or opaque. In certain examples, the agent is embedded within the wall material. In these examples, the wall material may be composed wholly or partially of a non-conductive layer, a light-transmissive layer or a transparent layer to allow exposure of the agent to the channel formed in the wall material to allow for signal generation. Where the wall material is only partially composed of these materials, the remainder of the wall material may be composed of conductive, opaque or opaque film layers that prevent signal generation. In some cases, the wall material is composed of film layers of different materials. For example, the wall material may be comprised of a conductive layer and a non-conductive layer. Alternatively, the wall material may consist of one non-conductive layer surrounded by two conductive layers. The wall material of the present invention includes multi-layer materials and various material combinations.
The term "luminescent film layer" herein is a film that naturally emits light or emits light by some excitation or illumination means, such as electro-optic films and high refractive index films that illuminate by internal reflection.
The term "conductive material" is used herein to refer to a material that is at least sufficiently conductive to prevent energy transfer between the donor and the acceptor.
The term "non-conductive material" is used herein to refer to a material that is conductive in an amount small enough to allow energy transfer between the donor and the acceptor.
The term "light transmissive material" is used herein to refer to a material that is capable of transmitting light of a wavelength generated by the particular electromagnetic radiation, quenching source, or fluorescence excitation source being used.
The term "opaque material" is used herein to refer to a material that is not capable of transmitting light of the wavelength generated by the particular electromagnetic radiation, quenching source, or fluorescence excitation source being used.
The term "channel" is used herein to refer to a passage through which a polymer can pass. The size of the channels is arbitrary as long as the polymer can pass through. For example, the passage may be an unbranched, straight cylindrical passage, or it may be a branched network of interconnected serpentine passages. Straight nanochannels or microchannels are preferred. The term "nanochannel" is used herein to refer to a channel having dimensions on the order of nanometers. The nanochannels have an average diameter of between 1nm and 999 nm. The term "microchannel" is used herein to refer to a channel having dimensions on the order of microns. The average diameter of the microchannels is between 1 μm and 1 mm. Preferred channel dimensions and specifications according to the present invention are described in detail below. In a preferred embodiment, the channel is fixed in the wall.
The reagent is attached to the wall material in such a way that it will undergo energy transfer or quenching with the luminescent partner compound transported through the channel in the wall material and thereby interact with the partner compound. The reagent may be positioned within a very close distance to the channel in order to interact with the partner compound. For example, the agent may be attached to the sides of the channel, to the outer surface of the wall material, to a concentrated region of the outer surface of the wall material around the rim of the channel, embedded within the wall material, or embedded in the wall material around the channel in the form of concentric rings. Optionally, the agent covers the entire surface of the wall material or is embedded in the wall material throughout each corner. To improve signal generation when the reagent is not localized, a mask may be used to cover certain areas of the wall material so that only the reagent localization areas are exposed. The term "mask" is used herein to refer to an object having an opening of any size and shape. More than one agent may be attached to the wall material to produce different signals when the agents are exposed to the coupling agent.
The agent may be attached to the wall material by any method known in the art to accomplish attachment. Examples of biomaterial mating methods are proposed in the work "Bioconjugate Techniques" by Hermanson, g.t. (Academic Press, inc., San Diego, 1996), which is incorporated herein by reference.
When the agent is attached to the surface of the wall material, it may be attached directly to the wall material or via a bonding agent. The term "bonding agent" in the context of reagent attachment is a molecule that binds a light emitting compound or quencher to the wall material. Bonding agents are known in the art. Common bonding agents include alkanes of varying lengths.
The agent is attached to the wall material in a dosage sufficient to allow detectable interaction with the partner light-emitting compound. The term "partner light-emissive compound" is defined herein as a light-emissive compound, but which will interact with and undergo energy transfer or quenching in a specific manner when positioned in close proximity to an agent. The amount of partner light-emissive compound and the amount of reagent required will depend on the type of reagent and light-emissive compound used.
Another example of an article of manufacture of the invention is a wall material having a surface defining a plurality of channels and a station attached to a discrete area of the wall material and at least adjacent to one of the channels, wherein the station is sufficiently close to the channel and is present in a sufficient amountto cause a signal to be generated upon exposure of the polymer to the station as a result of a detectable physical change occurring in the polymer of the linked units passing through the channel or in the station. The "discrete area" of wall material adjacent at least one of the channels is a localized area surrounded by wall material without stations. The area around the discrete area does not interact with the unit and does not produce the same signature signal that would be produced by the unit interacting with the station. The discrete areas are positioned in or near the passageway such that the stations at the discrete areas are exposed to the unit as it passes through the passageway.
A further article of manufacture of the invention is a wall material having a surface defining a channel and a surface of a plurality of stations, each station being attached to a discrete area of the wall material and adjacent to the channel, wherein the stations are sufficiently close to the channel and are present in a sufficient amount to cause a signal to be generated upon exposure of the polymer in the station due to a detectable physical change occurring in the polymer of a linked unit passing through the channel or in the station.
The term "plurality of stations" in this context is at least two stations. Preferably the plurality of stations is at least three stations. In another preferred embodiment, the plurality of stations is at least 5 stations.
In a preferred embodiment, the article is a nanochannel plate. The following description of the optimized design of a nanochannel plate with fluorophores embedded therein is provided for illustrative purposes only. This description is in no way intended to limit the articles described in the claims.
Several examples of nanochannel plates are given in fig. 4. Fig. 4A illustrates a nanochannel plate (60) having a layer ofconductive material (62) and a layer of non-conductive material (64). The diameter of the channel (70) is sufficient to allow passage of the labelled double stranded DNA in a straight line. In this example, the donor fluorophores (68) are embedded in a transparent non-conductive material in concentric rings around each channel. The remainder of the nanochannel plate is made of an opaque material (66).
FIGS. 4B, C, D, E and K illustrate nanochannel plates with fluorophores (68) attached to the surface of the wall material around the opening formed by channel (70). As shown in fig. 4B and 4D, these fluorophores can cover the entire wall material surface. These fluorophores can also be concentrated around the channel openings as shown in fig. 4C, E and K rather than covering the entire surface. Furthermore, the wall material supporting the fluorophore may be a conducting layer (62) as shown in fig. 4D and 4C, the wall material may be a light impermeable layer (78) as shown in fig. 4K, or the wall material may be a supporting layer (72) as shown in fig. 4B and 4C. The support layer may be any type of wall material including, but not limited to, conductive, non-conductive, transparent, light transmissive, and opaque materials.
Fig. 4F, G, H, I and L illustrate nanochannel plates with fluorophores (68) embedded in the wall material around the channel (70). These fluorophores can be dispersed on the surface of the wall material (as shown in fig. 4F) or concentrated around the channel as shown in fig. 4G, H and I. In the embodiment shown in fig. 4F, G, H, I and L, the fluorophores are embedded in a layer of conductive material (62) or a layer of transparent material (74) or a layer of light transmissive material (79). The membrane layer with the fluorophore embedded therein may be formed on the surface of the wall material as shown in fig. 4F and 4G, or sandwiched between other membrane layers. For example, the non-conductive layer (64) in fig. 4H and 4I is sandwiched between two conductive layers (62). The light-transmitting layer (79) of fig. 4L is sandwiched between two light-impermeable layers (78). In some cases, the film layer forms the entire wall material. In other cases, the membrane layers may be adjacent to or sandwiched by a support layer, as shown in fig. 4I.
FIG. 4J illustrates a nanochannel plate with fluorophores (68) attached to the surface of the wall material around the opening formed by channel (70). The material around all exposed surfaces of the wall material (including surfaces within the channels) is a conductive material.
Fig. 4M and 4N illustrate a nanochannel plate having a luminescent film (76) positioned within the wall material around at least a portion of the channel (70). The light-emitting thin film may be formed on the surface of the wall material and adjacent to the light-impermeable layer (78) as shown in fig. 4M, or may be sandwiched between two light-impermeable layers (78) as shown in fig. 4N.
FIGS. 4O and 4P illustrate nanochannel plates with two layers of fluorophores (68) embedded in or attached to the surface of the wall material. In fig. 4O, fluorophore layers (68) are attached to the surface of the conductive material (62), on both sides of the wall material and around the opening formed by the channel. In fig. 4P, the fluorophore layer (68) is embedded in two light transmitting layers (79) that sandwich a light opaque layer (78).
The preferred method of the invention involves analysis of a radiolabeled polymer as discussed above. Preparation of polymers with radiolabels, e.g. with 32P or3H, DNA is known in the art. The following description represents one of many possible embodiments for analyzing a polymer bearing a radiolabel according to the method of the invention (FIGS. 4Q and 4R). Nucleic acid molecules (160) with radiolabels were analysedusing a specially fabricated multi-layered nanochannel (162). The nanochannel is the diameter of the labeled nucleic acid molecule and is configured to obtain a defined detection zone. The exemplary nanochannel plate shown in fig. 4Q and 4R is a heterogeneous multilayer structure consisting of two radiopaque film layers (e.g., lead or Lucite films) (164, 166) and a low density material film (or scintillation layer) (168) (i.e., conventional polymer, plexiglass, Teflon, etc.). In the context of figure 4Q,the lead film is sandwiched by layers of low density material and is thick enough to prevent the passage of radiation. The low density material allows radiation to pass through, thereby establishing a designated radiation detection zone. When the radiation label on the DNA passes through the designated detection zone, nuclear radiation is emitted, a portion of which will pass through the designated radiation detection zone. Fig. 4R illustrates the presence of a low density material (168) around the opening formed by the via. The material surrounding all exposed surfaces of the wall material, including surfaces within the channels, is a radiation-opaque layer (165).
In a related embodiment (FIG. 5) for analyzing radiation labeled nucleotides, a scintillation counting and a admittance channel based detection system is presented. A nanochannel array (170) as shown in fig. 5 is fabricated. Multiple multi-layer channels (172) are provided for parallel amplification of data output. Each individual channel is composed of a nuclear radiation shield (174) that shields nuclear radiation and a fluorescence scintillation layer (176) that is excited upon exposure to the nuclear radiation. The individual channels are separated from each other by a nuclear radiation shielding material. The nuclear radiation is prevented from reaching the fluorescence detection system by covering it with Lucite (or any transparent material that prevents the nuclear radiation from passing). This allows only the fluorescent signal to reach the detection system.
Each nanochannel described above is merely an example. It should therefore be understood that each of the limitations described with respect to these embodiments involving any one element or combination of elements may be included in each nanochannel. Techniques for making Films with multiple layers of different materials are described, for example, in U.S. patent No.5,462,467 and Ferreira et al, Thin solid Films 224: 806809(1990).
In the example provided, the donor fluorophores are concentrated in concentric rings around each channel in order to optimize donor intensity. Intuitively, concentric rings are preferred because the range of energy transfer is limited in part by the Forster distance. Studying one channel in detail will illustrate the significant variation in donor intensity that can occur in a concentric ring structure. Fig. 6 shows a channel (82) with a concentric ring structure. The outermost concentric ring (86) represents the edge of the donor fluorophore around the channel. The central concentric region (84) represents the region where the energy transfer rate from donor to acceptor is greater than the emission rate of the donor fluorophore.
The fundamental reason for the mosaic of donor fluorophores in solid media is best understood by studying the mechanism of photobleaching and quenching. Factors that may attenuate the fluorescent signal include: photobleaching, temperature quenching, energy transfer quenching, collision quenching, excited state reactions, and solvent effects. These mechanisms are similar, i.e., they are caused either by a collision event or a bimolecular event. Solid media are physical barriers to prevent these unwanted molecular processes and are a means of isolating the donor fluorophore. For example, the photobleaching mechanism is due to the reaction of an excited fluorophore with oxygen to form a non-fluorescent product (Menter et al, 1978; Menter et al, 1979; Giloh and Sedat, 1982). Solid media, particularly those fabricated in an oxygen-free environment, prevent oxygen from contacting fluorophores embedded therein, thereby eliminating possible oxidation reactions (Garland and Moore, 1979; Rost, 1990). To further understand the effect of the solid medium, other quenching effects are briefly introduced. Temperature quenching is the decrease in fluorescence with increasing temperature. The extent of the temperature effect depends on the compound; it is typically about 1% quenching change per degree celsius (Guilbault, 1973). It is believed that this effect is due to the increased probability of ground state transitions occurring in the forward direction of fluorescence as a result of increased molecular motion and increased collision frequency. Collision quenching is a broad category consisting of a number of mechanisms involving direct contact of a fluorophore with another molecule (Lakowicz, 1983). Excited state reactions involve the reaction of an excited state's active fluorophore with nearby solvent molecules and constitute a subset of collision quenching (Porter, 1967; Zweig, 1973). The solvent effect involves solvent-fluorophore collisions and interactions including hydrogen bonding, acid-base chemistry and charge transfer (Lakowicz, 1983). Energy transfer quenching is the effect of impurities on a fluorophore via unwanted FRET. By briefly enumerating the mechanisms of photobleaching and quenching, it is apparent that the interaction of the molecule with the fluorophore is the main reason for the reduced emission of the fluorophore. Thus, the solid medium eliminates these unwanted molecular interactions, collisions and reactions by sequestering fluorophores and creating a physical barrier that prevents the entry of unwanted quenching molecules.
The equation defining the energy transfer should be studied in order to determine the effect of thesolid medium on the energy transfer. The equation describing the Forster distance needs to be considered [ Selvin, 1995; cantorand Schimmel, 1980; wu and Brand, 1994; clegg et al, 1995; fairclough and Cantor, 1978]:
Where J is the normalized spectral overlap of donor emission and acceptor absorption, φDIs the quantum efficiency (i.e., ion yield) of the donor emission in the absence of the acceptor (phi)DEqual to the number of photons emitted divided by the number of photons absorbed), n is the refractive index, K2Is a geometric factor related to the relative angle of the two dipoles. The donor fluorophore will be embedded in a solid medium to increase the refractive index n. In solvent systems, n has a value of around 1.35 (Selvin; 1995) slightly higher than the value of 1.33 for water. Typical values for some solid media are fused silica 1.46, lead free glass 1.52, heavy flint glass 1.66. R of solid media and solvent system0The ratio of's can be used to determine the magnitude of the effect of changing the refractive index: wherein the value with the "'" sign is the value of the solid medium; values without the "'" sign are values for the solvent system. Assuming that n' is 1.5, the ratio becomes 0.93. Thus, the Forster distance varies by only 7%, one by taking the original R0Higher donor-acceptor pairs are easily corrected values.
Referring again to FIG. 6, without reference to these equations, conceptually, the energy transfer rate (k)transfer) Decreasing from the center of the channel with increasing distance from the center (fig. 6). The donor emissivity (k) is also knownemit) Uniform over the entire area of the donor fluorophore in the absence of acceptor (fig. 6). The region closest to the channel (and hence also to the receptor) is completely quenched. At all less than RequalBecause of ktransferGreater than kemitThe donor fluorophore is completely quenched. At all above RequalThe donor emissivity is greater than the energy transfer rate, so quenching is incomplete.
If the radius of the concentric ring of donor fluorophore is equal to RequalThen a 100% intensity change will occur with respect to the donor fluorophore. This means that the acceptor is detected with the desired efficiency as the acceptor-labeled nucleotide leaves through the channel. Recall that the confidence interval is related to the SNR of the system, yielding 99.9% for this changeThe minimum signal to noise ratio required for the confidence interval is calculated, resulting in a 6: 1 ratio. SNRs are greater than 600: 1 for the proposed detection system.
At this time, quantitative descriptions are presented to calculate Requal. Equations for donor emissivity and energy transfer rate are given. The donor emissivity was: where I is the intensity of light incident on the donor fluorophore,. epsilon.is the molar extinction coefficient of the donor fluorophore, and. rho.is the fluorescence emission constant (3.8X 10)-21mol cm3L), N is the donor fluorophore number, h is the Planckian constant (6.6261X 10)-34Js), ν is the frequency of the excitation light.
Energy transfer rate (k) of multiple donors to one acceptortransfer) Derived from the energy transfer rate equation for Forster (Forster, 1965) originally used for one donor and one acceptor. The original equation is: wherein k is the energy transfer rate of a donor to an acceptor, R0Is the Forster distance, τ is the fluorescence lifetime of the donor, and r is the distance from the donor to the acceptor. The derivation of the multi-donor system was an extension of the previous discussion of the multi-donor system.
For a multi-donor system, there are two limitations on theenergy that can be transferred. First, there is a saturation limit imposed by receptor lifetime. The receptor can only be excited if it is in the single ground state. For receptors with a lifetime of 1ns,the upper limit is 1X 10⁹Secondary firing event/sec. This high saturation level is difficult to correlate with low-rate excitation (25,000 excitation events/second) of a single fluorophore. The second limit is the probability that the donor fluorophore will de-excite simultaneously. In the previous calculations, only a small number of simultaneous de-energizing events may occur. Since the excitation event derived from energy transfer does not saturate the acceptor and the simultaneous donor deactivation probability is low, the multi-donor system has a fractional energy transfer rate proportional to the number of donor fluorophores (N):
using this equation, let k be solved by making the two rate equations equal and solving for rtransferIs equal to kemitRadius (R) ofequal)。 And solving r. The value of (2) can be calculated. Table 3 lists the values of the various variables and the reasons for choosing these particular values.
| TABLE 3 | ||
| Variables of | Numerical value | Reason for |
| R0 | 60 angstroms (A) | Forster transfer distances of 20 to 100 angstroms |
| τD | 1×10⁻⁹Second/photon | Fluorescence lifetime ranging from 1ns to 20ns |
| h | 6.6261Js | Planck constant |
| ν | 6.1224×10¹⁴×s-1 | c ═ ν λ; lambda 490nm (excited fluorescein) |
| I | 30W/cm2 | The 2W laser intensity is given by P/A; a is the beam Area (r ═ 2 mm); the laser intensity was 64W/cm2 |
| ε | 91,000 1/M cm | Molar extinction coefficient of fluorescein |
| ρ | 3.8×10⁻²¹M cm3 | Fluorescence emission constant of fluorescein |
| Requal | 350 angstroms (A) | From the above equation |
RequalThe calculation of (d) is 350 angstroms, within the order of Forster distance. This means that a concentric ring of fluorophores with a radius of 350 angstroms around the channel will produce 100% signal intensity when the receptor labels are passed. In fact, having such a large donor intensity is redundant from both the standpoint of signal detection and the need to resolve adjacent bases. For example, only a 0.5% change in intensity can yield a 99.9% confidence interval. Looking at a further reduction in donor emission with two acceptors in the donor layer rather than one, it is possible to resolve adjacent bases. If one acceptor has reduced the donor emission to zero, a further reduction of the complementary acceptor, which is not possible due to the donor emission, will not be detected. This aspect will be discussed in detail below. Examples of methods for constructing concentric rings of donor fluorophores around each channel using photolabile protecting groups and light diffraction are also provided below.
Nanochannels having a channel diameter of at least 1nm are commercially available in the form of polycarbonate filters from Poretics, and can be ordered from Corning separations. There are several methods that can be used to make nanochannels of the desired diameter.
One method of fabricating a nanochannel plate is to create circular holes of uniform diameter in the membrane material by means of a track etch process. Microporous or nanoporous polymer membranes having pore sizes on the order of 10nm and pore densities approaching 10 pores per square centimeter may be prepared by track etching [ r.l. fleischer, p.b. price, r.m. walker, Nuclear track sin Solids univ.of California Press, Berkeley, CA (1975)]. The creation of the pores by means of track etching is a two-step process. In a first step, a polycarbonate (or other polymeric material) film is exposed to aligned charged particles in a nuclear reactor. These particles leave sensitized tracks as they pass over the polycarbonate material. The density of the traces is controlled by varying the time the film is in the reactor. In the second step, the traces left behind by the particles are preferentially etched (or dissolved) into uniform cylindrical channels. The perforation diameter can be controlled by the residence time of the etchant on the film. Methods of forming track etched membranes have been a number of precedent in the art, such as european patent application No. 83305268.1, publication No. 0109147, assigned to Varian Associates, inc., U.S. patent No. 3,303,085; 3,662,178 No. C; 3,713,921 No. C; 3,802,972 No. C; 3,852,134 No. C; 4,956,219 No. C; 5,462,467 No. C; 5,564,959 and 5,449,917, which are all incorporated herein by reference. Commercially available membranes are typically made from polycarbonate or polyester, but many other materials are treatable by track etching (Id). For example, other polymeric materials include, but are not limited to, polystyrene; an aromatic polyester; polyolefins, including polyethylene, polyethylene terephthalate, polypropylene; vinyl plastics such as polyvinyl difluoride (PVDF) and cellulose esters such as nitrocellulose, cellulose butyrate and cellulose acetate. If the nanochannel plate of the present invention is fabricated using a track etch technique, it may be made of any material that can be etched using a track etch to form a track etched membrane.
Devices for bombarding materials with energetic particles are known in the research and industrial fields. The particles used to form the track may be assisted by a charged particle accelerator, such as an electrostatic accelerator (e.g. a Van de Graaff accelerator or a Tandem accelerator); linear accelerators or circular accelerators, such as cyclotrons; or any device known in the art.
Once the damage tracks are formed on the thin film, the thin film may be selectively etched with a gas or liquid, thereby forming channels, i.e., micropores. The residence time of the etchant determines the size of the channel. The track etched film is exposed to the etchant for a time sufficient to create channels of a size suitable for the desired application, which will vary depending on the type of polymer being analyzed and the type of analysis. The channel diameter can be measured using a Scanning Electron Microscope (SEM) according to the method disclosed in "basic principles of Membrane Technology" by M.Mulder (KlumeAcademic, 1991).
A second method of forming nanochannels of defined diameter is to use track etching in conjunction with surface coating. Polycarbonate membranes having a diameter greater than the desired nanochannel device are coated with a thin film material of a specified thickness. The resulting structure was coated onto a polycarbonate film of the desired diameter. The first layer of film applied to the nanochannel plate is the conductive layer. The conductive layer helps to distinguish between adjacent bases (discussed in detail below)
A thin film layer of conductive polymer was applied to the polycarbonate film sheet by solvent deposition. Solvent deposition of conductive polymers has been described (Cheung et al, 1994; Fereira and Ruber, 1995; Fou and Ruber, 1995). The following is a section taken from Fou and Ruber, 1995:
we introduce the solutionchemistry and methodology required to utilize layer-by-layer processing techniques
… … to skillfully polymerize conductive polymers such as polypyrrole and polyaniline
Processing the article into a multilayer film and applying angstrom scale to both film thickness and film texture
And (5) controlling. An ultra-thin film having a conductivity of 300S/cm or more can be produced. The method
The process involves spontaneous absorption of a single layer of conducting polymer from a dilute solution to a substrate
The above. Followed by formation of multiple thin films by alternate deposition with soluble polyanions. Thin sheet
The thickness of the film can be precisely controlled to the angstrom level and can be distributed between 5 angstrom and 1000 angstrom
And (4) more than angstroms. The conductive polymers used are polypyrrole and polyaniline, since they can be used
They are extremely rich in ultrathin layers (. about.50A) of conductivity (300S/cm).
The advantages of using solvent deposition to form the desired nanochannels are twofold. First, nanochannels of any given diameter can be formed precisely. Second, since the first nanochannel plate is a conducting layer, it is convenient to add it. Another advantage, although not obvious, is that increasing the thickness of the conductive material layer can reduce the peak-to-valley distance of the polycarbonate surface, resulting in a more uniform surface.
Another method of making nanochannel devices of the present invention is to produce arrays of carbon nanotubes. Iijima demonstrates that the production of multiple concentric cylindrical shells of hexagonally bonded carbon atoms can act as catalytic surfaces, confining a substance in one dimension [ Iijima, Nature, 354: 56(1991), also see U.S. Pat. No. 4,424,054].
Li.w.z. et al also report a method of producing large areas of highly ordered isolated nanotubes. This method is based on vapor chemical deposition, which utilizes mesoporous silica containing iron nanoparticles embedded in micropores instead of carbon black and graphite or silica coated with transition metal nanoparticles. The following methods are disclosed by Li, w.z. et al:
the mesoporous silica containing nanoparticles is prepared by sol-gel method with tetraethoxy silicon
(TEOS) is prepared by hydrolysis in aqueous ferric nitrate. Analytically pure TEOS
(10ml) with 10.4ml of analytically pure ethanol and 0.1M aqueous ferric nitrate solution
(11.4ml) were mixed and stirred magnetically for about 30 minutes. Then, a few drops of concentrate were added
Condensed hydrogen fluoride (0.2ml) and the mixture was stirred for a further 15 minutes. In the mixing
After the compound had formed a gel, the gel was dried at 60 ℃ for 1 week to remove the majority
The remaining water and other solvents. Then, at 450 ℃ 10-2Under pressure of millimeter mercury column
The gel is calcined. Obtaining a silica network having relatively uniform micropores, sodium iron oxide
The particles are embedded in these pores. Then, at 550 ℃ under 180 mmHg
9% of H2/N2Air flow (110 cm)3Per min) reduction of iron oxide nanoparticles 5
And h, obtaining the iron nano particles with high catalytic activity. Subsequently, will contain 9% B
The nitrogen mixture of alkynes is at110cm3A flow rate of/min is introduced into the chamber, with the aid of
Deposition of carbon atoms from acetylene decomposition at 700 ℃ to form carbon nanotubes on a substrate
A tube. Before and after carbon deposition with a scanning electron microscope (S-4200,
hitachi) examined the sample and detected by means of siii attached to SEM
The machine records energy dispersive X-ray spectroscopy (EDX). To prepare a transmission electron display
A micromirror (TEM) sample, which was ground with a mortar and suspended in ethanol,
then, a drop was dropped on a porous carbon-red copper grid and subjected to JEM 200-cx microscopy
The lenses were examined to determine the characteristics of the carbon nanotubes.
In addition, nanochannels may be prepared from porous anodized aluminum, which is a packed array of hexagonal columnar unit cells with cylindrical central pores of uniform size, typically in the range of 4 to 200nm in diameter. Membranes of this type are prepared electrochemically from metallic aluminum [ A.Despic and V.P.Parkhutik, in Morden accessories of electrochemistry, J.O.Bocgris, R.E.white, B.E.Conway editors (Plenum, New York, 1994), vol.20, chap.6]. Up to 10 per square centimeter has been achieved11Micropore density of pores [ D.AlMawiwi, N.Coombs, M.Moskovits, J.appl.Phys., 70, 4421(1991)]. Membranes with pore diameters as small as 5nm have been produced using this method [ it is believed that even smaller pores can be produced, Martin, c.r., sceience, 266: 1961(1994)]。
Improvements in porous alumina membranes have been described by Matsuda and Fukuda. These membranes, which are arrays of noble metal (platinum and gold) nanopores, are prepared by replicating the porous, anodized aluminum honeycomb structure using a two-step process. The positive structure is made of metal after the porous negative structure of porous alumina is made, which will result in a geometry that is completely identical to the structure of the porous anodic alumina. Therefore, this method allows the preparation of porous anodic alumina pore arrays with the desired material instead of alumina [ Matsuda and Fukuda, sceience, 268: 1466(1995)]. The methods of Matsuda and Fukuda are briefly described below.
Anodized aluminum is produced by long-term anodization at 40V of aluminum oxide on a substrateResulting in minimal defects and dislocations, followed by saturation of HgCl2The bottom surface portions of the aluminum substrate and the porous layer are removed. Then, the material was impregnated with a 5% (by weight) phosphoric acid solution to adjust the pore diameter. Oxidation at porous anodes by vacuum depositionA thin metal layer is deposited on the bottom of the aluminum to form a catalyst or electrode for use in a subsequent metallization process. Generally, the metal used for evaporation is the same metal used to form the "scaffold". A metal methacrylate monomer containing an initiator, such as 5% by weight benzoyl peroxide, is injected into the pores under vacuum and polymerized by means of ultraviolet radiation. The alumina layer was then removed with NaOH to produce a porous alumina type negative structure of polymethyl methacrylate (PMMA). The positive structure is formed from a PMMA mold by chemical deposition of platinum. And immersing the negative-type PMMA in an electroless plating solution, and enabling metal to be deposited from the bottom surface part of the cylindrical structure and gradually filling the cavity of the PMMA until the metal is filled to the negative-type top surface of the PMMA. Another approach is to electrochemically deposit Au into the micro-cavities of PMMA under constant conditions,thereby preparing an array of gold (Au) wells.
Other nanoscale porous materials described in the prior art include pore densities up to 3 x 10 per square centimeter10Individual microwell nanochannel array glasses [ r.j.tonucci, b.l.justus, a.j.campllo, c.e.ford, sceience 258: 783(1992) and Pearson with Tonucci, Sceince 270: 68(1995)]. Douglas et al have demonstrated that nanopores in proteins derived from bacillus (nanoscipic wells) can be used to transfer images of these microwells to an underlying substrate [ Douglas et al, sceience 257: 642(1992)]. Finally, Ozin has discussed a wide variety of nanoporous solids that can be used as template materials [ Ozin, g.adv.mater.4: 612(1992)]. Nishizawa et al describe the production of metal nanotube films with radii as small as 0.8 nm [ Nishizawa et al, sceience 268: 700(1995)]The nanotube formation method described is gold plating of the walls of the micropores in a commercially available polycarbonate filter membrane comprising cylindrical micropores (6X 10 per square centimeter) of uniform radius (25nm) through the membrane thickness (6 μm)8A micro-well)."the thickness of the gold layer deposited on the walls of the micro wells can be controlled by varying the gold plating time. Thus, the inner diameter of the gold nanotubes can also be varied [ determined by measuring the flux of gas (He) across the membrane containing the nanotubes]. "Bertgren et al have demonstrated the use of monolayers for self-assembly and the use of neutral inert gas beams for nanoscopic applicationsGrade lithography (nanolithography) technique [ Berggren et al, science 269: 1255-1257(1995)]。
La Silva et al describes a technique for tunneling scanning microscopy (STM) to fabricate simple metallic structures with dimensions in the range of 10 to 100 nm and partially isolated from their environment. This method is to deposit a very thin metal film on an insulating substrate and topunch an opening through the film where lateral electrical insulation is desired using a sharp point machine [ journal Vacuum design&Technology B, (1993) 11: 1992-1999].
The wall material may be constructed in a manner that is most conducive to distinguishing between adjacent units of the polymer. Since the function of the wall material is to provide an environment for conducting signals, the material used to prepare the wall material may be selected to facilitate this process. For example, if the agent is embedded in the wall material, the wall material surrounding the agent is preferably a conductive material or a light transmissive material. In order to resolve adjacent labeled bases, there are at least two other mechanisms for optimizing wall material in devices having fluorophores embedded in the walls around the channels, including the use of thin conducting layers and controlling the radius of the donor fluorophore around each channel.
The conductive layer prevents Forster energy transfer through the electrical shield. Figure 6 illustrates the conducting layer configuration associated with a non-conducting layer containing a donor fluorophore. This conducting "sandwich" forms a defined region where energy transfer can occur, which helps to optimize base discrimination. Forster energy transfer is caused by an electric dipole interaction between the donor and acceptor. The basic reason for using a conducting layer when the signal that occurs is dependent on FRET is that FRET is a function of the electric field, and therefore placing an electrical barrier between the donor and acceptor prevents energy transfer. It is essential to understand the basis of energy transfer in general. The incident excitation light induces electron transitions or causes collisions of electrons in the donor,it will set up an electric field in the donor (Selvin, 1995). This will generate an induced electric dipole moment in the donor, which then also generatesits own electric field. Energy transfer occurs when the acceptor is placed in the electric field of the donor. Thus, there is an excited transition in the receptor that generates an induced dipole moment. The magnitude of this dipole moment is related to the magnitude of the donor electric field: p is a radical ofA=αAEDWherein αAIs thatThe degree of polarisation of the receptor. The energy absorbed by the acceptor is pAED=αAED 2Its conversion into energy transfer rate of 1/R6A changing relationship.
The theory of electrical shielding is found in most physical entry books. Purcell, 1985 provides a clear explanation. The potential function psi (x, y, z) within the cassette must satisfy the Laplace equation u2Psi-0. Given the known conditions of the conductor, the boundary of the superconductor is equipotential, which means ψ0I.e. a constant function everywhere on the surface of the superconductor. The obvious solution of Laplace's equation is psi ═ psi0Throughout the volume. According to the uniqueness theorem, there is only one solution, which means that ψ is constant. Since E ═ grad ψ, the electric field with a constant potential function is zero. Thus, the electric field is zero everywhere within the cartridge.
The hollow box model with openings can be applied to nanochannel plates, since nanochannel plates are essentially conductive boxes with many "holes". Referring to fig. 7A and 7B, fig. 7A shows a complete nanochannel plate (90) with nanochannels. The donor fluorophore layer (88) is enclosed by a conductive "cassette". In this case, no energy transfer from outside the cassette is possible for the donor fluorophore due to the electrical shielding (90). Recall that the basis for energy transfer is the electric field. The boundary condition of the nano-channel is thatthe outer surface psi of the nano-channel plate is equal to psi0I.e. an equipotential surface. The logical solution to laplace's equation is constant everywhere within the boundary. This is the only answer possible according to the uniqueness theorem, so E-0 is due to E-grad ψ everywhere inside the conductive "box" of the nanochannel. The conclusion is that the acceptor fluorophore cannot undergo energy transfer from outside the cassette. At the receptor molecule not interacting with the donorAny position where the bulk fluorophore is co-located, the amount of energy transfer will be limited. In fig. 7B, the donor fluorophore that did not undergo energy transfer is surrounded by an angle θ, which is very large in all cases, except for the acceptor fluorophore at the position of the donor fluorophore, which is the desired configuration.
The effect of the conducting layer is that sharp signals are formed when the labeled nucleotides pass through the nanochannel. FIGS. 8A and 8B illustrate the generation of a signal when receptor labeling is passed through a nanochannel. Fig. 8A shows an enlarged view of one nanochannel (98). Only a portion of the conductive layer (94) is shown. The opaque polycarbonate film layer is not shown. The acceptor label (100) on the DNA strand moves from bottom to top through the nanochannel, starting from position A and moving to position C. FRET can only occur at position B because the conduction layer shields the donor fluorophore (96) from any interaction with the acceptor at positions a and B. The curve in fig. 8B illustrates a steep change in donor intensity as the acceptor label moves from position a to position C. The middle section of the curve represents the energy level of the donor fluorophore. The outer segment of the curve represents the energy level of the conductive layer. At the interface between the conducting layer and the donor fluorophore layer, there is a significant change in donor intensity due toelectrical shielding.
Clearly, the use of a conducting layer can solve the resolution problem between adjacent bases. By forming a conductive "sandwich" in which the thickness of the donor fluorophore is less than the pitch of the B-DNA (3.4 angstroms), the required resolution can be achieved. Films of this thickness can be readily formed by plasma deposition, solution deposition, chemical vapor deposition or ion beam deposition (Spohr, 1990; Valiev, 1992; Konuma, 1992; Pauleau, 1995; Dash, 1975; Stuart, 1983; Morosanu, 1990). However, the use of a donor fluorophore film having a thickness of less than 3.4 angstroms is undesirable, as will be explained under the next heading. In short, the donor fluorophore embedded in the thicker film layer allows measurement of the instantaneous speed of DNA movement. By measuring the time spent by the labeled nucleotides in the thick film layer and knowing the size of the film layer, the speed of DNA movement can be known, which is critical for determining the distance between the labeled nucleotides.
Another example of a method to accurately resolve adjacent labeled bases is to control the radius of the donor fluorophore around each nanochannel. In the presence of concentric rings of donor fluorophores, more energy is transferred to the two acceptor labels than to one acceptor. Detecting the difference in energy transferred to one and two receptors allows discrimination of adjacent bases. In order for a donor fluorophore to be able to interact with more than one acceptor, the thickness of the donor fluorophore has to be the pitch of the DNA. In addition, the radius of the donor fluorophore must be larger than the R for one acceptorequal(see FIG. 6). In the presence of more than one acceptor, the radius is greater than the R for one acceptorequalAllowing further reduction in donor intensity. Radius equal meansThe donor intensity decreased by 100% upon passage of oneacceptor. In this case, two receptors would give the same detection signal as one receptor.
FIG. 9 illustrates the passage of two base-labeled DNA strands through a nanochannel (104) with appropriate thickness and radius of fluorophore (108) sandwiched between conducting materials (106). The positions marked with "a" to "D" correspond to the marks on the figure to the right of the figure. Initially, the acceptor on the DNA is labeled at position A. No energy transfer can occur at this location, so the donor intensity remains at a maximum. Further DNA movement allows one acceptor to undergo energy transfer (B) with the donor fluorophore and a sharp drop in donor intensity occurs. At position C, both fluorophores are able to undergo energy transfer and the donor intensity drops further. Finally, the two acceptor labels leave the donor fluorophore region and energy transfer is no longer possible, so the donor intensity returns to the maximum (D).
The change in donor emission in the presence of one and two acceptors can be illustrated graphically without mathematical quantification. Fig. 10A illustrates the amount of change by volume. The inset shows the degree of energy transfer as a solid volume (110). The raw donor intensity is represented as a disk-shaped volume (112). FIG. 10B changes induced by one receptor. The right panel is for two receptors. The decay curve represents the change in energy transfer rate versus radial distance given by the Forster equation. Adapted for two receptors, the decay curve being substantially that of one receptorTwice the decay curve. Donor emissivity and energy transfer rate in units of 1/s nm2And (4) showing. The donor emission fall rate is integrated over the energy transfer surface to give a net fall in donor emission. This is expressed as the area of the shadow under each attenuation curve integrated over a 2 pi range. Knowing the original donor emission (the area of the rectangular shading is integrated over a 2 pi range), the percent reduction in donor emission can be determined.
Mathematically, these variations are easily calculated. In both cases, the variation is equal to the integration of the band area (FIG. 10) over a 2 π range. For calculation, the donor emissivity and the energy transfer rate are calculated in the appropriate units l/s nm2And (4) showing. To this end, donor fluorophoresIs used in the rate equation, where N isDIs the number of fluorophores and A is the area occupied by the donor fluorophore. Thus, the emissivity is given by: the energy transfer rate becomes:
wherein N isAIs the number of acceptors that can undergo energy transfer with the donor. Adapted to sum upThe general equation for calculating the integral of the banded area over the 2 pi range is as follows: for the present calculation, Rdonor=55nm,ND1000. Density of Donor fluorophores (N)DA) becomes 0.11 fluorophores per square nanometer. This value is not reasonable, since the area of the largest fluorophore possible is 1nm2. This means that the density is at least an order of magnitude lower than the highest possible fluorophore density.
To solve the general equation, recall, let kemit=ktransferR can be obtainedequalThus, the following equation is derived: it is important to know the original donor emission (E)0) It is given by:
with the above values and the values from table 3, it is possible to tabulate the donor emission values for the number of acceptors that are in the position undergoing energy transfer (table 4). N is a radical ofAThe values 1-5, 11-12 are calculated as examples. We expect the first donor emission to drop by the greatest amount. The subsequent drop is gradually reduced. When close, it is desirable that the actual change (not a percentage) approaches zero. This is so because the donor molecule is almost completely quenched.
What determines the detectability is the rate of change and the signal-to-noise ratio, rather than the change in the absolute value of the donor emission. As expected, SNR decreases as the number of acceptors increases because there is more donor quenching. In other words, the donor emission becomes smaller. From N A5 to NAThis decrease in SNR is compensated by an increase in the rate of change, 12. Confidence is calculated using the SNR and the rate of change. For example, the confidence for detecting a change from one receptor to two receptors is calculated using the SNR at one receptor and the rate of change from one receptor to two receptors. In this case, there is a95% confidence that a 0.483% change was detected. Due to the high rate of change (29.1%), signal changes from one receptor to two receptors will be detected with 100% confidence. The above calculations indicate that multiple adjacent receptors can be detected with high efficiency.
| TABLE 4 | ||||
| NA | Donor emission (light) Second/second) | Relative to the preceding one Rate of change (%) | SNR (at E)080% full well Capacity, NA=0) | Confidence level |
| 0 | 2.5572×10⁷ | - | 632∶1 | ~100 |
| 1 | 1.0943×10⁶ | 57.2% | 413∶1 | “” |
| 2 | 7.7510×10⁶ | 29.1% | 348∶1 | “” |
| 3 | 5.7650×10⁶ | 25.6% | 300∶1 | “” |
| 4 | 4.3560×10⁶ | 24.4% | 261∶1 | “” |
| 5 | 3.2440×10⁶ | 25.5% | 225∶1 | “” |
| ” | ” | ” | ” | ” |
| 11 | 3.8200×10⁵ | - | 77∶1 | “” |
| 12 | 2.1200×10⁵ | 44.5% | 58∶1 | “” |
The assumption made in the above calculations is that the donor emission remains unchanged during the passage of one fluorophore through the donor fluorophore layer. Recall that the donor fluorophore layer can be composed of a single layer of fluorophores embedded in a non-conducting transparent material. The distance for energy transfer to an acceptor near the exit of a nanochannel is less than the distance when initially entering the channel. This variation is in fact important, as demonstrated below by mathematical methods. Taking this change into account for more acceptors will result in higher signal-to-noise ratios and larger donor intensity variations. This means that the values in table 4, although already indicating a very efficient signal generation/detection, are in practice even slightly higher.
The change in donor emission as the acceptor passes through the donor fluorophore layer was determined by calculation according to the following equation. It is expected that the extent of energy transfer will be reduced as the acceptor passes through the donor layer due to the smaller effective distance of energy transfer. The consequence of this reduction is that the donor emission is greater than used in the previous calculations. Higher donor emission means higher SNR. It is assumed that the acceptor has entered the donor layer a small distance. After a short time, another acceptor enters the donor layer. The presence of additional acceptor decreases the donor emission. The percentage change is large. In fact, it is larger than the previous calculation. The combination of higher SNR and larger percentage change means that the detection efficiency is higher than in previous estimates. The use of such a system enables complex labelling schemes to be identified, such as labelling individual nucleotides.
When the acceptor and donor fluorophores are in the same plane, the donor emission equation is given by: recall kemitAnd ktransferThe equation of (c):
to express the function of the original donor emission function in terms of radial distance (x) and acceptor-to-donor layer distance (d), the following equation is substituted: will solve for ktransferSubstituting the equation (a) to obtain a final equation: let u be x2+d2Then dx is du/dx,
mixing Xequal=√(R2 equal-d2) Substituting, the final transmit function becomes: the final donor emission function can be plotted against distance.
| Distance between two adjacent plates (Angstrom) | Donor emission (one photon/second) | Rate of change from the original value |
| 0 | 1.09425×10⁷ | - |
| 20 | 1.09740×10⁷ | 0.023% |
| 40 | 1.0692×10⁷ | 1.158% |
| 60 | 1.12278×10⁷ | 2.607% |
| 80 | 1.14501×10⁷ | 4.638% |
| 100 | 1.17365×10⁷ | 7.256% |
To solve the above equation, it is necessary to solve the problem by letting kemitSolving for R equal to the sum of the energy transfers of the two acceptorsequal. Solving for R according to the following equationequalIs completed by a computer: the acceptor was changed from one to two and the rate of change of the donor emission was tabulated.
 Therefore, base discrimination up to individual bases can be achieved. The inference of base-resolved independent variables is that the time spent by each acceptor in the donor layer can be determined. This translates into information about the instantaneous speed of DNA movement.
| Distance (d) |
| E2(d) | E1(d) | Rate of change | SNR |
| 0 angstrom | 39.28 | 7.7510×10⁸ | 1.0943×10⁷ | 29.10% | 348.0∶1 |
| 20 angstroms (A) | 39.21 | 7.7661×10⁸ | 1.0974×10⁷ | 29.24% | 348.3∶1 |
| 40 angstroms (A) | 39.11 | 7.8012×10⁸ | 1.1069×10⁷ | 29.44% | 349.3∶1 |
| 60 angstroms (A) | 39.01 | 7.8815×10⁸ | 1.1228×10⁷ | 29.80% | 350.9∶1 |
| 80 angstroms (A) | 38.82 | 7.9790×10⁸ | 1.1450×10⁷ | 30.31% | 353.1∶1 |
| 100 angstroms (A) | 38.610 | 8.0962×10⁸ | 1.1737×10⁷ | 31.01% | 355.7∶1 |
In order to achieve an optimal linear crossing channel (a polymer across a channel), it is important to consider the channel diameter and the method (e.g., electric field) used to guide the linear crossing of the polymer. The channel diameter should correspond well to the diameter of the marked polymer. The theory of linear traversal is that the channel diameter corresponds well to the polymer diameter. For example, a circular slide clamp of DNA polymerase has an inner diameter corresponding to double-stranded DNA and successfully achieves linear crossing of DNA molecules (advancing). Thousands of bases of DNA can pass through the slide clamp. Several references have also demonstrated that linear traversal of a channel by DNA occurs when the channel diameter corresponds well to the diameter of the DNA. (Bustamamte, 1991; Gurrieri et al, 1990; Matsumoto et al, 1981).
The single-stranded DNA tested in the experiment had a diameter of 1.6 nm. Channels with an inner diameter of about 1.7-3nm are sufficient to allow linear traversal of single-stranded DNA molecules. The channel diameter and the DNA diameter need not be exactly matched, but preferably they are the same. For double stranded DNA having a diameter of 3.4nm, a channel size between 3.5nm and 4.5nm is sufficient to allow linear traversal.
As discussed previously, a number of methods may be used to traverse the polymer through the channel and past the interaction stations or signal generation stations. A preferred method according to the invention is to use an electric field. Electric fields can be used to push the polymer through the channel because the polymer is tightened and aligned in the direction of the applied electric field, as has been demonstrated in several studies (Bustamamte, 1991; Gurrieri et al, 1990; Matsumoto et al, 1981). The most closely related experiments with polymer linear cross channels arise from experiments in which an electric field is used to drive polymer molecules through protein channels, as described by Kasiaanowicz et al (1996) and Bezrukov et al (1994), which are incorporated herein by reference. These experiments are briefly described below to illustrate one way to enable linear traversal of the polymer.
In a study entitled "description of the Individual properties of Polynucleotide Molecules when using Membrane channels" [ chromatography of Industrial Polynucleotide Molecules Using Membrane channels]Kasinowicz et al (1996) demonstrated that DNA Molecules translocate linearly across protein channels in a bilayer lipid Membrane under the influence of an electric field (also described in PCT published patent application WO 96/29593). The excerpts are as follows:
we demonstrate that electric fields can drive single-stranded RNA and DNA molecules through a bilayer
2.6nm diameter ion channels in lipid membrane membranes. Since the diameter of the channel can only be adapted
Should the RNA and DNA be single stranded, so that each polymer acts as a local block of the pathway
A straight chain of tracts traverses the membrane.
The assay was performed using staphylococcus aureus hemolysin as a membrane channel. It has a diameter of 2.6nm and can remain clear during straightening, allowing a continuous ionic current to flow through the bimolecular lipid membrane. The assumption is that there should be a block in the ion current as the DNA molecule traverses the channel. The blocking time was recorded using single channel recording. The extent of the blocking time corresponds to the length of the single-stranded DNA molecule that passes through the channel when linear crossing occurs. Initially a potential of-120 mv was applied across the membrane, inducing an ionic current. When single-stranded DNA was added, conduction blocks occurred twice in succession, 30. mu.s and 1300. mu.s, respectively.
This data supports two assumptions: (1) the length of the blocking time (expressed as "lifetime") is directly proportional to the length of the DNA; (2) higher voltage application for a given length of DNA shortened the blocking time, indicating that a linear crossing did occur. As a control. Double-stranded DNA has been shown to be unable to cross the protein membrane.
Similar studies have been performed by Bezrukov et al (1994) with a prorocetin microwell, which reports a title "Polymer counts Moving Through Single Ion channels" [ counting polymers Moving Through Single Ion Channel]. The amectin microwells have an internal diameter of 2 nm. The duration of conduction block is proportional to the length of polymer pushed through the pore, supporting the linear crossing assumption. Results from Kasiaanowicz et al (1996) and Bezrukov (1994) demonstrated that electric fields can drive DNA in a longitudinal mode across protein microwells.
An experiment to demonstrate that DNA can pass through a channel made according to the present invention has been completed. The results of this experiment are shown in fig. 11. The DNA is exposed to the nanochannel in various forms to determine whether it can pass through. Only 50kb of double stranded linear DNA can pass through the array of 4nm nanochannels. Stacked DNA, modeled with round bodies of the same size, cannot pass through the array. Lines 1 and 2 are controls. As expected, circular DNA migrates more slowly than linear DNA. Lines 3 and 4 demonstrate that only linear DNA can pass through the nanochannel array. Since the array cannot be passed by the confluent DNA of about 5nm in diameter, the only way linear DNA can be passed through the plate is in linear mode.
The channels may be made up of lipid membranes as described by Kasiaanowicz et al and in PCT patent application publication WO/96/29593, which is a method of making protein microwells with lipid membranes.briefly, Staphylococcus aureus protein α -hemolysin is added to the cys side of a bilayer lipid membrane.
Reverse movement of DNA is less likely due to differences in the coefficients of friction inside and outside the nanochannel. It is expected that the van der Walls interaction that occurs between the solvated labeled DNA and the interior of the nanochannel will create a higher frictional resistance to that portion of DNA within the nanochannel than in free solution. This is demonstrated by the fact that DNA migration becomes slower in the presence of the nanochannel plate (compare lines 1 and 3 in FIG. 6). The difference in frictional resistance may create a detent mechanism in the desired direction of DNA movement.
Another method of moving polymers in a straight line through an interaction station or signal generation station involves the use of molecular motors. A molecular motor is adevice that interacts with and pushes a polymer through the station. Molecular motors include, but are not limited to, DNA polymerases and helicases. It has been demonstrated that DNA polymerases can effectively function as molecular motors. It is preferred that the inner diameter of the polymerase fragment clamped to the DNA is similar to the inner diameter of double stranded DNA. Furthermore, a large amount of DNA may be able to pass through the slide clamp in a linear fashion.
The β -subunit of DNA polymerase III holoenzyme has an overall structure diameter of 80 angstroms and an internal diameter of about 35 angstroms in contrast to the B-form duplex DNA, where a complete helix (a full turn) is only about 34 angstroms, β -subunit fits around the DNA in a so-called slip clamp mechanism to transmit the processive movement of holoenzyme during DNA replication (processive motion). it is well understood that β -subunit surrounds the DNA during replication to limit processive entry to holoenzyme (Bloom et al, 1996; Griep, 1995; Herendeen and Kelly, 1996; Naktini et al, 1996; Paz-Eliz et al, 1996; Skaliter et al, 1996). since a slip clamp is a holoenzyme's mechanism of plunging, it necessarily means that there is a large amount of DNA that travels linearly through the slip clamp with thousands of bases at one time (Kornberg, 1991).
The preparation of the wall material of the present invention is also encompassed by the present invention. In accordance with the present invention, a method of making a wall material includes covalently bonding an agent to a plurality of discrete locations of the wall material. The agent is bound to the wall material at a discrete location sufficiently close to the interaction station that, when a polymeric individual unit capable of interacting with the agent to produce a signal is located at the interaction station, the agent interacts with the individual unit to produce a signal. These discrete locations may be on the surface of the wall material or within the wall material such that the agent is embedded in the wall material.
Another approach is to have the chemical selectively attach to the edges of the channel through an opaque wall material. The term "opaque" material is used herein to refer to a material that is opaque to a selected wavelength of light.
The wall material is provided with photo-protecting chemical groups attached to the edges of the channels through the wall material. Then, the photo-protecting chemical group is irradiated with light to remove the protection of the chemical group, and a chemical substance is attached to the photo-protected chemical group.
The term "photo-protecting chemical group" is used herein to refer to a photosensitive compound that becomes chemically active upon exposure to light. When light is irradiated to the photo-protecting chemical group, the group is deprotected and is sensitive to interaction with chemical species such as luminescent compounds and quenching compounds.
Even if the photo-protecting chemical groups cover the entire wall surface, the reagent-localized regions can still be prepared. The light can be selectively directed to certain areas of the wall where reagent localization is desired. For example, the light may only impinge on the wall areas around the passage openings, so that only these areas are unprotected from light. When the reagent is added, it will adhere to the wall surface only around those areas around the channel opening.
In addition, a method of making a wall material having a light-emissive localized region on a surface of the wall material is provided. Applying a light-emissive compound to the surface of the wall material so as to produce at least a plurality of light-emissive localised regions on the surface. The light-emissive compound may be applied directly to the surface of the wall material or indirectly to the surface via a photo-protecting chemical group which has been attached to the surface and from which the photo-protection has been removed.
The term "light emission localization area" in this context is the area on the surface of the wall material where the light-emitting compound is concentrated, which is a target area defined around the channel through the wall material for detecting light emission. The localized region can be created in several ways. First, the light-emissive compound may be attached directly to the surface of the wall material, only around the edges of the channel. Second, the light-emissive compound may be attached to a photo-protecting chemical group that has been selectively attached to a localised region around the edge of the channel. Alternatively, the photo-protecting chemical groups may be applied to the entire surface of the wall material or randomly to certain areas of the surface of the wall material, with only selected areas being photo-deprotected with light to form localised regions to which the light-emissive compound can be attached. In forming the light-emitting location area using a mask, both the photo-protecting chemical group and the light-emitting compound may be added to the entire surface of the wall material or randomly to certain areas of the surface of the wall material. A mask having openings can be positioned on the wall surface such that the openings in the mask expose localized areas of the wall surface, particularly around the via openings.
A wall material having a light-emissive locating region on a surface of the wall material may also be prepared by first applying a light-emissive compound to the surface of the wall to produce at least a plurality of light-emissive locating regions on the surface, and then creating a channel in the wall material such that the edges of the channel form a target region inthe light-emissive locating region.
A non-limiting example of a method of making an article having concentric rings of donor fluorophore around each channel is provided to demonstrate the preferred method of the invention. This is achieved by using photolabile protecting groups and light diffraction. A dense layer of covalent bonding agent was coated on one side of the opaque polycarbonate porous media. The bonding agent is protected by a photolabile protecting group. Light is transmitted through the back side of the opaque polycarbonate. Since the wavelength of the deprotected light source (400-500nm) is much larger than the channel size (5nm), each channel functions as a point source. The closer to the channel the greater the intensity of the transmitted light. Thus, only those groups close to the channel are deprotected. In a subsequent chemical reaction, the deprotected group is free to react with the donor fluorophore to produce concentric rings.
The radius of the deprotected concentric rings is controlled, as can be understood from the diffractivity of the light. Long wavelength light and small size channels constitute a very diffractive environment in which the diffraction angle is greater than 90 °. Light cannot penetrate the opaque polycarbonate surface but is forced to diffract through these channels. According to the Huygen principle, each channel acts as a secondary point source, forming spherical radiation. The Huygen principle states that all points on the wavefront can be considered as a point source, producing a secondary spherical wave. After time t, the new wavefront locations will be the common tangent to these secondary waves. The direct result of the Huygen principle is the formation of a point source at the exit end of each channel. A further consequence is that the intensity of the excitation light decreases with increasing distance from the center of each channel.
Both the intensity of the light leaving the channel and the resulting spherical distribution of the intensity of the light can be calculated. The intensity of the light leaving the channel is given as the product of the cross-sectional area of the channel and the intensity of the incident light (10):
P=I0πR2 channelupon exiting the channel, the light becomes a point source of spherical radiation. In this particular case, the light source is limited to emit hemispherical radiation (surface area 4 π r)2). The new intensity of radiation I (r) as a function of the radial distance from the centre of the channel is equal to the intensity of the emitted light of the channel divided by the radiation at a given distance rSurface area:
for a 60W light source 1cm from the opaque polycarbonate, at a distance (R) of 35nm from the center of the channelchannel) The light intensity is from 4.77W/cm2Reduced to 0.43W/cm2This corresponds to a 91% change in intensity. From the above equation, the radius of light around each channel can be precisely controlled by controlling the intensity of the light source.
Photosensitive protecting groups have been described in particular detail (Pilai, 1980.) the available photosensitive protecting groups depend on the type of the corresponding covalent bonding agent (amino, hydroxyl, carboxyl, keto, mercapto, etc.) for example, amino groups can be protected with a Nitroveratroxycarbonyl (NVOC), 2-nitrobenzyloxycarbonyl and α -substituted 2-nitrobenzyloxycarbonyl group the latter two can also be used to protect carboxylic acids and hydroxyl groups the photolytic deblocking of 2-nitrobenzyloxycarbonyl derivatives is direct, requiring only a 350nm lamp and ethanol the time of deprotection is controlled, from 1 hour to 24 hours.
The invention also includes a device for detecting the signal. The device provides support for articles and sensitive elements for detecting signals generated by interactions that occur as the polymer passes through the interaction station. The apparatus includes a housing having a buffer chamber, a wall forming a portion of the buffer chamber and having a plurality of openings adapted to align the polymer, and a sensor secured relative to the housing, the sensor separating signals from each opening from signals from other openings to produce sensor signals that vary with the opening.
The term "opening dependent sensor signal" in this context is a signal generated at the location of the opening in the wall material due to the interaction between the polymer and the station.
The walls within the housing define at least one, and preferably two, buffer compartments. The term "buffer compartment" is herein a region capable of containing a liquid medium. The two buffer compartments may be in fluid communication with each other.
The wall has a plurality of openings defined by channels in the wall. By "plurality of openings" in the wall is meant at least two openings comprising two channels. Preferably the plurality of openings is at least 50 openings.
The term "sensing element" is used herein to refer to a device that responds to a physical stimulus and emits a corresponding pulse in the form of a signal. Sensitive elements include, but are not limited to, optical sensors, temperature sensors, pressure sensors, acoustic sensors, magnetic sensors, electrical sensors, mechanical sensors, radioactive sensors, and motion sensors. A preferred sensing element is an optical sensor. The term "optical sensor" is herein a device capable of detecting an incoming electromagnetic radiation signal and converting it into pulses. The pulses are measurable and can be stored as data. Various optical sensors are well known in the art and include microscopes. The sensor is fixed relative to the housing such that the sensor is capable of detecting a signal generated at the interaction station. It is not necessary to fix or attach the sensitive element directly to the housing.
The term "microprocessor" is used herein to refer to a device that collects and stores the sensor signals. Generally, the microprocessor is a device that contains several electronic components (e.g., ROM, RAM, registers, and I/O control). Conventional microprocessors are well known in the electronics art.
Fig. 12 shows an example of an apparatus constructed to accommodate a nanochannel (or microchannel) plate (120) capable of generating an electric field. The electric field established by the electrodes (128, 130) is used to drive the DNA through the nanochannel. The exemplary nanochannel plate is immersed in a slightly viscous buffer solution that helps slow the rate of polymer travel through the nanochannel to provide a longer signal collection time for each base. Further, on both sides of the plate are electrodes (128, 130) immersed in the buffer solution. The nanochannel plate, buffer layer (122) and electrode combination is contained within an optical glass capsule suitable for image analysis and positionable adjacent to a 60 x 1.4NA oil immersion objective lens.
As discussed above, it is preferred that the electric field be used to drive the polymer linearly through the channel. The use of an electric field is appropriate because the polymer is straightened in a linear orientation in the electric field, which facilitates linear traversal of the nanochannel. In addition, the moving speed of the polymer can be controlled by a voltage. Finally, the electric field does not negatively affect FRET.
Optical microscopy (Bustamante, 1991; Gurrieri et al, 1990; Matzsmoto et al, 1981; Rampino and Chrambach, 1990; Schwartz and Koval, 1989; Smith et al, 1989), Linear Spectroscopy (LD) (_ Kerman et al, 1990; Kerman et al, 1985; Moore et al, 1989), fluorescence detection LD (Holzwarth et al, 1987) and Linear birefringence (Sturm and Weill, 1989; Chu et al, 1990) can all be used to study the transient shape changes of DNA molecules in electrophoresis. In these studies, the DNA exhibited strong orientation and straightness.
Gurrieri et al have demonstrated that DNA molecules take a linear, taut form in an electric field. In each case, the DNA molecules are precisely aligned with the direction of the applied electric field. The method used to view DNA molecules is to use fluorescent labeling of DNA with a video image recognition camera system (Bustamante, 1991; Housearch et al, 1989; Morikawa and Yanagida, 1981; Matsumoto et al, 1989; Yanagida et al, 1983). The DNA molecule displayed was a 164kbp long T2 molecule.
The orientation of DNA in an electric field has been studied earnestly using linear spectroscopic characteristics and electric spectroscopic characteristics (Ding et al, 1972; Yamaoka and Matsuda, 1981; Wu et al, 1981). In fact, the first studies on DNA orientation have been completed with both techniques. The DNA was first studied in solution and then in an electrophoresis gel. Two studies in solution and gel have resulted in similar structures, i.e. the DNA molecules areindeed oriented in the direction of the electric field.
Since the nucleotide bases are preferably oriented nearly perpendicular to the electric field, native DNA exhibits negative UV linear spectroscopic properties. DNA orientation has been attributed to the presence of permanent or guided dipole moments. For example, Ding et al describe the observation of DNA in ethanol diluted tricarboxamate buffer (80% v/v ethanol).
LD data is from a single electrical pulse of 9V/cm. The pulse duration is indicated by a horizontal bar. In the steady state, the read plateau of the LD is close to-1.5, which means that the DNA is oriented in the direction of the electric field (Kerman et al, 1990).
Chrman et al (1990) have completed LD studies on pulsed electric field gel electrophoresis and obtained results similar to those in solution. Kerman provides a plot of LD' as a function of time. LD' stands for orientation by electric field. The value-1.5 means that the DNA molecules are oriented in the electric field. The horizontal bars on the x-axis represent the duration of the electrical pulses. The DNA was in 1% agarose. Immediately after the pulse starts, the LD' curve plateau approaches-1.5, which means that the DNA is oriented immediately after the pulse starts. When the pulse was turned off, the DNA was no longer oriented in the electric field and the LD' curve was no longer maintained at-1.5.
The basis for the orientation of DNA in an electric field is the permanent or induced dipole moment in the DNA. Recall that the dipoles themselves are aligned with the electric field direction to minimize the dipole moment. Hogen et al (1978) have proposed the rationale for inducing dipole moment in DNA associated with anisotropic ion flux:
to explain the spectral characteristics of the electric field, the ionization degree of the medium andthe length of the macromolecule
In the dependence of (c), we propose a new model in which the dissimilarity is separated
The sub-stream generates an asymmetric ion cloud around the polyelectrolyte, resulting in an orienting force
Moment.
The conclusion from the discussion of the alignment of DNA in an electric field is that the DNA molecules or other polymers themselves will orient in the direction of the electric field, whether in an electrophoretic gel or in solution. Solution studies were completed prior to electrophoresis studies. The orientation of DNA in an electric field further supports the linear crossing of nanochannels by DNA molecules and other polymers. The developed orientation of the DNA is also important in the linear traversal of DNA molecules. As described above, electric fields can be used to drive DNA and other polymers linearly through protein channels. The data presented herein reasonably illustrate this prospect and provide a theoretical basis for explaining why DNA behaves as such. Since it has been demonstrated that DNA can linearly traverse protein microwells and that DNA molecules themselves can be oriented in the direction of an electric field, linear DNA traversal through nanochannels can be achieved.
The speed of movement of the polymer is also important, as the duration of the energy transfer is important. The longer the acceptor is in the donor fluorophore layer, the stronger the signal generated. A duration in the order of milliseconds allows providing accurate signal detection. Since the donor fluorophore layer is approximately 40 angstroms, the required polymer movement speed is approximately 40 angstroms/10 milliseconds, i.e., 4000 angstroms/second. In nanochannel FRET quenching, the suggested speed is achieved by controlling the voltage of the applied electric field or the fractional coefficient of the polymer molecules.
The speed of movement of DNA can be determined by giving an equation describing the movement of DNA strands in an electric field: (Tinoco et al, 1995) Where Z is the (dimensionless) number of charges, e-1.6022X 10⁻¹⁹Coulomb, E is the electric field strength (expressed in coulombs per meter), f is the fractional coefficient, expressed in kilograms per second. The speed of movement depends on the magnitude of the electric field strength E, the net charge of the molecule and the size and shape of the molecule characterized by its fractional coefficient f. The net charge on the molecule is assigned by Ze. The fractional coefficient may be determined by: (Tinco et al, 1995)
f=kf0K (6 pi η r) where η is the viscosity coefficient, r is the radius of a sphere of the same volume as the DNA, k is the shape factor (about 1.7 for DNA strands), f0Is the fraction coefficient of spheres having the same volume as the DNA.
Theoretically, it can be seen that either fractional coefficients or electric field strength can be used to control the rate of polymer movement. In a given system, different voltages have different polymer migration rates. Similarly, the larger the molecule or the more viscous the medium in which the molecule resides, the lower the mobility of the molecule. For example, in gel electrophoresis, it is possible to calculate the effects of electric field strength, size of the polymer and fractional coefficient. It is important to understand that a viscous medium, like a gel, can have the desired effect on the fractional coefficient. Since the fractional coefficient is inversely proportional to the electrophoresis speed, doubling the viscosity halves the electrophoresis speed.
Electrophoresis in viscous solvents has been accomplished by a number of groups (Chang and Yeung, 1995; Bello et al, 1994; Juppanan and Riekkoloa, 1994; Klenchen et al, 1991; Harris and Kell, 1985; Korchemnaya et al, 1978). Sahota and Khalledi (1994) demonstrated electrophoresis in formamidone with an experimental description, where the formamidone used has a viscosity of 3.3cP at 25 ℃ and water is added twice (0.89cP, 25 ℃). Electrophoresis is more advantageous than electrophoresis in water in the case of formaldehydeamine because it has a higher dielectric constant than water and can solubilize a variety of supporting electrolytes. In running buffer, it is usually used in a mixture with water. Also, a mixed solution of glycerol solution, N-methyl-2-pyrrolidone, acetic acid and N-methyl-carbaldehyde amine has been used (Korchemnaya et al, 1978). The viscosity distribution is likely to be in a considerable range, from 1cP up to 25cP (Bellow et al, 1994). The actual viscosity of the desired solution depends on the fractional coefficient of the polymer molecules in the nanochannel. The actual fractional coefficient therefore depends on the viscosity and the tribological effect of the nanochannels on the polymer. Due to the pores of the nanochannel, there is a rubbing action between the nanochannel walls and the tagged polymer from solvent entrapment. The magnitude of these solvent traps is similar to those produced by gel electrophoresis. Thus, only slightly viscous solutions can increase the desired polymer migration rate.
For a given electric field, the electrophoretic mobility of polymers of different sizes can be determined from the known relationship between molecular weight and migration distance as follows:
log M ═ a-bx where M is the molecular weight of the nucleic acid and x is the migration distance (proportional to mobility). a and bare constants corresponding to a given electric field.
In general, the moving speed of the polymer in the electric field can be controlled by the electric field, the friction coefficient and the size of the molecules. The desired value of the polymer movement speed can already be determined.
The electric field has no negative effect on FRET. Since energy transfer is associated with electric dipole interactions in close proximity, the presence of an external electric field may adversely affect the ability of the donor-acceptor pair to undergo FRET. As can be seen from the recent studies done with FRET primers and gel-based automated DNA sequencing, the presence of an external electric field has no negative effect on FRET (Glazer and Mathies, 1997; Hung et al, 1996; Ju et al, 1996 a; Ju et al, 1996 b; Marra et al, 1996; Wang et al, 1995). FRET primers are used to label sequencing reaction products because there is a Stoke's shift and therefore a large fluorophore difference is generated. In these experiments, FRET-labeled DNA fragments were still gels, while these fragments were detected with a CCD camera and laser in the presence of an electric field. Either a four color capillary electrophoresis system or an Applied Biosystems373A sequencer can be used. These experiments indicate that energy transfer occurs in the presence of a strong electric field.
An exemplary design of a nanochannel device is shown in fig. 13, the device comprising two molten Pyrex glass compartments (132, 134) housing nanochannel plates (140). The upper and lower buffer zones (136, 138) are contained in the smaller Pyrex compartment (134) and the larger Pyrex compartment (132), respectively. The two buffer zones are sealed with a cover glass, which has been modified with Indium Tin Oxide (ITO). Indium tin oxide is a transparent conductor that functions as an electrode (142) in this system. The pair of electrodes are connected to a voltage regulated power supply (152) including a load resistor RL(the resistance is about a few G in order to approach a constant current system) and a varistor (which controls the voltage from the power supply). The voltmeter is connected in parallel in the circuit. An oiled (144) immersion objective (150) is under the cover glass for detecting fluorescenceAn optical signal (148).
A polymer is added to the upper buffer zone and an electric field is used to drive the polymer towards the chamber. The buffer solution has satisfactory viscosity and electrolytic performance. It is possible to accomplish surface illumination and signal acquisition through the same oil immersion objective (60 ×, 1.4 NA). The dimensions of the device are similar to the slide dimensions of a conventional microscope (75mm by 25mm) to facilitate mounting. The gap between the nanochannel plate and the cover glass was 0.4 mm. A thin cover glass of 0.1mm thickness is shown. These dimensions are preferred because objectives with long working distances are available. For example, CFI from Nikon60The system has a 60 x, 1.4NA objective that can study samples over 0.6mm thick.
The temperature control block is used to prevent joule heating and temperature fluctuations. The control block is hollow to provide uniform temperature control for the nanochannel device. There are inlets and/or outlets on both sides of the device to allow coolant to circulate through the chamber.
Several groups have used specialized devices for fluorescence microscopy for electrophoresis (Rampino and Chrambach, 1991; Matsumoto et al, 1981; Smith et al, 1989; Bustamante, 1991; Gurrieri et al, 1990; Schwartz and Koval, 1989; Smith et al, 1990). Smith et al (1990) used to observe DNA molecules subjected to pulsed electric field gel electrophoresis as follows:
a20. mu.l drop of fused agarose was placed in two pieces of microscope cover glass (24mm in a single line)
24mm) and cooled for 10 minutes. Placing the sandwich combination in a standard display
The top of the micromirror slide was sealed with nail polish at the four corners. The slide glass is previously
The preparation is ready and the four angular electrodes are fixed on the glass slide by epoxy adhesives.
The device was then refrigerated at about 5 ℃ for 30 minutes. Melting the agarose
Dropping on the electrode to complete the electrical linkage, and adding TBE buffer (0.5X) at intervals
To keep it wet.
Rampino and Chrambach (1991) describe a more complex device with a large buffer zone, platinum strip electrodes and coolant flow zone. The entire apparatus may be mounted on the stage of a microscope. In fact, the gel itself is sandwiched between two pieces of cover glass and placed in the center of the device, in contact with the buffer blocks on both sides. The design allows for uniform electric field and temperature control. In contrast to the above devices, the Rampino and Chrambach devices are designed for standard pulsed electric field-free gel electrophoresis.
In the following it is briefly described how the device of the invention (shown in FIG. 13) is related to a polymer. The polymers (e.g., DNA) are labeled (exogenously or internally) by the methods of the invention or by methods known in the art. The labeled DNA is placed in a buffer solution, which is preferably slightly viscous. The buffer is added to the upper buffer compartment (136). The electrodes are used to establish an electric field that causes the DNA to enter the nanochannels on the nanochannel plate (140) in a linear fashion. When the labeled polymer emerges fromthe other side of the nanochannel plate, the label is caused to interact with the reagent, i.e. the environment surrounding the channel, producing a signal, i.e. a pulse that varies with the polymer, which pulse signal is detected by means of the detection device. The detected signal, i.e. the pulse which varies with the polymer, is stored and processed in order to reveal information about the structure of the polymer.
A final aspect of the invention includes methods of preparing nucleic acids for use in the methods of the invention, as well as for any other application where it is desirable to utilize randomly labeled nucleic acids. The method comprises the following steps: contacting the cleaving cell with a nucleotide analog; isolating cellular nucleic acid that has been combined with the nucleotide analog; the variation of the nucleic acid with which the nucleotide analog has been incorporated is induced by labeling the incorporated nucleotide analog. The term "nucleotide analog" herein is a molecule that can replace A, T, G or C and has an improved structure. For example, nucleotide analogs include, but are not limited to, brominated analogs, 2, 4-dithiouracil, 2, 4-selenouracil, hypoxanthine, mercaptopurine, 2-aminopurine, and selenoprourine. The incorporated nucleotide analog can be labeled with an agent selected from a light-emitting compound, a quenching source, or a fluorescence excitation source.
The cell being cleaved is "contacted" with the nucleotide analog by any means known in the art for incorporating nucleotides into living cells. For example, the nucleotide analog can be added to a cell culture medium and taken up naturally by the cell. To optimize uptake of the nucleotide analogs, the growth of the cleaving cells can be inhibited by conventional means prior to addition of the nucleotide analogs, and once the nucleotide analogs are added to the medium, the inhibition is removed to allow the cells to re-enter the cell cleavage cycle. The nucleic acid that has been combined with the nucleotide analogs is then isolated after the cells have re-entered the cell cleavage cycle and completed at least one cleavage cycle.
In Bick and Davidson, the journal of the national science research institute of america [ proc.nat.acd.sci., 71: 2082-2086(1974)]An example of a method for incorporating nucleotide analogs into DNA is provided. Bick and Davidson let BrdU-dependent cell lines B4Growth was carried out in Dulbecco's modified Eagle Medium basal growth medium supplemented with 10% fetal bovine serum (E medium) containing 0.1mM BrdU. Tissue culture dishes of 100mm Falcon plastic 106Each B4 cell was seeded in E medium (E-HAB medium) containing 0.1mM hypoxanthine, 0.4. mu.M aminopurine and 10. mu.M BrdU, and the cells were allowed to stand at high density (5X 10 per 100mM dish) for an entire 6-week period5Individual cells) were passed 3 times in E-HAB medium. Then, the cells were placed in E-HAB medium at low density (1000 cells per 6mm dish), and approximately 10 large colonies were observed in each culture dish after 3 weeks. Cells from one dish were harvested and retained as a new series of cells named HAB. Because BrdU-containing cells have desirable photosensitizing properties, HAB cells are protected from ambient light at all times. After 10 cell generations in E-HAB medium, aliquots of HAB cells were transferred back to E-medium. A new subset of cells designated HAB-E (the newsbline of cells) was isolated and retained in E medium.
Bick and Davidson allowed the cells to be addedAdd H3 32PO4(New England Nuclear, New England Nuclear Corp.) in the above medium at 2 u Ci/ml radioactivity. After doubling of 2 to 3 populations, as in Davidson and Bick, the national science research article in usa [ proc.nat.acad.sci., 70: 138-142(1973)]The cells were harvested and the DNA isolated as described in (1) except that after the first phenol extraction the DNA extract was routinely treated with 50. mu.g/ml RNase A at 37 ℃ for 60 minutes. After the second phenol extraction, the DNA was extensively dialyzed against 10mM Tris-HCl, 10mM pH7.6, 1mM EDTA, followed by a final dialysis against 10mM Tris-HCl, pH7.6, 1mM EDTA. Another method of isolating DNA is known in the art. (see, e.g., Sambrook et al, "Molecular Cloning-A laboratory Manual", 2nd edition 1989, published by Cold Spring Harbor laboratories [ Molecular Cloning: A laboratory Manual, 2nd edition, Cold Spring Harbor laboratory Press, 1989])。
The method for preparing a nucleic acid of the present invention is hereinafter preferred as a method for specifically labeling a base in vitro (IBSA). IBSA involves culturing cells derived from a subject in the presence of a nucleotide analog. The nucleotide analogs can either be subsequently chemically denatured, have a high molar extinction coefficient in the donor emission wavelength, or have a bonding agent suitable for attachment of an acceptor label. The most important analogs are those that contain functional groups that do not interact with base pairs during DNA replication. 8-substituted purines, 5-substituted pyrimidines and 6-substituted pyrimidines meet this criterion.
A non-limiting example of an IBSA plan is set forth in detail below. The outline of the method is shown in FIG. 14 and includes various steps from initial isolation of DNA, to labeling of the genome, to final sequencing analysis. The cells are isolated from the subject and then cultured. Cells are captured in the cell cycle when there are enough cells to provide the appropriate genetic material. The capture may occur at any time in the cycle as long as it does not interrupt the S-phase. Nucleotide analogs that are easily chemically derivatized (e.g., 8-bromo-2' -deoxypurine and 5-bromo-2-deoxypyrimidine) are added to the growth medium. The cells are then allowed to grow for one cycle and genomic DNA from the cells is isolated. The resulting DNA is a chimera of labeled and unlabeled DNA, a product of semi-retained replication. The advantage of labeling only one strand of DNA among these is that this will render the product duplex DNA useful in the sequencing method of the present invention.
Genomic DNA was fragmented to approximately 100kb in length. At this point, the genomic DNA is chemically and terminally labeled. The advantage of culturing the cells in brominated analogues is that one induced variation activates the base to induce further variation, adding the receptor label to the base. There are approximately 3 million fragments for the human genome. These fragments can be analyzed simultaneously by means of the sequencing method of the invention. Fragments of similar size and potential order are grouped and population analysis is performed to generate DNA sequence information. Sequencing of the genome can take about 6 hours to complete. The time required from isolation of the subject's cells to the end of sequencing is approximately l weeks. The following paragraphs will detail each individual step.
The first step is cell culture and cell cycle arrest. The purpose of cell cycle arrest is to generate a synchronized cell population that can undergo DNA replication simultaneously to ensure that all product DNA will be chimeras of labeled and unlabeled DNA. There are a number of methods for synchronizing cells, including methods that arrest cells in the M or S phase. Only disruption in M phase can produce the desired genome chimera. Examples of metastable phase inhibitors include pressurized nitrous oxide, vinblastine (Marcus&Robbins, 1963), and decarbonylcolchicine. Decarbonylation of colchicine leads to cell arrest in the metastable phase, but may be reversed by refreshing (Mitchison, 1971; Kato&Yoshida, 1970; Stubblefield, 1968). Cells were grownin decarbonylcolchicine for several hours, resulting in synchronized cultures (Wunderlich&Peyk, 1969). Pressurized nitrous oxide is advantageous in that it is easily removed (Rao, 1968). Removal of the blocking and addition of the required brominating base analog allows for simultaneous entry into the S phase.
Nucleotide analogs that can be used include, but are not limited to, 8-bromo-2 '-deoxyadenosine, 8-bromo-2' -deoxyguanosine, 5-bromo-2 '-deoxycytidine, and 5-bromo-2' -deoxyuridine. These brominated nucleotide analogs are activated to couple to nucleophiles (Traincard et al, 1983; Sakamoto et al, 1987; Keller et al, 1988; Hermanson, 1996). The coupling of the amine-containing acceptor label and fluorophore to the base analog is performed at ambient temperature (35 ℃). The final position of the acceptor label renders the base pairing of the labeled fragment unaffected.
Brominated nucleotide analogs can be purchased commercially (Sigma, Fluka, Fisher Scientific, Inc.) or prepared by reaction with a brominating reagent. Hermanson (1996) proposed a memo for brominating DNA at thymidine, cytidine and guanosine using N-bromosuccinimide (NBS). Adenine is prepared by other methods that do not require NBS. For example, 8-bromo-2 '-deoxyadenosine and 8-bromo-2' -deoxyguanosine may be synthesized by reacting the natural bases with aqueous bromine (Ikehara et al, 1969 a; Ueda et al, 1974; Faerber&Scheit, 1971; Kochetkov et al, 1968). Bromination at the 8-position of purines can also be achieved by means of the nucleotide morpholinamide (Lang et al, 1968; Ikehara et al, 1969 b). The solvent conditions for bromination are particularly important. Bromination of 2 '-deoxyadenosine does not occur in dimethylformamide at 0 ℃, but the reaction proceeds in glacial acetic acid at 50-60 ℃ and 8-bromo-2' -deoxyadenosine is relatively easily formed (Gueron et al, 1967; Rahn et al, 1965).
Brominated and other base analogs have been shown to be efficiently incorporated into genomic DNA during cell culture (Balzarini et al, 1984). One specific example is the incorporation of 5-bromo-2' -deoxyuridine into cells for flow cytometry. 5-bromo-2' -deoxyuridine is incorporated into newly synthesized DNA at the adenosine position (Crissman et al, 1990; Poot&Hoehn, 1990; Bohmer, 1990; Gaines et al, 1996; Nicolas et al, 1990). The percentage of Substitution of base analogues can be very high, as disclosed by Bick and Davidson in their report "complete replacement of Thymidine by brominated deoxyuridine in a DNA Cell Line associated with brominated deoxyuridine" [ Total Substition of Bromodeoxyuridine for Thymidine in the DNA of Bromodeoxyuridine-Dependent Cell Line](1974). The following paragraph was taken from this report:
to obtain complete substitution, BrdU-dependent cells were incubated in the absence of added adenosine …
Exposure to a composition comprising aminopterin, a potent inhibitor of adenosine biosynthesis and BrdU
In the culture medium of (1). We report here the isolation of a series of cells, in which
At least 99.8% of the adenosine in nuclear DNA in the cell series has been replaced by BrdU.
In the currently proposed schemes of randomly labeling bases, a percentage of substitution as high as 99.8% is not necessary, but this data gives us an insight into the possibility of cells merging with base analogues. Other brominated base analogs can also be incorporated relatively easily into mammalian cells (Stewart et al, 1968). Several examples of bromine-free base analogs that have been incorporated in this manner include 2-aminopurine (Glickman, 1985), 5-propynyloxy-2 '-deoxyuridine, and 5-ethynyl-2' -deoxyuridine (Balzarini et al, 1984).
After production of the appropriately brominated DNA chimera by cell culture, the chimeric genomic DNA is prepared for analysis by performing several steps, including an optional chromosome classification step. Localized digestion of chromosomes from the flow sort can produce 100kb DNA fragments. Optional flow sorting procedures are described in detail in numerous handbooks and textbooks (de Jong et al, 1989; Fawcett et al, 1994), and will not be discussed in detail here. Briefly, cells were arrested in the metastable phase by addition of decarbonylcolchicine. Millions of cultured cells are slowly lysed, releasing the metaphase chromosomes into the suspension buffer where they are stained with one or more fluorescent dyes. They are then identified by means of the fluorescence emission map of the target chromosome using one fluorophore in a one-beam system or two fluorophores in a two-beam detection system. Then, the sorted chromosomes were prepared and the local enzymatic hydrolysis was performed according to the proposal of Glover and Hames (see DNAcloning 3, 1995). Thereby obtaining a size of about 100 kb.
Labeling of the brominated DNA with a fluorophore can be performed before or after enzymatic digestion. Base bromination will activate base nucleophilic displacement. There are many fluorophores that can be used that have amino/hydrazine groups, including popular dyes, fluorescein, coumarin, tetrabromofluorescein, rhodamine, and texas red (molecular probes, OR). These both absorb and emit visible light. In these fluorophores the amino group reacts chemically with the 8 th position of the purine and the 5 th position of the pyrimidine. Experimental recommendations for displacement reactions were made by Hemanson in 1969. The improvement of the labeling scheme introduced therein is as follows:
suggestions for labeling brominated DNA:
1. dissolving the hydrazine or amine coupled fluorophore in water at a concentration of 80mM to
100mM;
2. Add 25 μ l fluorophore solution to the bromine activated DNA solution;
3. reacting at 50 ℃ for 1 hour;
4. purification was accomplished by ethanol precipitation, adding 20. mu.l of 4M LiCl and 500. mu.l
Ethanol (cooled to-20 ℃), and mixing well.
5. Stored at-20 ℃ for 30 minutes and then centrifuged at 12,000g
Separating the precipitated DNA;
6. removing the suspending agent and washing the pellets with 70% and 100% ethanol each time
After the secondary washing, the cells were centrifuged. The labeled DNA pellets were redissolved with water and stored at-20 ℃.
Localized digestion from the genome can form approximately 3 thousand fragments of 100 kb. These fragments are end-labeled either by terminal transferase or by complexation, in order to classify these labeled polynucleotides. The fluorescent labels incorporated by end-labeling can be uniquely identified by different spectral absorption coefficients or by a particular labeling sequence (when using a complexation scheme). After end labeling, the prepared DNA undergoes nano-channel FRET sequencing as described above. Data is sorted by fragment size and potential order. DNA sequences were generated by population analysis.
FIG. 15 gives a general scheme for interpreting DNA order in terms of IBSA markers. A sample of genomic DNA has two bases which are labeled (in this case A and C). The end and middle labeled DNA fragments were analyzed by FRET sequencing. The data obtained is sorted by fragment size and potential order. The underlying sequence is defined as a sequence-specific FRET signature generated for a particular DNA fragment. The potentialorder does not give sequencing information, but allows unique identification of the DNA molecule. Population analysis was performed in order to determine the location of a and C on each fragment. Pairing the complementary chains. The method for determining the base position is repeated for only one base (A). The data obtained for one labeled base and two labeled bases are compared to generate a DNA sequence.
Fragments of hundreds to thousands of bases are not always required for sequencing. Expression profiles and sequencing of individual genes require much shorter marker fragments. The generation of relatively short marker fragments can be achieved by nick decoding, primer extension (primer extension) and Polymerase Chain Reaction (PCR). In addition, smaller fragments can also be analyzed by modification of the Sanger reaction and the use of terminal transferase. Large nucleotide analogs can often be incorporated using enzymatic methods (Hemanson, 1990).
In primer extension, modified nucleoside triphosphates are added to a DNA template in which the amount of primer required is as specified. The polymerase used is in the form of Klenow fragment which lacks the 5 '-3' exonuclease activity of intact E.coli DNA polymerase I (Kessler et al, 1990; Feinberg and Vogelstein, 1983, 1984). Equivalent enzymes are the sequencing enzyme (Sequenase)2.0 and T7 polymerase. This method is a simple method for preparing target DNA with an internal label. Large DNA fragments with internal markers of greater than 10kb in length have been synthesized using this method using nucleotides substituted with a modified base. The proposed digest involved the use of the sequencing enzyme 2.0 (Amersham). The annealing reaction consisted of 1. mu.l of primer (0.5 pmol/. mu.l), 2. mu.l of sequencer enzyme buffer (5X), 5. mu.g of plasmid DNA and 10. mu.l of sterile distilled water. After incubation in a 65 ℃ water bath for 2 minutes, annealing was allowedto occur at 30 ℃ for 30 minutes. The actual reaction mixture was composed of 10. mu.l of annealing reaction (primer-template), 1. mu.l of dithiothreitol (0.1M), 1. mu.M of each dNTP, 0.1. mu.M of fluorophore dNTP and 0.025U/. mu.l of sequencing enzyme. After mixing, the reaction was allowed to proceed for 15 minutes at room temperature.
Ambrose et al (1993) and Harding&Keller (1992) have used experimental instructions to synthesize large fluorescent DNA molecules using primer extension. In their experiments, complete substitution of one pyrimidine with fluorophore analogues was achieved on DNA longer than 7 kb. These authors have reported fluorescent DNA between 5-7kb in length, where two pyrimidines are fully labeled. The synthesis of large fragments has also been accomplished using other unusual base analogs (e.g., 7- (2-oxoethyl) guanine, 2 '-amino-2' -deoxycytidine, 8-oxopurine, and N-4-aminocytidine) (Barbin et al, 1985; Purmal et al, 1994; Aurup et al, 1994; Negishi et al, 1988).
Nick coding takes advantage of the ability of E.coli DNA polymerase to combine the sequential addition of nucleotide residues at the 3 '-hydroxyl end of a nick [ generated by pancreatic deoxyribonuclease (Dnase) I]with the removal of nucleotides from the adjacent 5' -phosphoryl end (Meinkoth&Wahl, 1987; Rigby et al, 1977; Langer et al, 198 l; Holtke et al, 1990). Many modified bases have been incorporated by nick coding (Meffert&Dose, 1988; Gebeyehu et al, 1987; Gillam&Tener, 1986). DNA polymerase I causes breaks as rapidly as they are formed in order to be filled in, thereby incorporating the required nucleotides into the original strand. Since a certain number of labeled nucleoside triphosphates are present during the reaction, the label is incorporated, resulting in modification of the parent strand. Nick coding involves a double stranded DNA target, 1. mu.l DNAse at a concentration of 2ng/ml, 1. mu.l each of the three types of unlabeled deoxynucleoside triphosphates (dNTPs concentration 100. mu.M), 1. mu.l labeled dNTPs (300. mu.M), 32. mu.l water and 1. mu.l of a mixture comprising 5 to 10 units of a radioactive DNA polymerase. The reaction was carried out at 15 ℃ for 1 hour. The reaction was quenched with 4. mu.l of 0.25M DETA, 2. mu.l of 10mg/ml tRNA and 150. mu.l of 10mM Tris (pH 7.5). The labeled DNA was purified by ethanol precipitation (Bethesda research Laboratories, New England Nuclear, and Amersham [ Bethesda research Laboratories, New England Nuclear, and Amersham]).
Direct labeling with PCR not only incorporates the desired DNA into the target DNA, but also amplifies the amount of labeled DNA (Saiki et al, 1985, 1988). PCR uses a thermostable DNA polymerase, most commonly Taq polymerase from Themus aquaticus. Taq polymerase has the ability to incorporate a label into a growing DNA copy in each PCR cycle. In this way, DNA fragments up to 3kb in length can be labeled. Wieman et al (1995) introduced a method of labeling PCR products internally with fluorescein-15-dATP, a proposal that can be applied to other fluorophores. The reaction mix for PCR pooling of fluorophores included 1. mu.M each primer, 1. mu.M each dNTP, 10. mu.M fluorophore-dNTP and 0.025U/. mu.l Taq polymerase (Perkin-Elmer, Norwalk, CT). The reaction buffer comprises 10mM Tris-HCl (pH8.3), 50mM KCl, 1.5mM MgCl2And 0.01% (wt/vol) gelatin. PCR was completed in 30 cycles.
Sequencing reactions generated by the Sanger method can also be analysed by enzyme labelling. Each chain end fragment carries a 3 'and 5' fluorophore tag. The 5 'fluorophore is incorporated as part of the primer and the 3' terminal label is added via terminal transferase. Terminal transferase labeling was originally induced by a radiolabeled nucleoside triphosphate (Roychoudhury et al, 1979; Tu)&Cohen, 1988). This technique was later applied to non-radioactive nucleotide analogs (Kumer et al, 1988). This technique involves adding the target DNA to (a) 20. mu.l of 0.5M potassium cacodylate, 5mM CoCl21mM DTT (pH 7); (b)100mM modified deoxynucleoside triphosphate, 4. mu.l 5mM dCTP and 100. mu.l water. Terminal transferase was added to a final concentration of 50 units in the reaction mixture and reacted at 37 ℃ for 45 minutes (Hermanson, 1996).
A double labeling procedure may also be used. In this method, base analogues with a linker arm suitable for binding to a fluorophore were initially incorporated into DNA using the method described above. Subsequent bonding of the fluorophore to the linker arm is possible using covalent linkage techniques such as those described by waggon (1995). Jett et al have experimentally demonstrated the full length synthesis of M13DNA (7250kb) including the complete incorporation of one of 5- (3-aminopropynyl) -dCTP, 5- (3-aminoallyl) -dCTP or 5- (3-aminoallyl) -dUTP. Covalent bonding of the fluorophore to the linker is also demonstrated. The advantage of this technique is that the label need not consist of individual fluorescent molecules, but can be a relatively large molecule with more dye. Examples of such include phycobiliproteins, dye-filled microspheres, labeled proteins, or fluorescently labeled chains.
Each of the patents, patent applications, and references mentioned above are incorporated herein by reference in their entirety. Having thus described the presently preferred embodiments in accordance with the present invention, it is believed that other modifications, variations or changes will be suggested to those skilled in the art in light of the above teachings. It is, therefore, to be understood that all such variations, modifications and changes are believed to fall within the scope of the present invention as defined by the appended claims.
Reference to the literature
1. "analysis of DNA Structure mechanics during gel Electrophoresis by Linear Spectroscopy", Akerman, B, Jonsson, M, Moore, D, and Schellman, J.1990. structural dynamics of DNA degradation gel Electrophoresis, by linear chromatography, In Electrophoresis of Large DNA molecular Electrophoresis, published In 1990 by Acemann B.et al [ Large DNA molecular Electrophoresis], et al [ Akerman, B., Jonsson, M., Moore, D., and J.1990]gel Electrophoresis], In Electrophoresis, of Large DNA Molecules (Lai, E., and Birren, B.W., Eds], Cold spring Harbor Laboratory Press, New York]
2. "electrophoresis orientation of DNA by Linear Spectroscopy" published in 1985 by Acemann B.et al [ Akerman, B., Jonsson, M., and Nord en.1985. electrophoretic orientation of DNA detected by linear spectroscopy.J.chem.Soc.D.chem.Commun.422]
3. "Low illumination-Slow scanning Detector Performance in bioactive fluorescence Detector" published in Ecampsis R.1992 [ Aikens, R.1992.Properties of Low-light level slide-scan detectors in Fluorescent and luminescence Probe for Biological Activity Mason, W.T. (Ed.) Harcortex Brace&Company, Cambridge, England]
4. Allen m.j. et al, "scanning microscope" published in 1991 [ Allen, m.j., Balooch, m., Subbrah, s., Tench, r.j., Sickhaus, w., and Balhorn, r.1991.scanning microsc.5: 625.]
5. Ambuis w.p. et al, "use of DNA sequencing and determination with single molecules", 1993 [ Ambrose, w.p., Goodwin, p.m., Jett, j.h., Johnson, m.e., Martin, j.c., marron, b.l., schecker.j.a., Wilkerson, c.w., and Keller, r.a.1993.application of single-molecule detection DNA sequencing and analysis, beer.bunsengs.phys: chem.97: 1535-1542.]
6. "multicolor fluorescence imaging system for tissue diagnosis" published in 1990 by Anderson-Engers, S. et al [ Andersson-Engels, S., Johannson, J., and Svanberg, S.1990.multicolor fluorescence imaging systems for tissue diagnosis. Proc. SPIE-Bioimaging. two-Dimenss. Spectrosec.1205: 179-89.]
7. European pu h. et al, 1994, the literature on "nucleic acids research" stage 22 [ Aurup, h., Tuschl, t., Benseler, f., Ludwig, j., and Eckstein, f.1994.oligonucleotid duplex binding 2 '-amino-2' -deoxypeptides: thermal stability and chemical reactivity nucleic Acids res.22: 20-4.]
8. Azz E. et al 1993 published in "European journal of biochemistry" at 217 [ Arts, E., Kuiken, J., Jager, S., and Hoekstra, D.1993.fusion of aromatic membranes with a macromolecular ligand reaction.specific volume of the equivalent section after odor reaction.Eur.J.biochem.217: 1001-9.]
9. "hybridization methods for DNA sequencing", published in journal of "genome" of phase 11, Bains, W.1991, hybridization methods for DNA sequencing, genomics, 11: 294-301.]
10. "hybridization for DNA sequencing", published in Baens W.1991 [ Bains, W.1997.hybridization for sequencing of DNA. in Molecular Biology and Biotechnology, R.A.Meyers, Ed.VCH Publishers, New York]
11. Bosareni j, et al, published in 1984 in "journal of biochemistry" at stage 217 [ Balzarini, j., De Clercq, e., Ayusawa, d., and Seon, t.1984.thymidylate synthesis determination use FM3A a mammalian specific cell line as a tool for interpreting the thymidylate synthesis pathway and the biochemical analysis of height sensitive intermediates in cell dna. biochem.j.217: 245-52.]
12. Baker, A. et al, published in 1985 in the literature "cancer research" [ Barbin, A., Laib, R.J., and Bartsch, H.1985.Lack of misting properties of 7- (2-oxoethyl) guanine, the major vinyl chloride-DNA addition. cancer Res.45: 2440-4.]
13. Belo et al, electrophoresis, 15 [ Bello, M.S., de Besi, R, Rezzonio, R., Righetti, P.G., and Paraspirhi, E.1994.Electrosomosis of polymer solutions in fused silica capsules, Electrophoresis 15: 623-6.]
14. Beslukov et al, Nature 370 [ Bezrukov, S.M., Vodyanoy, l., and Parsegian, V.A.1994.counting polymers moving through a single ion channel. Nature.370: 279.]
15. Bibk et al, published in 1974 in "research in science", and Davisdon, r.l.1974.total subsystem of brosoxyuridine ffer thymidine in the DNA of brosoxyuridine-dependent cell line, proc.nat. acad.sci.usa.71: 2082-2086.]
16. Bignold, L.P.1987.A novel polycarbonates (Nuclear) membranes standards chemises, unaffected by chemises, in the Boyden chamber J.of immunological methods.105: 275-280.]
17. Brumol et al, 1996, published in the literature in the journal of biochemistry, stage 271 [ Bloom, L.B., Turner, J., Kelman, Z., Beechem, J.M., O' Donnell, M., and Goodman, M.F.1996.dynamics of loading the beta amplification clamp of DNA polymerase on DNA.J.biol.chem.271: 30699-708.]
18. Burk et al, 1985, published in journal of tissue biochemistry and cell biochemistry at stage 33 [ B ō ck, G., Hilchenbach, M., Schauenstein, K.and Wick, G.1985.Photometric analysis of anti-pollution reagens for immunology with laser and environmental analysis sources.J.of Histochemistry and chemistry 33: 699-705.]
19. Bermormor R published in 1990 in<methods of cell Biology>stage 18 [ B ō hmer, r.1990.cell division analysis using branched oxyuridine-induced compression of Hoechst 33258 fluorology. methods in cell Biology 18: 173-84.]
20. Bruno et al, 1995 [ Bruno, G., Capezzuto, P., and Madan, A.1995.plasma deposition of amorphous silicon based materials. academic Press, Boston.]
21. Battman was published in 1991 in the literature at<biophysical>stage 20 [ bustamate, c.1991. direcbservation and management of single DNA molecules using fluorescence. microprocessor. annu. rev. biophysis. chem.20: 415-46.]
22. Berman et al published in 1992 at<scan>stage 14 literature [ Buurman, e.p., Sanders, r., Draaijer, a.vanveen; j.j.f., Houpt, p.m., and Levine, y.k.1992.fluorescence lifetime imaging using environmental laser scanning 14: 155-59.]
23. Candel et al published 1992 in<genome>phase 13 literature [ Cantor, c.r., Mirzabekov, a., and Southern, e.1992.report on the sequencing by hybridization works, genomics, 13: 1378-1383.]
24. Karst lo et al 1995 published a document of<analytical chemistry>at stage 67 [ Castro, a.and sheaa, e.b.1995.single-molecule electrophoresis.anal.chem.67: 3181-3186.]
25. Paper et al 1995 published a document of<electrophoresis>at stage 16 [ Chang, H.T.and Yeung, E.S.1995.dynamic control to electrophoretic the separation operator in capillary electrophoresis. electrophoresis.16: 2069-73.]
26. Chen et al 1996 published literature at<analytical chemistry>stage 68 [ Chen, D.and Dovichi, N.J.1996.Single-molecule detection in renal electrophoresis: molecular shade root as a fundamental limit to chemical analysis, anal. chem.68: 690-696.]
27. Chu et al published in 1986 at<science>at No. 234 [ Chu, G.Vollrath, D., and Davis, R.W.1986.separation of large DNA molecules by consistent-clamped homology electric fields.science 234: 1582.]
28. Churgil et al published in 1988 at<science>stage 240 [ Church, g.m. and Kieffer-Higgins, s.1988.multiple DNA sequencing.science 240: 185-88.]
29. Clark et al, 1993, at<analytical biochemistry>stage 210 [ Clark, l., MacManus, j.p., Banville, d., and szabo, a.g.1993.a study of sensed lanthanide luminescence in an engineered calcium-binding protein.anal.biochem.210: 1-6.]
30. Krake et al, 1991, published in<journal of international optics, uk, 1640 [ Clegg, r.m., feddesen, b., Gratton, e., and Jovin, t.m.1991.time-resolved imaging microscopicity, proc.spie-lnt.soc.opt.eng.1640: 448-460.]
31. Kleker et al published 1992 at<methods of enzymology>at stage 211 [ Clegg, R.M.1992.fluorescence research and nucleic acids. methods in enzymology.211: 353-379.]
32. Krake et al 1993 published under the proceedings of the national institute of science of america at phase 90 [ Clegg, r.m., murchiee, a.l.h., Zechel, a., and Lilley, d.m.j.1993. observation of the magnetic geometry of double-stranded dna in solution by nuclear resource analysis reaction transfer. proc.natl.acad.sci.usa.90: 2994-98.]
33. Cleak published in 1995 in the document at<current biotechnology view>at phase 6 [ Clegg, r.m.1995.fluorescence science existence transfer. curr. opin. biotech.6: 103-110.]
34. Curson et al published in 1974 literature on<biochemistry and biophysics>at stage 340 [ Colson, p., Houssier, c.and fredericq, e.1974.biochim. biophysis. acta 340: 244-61.]
35. Creelin 1990 published literature at phase 9<review of mass spectrometry [ Crain, p.f.1990.mass spectra. rev.9: 505-54.]
36. Krisman et al 1990 published the literature on<methods of Cell Biology>at stage 33 [ Crissman, h.a.and Steinkamp, j.a.1990.detection of branched oxouridine-labeled cells by differential fluorescence of dna fluorochromes. methods in Cell Biology 33: 199-206.]
37. Kudaler et al, 1983,<Fluorescence microscopy in Biochemistry and biology>[ Curdall, R.B. and Date, R.E. (1983.) Time-Resolved Fluorescence Spectroscopy in Biochemistry and biology. plenum, New York.]
38. The poetry published in 1975 "film of solid surface: physics and chemistry of physical absorption "[ Dash, j.g.1975.films on solid surfaces: the physics and chemistry of physical adsorption. academic Press, New York]
39. Davis et al published in<los Alamos science>at stage 20 in 1992 [ Davis, l., Fairfield, f., Hammond, m., hager, c., Jett, j., and Keller, r.1992.rapid DNA sequencing based on single-molecule evaluation. los Alamos science.20: 280-6.]
40. Davis et al 1991 published under No. 8<practical genetic analysis techniques>[ Davis, l.m., Fairfield, f.r., hager, c.a., Jett, j.h., Keller, r.a., Hahn, j.h., Krakowski, l.a., marron, b.l., Martin, j.c., Nutter, h.l., raltiff, r.l., Shera, e.b., Simpson, d.j.and Soper, s.a.1991. gene.anal.appl.8: 1-7.]
41. Derjon et al published in 1989 at<cytogenetics>51 (De Jong, p.j., yokobatata, k., Chen, c., Lohman, f., Pederson, l., McNinch, j.et al 1989. cytogene.cell gene.51: 985.]
42. Et al, 1972, published on<biopolymer>phase 11 [ Ding, d.w., Rill, r.and Van holder, k.e.1972.biopolymers 11: 2109-2124.]
43. Duster published in 1988 under The term "remote sensing" at 924 [ Dozier, J.1988 HIRIS-The high resolution imaging spectrometer. Proc. SPIE-Recent adv. Sensors, Radiometry Data Process. remote Sens.924: 10-22.]
44. Delmar et al published in 1989 on<genome>stage 4 [ Drmanac, R., Labat, l., Brukner, l., and dCrkvenjakov, R.1989.sequencing of megabase plus DNA by hybridization: the order of the method.genomics 4: 114-128.]
45. Delmar et al 1994, "Automated Sequencing and analysis of DNA sequences" [ Drmanac, R., Drmanac, S., Jarvis, J., and Labat, l.1994.Sequencing by hybridization. in Automated DNA Sequencing and DNA Sequencing technologies, J.Craig vector, Ed.academic Press, London.]
46. Eggen et al, 1994, published in<proceedings of the national science of america, 91 [ origin, m.and Rigler, r.1994.sorting single molecules: applications to diagnostics and evolution biotechnology, proc.Natl.Acad.Sci.USA.91: 5740-7.]
47. Alderi et al 1993 published on<cell>75 [ El-Deiry, w.s., et al, 1993.WAFl, orthodontic media of p53 tumor delivery. cell 75: 817-825.]
48. The literature on fareber et al, phase 104<chemistry>[ Faerber, p.and Scheit, k.h.1971. chem.ber.104: 456-460.]
49. "methods of enzymology" published in 1978 by Faller Kraffu et al [ Fairclough, R.H., and Cantor, C.R.1978.the use of single-single energy transfer to study macromolecular assemblies, methods in enzym.347-79]
50. Fan et al, published 1995 at<science>at 267<science>[ Fan, f.f.and Bard, a.j.1995. electrochemistry detection of single molecules.science 267: 871-4.]
51. Famcett, j.j., Longmire, j.l., Martin, j.c., Deaven, l.l., and ram, l.s.1994, large scale chromosome sortation, methods in cell biology 42: 319-331.]
52. Fischerberg et al published in 1983 on<analytical biochemistry>at phase 132 [ Feinberg, a.p., and Vogelstein, b.1983.a technical for a radio labeling DNA restriction end fragments to high specificity. anal. biochem.132: 6-13.]
53. Fischerberg et al published in 1984 on<analytical biochemistry>at stage 137 [ Feinberg, a.p. and Vogelstein, b.1984.a technical for radio layering DNA retrieval ending indexes to high specificity (addendam). anal.biochem.137: 266-7.]
54. Ferrara et al published 1985 on "ACS" at stage 28 [ Ferreira, M.and Rubner, M.F.1985.molecular-level processing of conjugated polymers.1.layer-by-layer management of conjugated polymers.ACS 28: 7107-7114.]
55. "molecular biology and biological techniques" published in 1997 by Ferreia et al [ in Ferreira, T., Allison, D., Thundat, T., and Warmack, R.1997. screening microscopy in sequencing of DNA. in molecular biology and Biotechnology, R.A. Meyers, Ed.VCH Publishers, New York]
56. Volume III of<contemporary Quantum Chemistry>published in Fraster 1965 [ Forster, T.1965.in Modern Quantum Chemistry, Vol.lll (Sinogllu, O., Ed.), pp.93-137, Academic Press, New York]
57. Freund et al published at "ACS" 28 th in 1995 [ Fou, A.C. and Rubner, M.F.1995.molecular-level processing of conjugated polymers.2.layer-by-layer manipulation of in-situ polymerized p-type conjugated polymers. ACS 28: 7115-7120.]
58. Franklin et al published in 1985 on<staining technique>at stage 60 [ Franklin, a.l. and Filion, w.g.1985.a new technical for reporting marking of fluorescence: DPX-bme.stain Technology 60: 125-35.]
59. Frey et al, 1995 [ "free, M.W., powers, L.C., Millar, D.P., and Benkovic, S.J.1995.the nucleotide analog 2-aminopurine as a specific probe of nucleotide amplification by the nucleotide fragment of Escherichia coli polymerase I and bacterial gene T4 DNA ployme]
60. Dead et al published in 1996 in the literature at stage 15<J.Esperology][ Fu, T.J., Sanders, G.M., O' Donnell, M., and Geiduschek, E.P.1996.dynamics of DNA-tracking by two sliding-clamp proteins. EMBO J.15: 4414-22.]
61. Godela et al 1993 published<Biophysico chemistry>at 48 [ Gadella, T.W.J., Jovin, T.M., and dClegg, R.M.1993. fluoro life time imaging microscope (FLIM): biological chemistry.48: 221-239.]
62. Gainst et al published 1996 in<journal of Immunological methods>[ Gains, H., Andersson, L., andBobberfeld, G.1996.A new method for measuring a physiological simulation at the single-cell level in blood cells by flow cytometry. J.of Immunological methods.195: 63-72.]
63. Gelidini et al, "Fluorescence phasing", published in 1996 [ Garini, Y., Katzir, N., Cabib, D., and Buckwaid, R.A.1996.spectral bio-Imaging. in Fluorescence Imaging Spectroscopy and Microcopy (Wang, X. -F.and Herman, B., Eds.)], John Wiley&Sons, New York
64. Garland et al published in 1979 in<J.Biol. [ Garland, P.B. and Moore, C.H.1979.phosphor of protein-bound eosin and erythrosin: a able protocol for measurement of slow motion biochem J.183, 561-
65. Gawrisco et al, 1993, published on<Biochemical>at stage 32 [ Gawrisch, K, Han, K.H., Yang, J.S., Bergelson, L.D., and Ferretti, J.A.1993.interaction of peptide fragment 828. Anopregprotein of human immunodeficiency virus type 1 with lipid bilayer. biochemistry 32: 3112-18.]
66. Ge biye et al, published in 1987 on phase 15<nucleic acid research>[ Gebeyehu, g.rao, p.y., SooChan, p.s., Simms, d.a., and Klevan, l.1987. Novel biotinylated nucleotide-analytes for labeling and colorimetric detection of dna. nucleic Acids res.15: 4513-34.]
67. Gibson et al published in 1987 on<gene>at stage 53 [ Gibson, t.j., Coulson, a.r., Sulston, j.e., and little, r.f.r.1987 a.gene.53: 275.]
68. Gibson et al, published in 1987 on page 283 on<gene>[ Gibson, t.j., Rosenthal, a., and Waterson, r.h.1987b.gene 53: 283.]
69. Gill published in 1979 in the literature on "Experientia" at stage 35 [ Gill, D.1979.inhibition of cloning in microscopical copy of fixed cells. Experientia 35: 400-1.]
70. Gilmann et al published in 1986 on<analysis biochemistry>at 157 [ Gillam, I.C. and Tener.G.M.1986.N4- (6-aminohexyl) cyclidine and-deoxyribose nucleic acid can be used to label DNA. AnalBiochem.157: 199-207.]
71. Gile et al published in 1982 under the<science>at stage 217 [ Giloh, H.and Sedat, J.W.1982.fluorescence microscopy; reduced photobleaching of rhodomine and fisuessen protein conjugates by n-propylgallate. science 217: 1252-1255.]
72. Grezee et al 1997 published a document at phase 8<contemporary Biotechnology view [ Glazer, a.n. and Mathies, r.a.1997.energy-transfer reagents for DNA analysis. current Opinion in Biotechnology 8: 94-102.]
73. Grickman, published in 1985 at stage 31<basic life sciences>[ Glickman, b.w.1985.basic life sciences.31: 353-79.]
74. "DNA clone 3" published in 1995 by Glaaff et al [ Glover.D.M.and Hames, B.D.1995.DNA cloning3.IPL Press, New York.]
75. Ancient Wen published in 1995 under "cell biology" at stage 21 [ Goodwin, P.M. Amolose, W.P., Martin, J.C., and Keller, R.A.1995.spatial dependence of the optical selection efficiency in cell cytometry. cytometry.21: 133-144.]
76. Granton et al published in 1983 in<journal of biophysics>at stage 44 [ Gratton, e.and Limkema, m.1983.a continuous variable frequency-correction phase fluorometer with a fibrous content resolution. biophysis. j.44: 315-325.]
77. Greep was published in 1995 in<analytical biochemistry>at phase 232 [ Griep, m.a.1995. fluoroscience overview assay: a continuous assay for processed DNA polymers applied specific to DNApolymerase chain enzyme, anal. biochem. 232: 180-9.]
78. Gulan et al, 1967, published in the literature on<journal of chemi-physical>at phase 47[ gueron, m., Eisinger, j., and Shulman, r.g.1967.j. chem. phys.47: 4077.]
79. Literature published in 1973 by walbaud [ Guilbault, g.g.1973 (ed.): the term, methods and techniques, Marcel Dekker, New York
80. Guilei et al, published in 1990 under No. 29<Biochemical>[ Gurrier, S.Rizzarelli, E.Beach, D.andBestamampane.C.1990.Lming of keyed definitions of DNA molecules, nuclear localization field evaluation gel electrophoresis by fluorescence. biochemistry 29: 3396-3401.]
81. Haab et al, published 1995 at<analytical chemistry>stage 67 [ Haab, b.and materials, r.1995.single molecule fluorescence burst detection of DNA fragments isolated by plasmid electrophoresis, anal.chem.67: 3253-60.]
82. Hamata et al published in 1983 on<tissue biochemistry>at stage 79 [ Hamada, s.and Fujira, s.1983. dapstating improved for qualitative chemiluminescence. histochemistry 79: 219-26.]
83. Hating et al published in 1992 on the 10 th<biotech trends>[ Harding, J.D. and Keller, R.A.1992.Single molecule detection as an ap research to rapid DNA sequencing. trends Biotechnol: 10: 55-57.]
84. Harris et al, 1985, published in<european journal of biophysics>at phase 13 [ Harris, c.m. and Kell, d.b.1985.on the dielectric observable relationships of the differential movements of lipids and proteins membranes.2.experiments with microbial cells. protoplates and membranes vehicles. eur. biology.j.13: 11-24.]
85. Literature on "molecular Probes" published in Haoland 1996 [ Haughland, R.P.1996.handbook of fluorescent Probes and Research Chemicals. molecular Probes, Eugene.]
86. Congress et al published in 1996 on<cells>at stage 84 [ herenden, D.R and Kelly, t.j.1996.dna polymerase lll: running rings around the fork.cell.84: 5-8.]
87. Published literature by hellman et al [ Herman, b., Wang, x.f., Periasamy, a., Kwon, s., Gordon, g., and wodnicki, p.fluoro life time imaging in cell biology of Optical Diagnostics of living Cells and Biofluids 2678: 88-97.]
88. Holgan et al published in 1978 a paper of<proceedings of the national science of the united states, 75 (Hogan, m., dattagapeta, n.andcrethers, d.m.1978.proc.natl.acad.sci.usa 75: 195-199.]
89. Holter et al 1990 published literature on<molecular genetics>at phase 371 [ Holtke, h.j., Seibl, r., Burg, j., muhleggeger, k., and Kessler, c.1990.non-radioactive labeling and detection of nucleic acids: optimization of the digoxigenin system, mol, Gen, hopper-Seyler 371: 929-938.]
90. Hall law 1995 published literature on<methods in enzymology>at stage 246 { Holzwarth, a.r.1995.time-resolved fluorescence spectroscopy. methods in enzymology.246: 335-361.}
91. Hall, et al 1990 published literature [ Holzwarth, G., Whitcomb, R.W., Platt, K.J., Crater, G.D., and Mckee, C.B.1990. vector of linear DNA along with DNA Molecules of field electrophoresis. InElectrophoresis of Large DNA Molecules (Lai, E.and Birren, B.W., Eds.). Cold Spring harbor laboratory Press, New York.]
92. Hall act et al published in 1987 on<biopolymer>at stage 28 [ Holzwarth, g., McKee, c.b., Steiger, s., and Crater, g.1987. transfer orientation of linear DNA molecules purified-field gel electrophoresis. biopolymers 28: 1043.]
93. Housla et al published in 1989 in the 56 th journal of biophysics [ Housela, t.w., Bustamante, c., Stump, r.f., and Maestre, m.f.1989. biophysis.j.56: 507.]
94. Hoff et al published in 1982 on "dermatological study" at phase 78 [ Huff, j.c., Weston, w.l.and Wanda, k.d.1982.enhancement of specific immunological inflammatory definitions with use of para-phenylenediaminemounting buffer j.of Investigative detail 78: 449-50.]
95. Yellow et al, published in 1996 at stage 243<analytical biochemistry>[ Hung, S.C., Ju, J., Mathies, R.A., and Glazer, A.N.1996.cyanine dyes with high affinity chromatography section as a Donor chromophores in energyrans primer.anal.biochem.243: 15-27.]
96.Ickhikawa et al, 1993 [ Ickhikawa, M., lijima, T., and Matsumoto, G.1993.Simultaneous 16, 384-site optical recording of neural activities In the draft, In Brain Mechanisms of licensing and Memory: from Neuron to behanvior.t.ono, l.r.squire, m.e.raichle, d.l.perrett&m.fukuda (eds)
Ikehara et al, published 1969 as a paper on<chemist bulletin>at stage 17 [ Ikehara, m., Tazawa, l., and Fukui, t.1969a. chem.pharm.bull. (Tokyo). 17: 1019-1024.]
98.Ikehara et al published in 1969 on<biochemistry>at stage 8 [ Ikehara, M., Tazawa, l., and Fukui, T.1969b.biochemistry 8: 736-43.]
99.Iijima et al, published in 1989 at stage 15<neuroscience>[ Iijima, T., lchikawa, M.,&Matsumoto, G.1989 Abstract, Soc. Neurosci.15: 398.]
100. A document published by Janesick [ Janesick, J. (1980-91) lnformal Notes, Jet progress Laboratory, Californian title of Technology, Pasedena, California.]
101. Jett et al, published in 1989 in<J.7>J.Structure and kinetics [ Jett, J., Keller, R., Marron, B., Moyzis, R., Ratliff R., Seitzingger, N., Shera, E., and Stewart, C.1989.high-speed DNA sequencing: an advanced based uphole fluorescence detection of single molecules.J.of Bio.Structure&Dynamics 7: 301-9.]
102. Jett et al, 1995 U.S. Pat. No. 54057445 [ Jett et al 1995.US Patent No.54057447]
103. Johnson et al, published in 1982 at<immunological methods>of phase 55 [ Johnson, g.d., Davidson, r.s., McNamee, k.c., Russell, g., Goodwin, D.&holbrow, e.j.1982. facial of immunology procedure microscopicity: a study of the phenomenon and its remedy. J.of lmmunological Methods 55: 231-242.]
104. Johnson et al published in 1981 on<Immunological Methods>at stage 43 [ Johnson, G.D. and Nogueira Araujo, G.M.de C.1981.A simple method of reducing the mapping of Immunological reagents J.of Immunological Methods 43: 349-50]
105. Vehicle et al 1996 published literature on<nucleic acid research>at phase 24 [ Ju, J., Glazer, A.N., and Mathies, R.A.1996 a.case labeling for facility conjugation of genetic transformation of nucleic acids Res.24: 1144-8.]
106. Vehicle et al 1996 published literature on<natural drugs>at stage 2 [ Ju, j., Glazer, a.n., and Mathies, r.a.1996b. energy transfer printers: a new fluorescence labeling partner for DNA sequencing and analysis, Nature medicine.2: 246-9.]
107. Jiansanen et al, published 1995 at No. 16<electrophoresis>[ Juppanen, J.H. and Riekkola, M.L.1995. influx of electrolytic composition on the effective electrolytic field string h in the capacitor zone electrophoresis. electrophoresis.16: 1441-4.]
Kasianowicz et al, published in 1996 in the literature at<proceedings of the national science of the united states>at stage 93 [ Kasianowicz, j.j., Brandin, e., Branton, d., and deemer, d.w.1996. characteristics of experimental use of nuclear magnetic channels, proc. natural. acad. sci. usa.93: 13770-3.]
Kato et al, published in 1970 at phase 60<cell research>[ Kato, H.and Yoshida, T.H.1970.nondisjunction of chromosomes in a synchronized cell distribution association by cell Res.60: 459-64.]
110. Kouyvern et al 1993 published on<fast communication mass spectrometry>at phase 7 [ Keough, t., Baker, t.r., Dobson, r.l.m., lace, m.p., Riley, t., Hasselfiedld, j., and Hesselberth, p.e.1993, Rapid commu.mass spectrum.7: 195-200.]
111. Jinhou et al published in<nucleic acid research>at phase 23 [ Kinjo, m.and ringer, r.ultrasensive hybridization analysis using fluorescence spectroscopy. nucleic Acids research.23: 1795-1799.]
112. Cock et al, 1993, published in<physicochemical>at 97 th [ Kirk, w.r., Wessels, w.s., and prenergast, f.g.1993.lanthanide-dependent properties of luminescence based on amino acetic acid-lanthanide chemistry, j.phys. chem.97: 10326-10340.]
113. Klanchun et al, published in 1991 in<journal of biophysics>at stage 60 [ klenchi, v.a., Sukharev, s.i., Serov, s.m., chemimoradik, l.v., and Chizmadzhev, yua.1991.electrically induced DNAuptake by cells is a fast process in voving DNA electrophoresis. biophysical j.60: 804-11.]
114. Krhetkuff et al published literature on phase 1<nucleic acid chemistry>[ Kochetkov, n.k., Budowsky, and Shibaev, v.n.proc.nucl.acid chem., 1: 500-2.]
115. Kunzumann et al, published in 1992 [ Konuma, M.1992, film Deposition by plasma techniques, Springer-Verlag, New York.]
116. Latanoya et al 1978 [ Korchemnaya, e.k., Ermakov, a.n., Bochkova, l.p.1978.j.anal chem USSR (eng.trans.) 33: 625.]
117. Kuenberg et al, 1991 [ Kornberg, A., and Baker, T.A.1991.DNA Replication W.H.Freeman, New York]
118. Lakuwa et al, published in 1996 [ Lakowicz, J.R. and Szmaxinski, H.1996.Imaging applications of time-resolved Fluorescence spectroscopy.Jn Fluorescence Imaging Spectroscopy and Microcopy (Wang, X.F. and Herman, B.eds.). John Wiley&Sons, New York.]
119. Lakuweis et al published in 1991 at No. 62<scientific instruments review>[ Lakowicz, J.R. and Berndt, K.W.1991.Life time-selective funorescece imaging using an RF phase-sensitive camera, Rev. Sci. lnstru.62: 3653.]
120. Lang et al, published 1968 [ Lang, r.a., Robins, r.k., and Townsend, l.b.1968.synthetic procedure in Nucleic Acid chemistry.1: ed, Zorbach, W.W.and Tipson, R.S.John Wiley&sons.New York]
121. Langer et al, published in 1981 [ Langer, P.R., Waldrop, A.A., and Ward, D.C.1981.enzymatics synthesis of biotechnologies: novel nucleic acid affinity probes Proc Natl Acad Sci U S.A.78-6633-6637]
122. Li et al published 1995 under<analytical chemistry>at stage 230 [ Lee, k.b., Matsuoka, K, Nishimura, S, andLee, y.c. 1995.a new aproach to assay end-type carbohydrases: bifluorescent-labeldsubstrates for glycoamides and ceramides glycoamides, anal. biochem. 230: 31-6.]
123. Plum et al published literature on phase 20<nucleic acid research>[ Lee, l.g., Connell, c.r., wo, s.l., Cheng, r.d., McArdle, b.f., Fuller, c.w., Halloran, n.d., and Wilson, r.k.nucleic Acids res.20: 2471-2483.]
124. Plum et al, 1994 published on<analytical biochemistry>at stage 220 [ Lee, s.p., Porter, d., Chirikjian, j.g., Knutson, j.r., and Han, m.k.1994.a fluorimetric assay for DNA cleavage performed with bamh restriction end enzyme. anal.biochem.220: 377-383.]
125. Plum et al published in 1995 at<analytical chemistry>at No. 227 [ Lee, S.P., Censullo, M.L., Kim, H.G., Knutson, J.R., and Han, M.K.1995.characterization of endectolytic activity of HIV-linear using a viral substrate.anal.Biochem.227: 295-301.]
126. Plum et al,1994, published on<analytical chemistry>stage 66 [ Lee, Y-H, Maus, r.g., Smith, b.w.and windefordner, j.d.1994.laser-induced fluorescence detection of a single molecule in a ca Pillary.anal.chem.66: 4142-9.]
127. Lewowski 1994 article [ Lewotsky, k.1994.hyperspectral maging: evolution of imagingmetrology. spie OE/rep, November: 1-3.]
128. Litter et al 1994, published in<journal of the american society of chemistry>at phase 116 [ Little, d.p., chord, r.a., Speir, j.p., Senko, m.w., Kelleher, n.l., and McLafferty, f.w.1994.j.am.chem.soc.116: 4893-4897.]
129. Li Wake 1997 literature [ Livak, K.J. 1997. quantification of DNA/RNA using real-time PCRdetection. PE Applied Biosystems, Foster City, CA.]
130. Rockhard et al 1996, published in<natural biotechnology>at stage 14 [ Lockhart, d.j., Dong, h., Byrne, m.c., folettie, m.t.et al, 1996. Expression monitoring by hybridization to high-Densityioligonucletide arrays, nature biotechn.14: 1675-1680.]
131. Roots et al, published in<science>in 1989 [ los, J.J., Denome, S.A., and Dunlap, J.C.1989.molecular cloning of genes under control of the cyclic administration of the neurospora in science 243: 385-388.]
132. Markush et al published in 1963 on the document at<national science research institute>stage 50 [ Marcus, p.l.and Robbins, e.1963.viral inhibition in the metaphase-arrest cell. proc.natl.acad.sci.usa 50: 1156-64.]
133. Marla et al, published in 1996 at<genome Research>at stage 6 [ Marra, M., Weinstock, L.A., and Mardis, E.R.1996.end sequence determination from large inserts circles using genes transfer 6: 1118-22.]
134. Martin et al 1994, published in<J.Virol>No. 68 [ Martin, l, Dubois, M-C., Defree-Quertain, F., Saermark, T., Bumy, A., Brasseur, R., and Ruysschert, J-M. 1994]Correlation between science and genetics and synthesis modified peptides from the NH 2-terminated experiment of simulation and chemistry gp32 and the model of theory of diagnosis and the like: an infraredspecroscopicity study J.Virol.68: 1139-48.]
135. A document published in Messen 1992 [ Mason, W.T.1992.fluorescent and Luminescent Probes for biologicalcalivity. Harcortex Brane&Company, Cambridge, UK.]
Matayoshi et al 1990 published in the literature at stage 247<science>[ Matayoshi, e.d., Wang, g.t., kraft, g.a., and Erickson, j.1990.novel fluorogenic substrates for assisting in transforming viral proteins, science.247: 954.]
Matsumoto et al 1993 published on<methods in Cell biology at stage 38 [ Matsumoto, B.1993. cellular applications of contextual microscopics. methods in Cell biology.38: 86.]
Matsumoto et al, published in 1981 on<molecular biology>at stage 152 [ Matsumoto, S., Morikawa, K., and Yangdida, M.1981.light microscopical structure of DNA in solution resulting from the 4', 6-diamino-2-phenylindel standing method, J.mol.biol.152: 501-516.]
139. Muliss et al published in 1986 at<Biochemical>No. 25 [ Maurizi, M.R., Kasprzyk, P.G., and Ginsberg, A.1986. variants beta. active sites in a glutamine synthesis from Escherichia coli in a fluidized bed reactor, biochem.25: 141-151.]
140. Mauterer, published in 1956 in the publication at<journal of the american society of chemistry>at phase 78 [ Mautner, h.g.1956.j.am.chem.soc.78: 5293.]
141. Macheim et al published in 1977 the literature on<national scientific research institute>at 74 th [ Maxam, a.m. and gilbert, w.1977.a new method for sequencing dna.proc.natl.acad.sci.usa.74: 560-4.]
142. Meimeng et al, published in 1988 [ Maymon, W., and any New, S.P.1988.optical System design resources for the model-Resolution working Spectrometer Tilt (MODIS-T) for the Earth Observation System (EoS), Proc.SPIE-Recent adv. Sensors, Radiometry Data Process Remote Sens.924: 10-22.]
143. Mcgong et al published in 1989 on<analytical chemistry>at phase 61 [ McGown, l.b.1989. fluoro scientific life filtering. anal. chem.61: 839A-847A.)
144. MEFFIT et al published in 1988 at<FEBS leads>239 [ Meffert, R.and Dose, K.1988.uv-induced cross-linking of proteins to plasmid Pbr322 binding 8-azidoadine 2' -deoxyribosides. FEBS leads.239: 190-4.]
145. Merry et al published in 1995 at<optical communications>at phase 20 [ mertz, j., Xu, c.and Webb, w.w.1995. single-mobile detection by two-photon-excited luminescence Letters 20: 2532-34.]
146. Meinin Kukoshi et al published in 1987 on<methods in Enzymology>at No. 152 [ Meinkoth, J.and Wahl, G.M.1987.Nick transfer. methods in Enzymology 152: 91-94.]
147. Monte et al, 1979, published on<photochemistry>at stage 27 [ Menter, J.M., Hurst, R.E.and West, S.S.1979.photochemistry of heparin-acid organism complexes in solution. photochemistry and Photobiology.27: 629-33.]
148. Monte et al, 1978, published at<photochemistry>stage 27 [ Menter, J.M., Golden, J.F.&West, S.S.1978.kinetics of fluorescence fixing of acrylate orange-side complexes in solution. Photochemistristry and Photobiology 27: 629-633.]
149. Mickey et al published in 1992 in the document<journal of muscle research>at phase 13 [ Miki, M., O' Donoghue, S.l., and DosReemios, C.G.1992.Structure of action based by fluorescence sensitivity emission spectrum, J.Muscle Res.cell Motil.13: 132.]
150. Mich et al, 1993, published in<J.Biol.chem.268 [ Miki, M.and lio, T.1993.kinetics of structural changes of structural methyl esters of biological fluorine concrete transfer. J.biol.chem.268: 7101-7106.]
151. Mitcezesen et al, published 1971 [ Mitchinson, J.M.1971.the Biology of the Cell cycle. Cambridge University Press, London.]
152. Moore et al, published in 1986 in<journal of biophysics>at 49 rd [ Moore, D.P., Schellman, J.A., andBasase, W.A.1986.the orientation, translation and reproduction of DNA in orthogonal field: a linear dichlorism study. biopphys.j.49: 130 a.)
Morikawa et al, published 1981 in<J.Biochem>89 [ Morikawa, K., and Yangdia, M.1981. J.biochem.89: 693.]
154. Document published in 1990 by Morosarage et al [ Morosanu, C.E.1990.thin films by chemical vapor deposition. Elsevier, New York.]
155. Morgan et al 1990 literature { Morgan, C.G., Mitchell, A.C., and Murray, J.G.1990.Nanosecondtime-resolved fluorescence: primer and primer, Trans, R, Microsc, Source, (Micro' 90)463-466 }
A document published in Nakashima et al 1992 [ Nakashima, m., Yamada, s., Shiono, s., and Maeda, m.1992.ieee trans. biomed. engng.39: 26-36.]
Naktinis et al, 1996, published on<cells>at stage 84 [ Naktinis, V., Turner, J., O' Donnell, M.1996.A molecular switch in a replication machine defined by an internal composition for protein proteins. cell.84: 127-45.]
Negishi et al, published 1988 in the literature at stage 19<nucleic acid seminars>[ Negishi, K., Matsuroto, K., Bessho, T., Tada, F., and Hayatsu, H.1988.in vitro mutagenesis by incorporation of N4-aminodeoxymycin 5' -triphosphate. nucleic Acids Symposium series.19: 33-6.]
159. Newman et al 1977 published literature on<molecular biology>at stage 110 [ Newman, j., Swiney, j.l., Day, l.a.1977.j.mol.biol.110: 119-46.]
160. Nigulas et al 1990 published literature on<bone and mineral>at stage 8 [ Nicolas, V., Nefusi, J.R., Collin, P., and Forest, N.1990.effects of acidic fiber growth factor and epidemic growth factor non-basic yield cells: DNA synthesis and alkali phosphatase activity, Boneand mineral.8: 145-56.]
161. Nixin et al [ Nguyen, d.c. and Keller, r.a. detection of single molecules of phycerythrin in hydraulic focused flows by laser-induced fluorescence. anal. chem.59: 2185-2161.]
162. Niee et al, 1994, published in<science>stage 266 [ Nie, s., Chiu, d.t., and Zare, R.N.1994.probing index molecules with systematic fluorescence. science.266: 1018-21.]
The document published in 1993 by Oida et al at phase 64<biophysics>[ Oida, t., Sato, y, and Kusumi, a.1993.fluorescence lifetime imaging microscopics (flimsy): method of analysis and application of elastomers fusion in single cells, biophysis.j.64: 676-685.]
164. The document on<journal of biochemistry>at phase 268 [ irrust, r., and O' Donnell, m.1993.j.biol.chem.268: 11766-72.]
165. Pi Pu et al, 1993, published at<biochemistry>at stage 32 [ Pap, E.H.W., Bastiaens, P., Borst, J.W., van den berg, P., van Hoek, A., Snoek, G., Wirtz, K, and Visser, A.1993.quantification of the interaction of protein kinase C with diacylglycerol and phosphorisitides by time-resolved detection of restriction transmission. biochemistry 32: 13310-17.]
166. Baol's literature [ Paul, W.Professor of Physics, Harvard University]
167. The literature of Boria 1995 [ Pauleau, Y.1995.materials and processes for surface and interface engineering. Kluwer Academic Publishers, Boston.]
168. ParCi-Aili progenitor et al, published in 1996 in<J.Biochem>at stage 271 [ Paz-Elizur, T., Skaliter, R., Blumenstein, S., and Livneh, Z.1996. beta., a UV-indelible small assembler for the beta suburbitutilizing clamp of DNA polymerases l of Escherichia coli.l.Gene expression and regulation.J.biol.chem.271: 2482-90.]
169. Park et al, published in 1989 in<proceedings of the national science of the united states of america>at 86 [ -Peck, k., Stryer, l., Glazer, a.n. and materials.r.a.1989. single-molecule fluorescence detection: autocorrlation criterion and experimental regeneration with a phytoerythrin Proc. Natl. Acad. Sci. USA 86: 4087-4091.]
170. Peysama et al [ periiasamy, a., Siadat-Pajouh, m., Wodnick, p., Wang, X-f., and Herman, b.time-gated fluorescence microscopy for clinical imaging, microscopy and analysis.3: 33-4.]
171. Pisama et al, 1994, published in the literature on<computer-Assisted Microscopy>stage 6 [ periaxy, a.,&Herman, b.1994.computerized fluorescence vision in the biological science.j. of computer-Assisted Microscopy 6: 1-26.]
172. Picciolo et al published in 1984 on<development of practical microscope>at stage 30 [ Picciio lo, G.L. and Kaplan, D.S.1984.reduction of fixing of fluorescent reaction product for microphotometric evaluation. Advances in Applied Microbiology 30: 197-234.]
173. Pedana was published in 1980 [ Pilai, V.N.1980. Photocurable protective groups in organic synthesis. Synthesis.1980: 1.]
174. Prat et al published in 1983 in<J.histochemistry and Cytology>at 31 [ Platt, J.L.and Michael, A.F.1983. retrieval of fixing and enhancement of importance of immunology by p-phenylenediamine J.ofbiochemistry and biochemistry 31: 840-42.]
175. Putt et al 1990 published literature on<methods of Cell Biology>at stage 33 [ Poot, M.and Hoehn, H.1990.Cell cycle analysis using a continuous biological assay labeling and Hoescht 33258-ethidium biological assay flow. methods in Cell Biology 33: 185-98.]
176. Burter 1967 [ Porter, G. (Ed.)]1967.Reactivity of the photoexcited organic semiconductor. Interscience, New York.]
177. Prinschem 1963 [ Pringsheim, P.1963.fluorescence and Phosphorescence. John Wiley, New York]
178. Priorey et al published in 1979 on<biopolymer>at stage 18 [ Priore, d.r.c. and Allen, f.s.1979.biopolymers 18: 1809-1820.]
179. Pule et al, 1994, published on<nucleic acid research>at stage 22 [ pural, a.a., Kow, y.w., and Wallace, s.s.1994.5-hydroxyprolidine deoxyribose triphosphates are more involved in coding DNA by exonic lyase-free fragment of this 8-oxypurine deoxyribose triphosphates nucleic Acids res.22: 3930-5.]
180. Puser 1985 [ Purcell, E.M.1985.electric and Magnetism, Vol.2 McGraw-Hill, New York]
181. Koji et al, published in 1996 in<Nature>at stage 380 [ Qu, D., et al, 1996.A role for a mean-centering hormone in the centering regulation of feeding behaviour. Nature 380: 243-247.]
182. Lehn et al 1965 literature [ Rahn, r.o., Schulman, r.g., and Longworth, j.w.1965.proc.natl.acad.sci.usa 53: 893.]
183. Lymphonol et al, 1990, published a literature on<analytical biochemistry>at stage 194 [ Rampino, N.J. and Chrambach, A.1990.apparatus for gel electrophoresis with a continuous monitoring of infectious DNA molecules by video electrophoresis. animal. biochem.194: 278-283.]
184. Lao et al published in 1968 in the literature on<science>at 160 [ Rao, p.n.1968.mitotic syndrome in mammalian cells mined with nitrous oxide at high pressure. science 160: 774-6.]
185. Rigby, P.W.J., Dieckmann, M., Rhodes, C., and Berg, P.1977.Labeleg deoxygeninecolic acid to high specific activity in video bionics transfer with DNA polymerase l.J.mol.biol.113: 237-51.]
186. Ledick et al, 1989 [ redick, r.c., warrock, r.j., and Ferrell, t.l.1989.phys. rev.b 39: 767-770.]
187. Rogers et al, 1985 [ Rodgers, M.A.J.and Firey, P.A.1985. Photochem.Photobiol.42: 613.]
188. Lonagu et al 1996 literature [ Ronaghi, m., Karamohamed, s., Pettersson, b., Uhln, m., and Nyren, p.1996.real DNA sequencing using detection of pyrophosphate release.anal.biochem.242: 84-89.]
189. Ross et al published in 1964 on<biopolymer>phase 2 [ Ross, p.d. and Scruggs, l.1964. biopolymers.2: 231-6.]
190. Rosett 1991 [ Rost, F.W.D.1991.Quantitative Fluorescence Microcopy. Cambridge university Press, Cambridge]
191. Roy et al, 1979 [ Roychoudhury, R., Tu, C. -P-D., and Wu, R.1979. infiluence of nucleotide sequence ad jacent to duplex DNA tertiary on 3' -tertiary labeling by tertiary transfer enzyme. nucleic Acids Res.6: 1323-1333.]
192. Saha et al, 1993 [ Saha, a.k., Kross, k., klossewski, e.d., uppson, d.a., Toner, j.l., Snow, r.a., Black, c.d.v., and Desai, v.c.1993.time-resolved fluorescence of a new europeituumchelate complex: monitoring of high reactive detection of proteins and DNA samples.J.am.chem.Soc.115: 11032-33.]
193. Sahuta et al 1994 literature [ Sahota, r.s.and Khaledi, m.g.1994.nonaqueous capillary electrophoresis. anal.chem.66: 1141-6.]
194. The literature published in 1985 by Saiki et alat phase 230<science][ Saiki, r.k., Scharf, s., falonona, f., Mullis, k.b., Hom, g.t., Erlich, h.a., and arenheim, n.1985. enzymetic amplification of beta-globinggenic sequences and restriction sites analysis for diagnosis of cell of simple issue, science 230: 1350-1354.]
195. Saiki et al published in 1988 under the<science>at stage 239 [ Saiki, r.k., Gelfand, d.h., Stoffel, s., Scharf, s.j., Hignchi, r., Horn, g.t., Mullis, k.b., and Erlich, h.a. 1988.Primer-direct enzymatic amplification of DNA with alkaline stable DNA polymerase.science 239: 487-91.]
196. Sanger et al 1977 [ Sanger, f., Nicklen, a, and Coulson, a.r.1977.dna sequencing with a-terminating inhibitors, proc.inc.natl.acad.sci.usa.74: 5463-7.]
197. The literature of Sas et al, 1995 [ Sase, l., Miyara, H., Corrie, J., Craik, J, and Kinosita, Jr., K.K.1995.real time imaging of single fluorine on moving action with and epifluorescence microscopy. Biophys.J. 69: 323-8.]
198. The 1980 literature by motide antibodies for scontinite et al [ Scheit, k.h.1980: synthesis and Biologcalfunction John Wiley&Sons, New York
199. Schelman et al, 1987 [ schelman, j.a., and Jensen, h.p.1987.optical spectroscopy of ordered molecules.chem.rev.87: 1359.]
200. Schott 1989 [ Schott, j.r.1989.remote sensing, soft Earth: PhysToday September: 72-79.]
201. Schwartz et al published in<Nature>at 338<1989 [ Schwartz, D.C. and Koval, M.1989. formatting ai dynamics of individual DNA molecules along gel electrophoresis. Nature 338: 520-522.]
202. Selvin et al 1994 literature [ Selvin, P.R., Rana, T.M., and Hearst, J.E.1994. luminescences energy transfer.J.Am.chem.Soc.116: 6029-30.]
203. Selvin et al 1995 [ Selvin, P.R.1995.fluorescence research response transfer. Methodsin enzymology.246: 300-334.]
204. Sheila et al 1990 published literature on<chemico-physics>at stage 174 [ Shera, e.b., Seitzinger, n.k., Davis, l.m., Keller, r.a., and person.s.a.1990. detection of single fluoro molecules.chem.phys.letters.174: 553-57.]
205. Schlemm et al published in 1986 on<5>DNA [ Shikmus, M.L., Guaglianone, P., and Herman, T.M.1986.Synthesis and characterization of biotin-labeled nucleotide analogs. DNA.5: 247-55.]
206. Scaglitt et al, published in 1996 in journal of biochemistry of stage 271. [ Skaliter, r., Bergstein, m., andLivneh, z.1996.beta, a UV-absorbent short form of the beta subnitrile of DNA polymerase ll of escherichia coli.ll.over production, purification, and activity as a polymerase process close.j.biol.chem.271: 2491-6.]
207. Skoog et al, published 1992 [ Skoog, D.A., West, D.M., and Holler, F.J.1992, analytical chemistry, Saunders College Publishing, New York]
208. Smirnov et al [ Smirnov, l.p., Roskey, m.t., Juhasz, p., Takach, e.j., Martin, s.a., and, l.a.1996.sequencing oligonucleotides by energy analysis and delayed amplification-associated laser demodulation time-of-flight mass spectrometry, animal. biochemistry.238: 19-25.]
209. Smith et al 1990 published literature on<proceedings of the national science of the united states>at 87 [ Smith, d.p., Shieh, b.h., and Zuker, c.s.1990. Lrelation and structure of an aromatic gene from drosophila.proc.Natl.Acad.Sci.USA 87: 1003-1007.]
210. Smith et al 1990 [ Smith, S.B., Burrrier, S., and Stamante, C.1990. fluoro Microsocpy and computer relationships of DNA Molecules in genetic and pulse-field DNA Molecules (Lai, E.and Birren, B.W., Eds.). Cold Spring Harbor Laboratory Press, New York.]
211. Smith et al published in 1989 at<science>stage 243 [ Smith, s.b., Aldridge, p.k., and Callis, j.b.1989. observer of integrated DNA molecules electrophoresis. science 243: 203-206.]
212. Smith et al, 1986 [ Smith, l.m., Sanders, j.z., Kaiser, r.j., Hughes, p., Dodd, c., connect, c.r., Heiner, c., Kent, s.b., and Hood, l.e.1986. fluorscience detection in automated sequence analysis, nature.321: 674-9.]
213. Sobel 1970 [ Sober, H.A. Ed.1970.handbook of Biochemistry, 2nd nd.the chemical rubber Co., Cleveland]
214. Sopore, 1992 [ Soper, s.a., Davis, l.m., and Shera, e.b.1992.single molar mobility in solution.los Alamos Science 20: 286-98.]
215. Stickett et al, 1983 [ Spatz, W.B.and Grabig, S.1983.reduced fixing of fast blue fluorescence in the broad of the Guinea-pig by stream with sodium-nitro-usage. neuroscien letters 38: 1-4.]
216. Spohr, r.1990.lon tracks and microtechnology: principles and applications Vieweg, Braunschwing
217. Literature in stutberg 1971 [ Steinberg, l.z.1971. annu.rev.biochem.40: 83.]
218. Stantal et al, 1971 [ Steiner, R.F. and Weinryb, l.1971. expressed States of Proteins and nucleic acids. plenum Press, New York]
219. Stewart et al 1968 [ Stewart, j.e., Hahn, g.m., Parker, v., and Bagshaw, m.a.1968.chinese hamster cell monolayer cells cultures.exp.cell res.49: 293-299.]
220. Stutval, 1983 [ Stuart, R.V.1983.vacuum technology, thin films, and spraying: academic Press, New York]
221. Sturier 1978 [ Stryer, L.1978.annual Review of biochem.47: 819.]
222. 1968, stubblefel [ stubbblefield, e.1968.synchronization Methods for mammalia cells, in Methods in Cell physiology, ed.by d.m.prescott.3: 25-43 Academic Press, New York]
223. Sttem et al, 1989 [ Sturm, J.and Weill, G.1989.direct adherence of DNA priming and regeneration by electric birefringement: (ii) an evaluation for the mechanism of the partial pulsation-field gel electrophoresis. Phys. Rev. Lett.62: 1484.]
224. Taliani et al 1996 published literature on<analytical biochemistry>at stage 240 { Taliani, m., Bianchi, e., Narjes, f., Fossatelli, m., Urbani, a., Steinkuler, c., De francisco, r., and pisi, a.1996.a connectioussay of hepatics C virus enzyme based on restriction energy transfer therapy subsystem, animal.biochem.240: 60-7.}
225. Taylor et al published in 1989 on<methods of Cell biology>at stage 29 [ Taylor, d.l. and salmonella, e.d.1989.methods in Cell biol.29: 207-37.]
226. Taylor et al, 1981 [ Taylor, d.l.reidler, j., spatich, j.a., and stryer.l.1981. detective interference by fluorescence energy transfer.j.cell biol.89: 363.]
227. The 1993 literature of terbite et al [ Ter best, M.and Hoektra, D.1993.interaction of mylein basic protein with aromatic membranes. parameters compiling, aggregation and dissociation. Eur.J.biochem.211: 689-96.]
228. Sell et al 1997 literature [ Theil, E.1997.automation in genome research. in Molecular biology and Biotechnology, R.A.Meyers, Ed.VCH Publishers, New York.]
229. Tomas et al, 1992 [ Thomas, R.S., Shimkunas, A.R., and Manger, P.E.1992.sub-nanosecond intensifier gating using heavy and mesh cathode undersalays. Proc.Lnt.Congr.HighSpeed photo. photo 19th.1984]
230. Tian et al, 1991 [ Tian, R.and Rodgers, M.A.J. (1991). Time-resolved fluoroscience.in New Techniques in Optical Microcopy and Spectrophotometry (R.J.Cherry, Ed.), pp.312-351 CRC Press, Boca Raton, FL.]
231. Tinoco et al 1995 literature [ Tinoco, l., Sauer, K., and Wang, J.C. 1995.Physical chemistry Prentice Hall, Englewood Cliffs]
232. FIG. et al, 1980 [ Tu, C. -P-D., and Cohen, S.19803 '-End labeling of DNA with [ α -32P]cordicepin-5' -triphosphate. Gene 10: 177-83]
1996, Uchiyama et al [ Uchiyama, h., Hirano, k., Kashiwasake-Jibu, m., and Taira, k.1996.detection of undegradedded oligonucleotides in vivo by fluorescence response energy transfer.j.biol.chem.271: 380-84.]
234. Wudenfrand 1962 [ Udenfriend, S.1962.fluorescence assay in biology and medicine.academic Press, New York and London]
235. Uke et al 1974 [ Ueda, t., Miura, k., lmazawa, k., and Odajima, k.1974.chem.pharm.bulll. (Tokyo) 22: 2377-2382.]
236. Wahlev 1992 literature [ Valiev, K.A.1992.the physics of submicron littrow Press, New York.]
237. The publication of 1985 by Wales et al [ Valnes, K.and Brandtzaeg, P.1985. recording of immunological facing along with microscopy.J.of Histochemistry and biochemistry 33: 755-761.]
238. Document 1993 by model holster et al [ Van Hulst, n.f., mors, m.h.p., Noordman, o.f.j., Tack, r.g., Segerink, f.b., and Bolger, b.1993.appl.phys.lett.62: 461.]
239. Van der et al 1992 de document [ Van de Ven, m., and Gratton, e.1992.time-resolved fluoroscience imaging. in Optical microsoft copy: emerging Methods and Applications (B.Herman, and J.J.Lemaster, Eds.), 373-402.Academic Press, San Diego.)
240. Wako Han et al, 1970 [ Vauhan, W.M. and Weber, G.1970.oxygen queuing of Pyrenebutyl acid funoescience in water.A dynamic probe of the Microenvironmental. biochemistry 9: 464-473.]
241. Wagner 1995 literature [ Waggener, A.1995. equivalent labeling of proteins and nucleic acid fluorescence. methods in Enzymology 246: 362-373.]
242. King et al 1995 [ Wang et al, 1995.Discovery of artificial in a rat electrochemical simulation and apparatus in an experimental resonant formation of biological in a rat electrochemical damage.Proc.Natl.Acad.Sci.USA87: 1003-1007.]
243. King et al, 1976 [ Wang, S.Y.1976.Photochemistry and Photobiology of Nucleic acids, academic Press, New York.]
244. King et al, 1996 literature [ Wang, x.f., periiasamy, a, Wodnicki, p., Gordon, g.w., and Herman, b.1996, time-delayed fluorescence life longevity imaging microscopics: in Fluorescence working Spectroscopy and Microcopy (Wang, X.F. and Herman, B.Ed.) John Wiley&Sons, Inc., New York
245. King et al, 1996 literature [ Wang, x.f., periiasamy, a, Wodnicki, p., Gordon, g.w., and Herman, b.1996, time-delayed fluorescence life longevity imaging microscopics: ionization and biomedicalapplication.chemical Analysis 137: 313-350.]
246. King et al 1990 [ Wang, x.f., Kitajima, s., Uchida, t., Coleman, d.m., and minim, s.1990. time-delayed fluorescence microscopy using multichannel photon counting. appl.spectrosc.44: 25.]
247. Wang et al, 1996 [ Wang, Y., Wallin, J.M., Ju, J.S., Sensabaugh, G.P., and Mathies, R.A.1996.high-resolution capacitor array electrophoretic sizing of multiple short tandem repeat utilization array primers.Electrophoresis.17: 1485-90.]
248. Wang et al, 1995 [ Wang, Y., Ju, J., Carpenter, B.A., Atherton, J.M., Sensabaugh, G.F., and Mathies, R.A.1995.Rapid sizing of short standing repeat alloys using a camera imaging apparatus imaging optical reflection and energy-transfer fluorescence printers, anal.chem. 67: 1197-203.]
249. Ward et al 1969 [ Ward, D.C. and Reich, E.1969. fluoro science students of nucleotideses and polynucleotides.244: 1228-1237.]
250. Weiman et al, 1995 [ Weimann, S., Rupp, T., Zimmermann, J., Voss, H., Schwager, C., and AndAssorge, W.1995.primer design for automated DNA sequencing utilizing T7 DNA polymerase and internal labeling with fluorescence-15-Datp.BioTechniques 18: 688-97.]
251. Wilkinson, j.q., Lanahan, m.b., Conner, t.w., and Klee, h.j.1995. indication of mRNAs with enhanced expression in dependent strand concrete from plant mol.biol.27: 1097-1108.]
252. Wittwel et al 1997 literature [ Wittwer, c.t., Herman, m.g., Moss, a.a., and rasmussen.r.p.1997.continuous fluorescence monitoring of rapid cycle DNA amplification.biotechniques.22: 130-1, 134-8.]
253. Wolley et al 1995 [ Wooley, A.T.and materials, R.A.1995.ultra-high-speed DNA sequencing using a capillary electrophoresis chip. anal.chem.67: 3676-3680.]
254. Vorenis et al 1994 [ Woronicz, j.d., Calnan, b., Ngo, v., and Winoto, a.1994.requirement for the orphan stereo receiver Nur77 in apoptosis of T-cell hybrids. nature 367: 277-281.]
255. Wu et al, 1981 [ Wu, h.m., dattagappa, n.and Crothers, d.m.1981.proc.natl.acad.sci.usa 78: 6808-6811.]
256. Wu et al 1994 literature [ Wu, P.G.and Brand, L.1994.Resonance energy transfer: methods and applications, anal. biochem.218: 1-13.]
257. Wednrich et al, 1969 [ Wunderlich, F. and Peyk, D.1969. analytical agents and deacronuclear division of cities, ll Endogeneous recovery from collecic and collemid-a newmethod of synchronization in Tetrahymena pyriformis GL.Expl. cell Res.57: 142-4.]
258, Yanagida et al 1983 [ Yanagida, m., Hiraoka, y., and Katsura, l.1983.cold spring harbor symp.biol.47: 177-87.]
259 Yamaoka etal 1981 [ Yamaoka, k.and Matsuda, k.1981.macromolecules 14: 595-601.]
Yamaoka et al 1973 [ Yamaoka, K.and Charney, E.1973.macromolecules 6: 66-76.]
261. Wani et al, 1988 [ Vane, G., Chrien, T.G., Reimer, J.H., Green, R.O., and Conel, J.E.1988.Comparison of laboratory calibretions of the air Vision/Infrared Imaging Spectrometers (AVIRIS) at the marking and end of the first light section. 168178.]
262. Swingle 1973 [ Zweig, A.1973.Photochemical generation of stable fluoro compounds (photofluoro science) [ Pure and Applied Chemistry 33: 389-410.]
Claims (229)
1.A method of analyzing a polymer of linked units, comprising:
exposing the plurality of individual units of the polymer to an agent selected from the group consisting of electromagnetic radiation, a quenching source, and a fluorescence excitation source; (ii) the individual units interact with the agent to produce a detectable signal; and
the signals resulting from the interactions are detected in turn in order to analyze the polymer.
2.The method of claim 1, wherein the signal is electromagnetic radiation.
3. The method according to claim 2, wherein the agent is electromagnetic radiation.
4. The method according to claim 3, wherein a portion of the plurality of polymer mer units are fluorophore-labeled.
5.A method according to claim 3, wherein:
sequentially exposing the plurality of individual units of the polymer to electromagnetic radiation by bringing the plurality of individual units into close proximity to a light-emissive compound and exposing the light-emissive compound to electromagnetic radiation; and
the plurality of individual units of the polymer has a detectable effect on the electromagnetic radiation emitted by the light-emitting compound.
6.A method according to claim 3, wherein:
sequentially exposing a plurality of individual units of the polymer to electromagnetic radiation, and
the electromagnetic radiation detectably affects the electromagnetic radiation emitted by the plurality of individual units of the polymer to produce a detectable signal.
7. The method according to claim 5, wherein the individual units having a detectable effect on the electromagnetic radiation emitted by the light-emitting compound are fluorophore labelled.
8.A method according to claim 5 wherein the light emissive compound is attached to a solid material.
9. The method of claim 3, wherein the plurality of individual units of polymer are sequentially exposed to the agent by passing the polymer through a nanochannel in the wall material and exposing the plurality of individual units of polymer to the agent at an interaction station adjacent the nanochannel.
10. The method of claim 9, wherein the polymer passes through a nanochannel in a wall material adjacent to which the light-emissive compound is embedded in the wall material, thereby allowing a plurality of individual units to interact with the light-emissive compound as thepolymer passes through the nanochannel.
11. The method of claim 9, wherein the wall material comprises a plurality of nanochannels and an interaction station at the nanochannels, and the method further comprises passing a plurality of polymers through the nanochannels with only one polymer per nanochannel at any given time, and simultaneously detecting signals resulting from the interaction of individual units of the polymers with the agent at the interaction station.
12. The method of claim 1 further comprising storing said detected signal in a database.
13. The method of claim 2 further comprising comparing the detected signal with a signature from another polymer to determine the relatedness of the two polymers.
14. The method of claim 2 further comprising comparing the detected signal to a known signature representative of a characteristic of a known polymer to determine the relatedness of the polymer being analyzed to the known polymer.
15. The method of claim 2, wherein the plurality of individual units are two units, the first unit being at a first end of the polymer and the second unit being at a second end of the polymer.
16. The method of claim 15 further comprising measuring a length of time that is spaced between detecting the first signal from the first unit and detecting the second signal from the second unit.
17. The method of claim 2 further comprising measuring the time interval during which each signal is detected sequentially.
18. The method of claim 2, wherein a first unit of said individual units interacts with the agent to produce a first detectable signal and a second unit of said individual units interacts with the agent to produce a second detectable signal different from the first detectable signal.
19. The method according to claims 1-18, wherein the polymer is a nucleic acid.
20. The method of claims 1-18, wherein only a portion of the polymer units are labeled.
21. The method of claims 1-18, wherein only a portion of the polymer units are labeled and randomly labeled.
22. The method of claims 1-18, wherein at least two units of the polymer are differently labeled so as to produce two different detectable signals.
23. The method of claim 1, wherein the plurality of polymer individual units are exposed to at least two agents and the interaction between the polymer units and the at least two agents produces at least two signals.
24. The method of claim 23, wherein at least two reagents are positioned in different regions of a channel through which the polymer passes.
25. The method of claim 23, wherein the at least two signals are different signals.
26. The method of claim 23, wherein the at least two signals are the same signal.
27. The method of claim 9, wherein the nanochannel is fixed in the wall.
28. The method of claim 1, wherein the unit is exposed to a reagent in a station, and the station is a non-ligand material.
29. A method of analyzing a polymer of linked units, comprising: moving a plurality of individual units of the linked-unit polymer relative to the station; and
sequentially detecting signals resulting from detectable physical changes occurring in the polymer or the station as individual units pass through the station.
30. The method of claim 29, wherein said station is an interaction station and wherein exposing an individual element to an agent that interacts with said interaction station produces a detectable electromagnetic radiation signal characteristic of said interaction.
31. The method of claim 29, wherein the station is a signal generating station and the generated signature signal is a pulse that varies with the polymer.
32. A method of analyzing a polymer of linked units, comprising:
exposing a plurality of individual units of a polymer to a station for generating a non-ionically conductive signal resulting from exposure of said polymer units to the station, wherein said station is attached to a wall material having a surface defining a passageway.
33. A method of identifying individual units of a polymer, comprising:
briefly exposing individual units of a polymer to an agent selected from the group consisting of electromagnetic radiation, a quenching source, and a fluorescence excitation source, wherein the identity of the individual units is unknown so as to interact with a detectable electromagnetic radiation signal characteristic of said individual units;
detecting the signal; and
distinguishing the signal as an indication of the identity of the individual unit from signals produced by adjacent units in the polymer that produce the signal.
34. The method according to claim 33, wherein the agent is one or more fluorophores and the signal is detected by briefly exposing the individual unit to the agent by locating the individual unit within an energy transfer distance of the agent and by detecting fluorescent energy transfer between the agent and the individual unit.
35. The method according to claim 34, wherein the agent comprises at least three fluorophores.
36. The method according to claims 33-34, wherein the individual units of the polymer are exposed to the agent by positioning the individual units at an interaction station comprising nanochannels in the wall material.
37. The method of claim 36, wherein the wall material comprises two layers, one layer being conductive and the other layer being non-conductive, and the nanochannel traverses both layers.
38. A method of identifying individual units of a polymer, comprising: instantaneously moving an individual unit of the polymer relative to a station, the identity of the individual unit being unknown;
detecting a signal generated as a result of a detectable physical change occurring in the unit or the station; and
the signal is distinguished as an indication of the identity of the individual unit from signals generated as a result of exposure of neighbouring units in the polymer which generate the signal to the station.
39. The method of claim 38, wherein the station is an interaction station and the individual units are exposed at the interaction station to an agent that interacts with the individual units to produce detectable electromagnetic radiation signals representative of the interaction characteristics.
40. The method of claim 38, wherein the station is a signal generating station and the generated signal is a pulse that varies with the polymer.
41. A method of determining the proximity of two individual units of a polymer of linked units, comprising:
moving the polymer relative to a station;
exposing an individual unit to the station to generate a signature signal due to a detectable physical change occurring in the unit or the station;
detecting the generated characteristic signal; and
the time interval between the detection of these characteristic signals is measured, the length of which reflects the proximity between the two individual units.
42. The method of claim 41, wherein the station is an interaction station and the individual units are exposed at the interaction station to an agent that interacts with the individual units to produce detectable electromagnetic radiation signals characteristic of the interaction.
43. The method according to claim 42, wherein the agent is selected from the group consisting of electromagnetic radiation, a quenching source, and a fluorescence excitation source.
44. The method of claim 41, wherein the station is a signal generating station and the generated signal is a pulse that varies with the polymer.
45. The method according to claims 41-44, wherein the polymer is a nucleic acid.
46. The method according to claims 41-43, wherein said polymeric individual units are fluorophore-labelled.
47. The method of claims 41-46, wherein the two individual units are randomly labeled polymer individual units.
48. The method of claims 42-43, wherein the interaction station comprises a nanochannel in a wall material.
49. A method of determining the order of two individual units of a linked-unit polymer, comprising:
moving the polymer linearly relative to a station;
exposing one of the individual units to the station to generate a signal arising from a detectable physical change occurring in that unit or in that station;
exposing the further individual unit to the station to produce a second detectable signal different from the first signal arising from the detectable physical change occurring in the unit or the station;and
the order of these signals is determined as the order index of the two individual units.
50. The method of claim 49, wherein the station is an interaction station and one of the individual units is exposed to an agent that interacts with the one individual unit at the interaction station to produce a first detectable electromagnetic radiation signal; the other individual unit is then exposed to an agent that interacts with the other individual unit at the interaction station to produce a second detectable electromagnetic radiation signal.
51. The method according to claim 50, wherein the agent is selected from the group consisting of electromagnetic radiation, a quenching source, and a fluorescence excitation source.
52. The method of claim 49, wherein the station is a signal generating station and the generated signal is a pulse that varies with the polymer.
53. The method of claims 49-52, wherein the polymer is a nucleic acid.
54. The method according to claims 49-51, wherein the individual units of the polymer are fluorophore-labelled.
55. The method of claims 49-52, wherein the individual units of the polymer are randomly labeled individual units of the polymer.
56. The method of claims 50-51, wherein the interaction station comprises a nanochannel in a wall material.
57. A method of determiningthe distance between two individual units in a polymer of linked units, comprising:
(1) linearly conveying the polymer relative to a station;
(2) detecting a signature signal generated by each individual unit when the station is bypassed;
(3) measuring time intervals between the measured signals;
(4) repeating steps 1, 2 and 3 on a plurality of like polymers to generate a set of data; and
(5) determining the distance between the two individual units by analyzing the set of data in dependence on information obtained from the plurality of homogeneous polymers.
58. The method of claim 57, wherein the stations are signal generating stations.
59. The method of claim 58, wherein the signature signal is a pulse that varies with the polymer.
60. The method of claim 57, wherein step (2) comprises measuring the generated electromagnetic radiation signal.
61. The method of claim 57, wherein the plurality of homogeneous polymers is a homogeneous population.
62. The method of claim 57, wherein the plurality of homogeneous polymers is a heterogeneous population.
63. The method of claim 57, wherein the plurality of similar polymers are randomly labeled.
64. The method according to claims 57-63, wherein said polymer is a nucleic acid.
65. A method according to claim 58, wherein both link elements are detected at the signal generating station by measuring optical radiation at the station.
66. The method of claim 57, wherein steps (1) - (4) are performed substantially simultaneously.
67. The method of claim 57, wherein the stations are interaction stations and the interaction stations are nanochannels.
68. An article of manufacture, comprising:
a wall material having a surface defining a channel;
an agent selected from the group consisting of a source of electromagnetic radiation, a quenching source, a luminescent film layer, and a fluorescence excitation source attached to a wall material adjacent to the channel, and in close proximity to the channel and in sufficient dosage to detectably interact with a partner compound selected from the group consisting of a light-emitting compound, a light-receiving compound, a radiation compound, and a quenching agent through the channel.
69.An article as in claim 68, wherein the agent is a source of electromagnetic radiation and the source of electromagnetic radiation is a light-emissive compound.
70. The article of claim 69, wherein the channel is a microchannel.
71.The article of claim 69, wherein the channel is a nanochannel.
72. The article of claim 69, wherein the surface of the wall material defining the microchannel is free of the light emissive compound.
73. The article of claim 69, wherein the light emissive compound is attached to an outer surface of the wall material.
74. The article of claim 73, wherein the light emissive compound is attached to a linker that is attached to an outer surface of the wall material.
75. The article of claim 73, wherein the light emissive compound is concentrated at an area on the outer surface of the wall material that surrounds a portion of the channel.
76. The article of claim 73 further comprising a masking layer having openings therein, the masking layer allowing only localized areas of the light emissive compound to be exposed.
77. The article of manufacture of claim 69 further comprising a second light-emissive compound different from the first light-emissive compound attached to the wall material adjacent to the channel, wherein the light-emissive compound is in close proximity to the channel and in a dose sufficient to interact with a partner light-emissive compound passing through the channel.
78.The article of claims 73-76, wherein an exterior surface of the wall material adjacent to the light emissive compound is a conductive layer.
79. The article of claim 78, wherein the wall material comprises two layers, a conductive layer and a non-conductive layer.
80. The article of claims 73-76, wherein the wall material comprises at least two layers, a first layer preventing signal generation and a second layer allowing signal generation.
81. The article of claims 73-76, wherein an exterior surface of the wall material adjacent to the light emissive compound is an opaque layer.
82. The article of claim 80, wherein the wall material comprises two layers, an opaque layer and a light transmissive support layer.
83. The article of claim 69, wherein the light emissive compound is embedded in the wall material.
84. The article of claim 83, wherein the light emissive compound is concentrated in an area of the wall material that surrounds a portion of the channel.
85. The article of claim 84, wherein the light emissive compound forms a concentric ring in the wall material around a portion of the channel.
86.The article of manufacture of claim 83, further comprising a second light-emissive compound different from the first light-emissive compound attached to the wall material adjacent to the channel, wherein
The light-emissive compound is sufficiently close to the channel and in sufficient dosage to undergo a detectable interaction with a partner light-emissive compound passing through the channel.
87. The article of claim 86, wherein the second light emissive compound is embedded in the wall material.
88. The article of claims83-87, wherein the wall material comprises a first conductive layer adjacent the first side of the light emissive compound.
89. The article of claim 88, wherein the wall material comprises a second conductive layer adjacent a second side of the light emitting compound, the first and second layers sandwiching the light emitting compound.
90. The article of claims 83-87, wherein the wall material comprises a non-conductive material and the light emissive compound is embedded in the non-conductive material.
91. The article of claims 83-87, wherein the wall material comprises a first light impermeable layer on a first side of the light emissive compound.
92.The article of claim 91, wherein the wall material comprises a second light impermeable layer on a second side of the light emissive compound, the first and second layers sandwiching the light emissive compound.
93. The article of claims 83-87, wherein the wall material is a light transmissive material.
94. An article as in claim 93, wherein the light emissive compound is embedded in the light transmissive material.
95.The article of claims 69-86 wherein the light emissive compound is embedded in the layer of light transmissive material.
96. The article of claim 89, wherein the light emissive compound is embedded in the layer of light transmissive material.
97. The article of claim 68, wherein the light emissive compound is a fluorescent compound.
98. The article of claim 69, wherein the nanochannel length is in the range of 500 angstroms to 1 millimeter.
99. The article of claim 68, wherein the channel width is between 1 and 500 angstroms.
100. The article of claim 68, wherein the wall material is comprised of two layers, a first light impermeable layer and a luminescent film layer attached to each other, and wherein the channel extends through the two layers and is defined by surfaces of the two layers.
101. The article of claim 100, wherein the channel is a nanochannel.
102. The article of claim 101, further comprising a second light-impermeable layer, the luminescent film layer being sandwiched between the first and second light-impermeable layers.
103. The article as recited in claim 101-102, wherein the surfaces defining the channel include an opaque layer surface free of the luminescent film material.
104. The article as recited in claim 100, 103, wherein the channel length is between 500 a and 1 mm.
105. The article of claim 68, wherein the agent is a fluorescence excitation source and the fluorescence excitation source is a scintillation layer.
106. The article according to claim 105, wherein the scintillation layer is selected from the group consisting of NaI (TI), ZnS (Ag), anthracene, stilbene, and plastic phosphor.
107. The article of claim 105, wherein the scintillation layer is embedded in the wall material, sandwiched between two radiation-opaque layers.
108. An article of manufacture, comprising:
a wall material having a surface defining a plurality of channels;
a station attached in a discrete area of the wall material and adjacent to at least one of the channels, wherein the station is sufficiently close to the channel and in sufficient number to cause a signal to appear upon exposure of the polymer in the station due to a detectable physical change in the polymer of the linker unit passing through the channel or in the station.
109. The article of claim 108, wherein the station is an interaction station and the interaction station is a source of electromagnetic radiation.
110. The article of claim 108, wherein the wall material is comprised of two layers, the first light impermeable layer and the luminescent film layer attached to each other, and the channel extends through the two layers and is defined by surfaces of the two layers.
111. The article of claim 108, wherein the station is a signal generating station and the signal generating station generates pulses that vary with the polymer.
112. The article of claim 108, wherein the station isan electromagnetic radiation source and the electromagnetic radiation source is a scintillation film.
113. The article of claim 112, wherein the scintillation film is embedded in the wall material, sandwiched between two radiation opaque film layers.
114. The article as recited in claim 109-113, wherein the channel is a microchannel.
115. The article as recited in claim 109-113, wherein the channel is a nanochannel.
116. An article of manufacture, comprising:
a wall material having a surface defining a channel;
a plurality of stations, each station attached to a discrete area of the wall material and adjacent to the channel, wherein the stations are sufficiently close to the channel and in sufficient number that a signal appears upon exposure of the polymer to the stations due to a detectable physical change in the polymer of the linked units passing through the channel or in the stations.
117. The article of claim 116, wherein the station is an interaction station.
118. The article of claim 116, wherein the station is a signal generating station.
119. The article of claim 116, wherein the station is an electromagnetic radiation source and the electromagnetic radiation source is a scintillation film.
120. The article as defined in claim 117-119, wherein the channel is a microchannel.
121. The article as defined in claim 117-119, wherein the channel is a nanochannel.
122. A method of analyzing a polymer of linked units, comprising:
(1) providing a labeled polymer of linked units;
(2) sequentially detecting signals from unit specific labels of less than all of the linked units; and
(3) storing the signature of the detected signal for analysis of the polymer.
123. The method of claim 122, wherein said signal is detected along a straight line.
124. The method of claim 122, wherein the signature of the signals is at least 10 signals.
125. The method of claim 122, wherein the signature of the signals defines an order of unit specific markers.
126. The method of claim 122, wherein the signature of the signal defines a distance between the unit-specific markers.
127. The method of claim 122, wherein the signature of the signal defines the number of unit specific markers.
128. The method according to claim 122, wherein all unit specific labels are detected.
129. The method of claim 122, wherein only a portion of the unit specific labels are detected.
130. The method of claim 122, wherein a portion of the polymer is randomly labeled with a unit-specific label.
131. The method of claim 129, wherein all polymer units are labeled with a unit-specific label.
132. The method of claim 122, wherein the tagged linked-unit polymer is exposed to an agent selected from the group consisting of electromagnetic radiation, a quenching source, and a fluorescence excitation source, and the signal is generated by interaction between a unit specific tag of the polymer and the agent.
133. The method of claim 122, wherein the tagged linked-unit polymer moves relative to a station and generates a signal when the unit-specific tag of the polymer is exposed to the station.
134. The method of claim 122, wherein the method is a method of identifying unit-specific tags of a polymer, the identity of a unit-specific tag being representative of at least the identity of a polymer unit, and the unit-specific tag being transiently exposed to a station to generate a signal representative of a characteristic of the unit-specific tag, and further comprising a step of distinguishing the signal as an indication of the identity of the unit-specific tag from signals generated by adjacent unit-specific tags in the polymer that generate the signal.
135. The method of claim 134, wherein the station is an agent selected from the group consisting of electromagnetic radiation, a quenching source, and a fluorescence excitation source, and the signal is a detectable electromagnetic radiation signal.
136. The method of claim 122, wherein said method is a method for determining the proximity of two unit-specific labels in a polymer, wherein the proximity of two unit-specific labels is a signature of said signal, the identity of each unit-specific label reflecting the identity of at least one polymer unit, wherein the labeled polymer is moved relative to a station to expose both unit-specific labels to said station to produce a characteristic signal arising from a detectable physical change occurring in the unit-specific label or said station; and further comprising the step of measuring a time interval that measures the length of the time interval between detection of each characteristic signal, the length of the time interval reflecting the proximity of the two unit-specific labels.
137. The method of claim 122, wherein the method is a method of determining the order of two unit-specific markers of a polymer, the identity of each unit-specific marker reflecting the identity of at least one polymer unit, wherein the order of the two unit-specific markers is the signature of the signal, wherein the marked polymer is moved linearly relative to a station, one of the unit-specific markers is exposed to the station to produce the signal as the signature of the signal, and the other unit-specific marker is then exposed to the station to produce a second detectable signal as the signature of the signal, different from the first signal; and the method further comprises an order-determining step of determining the order of the signals as an order index of the two unit-specific markers.
138. The method of claim 122, wherein the method is a method of determining the distance between two unit specific markers of a polymer, the identity of each unit specific marker reflecting the identity of at least one polymer unit, wherein the distance of two unit specific markers is a signature of the signal, wherein the labeled polymer is moved linearly with respect to a station to generate a characteristic signal as each unit specific marker passes by the station; and further comprising a step of determining the distance between the signals as an index of the distance between the two unit-specific markers.
139. A method of making a wall material comprising covalently bonding a light-emissive compound or quencher to a plurality of discrete locations on the wall material, each of said discrete locations on said wall material being in close proximity to a respective interaction station, whereby the light-emissive compound or quencher interacts with individual units of a polymer capable of interacting with said light-emissive compound or quencher to generate a signal when said individual units are located at said interaction stations.
140. The method of claim 139, wherein the light emissive compound or the quencher is covalently bonded in the wall material at discrete locations proximal to the channels defining the interaction stations.
141. The method of claim 140, wherein the channel is a nanochannel.
142. The method of claim 140, wherein the channel is a microchannel.
143. The method of claim 140, wherein the light emissive compound or the quencher is covalently bonded to the wall material in a manner whereby the surface of the wall material defining the channel is free of the light emissive compound and the quencher.
144. The method of claim 141, wherein the light emissive compound or the quencher is covalently bonded to the wall material in a manner whereby the surface of the wall material defining the channel is free of the light emissive compound and the quencher.
145. The method as recited in claim 141-144, further comprising applying a layer of conductive material to the wall material.
146. A method of attaching a chemical substrate to the edge of a channel through an opaque wall material, comprising:
providing a wall material with a photo-protected chemical group, wherein the photo-protected chemical group is selectively attached to the edge of a channel through the wall material;
applying light to the photo-protected chemical group to remove photo-protection from the chemical group; and
a chemical substrate is applied to the deprotected chemical groups.
147. The method of claim 146, wherein the light is applied to only selected areas of the surface of the wall material defining the edges of the channel.
148. The method of claim 146, wherein the channel has a first end and a second end, the edge at the first end, and light is applied to the second end, the light traversing the channel to contact the photoprotected chemical group at the first end.
149. The method of claim 146-148, wherein the channel is a microchannel.
150. The method of claim 146-148, wherein the channel is ananochannel.
151. A method of making a wall material having a light-emissive region localized on a surface of the wall material, the method comprising:
providing a wall material having a surface; and
applying a light-emissive compound to the surface so as to produce localised regions of light emission on the surface, wherein said localised regions define target areas for detection of light emission and the target areas are the edges of channels through the wall material.
152. The method of claim 151 further comprising the steps of:
attaching a chemical group with photo-protection to the surface of the wall material;
applying light to the photo-protected chemical group to remove the protection of the chemical group prior to attaching the light-emissive compound; and
the light emissive compound is attached to the chemical group from which the photo-protection has been removed.
153. The method of claim 152 wherein the light is applied to only selected areas of the surface of the wall material defining the edges of the channel.
154. The method of claim 152, wherein the photoprotective chemical group is attached to only selected regions of the surface of the wall material defining the channel edges.
155. The method of claim 152, wherein the channel has a first end and a second end, the edge at the first end, and light is applied to the second end, the light passing through the channel to contact the photo-protectedchemical group at the first end.
156. The method of claim 152-155, wherein the channel is a microchannel.
157. The method as recited in claim 152-155, wherein the channel is a nanochannel.
158. The method of claim 151 further comprising the step of positioning a mask having openings over the surface of the wall material such that only localized light-emissive regions are exposed through the openings of the mask.
159. The method of claim 158, wherein the light emissive compound is attached to a portion of the surface of the wall material.
160. A method of detecting the energy resonance transfer or quenching that can occur between two interacting partner compounds, the method comprising:
bringing the two partner compounds close enough to allow this transfer or quenching to occur;
applying an agent to one of said partners, the agent being selected from the group consisting of electromagnetic radiation, a quenching source, and a fluorescence excitation source;
shielding from electromagnetic radiation emission and interaction between said partners with a material that causes resonance transfer and quenching of fluorescence energy; and detecting the emitted electromagnetic radiation.
161. An apparatus for detecting a signal, comprising:
a housing with a surge bin;
a wall defining a surge tank portion and having a plurality of openingsfor straightening the polymer;
a sensor fixed relative to the housing, the sensor distinguishing the signal emitted by each opening from the signals emitted by the other openings to produce a sensor signal that varies with the opening; and
a memory for collecting and storing the signals.
162. The apparatus of claim 161, wherein the sensing element is a photosensor and the photosensor senses the electromagnetic radiation signals emitted by the plurality of openings.
163. The apparatus of claim 161 further comprising a microprocessor.
164. The device of claim 161, wherein the opening is defined by a microchannel in the wall.
165. The apparatus of claim 161, wherein the opening is defined by a nanochannel in a wall.
166. The apparatus as recited in claim 161-165, wherein said plurality is at least 50.
167. The apparatus as defined in claim 161-165, wherein the apparatus further comprises a second buffer chamber separated from the first buffer chamber by the wall, and wherein the two buffer chambers are in fluid communication with each other by the opening.
168. The apparatus of claim 166, wherein the apparatus further comprises a second buffer chamber separated from the first buffer chamber by the wall, and wherein the two buffer chambers are in fluid communication with each other by the opening.
169. The apparatus of claim 167 further comprising a pair of electrodes secured to the housing, one of the electrodes being positioned in the first buffer chamber and the other electrode being positioned in the second buffer chamber.
170. An apparatus for detecting a signal, comprising:
a housing defining a first buffer compartment and a second buffer compartment;
a wall supported by the housing and separating the first and second surge compartments;
a plurality of openings defined by said wall and providing fluid communication between the first and second surge chambers; and
and a sensor for distinguishing and collecting signals varying with the channel.
171. The apparatus of claim 170, wherein the channel is a nanochannel.
172. The device of claim 170, wherein the channel is a microchannel.
173. The device of claim 170, wherein the agent is selected from the group consisting of electromagnetic radiation, a quenching source, and a fluorescence excitation source.
174. A device according to claim 173 wherein said agent is electromagnetic radiation and said electromagnetic radiation is a light emitting compound.
175. The apparatus of claim 174, wherein the light emissive compound is concentrated at the channel on the wall.
176. The device according toclaim 170 and 175, further comprising means for passing biological entities through said channel.
177. A method of characterizing a test polymer, comprising:
obtaining pulses that vary with polymer for a plurality of polymers;
comparing polymer-dependent pulses obtained from a plurality of polymers;
determining the relatedness of the polymers based on the similarity between the polymer-dependent pulses of the polymers; and
the characteristics of the test polymer are described based on the polymer-dependent pulses of the relevant polymer.
178. The method of claim 177, wherein the plurality of polymers is a homogenous population.
179. The method of claim 177, wherein the plurality of polymers is a heterogeneous population.
180. The method of claim 177, wherein the polymer is randomly labeled.
181. The method of claim 177, wherein the polymer is a polymer having at least two different linking units, and wherein the at least two different linking units are labeled to produce different signals.
182. The method of claim 177-181, wherein the polymer is a nucleic acid.
183. The method of claim 182, wherein the obtained polymer-dependent pulses comprise a polymer-dependent pulse sequence.
184. The method ofclaim 182, wherein the obtained polymer dependent pulses comprise time intervals between specific signals.
185. The method of claim 182, wherein the polymer-dependent pulses are obtained by moving a plurality of polymers linearly past a signal generating station.
186. A method as in claim 182, wherein the obtained polymer-dependent pulses comprise polymer-dependent pulse numbers.
187. A method of sequencing a polymer of linked units, comprising:
obtaining polymer-dependent pulses from a plurality of overlapping polymers, each polymer having at least a portion of the same sequence of linked units as the remaining polymers; and
these polymer-dependent pulses are compared to obtain the same sequence of linked units in a large number of polymers.
188. The method of claim 187, wherein the polymer-dependent pulse is optically detectable.
189. The method of claim 187, wherein the plurality of polymers is a homogenous population.
190. The method of claim 187, wherein the plurality of polymers is a heterogeneous population.
191. The method of claim 187, wherein the plurality of polymers are randomly labeled.
192. The method of claim 187-191 wherein the polymer is a nucleic acid.
193. The method of claim 193, wherein the nucleic acid is labeled with an agent selected from the group consisting of a source of electromagnetic radiation, a source of quenching, and a source of fluorescence excitation.
194. A method of labeling a nucleic acid comprising:
contacting the dividing cell with a nucleotide analog;
isolating cellular nucleic acid that has been combined with the nucleotide analog; and
nucleic acids incorporating nucleotide analogs are modified by labeling the incorporated nucleotide analogs.
195. The method of claim 194, wherein the nucleotide analog is a brominated analog.
196. The method of claim 194, wherein the method of contacting dividing cells with a nucleotide analog is:
preventing cell growth during the cell division cycle;
completing the contacting step; and
allowing the cell to re-enter the cell division cycle.
197. The method of claim 194, wherein the nucleic acid is isolated after a cell has re-entered and completed a cell division cycle and before completion of a next cell division cycle.
198. The method of claim 194-197, wherein the incorporated nucleotide analog is labeled with an agent selected from the group consisting of an electromagnetic radiation source, a quenching source, a fluorescence excitation source, and a radiation source.
199. A method of determining the order of units of a polymer of linked units, comprising:
(1) allowing the polymer to move linearly relative to a station;
(2) measuring the polymer-dependent pulse generated by each individual unit as it passes by the station, i.e. each of the two individual units generates a characteristic signal;
(3) repeating steps (1) and (2) for a plurality of like polymers;
(4) determining an order of at least two individual units from information obtained from the plurality of homogeneous polymers.
200. The method of claim 199, wherein the station is a signal generating station.
201. The method of claim 199, wherein the stations are interaction stations.
202. The method of claim 199, wherein step (2) comprises measuring the generated electromagnetic radiation signal.
203. The method of claim 199, wherein the plurality of homogeneous polymers is a homogeneous population.
204. The method of claim 199, wherein the plurality of homogeneous polymers is a heterogeneous population.
205. The method of claim 199, wherein the polymer is a nucleic acid.
206. A method of analyzing a group of polymers, each polymer in the group being an independent polymer of linked units, the method comprising:
orienting the polymers of the group parallel to each other, and
detecting a polymer characteristic of said polymer.
207. The method of claim 206, wherein the polymer is oriented by application of an electric field.
208. The method of claim 206, wherein the characteristic polymer characteristic is an order of linking units in the polymer.
209. The method of claim 206, wherein the detecting step is performed simultaneously with respect to the polymer.
210. The method of claim 206, wherein the detecting step comprises measuring electromagnetic radiation signals.
211. A method as in claim 206, wherein the detecting step comprises moving a relatively large number of signal generating stations of the polymer in a straight line and detecting and distinguishing between signals generated as the polymer passes through the interaction stations.
212. The method of claim 206-211, wherein the polymers are a homogenous population.
213. The method of claim 206-211, wherein the polymer is a heterogeneous population.
214. The method of claim 206-211, wherein the polymer is randomly labeled.
215. The method of claim 206-211 wherein the orienting step is performed in a gel-free solution.
216. A method of analyzing a population of polymers, each polymer in the population being an independent polymer of linked units, the method comprising:
orienting the set of polymers in an electric field;
moving the set of polymers simultaneously through the respective channels; and
the characteristic polymer characteristics are detected as these polymers pass through the channel.
217. The method of claim 216, wherein the channel is a nanochannel.
218. The method of claim 216, wherein the characteristic polymer characteristic is an order of linking units in the polymer.
219. The method of claim 216, wherein the detecting step is performed simultaneously with respect to the polymer.
220. The method of claim 216, wherein the detecting step comprises measuring electromagnetic radiation signals.
221. A method as in claim 216, wherein the detecting step comprises moving a relatively large number of signal generating stations of said polymer in a linear motion and detecting and distinguishing polymer-dependent pulses generated as said polymer passes through said signal generating stations.
222. The method of claim 216 and 221 wherein the polymers are a homogenous population.
223. The method of claim 216-221, wherein the polymer is a heterogeneous population.
224. The method as defined in claim 216 and 221, wherein the polymer is randomly labeled.
225. The method of claim 216-221 wherein the orienting step is performed in a gel-free solution.
226. An apparatus for optically detecting a plurality of signals, the apparatus comprising:
a housing with a surge bin;
a wall material defining a portion of the surge bin, the wall comprising a polymer interaction station; and
a light sensitive element secured to the housing, the light sensitive element being constructed and arranged to detect electromagnetic radiation signals emitted at the interaction station.
227. A computer system for responding to a request using information characterizing a plurality of linked-unit polymers, comprising:
a memory storing a plurality of records of polymers in a manner to access each polymer using a marker word exclusive to the polymer, the records including information reflecting sequential detected signals resulting from a detectable physical change occurring in a plurality of individual units of the polymer or stations to which the polymer is exposed; and
a processor accessing a record of a selected polymer stored in the memory according to the indicia exclusive to the selected polymer.
228. The system of claim 227, wherein the sequentially detected signals are the result of a plurality of polymer individual unit interactions exposed to an agent selected from the group consisting of electromagnetic radiation, a quenching source, and a fluorescence excitation source.
229. The system of claim 227 further comprising:
a comparison device that compares the sequentially detected signals of the selected polymer to signatures representative of known polymer characteristics to determine the relatedness of the selected polymer to the known polymer.
Applications Claiming Priority (4)
| Application Number | Priority Date | Filing Date | Title |
|---|---|---|---|
| US3792197P | 1997-02-12 | 1997-02-12 | |
| US60/037,921 | 1997-02-12 | ||
| US6468797P | 1997-11-05 | 1997-11-05 | |
| US60/064,687 | 1997-11-05 |
Publications (1)
| Publication Number | Publication Date |
|---|---|
| CN1251609A true CN1251609A (en) | 2000-04-26 |
Family
ID=26714627
Family Applications (1)
| Application Number | Title | Priority Date | Filing Date |
|---|---|---|---|
| CN98803852A Pending CN1251609A (en) | 1997-02-12 | 1998-02-11 | Method and product for analyzing polymers |
Country Status (10)
| Country | Link |
|---|---|
| US (5) | US6355420B1 (en) |
| EP (1) | EP1009802B1 (en) |
| JP (1) | JP3935509B2 (en) |
| CN (1) | CN1251609A (en) |
| AT (1) | ATE273381T1 (en) |
| AU (1) | AU762888B2 (en) |
| CA (1) | CA2281205A1 (en) |
| DE (1) | DE69825601T2 (en) |
| IL (2) | IL131332A (en) |
| WO (1) | WO1998035012A2 (en) |
Cited By (7)
| Publication number | Priority date | Publication date | Assignee | Title |
|---|---|---|---|---|
| CN101915957B (en) * | 2006-06-12 | 2012-12-12 | 加利福尼亚太平洋生物科学公司 | Substrates for performing analytical reactions |
| CN108463714A (en) * | 2016-01-13 | 2018-08-28 | 马克斯-普朗克科学促进学会 | The emission lifetime measurement method and equipment of average life span for measuring excited electronic state |
| CN108646332A (en) * | 2018-06-11 | 2018-10-12 | 中南大学 | The building method of novel zone plate and its zone plate is made |
| CN109477813A (en) * | 2016-07-05 | 2019-03-15 | 昆塔波尔公司 | Based on optical nano-pore sequencing |
| CN111213635A (en) * | 2018-11-23 | 2020-06-02 | 江苏龙灯化学有限公司 | Composition containing bifenazate and hexythiazox |
| CN111931898A (en) * | 2020-07-23 | 2020-11-13 | 兰州理工大学 | Intelligent electrolytic aluminum distribution scheduling method based on deep immune clone algorithm |
| CN115060772A (en) * | 2022-08-16 | 2022-09-16 | 天津市协和医药科技集团有限公司 | CA50 antigen electrochemical detection method based on functionalized nucleopore membrane |
Families Citing this family (461)
| Publication number | Priority date | Publication date | Assignee | Title |
|---|---|---|---|---|
| US6150089A (en) * | 1988-09-15 | 2000-11-21 | New York University | Method and characterizing polymer molecules or the like |
| US6652808B1 (en) * | 1991-11-07 | 2003-11-25 | Nanotronics, Inc. | Methods for the electronic assembly and fabrication of devices |
| EP0779935A4 (en) * | 1994-08-31 | 2006-07-19 | Univ Johns Hopkins Med | Detection of hypermutable nucleic acid sequence in tissue |
| US6362002B1 (en) * | 1995-03-17 | 2002-03-26 | President And Fellows Of Harvard College | Characterization of individual polymer molecules based on monomer-interface interactions |
| US20120160687A1 (en) | 1995-03-17 | 2012-06-28 | President And Fellows Of Harvard College | Characterization of individual polymer molecules based on monomer-interface interactions |
| US20020028443A1 (en) * | 1999-09-27 | 2002-03-07 | Jay M. Short | Method of dna shuffling with polynucleotides produced by blocking or interrupting a synthesis or amplification process |
| US6881571B1 (en) * | 1998-03-11 | 2005-04-19 | Exonhit Therapeutics S.A. | Qualitative differential screening |
| US6403311B1 (en) | 1997-02-12 | 2002-06-11 | Us Genomics | Methods of analyzing polymers using ordered label strategies |
| DE69825601T2 (en) | 1997-02-12 | 2005-04-28 | Chan, Eugene Y, Brookline | METHOD FOR THE ANALYSIS OF POLYMERS |
| US6143496A (en) | 1997-04-17 | 2000-11-07 | Cytonix Corporation | Method of sampling, amplifying and quantifying segment of nucleic acid, polymerase chain reaction assembly having nanoliter-sized sample chambers, and method of filling assembly |
| US7001996B1 (en) * | 1997-08-21 | 2006-02-21 | The United States Of America As Represented By The Secretary Of The Army | Enzymatic template polymerization |
| US6833242B2 (en) * | 1997-09-23 | 2004-12-21 | California Institute Of Technology | Methods for detecting and sorting polynucleotides based on size |
| GB9725197D0 (en) * | 1997-11-29 | 1998-01-28 | Secr Defence | Detection system |
| US20020177144A1 (en) * | 1997-12-30 | 2002-11-28 | Jose Remacle | Detection and/or quantification method of a target molecule by a binding with a capture molecule fixed on the surface of a disc |
| US20050053962A1 (en) * | 1998-01-27 | 2005-03-10 | Gary Blackburn | Amplification of nucleic acids with electronic detection |
| US7875440B2 (en) | 1998-05-01 | 2011-01-25 | Arizona Board Of Regents | Method of determining the nucleotide sequence of oligonucleotides and DNA molecules |
| US6780591B2 (en) * | 1998-05-01 | 2004-08-24 | Arizona Board Of Regents | Method of determining the nucleotide sequence of oligonucleotides and DNA molecules |
| US20040203078A1 (en) * | 1998-07-22 | 2004-10-14 | National Institute Of Advanced Industrial Science And Technology | Labeled complex, process for producing same and process for utilizing same |
| US6210896B1 (en) | 1998-08-13 | 2001-04-03 | Us Genomics | Molecular motors |
| US6263286B1 (en) | 1998-08-13 | 2001-07-17 | U.S. Genomics, Inc. | Methods of analyzing polymers using a spatial network of fluorophores and fluorescence resonance energy transfer |
| US6790671B1 (en) | 1998-08-13 | 2004-09-14 | Princeton University | Optically characterizing polymers |
| AU5560699A (en) * | 1998-08-13 | 2000-03-06 | U.S. Genomics, Inc. | Optically characterizing polymers |
| US20020012916A1 (en) * | 1998-10-14 | 2002-01-31 | Gundling Gerard J | A method of reducing contamination in an essay vessel |
| US6261779B1 (en) * | 1998-11-10 | 2001-07-17 | Bio-Pixels Ltd. | Nanocrystals having polynucleotide strands and their use to form dendrimers in a signal amplification system |
| US6232075B1 (en) * | 1998-12-14 | 2001-05-15 | Li-Cor, Inc. | Heterogeneous assay for pyrophosphate detection |
| US7655443B1 (en) * | 1999-05-07 | 2010-02-02 | Siemens Healthcare Diagnostics, Inc. | Nucleic acid sequencing with simultaneous quantitation |
| US20030096321A1 (en) * | 1999-05-19 | 2003-05-22 | Jose Remacle | Method for the identification and/or the quantification of a target compound obtained from a biological sample upon chips |
| US7056661B2 (en) | 1999-05-19 | 2006-06-06 | Cornell Research Foundation, Inc. | Method for sequencing nucleic acid molecules |
| EP1192453B1 (en) * | 1999-06-22 | 2012-02-15 | President and Fellows of Harvard College | Molecular and atomic scale evaluation of biopolymers |
| US6818395B1 (en) * | 1999-06-28 | 2004-11-16 | California Institute Of Technology | Methods and apparatus for analyzing polynucleotide sequences |
| US7501245B2 (en) * | 1999-06-28 | 2009-03-10 | Helicos Biosciences Corp. | Methods and apparatuses for analyzing polynucleotide sequences |
| US7045287B2 (en) * | 1999-07-20 | 2006-05-16 | Agilent Technologies, Inc. | Method for contacting fluid components with moieties on a surface |
| US6696022B1 (en) | 1999-08-13 | 2004-02-24 | U.S. Genomics, Inc. | Methods and apparatuses for stretching polymers |
| US6927065B2 (en) | 1999-08-13 | 2005-08-09 | U.S. Genomics, Inc. | Methods and apparatus for characterization of single polymers |
| US6762059B2 (en) | 1999-08-13 | 2004-07-13 | U.S. Genomics, Inc. | Methods and apparatuses for characterization of single polymers |
| US6846626B1 (en) * | 1999-09-01 | 2005-01-25 | Genome Technologies, Llc | Method for amplifying sequences from unknown DNA |
| AU7105300A (en) | 1999-09-03 | 2001-04-10 | Lifebeam Technologies, Inc. | Optical system for rapid polymer analysis |
| US6274320B1 (en) * | 1999-09-16 | 2001-08-14 | Curagen Corporation | Method of sequencing a nucleic acid |
| US7211390B2 (en) * | 1999-09-16 | 2007-05-01 | 454 Life Sciences Corporation | Method of sequencing a nucleic acid |
| US7244559B2 (en) * | 1999-09-16 | 2007-07-17 | 454 Life Sciences Corporation | Method of sequencing a nucleic acid |
| FR2798673B1 (en) * | 1999-09-16 | 2004-05-28 | Exonhit Therapeutics Sa | METHODS AND COMPOSITIONS FOR DETECTION OF PATHOLOGICAL EVENTS |
| GB9923644D0 (en) * | 1999-10-06 | 1999-12-08 | Medical Biosystems Ltd | DNA sequencing |
| US6908736B1 (en) * | 1999-10-06 | 2005-06-21 | Medical Biosystems, Ltd. | DNA sequencing method |
| US7220541B2 (en) | 2000-01-24 | 2007-05-22 | Ingeneus, Inc. | Homogeneous assay of biopolymer binding by means of multiple measurements under varied conditions |
| US8232582B2 (en) | 2000-04-24 | 2012-07-31 | Life Technologies Corporation | Ultra-fast nucleic acid sequencing device and a method for making and using the same |
| DE10023423B4 (en) * | 2000-05-12 | 2009-03-05 | Gnothis Holding Sa | Direct detection of single molecules |
| US20060008799A1 (en) * | 2000-05-22 | 2006-01-12 | Hong Cai | Rapid haplotyping by single molecule detection |
| DE50108396D1 (en) * | 2000-07-01 | 2006-01-19 | Clondiag Chip Tech Gmbh | PROCESS FOR THE QUALITATIVE AND / OR QUANTITATIVE DETECTION OF MOLECULAR INTERACTIONS ON PROBE ARRAYS |
| EP1975251A3 (en) * | 2000-07-07 | 2009-03-25 | Visigen Biotechnologies, Inc. | Real-time sequence determination |
| US20070172866A1 (en) * | 2000-07-07 | 2007-07-26 | Susan Hardin | Methods for sequence determination using depolymerizing agent |
| US20050260574A1 (en) * | 2000-07-27 | 2005-11-24 | Gibbs Mark J | Combinatorial probes and uses therefor |
| US20050266494A1 (en) * | 2000-09-06 | 2005-12-01 | Hodge Timothy A | System and method for computer network ordering of biological testing |
| EP1978110B1 (en) * | 2000-09-06 | 2010-05-26 | Transnetyx, Inc. | Computer-based method and system for screening genomic DNA |
| US20050272085A1 (en) * | 2000-09-06 | 2005-12-08 | Hodge Timothy A | Methods for forensic and congenic screening |
| US7494817B2 (en) * | 2000-09-06 | 2009-02-24 | Transnet Yx, Inc. | Methods for genotype screening using magnetic particles |
| US20050239125A1 (en) * | 2000-09-06 | 2005-10-27 | Hodge Timothy A | Methods for genotype screening |
| US20030207289A1 (en) * | 2001-09-04 | 2003-11-06 | Hodge Timothy A. | Detection of genetic sequences using a bipartite probe |
| DE10048944A1 (en) * | 2000-10-03 | 2002-04-18 | Andreas Kage | Process for the selection of nucleic acids that bind highly affine to a target by two-dimensional separation |
| AU2002211566A1 (en) * | 2000-10-10 | 2002-04-22 | Grant W. Waterer | Method for identifying increased risk of death from community acquired pneumonia |
| EP1343973B2 (en) | 2000-11-16 | 2020-09-16 | California Institute Of Technology | Apparatus and methods for conducting assays and high throughput screening |
| US6936433B2 (en) * | 2000-11-27 | 2005-08-30 | The Regents Of The University Of California | Methods and devices for characterizing duplex nucleic acid molecules |
| US20020142326A1 (en) * | 2000-11-30 | 2002-10-03 | Coull James M. | Methods and compositions for sorting and/or determining organisms |
| EP1354064A2 (en) * | 2000-12-01 | 2003-10-22 | Visigen Biotechnologies, Inc. | Enzymatic nucleic acid synthesis: compositions and methods for altering monomer incorporation fidelity |
| FI115139B (en) * | 2001-01-10 | 2005-03-15 | Valtion Teknillinen | Method and test package for quantitative and / or comparative assessment of the variations of polynucleotide amounts in cell or tissue samples |
| JP2002233382A (en) * | 2001-02-09 | 2002-08-20 | Sapporo Breweries Ltd | Method for discriminating beer yeasts |
| JP3883815B2 (en) * | 2001-02-20 | 2007-02-21 | 日立ソフトウエアエンジニアリング株式会社 | Hybridization reaction method and hybridization instrument |
| WO2003012147A1 (en) * | 2001-02-20 | 2003-02-13 | Datascope Investment Corp. | Method for reusing standard blots and microarrays utilizing dna dendrimer technology |
| JP2002329473A (en) * | 2001-02-27 | 2002-11-15 | Jeol Ltd | Transmission type electron microscope equipped with x- ray spectroscope |
| EP1370690B1 (en) | 2001-03-16 | 2012-03-14 | Kalim Mir | Arrays and methods of use |
| US6681648B1 (en) * | 2001-04-04 | 2004-01-27 | The Regents Of The University Of California | Meniscus membranes for separations |
| US6960437B2 (en) * | 2001-04-06 | 2005-11-01 | California Institute Of Technology | Nucleic acid amplification utilizing microfluidic devices |
| US6717146B2 (en) * | 2001-05-24 | 2004-04-06 | Applied Materials, Inc. | Tandem microchannel plate and solid state electron detector |
| GB0112868D0 (en) * | 2001-05-25 | 2001-07-18 | Secr Defence | Detection system |
| DE10126630A1 (en) * | 2001-05-31 | 2003-01-09 | Peter Und Traudl Engelhorn Sti | Cell sorting method |
| WO2002097058A2 (en) * | 2001-05-31 | 2002-12-05 | Iowa State University Research Foundation, Inc. | Genetic markers for improved disease resistance in animals (nramp1) |
| EP1402069A4 (en) * | 2001-06-08 | 2006-01-25 | Us Genomics Inc | Methods and products for analyzing nucleic acids using nick translation |
| WO2002101353A2 (en) * | 2001-06-08 | 2002-12-19 | U.S. Genomics, Inc. | Methods and products for analyzing nucleic acids based on methylation status |
| EP1478771A4 (en) * | 2001-06-21 | 2005-06-15 | Harvard College | Methods for characterization of nucleic acid molecules |
| US20030104428A1 (en) * | 2001-06-21 | 2003-06-05 | President And Fellows Of Harvard College | Method for characterization of nucleic acid molecules |
| DE10132211A1 (en) * | 2001-06-27 | 2003-01-16 | Epigenomics Ag | Detection of specific dinucleotides in DNA samples by fluorescence resonance energy transfer (FRET) |
| US7189577B2 (en) * | 2001-07-02 | 2007-03-13 | Fuji Photo Film Co., Ltd. | Biochemical analysis kit and method for exposing stimulable phosphor sheet |
| US20030096268A1 (en) * | 2001-07-06 | 2003-05-22 | Michael Weiner | Method for isolation of independent, parallel chemical micro-reactions using a porous filter |
| US7668697B2 (en) * | 2006-02-06 | 2010-02-23 | Andrei Volkov | Method for analyzing dynamic detectable events at the single molecule level |
| JP4312595B2 (en) * | 2001-07-11 | 2009-08-12 | ベイラー カレッジ オブ メディシン | Method and apparatus based on a novel form of nucleic acid duplex on a surface |
| US10272409B2 (en) | 2001-07-11 | 2019-04-30 | Michael E. Hogan | Methods and devices based upon a novel form of nucleic acid duplex on a surface |
| US6514617B1 (en) | 2001-07-11 | 2003-02-04 | General Electric Company | Tagging materials for polymers, methods, and articles made thereby |
| AU2002365115A1 (en) * | 2001-07-20 | 2003-09-02 | North Carolina State University | Light addressable electrochemical detection of duplex structures |
| EP1417474B1 (en) | 2001-07-25 | 2021-12-29 | The Trustees Of Princeton University | Nanochannel arrays and their preparation and use for high throughput macromolecular analysis |
| US9678038B2 (en) | 2001-07-25 | 2017-06-13 | The Trustees Of Princeton University | Nanochannel arrays and their preparation and use for high throughput macromolecular analysis |
| US6639632B2 (en) * | 2001-07-25 | 2003-10-28 | Huang-Chung Cheng | Backlight module of liquid crystal display |
| US20060014186A1 (en) * | 2001-09-04 | 2006-01-19 | Hodge Timothy A | Methods for genotype screening of a strain disposed on an adsorbent carrier |
| GB0121700D0 (en) * | 2001-09-07 | 2001-10-31 | Univ Leicester | Detection of fluorescence |
| US20030054396A1 (en) * | 2001-09-07 | 2003-03-20 | Weiner Michael P. | Enzymatic light amplification |
| US20090065471A1 (en) * | 2003-02-10 | 2009-03-12 | Faris Sadeg M | Micro-nozzle, nano-nozzle, manufacturing methods therefor, applications therefor |
| US8423294B2 (en) | 2001-09-18 | 2013-04-16 | Pathogenetix, Inc. | High resolution linear analysis of polymers |
| JP2005504275A (en) * | 2001-09-18 | 2005-02-10 | ユー.エス. ジェノミクス, インコーポレイテッド | Differential tagging of polymers for high-resolution linear analysis |
| US7298461B2 (en) * | 2001-10-09 | 2007-11-20 | Ruprecht-Karls-Universitat | Far field light microscopical method, system and computer program product for analysing at least one object having a subwavelength size |
| US20030124592A1 (en) * | 2001-10-24 | 2003-07-03 | Bioprofile, Llc | Methods for detecting genetic haplotypes by interaction with probes |
| US20030138819A1 (en) * | 2001-10-26 | 2003-07-24 | Haiqing Gong | Method for detecting disease |
| US6956114B2 (en) | 2001-10-30 | 2005-10-18 | '454 Corporation | Sulfurylase-luciferase fusion proteins and thermostable sulfurylase |
| US6902921B2 (en) * | 2001-10-30 | 2005-06-07 | 454 Corporation | Sulfurylase-luciferase fusion proteins and thermostable sulfurylase |
| US20050124022A1 (en) * | 2001-10-30 | 2005-06-09 | Maithreyan Srinivasan | Novel sulfurylase-luciferase fusion proteins and thermostable sulfurylase |
| EP1463796B1 (en) | 2001-11-30 | 2013-01-09 | Fluidigm Corporation | Microfluidic device and methods of using same |
| US7279046B2 (en) * | 2002-03-27 | 2007-10-09 | Nanoink, Inc. | Method and apparatus for aligning patterns on a substrate |
| WO2003085379A2 (en) * | 2002-04-01 | 2003-10-16 | Fluidigm Corporation | Microfluidic particle-analysis systems |
| US7312085B2 (en) * | 2002-04-01 | 2007-12-25 | Fluidigm Corporation | Microfluidic particle-analysis systems |
| US7652574B2 (en) * | 2002-04-08 | 2010-01-26 | Sayegh Adel O | Article surveillance tag having a vial |
| JP4799861B2 (en) | 2002-04-16 | 2011-10-26 | プリンストン ユニバーシティ | Gradient structure for interface between microfluidic and nanofluid, and its manufacturing and use |
| AU2003228649A1 (en) * | 2002-04-23 | 2003-11-10 | U.S.Genomics, Inc. | Compositions and methods related to two-arm nucleic acid probes |
| US8383342B2 (en) | 2002-04-24 | 2013-02-26 | The University Of North Carolina At Greensboro | Compositions, products, methods and systems to monitor water and other ecosystems |
| US7214492B1 (en) | 2002-04-24 | 2007-05-08 | The University Of North Carolina At Greensboro | Nucleic acid arrays to monitor water and other ecosystems |
| US8048623B1 (en) | 2002-04-24 | 2011-11-01 | The University Of North Carolina At Greensboro | Compositions, products, methods and systems to monitor water and other ecosystems |
| US9126165B1 (en) | 2002-04-24 | 2015-09-08 | The University Of North Carolina At Greensboro | Nucleic acid arrays to monitor water and other ecosystems |
| US8278055B2 (en) * | 2002-05-01 | 2012-10-02 | Intel Corporation | Methods and device for analyte characterization |
| US7744816B2 (en) * | 2002-05-01 | 2010-06-29 | Intel Corporation | Methods and device for biomolecule characterization |
| WO2004048514A2 (en) * | 2002-05-09 | 2004-06-10 | U.S. Genomics, Inc. | Methods for analyzing a nucleic acid |
| DE10220935B3 (en) * | 2002-05-10 | 2004-02-05 | Siemens Ag | Methods for the biochemical analysis of DNA and associated arrangement |
| WO2003100099A1 (en) * | 2002-05-24 | 2003-12-04 | Cygene, Inc. | Parallel stranded duplexes of deoxyribonucleic acid and methods of use |
| US7282330B2 (en) | 2002-05-28 | 2007-10-16 | U.S. Genomics, Inc. | Methods and apparati using single polymer analysis |
| US7371520B2 (en) | 2002-05-28 | 2008-05-13 | U.S. Genomics, Inc. | Methods and apparati using single polymer analysis |
| DK1512015T3 (en) * | 2002-06-12 | 2009-07-06 | Genencor Int | Methods for improving the binding properties of a molecule |
| US6952651B2 (en) * | 2002-06-17 | 2005-10-04 | Intel Corporation | Methods and apparatus for nucleic acid sequencing by signal stretching and data integration |
| US8168139B2 (en) * | 2002-06-24 | 2012-05-01 | Fluidigm Corporation | Recirculating fluidic network and methods for using the same |
| FI20021325A0 (en) * | 2002-07-05 | 2002-07-05 | Valtion Teknillinen | Method and kit for determining the amount of individual polynucleotides |
| JP2005533256A (en) * | 2002-07-17 | 2005-11-04 | ユー.エス. ジェノミクス, インコーポレイテッド | Methods and compositions for analyzing polymers using chimeric tags |
| US7076472B2 (en) * | 2002-08-05 | 2006-07-11 | Edwin Addison | Knowledge-based methods for genetic network analysis and the whole cell computer system based thereon |
| US11008359B2 (en) | 2002-08-23 | 2021-05-18 | Illumina Cambridge Limited | Labelled nucleotides |
| US20040197845A1 (en) * | 2002-08-30 | 2004-10-07 | Arjang Hassibi | Methods and apparatus for pathogen detection, identification and/or quantification |
| US20040110205A1 (en) * | 2002-09-23 | 2004-06-10 | Hui Wang | Methods and systems for nanopore data analysis |
| US7143785B2 (en) | 2002-09-25 | 2006-12-05 | California Institute Of Technology | Microfluidic large scale integration |
| DE10245715A1 (en) * | 2002-10-01 | 2004-04-15 | Philips Intellectual Property & Standards Gmbh | Method and device for generating partial images |
| JP5695287B2 (en) | 2002-10-02 | 2015-04-01 | カリフォルニア インスティテュート オブ テクノロジー | Nucleic acid analysis of microfluids |
| GB0223563D0 (en) * | 2002-10-10 | 2002-11-20 | Secr Defence | Detection system |
| GB0223666D0 (en) * | 2002-10-10 | 2002-11-20 | Univ Cambridge Tech | Arrays of molecules and their production |
| US20040166514A1 (en) * | 2002-11-19 | 2004-08-26 | Singulex, Inc. | Detection of target molecules through interaction with probes |
| GB2395557A (en) * | 2002-11-22 | 2004-05-26 | Dynal Biotech Ltd | Nucleic acid probes |
| ATE534748T1 (en) * | 2002-12-12 | 2011-12-15 | Nanosphere Inc | DIRECT SNP DETECTION USING NON-AMPLIFIED DNA |
| US20090246879A1 (en) * | 2002-12-20 | 2009-10-01 | Callida Genomics | Materials and Methods Relating to Nano-Tags and Nano-Brands |
| US7001669B2 (en) | 2002-12-23 | 2006-02-21 | The Administration Of The Tulane Educational Fund | Process for the preparation of metal-containing nanostructured films |
| US20040180369A1 (en) * | 2003-01-16 | 2004-09-16 | North Carolina State University | Photothermal detection of nucleic acid hybridization |
| US7312257B2 (en) * | 2003-01-23 | 2007-12-25 | General Electric Company | Polymer encapsulation of high aspect ratio materials and methods of making same |
| EP1586068B1 (en) * | 2003-01-23 | 2008-07-30 | U.S. Genomics, Inc. | Methods for analyzing polymer populations |
| US20090186343A1 (en) * | 2003-01-28 | 2009-07-23 | Visigen Biotechnologies, Inc. | Methods for preparing modified biomolecules, modified biomolecules and methods for using same |
| ES2338654T5 (en) * | 2003-01-29 | 2017-12-11 | 454 Life Sciences Corporation | Pearl emulsion nucleic acid amplification |
| US7575865B2 (en) * | 2003-01-29 | 2009-08-18 | 454 Life Sciences Corporation | Methods of amplifying and sequencing nucleic acids |
| US7282130B2 (en) * | 2003-01-31 | 2007-10-16 | Agilent Technologies, Inc. | Apparatus and method for control of biopolymer translocation through a nanopore |
| US20050014134A1 (en) * | 2003-03-06 | 2005-01-20 | West Jason Andrew Appleton | Viral identification by generation and detection of protein signatures |
| US10533998B2 (en) | 2008-07-18 | 2020-01-14 | Bio-Rad Laboratories, Inc. | Enzyme quantification |
| WO2004092403A1 (en) * | 2003-04-03 | 2004-10-28 | University Of Washington | Microwell arrays with nanoholes |
| US7604965B2 (en) | 2003-04-03 | 2009-10-20 | Fluidigm Corporation | Thermal reaction device and method for using the same |
| JP2006522940A (en) * | 2003-04-10 | 2006-10-05 | ユー.エス. ジェノミクス, インコーポレイテッド | Manipulating polymers in microchannels |
| US20040259135A1 (en) * | 2003-05-09 | 2004-12-23 | Cleary Michael D. | Biosynthetic labeling and separation of RNA |
| WO2004104172A2 (en) * | 2003-05-15 | 2004-12-02 | Bioarray Solutions, Ltd. | Hybridization-mediated analysis of polymorphisms |
| DE10323685A1 (en) * | 2003-05-22 | 2004-12-09 | Rühe, Jürgen, Prof. Dr. | Process for the covalent immobilization of probe biomolecules on organic surfaces |
| ITTO20030409A1 (en) * | 2003-06-03 | 2004-12-04 | Fiat Ricerche | OPTICAL BIOSENSOR. |
| US20050170367A1 (en) * | 2003-06-10 | 2005-08-04 | Quake Stephen R. | Fluorescently labeled nucleoside triphosphates and analogs thereof for sequencing nucleic acids |
| DE602004019926D1 (en) * | 2003-06-30 | 2009-04-23 | Panasonic Corp | METHOD FOR MODIFYING A NUCLEOTIDE CHAIN |
| US20100291637A1 (en) * | 2003-06-30 | 2010-11-18 | Panasonic Corporation | Method for modifying nucleotide chain |
| US20120077206A1 (en) | 2003-07-12 | 2012-03-29 | Accelr8 Technology Corporation | Rapid Microbial Detection and Antimicrobial Susceptibility Testing |
| US7341841B2 (en) * | 2003-07-12 | 2008-03-11 | Accelr8 Technology Corporation | Rapid microbial detection and antimicrobial susceptibility testing |
| CA2956645A1 (en) | 2003-07-12 | 2005-03-31 | David A. Goldberg | Sensitive and rapid biodetection |
| EP1498492B1 (en) * | 2003-07-15 | 2011-11-02 | Lukas Bestmann | Apparatus for the preparation of samples |
| US20090088982A1 (en) * | 2003-07-31 | 2009-04-02 | Fukushima Noelle H | Co-detection of single polypeptide and polynucleotide molecules |
| WO2005012575A1 (en) * | 2003-08-01 | 2005-02-10 | U.S. Genomics, Inc. | Methods and compositions related to the use of sequence-specific endonucleases for analyzing nucleic acids under non-cleaving conditions |
| WO2005017205A2 (en) * | 2003-08-04 | 2005-02-24 | U. S. Genomics, Inc. | Nucleic acid mapping using linear analysis |
| CN1580283A (en) * | 2003-08-13 | 2005-02-16 | 清华大学 | Method for detecting nucleic acid molecule |
| US7846738B2 (en) | 2003-08-15 | 2010-12-07 | President And Fellows Of Harvard College | Study of polymer molecules and conformations with a nanopore |
| WO2005022162A1 (en) * | 2003-08-21 | 2005-03-10 | U.S. Genomics, Inc. | Quantum dots and methods of use thereof |
| GB0319949D0 (en) * | 2003-08-26 | 2003-09-24 | Univ Strathclyde | Nucleic acid sequence identification |
| US7198900B2 (en) * | 2003-08-29 | 2007-04-03 | Applera Corporation | Multiplex detection compositions, methods, and kits |
| US20050048498A1 (en) * | 2003-08-29 | 2005-03-03 | Applera Corporation | Compositions, methods, and kits for assembling probes |
| US20050069895A1 (en) * | 2003-08-29 | 2005-03-31 | Applera Corporation | Compositions, methods, and kits for fabricating coded molecular tags |
| WO2005074417A2 (en) * | 2003-09-03 | 2005-08-18 | Salk Institute For Biological Studies | Multiple antigen detection assays and reagents |
| US20080021674A1 (en) * | 2003-09-30 | 2008-01-24 | Robert Puskas | Methods for Enhancing the Analysis of Particle Detection |
| WO2005085849A2 (en) * | 2003-10-24 | 2005-09-15 | U S. Genomics, Inc | Biohazard identification by fluorescent immunoassay and single molecule detection |
| US20100000881A1 (en) * | 2003-10-30 | 2010-01-07 | North Carolina State University | Electrochemical detection of nucleic acid hybridization |
| US20050095599A1 (en) * | 2003-10-30 | 2005-05-05 | Pittaro Richard J. | Detection and identification of biopolymers using fluorescence quenching |
| US20050191651A1 (en) * | 2003-10-30 | 2005-09-01 | North Carolina State University | Temperature-jump enhanced electrochemical detection of nucleic acid hybridization |
| US20050142595A1 (en) * | 2003-11-07 | 2005-06-30 | U.S. Genomics, Inc. | Intercalator FRET donors or acceptors |
| US7169560B2 (en) | 2003-11-12 | 2007-01-30 | Helicos Biosciences Corporation | Short cycle methods for sequencing polynucleotides |
| US20050143919A1 (en) * | 2003-11-14 | 2005-06-30 | Williams Robert E. | Unified method and system for multi-dimensional mapping of spatial-energy relationships among micro and macro-events in the universe |
| US20050123974A1 (en) * | 2003-11-17 | 2005-06-09 | U.S. Genomics, Inc. | Methods and compositions relating to single reactive center reagents |
| US7496938B2 (en) * | 2003-11-24 | 2009-02-24 | Sabic Innovative Plastics Ip B.V. | Media drive with a luminescence detector and methods of detecting an authentic article |
| US7175086B2 (en) * | 2004-04-21 | 2007-02-13 | General Electric Company | Authentication system, data device, and methods for using the same |
| US20050110978A1 (en) * | 2003-11-26 | 2005-05-26 | Radislav Potyrailo | Method of authenticating articles, authenticatable polymers, and authenticatable articles |
| US20090266991A1 (en) * | 2003-11-26 | 2009-10-29 | Sabic Innovative Plastics Ip B.V. | Method of authenticating tagged polymers |
| US20050112768A1 (en) * | 2003-11-26 | 2005-05-26 | Thomas Evans | Method of authenticating tagged polymers |
| US7094364B2 (en) * | 2003-11-26 | 2006-08-22 | General Electric Company | Method of authenticating polymers, authenticatable polymers, methods of making authenticatable polymers and authenticatable articles, and articles made there from |
| US7169615B2 (en) * | 2003-11-26 | 2007-01-30 | General Electric Company | Method of authenticating polymers, authenticatable polymers, methods of making authenticatable polymers and authenticatable articles, and articles made there from |
| WO2005054441A2 (en) * | 2003-12-01 | 2005-06-16 | California Institute Of Technology | Device for immobilizing chemical and biomedical species and methods of using same |
| US20050136408A1 (en) * | 2003-12-19 | 2005-06-23 | May Tom-Moy | Methods and systems for characterizing a polymer |
| US7595160B2 (en) | 2004-01-13 | 2009-09-29 | U.S. Genomics, Inc. | Analyte detection using barcoded polymers |
| JP2007518107A (en) | 2004-01-13 | 2007-07-05 | ユー.エス. ジェノミクス, インコーポレイテッド | Detection and quantification of analytes in solution using polymers |
| US20050196790A1 (en) * | 2004-02-05 | 2005-09-08 | U.S. Genomics, Inc. | Methods for detection and quantitation of minimum length polymers |
| US7981604B2 (en) | 2004-02-19 | 2011-07-19 | California Institute Of Technology | Methods and kits for analyzing polynucleotide sequences |
| US20050186576A1 (en) * | 2004-02-19 | 2005-08-25 | Intel Corporation | Polymer sequencing using selectively labeled monomers and data integration |
| US20060046258A1 (en) * | 2004-02-27 | 2006-03-02 | Lapidus Stanley N | Applications of single molecule sequencing |
| US7279337B2 (en) * | 2004-03-10 | 2007-10-09 | Agilent Technologies, Inc. | Method and apparatus for sequencing polymers through tunneling conductance variation detection |
| US20050221408A1 (en) * | 2004-03-19 | 2005-10-06 | U.S. Genomics, Inc. | Compositions and methods for detection of single molecules |
| US7238485B2 (en) | 2004-03-23 | 2007-07-03 | President And Fellows Of Harvard College | Methods and apparatus for characterizing polynucleotides |
| US20050239085A1 (en) * | 2004-04-23 | 2005-10-27 | Buzby Philip R | Methods for nucleic acid sequence determination |
| US20050260609A1 (en) * | 2004-05-24 | 2005-11-24 | Lapidus Stanley N | Methods and devices for sequencing nucleic acids |
| US20070117103A1 (en) * | 2005-11-22 | 2007-05-24 | Buzby Philip R | Nucleotide analogs |
| US7476734B2 (en) * | 2005-12-06 | 2009-01-13 | Helicos Biosciences Corporation | Nucleotide analogs |
| JP2008512084A (en) * | 2004-05-25 | 2008-04-24 | ヘリコス バイオサイエンシーズ コーポレイション | Methods and devices for nucleic acid sequencing |
| US20070117104A1 (en) * | 2005-11-22 | 2007-05-24 | Buzby Philip R | Nucleotide analogs |
| WO2005118871A1 (en) * | 2004-05-28 | 2005-12-15 | The Arizona Board Of Regents | Surface plasmon resonance sensor for detecting changes in polynucleotides mass |
| US20050277710A1 (en) * | 2004-06-14 | 2005-12-15 | Joyce Richard P | Tagged resin, method of making a tagged resin, and articles made therefrom |
| US6958480B1 (en) * | 2004-06-25 | 2005-10-25 | The Regents Of The University Of California | Sample desorption/ionization from mesoporous silica |
| JP4476050B2 (en) * | 2004-06-30 | 2010-06-09 | 株式会社ニデック | Perimeter |
| WO2006017274A2 (en) * | 2004-07-13 | 2006-02-16 | U.S. Genomics, Inc. | Systems and methods for sample modification using fluidic chambers |
| US7597961B2 (en) * | 2004-07-13 | 2009-10-06 | Sabic Innovative Plastics Ip B.V. | Authenticatable article and method of authenticating |
| US7511285B2 (en) * | 2004-07-16 | 2009-03-31 | The Charles Stark Draper Laboratory, Inc. | Methods and apparatus for biomolecule identification |
| US20060019259A1 (en) * | 2004-07-22 | 2006-01-26 | Joyce Timothy H | Characterization of biopolymers by resonance tunneling and fluorescence quenching |
| US7622934B2 (en) * | 2004-07-23 | 2009-11-24 | Electronic Bio Sciences, Llc | Method and apparatus for sensing a time varying current passing through an ion channel |
| US20060024678A1 (en) * | 2004-07-28 | 2006-02-02 | Helicos Biosciences Corporation | Use of single-stranded nucleic acid binding proteins in sequencing |
| WO2006020775A2 (en) * | 2004-08-13 | 2006-02-23 | Harvard University | An ultra high-throughput opti-nanopore dna readout platform |
| US7351538B2 (en) | 2004-08-23 | 2008-04-01 | U.S. Genomics | Systems and methods for detecting and analyzing polymers |
| CA2579150C (en) * | 2004-09-17 | 2014-11-25 | Pacific Biosciences Of California, Inc. | Apparatus and method for analysis of molecules |
| US7170050B2 (en) * | 2004-09-17 | 2007-01-30 | Pacific Biosciences Of California, Inc. | Apparatus and methods for optical analysis of molecules |
| US7524672B2 (en) * | 2004-09-22 | 2009-04-28 | Sandia Corporation | Microfluidic microarray systems and methods thereof |
| US7592139B2 (en) | 2004-09-24 | 2009-09-22 | Sandia National Laboratories | High temperature flow-through device for rapid solubilization and analysis |
| US9040305B2 (en) * | 2004-09-28 | 2015-05-26 | Singulex, Inc. | Method of analysis for determining a specific protein in blood samples using fluorescence spectrometry |
| US8685711B2 (en) | 2004-09-28 | 2014-04-01 | Singulex, Inc. | Methods and compositions for highly sensitive detection of molecules |
| US7572640B2 (en) * | 2004-09-28 | 2009-08-11 | Singulex, Inc. | Method for highly sensitive detection of single protein molecules labeled with fluorescent moieties |
| EP1805500A4 (en) * | 2004-09-28 | 2008-05-07 | Singulex Inc | System and method for spectroscopic analysis of single particles |
| US20060072444A1 (en) * | 2004-09-29 | 2006-04-06 | Engel David B | Marked article and method of making the same |
| WO2006098772A2 (en) * | 2004-10-13 | 2006-09-21 | U.S. Genomics, Inc. | Systems and methods for measurement optimization |
| WO2006044728A2 (en) | 2004-10-18 | 2006-04-27 | U.S.Genomics, Inc. | Methods for isolation of nucleic acids from prokaryotic spores |
| ES2301268B1 (en) * | 2004-10-25 | 2009-05-01 | Centro De Investigacion Biomolecular Aplicada Salamanca, S.L. | USE OF GEN SLUG, OR ITS REPLICATION, TRANSCRIPTION OR EXPRESSION PRODUCTS, IN THE IDENTIFICATION, DIAGNOSIS, PREVENTION OR TREATMENT OF CANCER DISSEMINATION AND / OR METASTASIS DEVELOPMENT. |
| US20060160231A1 (en) * | 2004-11-24 | 2006-07-20 | U.S. Genomics, Inc. | Linear analysis of polymers |
| JPWO2006059769A1 (en) * | 2004-12-03 | 2008-06-05 | 愛知県 | Methods for diagnosis and prognosis of malignant lymphoma |
| US20060118754A1 (en) * | 2004-12-08 | 2006-06-08 | Lapen Daniel C | Stabilizing a polyelectrolyte multilayer |
| GB0427236D0 (en) | 2004-12-13 | 2005-01-12 | Solexa Ltd | Improved method of nucleotide detection |
| US7220549B2 (en) * | 2004-12-30 | 2007-05-22 | Helicos Biosciences Corporation | Stabilizing a nucleic acid for nucleic acid sequencing |
| US20060172328A1 (en) * | 2005-01-05 | 2006-08-03 | Buzby Philip R | Methods and compositions for correcting misincorporation in a nucleic acid synthesis reaction |
| US7482120B2 (en) * | 2005-01-28 | 2009-01-27 | Helicos Biosciences Corporation | Methods and compositions for improving fidelity in a nucleic acid synthesis reaction |
| WO2006094149A2 (en) * | 2005-03-01 | 2006-09-08 | Exact Sciences Corporation | Methods and compositions for detecting adenoma |
| JP2006242925A (en) * | 2005-03-07 | 2006-09-14 | Seiko Epson Corp | Electrode substrate, detector equipped with the substrate, kit including the detector, detection method using the kit |
| US20060211024A1 (en) * | 2005-03-10 | 2006-09-21 | Gwc Technologies Incorporated | Methods for analysis of a nucleic acid sample |
| WO2006119561A1 (en) * | 2005-05-10 | 2006-11-16 | Commonwealth Scientific And Industrial Research Organisation | High-resolution tracking of industrial process materials using trace incorporation of luminescent markers |
| US20060263790A1 (en) * | 2005-05-20 | 2006-11-23 | Timothy Harris | Methods for improving fidelity in a nucleic acid synthesis reaction |
| ATE490343T1 (en) * | 2005-06-30 | 2010-12-15 | Ge Healthcare Bio Sciences | DETECTION METHODS FOR GENE EXPRESSION |
| US20070128083A1 (en) * | 2005-07-18 | 2007-06-07 | U.S. Genomics, Inc. | Microfluidic methods and apparatuses for sample preparation and analysis |
| EP1904653A4 (en) * | 2005-07-18 | 2010-04-14 | Us Genomics Inc | Microfluidic methods and apparatuses for sample preparation and analysis |
| US7977108B2 (en) * | 2005-07-25 | 2011-07-12 | Roche Molecular Systems, Inc. | Method for detecting a mutation in a repetitive nucleic acid sequence |
| US20070065847A1 (en) * | 2005-08-11 | 2007-03-22 | Affymetrix, Inc. | Degeneratively Labeled Probes |
| US7666593B2 (en) | 2005-08-26 | 2010-02-23 | Helicos Biosciences Corporation | Single molecule sequencing of captured nucleic acids |
| ATE389035T1 (en) * | 2005-09-13 | 2008-03-15 | Eppendorf Array Tech Sa | METHOD FOR DETECTING HOMOLOGOUS SEQUENCES THAT DIFFER BY A BASE ON A MICROARRAY |
| WO2007041621A2 (en) * | 2005-10-03 | 2007-04-12 | Xingsheng Sean Ling | Hybridization assisted nanopore sequencing |
| KR100849384B1 (en) * | 2005-10-21 | 2008-07-31 | 한국생명공학연구원 | A method for fabricating nanogap and nanogap sensor |
| WO2007056250A2 (en) * | 2005-11-04 | 2007-05-18 | U.S. Genomics, Inc. | Heterogeneous assay of analytes in solution using polymers |
| WO2007057652A1 (en) * | 2005-11-15 | 2007-05-24 | Solexa Limited | Method of target enrichment |
| US20070117102A1 (en) * | 2005-11-22 | 2007-05-24 | Buzby Philip R | Nucleotide analogs |
| US7960105B2 (en) * | 2005-11-29 | 2011-06-14 | National Institutes Of Health | Method of DNA analysis using micro/nanochannel |
| US20070128610A1 (en) * | 2005-12-02 | 2007-06-07 | Buzby Philip R | Sample preparation method and apparatus for nucleic acid sequencing |
| WO2007075680A2 (en) * | 2005-12-19 | 2007-07-05 | University Of Vermont And State Agricultural College | System and method for delivering a desired material to a cell |
| US20100009373A1 (en) * | 2005-12-23 | 2010-01-14 | Perkinelmer Health Sciences, Inc. | Methods and compositions relating to multiplex genomic gain and loss assays |
| US7932037B2 (en) * | 2007-12-05 | 2011-04-26 | Perkinelmer Health Sciences, Inc. | DNA assays using amplicon probes on encoded particles |
| US20090104613A1 (en) * | 2005-12-23 | 2009-04-23 | Perkinelmer Las, Inc. | Methods and compositions relating to multiplexed genomic gain and loss assays |
| AU2006331607B2 (en) * | 2005-12-23 | 2012-11-29 | Perkinelmer Health Sciences, Inc. | Comparative genomic hybridization on encoded multiplex particles |
| US20070196832A1 (en) * | 2006-02-22 | 2007-08-23 | Efcavitch J William | Methods for mutation detection |
| US7815868B1 (en) | 2006-02-28 | 2010-10-19 | Fluidigm Corporation | Microfluidic reaction apparatus for high throughput screening |
| US20080309926A1 (en) * | 2006-03-08 | 2008-12-18 | Aaron Weber | Systems and methods for reducing detected intensity non uniformity in a laser beam |
| US7397546B2 (en) * | 2006-03-08 | 2008-07-08 | Helicos Biosciences Corporation | Systems and methods for reducing detected intensity non-uniformity in a laser beam |
| EP3156799B1 (en) | 2006-04-04 | 2024-01-24 | Novilux, LLC | Analyzer and method for highly sensitive detection of analytes |
| EP3168618B1 (en) | 2006-04-04 | 2018-11-21 | Singulex, Inc. | Highly sensitive methods for analysis of troponin |
| US7838250B1 (en) | 2006-04-04 | 2010-11-23 | Singulex, Inc. | Highly sensitive system and methods for analysis of troponin |
| US20080014589A1 (en) | 2006-05-11 | 2008-01-17 | Link Darren R | Microfluidic devices and methods of use thereof |
| US7629124B2 (en) * | 2006-06-30 | 2009-12-08 | Canon U.S. Life Sciences, Inc. | Real-time PCR in micro-channels |
| US9061901B2 (en) | 2006-07-19 | 2015-06-23 | Bionano Genomics, Inc. | Nanonozzle device arrays: their preparation and use for macromolecular analysis |
| US20080241938A1 (en) * | 2006-07-20 | 2008-10-02 | Visigen Biotechnologies, Inc. | Automated synthesis or sequencing apparatus and method for making and using same |
| US20080091005A1 (en) * | 2006-07-20 | 2008-04-17 | Visigen Biotechnologies, Inc. | Modified nucleotides, methods for making and using same |
| US20080241951A1 (en) * | 2006-07-20 | 2008-10-02 | Visigen Biotechnologies, Inc. | Method and apparatus for moving stage detection of single molecular events |
| US20080044822A1 (en) * | 2006-08-21 | 2008-02-21 | Gafur Zainiev | Nucleic acid array with releaseable nucleic acid probes |
| US20090286694A1 (en) * | 2006-08-21 | 2009-11-19 | Gafur Zainiev | Nucleic acid array with releaseable nucleic acid probes |
| US20080044821A1 (en) * | 2006-08-21 | 2008-02-21 | Gafur Zainiev | Nucleic acid array having fixed nucleic acid anti-probes and complementary free nucleic acid probes |
| US20100056388A1 (en) * | 2006-08-21 | 2010-03-04 | Cnvgenes, Inc. | Nucleic acid array having fixed nucleic acid anti-probes and complementary free nucleic acid probes |
| US20080050724A1 (en) * | 2006-08-24 | 2008-02-28 | Microfluidic Systems, Inc. | Method of detecting one or more limited copy targets |
| JP2008072950A (en) * | 2006-09-21 | 2008-04-03 | Sysmex Corp | Method for confirming conversion treatment and nucleic acid molecule used therefor |
| EP2076609A1 (en) | 2006-10-10 | 2009-07-08 | Illumina Inc. | Compositions and methods for representational selection of nucleic acids fro complex mixtures using hybridization |
| JP2008148570A (en) * | 2006-12-14 | 2008-07-03 | Hitachi Ltd | Microorganism detection system |
| US8999636B2 (en) | 2007-01-08 | 2015-04-07 | Toxic Report Llc | Reaction chamber |
| US20080182235A1 (en) * | 2007-01-30 | 2008-07-31 | Celsis International Plc | Detection of Analytes in Samples Using Liposome-Amplified Luminescence and Magnetic Separation |
| US11940413B2 (en) | 2007-02-05 | 2024-03-26 | IsoPlexis Corporation | Methods and devices for sequencing nucleic acids in smaller batches |
| US8481259B2 (en) | 2007-02-05 | 2013-07-09 | Intelligent Bio-Systems, Inc. | Methods and devices for sequencing nucleic acids in smaller batches |
| US11035823B2 (en) | 2009-03-17 | 2021-06-15 | Qiagen Sciences, Llc | Methods and devices for sequencing nucleic acids in smaller batches |
| US8772046B2 (en) | 2007-02-06 | 2014-07-08 | Brandeis University | Manipulation of fluids and reactions in microfluidic systems |
| US20080254995A1 (en) * | 2007-02-27 | 2008-10-16 | Drexel University | Nanopore arrays and sequencing devices and methods thereof |
| US20090136932A1 (en) * | 2007-03-16 | 2009-05-28 | Craighead Harold G | Fibers with isolated biomolecules and uses thereof |
| CN103305402A (en) * | 2007-03-28 | 2013-09-18 | 博纳基因技术有限公司 | Method of macromolecular analysis using nanochannel arrays |
| WO2008124693A1 (en) * | 2007-04-05 | 2008-10-16 | The Arizona Board Of Regents, A Body Corporate Of The State Of Arizona Acting For And On Behalf Of Arizona State University | Separation-based arrays |
| US8592221B2 (en) | 2007-04-19 | 2013-11-26 | Brandeis University | Manipulation of fluids, fluid components and reactions in microfluidic systems |
| EP2158476B8 (en) | 2007-05-08 | 2019-10-09 | Trustees of Boston University | Chemical functionalization of solid-state nanopores and nanopore arrays and applications thereof |
| US20100294665A1 (en) * | 2007-07-12 | 2010-11-25 | Richard Allen | Method and system for transferring and/or concentrating a sample |
| GB0716005D0 (en) * | 2007-08-16 | 2007-09-26 | Imp Innovations Ltd | Single molecule spectroscopy using nanoporpus membranes |
| WO2009029550A2 (en) * | 2007-08-24 | 2009-03-05 | Singulex, Inc. | Highly sensitive system and methods for analysis of prostate specific antigen (psa) |
| US8278047B2 (en) | 2007-10-01 | 2012-10-02 | Nabsys, Inc. | Biopolymer sequencing by hybridization of probes to form ternary complexes and variable range alignment |
| US8093063B2 (en) * | 2007-11-29 | 2012-01-10 | Quest Diagnostics Investments Incorporated | Assay for detecting genetic abnormalities in genomic nucleic acids |
| US7914734B2 (en) | 2007-12-19 | 2011-03-29 | Singulex, Inc. | Scanning analyzer for single molecule detection and methods of use |
| US8852864B2 (en) | 2008-01-17 | 2014-10-07 | Sequenom Inc. | Methods and compositions for the analysis of nucleic acids |
| WO2009100442A2 (en) * | 2008-02-07 | 2009-08-13 | The Board Of Regents Of The University Of Texas System | Methods for detecting molecule-molecule interactions with a single detection channel |
| CA2716522A1 (en) * | 2008-03-05 | 2009-10-15 | Singulex, Inc. | Methods and compositions for highly sensitive detection of molecules |
| US9017973B2 (en) | 2008-03-19 | 2015-04-28 | Intelligent Biosystems, Inc. | Methods and compositions for incorporating nucleotides |
| CA2991818C (en) | 2008-03-28 | 2022-10-11 | Pacific Biosciences Of California, Inc. | Compositions and methods for nucleic acid sequencing |
| US8628940B2 (en) | 2008-09-24 | 2014-01-14 | Pacific Biosciences Of California, Inc. | Intermittent detection during analytical reactions |
| WO2009149362A2 (en) | 2008-06-06 | 2009-12-10 | Bionanomatrix, Inc. | Integrated nanofluidic analysis devices, fabrication methods and analysis techniques |
| AU2009267086B2 (en) | 2008-06-30 | 2016-01-14 | Bionano Genomics, Inc. | Methods and devices for single-molecule whole genome analysis |
| WO2010009365A1 (en) | 2008-07-18 | 2010-01-21 | Raindance Technologies, Inc. | Droplet libraries |
| CA2735250A1 (en) * | 2008-07-30 | 2010-02-04 | Nippon Steel Kankyo Engineering Co., Ltd. | Universal nucleic acid probe set and method for utilization thereof |
| US9650668B2 (en) | 2008-09-03 | 2017-05-16 | Nabsys 2.0 Llc | Use of longitudinally displaced nanoscale electrodes for voltage sensing of biomolecules and other analytes in fluidic channels |
| WO2010028140A2 (en) | 2008-09-03 | 2010-03-11 | Nabsys, Inc. | Use of longitudinally displaced nanoscale electrodes for voltage sensing of biomolecules and other analytes in fluidic channels |
| US8262879B2 (en) | 2008-09-03 | 2012-09-11 | Nabsys, Inc. | Devices and methods for determining the length of biopolymers and distances between probes bound thereto |
| GB2464183A (en) * | 2008-09-19 | 2010-04-14 | Singulex Inc | Sandwich assay |
| US8361716B2 (en) | 2008-10-03 | 2013-01-29 | Pathogenetix, Inc. | Focusing chamber |
| CN102292454B (en) | 2008-11-18 | 2014-11-26 | 博纳基因技术有限公司 | Polynucleotide mapping and sequencing |
| GB0904957D0 (en) | 2009-03-23 | 2009-05-06 | Univ Erasmus Medical Ct | Tumour gene profile |
| WO2010111602A1 (en) * | 2009-03-26 | 2010-09-30 | Trustees Of Boston University | Method for imaging on thin solid-state interface between two fluids |
| US8455260B2 (en) * | 2009-03-27 | 2013-06-04 | Massachusetts Institute Of Technology | Tagged-fragment map assembly |
| US20100243449A1 (en) * | 2009-03-27 | 2010-09-30 | Oliver John S | Devices and methods for analyzing biomolecules and probes bound thereto |
| US8246799B2 (en) * | 2009-05-28 | 2012-08-21 | Nabsys, Inc. | Devices and methods for analyzing biomolecules and probes bound thereto |
| JP5678045B2 (en) | 2009-06-08 | 2015-02-25 | シンギュレックス・インコーポレイテッド | High sensitivity biomarker panel |
| EP2290102A1 (en) | 2009-07-08 | 2011-03-02 | Administración General De La Communidad Autónoma De Euskadi | Methods for the diagnosis of multiple sclerosis based on its microRNA expression profiling |
| WO2011034895A1 (en) * | 2009-09-15 | 2011-03-24 | Regents Of The University Of Colorado | Compositions, methods and uses for nucleotide analogues |
| AU2010301128B2 (en) | 2009-09-30 | 2014-09-18 | Quantapore, Inc. | Ultrafast sequencing of biological polymers using a labeled nanopore |
| JP5873023B2 (en) | 2009-12-01 | 2016-03-01 | オックスフォード ナノポール テクノロジーズ リミテッド | Biochemical analyzer |
| WO2011100604A2 (en) | 2010-02-12 | 2011-08-18 | Raindance Technologies, Inc. | Digital analyte analysis |
| US9399797B2 (en) | 2010-02-12 | 2016-07-26 | Raindance Technologies, Inc. | Digital analyte analysis |
| DE102010012857B4 (en) * | 2010-03-25 | 2015-02-19 | Tim Liedl | Device for detecting a path size |
| US9453289B2 (en) | 2010-04-13 | 2016-09-27 | Lawrence Livermore National Security, Llc | Methods of three-dimensional electrophoretic deposition for ceramic and cermet applications and systems thereof |
| US8974651B2 (en) | 2010-04-17 | 2015-03-10 | C.C. Imex | Illuminator for visualization of fluorophores |
| FR2959046B1 (en) * | 2010-04-19 | 2012-06-15 | Michelin Soc Tech | METHOD FOR CONTROLLING THE APPEARANCE OF THE SURFACE OF A TIRE |
| WO2011140484A1 (en) | 2010-05-06 | 2011-11-10 | Singulex, Inc | Methods for diagnosing, staging, predicting risk for developing and identifying treatment responders for rheumatoid arthritis |
| US8828211B2 (en) | 2010-06-08 | 2014-09-09 | President And Fellows Of Harvard College | Nanopore device with graphene supported artificial lipid membrane |
| US9852824B2 (en) | 2010-08-24 | 2017-12-26 | Lawrence Livermore National Security, Llc | Methods for controlling pore morphology in aerogels using electric fields and products thereof |
| WO2012034013A2 (en) | 2010-09-10 | 2012-03-15 | Bio-Rad Laboratories, Inc. | Detection of rna-interacting regions in dna |
| US8715933B2 (en) | 2010-09-27 | 2014-05-06 | Nabsys, Inc. | Assay methods using nicking endonucleases |
| US9593370B2 (en) | 2010-10-01 | 2017-03-14 | Oxford Nanopore Technologies Ltd. | Biochemical analysis apparatus and rotary valve |
| US8859201B2 (en) | 2010-11-16 | 2014-10-14 | Nabsys, Inc. | Methods for sequencing a biomolecule by detecting relative positions of hybridized probes |
| US11274341B2 (en) | 2011-02-11 | 2022-03-15 | NABsys, 2.0 LLC | Assay methods using DNA binding proteins |
| US20120208193A1 (en) | 2011-02-15 | 2012-08-16 | Bio-Rad Laboratories, Inc. | Detecting methylation in a subpopulation of genomic dna |
| WO2012112804A1 (en) | 2011-02-18 | 2012-08-23 | Raindance Technoligies, Inc. | Compositions and methods for molecular labeling |
| WO2012122314A2 (en) | 2011-03-07 | 2012-09-13 | Accelr8 Technology Corporation | Rapid cell purification systems |
| US10254204B2 (en) | 2011-03-07 | 2019-04-09 | Accelerate Diagnostics, Inc. | Membrane-assisted purification |
| US9290855B2 (en) | 2011-04-22 | 2016-03-22 | Lawrence Livermore National Security, Llc | Stabilization of green bodies via sacrificial gelling agent during electrophoretic deposition |
| GB201111237D0 (en) * | 2011-06-30 | 2011-08-17 | Isis Innovation | Nanochip |
| JP2014524121A (en) * | 2011-07-14 | 2014-09-18 | ザ・ジョージ・ワシントン・ユニバーシティ | Plume collimation for laser ablation and electrospray ionization mass spectrometry |
| EP2546358A1 (en) | 2011-07-15 | 2013-01-16 | Laboratorios Del. Dr. Esteve, S.A. | Methods and reagents for efficient control of HIV progression |
| US8658430B2 (en) | 2011-07-20 | 2014-02-25 | Raindance Technologies, Inc. | Manipulating droplet size |
| WO2013049613A1 (en) * | 2011-09-29 | 2013-04-04 | Luminex Corporation | Hydrolysis probes |
| GB201120711D0 (en) | 2011-12-01 | 2012-01-11 | Univ Erasmus Medical Ct | Method for classifying tumour cells |
| WO2013120089A1 (en) * | 2012-02-10 | 2013-08-15 | Raindance Technologies, Inc. | Molecular diagnostic screening assay |
| US8956815B2 (en) | 2012-04-18 | 2015-02-17 | Toxic Report Llc | Intercalation methods and devices |
| US8685708B2 (en) | 2012-04-18 | 2014-04-01 | Pathogenetix, Inc. | Device for preparing a sample |
| US9028776B2 (en) | 2012-04-18 | 2015-05-12 | Toxic Report Llc | Device for stretching a polymer in a fluid sample |
| ES2434853B1 (en) | 2012-06-12 | 2014-09-30 | Fundación Centro Nacional De Investigaciones Cardiovasculares Carlos Iii | Molecular marker of therapeutic potency of human mesenchymal stem cells and their uses |
| US11591637B2 (en) | 2012-08-14 | 2023-02-28 | 10X Genomics, Inc. | Compositions and methods for sample processing |
| US9701998B2 (en) | 2012-12-14 | 2017-07-11 | 10X Genomics, Inc. | Methods and systems for processing polynucleotides |
| US10273541B2 (en) | 2012-08-14 | 2019-04-30 | 10X Genomics, Inc. | Methods and systems for processing polynucleotides |
| WO2014028537A1 (en) | 2012-08-14 | 2014-02-20 | 10X Technologies, Inc. | Microcapsule compositions and methods |
| US9951386B2 (en) | 2014-06-26 | 2018-04-24 | 10X Genomics, Inc. | Methods and systems for processing polynucleotides |
| US10752949B2 (en) | 2012-08-14 | 2020-08-25 | 10X Genomics, Inc. | Methods and systems for processing polynucleotides |
| US10584381B2 (en) | 2012-08-14 | 2020-03-10 | 10X Genomics, Inc. | Methods and systems for processing polynucleotides |
| US10323279B2 (en) | 2012-08-14 | 2019-06-18 | 10X Genomics, Inc. | Methods and systems for processing polynucleotides |
| US9651539B2 (en) | 2012-10-28 | 2017-05-16 | Quantapore, Inc. | Reducing background fluorescence in MEMS materials by low energy ion beam treatment |
| CA2894694C (en) | 2012-12-14 | 2023-04-25 | 10X Genomics, Inc. | Methods and systems for processing polynucleotides |
| US10533221B2 (en) | 2012-12-14 | 2020-01-14 | 10X Genomics, Inc. | Methods and systems for processing polynucleotides |
| US9914966B1 (en) | 2012-12-20 | 2018-03-13 | Nabsys 2.0 Llc | Apparatus and methods for analysis of biomolecules using high frequency alternating current excitation |
| WO2014113557A1 (en) | 2013-01-18 | 2014-07-24 | Nabsys, Inc. | Enhanced probe binding |
| EP3862435A1 (en) | 2013-02-08 | 2021-08-11 | 10X Genomics, Inc. | Polynucleotide barcode generation |
| US20140272959A1 (en) * | 2013-03-14 | 2014-09-18 | President And Fellows Of Harvard College | Methods of Hybridizing Probes to Genomic DNA |
| DK2970356T3 (en) | 2013-03-15 | 2018-08-27 | Illumina Cambridge Ltd | Modified nucleosides or nucleotides |
| US9677109B2 (en) | 2013-03-15 | 2017-06-13 | Accelerate Diagnostics, Inc. | Rapid determination of microbial growth and antimicrobial susceptibility |
| ES2523016B1 (en) | 2013-05-20 | 2015-09-09 | 3P Biopharmaceuticals | Alpha-viral vectors and cell lines for the production of recombinant proteins |
| WO2014190299A2 (en) * | 2013-05-23 | 2014-11-27 | Arizona Board Of Regents Acting For And On Behalf Of Arizona State University | Chemistry, systems and methods of translocation of a polymer through a nanopore |
| US9862997B2 (en) | 2013-05-24 | 2018-01-09 | Quantapore, Inc. | Nanopore-based nucleic acid analysis with mixed FRET detection |
| US11901041B2 (en) | 2013-10-04 | 2024-02-13 | Bio-Rad Laboratories, Inc. | Digital analysis of nucleic acid modification |
| JP6286183B2 (en) * | 2013-11-07 | 2018-02-28 | 株式会社日立ハイテクノロジーズ | Analysis equipment |
| EP3068900B1 (en) | 2013-11-17 | 2020-01-08 | Quantum-Si Incorporated | Active-source-pixel, integrated device for rapid analysis of biological and chemical speciments |
| US20160273027A1 (en) * | 2013-11-26 | 2016-09-22 | Bio-Rad Laboratories, Inc. | Methods for detecting nucleic acids proximity |
| US9944977B2 (en) | 2013-12-12 | 2018-04-17 | Raindance Technologies, Inc. | Distinguishing rare variations in a nucleic acid sequence from a sample |
| US9824068B2 (en) | 2013-12-16 | 2017-11-21 | 10X Genomics, Inc. | Methods and apparatus for sorting data |
| EP2986742A4 (en) * | 2014-01-10 | 2016-12-07 | Bio Rad Laboratories Inc | Intercalating dyes for differential detection |
| US9835587B2 (en) | 2014-04-01 | 2017-12-05 | C.C. Imex | Electrophoresis running tank assembly |
| WO2015157691A1 (en) * | 2014-04-10 | 2015-10-15 | President And Fellows Of Harvard College | Colorimetric sensor with automated readout |
| AU2015243445B2 (en) | 2014-04-10 | 2020-05-28 | 10X Genomics, Inc. | Fluidic devices, systems, and methods for encapsulating and partitioning reagents, and applications of same |
| CN106795553B (en) | 2014-06-26 | 2021-06-04 | 10X基因组学有限公司 | Methods of analyzing nucleic acids from individual cells or cell populations |
| GB201413718D0 (en) * | 2014-08-01 | 2014-09-17 | Olink Ab | Method for selecting a target nucleic acid sequence |
| WO2016023010A1 (en) | 2014-08-08 | 2016-02-11 | Quantum-Si Incorporated | Optical system and assay chip for probing, detecting, and analyzing molecules |
| WO2016022998A2 (en) | 2014-08-08 | 2016-02-11 | Quantum-Si Incorporated | Integrated device for temporal binning of received photons |
| MX2017001808A (en) | 2014-08-08 | 2018-02-08 | Quantum Si Inc | Integrated device with external light source for probing, detecting, and analyzing molecules. |
| WO2016028887A1 (en) | 2014-08-19 | 2016-02-25 | Pacific Biosciences Of California, Inc. | Compositions and methods for enrichment of nucleic acids |
| JP6740222B2 (en) | 2014-10-10 | 2020-08-12 | クアンタポール, インコーポレイテッド | Nanopore-based polymer analysis with fluorescent labels quenching each other |
| CN107002126B (en) | 2014-10-24 | 2021-05-25 | 昆塔波尔公司 | Efficient optical analysis of polymers using nanostructure arrays |
| US9975122B2 (en) | 2014-11-05 | 2018-05-22 | 10X Genomics, Inc. | Instrument systems for integrated sample processing |
| US10157689B2 (en) * | 2014-12-17 | 2018-12-18 | Savannah River Nuclear Solutions, Llc | Reinforced radiological containment bag |
| EP3244992B1 (en) | 2015-01-12 | 2023-03-08 | 10X Genomics, Inc. | Processes for barcoding nucleic acids |
| EP3262407B1 (en) | 2015-02-24 | 2023-08-30 | 10X Genomics, Inc. | Partition processing methods and systems |
| US10023895B2 (en) | 2015-03-30 | 2018-07-17 | Accelerate Diagnostics, Inc. | Instrument and system for rapid microogranism identification and antimicrobial agent susceptibility testing |
| US10253355B2 (en) | 2015-03-30 | 2019-04-09 | Accelerate Diagnostics, Inc. | Instrument and system for rapid microorganism identification and antimicrobial agent susceptibility testing |
| US20160299129A1 (en) * | 2015-04-07 | 2016-10-13 | Xiaolei Qiu | Ultra Sensitive and Specific Multiplex Biosensor System Based on Multiple Cooperative Interactions |
| US10174363B2 (en) | 2015-05-20 | 2019-01-08 | Quantum-Si Incorporated | Methods for nucleic acid sequencing |
| US11466316B2 (en) | 2015-05-20 | 2022-10-11 | Quantum-Si Incorporated | Pulsed laser and bioanalytic system |
| US10246742B2 (en) | 2015-05-20 | 2019-04-02 | Quantum-Si Incorporated | Pulsed laser and bioanalytic system |
| US10605730B2 (en) | 2015-05-20 | 2020-03-31 | Quantum-Si Incorporated | Optical sources for fluorescent lifetime analysis |
| JP6404785B2 (en) * | 2015-08-12 | 2018-10-17 | 日本電信電話株式会社 | Biomolecular mobility control method and electrophoresis tank |
| CN108350499B (en) * | 2015-11-19 | 2022-05-13 | 10X基因组学有限公司 | Convertible marking compositions, methods, and processes incorporating same |
| US11371094B2 (en) | 2015-11-19 | 2022-06-28 | 10X Genomics, Inc. | Systems and methods for nucleic acid processing using degenerate nucleotides |
| JP6703824B2 (en) * | 2015-11-30 | 2020-06-03 | シスメックス株式会社 | Cell selection method, cell detection method, cell selection device, and cell detection device |
| SG10202108763UA (en) | 2015-12-04 | 2021-09-29 | 10X Genomics Inc | Methods and compositions for nucleic acid analysis |
| US11066702B2 (en) * | 2016-01-15 | 2021-07-20 | Quantapore, Inc. | Optically-based nanopore analysis with reduced background |
| SG11201806757XA (en) | 2016-02-11 | 2018-09-27 | 10X Genomics Inc | Systems, methods, and media for de novo assembly of whole genome sequence data |
| JP2019512090A (en) | 2016-02-17 | 2019-05-09 | テッセラクト ヘルス インコーポレイテッドTesseract Health,Inc. | Sensors and Devices for Lifetime Imaging and Detection Applications |
| US10438662B2 (en) | 2016-02-29 | 2019-10-08 | Iridia, Inc. | Methods, compositions, and devices for information storage |
| US10859562B2 (en) | 2016-02-29 | 2020-12-08 | Iridia, Inc. | Methods, compositions, and devices for information storage |
| US10640822B2 (en) | 2016-02-29 | 2020-05-05 | Iridia, Inc. | Systems and methods for writing, reading, and controlling data stored in a polymer |
| EP3936863A1 (en) | 2016-03-21 | 2022-01-12 | Nooma Bio, Inc. | Wafer-scale assembly of insulator-membrane-insulator devices for nanopore sensing |
| US9816941B2 (en) | 2016-03-28 | 2017-11-14 | Saudi Arabian Oil Company | Systems and methods for constructing and testing composite photonic structures |
| US11486873B2 (en) | 2016-03-31 | 2022-11-01 | Ontera Inc. | Multipore determination of fractional abundance of polynucleotide sequences in a sample |
| WO2017197338A1 (en) | 2016-05-13 | 2017-11-16 | 10X Genomics, Inc. | Microfluidic systems and methods of use |
| US10340049B2 (en) * | 2016-08-04 | 2019-07-02 | Savannah River Nuclear Solutions, Llc | Alpha/beta radiation shielding materials |
| JP7050068B2 (en) | 2016-12-16 | 2022-04-07 | クアンタム-エスアイ インコーポレイテッド | Compact beam forming and steering assembly |
| US10283928B2 (en) | 2016-12-16 | 2019-05-07 | Quantum-Si Incorporated | Compact mode-locked laser module |
| US10550429B2 (en) | 2016-12-22 | 2020-02-04 | 10X Genomics, Inc. | Methods and systems for processing polynucleotides |
| US10815525B2 (en) | 2016-12-22 | 2020-10-27 | 10X Genomics, Inc. | Methods and systems for processing polynucleotides |
| MX2019007530A (en) | 2016-12-22 | 2019-08-16 | Quantum Si Inc | Integrated photodetector with direct binning pixel. |
| WO2018140966A1 (en) | 2017-01-30 | 2018-08-02 | 10X Genomics, Inc. | Methods and systems for droplet-based single cell barcoding |
| US10995333B2 (en) | 2017-02-06 | 2021-05-04 | 10X Genomics, Inc. | Systems and methods for nucleic acid preparation |
| US11385451B2 (en) * | 2017-02-08 | 2022-07-12 | The Regents Of The University Of California | Selective plane illumination in the conventional inverted microscope geometry by side illumination |
| SG11201901822QA (en) | 2017-05-26 | 2019-03-28 | 10X Genomics Inc | Single cell analysis of transposase accessible chromatin |
| US10844372B2 (en) | 2017-05-26 | 2020-11-24 | 10X Genomics, Inc. | Single cell analysis of transposase accessible chromatin |
| US10837047B2 (en) | 2017-10-04 | 2020-11-17 | 10X Genomics, Inc. | Compositions, methods, and systems for bead formation using improved polymers |
| WO2019084043A1 (en) | 2017-10-26 | 2019-05-02 | 10X Genomics, Inc. | Methods and systems for nuclecic acid preparation and chromatin analysis |
| EP3700672B1 (en) | 2017-10-27 | 2022-12-28 | 10X Genomics, Inc. | Methods for sample preparation and analysis |
| SG11201913654QA (en) | 2017-11-15 | 2020-01-30 | 10X Genomics Inc | Functionalized gel beads |
| US10829815B2 (en) | 2017-11-17 | 2020-11-10 | 10X Genomics, Inc. | Methods and systems for associating physical and genetic properties of biological particles |
| US11021701B2 (en) * | 2017-11-22 | 2021-06-01 | New England Biolabs, Inc. | Method for fragmenting DNA by nick translation |
| WO2019108851A1 (en) | 2017-11-30 | 2019-06-06 | 10X Genomics, Inc. | Systems and methods for nucleic acid preparation and analysis |
| WO2019157529A1 (en) | 2018-02-12 | 2019-08-15 | 10X Genomics, Inc. | Methods characterizing multiple analytes from individual cells or cell populations |
| US11639928B2 (en) | 2018-02-22 | 2023-05-02 | 10X Genomics, Inc. | Methods and systems for characterizing analytes from individual cells or cell populations |
| SG11202009889VA (en) | 2018-04-06 | 2020-11-27 | 10X Genomics Inc | Systems and methods for quality control in single cell processing |
| US11932899B2 (en) | 2018-06-07 | 2024-03-19 | 10X Genomics, Inc. | Methods and systems for characterizing nucleic acid molecules |
| AU2019287768A1 (en) | 2018-06-15 | 2020-12-24 | Quantum-Si Incorporated | Data acquisition control for advanced analytic instruments having pulsed optical sources |
| AU2019288394A1 (en) | 2018-06-22 | 2021-01-07 | Quantum-Si Incorporated | Integrated photodetector with charge storage bin of varied detection time |
| US11703427B2 (en) | 2018-06-25 | 2023-07-18 | 10X Genomics, Inc. | Methods and systems for cell and bead processing |
| US20200032335A1 (en) | 2018-07-27 | 2020-01-30 | 10X Genomics, Inc. | Systems and methods for metabolome analysis |
| US11459607B1 (en) | 2018-12-10 | 2022-10-04 | 10X Genomics, Inc. | Systems and methods for processing-nucleic acid molecules from a single cell using sequential co-partitioning and composite barcodes |
| US11845983B1 (en) | 2019-01-09 | 2023-12-19 | 10X Genomics, Inc. | Methods and systems for multiplexing of droplet based assays |
| WO2020154245A1 (en) * | 2019-01-22 | 2020-07-30 | Georgia Tech Research Corporation | Microscale in-situ imaging of dynamic temperature and deformation fields |
| SG11202108788TA (en) | 2019-02-12 | 2021-09-29 | 10X Genomics Inc | Methods for processing nucleic acid molecules |
| US11467153B2 (en) | 2019-02-12 | 2022-10-11 | 10X Genomics, Inc. | Methods for processing nucleic acid molecules |
| US11851683B1 (en) | 2019-02-12 | 2023-12-26 | 10X Genomics, Inc. | Methods and systems for selective analysis of cellular samples |
| US11655499B1 (en) | 2019-02-25 | 2023-05-23 | 10X Genomics, Inc. | Detection of sequence elements in nucleic acid molecules |
| WO2020185791A1 (en) | 2019-03-11 | 2020-09-17 | 10X Genomics, Inc. | Systems and methods for processing optically tagged beads |
| US11747561B2 (en) | 2019-06-14 | 2023-09-05 | Quantum-Si Incorporated | Sliced grating coupler with increased beam alignment sensitivity |
| US11287422B2 (en) | 2019-09-23 | 2022-03-29 | Element Biosciences, Inc. | Multivalent binding composition for nucleic acid analysis |
| US11779918B2 (en) | 2019-12-05 | 2023-10-10 | International Business Machines Corporation | 3D nanochannel interleaved devices |
| IL294734A (en) * | 2020-01-14 | 2022-09-01 | Quantum Si Inc | Amplitude-modulated laser |
| US11851700B1 (en) | 2020-05-13 | 2023-12-26 | 10X Genomics, Inc. | Methods, kits, and compositions for processing extracellular molecules |
| US11837302B1 (en) | 2020-08-07 | 2023-12-05 | Iridia, Inc. | Systems and methods for writing and reading data stored in a polymer using nano-channels |
| AU2022227563A1 (en) | 2021-02-23 | 2023-08-24 | 10X Genomics, Inc. | Probe-based analysis of nucleic acids and proteins |
Family Cites Families (235)
| Publication number | Priority date | Publication date | Assignee | Title |
|---|---|---|---|---|
| US3303085A (en) | 1962-02-28 | 1967-02-07 | Gen Electric | Molecular sieves and methods for producing same |
| GB1271423A (en) | 1968-06-27 | 1972-04-19 | Gen Electric | Improvements relating to the manufacture of sheets having holes therein by an etching process |
| US3852134A (en) | 1969-05-05 | 1974-12-03 | Gen Electric | Method for forming selectively perforate bodies |
| BE755122A (en) | 1969-06-20 | 1971-02-01 | Albright & Wilson | COPPER ELECTROLYTIC DEPOSIT PROCESS |
| US3713921A (en) | 1971-04-01 | 1973-01-30 | Gen Electric | Geometry control of etched nuclear particle tracks |
| US3996345A (en) | 1974-08-12 | 1976-12-07 | Syva Company | Fluorescence quenching with immunological pairs in immunoassays |
| US4424054A (en) | 1978-05-17 | 1984-01-03 | Kcdp Corporation | Fluid-expansible contraceptive tampon and applicator |
| US4351760A (en) | 1979-09-07 | 1982-09-28 | Syva Company | Novel alkyl substituted fluorescent compounds and polyamino acid conjugates |
| SE429036B (en) | 1979-12-17 | 1983-08-08 | Haustrup Plastic As | CONTAINER WITH A CLOSING PART |
| US4711955A (en) | 1981-04-17 | 1987-12-08 | Yale University | Modified nucleotides and methods of preparing and using same |
| NO155316C (en) | 1982-04-23 | 1987-03-11 | Sintef | PROCEDURE FOR MAKING MAGNETIC POLYMER PARTICLES. |
| US5241060A (en) | 1982-06-23 | 1993-08-31 | Enzo Diagnostics, Inc. | Base moiety-labeled detectable nucleatide |
| US4994373A (en) | 1983-01-27 | 1991-02-19 | Enzo Biochem, Inc. | Method and structures employing chemically-labelled polynucleotide probes |
| US5200313A (en) | 1983-08-05 | 1993-04-06 | Miles Inc. | Nucleic acid hybridization assay employing detectable anti-hybrid antibodies |
| IT1172599B (en) | 1983-11-09 | 1987-06-18 | Santarelli Franco | MECHANISM TO OPERATE THE DISC BRAKES OF MOTOR VEHICLES OR OTHER |
| US5821058A (en) | 1984-01-16 | 1998-10-13 | California Institute Of Technology | Automated DNA sequencing technique |
| US5171534A (en) | 1984-01-16 | 1992-12-15 | California Institute Of Technology | Automated DNA sequencing technique |
| US6207421B1 (en) | 1984-03-29 | 2001-03-27 | Li-Cor, Inc. | DNA sequencing and DNA terminators |
| US5230781A (en) | 1984-03-29 | 1993-07-27 | Li-Cor, Inc. | Sequencing near infrared and infrared fluorescence labeled DNA for detecting using laser diodes |
| US5571388A (en) | 1984-03-29 | 1996-11-05 | Li-Cor, Inc. | Sequencing near infrared and infrared fluorescense labeled DNA for detecting using laser diodes and suitable labels thereof |
| US4729947A (en) | 1984-03-29 | 1988-03-08 | The Board Of Regents Of The University Of Nebraska | DNA sequencing |
| US6086737A (en) | 1984-03-29 | 2000-07-11 | Li-Cor, Inc. | Sequencing near infrared and infrared fluorescence labeled DNA for detecting using laser diodes and suitable labels therefor |
| US5366603A (en) | 1984-03-29 | 1994-11-22 | Li-Cor, Inc. | Sequencing near infrared and infrared fluorescence labeled DNA for detecting useing laser diodes |
| US5360523A (en) | 1984-03-29 | 1994-11-01 | Li-Cor, Inc. | DNA sequencing |
| US6004446A (en) | 1984-03-29 | 1999-12-21 | Li-Cor, Inc. | DNA Sequencing |
| US4683195A (en) | 1986-01-30 | 1987-07-28 | Cetus Corporation | Process for amplifying, detecting, and/or-cloning nucleic acid sequences |
| US4965188A (en) | 1986-08-22 | 1990-10-23 | Cetus Corporation | Process for amplifying, detecting, and/or cloning nucleic acid sequences using a thermostable enzyme |
| US4683202A (en) | 1985-03-28 | 1987-07-28 | Cetus Corporation | Process for amplifying nucleic acid sequences |
| US4739044A (en) | 1985-06-13 | 1988-04-19 | Amgen | Method for derivitization of polynucleotides |
| US4757141A (en) | 1985-08-26 | 1988-07-12 | Applied Biosystems, Incorporated | Amino-derivatized phosphite and phosphate linking agents, phosphoramidite precursors, and useful conjugates thereof |
| US4764460A (en) | 1985-11-08 | 1988-08-16 | Hoffmann-La Roche Inc. | Recombinant sigma NS protein |
| US4800159A (en) | 1986-02-07 | 1989-01-24 | Cetus Corporation | Process for amplifying, detecting, and/or cloning nucleic acid sequences |
| FR2597391B1 (en) | 1986-03-25 | 1989-02-24 | Univ Catholique Louvain | PROCESS FOR PERFORMING PERFORATIONS IN SOLID SHEET MATERIAL, IRRADIATION DEVICE FOR IMPLEMENTING THE PROCESS AND PERFORATED MATERIAL THUS OBTAINED |
| US5151507A (en) | 1986-07-02 | 1992-09-29 | E. I. Du Pont De Nemours And Company | Alkynylamino-nucleotides |
| US5047519A (en) | 1986-07-02 | 1991-09-10 | E. I. Du Pont De Nemours And Company | Alkynylamino-nucleotides |
| CA1340806C (en) | 1986-07-02 | 1999-11-02 | James Merrill Prober | Method, system and reagents for dna sequencing |
| US5079352A (en) | 1986-08-22 | 1992-01-07 | Cetus Corporation | Purified thermostable enzyme |
| US5202231A (en) | 1987-04-01 | 1993-04-13 | Drmanac Radoje T | Method of sequencing of genomes by hybridization of oligonucleotide probes |
| US4962037A (en) | 1987-10-07 | 1990-10-09 | United States Of America | Method for rapid base sequencing in DNA and RNA |
| US4793705A (en) | 1987-10-07 | 1988-12-27 | The United States Of America As Represented By The United States Department Of Energy | Single molecule tracking |
| US5244797B1 (en) | 1988-01-13 | 1998-08-25 | Life Technologies Inc | Cloned genes encoding reverse transcriptase lacking rnase h activity |
| US4971903A (en) | 1988-03-25 | 1990-11-20 | Edward Hyman | Pyrophosphate-based method and apparatus for sequencing nucleic acids |
| US5498523A (en) | 1988-07-12 | 1996-03-12 | President And Fellows Of Harvard College | DNA sequencing with pyrophosphatase |
| US4962020A (en) | 1988-07-12 | 1990-10-09 | President And Fellows Of Harvard College | DNA sequencing |
| US5720928A (en) | 1988-09-15 | 1998-02-24 | New York University | Image processing and analysis of individual nucleic acid molecules |
| US4997928A (en) | 1988-09-15 | 1991-03-05 | E. I. Du Pont De Nemours And Company | Fluorescent reagents for the preparation of 5'-tagged oligonucleotides |
| US5091310A (en) | 1988-09-23 | 1992-02-25 | Cetus Corporation | Structure-independent dna amplification by the polymerase chain reaction |
| US5001050A (en) | 1989-03-24 | 1991-03-19 | Consejo Superior Investigaciones Cientificas | PHφ29 DNA polymerase |
| US5198543A (en) | 1989-03-24 | 1993-03-30 | Consejo Superior Investigaciones Cientificas | PHI29 DNA polymerase |
| US4979824A (en) | 1989-05-26 | 1990-12-25 | Board Of Trustees Of The Leland Stanford Junior University | High sensitivity fluorescent single particle and single molecule detection apparatus and method |
| US5143854A (en) | 1989-06-07 | 1992-09-01 | Affymax Technologies N.V. | Large scale photolithographic solid phase synthesis of polypeptides and receptor binding screening thereof |
| US5547839A (en) | 1989-06-07 | 1996-08-20 | Affymax Technologies N.V. | Sequencing of surface immobilized polymers utilizing microflourescence detection |
| US5302509A (en) | 1989-08-14 | 1994-04-12 | Beckman Instruments, Inc. | Method for sequencing polynucleotides |
| US6984487B1 (en) | 1989-08-22 | 2006-01-10 | Hsc Research Development Corporation | Cystic fibrosis gene |
| GB8920571D0 (en) | 1989-09-12 | 1989-10-25 | Carr Robert J G | Examination of objects of macromolecular size |
| US5188934A (en) | 1989-11-14 | 1993-02-23 | Applied Biosystems, Inc. | 4,7-dichlorofluorescein dyes as molecular probes |
| US5091652A (en) | 1990-01-12 | 1992-02-25 | The Regents Of The University Of California | Laser excited confocal microscope fluorescence scanner and method |
| US5274240A (en) | 1990-01-12 | 1993-12-28 | The Regents Of The University Of California | Capillary array confocal fluorescence scanner and method |
| US5401847A (en) | 1990-03-14 | 1995-03-28 | Regents Of The University Of California | DNA complexes with dyes designed for energy transfer as fluorescent markers |
| US5227487A (en) | 1990-04-16 | 1993-07-13 | Molecular Probes, Inc. | Certain tricyclic and pentacyclic-hetero nitrogen rhodol dyes |
| US5079169A (en) | 1990-05-22 | 1992-01-07 | The Regents Of The Stanford Leland Junior University | Method for optically manipulating polymer filaments |
| US5270214A (en) * | 1990-05-30 | 1993-12-14 | The United States Of America As Represented By The United States Department Of Energy | Method for sequencing DNA base pairs |
| DE69132843T2 (en) | 1990-12-06 | 2002-09-12 | Affymetrix Inc N D Ges D Staat | Identification of nucleic acids in samples |
| US6004744A (en) | 1991-03-05 | 1999-12-21 | Molecular Tool, Inc. | Method for determining nucleotide identity through extension of immobilized primer |
| US5578443A (en) | 1991-03-06 | 1996-11-26 | Regents Of The University Of Minnesota | DNA sequence-based HLA typing method |
| US5119463A (en) * | 1991-04-09 | 1992-06-02 | Abbott Laboratories | Compound optical probe employing single optical waveguide |
| JP3123249B2 (en) * | 1991-09-10 | 2001-01-09 | 株式会社日立製作所 | DNA molecule length measuring method and measuring device |
| US5405747A (en) * | 1991-09-25 | 1995-04-11 | The Regents Of The University Of California Office Of Technology Transfer | Method for rapid base sequencing in DNA and RNA with two base labeling |
| US6048690A (en) | 1991-11-07 | 2000-04-11 | Nanogen, Inc. | Methods for electronic fluorescent perturbation for analysis and electronic perturbation catalysis for synthesis |
| US5605662A (en) | 1993-11-01 | 1997-02-25 | Nanogen, Inc. | Active programmable electronic devices for molecular biological analysis and diagnostics |
| US5449917A (en) | 1992-02-06 | 1995-09-12 | Costar Corporation | Method and apparatus for forming a plurality of tracks in a flexible workpiece with a high energy particle |
| JPH05244997A (en) | 1992-03-04 | 1993-09-24 | Hitachi Ltd | Method for determining base sequence of dna or rna |
| AU3816993A (en) | 1992-03-19 | 1993-10-21 | Regents Of The University Of California, The | Multiple tag labeling method for DNA sequencing |
| US5470705A (en) | 1992-04-03 | 1995-11-28 | Applied Biosystems, Inc. | Probe composition containing a binding domain and polymer chain and methods of use |
| GB9208733D0 (en) | 1992-04-22 | 1992-06-10 | Medical Res Council | Dna sequencing method |
| US5403708A (en) | 1992-07-06 | 1995-04-04 | Brennan; Thomas M. | Methods and compositions for determining the sequence of nucleic acids |
| US5503980A (en) | 1992-11-06 | 1996-04-02 | Trustees Of Boston University | Positional sequencing by hybridization |
| JP2575270B2 (en) | 1992-11-10 | 1997-01-22 | 浜松ホトニクス株式会社 | Method for determining base sequence of nucleic acid, method for detecting single molecule, apparatus therefor and method for preparing sample |
| EP1262564A3 (en) | 1993-01-07 | 2004-03-31 | Sequenom, Inc. | Dna sequencing by mass spectrometry |
| WO1994016104A1 (en) | 1993-01-08 | 1994-07-21 | Ctrc Research Foundation | Color imaging system for use in molecular biology |
| IL108497A0 (en) | 1993-02-01 | 1994-05-30 | Seq Ltd | Methods and apparatus for dna sequencing |
| US5324401A (en) * | 1993-02-05 | 1994-06-28 | Iowa State University Research Foundation, Inc. | Multiplexed fluorescence detector system for capillary electrophoresis |
| US5403707A (en) | 1993-05-14 | 1995-04-04 | Eastman Kodak Company | Diagnostic compositions, elements, methods and test kits for amplification and detection of retroviral DNA using primers having matched melting temperatures |
| US5677196A (en) | 1993-05-18 | 1997-10-14 | University Of Utah Research Foundation | Apparatus and methods for multi-analyte homogeneous fluoro-immunoassays |
| US5424841A (en) | 1993-05-28 | 1995-06-13 | Molecular Dynamics | Apparatus for measuring spatial distribution of fluorescence on a substrate |
| US5473060A (en) | 1993-07-02 | 1995-12-05 | Lynx Therapeutics, Inc. | Oligonucleotide clamps having diagnostic applications |
| US5706805A (en) | 1993-08-12 | 1998-01-13 | Trustees Of Dartmouth College | Apparatus and methodology for determining oxygen tension in biological systems |
| US5494030A (en) | 1993-08-12 | 1996-02-27 | Trustees Of Dartmouth College | Apparatus and methodology for determining oxygen in biological systems |
| US5804561A (en) | 1993-08-16 | 1998-09-08 | Hsia; Jen-Chang | Compositions and methods utilizing nitroxides in combination with biocompatible macromolecules |
| US6458758B1 (en) | 1993-08-16 | 2002-10-01 | Synzyme Technologies, Inc. | Compositions and methods utilizing nitroxides in combination with biocompatible macromolecules |
| US5817632A (en) | 1993-08-16 | 1998-10-06 | Hsia; Jen-Chang | Compositions and methods utilizing nitroxides in combination with biocompatible macromolecules |
| US5741893A (en) | 1993-08-16 | 1998-04-21 | Hsia; Jen-Chang | Compositions and methods utilizing nitroxides in combination with biocompatible macromolecules |
| US5725839A (en) | 1993-08-16 | 1998-03-10 | Hsia; Jen-Chang | Compositions and methods utilizing nitroxides in combination with biocompatible macromolecules for ERI or MRI |
| US5824781A (en) | 1993-08-16 | 1998-10-20 | Hsia; Jen-Chang | Compositions and methods utilizing nitroxides in combination with biocompatible macromolecules |
| US5840701A (en) | 1993-08-16 | 1998-11-24 | Hsia; Jen-Chang | Compositions and methods utilizing nitroxides in combination with biocompatible macromolecules |
| US5807831A (en) | 1993-08-16 | 1998-09-15 | Hsia; Jen-Chang | Compositions and methods utilizing nitroxides in combination with biocompatible macromolecules |
| WO1995006138A1 (en) | 1993-08-25 | 1995-03-02 | The Regents Of The University Of California | Microscopic method for detecting micromotions |
| US5462467A (en) | 1993-09-08 | 1995-10-31 | Silicon Video Corporation | Fabrication of filamentary field-emission device, including self-aligned gate |
| US5564959A (en) | 1993-09-08 | 1996-10-15 | Silicon Video Corporation | Use of charged-particle tracks in fabricating gated electron-emitting devices |
| CA2170264A1 (en) | 1993-09-10 | 1995-03-16 | Michael W. Konrad | Optical detection of position of oligonucleotides on large dna molecules |
| US5470710A (en) | 1993-10-22 | 1995-11-28 | University Of Utah | Automated hybridization/imaging device for fluorescent multiplex DNA sequencing |
| JP3488465B2 (en) * | 1993-10-28 | 2004-01-19 | ヒューストン・アドバンスド・リサーチ・センター | Microfabricated flow-through porosity device for separately detecting binding reactions |
| US5538848A (en) | 1994-11-16 | 1996-07-23 | Applied Biosystems Division, Perkin-Elmer Corp. | Method for detecting nucleic acid amplification using self-quenching fluorescence probe |
| WO1995014775A1 (en) | 1993-11-26 | 1995-06-01 | British Technology Group Limited | Translational enhancer dna |
| US5654419A (en) | 1994-02-01 | 1997-08-05 | The Regents Of The University Of California | Fluorescent labels and their use in separations |
| US5869255A (en) | 1994-02-01 | 1999-02-09 | The Regents Of The University Of California | Probes labeled with energy transfer couples dyes exemplified with DNA fragment analysis |
| US5631734A (en) | 1994-02-10 | 1997-05-20 | Affymetrix, Inc. | Method and apparatus for detection of fluorescently labeled materials |
| US5605793A (en) | 1994-02-17 | 1997-02-25 | Affymax Technologies N.V. | Methods for in vitro recombination |
| US5512462A (en) | 1994-02-25 | 1996-04-30 | Hoffmann-La Roche Inc. | Methods and reagents for the polymerase chain reaction amplification of long DNA sequences |
| US6593148B1 (en) | 1994-03-01 | 2003-07-15 | Li-Cor, Inc. | Cyanine dye compounds and labeling methods |
| US5552278A (en) | 1994-04-04 | 1996-09-03 | Spectragen, Inc. | DNA sequencing by stepwise ligation and cleavage |
| US5459325A (en) | 1994-07-19 | 1995-10-17 | Molecular Dynamics, Inc. | High-speed fluorescence scanner |
| US5695934A (en) | 1994-10-13 | 1997-12-09 | Lynx Therapeutics, Inc. | Massively parallel sequencing of sorted polynucleotides |
| SE9500342D0 (en) | 1995-01-31 | 1995-01-31 | Marek Kwiatkowski | Novel chain terminators, the use thereof for nucleic acid sequencing and synthesis and a method of their preparation |
| US5601982A (en) | 1995-02-07 | 1997-02-11 | Sargent; Jeannine P. | Method and apparatus for determining the sequence of polynucleotides |
| US5599695A (en) | 1995-02-27 | 1997-02-04 | Affymetrix, Inc. | Printing molecular library arrays using deprotection agents solely in the vapor phase |
| US5538898A (en) * | 1995-03-16 | 1996-07-23 | International Business Machines Corporation | Method suitable for identifying a code sequence of a biomolecule |
| US6362002B1 (en) | 1995-03-17 | 2002-03-26 | President And Fellows Of Harvard College | Characterization of individual polymer molecules based on monomer-interface interactions |
| US5795782A (en) | 1995-03-17 | 1998-08-18 | President & Fellows Of Harvard College | Characterization of individual polymer molecules based on monomer-interface interactions |
| AU5525296A (en) * | 1995-03-24 | 1996-10-16 | Ely Michael Rabani | Assembly of complex molecular and supramolecular objects and devices and uses thereof |
| US5961923A (en) | 1995-04-25 | 1999-10-05 | Irori | Matrices with memories and uses thereof |
| DE19515552A1 (en) | 1995-04-27 | 1996-10-31 | Europ Lab Molekularbiolog | Simultaneous sequencing of nucleic acids |
| US5776674A (en) | 1995-06-05 | 1998-07-07 | Seq, Ltd | Chemical biochemical and biological processing in thin films |
| US5635728A (en) | 1995-06-19 | 1997-06-03 | Denoptix, Inc. | Rotating scanner system for reading multiple storage layer radiation screens |
| US5856174A (en) | 1995-06-29 | 1999-01-05 | Affymetrix, Inc. | Integrated nucleic acid diagnostic device |
| US5661028A (en) | 1995-09-29 | 1997-08-26 | Lockheed Martin Energy Systems, Inc. | Large scale DNA microsequencing device |
| US5814524A (en) | 1995-12-14 | 1998-09-29 | Trustees Of Tufts College | Optical sensor apparatus for far-field viewing and making optical analytical measurements at remote locations |
| US6027890A (en) | 1996-01-23 | 2000-02-22 | Rapigene, Inc. | Methods and compositions for enhancing sensitivity in the analysis of biological-based assays |
| US5972603A (en) | 1996-02-09 | 1999-10-26 | President And Fellows Of Harvard College | DNA polymerase with modified processivity |
| US6020481A (en) | 1996-04-01 | 2000-02-01 | The Perkin-Elmer Corporation | Asymmetric benzoxanthene dyes |
| US6162931A (en) | 1996-04-12 | 2000-12-19 | Molecular Probes, Inc. | Fluorinated xanthene derivatives |
| WO1997039150A1 (en) | 1996-04-15 | 1997-10-23 | University Of Southern California | Synthesis of fluorophore-labeled dna |
| US6083695A (en) | 1996-04-15 | 2000-07-04 | The University Of Houston | Optimized primer library for gene sequencing and method of using same |
| US5800996A (en) | 1996-05-03 | 1998-09-01 | The Perkin Elmer Corporation | Energy transfer dyes with enchanced fluorescence |
| US5863727A (en) | 1996-05-03 | 1999-01-26 | The Perkin-Elmer Corporation | Energy transfer dyes with enhanced fluorescence |
| US5846727A (en) | 1996-06-06 | 1998-12-08 | Board Of Supervisors Of Louisiana State University And Agricultural & Mechanical College | Microsystem for rapid DNA sequencing |
| US5866336A (en) | 1996-07-16 | 1999-02-02 | Oncor, Inc. | Nucleic acid amplification oligonucleotides with molecular energy transfer labels and methods based thereon |
| US5906723A (en) | 1996-08-26 | 1999-05-25 | The Regents Of The University Of California | Electrochemical detector integrated on microfabricated capillary electrophoresis chips |
| AU3829197A (en) | 1996-09-03 | 1998-03-26 | Pioneer Hi-Bred International, Inc. | Method and apparatus for single molecule two color fluorescent detection and molecular weight and concentration determination |
| US5830659A (en) | 1996-09-13 | 1998-11-03 | University Of Utah Research Foundation | Active microtubule-based separations by kinesins |
| US5723298A (en) | 1996-09-16 | 1998-03-03 | Li-Cor, Inc. | Cycle labeling and sequencing with thermostable polymerases |
| GB9620209D0 (en) | 1996-09-27 | 1996-11-13 | Cemu Bioteknik Ab | Method of sequencing DNA |
| US5858671A (en) | 1996-11-01 | 1999-01-12 | The University Of Iowa Research Foundation | Iterative and regenerative DNA sequencing method |
| US6291164B1 (en) | 1996-11-22 | 2001-09-18 | Invitrogen Corporation | Methods for preventing inhibition of nucleic acid synthesis by pyrophosphate |
| GB9626815D0 (en) | 1996-12-23 | 1997-02-12 | Cemu Bioteknik Ab | Method of sequencing DNA |
| US5697597A (en) | 1997-01-10 | 1997-12-16 | Goodbold; Frank | Snowmobile entrenchment lifting device |
| US6027709A (en) | 1997-01-10 | 2000-02-22 | Li-Cor Inc. | Fluorescent cyanine dyes |
| US6136543A (en) | 1997-01-31 | 2000-10-24 | Hitachi, Ltd. | Method for determining nucleic acids base sequence and apparatus therefor |
| DE69825601T2 (en) | 1997-02-12 | 2005-04-28 | Chan, Eugene Y, Brookline | METHOD FOR THE ANALYSIS OF POLYMERS |
| US6403311B1 (en) | 1997-02-12 | 2002-06-11 | Us Genomics | Methods of analyzing polymers using ordered label strategies |
| US6024981A (en) | 1997-04-16 | 2000-02-15 | Cima Labs Inc. | Rapidly dissolving robust dosage form |
| US6143496A (en) | 1997-04-17 | 2000-11-07 | Cytonix Corporation | Method of sampling, amplifying and quantifying segment of nucleic acid, polymerase chain reaction assembly having nanoliter-sized sample chambers, and method of filling assembly |
| US5928869A (en) | 1997-05-30 | 1999-07-27 | Becton, Dickinson And Company | Detection of nucleic acids by fluorescence quenching |
| US5888792A (en) | 1997-07-11 | 1999-03-30 | Incyte Pharmaceuticals, Inc. | ATP-dependent RNA helicase protein |
| ATE225858T1 (en) | 1997-07-28 | 2002-10-15 | Medical Biosystems Ltd | SEQUENCE ANALYSIS OF NUCLEIC ACIDS |
| US6245506B1 (en) | 1997-07-30 | 2001-06-12 | Bbi Bioseq, Inc. | Integrated sequencing device |
| US5932442A (en) | 1997-09-23 | 1999-08-03 | Incyte Pharmaceuticals, Inc. | Human regulatory molecules |
| US6130101A (en) | 1997-09-23 | 2000-10-10 | Molecular Probes, Inc. | Sulfonated xanthene derivatives |
| US6399334B1 (en) | 1997-09-24 | 2002-06-04 | Invitrogen Corporation | Normalized nucleic acid libraries and methods of production thereof |
| US6008379A (en) | 1997-10-01 | 1999-12-28 | The Perkin-Elmer Corporation | Aromatic-substituted xanthene dyes |
| US6485944B1 (en) | 1997-10-10 | 2002-11-26 | President And Fellows Of Harvard College | Replica amplification of nucleic acid arrays |
| AU1138699A (en) | 1997-11-12 | 1999-05-31 | Mcgill University | Dna demethylase, therapeutic and diagnostic uses thereof |
| US6322901B1 (en) | 1997-11-13 | 2001-11-27 | Massachusetts Institute Of Technology | Highly luminescent color-selective nano-crystalline materials |
| US5990479A (en) | 1997-11-25 | 1999-11-23 | Regents Of The University Of California | Organo Luminescent semiconductor nanocrystal probes for biological applications and process for making and using such probes |
| US5936087A (en) | 1997-11-25 | 1999-08-10 | The Perkin-Elmer Corporation | Dibenzorhodamine dyes |
| US6207392B1 (en) | 1997-11-25 | 2001-03-27 | The Regents Of The University Of California | Semiconductor nanocrystal probes for biological applications and process for making and using such probes |
| WO1999044045A1 (en) | 1998-02-27 | 1999-09-02 | Massachusetts Institute Of Technology | Single molecule detection with surface-enhanced raman scattering and applications in dna or rna sequencing |
| CA2330673C (en) | 1998-05-01 | 2009-05-26 | Arizona Board Of Regents | Method of determining the nucleotide sequence of oligonucleotides and dna molecules |
| US7875440B2 (en) | 1998-05-01 | 2011-01-25 | Arizona Board Of Regents | Method of determining the nucleotide sequence of oligonucleotides and DNA molecules |
| US6780591B2 (en) | 1998-05-01 | 2004-08-24 | Arizona Board Of Regents | Method of determining the nucleotide sequence of oligonucleotides and DNA molecules |
| ES2211138T3 (en) | 1998-07-29 | 2004-07-01 | Max-Planck-Gesellschaft Zur Forderung Der Wissenschaften E.V. | NEW COFACTORS OF METHYLTRANSPHERASES. |
| CA2339121A1 (en) | 1998-07-30 | 2000-02-10 | Shankar Balasubramanian | Arrayed biomolecules and their use in sequencing |
| US6263286B1 (en) | 1998-08-13 | 2001-07-17 | U.S. Genomics, Inc. | Methods of analyzing polymers using a spatial network of fluorophores and fluorescence resonance energy transfer |
| AU5560699A (en) | 1998-08-13 | 2000-03-06 | U.S. Genomics, Inc. | Optically characterizing polymers |
| US6790671B1 (en) | 1998-08-13 | 2004-09-14 | Princeton University | Optically characterizing polymers |
| US6210896B1 (en) | 1998-08-13 | 2001-04-03 | Us Genomics | Molecular motors |
| DE19844931C1 (en) | 1998-09-30 | 2000-06-15 | Stefan Seeger | Procedures for DNA or RNA sequencing |
| US6232075B1 (en) | 1998-12-14 | 2001-05-15 | Li-Cor, Inc. | Heterogeneous assay for pyrophosphate detection |
| US6214278B1 (en) | 1999-02-17 | 2001-04-10 | Denki Kagaku Kogyo Kabushiki Kaisha | Rubber-modified styrene copolymer |
| ATE556149T1 (en) | 1999-02-23 | 2012-05-15 | Caliper Life Sciences Inc | MANIPULATION OF MICROPARTICLES IN MICROFLUIDIC SYSTEMS |
| ES2310514T3 (en) | 1999-03-10 | 2009-01-16 | Asm Scientific, Inc. | A METHOD FOR DIRECT SEQUENCING OF NUCLEIC ACID. |
| GB9907813D0 (en) | 1999-04-06 | 1999-06-02 | Medical Biosystems Ltd | Synthesis |
| GB9907812D0 (en) | 1999-04-06 | 1999-06-02 | Medical Biosystems Ltd | Sequencing |
| US6054316A (en) | 1999-06-25 | 2000-04-25 | Isis Pharmaceuticals Inc. | Antisense inhibition of ETs-2 expression |
| US7501245B2 (en) | 1999-06-28 | 2009-03-10 | Helicos Biosciences Corp. | Methods and apparatuses for analyzing polynucleotide sequences |
| US6818395B1 (en) | 1999-06-28 | 2004-11-16 | California Institute Of Technology | Methods and apparatus for analyzing polynucleotide sequences |
| US6927065B2 (en) | 1999-08-13 | 2005-08-09 | U.S. Genomics, Inc. | Methods and apparatus for characterization of single polymers |
| US6762059B2 (en) | 1999-08-13 | 2004-07-13 | U.S. Genomics, Inc. | Methods and apparatuses for characterization of single polymers |
| US6696022B1 (en) | 1999-08-13 | 2004-02-24 | U.S. Genomics, Inc. | Methods and apparatuses for stretching polymers |
| US6982146B1 (en) | 1999-08-30 | 2006-01-03 | The United States Of America As Represented By The Department Of Health And Human Services | High speed parallel molecular nucleic acid sequencing |
| US6309836B1 (en) | 1999-10-05 | 2001-10-30 | Marek Kwiatkowski | Compounds for protecting hydroxyls and methods for their use |
| US6908736B1 (en) | 1999-10-06 | 2005-06-21 | Medical Biosystems, Ltd. | DNA sequencing method |
| CA2440754A1 (en) | 2001-03-12 | 2002-09-19 | Stephen Quake | Methods and apparatus for analyzing polynucleotide sequences by asynchronous base extension |
| EP1402069A4 (en) | 2001-06-08 | 2006-01-25 | Us Genomics Inc | Methods and products for analyzing nucleic acids using nick translation |
| WO2002101353A2 (en) | 2001-06-08 | 2002-12-19 | U.S. Genomics, Inc. | Methods and products for analyzing nucleic acids based on methylation status |
| JP2005504275A (en) | 2001-09-18 | 2005-02-10 | ユー.エス. ジェノミクス, インコーポレイテッド | Differential tagging of polymers for high-resolution linear analysis |
| US8423294B2 (en) | 2001-09-18 | 2013-04-16 | Pathogenetix, Inc. | High resolution linear analysis of polymers |
| AU2003228649A1 (en) | 2002-04-23 | 2003-11-10 | U.S.Genomics, Inc. | Compositions and methods related to two-arm nucleic acid probes |
| WO2004048514A2 (en) | 2002-05-09 | 2004-06-10 | U.S. Genomics, Inc. | Methods for analyzing a nucleic acid |
| US7282330B2 (en) | 2002-05-28 | 2007-10-16 | U.S. Genomics, Inc. | Methods and apparati using single polymer analysis |
| US7371520B2 (en) | 2002-05-28 | 2008-05-13 | U.S. Genomics, Inc. | Methods and apparati using single polymer analysis |
| JP2005533256A (en) | 2002-07-17 | 2005-11-04 | ユー.エス. ジェノミクス, インコーポレイテッド | Methods and compositions for analyzing polymers using chimeric tags |
| EP1586068B1 (en) | 2003-01-23 | 2008-07-30 | U.S. Genomics, Inc. | Methods for analyzing polymer populations |
| JP2006522940A (en) | 2003-04-10 | 2006-10-05 | ユー.エス. ジェノミクス, インコーポレイテッド | Manipulating polymers in microchannels |
| WO2005012575A1 (en) | 2003-08-01 | 2005-02-10 | U.S. Genomics, Inc. | Methods and compositions related to the use of sequence-specific endonucleases for analyzing nucleic acids under non-cleaving conditions |
| WO2005017205A2 (en) | 2003-08-04 | 2005-02-24 | U. S. Genomics, Inc. | Nucleic acid mapping using linear analysis |
| WO2005022162A1 (en) | 2003-08-21 | 2005-03-10 | U.S. Genomics, Inc. | Quantum dots and methods of use thereof |
| US20050142595A1 (en) | 2003-11-07 | 2005-06-30 | U.S. Genomics, Inc. | Intercalator FRET donors or acceptors |
| WO2005047471A2 (en) | 2003-11-07 | 2005-05-26 | U.S. Genomics, Inc. | Improved fret efficiency methods |
| US7169560B2 (en) | 2003-11-12 | 2007-01-30 | Helicos Biosciences Corporation | Short cycle methods for sequencing polynucleotides |
| US20050123974A1 (en) | 2003-11-17 | 2005-06-09 | U.S. Genomics, Inc. | Methods and compositions relating to single reactive center reagents |
| JP2007518107A (en) | 2004-01-13 | 2007-07-05 | ユー.エス. ジェノミクス, インコーポレイテッド | Detection and quantification of analytes in solution using polymers |
| US20050196790A1 (en) | 2004-02-05 | 2005-09-08 | U.S. Genomics, Inc. | Methods for detection and quantitation of minimum length polymers |
| US7981604B2 (en) | 2004-02-19 | 2011-07-19 | California Institute Of Technology | Methods and kits for analyzing polynucleotide sequences |
| US20060046258A1 (en) | 2004-02-27 | 2006-03-02 | Lapidus Stanley N | Applications of single molecule sequencing |
| US7279337B2 (en) * | 2004-03-10 | 2007-10-09 | Agilent Technologies, Inc. | Method and apparatus for sequencing polymers through tunneling conductance variation detection |
| US20050221408A1 (en) | 2004-03-19 | 2005-10-06 | U.S. Genomics, Inc. | Compositions and methods for detection of single molecules |
| US20050239085A1 (en) | 2004-04-23 | 2005-10-27 | Buzby Philip R | Methods for nucleic acid sequence determination |
| US20050260609A1 (en) | 2004-05-24 | 2005-11-24 | Lapidus Stanley N | Methods and devices for sequencing nucleic acids |
| JP2008512084A (en) | 2004-05-25 | 2008-04-24 | ヘリコス バイオサイエンシーズ コーポレイション | Methods and devices for nucleic acid sequencing |
| US20060024711A1 (en) | 2004-07-02 | 2006-02-02 | Helicos Biosciences Corporation | Methods for nucleic acid amplification and sequence determination |
| US7276720B2 (en) | 2004-07-19 | 2007-10-02 | Helicos Biosciences Corporation | Apparatus and methods for analyzing samples |
| US20060024678A1 (en) | 2004-07-28 | 2006-02-02 | Helicos Biosciences Corporation | Use of single-stranded nucleic acid binding proteins in sequencing |
| US7351538B2 (en) | 2004-08-23 | 2008-04-01 | U.S. Genomics | Systems and methods for detecting and analyzing polymers |
| US7482120B2 (en) | 2005-01-28 | 2009-01-27 | Helicos Biosciences Corporation | Methods and compositions for improving fidelity in a nucleic acid synthesis reaction |
| US20060263790A1 (en) | 2005-05-20 | 2006-11-23 | Timothy Harris | Methods for improving fidelity in a nucleic acid synthesis reaction |
| US20070099212A1 (en) | 2005-07-28 | 2007-05-03 | Timothy Harris | Consecutive base single molecule sequencing |
| US7666593B2 (en) | 2005-08-26 | 2010-02-23 | Helicos Biosciences Corporation | Single molecule sequencing of captured nucleic acids |
| US20090075252A1 (en) | 2006-04-14 | 2009-03-19 | Helicos Biosciences Corporation | Methods for increasing accuracy of nucleic acid sequencing |
| US7282337B1 (en) | 2006-04-14 | 2007-10-16 | Helicos Biosciences Corporation | Methods for increasing accuracy of nucleic acid sequencing |
| US7767805B2 (en) | 2007-05-03 | 2010-08-03 | Helicos Biosciences Corporation | Methods and compositions for sequencing a nucleic acid |
| US7678894B2 (en) | 2007-05-18 | 2010-03-16 | Helicos Biosciences Corporation | Nucleotide analogs |
| US7767400B2 (en) | 2008-02-03 | 2010-08-03 | Helicos Biosciences Corporation | Paired-end reads in sequencing by synthesis |
| US7790391B2 (en) | 2008-03-28 | 2010-09-07 | Helicos Biosciences Corporation | Methods of equalizing representation levels of nucleic acid targets |
| WO2010051434A1 (en) | 2008-10-31 | 2010-05-06 | Helicos Biosciences Corporation | Polymerases and methods of use thereof |
-
1998
- 1998-02-11 DE DE69825601T patent/DE69825601T2/en not_active Expired - Lifetime
- 1998-02-11 IL IL13133298A patent/IL131332A/en not_active IP Right Cessation
- 1998-02-11 CN CN98803852A patent/CN1251609A/en active Pending
- 1998-02-11 IL IL15600298A patent/IL156002A0/en unknown
- 1998-02-11 AT AT98906490T patent/ATE273381T1/en not_active IP Right Cessation
- 1998-02-11 CA CA002281205A patent/CA2281205A1/en not_active Abandoned
- 1998-02-11 EP EP98906490A patent/EP1009802B1/en not_active Expired - Lifetime
- 1998-02-11 JP JP53510498A patent/JP3935509B2/en not_active Expired - Lifetime
- 1998-02-11 AU AU61703/98A patent/AU762888B2/en not_active Ceased
- 1998-02-11 WO PCT/US1998/003024 patent/WO1998035012A2/en active IP Right Grant
- 1998-08-13 US US09/134,411 patent/US6355420B1/en not_active Expired - Lifetime
-
2001
- 2001-05-10 US US09/852,968 patent/US8168380B2/en not_active Expired - Lifetime
-
2011
- 2011-01-06 US US12/985,905 patent/US20110210272A1/en not_active Abandoned
-
2012
- 2012-03-28 US US13/432,959 patent/US20120217161A1/en not_active Abandoned
-
2013
- 2013-09-23 US US14/034,407 patent/US9745625B2/en not_active Expired - Lifetime
Cited By (11)
| Publication number | Priority date | Publication date | Assignee | Title |
|---|---|---|---|---|
| CN101915957B (en) * | 2006-06-12 | 2012-12-12 | 加利福尼亚太平洋生物科学公司 | Substrates for performing analytical reactions |
| CN108463714A (en) * | 2016-01-13 | 2018-08-28 | 马克斯-普朗克科学促进学会 | The emission lifetime measurement method and equipment of average life span for measuring excited electronic state |
| CN108463714B (en) * | 2016-01-13 | 2021-02-05 | 马克斯-普朗克科学促进学会 | Emission lifetime measurement method and apparatus for measuring average lifetime of excited electronic states |
| CN109477813A (en) * | 2016-07-05 | 2019-03-15 | 昆塔波尔公司 | Based on optical nano-pore sequencing |
| CN108646332A (en) * | 2018-06-11 | 2018-10-12 | 中南大学 | The building method of novel zone plate and its zone plate is made |
| CN108646332B (en) * | 2018-06-11 | 2020-06-16 | 中南大学 | Novel zone plate construction method and zone plate manufactured by same |
| CN111213635A (en) * | 2018-11-23 | 2020-06-02 | 江苏龙灯化学有限公司 | Composition containing bifenazate and hexythiazox |
| CN111213635B (en) * | 2018-11-23 | 2022-07-26 | 江苏龙灯化学有限公司 | Composition containing bifenazate and hexythiazox |
| CN111931898A (en) * | 2020-07-23 | 2020-11-13 | 兰州理工大学 | Intelligent electrolytic aluminum distribution scheduling method based on deep immune clone algorithm |
| CN111931898B (en) * | 2020-07-23 | 2023-05-23 | 兰州理工大学 | Electrolytic aluminum intelligent aluminum distribution scheduling method based on deep immune cloning algorithm |
| CN115060772A (en) * | 2022-08-16 | 2022-09-16 | 天津市协和医药科技集团有限公司 | CA50 antigen electrochemical detection method based on functionalized nucleopore membrane |
Also Published As
| Publication number | Publication date |
|---|---|
| WO1998035012A3 (en) | 1999-02-11 |
| IL131332A0 (en) | 2001-01-28 |
| AU762888B2 (en) | 2003-07-10 |
| JP2001514739A (en) | 2001-09-11 |
| US8168380B2 (en) | 2012-05-01 |
| US20120217161A1 (en) | 2012-08-30 |
| WO1998035012A2 (en) | 1998-08-13 |
| DE69825601D1 (en) | 2004-09-16 |
| AU6170398A (en) | 1998-08-26 |
| ATE273381T1 (en) | 2004-08-15 |
| US20020119455A1 (en) | 2002-08-29 |
| IL131332A (en) | 2003-07-31 |
| US20110210272A1 (en) | 2011-09-01 |
| EP1009802A2 (en) | 2000-06-21 |
| CA2281205A1 (en) | 1998-08-13 |
| EP1009802B1 (en) | 2004-08-11 |
| US9745625B2 (en) | 2017-08-29 |
| DE69825601T2 (en) | 2005-04-28 |
| JP3935509B2 (en) | 2007-06-27 |
| US20140199209A1 (en) | 2014-07-17 |
| US6355420B1 (en) | 2002-03-12 |
| IL156002A0 (en) | 2003-12-23 |
Similar Documents
| Publication | Publication Date | Title |
|---|---|---|
| CN1251609A (en) | Method and product for analyzing polymers | |
| US6376177B1 (en) | Apparatus and method for the analysis of nucleic acids hybridization on high density NA chips | |
| US6210896B1 (en) | Molecular motors | |
| Fuller et al. | The challenges of sequencing by synthesis | |
| US11384391B2 (en) | Flourescene energy transfer-based single molecule/ensemble DNA sequencing by synthesis | |
| Borland et al. | Chemical analysis of single cells | |
| US7270951B1 (en) | Method for direct nucleic acid sequencing | |
| Zhao et al. | Integrated microfluidic system with chemiluminescence detection for single cell analysis after intracellular labeling | |
| US20110008775A1 (en) | Sequencing of nucleic acids | |
| CN1186513A (en) | Multi-array, multi-specific electrochemiluminescence testing | |
| CN1323355A (en) | Optically characterizing polymers | |
| US20210382002A1 (en) | Detection methods for epitachophoresis workflow automation | |
| JP2003505110A (en) | Methods and apparatus for template capture and normalization for sub-microliter reactions | |
| CN102639716A (en) | Gene expression analysis method using two dimensional cDNA library | |
| Cousino et al. | Peer reviewed: pushing down the limits of detection: molecular needles in a haystack | |
| CN105525010A (en) | Stem-loop structured combined probe and application thereof | |
| EP0616212B1 (en) | Apparatus and method for reading a gel electrophoresis pattern | |
| Soper et al. | DNA sequencing using fluorescence detection | |
| US20100167277A1 (en) | Fret sequencing by DNA scanning proteins | |
| Kerékgyártó et al. | Capillary gel electrophoresis | |
| Seo et al. | Multiplex mini Y short tandem repeat haplotyping using fluorescence energy transfer labeled primers | |
| Castro et al. | Single-molecule electrophoresis: applications to biomolecular detection | |
| McDonald | The use of biochemical methods in extraterrestrial life detection | |
| Spencer et al. | Ionflux: A Microfluidic Approach to Ensemble Recording and Block of Whole-Cell Current from Voltage-Gated Ion Channels | |
| Okagbare | Polymer-Based Microfluidic Devices for High Throughput Single Molecule Detection: Applications in Biological and Drug Discovery |
Legal Events
| Date | Code | Title | Description |
|---|---|---|---|
| C06 | Publication | ||
| PB01 | Publication | ||
| C10 | Entry into substantive examination | ||
| SE01 | Entry into force of request for substantive examination | ||
| C02 | Deemed withdrawal of patent application after publication (patent law 2001) | ||
| WD01 | Invention patent application deemed withdrawn after publication |