EP0130467A2 - Efficient trace method adaptable to multiprocessors - Google Patents
Efficient trace method adaptable to multiprocessors Download PDFInfo
- Publication number
- EP0130467A2 EP0130467A2 EP84107039A EP84107039A EP0130467A2 EP 0130467 A2 EP0130467 A2 EP 0130467A2 EP 84107039 A EP84107039 A EP 84107039A EP 84107039 A EP84107039 A EP 84107039A EP 0130467 A2 EP0130467 A2 EP 0130467A2
- Authority
- EP
- European Patent Office
- Prior art keywords
- trace
- instruction
- tracing
- entry
- cpu
- Prior art date
- Legal status (The legal status is an assumption and is not a legal conclusion. Google has not performed a legal analysis and makes no representation as to the accuracy of the status listed.)
- Granted
Links
Images


Classifications
-
- G—PHYSICS
- G06—COMPUTING; CALCULATING OR COUNTING
- G06F—ELECTRIC DIGITAL DATA PROCESSING
- G06F11/00—Error detection; Error correction; Monitoring
- G06F11/36—Preventing errors by testing or debugging software
- G06F11/362—Software debugging
- G06F11/3636—Software debugging by tracing the execution of the program
Definitions
- the subject invention relates to a program tracing and monitoring method which can operate on any CPU of a multiprocessor (MP) without tracing interaction between CPUs in the MP concurrently doing program tracing.
- MP multiprocessor
- Tracing routines in software and microcode have been provided in the prior art for the purpose of tracing through a program to assist in locating errors or bugs therein.
- Software monitoring routines and instructions e.g. S/370 monitor call instruction
- S/370 monitor call instruction also are in the prior art for the purpose of storing hardware and software states sensed during the execution of programs on a system, in order to enable analysis of the results to measure system performance and enable tuning of the resource configuration of the system.
- Tracing assists in the determination of system problems by providing a snapshot record in storage of certain types of states existing when a location in a program is reached.
- the instruction support for software monitoring has some similarity to tracing instruction support. However their functions are different, i.e. software diagnostics for tracing, and system performance measurement for monitoring.
- Software monitors universally have the problem of distorting the operations of the system they are measuring, because a monitor software routine or instruction interrupts the program it is monitoring to thereby compete with the program being measured for hardware resources in the system. This distortion is unimportant to the diagnostic function of tracing. For this reason, monitoring is most accurately done by special hardware which is normally externally connected to a system, but may be built into a system such as by the invention disclosed in a European patent application No j841 070745. 1 entitled "Internally Distributed Monitoring System” filed on the same day as the subject application.
- tracing programs are currently available. However, the name, tracing program, covers diverse areas in the examination of computer programs. One tracing program may be strikingly different from ' another, and each may be useable for a different purpose. Some tracing programs only observe a particular type of situation, event, or kind of information. Many prior tracing programs are not user-directed and are not flexible; they can not be tailored to a particular computer installation or to a particular program execution.
- prior tracing programs operate at relatively slow rates; for example, it is common when storing all traced data for such prior programs to take, on the average, 100 times longer than their untraced execution time. Most prior tracing programs overlay their limited output areas which they may use for buffering to an output device, or they may have the results remain in main storage for analysis.
- Dual address space (DAS) tracing in S/370 is described on pages 4-11 through 4-15 in the IBM S/370 Principles of Operation, Form No. GA22-7000-8. It describes a tracing architecture that uses fixed length entries written into one trace table in main storage used by all CPUs in the system.
- the fixed length format limits tracing performance when more tracing data is needed to be collected than would fit in the fixed length format. Then the tracing needs to be supplemented by a tracing program to collect the additional data.
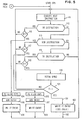
- FIGURE 7 illustrates the prior art S/370 tracing method, in which all CPU's 1 through N in an MP use the same system trace table. They all access the system trace table through an anchor word at absolute address 84 in main storage. Flag bit A in the anchor at this location indicates whether system tracing is enabled or not. If enabled, a trace-table header address in the anchor word is used to access a trace-table header in main storage, which contains the current trace address to be used, and also contains the boundaries of the system trace table in starting and ending address fields. Significant overhead occurs for each tracing entry made, in order to compare the updated current trace-entry address with the ending address and with the end of the 4KB page frame currently being used since another page frame must be allocated before the trace table can be continued beyond the current page frame.
- tracing for all CPU's 1 through N is enabled by bit A being set to 1. Then traceable instructions executed by all CPU's 1 through N write fixed-length trace entries into the single system trace table in the following manner:
- both steps 2 and 3 have a high probability of resulting in cache interference with another CPU.
- the resulting MP performance degradation may be very significant.
- step 3 although each CPU is storing its trace entry into a different 32-byte location, inter-CPU interference results if the cache-line size is more than 32 bytes wherein all or part of the required 32 byte entry is part of a line (e.g. 128 bytes) in another CPUs cache.
- the cache-line size is 128 bytes which spans across four trace table entries.
- variable-length entries permit each trace entry to include all available required
Abstract
Description
- The subject invention relates to a program tracing and monitoring method which can operate on any CPU of a multiprocessor (MP) without tracing interaction between CPUs in the MP concurrently doing program tracing.
- Tracing routines in software and microcode have been provided in the prior art for the purpose of tracing through a program to assist in locating errors or bugs therein. Software monitoring routines and instructions (e.g. S/370 monitor call instruction) also are in the prior art for the purpose of storing hardware and software states sensed during the execution of programs on a system, in order to enable analysis of the results to measure system performance and enable tuning of the resource configuration of the system.
- Tracing assists in the determination of system problems by providing a snapshot record in storage of certain types of states existing when a location in a program is reached.
- The instruction support for software monitoring has some similarity to tracing instruction support. However their functions are different, i.e. software diagnostics for tracing, and system performance measurement for monitoring. Software monitors universally have the problem of distorting the operations of the system they are measuring, because a monitor software routine or instruction interrupts the program it is monitoring to thereby compete with the program being measured for hardware resources in the system. This distortion is unimportant to the diagnostic function of tracing. For this reason, monitoring is most accurately done by special hardware which is normally externally connected to a system, but may be built into a system such as by the invention disclosed in a European patent application No j841 070745. 1 entitled "Internally Distributed Monitoring System" filed on the same day as the subject application.
- Many types of tracing programs are currently available. However, the name, tracing program, covers diverse areas in the examination of computer programs. One tracing program may be strikingly different from ' another, and each may be useable for a different purpose. Some tracing programs only observe a particular type of situation, event, or kind of information. Many prior tracing programs are not user-directed and are not flexible; they can not be tailored to a particular computer installation or to a particular program execution.
- Some prior tracing programs were limited in their tracing function to branch points only, interrupt points only, predetermined sequences of instructions, or other prespecified events.
- Some prior tracing programs operate at relatively slow rates; for example, it is common when storing all traced data for such prior programs to take, on the average, 100 times longer than their untraced execution time. Most prior tracing programs overlay their limited output areas which they may use for buffering to an output device, or they may have the results remain in main storage for analysis.
- A tracing program that totally controls all other programs on a computing system is disclosed and claimed in U.S.A. patent 3,707,724 to J. L. Dellheim entitled "Program Execution Tracing System Improvements".
- Dual address space (DAS) tracing in S/370 is described on pages 4-11 through 4-15 in the IBM S/370 Principles of Operation, Form No. GA22-7000-8. It describes a tracing architecture that uses fixed length entries written into one trace table in main storage used by all CPUs in the system.
- Also special purpose trace instructions have been used as assists to MVS/370 programs on S/370 systems. Each generates a fixed length trace entry of 32 bytes in the system trace table. These special purpose trace instructions are:
- TRACE SVC INTERRUPTION
- TRACE PROGRAM INTERRUPTION
- TRACE INITIAL SRB DISPATCH
- TRACE I/0 INTERRUPTION
- TRACE TASK DISPATCH
- TRACE SVC RETURN
- The fixed length format limits tracing performance when more tracing data is needed to be collected than would fit in the fixed length format. Then the tracing needs to be supplemented by a tracing program to collect the additional data.
- FIGURE 7 illustrates the prior art S/370 tracing method, in which all CPU's 1 through N in an MP use the same system trace table. They all access the system trace table through an anchor word at absolute address 84 in main storage. Flag bit A in the anchor at this location indicates whether system tracing is enabled or not. If enabled, a trace-table header address in the anchor word is used to access a trace-table header in main storage, which contains the current trace address to be used, and also contains the boundaries of the system trace table in starting and ending address fields. Significant overhead occurs for each tracing entry made, in order to compare the updated current trace-entry address with the ending address and with the end of the 4KB page frame currently being used since another page frame must be allocated before the trace table can be continued beyond the current page frame.
- In more detail for the prior S/370, tracing for all CPU's 1 through N is enabled by bit A being set to 1. Then traceable instructions executed by all CPU's 1 through N write fixed-length trace entries into the single system trace table in the following manner:
- 1. Any one or more of CPU's 1-N executing a traceable instruction will access location 84 to read the trace-table header address. This causes no contention among simultaneously requesting CPU's, because only read requests are made.
- 2. Each CPU which is permitted to access the trace table must change the current-entry address to the next entry value for the next CPU permitted to make a trace entry. In order to maintain the integrity of the trace table, only one CPU at a time is allowed to read the current-entry address and then change the current-entry address value. Thus, only one of simultaneously contending CPUs is permitted to access this one-word address at a time to perform an interlocked update on the current-entry address. This is usually done with a compare and swap (CS) instruction, which serializes all concurrently requesting CPUs. Each requesting CPU failing to gain access goes into a CS wait loop until it successfully executes its CS instruction, after which it reads and then changes the current-entry address. Also another type of very significant inter-CPU interference can exist when the successful CS read request occurs; and that is the requested current-entry address may be found only in a store-in cache of another CPU which last changed that address value. Then before the read request can be performed, the line containing that address must be castout of the other CPU's cache and line fetched into the requesting CPU cache, which may be done either through main storage or cache-to-cache if available in the MP.
- 3. After a CS successful CPU reads the current-entry address, it will be unique to that CPU because each next CPU to read the current-entry address will get a different address (incremented by the prior successful CPU). Hence there is no interlock contention among the tracing CPUs in accessing the trace table itself to record its trace data. However, there is significant inter- CPU cache contention among the CPUs, because their cache line sizes are much longer than the one-word current-entry address field.
- Hence, both
steps - For
step 3, although each CPU is storing its trace entry into a different 32-byte location, inter-CPU interference results if the cache-line size is more than 32 bytes wherein all or part of the required 32 byte entry is part of a line (e.g. 128 bytes) in another CPUs cache. For example in an IBM 3081 CPU, the cache-line size is 128 bytes which spans across four trace table entries. - Also, two fundamental architectural problems exist with the S/370 fixed-length trace entries, which are: (1) some entries cannot contain all of the available information required, and (2) some entries waste unused space. The variable-length entries provided by the subject invention permit each trace entry to include all available required
Claims (89)
Applications Claiming Priority (2)
| Application Number | Priority Date | Filing Date | Title |
|---|---|---|---|
| US06/509,129 US4598364A (en) | 1983-06-29 | 1983-06-29 | Efficient trace method adaptable to multiprocessors |
| US509129 | 1983-06-29 |
Publications (3)
| Publication Number | Publication Date |
|---|---|
| EP0130467A2 true EP0130467A2 (en) | 1985-01-09 |
| EP0130467A3 EP0130467A3 (en) | 1987-10-21 |
| EP0130467B1 EP0130467B1 (en) | 1990-09-05 |
Family
ID=24025398
Family Applications (1)
| Application Number | Title | Priority Date | Filing Date |
|---|---|---|---|
| EP84107039A Expired EP0130467B1 (en) | 1983-06-29 | 1984-06-20 | Efficient trace method adaptable to multiprocessors |
Country Status (4)
| Country | Link |
|---|---|
| US (1) | US4598364A (en) |
| EP (1) | EP0130467B1 (en) |
| JP (1) | JPH0697436B2 (en) |
| DE (1) | DE3483120D1 (en) |
Cited By (4)
| Publication number | Priority date | Publication date | Assignee | Title |
|---|---|---|---|---|
| DE3502387A1 (en) * | 1985-01-25 | 1986-07-31 | Klöckner-Moeller Elektrizitäts GmbH, 5300 Bonn | Method for monitoring microprocessor systems and stored-program controls |
| EP0396833A1 (en) * | 1989-05-12 | 1990-11-14 | International Business Machines Corporation | Trace facility for use in a multiprocessing environment |
| EP0455946A2 (en) * | 1990-05-07 | 1991-11-13 | International Business Machines Corporation | System for debugging shared memory multiprocessor computers |
| EP3056995A1 (en) * | 2013-09-30 | 2016-08-17 | Renesas Electronics Corporation | Computer and compiling method |
Families Citing this family (110)
| Publication number | Priority date | Publication date | Assignee | Title |
|---|---|---|---|---|
| JPH0776932B2 (en) * | 1984-12-07 | 1995-08-16 | 日本電気株式会社 | Data transmission method |
| US4764863A (en) * | 1985-05-09 | 1988-08-16 | The United States Of America As Represented By The Secretary Of Commerce | Hardware interpreter for finite state automata |
| US4937740A (en) * | 1985-09-18 | 1990-06-26 | Cadre Technologies, Inc. | Real time software analyzing system for storing selective m-bit addresses based upon correspondingly generated n-bit tags |
| JPS62243008A (en) * | 1986-04-15 | 1987-10-23 | Fanuc Ltd | Signal trace controlling system for pmc |
| JPH01125633A (en) * | 1987-11-11 | 1989-05-18 | Fujitsu Ltd | System for debugging multi-processing system |
| JP2678283B2 (en) * | 1988-03-15 | 1997-11-17 | 株式会社日立製作所 | Data communication controller |
| JPH01241636A (en) * | 1988-03-17 | 1989-09-26 | Internatl Business Mach Corp <Ibm> | Data processing system |
| JPH01297764A (en) * | 1988-05-25 | 1989-11-30 | Nec Corp | Processor |
| US5067073A (en) * | 1988-08-02 | 1991-11-19 | International Business Machines Corporation | Embedded tracing method for identifying program executed paths |
| US5121489A (en) * | 1988-08-02 | 1992-06-09 | International Business Machines Corporation | Tracing method for identifying program execution paths using a trace points bit map with one-to-one correspondence with embedded trace points |
| US5073968A (en) * | 1988-08-09 | 1991-12-17 | Hewlett-Packard Company | Method and apparatus for marking emulation analysis states |
| JPH02199548A (en) * | 1988-11-09 | 1990-08-07 | Asea Brown Boveri Ag | Observing method for development with the lapse of time of object program made by electronic computer system and observation instrument practicing said method |
| JPH02133834A (en) * | 1988-11-14 | 1990-05-23 | Nec Corp | In-circuit emulator |
| JPH02216545A (en) * | 1989-02-17 | 1990-08-29 | Nec Corp | Execution hysteresis storage device |
| JPH02271435A (en) * | 1989-04-13 | 1990-11-06 | Mitsubishi Electric Corp | Task tracing device |
| US5274811A (en) * | 1989-06-19 | 1993-12-28 | Digital Equipment Corporation | Method for quickly acquiring and using very long traces of mixed system and user memory references |
| US5124989A (en) * | 1990-01-08 | 1992-06-23 | Microsoft Corporation | Method of debugging a computer program |
| JPH03217949A (en) * | 1990-01-23 | 1991-09-25 | Hitachi Ltd | Computer system |
| JPH0820975B2 (en) * | 1990-03-29 | 1996-03-04 | インターナショナル・ビジネス・マシーンズ・コーポレイション | Computer system and tracing method performed on the computer |
| US5151981A (en) * | 1990-07-13 | 1992-09-29 | International Business Machines Corporation | Instruction sampling instrumentation |
| US5355469A (en) * | 1990-07-30 | 1994-10-11 | Delphi Data, A Division Of Sparks Industries, Inc. | Method for detecting program errors |
| US5305454A (en) * | 1991-08-12 | 1994-04-19 | International Business Machines Corporation | Notification of event handlers in broadcast or propagation mode by event management services in a computer system |
| US5355484A (en) * | 1991-08-12 | 1994-10-11 | International Business Machines Corporation | Dynamically established event monitors in event management services of a computer system |
| US5237684A (en) * | 1991-08-12 | 1993-08-17 | International Business Machines Corporation | Customized and versatile event monitor within event management services of a computer system |
| US5625821A (en) * | 1991-08-12 | 1997-04-29 | International Business Machines Corporation | Asynchronous or synchronous operation of event signaller by event management services in a computer system |
| US5319784A (en) * | 1991-12-18 | 1994-06-07 | International Business Machines Corp. | System for automatic and selective compile-time installation of fastpath into program for calculation of function/procedure without executing the function/procedure |
| US5491793A (en) * | 1992-07-31 | 1996-02-13 | Fujitsu Limited | Debug support in a processor chip |
| US5359608A (en) * | 1992-11-24 | 1994-10-25 | Amdahl Corporation | Apparatus for activation and deactivation of instruction tracing through use of conditional trace field in branch instructions |
| US5473754A (en) * | 1993-11-23 | 1995-12-05 | Rockwell International Corporation | Branch decision encoding scheme |
| JP3290280B2 (en) * | 1994-01-13 | 2002-06-10 | 株式会社東芝 | Information processing device |
| DE4407573C1 (en) * | 1994-03-07 | 1995-03-30 | Siemens Nixdorf Inf Syst | Data processing system having devices for recording control signals and/or addresses which become effective during program runs (executions) |
| US5446876A (en) * | 1994-04-15 | 1995-08-29 | International Business Machines Corporation | Hardware mechanism for instruction/data address tracing |
| US5642478A (en) * | 1994-12-29 | 1997-06-24 | International Business Machines Corporation | Distributed trace data acquisition system |
| US6052801A (en) * | 1995-05-10 | 2000-04-18 | Intel Corporation | Method and apparatus for providing breakpoints on a selectable address range |
| US5659679A (en) * | 1995-05-30 | 1997-08-19 | Intel Corporation | Method and apparatus for providing breakpoints on taken jumps and for providing software profiling in a computer system |
| US5740413A (en) * | 1995-06-19 | 1998-04-14 | Intel Corporation | Method and apparatus for providing address breakpoints, branch breakpoints, and single stepping |
| US5621886A (en) * | 1995-06-19 | 1997-04-15 | Intel Corporation | Method and apparatus for providing efficient software debugging |
| US5875294A (en) * | 1995-06-30 | 1999-02-23 | International Business Machines Corporation | Method and system for halting processor execution in response to an enumerated occurrence of a selected combination of internal states |
| US5805862A (en) * | 1995-11-16 | 1998-09-08 | Motorola, Inc. | Method of forming an integrated circuit |
| US5758061A (en) * | 1995-12-15 | 1998-05-26 | Plum; Thomas S. | Computer software testing method and apparatus |
| JPH1078889A (en) * | 1996-09-04 | 1998-03-24 | Mitsubishi Electric Corp | Microcomputer |
| US5862371A (en) * | 1996-11-25 | 1999-01-19 | International Business Machines Corporation | Method and system for instruction trace reconstruction utilizing performance monitor outputs and bus monitoring |
| US6148381A (en) * | 1997-04-08 | 2000-11-14 | Advanced Micro Devices, Inc. | Single-port trace buffer architecture with overflow reduction |
| US6189140B1 (en) | 1997-04-08 | 2001-02-13 | Advanced Micro Devices, Inc. | Debug interface including logic generating handshake signals between a processor, an input/output port, and a trace logic |
| US6009270A (en) * | 1997-04-08 | 1999-12-28 | Advanced Micro Devices, Inc. | Trace synchronization in a processor |
| US6154856A (en) * | 1997-04-08 | 2000-11-28 | Advanced Micro Devices, Inc. | Debug interface including state machines for timing synchronization and communication |
| US6142683A (en) * | 1997-04-08 | 2000-11-07 | Advanced Micro Devices, Inc. | Debug interface including data steering between a processor, an input/output port, and a trace logic |
| US6314530B1 (en) | 1997-04-08 | 2001-11-06 | Advanced Micro Devices, Inc. | Processor having a trace access instruction to access on-chip trace memory |
| US6094729A (en) * | 1997-04-08 | 2000-07-25 | Advanced Micro Devices, Inc. | Debug interface including a compact trace record storage |
| US5933626A (en) * | 1997-06-12 | 1999-08-03 | Advanced Micro Devices, Inc. | Apparatus and method for tracing microprocessor instructions |
| US6282701B1 (en) | 1997-07-31 | 2001-08-28 | Mutek Solutions, Ltd. | System and method for monitoring and analyzing the execution of computer programs |
| US6175914B1 (en) | 1997-12-17 | 2001-01-16 | Advanced Micro Devices, Inc. | Processor including a combined parallel debug and trace port and a serial port |
| JP3872196B2 (en) * | 1998-01-09 | 2007-01-24 | 株式会社ルネサステクノロジ | Microcomputer |
| US6021271A (en) * | 1998-01-15 | 2000-02-01 | Motorola, Inc. | Methods of simulating an electronic circuit design |
| US6145100A (en) * | 1998-03-04 | 2000-11-07 | Advanced Micro Devices, Inc. | Debug interface including timing synchronization logic |
| US6145122A (en) * | 1998-04-27 | 2000-11-07 | Motorola, Inc. | Development interface for a data processor |
| US6125444A (en) * | 1998-04-30 | 2000-09-26 | International Business Machines Corporation | Millimode capable computer system providing global branch history table disables and separate millicode disables which enable millicode disable to be turned off for some sections of code execution but not disabled for all |
| US6145123A (en) * | 1998-07-01 | 2000-11-07 | Advanced Micro Devices, Inc. | Trace on/off with breakpoint register |
| US6223338B1 (en) * | 1998-09-30 | 2001-04-24 | International Business Machines Corporation | Method and system for software instruction level tracing in a data processing system |
| US6253338B1 (en) * | 1998-12-21 | 2001-06-26 | International Business Machines Corporation | System for tracing hardware counters utilizing programmed performance monitor to generate trace interrupt after each branch instruction or at the end of each code basic block |
| US6260082B1 (en) * | 1998-12-23 | 2001-07-10 | Bops, Inc. | Methods and apparatus for providing data transfer control |
| GB2348718A (en) | 1999-04-07 | 2000-10-11 | Ibm | Data processing system having a centralised trace facility with dynamic tracing |
| US6539500B1 (en) * | 1999-10-28 | 2003-03-25 | International Business Machines Corporation | System and method for tracing |
| US7058928B2 (en) | 1999-12-23 | 2006-06-06 | Identify Software Ltd. | System and method for conditional tracing of computer programs |
| US20020087949A1 (en) * | 2000-03-03 | 2002-07-04 | Valery Golender | System and method for software diagnostics using a combination of visual and dynamic tracing |
| US8312435B2 (en) * | 2000-12-26 | 2012-11-13 | Identify Software Ltd. (IL) | System and method for conditional tracing of computer programs |
| US6795836B2 (en) * | 2000-12-29 | 2004-09-21 | International Business Machines Corporation | Accurately determining an object's lifetime |
| US20030135718A1 (en) * | 2002-01-14 | 2003-07-17 | International Business Machines Corporation | Method and system using hardware assistance for instruction tracing by revealing executed opcode or instruction |
| US7313734B2 (en) * | 2002-01-14 | 2007-12-25 | International Business Machines Corporation | Method and system for instruction tracing with enhanced interrupt avoidance |
| US20040003160A1 (en) * | 2002-06-28 | 2004-01-01 | Lee John P. | Method and apparatus for provision, access and control of an event log for a plurality of internal modules of a chipset |
| US7386839B1 (en) | 2002-11-06 | 2008-06-10 | Valery Golender | System and method for troubleshooting software configuration problems using application tracing |
| US8032866B1 (en) | 2003-03-27 | 2011-10-04 | Identify Software Ltd. | System and method for troubleshooting runtime software problems using application learning |
| US7395527B2 (en) | 2003-09-30 | 2008-07-01 | International Business Machines Corporation | Method and apparatus for counting instruction execution and data accesses |
| US8381037B2 (en) | 2003-10-09 | 2013-02-19 | International Business Machines Corporation | Method and system for autonomic execution path selection in an application |
| US7458078B2 (en) * | 2003-11-06 | 2008-11-25 | International Business Machines Corporation | Apparatus and method for autonomic hardware assisted thread stack tracking |
| US7895382B2 (en) | 2004-01-14 | 2011-02-22 | International Business Machines Corporation | Method and apparatus for qualifying collection of performance monitoring events by types of interrupt when interrupt occurs |
| US7415705B2 (en) | 2004-01-14 | 2008-08-19 | International Business Machines Corporation | Autonomic method and apparatus for hardware assist for patching code |
| US7434108B2 (en) * | 2004-04-30 | 2008-10-07 | Freescale Semiconductor, Inc. | Masking within a data processing system having applicability for a development interface |
| GB0412104D0 (en) * | 2004-05-29 | 2004-06-30 | Ibm | Apparatus method and program for recording diagnostic trace information |
| US7827539B1 (en) | 2004-06-25 | 2010-11-02 | Identify Software Ltd. | System and method for automated tuning of program execution tracing |
| US7464874B2 (en) * | 2005-02-24 | 2008-12-16 | Robert William Donner | Method and system for transparent and secure vote tabulation |
| US7188052B2 (en) * | 2005-04-12 | 2007-03-06 | International Business Machines Corporation | Using highly skewed clocks for application based tracing and application based normalization of processor clocks in an SMP environment |
| US7725894B2 (en) * | 2006-09-15 | 2010-05-25 | International Business Machines Corporation | Enhanced un-privileged computer instruction to store a facility list |
| US20080071502A1 (en) * | 2006-09-15 | 2008-03-20 | International Business Machines Corporation | Method and system of recording time of day clock |
| US7962803B2 (en) * | 2008-09-30 | 2011-06-14 | International Business Machines Corporation | Apparatus, system, and method for multi-address space tracing |
| US8234524B1 (en) * | 2009-09-28 | 2012-07-31 | Dale Trenton Smith | Protocol analysis with event present flags |
| US20110231820A1 (en) * | 2010-03-19 | 2011-09-22 | Aricent Inc. | Exclusive logging |
| US8762952B2 (en) | 2010-12-14 | 2014-06-24 | Bmc Software, Inc. | Recording method calls that led to an unforeseen problem |
| US8745598B2 (en) | 2010-12-14 | 2014-06-03 | Bmc Software, Inc. | Running injected code prior to execution of an application |
| US8793538B2 (en) * | 2012-01-30 | 2014-07-29 | Hewlett-Packard Development Company, L.P. | System error response |
| US10108528B2 (en) | 2016-08-26 | 2018-10-23 | Microsoft Technology Licensing, Llc | High-performance processor instruction tracing |
| US10042737B2 (en) | 2016-08-31 | 2018-08-07 | Microsoft Technology Licensing, Llc | Program tracing for time travel debugging and analysis |
| US10031833B2 (en) | 2016-08-31 | 2018-07-24 | Microsoft Technology Licensing, Llc | Cache-based tracing for time travel debugging and analysis |
| US10031834B2 (en) | 2016-08-31 | 2018-07-24 | Microsoft Technology Licensing, Llc | Cache-based tracing for time travel debugging and analysis |
| US10324851B2 (en) | 2016-10-20 | 2019-06-18 | Microsoft Technology Licensing, Llc | Facilitating recording a trace file of code execution using way-locking in a set-associative processor cache |
| US10489273B2 (en) | 2016-10-20 | 2019-11-26 | Microsoft Technology Licensing, Llc | Reuse of a related thread's cache while recording a trace file of code execution |
| US10310977B2 (en) | 2016-10-20 | 2019-06-04 | Microsoft Technology Licensing, Llc | Facilitating recording a trace file of code execution using a processor cache |
| US10310963B2 (en) | 2016-10-20 | 2019-06-04 | Microsoft Technology Licensing, Llc | Facilitating recording a trace file of code execution using index bits in a processor cache |
| US10540250B2 (en) | 2016-11-11 | 2020-01-21 | Microsoft Technology Licensing, Llc | Reducing storage requirements for storing memory addresses and values |
| US10365987B2 (en) | 2017-03-29 | 2019-07-30 | Google Llc | Synchronous hardware event collection |
| US9875167B1 (en) * | 2017-03-29 | 2018-01-23 | Google Inc. | Distributed hardware tracing |
| US10318332B2 (en) | 2017-04-01 | 2019-06-11 | Microsoft Technology Licensing, Llc | Virtual machine execution tracing |
| US10296442B2 (en) | 2017-06-29 | 2019-05-21 | Microsoft Technology Licensing, Llc | Distributed time-travel trace recording and replay |
| CN107516052B (en) * | 2017-08-14 | 2020-11-13 | 海光信息技术有限公司 | Memory access isolation method |
| US10459824B2 (en) | 2017-09-18 | 2019-10-29 | Microsoft Technology Licensing, Llc | Cache-based trace recording using cache coherence protocol data |
| US10558572B2 (en) | 2018-01-16 | 2020-02-11 | Microsoft Technology Licensing, Llc | Decoupling trace data streams using cache coherence protocol data |
| US11907091B2 (en) | 2018-02-16 | 2024-02-20 | Microsoft Technology Licensing, Llc | Trace recording by logging influxes to an upper-layer shared cache, plus cache coherence protocol transitions among lower-layer caches |
| US10496537B2 (en) | 2018-02-23 | 2019-12-03 | Microsoft Technology Licensing, Llc | Trace recording by logging influxes to a lower-layer cache based on entries in an upper-layer cache |
| US10642737B2 (en) | 2018-02-23 | 2020-05-05 | Microsoft Technology Licensing, Llc | Logging cache influxes by request to a higher-level cache |
| US10579505B1 (en) | 2018-09-11 | 2020-03-03 | International Business Machines Corporation | Capturing task traces for multiple tasks |
Citations (2)
| Publication number | Priority date | Publication date | Assignee | Title |
|---|---|---|---|---|
| US3659272A (en) * | 1970-05-13 | 1972-04-25 | Burroughs Corp | Digital computer with a program-trace facility |
| US4462077A (en) * | 1982-06-24 | 1984-07-24 | Bell Telephone Laboratories, Incorporated | Trace facility for use in multiprocessing environment |
Family Cites Families (5)
| Publication number | Priority date | Publication date | Assignee | Title |
|---|---|---|---|---|
| JPS5160127A (en) * | 1974-11-22 | 1976-05-25 | Hitachi Ltd | |
| US4205370A (en) * | 1975-04-16 | 1980-05-27 | Honeywell Information Systems Inc. | Trace method and apparatus for use in a data processing system |
| JPS5946023B2 (en) * | 1978-01-06 | 1984-11-09 | 日本電気株式会社 | Microprogram tracing device |
| US4268904A (en) * | 1978-02-15 | 1981-05-19 | Tokyo Shibaura Electric Co., Ltd. | Interruption control method for multiprocessor system |
| US4435759A (en) * | 1981-06-15 | 1984-03-06 | International Business Machines Corporation | Hardware monitor for obtaining processor software/hardware interrelationships |
-
1983
- 1983-06-29 US US06/509,129 patent/US4598364A/en not_active Expired - Lifetime
-
1984
- 1984-05-15 JP JP59095790A patent/JPH0697436B2/en not_active Expired - Lifetime
- 1984-06-20 EP EP84107039A patent/EP0130467B1/en not_active Expired
- 1984-06-20 DE DE8484107039T patent/DE3483120D1/en not_active Expired - Fee Related
Patent Citations (2)
| Publication number | Priority date | Publication date | Assignee | Title |
|---|---|---|---|---|
| US3659272A (en) * | 1970-05-13 | 1972-04-25 | Burroughs Corp | Digital computer with a program-trace facility |
| US4462077A (en) * | 1982-06-24 | 1984-07-24 | Bell Telephone Laboratories, Incorporated | Trace facility for use in multiprocessing environment |
Non-Patent Citations (3)
| Title |
|---|
| EUROMICRO SYMPOSIUM ON MICROPROCESSING AND MICROPROGRAMMING: MICROPROCESSORS SYSTEMS, 16th-18th September 1980, pages 149-156, North Holland Publishing Co., Amsterdam, NL; G. CONTE et al.: "Software development and debug aids for the mu * multimicroprocessor system" * |
| IEE PROCEEDINGS SECTION A a I, vol. 130, no. 1, part E, January 1983, pages 25-31, Old Woking, Surrey, GB; F. HALSALL et al.: "Development environment for the design and test of applications software for a distributed multiprocessor computer system" * |
| SOFTWARE & MICROSYSTEMS, vol. 1, no. 2, February 1982, pages 41-47, Camberley, Surrey, GB; P.C. BIRKIMSHER: "EMU: a multiprocessor software debugging tool" * |
Cited By (7)
| Publication number | Priority date | Publication date | Assignee | Title |
|---|---|---|---|---|
| DE3502387A1 (en) * | 1985-01-25 | 1986-07-31 | Klöckner-Moeller Elektrizitäts GmbH, 5300 Bonn | Method for monitoring microprocessor systems and stored-program controls |
| EP0396833A1 (en) * | 1989-05-12 | 1990-11-14 | International Business Machines Corporation | Trace facility for use in a multiprocessing environment |
| US5347649A (en) * | 1989-05-12 | 1994-09-13 | International Business Machines Corp. | System for dynamically generating, correlating and reading multiprocessing trace data in a shared memory |
| EP0455946A2 (en) * | 1990-05-07 | 1991-11-13 | International Business Machines Corporation | System for debugging shared memory multiprocessor computers |
| EP0455946A3 (en) * | 1990-05-07 | 1992-10-28 | International Business Machines Corporation | System for debugging shared memory multiprocessor computers |
| EP3056995A1 (en) * | 2013-09-30 | 2016-08-17 | Renesas Electronics Corporation | Computer and compiling method |
| US10402305B2 (en) | 2013-09-30 | 2019-09-03 | Renesas Electronics Corporation | Computer and compiling method |
Also Published As
| Publication number | Publication date |
|---|---|
| EP0130467A3 (en) | 1987-10-21 |
| JPH0697436B2 (en) | 1994-11-30 |
| EP0130467B1 (en) | 1990-09-05 |
| JPS6010354A (en) | 1985-01-19 |
| DE3483120D1 (en) | 1990-10-11 |
| US4598364A (en) | 1986-07-01 |
Similar Documents
| Publication | Publication Date | Title |
|---|---|---|
| US4598364A (en) | Efficient trace method adaptable to multiprocessors | |
| US5375216A (en) | Apparatus and method for optimizing performance of a cache memory in a data processing system | |
| US7926041B2 (en) | Autonomic test case feedback using hardware assistance for code coverage | |
| US6961925B2 (en) | Parallelism performance analysis based on execution trace information | |
| US5317717A (en) | Apparatus and method for main memory unit protection using access and fault logic signals | |
| US4975836A (en) | Virtual computer system | |
| US7299319B2 (en) | Method and apparatus for providing hardware assistance for code coverage | |
| US5864692A (en) | Method and apparatus for protecting memory-mapped devices from side effects of speculative instructions | |
| US7620777B2 (en) | Method and apparatus for prefetching data from a data structure | |
| US7421684B2 (en) | Method and apparatus for autonomic test case feedback using hardware assistance for data coverage | |
| RU2769785C1 (en) | Cache-based trace playback breakpoints using tag field reserved bits | |
| JP2015515654A (en) | Converting program event recording events to runtime instrumentation events | |
| JPS5911943B2 (en) | Trap mechanism for data processing equipment | |
| US7296130B2 (en) | Method and apparatus for providing hardware assistance for data access coverage on dynamically allocated data | |
| US20050210199A1 (en) | Method and apparatus for hardware assistance for prefetching data | |
| US20060149940A1 (en) | Implementation to save and restore processor registers on a context switch | |
| EP0297891B1 (en) | Apparatus and method for main memory unit protection using access and fault logic signals | |
| US20050210450A1 (en) | Method and appartus for hardware assistance for data access coverage | |
| CA1302582C (en) | Apparatus and method for control of asynchronous program interrupt events in a data processing system | |
| EP0156307A2 (en) | Pipelined processor having dual cache memories | |
| US5813039A (en) | Guest execution control system, method and computer process for a virtual machine system | |
| US5117491A (en) | Ring reduction logic using parallel determination of ring numbers in a plurality of functional units and forced ring numbers by instruction decoding | |
| JPH04143845A (en) | Page fault test system for computer | |
| JPS61290540A (en) | Information processor | |
| JPS613251A (en) | Program debugging mechanism of processor |
Legal Events
| Date | Code | Title | Description |
|---|---|---|---|
| PUAI | Public reference made under article 153(3) epc to a published international application that has entered the european phase |
Free format text: ORIGINAL CODE: 0009012 |
|
| AK | Designated contracting states |
Designated state(s): DE FR GB |
|
| 17P | Request for examination filed |
Effective date: 19841123 |
|
| PUAL | Search report despatched |
Free format text: ORIGINAL CODE: 0009013 |
|
| AK | Designated contracting states |
Kind code of ref document: A3 Designated state(s): DE FR GB |
|
| 17Q | First examination report despatched |
Effective date: 19890825 |
|
| GRAA | (expected) grant |
Free format text: ORIGINAL CODE: 0009210 |
|
| AK | Designated contracting states |
Kind code of ref document: B1 Designated state(s): DE FR GB |
|
| REF | Corresponds to: |
Ref document number: 3483120 Country of ref document: DE Date of ref document: 19901011 |
|
| ET | Fr: translation filed | ||
| PLBE | No opposition filed within time limit |
Free format text: ORIGINAL CODE: 0009261 |
|
| STAA | Information on the status of an ep patent application or granted ep patent |
Free format text: STATUS: NO OPPOSITION FILED WITHIN TIME LIMIT |
|
| 26N | No opposition filed | ||
| K2C2 | Correction of patent specification (partial reprint) published |
Effective date: 19900905 |
|
| PGFP | Annual fee paid to national office [announced via postgrant information from national office to epo] |
Ref country code: FR Payment date: 19950606 Year of fee payment: 12 |
|
| PGFP | Annual fee paid to national office [announced via postgrant information from national office to epo] |
Ref country code: DE Payment date: 19950616 Year of fee payment: 12 |
|
| PGFP | Annual fee paid to national office [announced via postgrant information from national office to epo] |
Ref country code: GB Payment date: 19960520 Year of fee payment: 13 |
|
| PG25 | Lapsed in a contracting state [announced via postgrant information from national office to epo] |
Ref country code: FR Effective date: 19970228 |
|
| PG25 | Lapsed in a contracting state [announced via postgrant information from national office to epo] |
Ref country code: DE Effective date: 19970301 |
|
| REG | Reference to a national code |
Ref country code: FR Ref legal event code: ST |
|
| PG25 | Lapsed in a contracting state [announced via postgrant information from national office to epo] |
Ref country code: GB Free format text: LAPSE BECAUSE OF NON-PAYMENT OF DUE FEES Effective date: 19970620 |
|
| GBPC | Gb: european patent ceased through non-payment of renewal fee |
Effective date: 19970620 |