EP0298122A1 - Liver function inspection apparatus - Google Patents
Liver function inspection apparatus Download PDFInfo
- Publication number
- EP0298122A1 EP0298122A1 EP87907339A EP87907339A EP0298122A1 EP 0298122 A1 EP0298122 A1 EP 0298122A1 EP 87907339 A EP87907339 A EP 87907339A EP 87907339 A EP87907339 A EP 87907339A EP 0298122 A1 EP0298122 A1 EP 0298122A1
- Authority
- EP
- European Patent Office
- Prior art keywords
- specific dye
- liver function
- light
- basis
- accordance
- Prior art date
- Legal status (The legal status is an assumption and is not a legal conclusion. Google has not performed a legal analysis and makes no representation as to the accuracy of the status listed.)
- Granted
Links
Images


Classifications
-
- A—HUMAN NECESSITIES
- A61—MEDICAL OR VETERINARY SCIENCE; HYGIENE
- A61B—DIAGNOSIS; SURGERY; IDENTIFICATION
- A61B5/00—Measuring for diagnostic purposes; Identification of persons
-
- A—HUMAN NECESSITIES
- A61—MEDICAL OR VETERINARY SCIENCE; HYGIENE
- A61B—DIAGNOSIS; SURGERY; IDENTIFICATION
- A61B5/00—Measuring for diagnostic purposes; Identification of persons
- A61B5/0059—Measuring for diagnostic purposes; Identification of persons using light, e.g. diagnosis by transillumination, diascopy, fluorescence
-
- A—HUMAN NECESSITIES
- A61—MEDICAL OR VETERINARY SCIENCE; HYGIENE
- A61B—DIAGNOSIS; SURGERY; IDENTIFICATION
- A61B5/00—Measuring for diagnostic purposes; Identification of persons
- A61B5/42—Detecting, measuring or recording for evaluating the gastrointestinal, the endocrine or the exocrine systems
- A61B5/4222—Evaluating particular parts, e.g. particular organs
- A61B5/4244—Evaluating particular parts, e.g. particular organs liver
-
- G—PHYSICS
- G06—COMPUTING; CALCULATING OR COUNTING
- G06T—IMAGE DATA PROCESSING OR GENERATION, IN GENERAL
- G06T5/00—Image enhancement or restoration
- G06T5/50—Image enhancement or restoration by the use of more than one image, e.g. averaging, subtraction
Landscapes
- Health & Medical Sciences (AREA)
- Life Sciences & Earth Sciences (AREA)
- Physics & Mathematics (AREA)
- Engineering & Computer Science (AREA)
- Medical Informatics (AREA)
- Animal Behavior & Ethology (AREA)
- Biophysics (AREA)
- Pathology (AREA)
- Biomedical Technology (AREA)
- Heart & Thoracic Surgery (AREA)
- Veterinary Medicine (AREA)
- Molecular Biology (AREA)
- Surgery (AREA)
- Public Health (AREA)
- General Health & Medical Sciences (AREA)
- Gastroenterology & Hepatology (AREA)
- Theoretical Computer Science (AREA)
- General Physics & Mathematics (AREA)
- Endocrinology (AREA)
- Physiology (AREA)
- Measurement Of The Respiration, Hearing Ability, Form, And Blood Characteristics Of Living Organisms (AREA)
- Investigating Or Analysing Biological Materials (AREA)
Abstract
Description
- The present invention relates to a liver function testing apparatus. More specifically, it relates to a liver function testing apparatus for automatically performing measurement for testing/diagnosing liver function by injecting specific color dye, which is selectively taken in and removed by only the liver, into blood and measuring a blood plasma disappearance rate and a retention rate thereof.
- In general, the blood plasma disappearance rate and the retention rate have been measured by a method of blood collection through use of indocyanine green (hereinafter referred to as ICG) serving as specific dye. According to this method, intravenous injection of ICG is given to a testee to perform blood collection three times after lapses of five, ten and 15 minutes from the injection, and blood serum is separated upon coagulation of a blood clot so that absorbance at a wavelength of 805 nm is measured through a spectrophotometer to obtain ICG concentration values in the blood serum after the lapses of five, ten and 15 minutes from a previously obtained calibration curve (corresponding ICG concentration in blood vs. absorbance), thereby to calculate the blood plasma disappearance rate and the retention rate. In recent years, widely employed is a method of changing the quantity of ICG injection to measure the blood plasma disappearance rate several times thereby to obtain index expressing an amount of hepatic cell function RMAX (removed maximal).
- Japanese Patent Publication Gazette No. 58649/1985 has already proposed a method of measuring the blood plasma disappearance rate and the retention rate without performing blood collection. According to this method, light is applied through the body surface of an organism, which in turn transmits light of a wavelength having high ICG absorption sensitivity and light of a wavelength having substantially no ICG absorption sensitivity. The respective quantities of transmitted light are measured to obtain the blood plasma disappearance rate and the retention rate from time change (dye disappearance curve) of the light quantities.
- In the aforementioned first method of blood collection, it is necessary to correctly measure the blood collection time after injection. However, the time has not been accurately measured in an actual test, and the operation for such measurement has been complicated. Further, the testee has been subjected to heavy mental and physical burdens by blood collection. In addition, the index RMAX measuring method of measuring the blood plasma disappearance rate several times by changing the quantity of ICG injection requires blood collection over ten times, whereby the burdens on the testee are further increased.
- According to the second measuring method without blood collection as disclosed in Japanese Patent Publication No. 58649/1985, the output of a sensor actually attached to an organism is fluctuated by influence such as blood flow disturbance caused by . suppression on a blood vessel, vibration of the organism, being the object of measurement, pulsation in the organism, change of blood volume in the vital tissue (the blood volume in each part in the vital tissue is changed by merely vertically moving an arm) etc., whereby a correct dye disappearance curve cannot be obtained. Consequently, the blood plasma disappearance rate and the retention rate obtained by the curve cannot be recognized as being correct.
- Accordingly, a principal object of the present invention is to provide a liver function testing apparatus which can remove artifacts such as blood flow disturbance, vibration of an organism, pulsation in the organism and change of the blood volume in the vital tissue, to enable correct measurement.
- The present invention provides a liver function testing apparatus for testing liver function, which comprises light source means for exposing vital tissue to first light of a wavelength absorbed by specific dye which is dosed into blood of the vital tissue to be taken in and removed by the liver and second light of a wavelength not absorbed by the dye, photoelectric conversion means for outputting first and second photoelectric conversion signals corresponding to the first light and the second light applied to the vital tissue from the light source means and obtained from the vital tissue, sampling means for sampling the photoelectric conversion signals, decision means for deciding the coefficient of a linear regression expression between the first and second photoelectric conversion signals on the basis of variable components in the blood included in the sampled first and second photoelectric conversion signals and arithmetic means for operating a value correlated with specific dye concentration in the blood on the basis of a sampling signal during a prescribed period after a lapse of a predetermined time from injection of the specific dye and the decided coefficient of the regression line expression.
- In a preferred embodiment of such a liver function testing apparatus, a coefficient of a simulation function serving as a function of.time is obtained by using the method of least squares on the basis of the operated value correlated with the specific dye concentration.
- In a more preferred embodiment of the present invention, a blood plasma disappearance rate of the specific dye is found on the basis of the obtained coefficient of the simulation function.
- In a further preferred embodiment of the present invention, a retention rate of the specific dye in a prescribed period is found on the basis of the obtained coefficient of the simulation function.
- In a further embodiment of the present invention, index expressing an amount of hepatic cell function RMAX is found on the basis of the obtained coefficient of the simulation function.
- Thus, according to the present invention, first light of a wavelength absorbed by specific dye dosed into blood of vital tissue to be taken in and removed from the liver and second light of a wavelength not absorbed by the dye are applied to the vital tissue and first and second photoelectric conversion signals corresponding to the first light and the second light obtained from the vital tissue are sampled so that a coefficient of a regression line expression between the first and second photoelectric conversion signals is determined on the basis of variable components in the blood included in the sampled first and second photoelectric conversion signals to perform biocalibration, in order to operate a value correlated with specific dye concentration in the blood on the basis of a sampling signal during a prescribed period after a lapse of a predetermined time from injection of the specific dye and the decided coefficient of the regression line expression. Thus, artifacts such as blood flow disturbance, vibration and pulsation of an organism etc. in attachment of a sensor to an organism can be removed by biocalibration, to operate the value correlated with the specific dye concentration. Thus, correct time management of a disappearance curve of the specific dye is enabled, to obtain correct data. Further, the blood plasma disappearance rate, the retention rate, an index expressing the total amount of hepatic cell function etc. can be more correctly expressed not from several samples by the conventional blood correction method but from a larger number of data of the disappearance curve, thereby to improve reliability of the data.
- These and other objects; features, aspects and advantages of the present invention will become more apparent from the following detailed description of the present invention will become more apparent from the following detailed description of the present invention when taken in conjunction with the accompanying drawings.
-
- Figs. 1 to 4 are diagrams for illustrating the principle of the present invention;
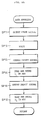
- Fig. 5 is a schematic block diagram showing the structure of an embodiment of the present invention;
- Fig. 6 illustrates timing for detecting quantities of light of wavelengths λ1 and À2 after passage through a prescribed optical path in a measured object;
- Fig. 7 illustrates data stored in a RAM as shown in Fig. 1;
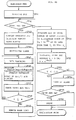
- Figs. 8A to 8D are flow charts for concretely illustrating the operation of the embodiment, in which Fig. 8A shows a data sampling subroutine, Fig. 8B shows a biocalibration mode, Fig. 8C shows an initialization mode and Fig. 8D shows a measurement mode;
- Figs. 9 to 12 are illustrative of exemplary displays on a display part as shown in Fig. 5;
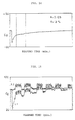
- Fig. 13 shows an example of a disappearance curve of specific dye measured by the present invention;
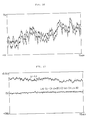
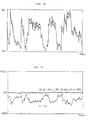
- Figs. 14 and 15 illustrate result of light quantity data L1 and L2, a disappearance curve, a blood plasma disappearance rate and 15-minute retention rate measured through the present invention;
- Figs. 16 to 19 are diagrams for illustrating effects by the present invention;
- Fig. 20 illustrates data stored in a RAM employed in another embodiment of the present invention;
- Figs. 21A and 21B are flow charts for illustrating operation of a measurement mode in another embodiment of the present invention; and
- Figs. 22 to 24 are diagrams for illustrating operation of another embodiment of the present invention.
- Before explaining embodiments of the present invention, description is now made on the principle of biocalibration employed in the present invention.
- Figs. 1 to 4 are diagrams for illustrating the principle of the biocalibration in the present invention.
- It is assumed that symbols I1 and 12 indicate quantities of light having a wavelength λ1 which is largely absorbed by specific dye and light of a wavelength λ2 which is not absorbed by the specific dye incident upon vital tissue, and symbols L1 and L2 indicate light quantities after passage through a prescribed optical path in the vital tissue. Relations between the incident light quantities I1 and I2 and the passing light quantities L1 and L2 in injection of the specific dye are as follows:


- Respective coefficients and variables are shown in Fig. 1. Symbols f1 and f2 represent functions which are determined by characteristics of blood at the wavelengths λ1 and λ2.
- On the other hand, relations between the incident light quantities I1 and I2 and the passing light quantities L1 and L2 before injection of the specific dye are as follows:


- The relation between the passing light quantities L1 and L2 previous to actual injection of the specific dye is measured as shown Fig. 2, to be in the linear relation as shown in Fig. 3. This is the data in case of attaching a sensor to an organism and fluctuating the blood volume in the organism. It has been confirmed that such linearity has reproducibility, with no individual difference.
- Then, the expressions (3) and (4) would appear as follows:


- A function C obtained by multiplying concentration of the specific dye by the blood volume in the sample and the absorption coefficient of the specific dye by using the expressions (1) and (2) after injection of the specific dye can be expressed as follows:

- The function C is found by the expression (7) as follows:

- Through the expression (6), we have:

- Hence, it is understood that a signal of the function C can be obtained by using Fig. 3 as a biocalibration curve.
- As to the function C, however, although the coefficient kg is constant, it can be considered that the blood volume Vb in each part' is changed from time to time, and hence, if the blood volume Vb in a prescribed sample created by the sensor once attached is changed, the amount of the specific dye is also changed in proportion thereto although the dye concentration remains unchanged. This is typically shown in Fig. 4.
- Referring to Fig. 4, it is assumed that DE represents the value of the function C after a lapse of t1 minutes. The blood contained in the prescribed sample obtained after a lapse of t1 + Δt minutes is changed in volume, whereby an observation point is changed from E to E'. Assuming that At is sufficiently less than one minute, the specific dye concentration in the blood after the lapse of tI minutes may be considered identical to that after the lapse of t1 + Δt minutes. However, as to the function C, the change is from C = DE to C' = D'E'. C ≠ C', and hence some correction must be performed. Hence, by normalizing DE and D'E' at the point L10, apparent fluctuation of the dye concentration due to the fluctuation of the blood volume can be corrected. When the specific dye is injected, a signal of only logLl is fluctuated, to lie to a point E, for example. At this time, DE becomes the function C as shown in the expression (9). The blood volume Vb in the expression (9) can be interpreted as being denoted by CD, and hence, normalizing the Y coordinate of a point A as L10, the same is expressed as follows:

- Hence, a signal Cg corresponding to the specific dye concentration can be found by the expressions (7) and (10) as follows:

- Using the method of least squares, the function Cg of a simulation curve in time change of the aforementioned result Cg of calculation is expressed as follows:

- The constants A and B are found by the above expression (12). The blood plasma disappearance rate k and the T-minute retention rate R % are expressed as follows:


- While the biocalibration employed in the present invention has been described in the above, description is now made on an embodiment of the present invention employing the aforementioned biocalibration.
- Fig. 5 is a schematic block diagram showing an embodiment of the present invention, Fig. 6 is a timing chart for detecting quantities of light of wavelengths λ1 and λ2 after passage through a prescribed optical in a measured object, and Fig. 7 illustrates data stored in a RAM as shown in Fig. 5.
- Referring to Fig. 5, a liver function testing apparatus is formed by a
sensor part 10 and ameasurement processing part 20. Thesensor part 10 includes afirst light source 11, a secondlight source 12, alight receiving element 13 and apreamplifier 14. Thefirst light source 11 and the secondlight source 12 generate optical pulses of a wavelength λ1 having large absorbance to specific dye and optical pulses of a wavelength i12 having no absorbance, respectively. Thelight receiving element 13 receives light applied tovital tissue 15 from thelight sources light sources measurement processing part 20 to alternately emit light by pulse operation, respectively. - The
measurement processing part 20 includes aCPU 34 which operates as arithmetic means. The CPU 34.supplies a start signal to anoscillation circuit 24 and atiming circuit 23 through an I/O port 32. Theoscillation circuit 24 regularly oscillates to produce a prescribed clock signal. This clock signal and the aforementioned start signal are utilized to supply constant currents il and i2 to thefirst light source 11 and the secondlight source 12 from a constantcurrent circuit 21 through thetiming circuit 23 and adecoder 22 at timing TM1' and TM1" in Fig. 6. - The light emitted from the
first light source 11 and the light emitted from the secondlight source 12 pass through the prescribed optical path in thevital tissue 15, to be incident upon thelight receiving element 13. A current generated from thelight receiving element 13 is supplied to thepreamplifier 14 to be subjected to current-to-voltage conversion, while being amplified to be supplied to themeasurement processing part 20. Output of thepreamplifier 14 is amplified to a level within a prescribed range by anamplifier 16 provided in themeasurement processing part 20, whereby output such as VpD in Fig. 6 is obtained. A sample and holdcircuit 28 samples and holds output from theamplifier 16 on the basis of a timing signal TM2', shown in Fig. 6, generated by thetiming circuit 23 and adecoder 25. - The signal thus sampled and held is selected by a
multiplexer 29 and converted into a digital signal by anA-D converter 30, to.be data-latched by adata latch 31. At this time, themultiplexer 29, theA-D converter 30 and the data latch 31 are controlled in timing by thetiming circuit 23 and thedecoder 26. - The latched data are timed by a
decoder 27 through a select signal outputted from theCPU 34 through the I/O port 32, to be taken in aRAM 35 as digital signals Ll and L2. The I/O port 32 is connected with a buzzer 33, which informs timing for injecting the specific dye. Further, theCPU 34 is connected with theRAM 35, aROM 36, adisplay part 37 and aoperation part 28. TheRAM 35 is adapted to store data as shown in Fig. 7 as hereinafter described, and theROM 36 stores programs based on flow charts as shown in Figs. 8A to 8D as hereinafter described. Thedisplay part 37 displays data as shown in Figs. 9 to 12, as hereinafter described. Aprinter 38 is adapted to print the result of a liver function test. - The
function part 39 includes analarm LED 40, acalibration key 41, astart key 42 and aprint key 43. Thealarm LED 40 is adapted to display an alarm when reliability of the test result is small and thecalibration key 41 is adapted to set a biocalibration mode, while thestart key 42 is adapted to command start of a measurement mode and theprint key 43 is adapted to command printout of the test result. - In the aforementioned exemplary structure as shown in Fig. 5, the light emitted from the first and second
light sources vital tissue 15 is received by a singlelight receiving element 13. However, such means is not restricted to this but light receiving elements may be provided in correspondence to the first and secondlight sources CPU 34 in a time-sharing manner. Alternatively, a single light source commonly emitting light having a wavelength al absorbed by specific dye and light having a wavelength À2 not absorbed by the same may be provided as light source means, with provision of two filters for individually transmitting the light of the respective wavelengths and light receiving elements corresponding to the respective ones of the filters. - Fig. 7 illustrates data stored in the
RAM 35 as shown in Fig. 5 and Figs. 8A to 8D are flow charts for illustrating concrete operation of the embodiment of the present invention, while Figs. 9 to 12 are illustrative of exemplary displays on the display part as shown in Fig. 5, Fig. 14 is illustrative of an exemplary disappearance curve of specific dye, and the blood plasma disappearance rate k and the T-minute retention rate R % measured by the present invention. - With reference to Figs. 5, 8A to 8D and 14, description is now made on the concrete operation of the embodiment of the present invention.
- The operation of the inventive apparatus includes a data sampling mode, a biocalibration mode, an initialization mode and a measurement mode, and Figs. 8A, 8B, 8C and 8D show operation flows in these modes respectively.
- First, it is pointed out that the data sampling mode as shown in Fig. 8A is executed as subroutines in the calibration mode and the measurement mode as hereinafter described. Steps (abbreviated as SP in the figures) SP11 to SP16 are adapted to sample quantities of light of a pair of wavelengths λ1 and À2 after passage through a measured object and store the same in the
RAM 35. Namely, theCPU 34 outputs the start signal from a line as shown in Fig. 5 through the I/O port 23 at the step SP11. The values L1 and L2 are data-latched by the start signal, as hereinabove described. TheCPU 34 waits until the data are latched at the step SP12. - Then, at the step SP13, the
CPU 34 outputs the select signal to a select line as shown in Fig. 5 through the I/O port 32, to read the data of L1 through the I/O port 32 at the step SP14, thereby to store the same in a storage area 8a1 of theRAM 35 as shown in Fig. 7. - Similarly, the
CPU 34 stores the data of L2 in a storage area 8a2 of theRAM 35 at the steps SP15 and SP16. - Upon completion of the aforementioned operation at the step SP16, the
CPU 34 returns to the original step. This will be described with reference to Fig. 8B showing the biocalibration mode and Fig. 8D showing the measurement mode. - Fig. 8B shows the operation flow chart of the biocalibration mode, which is started upon power supply to the apparatus or upon completion of the operation of the measurement mode as shown in Fig. 8D, as hereinafter described. At a step SP21, the
CPU 34 makes the biocalibration mode appear on thedisplay part 37. This display shows that the apparatus enters the biocalibration mode and indicates mounting of thesensor part 10 as shown in Fig. 9, for example. In accordance with this indication, an operator attaches thesensor part 10 to thevital tissue 15. - Thereafter the
CPU 34 waits until thecalibration key 41 is operated at a step SP22. When thecalibration key 41 is operated, theCPU 34 advances to a step SP23, to execute the data sampling subroutine as shown in Fig. 8A, as hereinabove described. - Then, the
CPU 34 controls the constantcurrent circuit 21 as shown in Fig. 5 so that the data L1 and L2 read at the step SP23 are within ranges of light quantity data LMAX and LMIN stored in storage areas 8bl and 8b2 of theRAM 35. TheCPU 34 then stores current set values i1, i2 in storage areas 8c1 and 8c2 in theRAM 35. Thereafter the currents il, i2 regularly flow to thelight sources - Then, the
CPU 34 sounds the buzzer at a step SP25, to inform that power setting is completed. Subsequent steps SP26 to SP29 are shown as a flow chart for performing the aforementioned biocalibration. In more concrete terms, theCPU 34 samples the values of L1 and L2 n times respectively at the steps SP26 and SP27, to make CL1(1) to CL1(n) stored in storage areas 8d1 to 8dn and CL2(1) to CL2(n) stored in storage areas 8el to 8en. At the subsequent step SP28, theCPU 34 performs regression line analysis with respect to log CL1(I) and logCL2(I) (I = 1 to n), in accordance with the following operation expression:
- The
CPU 34 finds the values A and B in the above operation expression, a correlation coefficient r1 and the maximum value of CL1(I) (I = 1 to n) as CL10, to store the same in storage areas 8fl, 8f2, 8f3 and 8f4 in theRAM 35 respectively. - Then, at the step SP29, the
CPU 34 determines whether or not the correlation coefficient rI is at least 0.998 in order to verify reliability of the biocalibration, advances to a step SP30 if the same is less than 0.998 to light thealarm LED 40, and returns to the step SP22 to again perform biocalibration. On the other hand, if a determination is made that the correlation coefficient r1 is at least 0.998, theCPU 34 advances to the measurement mode as shown in Fig. 8D. The reference value 0.998 of the correlation coefficient r1 herein employed is a mere example, which is. determined by performance of the entire apparatus. During the data sampling by n times at the step SP26, the testee raises and brings down his hand and suppresses the same by the sensor, in order to change the blood volume in the organism. - With reference to Fig. 8C, the aforementioned initializing operation at the step SP24 as shown in Fig. 8B will now be described in more concrete terms.
- The light quantity data L1 and L2 of the light of the wavelengths λ1 and λ2 are stored in the storage areas 8al and 8a2 of the
RAM 35. At a step SP241, theCPU 34 makes the values of L1 and L2 stored in storage area 8hl and 8h2 in theRAM 35 as L0λ1 and L0λ2 respectively. Then theCPU 34 executes steps SP242 to SP249, to adjust the set values of the currents flowing from the constantcurrent circuit 21 so that L0λ1 and L0λ2 are set between the light quantity data LMAX and LMIN (LMAX > LMIN) stored in the storage areas 8bl and 8b2 of theRAM 35. - In more concrete terms, if L0λ1 is greater than LMAX at the step SP242, the
CPU 34 advances to the step SP243 to set the current set value i1 at a small value to again execute the steps SP23 and SP241, and a determination is again made as to whether or not L0λ1 is greater than LMAX at the step SP242. If L0λ1 is less than LMAX theCPU 34 advances to the step SP244 to determine whether or not L0λ1 is less than LMIN. If L0λ1 is less than LMIN' theCPU 34 increases the value of the current set value i1 at the step SP245, to return to'the aforementioned step SP23. This operation is repeated to set the current set value i1 so that L0λ1 is between LMAX and LMIN . - Then, at.the steps SP246 to SP249, the current set value i2 is set so that L0λ2 is between LMAX and LMIN' similarly to the steps SP242 to SP245. Thus, the current set values i1 and i2 finally set at the steps SP23 to SP249 are stored in the storage areas 8cl and 8c2 of the
RAM 35. - With reference to Fig. 8D, description is now made on the measurement mode. At a step SP41, the
CPU 34 makes a display for injection of the specific dye on thedisplay part 37. As to this display, indication is made for injection of the specific dye such as ICG as shown in Fig. 10, for example. In accordance with the display, the operator prepares for injection of the specific dye to the testee. At a step SP42, theCPU 34 waits until thestart key 42 is operated. Upon a determination that thestart key 42 is operated, theCPU 34 displays timing for injecting the specific dye at a step SP43, while sounding the buzzer 33. This is displayed as 1 → 2 → 3 → 4 → 5 as shown in Fig. 11, for example, so that the measurer injects the specific dye upon display of "5". TheCPU 34 generates a first sound from the buzzer 33 with the displays, of "1", "2", "3" and "4", while generating a different sound from the buzzer 33 upon display of "5". - Upon generation of the sound and the display, the measurer injects the specific dye. The
CPU 34 sets "0" as the initial value of a timer at a step SP44. Then, at a step SP45, theCPU 34 executes a data sampling program, which is the subroutine as hereinabove described with reference to Fig. 8A. Then, the sampling data are stored in the storage areas 8al to 8a2 of theRAM 35 as L1 to L2) respectively. At a step SP46, theCPU 34 performs operation based on the following operation expression by using the coefficients A, B, and L10 stored in the storage areas 8fl, 8f2 and 8f4 of theRAM 35 in the biocalibration mode as hereinabove-described with reference to Fig. 8B, to store Cg(I) in a storage area 8g1 of the RAM 35:
- The value of Cg(I) is displayed on the
display part 37 at the step SP46 in a mode as shown in Fig. 12, for example. Referring to Fig. 12, the axis of abscissa indicates the elapsed time from injection of the specific dye and axis of ordinate indicates the value of Cg(I). Assuming that m represents the sampling number of a disappearance curve of the specific dye, symbol I indicatesintegers 1 to m, and assuming that T represents a measuring time of the disappearance curve, a single sampling time is ITM = Ts/(m - 1). The same coincides with the injection time of the specific dye in the case of I = 1, as a matter of course. At a step SP47, theCPU 34 waits during this sampling time ITM. - Upon a lapse of this standby time, the
CPU 34 judges whether or not i is greater than m at a step SP4-8. TheCPU 34 advances to a step SP49 if i is greater than m, while the same again returns to the step SP45 to repeat sampling if the former is less than the latter. The data Cg(I) stored in the storage areas Bgl to 8gm of theRAM 35 draw a disappearance curve of the specific dye as shown in Fig..13, for example, and the leading edge thereof is detected so that data preceding thereto are subtracted as baselines from the respective values of Cg(I), to be again stored in the storage areas 8gl to 8gm. Needless to say, L1 to L2 at the step SP45 may be average values of k times, in order to improve the accuracy of measurement. - Then, at a step SP51, the
CPU 34 finds the constants A and B by using the method of least squares in a simulation curve of:

- Then, the
CPU 34 performs operation of the blood plasma disappearance rate k = -B and the T-minute retention rate R % = eBT at a step SP52, to evaluate k and R %. The values k and R % thus evaluated are stored in storage areas 8jl and 8j2 of theRAM 35, respectively. At this time, theCPU 34 operates a correlation coefficient r2 by the method of least squares, to make the correlation coefficient r2 thus operated stored in a storage area 8j3 of theRAM 35. TheCPU 34 further generates an end sound from the buzzer 33. - Further, the
CPU 34 makes the values k and R % appear on thedisplay part 26 in a mode as shown in Fig. 12, for example. Then, at a step SP53, theCPU 34 determines whether or not the correlation coefficient r2 is less than 0.95, for example. This determination is made to check the degree of correlation since correlation is improved as the correlation coefficient r2 approaches -1. The value -0.95 is provisionally selected between zero and -1, and reliability of the apparatus is improved as the value comes closer to -1. - If the correlation coefficient r2 is greater than 0.95, for example, the
CPU 34 determines that reliability is insufficient to light thealarm LED 40 at the step SP54. On the other hand, if the correlation coefficient r2 is less than -0.95, for example, at the step SP53, theCPU 34 advances to a step SP55 without flashing the alarm LED 44, since the measurement is reliable. At the step SP55, theCPU 34 determines whether or not theprint key 43 is operated, to make theprinter 38 print the values k and R % if the determination is of YES. - If necessary, the
CPU 34 also makes characteristic dye disappearance curves of Cg(I) stored in the storage areas 8gl to 8gn of theRAM 35 printed, to advance to the biocalibration mode as shown in Fig. 8B. Also when a determination is made that theprint key 43 is not operated at the step SP55, theCPU 34 advances to the calibration mode. - Fig. 14 shows the result of a measurement experiment in the liver function testing apparatus as shown in Fig. 5. The
sensor part 10 was attached on a left fingertip of a male patient having hepatic disease (age: 60, weight: 48 Kg), to intravenously inject an aqueous solution containing 24 mg of ICG (0.5 mg per Kg) from the vein of his right front elbow. Fig. 15 shows the time change of L1, L2 in case of employing a light emitting diode of wavelength X1 = 810 nm as thefirst light source 11 and a light emitting diode of wavelength λ2 = 940 nm as the secondlight source 12. - The value k calculated by the ICG disappearance curve was 0.125 as shown in Fig. 14 and the value R % was 13 %, while the value k measured by the conventional blood collection method was 0.124 and the value R % was 12.8 %, substantially in coincidence. Fig. 15 also shows raw data of L1 and L 2' It is clearly understood from Fig. 14 that the blood volume in the organism was fluctuated.
- Figs. 16 to 19 show results of experiments for illustrating effects attained by the present invention.
- Fig. 16 shows time changes for 15 minutes in intensity levels of the first light and the second light passing through the
vital tissue 15 from thelight sources vital tissue 15 in a rest state. Merely finding difference (L1 - L2) between the first light and the second light, the base line is largely fluctuated as characteristic a in Fig. 17. When the fluctuation of the blood volume is corrected by the biocalibration according to the present invention, the base line is substantially stable as shown by characteristic b in Fig. 17. - Fig. 18 shows time changes for 15 minutes in intensity levels of the first light and the second light passing through the
vital tissue 15 from thelight sources - In the aforementioned embodiment, the present invention is applied to the case of evaluating the coefficient of the simulation function by using the method of least squares on the basis of the value correlated with the specific dye concentration in the blood thereby to evaluate the blood plasma disappearance rate k and the retention rate R %. However, the present invention is not restricted to this but further applicable to the case of obtaining index RMAX on the basis of the aforementioned coefficient as obtained. Description is now made on such an embodiment.
- Fig. 20 illustrates data stored in a RAM provided in an apparatus for measuring index RMAX.
- The apparatus for measuring index RMAX is identical in structure to that shown in Fig. 5, but the
RAM 3*5 is provided with storage areas 8k1 to 8k6 and 8ℓ1 and 8ℓ2 as shown in Fig. 20, in place of the storage areas 8j1 to 8j3 as shown in Fig. 7. - Figs. 21A and 21B are flow charts for illustrating a measurement mode for measuring index RMAX, and Figs. 22 to 24 are diagrams for illustrating operation for measuring index RMAX.
- A data sampling mode in measurement of index RMAX is identical to that shown in Fig. 8A and a biocalibration mode is identical to that shown in Fig. 8B, while initializing operation is identical to that shown in Fig. 8C. Within the operation of the measurement mode as shown in Figs. 21A and 21B, steps SP41 to SP51 and SP53 to SP56 are identical to those shown in Fig. 8D, and hence redundant description is omitted.
- In order to measure index RMAX, it is necessary to operate functions of simulation curves in time change of results of operation in at least two or more blocks by using the method of least squares, to evaluate coefficients K of specific dye as to respective blocks on the basis of the functions, as shown in Fig. 22.
- Then, at a step SP51, a
CPU 34 operates constants A1 and B1 in a block between times T1 to T2, similarly to the above embodiment. At a step SP57, theCPU 34 evaluates K1 from K1 = B1 while evaluating a correlation coefficient rgl, to store the same in the storage areas 8kl and 8k2 of theRAM 35. Similarly, theCPU 34 evaluates constants A2 and B2 in a block between times T3 and T4 at a step SP58, and evaluates a coefficient K2 and a correlation coefficient rg2 at a step SP59 to store the same in the storage areas 8k3 and 8k4. TheCPU 34 further operates constants A3 and B3 at a step SP60 and evaluates a coefficient K3 and a correlation coefficient rg3 at a step SP61, to store the same in the storage areas 8k5 and 8k6. Then theCPU 34 operates index RMAX at a step SP62. - The times T1 to T6 and the coefficients K1 to K3 are mapped in relation as shown in Fig. 22. The
CPU 34 assumes that Cgl, Cg2 and Cg3 represent values corresponding to specific dye concentration values at the times T1, T3 and T5, to display the graph as shown in Fig. 23. Referring to Fig. 23, the axis of abscissa is indicated by 1/Cg and the axis of ordinate is indicated by 1/K. On the basis of these data, theCPU 34 operates a and b by using the method of least squares, through the following operation expression:
- (i = 1, 2 ...m, m > 2, where i = 1 is a first block)
- Then, the
CPU 34 operates index RMAX and rMAX in accordance with the following operation expression, to store the same in the storage areas 8l1 and 8l2 of the RAM 35:
- Although three time blocks are provided in the above embodiment, such time blocks may be in any number so far as the same is at least two, and the accuracy is improved as the number of time blocks is increased.
- Although 1/Cgl, 1/Cg2 and 1/Cg3 are plotted in the axis of abscissa, this is a simplified type and index RMAX can be more correctly measured by evaluating the coefficient A1 on the basis of the following operation expression to assume the coefficient A1 as a coefficient C01, and similarly evaluating coefficients C02 and C03 to create the data as shown in Fig. 22. Assuming that T1 = 5 min. and the dose of ICG is D1 mg/kg, CO1 may correspond to D1, D2 may be equal to D1 x CO2/CO1 and D3 may be equal to D1 x CO1/C03. D1 may be previously set at 2 mg/kg, for example, as a value specific to the apparatus, or may be inputted by connecting input means to the
CPU 34. - According to the present invention as hereinabove described, vital tissue is exposed to first light of a wavelength absorbed by specific dye dosed into the blood of the vital tissue to be taken in and removed by the liver and second light of a wavelength not absorbed by the dye and first and second photoelectric conversion signals corresponding to the first light and the second light obtained from the vital tissue are sampled so that the coefficient of a regression line expression between the first and second photoelectric conversion signals is determined on the basis of variable components in the blood included in the sampled first and second photoelectric conversion signals, thereby to operate a value correlated with specific dye concentration in the blood on the basis of a sampling signal during a prescribed period after a lapse of a predetermined time from injection of the specific dye and the determined coefficient of the regression line expression. Thus, the value correlated with the specific dye concentration is operated to remove artifacts caused by blood flow disturbance and vibration of an organism in attachment of a sensor to the organism by performing biocalibration, thereby to more correctly test/diagnose the liver function.
- Although the present invention has been described and illustrated in detail, it is clearly understood that the same is by way of illustration and example only and is not to be taken by way of limitation, the spirit and scope of the present invention being limited only by the terms of the appended claims.
- The liver function testing apparatus according to the present invention is employed as an apparatus for testing/diagnosing liver function by performing biocalibration before injecting specific dye selectively taken in and removed by the liver into the blood for removing artifacts and thereafter injecting the specific dye into the blood to more correctly measure the blood plasma disappearance rate and the retention rate.
Claims (34)
assuming that CL1 and CL2 represent average values of said first and second photoelectric conversion signals sampled by said sampling means a plurality of times.

assuming that t represents said prescribed period after injection of said specific dye.

Priority Applications (1)
| Application Number | Priority Date | Filing Date | Title |
|---|---|---|---|
| AT87907339T ATE94361T1 (en) | 1986-11-05 | 1987-11-04 | DEVICE FOR EXAMINING LIVER FUNCTION. |
Applications Claiming Priority (4)
| Application Number | Priority Date | Filing Date | Title |
|---|---|---|---|
| JP61263046A JPS63177843A (en) | 1986-11-05 | 1986-11-05 | Hepatic function examination apparatus |
| JP263046/86 | 1986-11-05 | ||
| JP62175517A JPS6417630A (en) | 1987-07-13 | 1987-07-13 | Liver function test apparatus |
| JP175517/87 | 1987-07-13 |
Publications (3)
| Publication Number | Publication Date |
|---|---|
| EP0298122A1 true EP0298122A1 (en) | 1989-01-11 |
| EP0298122A4 EP0298122A4 (en) | 1989-03-16 |
| EP0298122B1 EP0298122B1 (en) | 1993-09-15 |
Family
ID=26496771
Family Applications (1)
| Application Number | Title | Priority Date | Filing Date |
|---|---|---|---|
| EP87907339A Expired - Lifetime EP0298122B1 (en) | 1986-11-05 | 1987-11-04 | Liver function inspection apparatus |
Country Status (16)
| Country | Link |
|---|---|
| US (1) | US4905703A (en) |
| EP (1) | EP0298122B1 (en) |
| KR (1) | KR960008908B1 (en) |
| CN (1) | CN1014019B (en) |
| AU (1) | AU605521B2 (en) |
| BR (1) | BR8707524A (en) |
| CA (1) | CA1305222C (en) |
| DE (1) | DE3787466T2 (en) |
| DK (1) | DK331688A (en) |
| ES (1) | ES2006219A6 (en) |
| FI (1) | FI98487C (en) |
| HU (1) | HU206255B (en) |
| IL (1) | IL84356A (en) |
| MX (1) | MX161742A (en) |
| NO (1) | NO178091C (en) |
| WO (1) | WO1988003386A1 (en) |
Cited By (5)
| Publication number | Priority date | Publication date | Assignee | Title |
|---|---|---|---|---|
| EP0359206A1 (en) * | 1988-09-14 | 1990-03-21 | Sumitomo Electric Industries, Ltd. | Liver function testing apparatus |
| EP0385608A1 (en) * | 1989-02-15 | 1990-09-05 | Hitachi, Ltd. | Method for optically inspecting human body and apparatus for the same |
| EP0399482A2 (en) * | 1989-05-24 | 1990-11-28 | Sumitomo Electric Industries, Ltd. | Liver function testing apparatus |
| EP0316812B1 (en) * | 1987-11-13 | 1994-02-02 | Sumitomo Electric Industries, Ltd. | Liver function testing apparatus |
| US8318504B2 (en) | 2008-05-15 | 2012-11-27 | Norgine Bv | MRP2 efflux pathway prognostic method |
Families Citing this family (5)
| Publication number | Priority date | Publication date | Assignee | Title |
|---|---|---|---|---|
| JPH01129838A (en) * | 1987-11-13 | 1989-05-23 | Sumitomo Electric Ind Ltd | Liver function examination apparatus |
| US5928625A (en) * | 1997-03-13 | 1999-07-27 | Mallinckrodt Inc. | Method of measuring physiological function |
| US6228344B1 (en) | 1997-03-13 | 2001-05-08 | Mallinckrodt Inc. | Method of measuring physiological function |
| US6280703B1 (en) | 1997-03-13 | 2001-08-28 | Mallinckrodt Inc. | Simultaneous multimodal measurement of physiological function |
| US20030215391A1 (en) * | 2001-07-19 | 2003-11-20 | Carlos Rabito | Fluorescent agents for real-time measurement of organ function |
Citations (4)
| Publication number | Priority date | Publication date | Assignee | Title |
|---|---|---|---|---|
| US3677648A (en) * | 1963-12-09 | 1972-07-18 | Johannes Dorsch | Method and apparatus for the measurement of dye dilution in blood |
| US4017192A (en) * | 1975-02-06 | 1977-04-12 | Neotec Corporation | Optical analysis of biomedical specimens |
| WO1982001948A1 (en) * | 1980-11-24 | 1982-06-10 | Oximetrix | Signal filter method and apparatus |
| US4602641A (en) * | 1983-08-15 | 1986-07-29 | The Regents Of The University Of California | Method and apparatus for NMR detection and imaging of flowing fluid nuclei |
Family Cites Families (7)
| Publication number | Priority date | Publication date | Assignee | Title |
|---|---|---|---|---|
| DE3016818A1 (en) * | 1980-05-02 | 1982-02-04 | Röhm Pharma GmbH, 6100 Darmstadt | DIAGNOSTIC METHOD FOR DETERMINING THE LIVER FUNCTION |
| JPS6058649B2 (en) * | 1980-10-02 | 1985-12-20 | 甫 横須賀 | Liver function testing device |
| JPS59189828A (en) * | 1983-04-08 | 1984-10-27 | 萩原 文二 | Subcateneous measuring sensor and apparatus of blood coloring matter |
| JPS61162934A (en) * | 1985-01-14 | 1986-07-23 | 萩原 文二 | Percateneous measuring sensor and apparatus of blood coloring matter |
| JPS61177608A (en) * | 1985-01-31 | 1986-08-09 | Mitsubishi Electric Corp | Magnetic recording and reproducing device |
| JPS61203939A (en) * | 1985-03-07 | 1986-09-09 | 萩原 文二 | Skin laser sensor for examination liver function |
| JPH022325Y2 (en) * | 1985-04-25 | 1990-01-19 |
-
1987
- 1987-11-03 IL IL84356A patent/IL84356A/en not_active IP Right Cessation
- 1987-11-04 DE DE87907339T patent/DE3787466T2/en not_active Expired - Fee Related
- 1987-11-04 CA CA000551058A patent/CA1305222C/en not_active Expired - Fee Related
- 1987-11-04 EP EP87907339A patent/EP0298122B1/en not_active Expired - Lifetime
- 1987-11-04 AU AU81715/87A patent/AU605521B2/en not_active Ceased
- 1987-11-04 BR BR8707524A patent/BR8707524A/en not_active IP Right Cessation
- 1987-11-04 WO PCT/JP1987/000851 patent/WO1988003386A1/en active IP Right Grant
- 1987-11-04 US US07/217,877 patent/US4905703A/en not_active Expired - Fee Related
- 1987-11-04 HU HU875836A patent/HU206255B/en not_active IP Right Cessation
- 1987-11-04 ES ES8703158A patent/ES2006219A6/en not_active Expired
- 1987-11-05 CN CN87107376A patent/CN1014019B/en not_active Expired
- 1987-11-05 MX MX9158A patent/MX161742A/en unknown
-
1988
- 1988-06-16 DK DK331688A patent/DK331688A/en not_active Application Discontinuation
- 1988-07-04 KR KR88700773A patent/KR960008908B1/en not_active IP Right Cessation
- 1988-07-04 NO NO882978A patent/NO178091C/en not_active IP Right Cessation
- 1988-07-05 FI FI883202A patent/FI98487C/en not_active IP Right Cessation
Patent Citations (4)
| Publication number | Priority date | Publication date | Assignee | Title |
|---|---|---|---|---|
| US3677648A (en) * | 1963-12-09 | 1972-07-18 | Johannes Dorsch | Method and apparatus for the measurement of dye dilution in blood |
| US4017192A (en) * | 1975-02-06 | 1977-04-12 | Neotec Corporation | Optical analysis of biomedical specimens |
| WO1982001948A1 (en) * | 1980-11-24 | 1982-06-10 | Oximetrix | Signal filter method and apparatus |
| US4602641A (en) * | 1983-08-15 | 1986-07-29 | The Regents Of The University Of California | Method and apparatus for NMR detection and imaging of flowing fluid nuclei |
Non-Patent Citations (1)
| Title |
|---|
| See also references of WO8803386A1 * |
Cited By (8)
| Publication number | Priority date | Publication date | Assignee | Title |
|---|---|---|---|---|
| EP0316812B1 (en) * | 1987-11-13 | 1994-02-02 | Sumitomo Electric Industries, Ltd. | Liver function testing apparatus |
| EP0359206A1 (en) * | 1988-09-14 | 1990-03-21 | Sumitomo Electric Industries, Ltd. | Liver function testing apparatus |
| EP0385608A1 (en) * | 1989-02-15 | 1990-09-05 | Hitachi, Ltd. | Method for optically inspecting human body and apparatus for the same |
| US5148022A (en) * | 1989-02-15 | 1992-09-15 | Hitachi, Ltd. | Method for optically inspecting human body and apparatus for the same |
| EP0399482A2 (en) * | 1989-05-24 | 1990-11-28 | Sumitomo Electric Industries, Ltd. | Liver function testing apparatus |
| EP0399482A3 (en) * | 1989-05-24 | 1991-05-02 | Sumitomo Electric Industries, Ltd. | Liver function testing apparatus |
| US8318504B2 (en) | 2008-05-15 | 2012-11-27 | Norgine Bv | MRP2 efflux pathway prognostic method |
| US8513023B2 (en) | 2008-05-15 | 2013-08-20 | Norgine Bv | Prognostic method |
Also Published As
| Publication number | Publication date |
|---|---|
| KR890700009A (en) | 1989-03-02 |
| CN1014019B (en) | 1991-09-25 |
| FI98487B (en) | 1997-03-27 |
| IL84356A0 (en) | 1988-04-29 |
| DE3787466D1 (en) | 1993-10-21 |
| EP0298122A4 (en) | 1989-03-16 |
| AU605521B2 (en) | 1991-01-17 |
| CN87107376A (en) | 1988-07-06 |
| AU8171587A (en) | 1988-06-01 |
| KR960008908B1 (en) | 1996-07-09 |
| US4905703A (en) | 1990-03-06 |
| ES2006219A6 (en) | 1989-04-16 |
| BR8707524A (en) | 1989-02-21 |
| WO1988003386A1 (en) | 1988-05-19 |
| NO178091C (en) | 1996-01-24 |
| FI883202A (en) | 1988-07-05 |
| NO882978D0 (en) | 1988-07-04 |
| CA1305222C (en) | 1992-07-14 |
| NO882978L (en) | 1988-09-02 |
| FI98487C (en) | 1997-07-10 |
| NO178091B (en) | 1995-10-16 |
| EP0298122B1 (en) | 1993-09-15 |
| MX161742A (en) | 1990-12-20 |
| DE3787466T2 (en) | 1994-01-13 |
| DK331688A (en) | 1988-08-30 |
| IL84356A (en) | 1991-08-16 |
| DK331688D0 (en) | 1988-06-16 |
| HU206255B (en) | 1992-10-28 |
| HUT47418A (en) | 1989-03-28 |
| FI883202A0 (en) | 1988-07-05 |
Similar Documents
| Publication | Publication Date | Title |
|---|---|---|
| EP0399482B1 (en) | Liver function testing apparatus | |
| US5690104A (en) | Apparatus and method for measuring oxygen saturation in blood and apparatus and method for measuring concentration of light-absorbing materials in blood | |
| US5154176A (en) | Liver function testing apparatus | |
| EP0316812B1 (en) | Liver function testing apparatus | |
| EP0298122B1 (en) | Liver function inspection apparatus | |
| JPH07222723A (en) | Circulating blood quantity measuring instrument | |
| EP0316745B1 (en) | Liver function testing apparatus | |
| EP0276477B1 (en) | Apparatus for measuring the change in the concentration of a pigment in blood | |
| JPH0534979B2 (en) | ||
| JPH0620459B2 (en) | Liver function test device | |
| JPH04336057A (en) | Liver function inspection device | |
| JPH04297233A (en) | Liver function inspector | |
| JPH0351177B2 (en) | ||
| JPH0570467B2 (en) | ||
| JPH0534978B2 (en) | ||
| CN112120672A (en) | Detection method and detection device for effective liver function and storage medium |
Legal Events
| Date | Code | Title | Description |
|---|---|---|---|
| PUAI | Public reference made under article 153(3) epc to a published international application that has entered the european phase |
Free format text: ORIGINAL CODE: 0009012 |
|
| 17P | Request for examination filed |
Effective date: 19880620 |
|
| AK | Designated contracting states |
Kind code of ref document: A1 Designated state(s): AT BE CH DE FR GB IT LI NL SE |
|
| A4 | Supplementary search report drawn up and despatched |
Effective date: 19890316 |
|
| RAP1 | Party data changed (applicant data changed or rights of an application transferred) |
Owner name: SUMITOMO ELECTRIC INDUSTRIES, LIMITED |
|
| 17Q | First examination report despatched |
Effective date: 19920318 |
|
| GRAA | (expected) grant |
Free format text: ORIGINAL CODE: 0009210 |
|
| AK | Designated contracting states |
Kind code of ref document: B1 Designated state(s): AT BE CH DE FR GB IT LI NL SE |
|
| REF | Corresponds to: |
Ref document number: 94361 Country of ref document: AT Date of ref document: 19931015 Kind code of ref document: T |
|
| REF | Corresponds to: |
Ref document number: 3787466 Country of ref document: DE Date of ref document: 19931021 |
|
| ITF | It: translation for a ep patent filed |
Owner name: MODIANO & ASSOCIATI S.R |
|
| ET | Fr: translation filed | ||
| PLBE | No opposition filed within time limit |
Free format text: ORIGINAL CODE: 0009261 |
|
| STAA | Information on the status of an ep patent application or granted ep patent |
Free format text: STATUS: NO OPPOSITION FILED WITHIN TIME LIMIT |
|
| 26N | No opposition filed | ||
| EAL | Se: european patent in force in sweden |
Ref document number: 87907339.3 |
|
| REG | Reference to a national code |
Ref country code: CH Ref legal event code: NV Representative=s name: TROESCH SCHEIDEGGER WERNER AG |
|
| PGFP | Annual fee paid to national office [announced via postgrant information from national office to epo] |
Ref country code: GB Payment date: 19991103 Year of fee payment: 13 |
|
| PGFP | Annual fee paid to national office [announced via postgrant information from national office to epo] |
Ref country code: SE Payment date: 19991104 Year of fee payment: 13 |
|
| PGFP | Annual fee paid to national office [announced via postgrant information from national office to epo] |
Ref country code: FR Payment date: 19991109 Year of fee payment: 13 |
|
| PGFP | Annual fee paid to national office [announced via postgrant information from national office to epo] |
Ref country code: CH Payment date: 19991111 Year of fee payment: 13 |
|
| PGFP | Annual fee paid to national office [announced via postgrant information from national office to epo] |
Ref country code: AT Payment date: 19991112 Year of fee payment: 13 |
|
| PGFP | Annual fee paid to national office [announced via postgrant information from national office to epo] |
Ref country code: NL Payment date: 19991130 Year of fee payment: 13 |
|
| PGFP | Annual fee paid to national office [announced via postgrant information from national office to epo] |
Ref country code: BE Payment date: 20000121 Year of fee payment: 13 |
|
| PGFP | Annual fee paid to national office [announced via postgrant information from national office to epo] |
Ref country code: DE Payment date: 20001030 Year of fee payment: 14 |
|
| PG25 | Lapsed in a contracting state [announced via postgrant information from national office to epo] |
Ref country code: GB Free format text: LAPSE BECAUSE OF NON-PAYMENT OF DUE FEES Effective date: 20001104 Ref country code: AT Free format text: LAPSE BECAUSE OF NON-PAYMENT OF DUE FEES Effective date: 20001104 |
|
| PG25 | Lapsed in a contracting state [announced via postgrant information from national office to epo] |
Ref country code: SE Free format text: THE PATENT HAS BEEN ANNULLED BY A DECISION OF A NATIONAL AUTHORITY Effective date: 20001129 |
|
| PG25 | Lapsed in a contracting state [announced via postgrant information from national office to epo] |
Ref country code: LI Free format text: LAPSE BECAUSE OF NON-PAYMENT OF DUE FEES Effective date: 20001130 Ref country code: CH Free format text: LAPSE BECAUSE OF NON-PAYMENT OF DUE FEES Effective date: 20001130 Ref country code: BE Free format text: LAPSE BECAUSE OF NON-PAYMENT OF DUE FEES Effective date: 20001130 |
|
| BERE | Be: lapsed |
Owner name: SUMITOMO ELECTRIC INDUSTRIES LTD Effective date: 20001130 |
|
| PG25 | Lapsed in a contracting state [announced via postgrant information from national office to epo] |
Ref country code: NL Free format text: LAPSE BECAUSE OF NON-PAYMENT OF DUE FEES Effective date: 20010601 |
|
| GBPC | Gb: european patent ceased through non-payment of renewal fee |
Effective date: 20001104 |
|
| REG | Reference to a national code |
Ref country code: CH Ref legal event code: PL |
|
| EUG | Se: european patent has lapsed |
Ref document number: 87907339.3 |
|
| PG25 | Lapsed in a contracting state [announced via postgrant information from national office to epo] |
Ref country code: FR Free format text: LAPSE BECAUSE OF NON-PAYMENT OF DUE FEES Effective date: 20010731 |
|
| NLV4 | Nl: lapsed or anulled due to non-payment of the annual fee |
Effective date: 20010601 |
|
| REG | Reference to a national code |
Ref country code: FR Ref legal event code: ST |
|
| PG25 | Lapsed in a contracting state [announced via postgrant information from national office to epo] |
Ref country code: DE Free format text: LAPSE BECAUSE OF NON-PAYMENT OF DUE FEES Effective date: 20020702 |
|
| PG25 | Lapsed in a contracting state [announced via postgrant information from national office to epo] |
Ref country code: IT Free format text: LAPSE BECAUSE OF NON-PAYMENT OF DUE FEES;WARNING: LAPSES OF ITALIAN PATENTS WITH EFFECTIVE DATE BEFORE 2007 MAY HAVE OCCURRED AT ANY TIME BEFORE 2007. THE CORRECT EFFECTIVE DATE MAY BE DIFFERENT FROM THE ONE RECORDED. Effective date: 20051104 |