EP0430165A2 - Procédé et appareil pour la génération d'une courbe de conversion utilisable pour convertir la caractéristique de reproduction d'images - Google Patents
Procédé et appareil pour la génération d'une courbe de conversion utilisable pour convertir la caractéristique de reproduction d'images Download PDFInfo
- Publication number
- EP0430165A2 EP0430165A2 EP90122646A EP90122646A EP0430165A2 EP 0430165 A2 EP0430165 A2 EP 0430165A2 EP 90122646 A EP90122646 A EP 90122646A EP 90122646 A EP90122646 A EP 90122646A EP 0430165 A2 EP0430165 A2 EP 0430165A2
- Authority
- EP
- European Patent Office
- Prior art keywords
- shadow
- density value
- density
- value
- highlight
- Prior art date
- Legal status (The legal status is an assumption and is not a legal conclusion. Google has not performed a legal analysis and makes no representation as to the accuracy of the status listed.)
- Granted
Links
Images


Classifications
-
- H—ELECTRICITY
- H04—ELECTRIC COMMUNICATION TECHNIQUE
- H04N—PICTORIAL COMMUNICATION, e.g. TELEVISION
- H04N1/00—Scanning, transmission or reproduction of documents or the like, e.g. facsimile transmission; Details thereof
- H04N1/46—Colour picture communication systems
- H04N1/56—Processing of colour picture signals
- H04N1/60—Colour correction or control
- H04N1/6027—Correction or control of colour gradation or colour contrast
-
- H—ELECTRICITY
- H04—ELECTRIC COMMUNICATION TECHNIQUE
- H04N—PICTORIAL COMMUNICATION, e.g. TELEVISION
- H04N1/00—Scanning, transmission or reproduction of documents or the like, e.g. facsimile transmission; Details thereof
- H04N1/40—Picture signal circuits
- H04N1/407—Control or modification of tonal gradation or of extreme levels, e.g. background level
- H04N1/4072—Control or modification of tonal gradation or of extreme levels, e.g. background level dependent on the contents of the original
- H04N1/4074—Control or modification of tonal gradation or of extreme levels, e.g. background level dependent on the contents of the original using histograms
Definitions
- the present invention relates to a method of and apparatus for generating a conversion curve employable for converting a reproduction characteristic of an image, and more particularly to a technique suitable for automatic generation of the conversion curve in a process scanner and the like.
- the present invention may be applied to a method of systematically correcting color fogging caused only in a shadow part of a color original in a color image processor such as a color process scanner.
- a first conventional method for correcting the color separation conditions different highlight and shadow density values are set for respective color components in a process for converting a density signal for each color component obtained by reading the original to fit a density range of a color separation device, that is, a normalization conversion process.
- highlight and shadow density values are set in common to each color component, and halftone dot percentage for each color block is corrected in the stage where the halftone dot signal for each color block: yellow (Y), magenta (M), cyan (C) and black (K) is determined.
- UCA/UCR Under Color Add/Removal
- the lower limit of the density range to be corrected must be set manually for each color printer.
- the decision of a correction amount is largely dependent on operator's sense because the correction amount is also based on the darkest part in the original. That is, the work of removing the color fogging by means of the UCA/UCR function is not objective and systematic but temporary.
- the correction amount of the color fogging by means of the UCA/UCR function cannot be controlled systematically and quantitatively, which causes a hindrance to automatic determination of color separation conditions.
- each circuit in the preceding stage of the UCA/UCR circuit must process a signal before gray balance correction, and establishment of the processing characteristic thereof is complicated.
- the present invention is directed to a method of generating a conversion curve which is employable for converting first density values obtained by photoelectrically reading an object image for each pixel and defined in a first density range into second density values defined in a second density range and having a reproduction characteristic suitable for prescribed image processing.
- the method comprises the steps of: (a) designating a highlight density value and a shadow density value within the first density range; (b) determining a dummy shadow density value within the first density range according to a predetermined determination rule; and (c) generating the conversion curve so as to satisfy both of the following conditions (1) and (2):
- the conversion curve substantially passes through first and second points on a two-dimensional coordinate plane on which the conversion curve is defined, where the first and second points are determined in accordance with the highlight density value and the shadow density value, respectively.
- the conversion curve extends along a line in a highlight density region which is defined around the highlight density value, where the line is so defined as to pass through the first point and a third point determined in accordance with the dummy shadow density value.
- the first through third points are specified on the coordinate plane in accordance with the highlight density value, the shadow density value and the dummy shadow density value.
- the conversion curve is formed along the straight line connecting the first and third points.
- the conversion curve deviates from the straight line to pass through the second point.
- the method may further comprises the step of: (d) conducting the steps (a) through (c) for each color component to obtain the conversion curve for each color component.
- the method is effective for compensating a color fogging only in a shadow part of the object image
- the step (b) comprises the steps of: (b-1) determining whether or not there is a fogging only in a shadow part on the object image; and (b-2) when there is the fogging only in the shadow part, determining the dummy shadow density value for each color component such that the dummy shadow density value is different from the shadow density value by a value representing an amount of the fogging in each color component.
- the shadow density value and the dummy shadow density value are determined so that the difference therebetween is adapted to correspond to the color fogging amount only in the shadow part of the object image.
- the deviation of the conversion curve from the straight line accordingly has the function of eliminating the color fogging only in the shadow part. Since the deviation occurs substantially in the shadow part or in the vicinity thereof on the coordinate plane, the gray balance of the low and middle density regions is not lost.
- the step (b) comprises the steps of: (b-1) detemining a first value proportional to a width of a density range in a reference image; (b-2) detemining a second value proportional to the highlight density value; and (b-3) summing the first and second values to obtain the dummy shadow density value.
- the present invention also provides an apparatus adapted for the above-indicated methods, which may be a color process scanner.
- density in the present invention generally designates not only an optical density itself but also an amount expressing image gradation such as a signal level obtained by photoelectrically reading the optical density and a Munsell value.
- an object of the present invention is to provide a method of and apparatus for generating a conversion curve systematically executable without a skilled operator and particularly suitable for automation.
- Another object of the present invention is to generate a conversion curve applied to correction of color separation conditions for a color original and capable of controlling a correction amount of color fogging only in a shadow part systematically and quantitatively.
- Another object of the present invention is to supply each circuit in a color separation device with a signal after gray balance correction to facilitate the establishment of processing characteristics in the circuits.
- Another object of the present invention is to provide a technique capable of handling together gray balance correction in the case where the whole of an original is discolored and color fogging correction only in a shadow part and particularly suitable for automation of color separation conditions.
- Another object of the present invention is to generate a conversion curve capable of particularly preventing density expressivity in an image after conversion from being affected largely by the density range of an original.
- Fig. 1 is an external view of a color process scanner according to a first preferred embodiment of the present invention
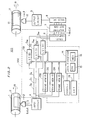
- Fig. 2 is a block diagram of the color process scanner
- Figs. 3A and 3B are flow charts showing the operation of the first preferred embodiment
- Fig. 4 shows conceptionally the procedure of data processings in the first preferred embodiment
- Fig. 5 shows a frequency histogram of average density values
- Fig. 6 shows a cumulative density histogram for each color component
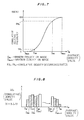
- Fig. 7 shows a cumulative relative frequency histogram
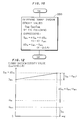
- Fig. 8 shows a histogram for explaining processes of calculating an average color density value from parts of the histogram of Fig. 5;
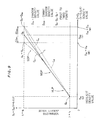
- Fig. 9 is a graph illustrating an example of conversion curves generated according to the first preferred embodiment.
- Fig. 10 is a flow chart showing a part of the process of a second preferred embodiment of the present invention.
- Fig. 11 is a graph illustrating an example of conversion curves generated according to the second preferred embodiment
- Fig. 12 is a graph showing dependence of a dummy shadow density value on a weight coefficient for calculating a weighted average
- Fig. 13 is an external view showing another example of color process scanners according to the present invention.
- Fig. 14 illustrates correction of a highlight density value depending on a subject in an original to be processed.
- Fig. 1 is an external view of a color process scanner according to a preferred embodiment of the present invention
- Fig. 2 is a block diagram showing an internal structure thereof.
- the process scanner 100 comprises a scanner unit 200 and a color separation auxiliary device 300 which are electrically connected to each other by a transmission cable 101.
- the scanner unit 200 consists of an input part 201 and an output part 202.
- the input part 201 comprises an original drum 2 and a pickup head 3.
- the output part 202 comprises a recording drum 11 and a recording head 10.
- an operation panel 203 of the scanner unit 200 is provided on the side of the input part 202.
- the scanner unit 200 itself has no automatic function of setting color separation conditions, and the function is achieved by the color separation auxiliary device 300.
- the color separation auxiliary device 300 comprises a CRT 18 and a console 17 disposed on a device body 301.
- FIG. 2 components of the scanner unit 200 are illustrated outside the broken line representative of the color separation auxiliary device 300.
- a positive color original film 1 is wound around the original drum 2.
- the pickup head 3 is provided in opposition to the original drum 2.
- Main scanning and subscanning of the original 1 are achieved by rotation of the drum 2 in the direction ⁇ and translation of the pickup head 3 in the direction ⁇ , respectively, whereby the pickup head 3 photoelectrically reads the image of the original 1 for each pixel in the order of scanning lines.
- Electronic signals representative of the image on the original is supplied to an input circuit 4 for each color component of blue (B), green (G) and red (R), which are converted into digital color density signals D B , D G and D R for B, G and R in the input circuit 4, respectively.
- these signals D B , D G and D R are stored in frame memories 13B, 13G and 13R for each pixel respectively.
- An data processor 14 is, for example, a microcomputer, is supplied with the signals D B , D G and D R from the frame memories 13B, 13G and 13R and generates conversion curves which are employable in converting a reproduction characteristic of the image for each color component.
- the conversion curves may be called as normalization curves, since the conversion includes an operation for normalizing the range of the color density signals into in accordance with a density range suitable for data processing for image recording. The details of this process are described later.
- a CPU 15 and a memory 16 are used in this process.
- the console 17 is provided for manually inputting various commands and data to the data processor 14.
- the conversion curves generated in the data processor 14 for respective components B, G and R are loaded as numerical data to lookup table memories (LUTs) 5B, 5G and 5R.
- the signals D B , D G and D R obtained at this time are subjected to normalization conversion using the conversion curves in the LUTs 5B, 5G and 5R to be converted into signals D NB' D NG and D NR , which are supplied to a color computation circuit 6 provided in the next stage.
- color computation circuit 6 color computation based on the signals D NB , D NG and D NR is executed so that respective color printer signals for Y, M, C and K are generated.
- These respective color printer signals are converted into Y, M, C and K halftone dot signals in a halftone dot converter 7.
- the halftone dot signals are combined by a selector 8 into a time-shared signal to be supplied to an output circuit 9 as a modulation signal.
- the recording head 10 contains a laser light source and ON/OFF-modulates a laser beam according to the modulation signal supplied from the output circuit 9.
- a photosensitive film 12 is wound around the recording drum 11.
- the laser beam exposes the photosensitive film 12 for each pixel in the order of scanning lines by the combination of the rotation of the drum 11 in the direction ⁇ and the translation of the recording head 10 in the direction ⁇ .
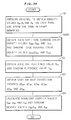
- Figs. 3A and 3B are flow charts showing the operation of the color process scanner 100. This operation is suited for correcting color fogging only in a shadow part.
- Fig. 4 shows conceptionally the processes of generating the conversion curves.
- the reference characters S1, S101, ⁇ ⁇ ⁇ and the like in Fig. 4 correspond to the step numbers in Figs. 3A and 3B.
- Outline arrows in Fig. 4 show flows of data.
- the whole part of the original 1 to be reproduced is prescanned.
- the color density signals D B' D G and D R for each pixel (Fig. 2) are stored in the frame memories 13B, 13G and 13R, respectively.
- the color density values that the signals D B , D G and D R indicate are designated by the same reference characters D B , D G and D R hereinafter.
- the storing operation of the color density values D B , D G and D R is carried out while skipping the pixels.
- the next process step S100 is a subroutine for obtaining highlight-side average color density values D HAB , D HAG and D HAR and shadow-side average color density values D SAB' D SAG and D SAR from the color density values D B , D G and D R .
- D M (D B +D G +D R )/3 for each pixel is calculated in the first process step S101 from the density values D B' D G and D R which have been found in the process step S1.
- This calculation is executed on all prescanned pixels, and a frequency histogram of average density values is generated as shown in Fig. 5, in which the abscissa expresses ranks indicative of respective ranges of the average density value D M and the ordinate expresses the numbers of pixels N p belonging to respective ranks.
- the density values D B' D G and D R for each color component B, G and R of the respective pixels are cumulatively added in each rank of the frequency histogram of average density values.
- This process is executed for each rank independently.
- the number of pixels included in this rank is taken as three, and the density data of the respective pixels are as follows:
- Such process is executed for each rank, so that the cumulative density histogram is obtained for each color component B, G and R. (See the block of process step S102 in Fig. 4. In Fig. 4, each histogram is drawn approximately by a curve. The process steps S101 and S102 are practically executed in parallel.)
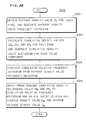
- a cumulative relative frequency histogram as shown in Fig. 7, in which the abscissa expresses the rank values D Mi (i 1 to n) and the ordinate expresses relative frequency RN (%) of pixels cumulatively added from the low density side, is generated from the frequency histogram average density values shown in Fig. 5.
- the histogram values increases from 0% to 100% in the range from a minimum density value D Mmin to a maximum density value D Mmax appearing on the original image.
- the cumulative relative frequency histogram is approximated by a curve on the condition that the rank width is sufficiently small.
- step S104 predetermined values of cumulative density occurrence rates RN H and RN S are applied to the cumulative relative frequency histogram shown in Fig. 7 to find a tentative highlight average density value D MH and a tentative shadow average density value D MS , respectively.
- the values of cumulative density occurrence rates RN H and RN S are previously obtained by an analysis of a large number of sample originals as values for statistically providing optimum highlight and shadow points, which are, for example, 1% and 98%, respectively.
- step S105 noting the region of less than the tentative highlight average density value D MH on the highlight side (D Mmin ⁇ ⁇ D M ⁇ ⁇ D MH ) and the regions of more than the tentative shadow average density value D MS on the shadow side (D MS ⁇ ⁇ D M ⁇ ⁇ D Mmax ) as shown by oblique hatching of Fig. 8 in the cumulative density value histogram for each color component typically shown in Fig. 6, the cumulative density values ⁇ D B , ⁇ D G and ⁇ D R within these ranges are averaged for each color component using respective numbers of pixels belonging thereto.
- the highlight-side average color density values D HAB' D HAG and D HAR and the shadow-side average color density values D SAB , D SAG and D SAR obtained through the above-indicated process step are as follows:
- a highlight reference value D HO and a shadow reference value D SO which are common to the respective color components of B, G and R are found in accordance with the following equations (4) and (5): where functions FH and FS are defined as follows: where:
- MIN( ⁇ ⁇ ⁇ ) is a calculation for selecting a minimum value therein
- MAX( ⁇ ⁇ ⁇ ) is a calculation for selecting a maximum value therein
- D HF and D SF are predetermined standard highlight and shadow density values
- r H and r S are constants preselected in the ranges of O ⁇ r H ⁇ 1 and O ⁇ r S ⁇ 1.
- K H and K S are experimentally predetermined positive constants.
- the functions GH and GS are defined, for example, by the following equations: where: A H is a preselected positive constant, and
- n is a preselected positive constant (e.g., "3").
- the correction amounts ⁇ D HX in the highlight part and the correction amounts ⁇ D SX in the shadow part are proportional to (D HAX -D HO ) and (D SAX -D SO ) respectively.
- the values (D HAX - D HO ) and (D SAX -D SO ) reflect color fogging amounts in the highlight part and in the shadow part respectively.
- the gray balance correction amounts ⁇ D HX in the highlight part are noted, according to the equations (7), (8), (10a) and (10b), the larger the distribution width: of the average density values of the respective color components of B, G and R in the highlight part is, the smaller the gray balance correction amounts ⁇ D HX are. Consequently, when no highlight point is present in the original 1, the gray balance correction amounts in the highlight part can be prevented from growing more than necessary.
- the constant A H is a threshold in a judgement whether a highlight point is present or absent and the aforesaid suppresion in correction is enhanced when the following condision is satisfied:
- step S5 an operator judges whether or not the original 1 requires the color fogging correction only in the shadow part. Since it is not easy to directly judge the color fogging only in the shadow part through visual observation of the original image. Therefore, it is more practical that the operator judges whether the global discoloring of the original 1 is present or absent and considers that a color fogging only in the shadow part is present when no global discoloring is found.
- the dummy shadow density values D DSX need not be completely equal to the shadow density values D SX' but may be set to the values approximate to D SX .
- a nonlinear conversion function f defined by the following expressions (17) to (19) is predetermined and data expressing this function f is stored in the memory 16: where:
- p and q are constants which are set in the vicinity of the lower and upper limits of a normalized density range before masking operation, respectively,
- D is a density value before conversion
- D N is a density value after conversion
- u , v and w are parameters.
- the constants p and q are predetermined for each color component.
- the following parameter values u , v and w are substituted in the expressions (17) to (19) for each color component to specify the conversion characteristic of the function f for each color component.
- Fig. 9 illustrates the function f specified in this manner on a density conversion coordinate plane, where p X and q X are the constants p and q for the color components X.
- a subscript "X" is attached to the density variables D x and D NX to indicate the correspondence to the color components X.
- the characteristics of the function f are described later. Examples of the function f are shown in Fig. 9 as curves C a and C b . The difference between C a and C b is also described later.
- the CPU 15 When the function f is specified for each color component, the CPU 15 generates numerical data expressive of the conversion characteristic of the function f , that is, data expressing numerically the curve C a of Fig. 9, for example.
- the data are loaded to the LUTs 5B, 5G and 5R of Fig. 2 for each color component. This completes the preparation steps of the image data conversion.
- a regular scanning of the original 1 is carried out for the purpose of practically reproducing the image. Since the operation in the regular scanning has been described, the description thereof is omitted, here.
- the conversion curves in the LUTs 5B, 5G and 5R generated in the above-mentioned manner are used for the conversion of the signals D B , D G and D R.
- the conversion curves C a and C b in Fig. 9 substantially passes through a first point Q H defined by the two-dimensional coordinate values (D HX , p X ).
- the conversion curves C a and C b in Fig. 9 pass through a second point Q S defined by the two-dimensional coordinate values (D SX , q X ).
- the former is the second point Q S in the case where the gray balance correction amount ⁇ D SX in the shadow part is a positive value ⁇ D SXa
- the latter is the second point Q S in the case where the correction amount ⁇ D SX is a negative value ⁇ D SXb
- the conversion curves C a and C b extend along the straight line L.
- the conversion curves C a and C b pass through the second point Q S , and the position of the second point Q S is different from that of the third point Q D in the example shown in Fig. 9.
- the conversion curves C a and C b accordingly deviate from the straight line L in the shadow part SDP.
- the deviation amount in the middle density part MDP is larger than that in the highlight part HLP and is not so large as that in the shadow part SDP. Since the deviation amount in the shadow part SDP is set to a value corresponding to the color fogging amount only in the shadow part of the original 1, the conversion curves illustrated by the curves C a and C b of Fig. 9 in this preferred embodiment are the curves capable of eliminating the color fogging only in the shadow part without losing the gray balance in the low and middle density regions.
- the shadow density values D SX and the dummy shadow density values D DSX are set equally when the color fogging only in the shadow part is absent and, for example, the original 1 is globally discolored.
- a straight line L O indicated in Fig. 9 corresponds to the case where the second point Q S is Q Sa' .
- the normalization conversion characteristic represented by the straight line L O is such that the density of a specific color component is restrained in the highlight part HLP, the middle density part MDP and the shadow part SDP to ensure the gray balance among the respective color components, and accordingly, the global discoloring on the original 1 can be corrected.
- the nonlinear function f used in this preferred embodiment is effective for both color fogging correction only in the shadow part and correction of global discoloring on the original 1, thereby being useful for these various corrections.
- the shadow density values D SX and the dummy shadow density values D DSX are set equally to obtain the expression for the straight line from the function f .
- the function f is effective also for this case.
- a second preferred embodiment of the present invention is executable regardless of color fogging correction.
- the basic structure of a color process scanner to which the second preferred embodiment is applied is similar to that of the scanner 100 shown in Figs. 1 and 2.
- the difference of the second preferred embodiment from the first preferred embodiment is only in conversion curves generated in the data processor 14.
- highlight density values D HFX and shadow density values D SFX for a standard original are previously specified.
- the standard original is an original having tone and gradation which are experientially considered to be standard.
- a photograph and the like is employed as an original to be reproduced, a photograph previously confirmed that the same has been obtained under a proper exposure of an image is used as a standard original.
- Highlight and shadow density values for each color component which have been experientially found with respect to the standard original are taken as D HFX and D SFX respectively.
- the expression (31) means that a value: which is proportional to the standard density range width ⁇ D FX and a value: which is proportional to the highlight density value D HX of the original 1 to be reproduced are added to determine the dummy shadow density values D DSX .
- the standard density range width ⁇ D FX and the standard shadow density value D SFX are weightedly averaged by using a weight coefficient K, and the values of the expression (34) thereby obtained are added to the values of the expression (35) to provide the dummy shadow density value D DSX . Advantages due to the determination of the dummy shadow density values D DSX in this manner are described later.
- a conversion curve is generated for each color component in the process step S8 of Fig. 3A. While carrying out the normalization density conversion by the use of the conversion curve for each color component, the original 1 to be reproduced is regularly scanned in the process step S9 for image reproduction.
- the principle itself for recording a halftone dot image in the second preferred embodiment is similar to that in the first preferred embodiment.
- Fig. 11 shows two conversion curves C1 and C2 determined according to the second preferred embodiment.
- the first conversion curve C1 is the curve in the case where the highlight density values D HX1 and the shadow density values D SX 1 are small
- the second conversion curve C2 is the curve in the case where the highlight density values D HX2 and the shadow density values D SX 2 are large. That is, these two conversion curves C1 and C2 are the curves for two types of originals to be reproduced having different density ranges.
- the nonlinear conversion function f defined by the expressions (17) to (19) is used, and thereby the first conversion curve C1 extends along a straight line L1 connecting a highlight point Q H1 and a dummy shadow point Q D1 in the highlight part HLP and the middle density part MDP.
- the curve C1 passes through a shadow point Q S1 .
- the second conversion curve C2 extends along a straight line L2 connecting a highlight point Q H2 and a dummy shadow point Q D2 in the highlight part HLP and the middle density part MDP.
- the curve C2 deviates from the straight line L2 to pass through a shadow point Q S2 in the shadow part SDP.
- the mutual distance ⁇ D DSX between the dummy shadow points Q D1 and Q D2 is K times the mutual distance ⁇ H X between the two highlight points Q H1 and Q H2 .
- This property holds independently of a mutual distance ⁇ S X between the two shadow points D SX1 and D SX2 .
- a density value obtained by converting by the first conversion curve C1 a density value D1 (see Fig. 11) which is larger than the first highlight density value D HX1 by the value ⁇ D T is represented by D NT . Because the straight lines L1 and L2 are parallel to each other as above-mentioned, a density value obtained by converting by the second conversion curve C2 a density value D2 which is larger than the second highlight density value D HX2 by the same value ⁇ D T results in being equal to D NT .
- the normalization conversion according to this preferred embodiment is executed for a plurality of originals to be reproduced having different density ranges respectively, proper reproduced images can be constantly attained independently of the difference in density range.
- the condition that the conversion curves C1 and C2 pass through the respective inherent shadow points Q S1 and Q S2 in the shadow part SDP is satisfied, and thereby the normalization convertion having preferable property over the full range of the density values can be executed.
- Fig. 12 is a graph in which a solid line shows the variation in the dummy shadow density values D DSX according to variation in the constant K .
- This graph is obtained from the equation (31).
- the dummy shadow density value D DSX is the sum of the highlight density value D HX and the standard density range width ⁇ D FX of the original 1 to be reproduced as described above.
- the coefficient K is equal to "1" or is approximate thereto (e.g., 0.5 or more)
- the dummy shadow density value D DSX varies considerably in accordance with the highlight density value D HX of the original 1.
- the coefficient K is 0.5 or less, the dummy shadow density value D DSX approximates to the standard shadow density value D SFX and the dependence on the highlight density value D HX of the original 1 is suppressed.
- Fig. 13 shows a color process scanner 400 into which a scanner unit and a color separation auxiliary device are integrated.
- the scanner 400 also comprises an input unit 401 and an output unit 402.
- An operation panel 403 is mounted on the input unit 401.
- Each circuit inside the color separation auxiliary device 300 of Fig. 1 is contained in the body of the input unit 401 in Fig. 13.
- a CRT 418 and an operation panel 417 of Fig. 13 correspond to the CRT 18 and the console 17 of Fig. 1, respectively.
- the function and operation of the scanner 400 are substantially similar to those of the scanner 100 of Fig. 1.
- the scanner 400 need not be provided with a color separation auxiliary device separately, hence being relatively compact.
- the function f in the expression (17) corresponds to an expression obtained by substituting the following expressions in the equation (43): where g1 and g2 are functions defined by the expressions (18) and (19).
- the normalization conversion is carried out by using the LUTs 5B, 5G and 5R in digital form in the aforesaid preferred embodiments. It may be, however, carried out in analog form by using a function generator.
- the highlight density values D HX and the shadow density values D SX are determined by a statistical method using histograms and the like as described in the aforesaid preferred embodiments, an operator may specify these points, measure the color density thereof and adopt the measured values as D HX and D SX in the case where the highlight point and the shadow point are found in the original 1.
- correction in accordance with the type of a subject image in an original to be processed may be executed.
- a conversion curve C10 before correction becomes a curve C11 after the correction.
- the above-mentioned first preferred embodiment is applied only to color originals.
- the second preferred embodiment is however applicable to both color and monochrome originals.
- a monochrome original a single highlight density value, a single shadow density value and a single dummy shadow density value are determined, and a single conversion curve is obtained.
- the present invention is applied not only to color process scanners, but also to other image processors for executing color separation and other processings on original images.
- a dummy shadow density value is determined in addition to a highlight density value and a shadow density value.
- the configuration of a conversion curve in the highlight part and the middle density part is determined by the highlight density value and the dummy shadow density value.
- the shadow density value is reflected only in the configuration thereof in the shadow part.
- the configuration of the conversion curve in the respective density parts can be controlled together by relatively less parameters. A skilled operator is not required, therefore this method is suitable for automation.
- a dummy shadow density value is obtained for each color component in accordance with color fogging amount only in the shadow part, thereby a conversion curve suitable for eliminating the color fogging only in the shadow part being systematically generated. Since the conversion curve is generated based on such an objectively graspable value, the correction amount of the color fogging can be quantitatively controlled.
- the color fogging is corrected at the time of the normalization conversion.
- the processing characteristics in other circuits in the color separation device is executed on the signal after the color fogging correction. Independently of the presence or absence of the color fogging in the original, the processing characteristics can be determined in these circuits without paying attention to color fogging in the original.
- the present invention only change in parameters in a predetermined function enables the unific handling of color fogging elimination only in the shadow part and correction of global discoloring in an original. Therefore the present invention is suitable for automation of color separation conditions.
- a dummy shadow density value is determined while reflecting the density range width of a standard original.
- Density values having the same differences from the highlight density value can be converted by the normalization conversion into substantially equal or relatively approximate density values in the highlight part and the middle density part independently of the density range of the original to be processed. This method is independent of whether or not it is for the color fogging correction and is applicable to both color and monochrome originals. A proper reproduction character can be always ensured in a reproduced image through the normalization conversion independently of the density range of the original to be processed.
- the dependence of the dummy shadow density value on the standard density range width can be arbitrarily changed by changing the weight coefficient in the weighted average, thereby flexibility thereof being improved.
Applications Claiming Priority (4)
| Application Number | Priority Date | Filing Date | Title |
|---|---|---|---|
| JP308484/89 | 1989-11-28 | ||
| JP30848489 | 1989-11-28 | ||
| JP2287753A JPH0722340B2 (ja) | 1989-11-28 | 1990-10-24 | 正規化曲線生成方法 |
| JP287753/90 | 1990-10-24 |
Publications (3)
| Publication Number | Publication Date |
|---|---|
| EP0430165A2 true EP0430165A2 (fr) | 1991-06-05 |
| EP0430165A3 EP0430165A3 (en) | 1992-03-25 |
| EP0430165B1 EP0430165B1 (fr) | 1995-06-07 |
Family
ID=26556866
Family Applications (1)
| Application Number | Title | Priority Date | Filing Date |
|---|---|---|---|
| EP90122646A Expired - Lifetime EP0430165B1 (fr) | 1989-11-28 | 1990-11-27 | Procédé et appareil pour la génération d'une courbe de conversion utilisable pour convertir la caractéristique de reproduction d'images |
Country Status (3)
| Country | Link |
|---|---|
| US (1) | US5117293A (fr) |
| EP (1) | EP0430165B1 (fr) |
| DE (1) | DE69019923T2 (fr) |
Cited By (10)
| Publication number | Priority date | Publication date | Assignee | Title |
|---|---|---|---|---|
| EP0533100A2 (fr) * | 1991-09-17 | 1993-03-24 | Matsushita Electric Industrial Co., Ltd. | Procédé et appareil de correction de gradation |
| EP0583898A2 (fr) * | 1992-08-04 | 1994-02-23 | International Business Machines Corporation | Système de traitement de données et méthode de réglage des niveaux de gris |
| EP0595353A1 (fr) * | 1992-10-30 | 1994-05-04 | Dainippon Screen Mfg. Co., Ltd. | Procédé et appareil pour générer une courbe de normalisation |
| EP0603908A2 (fr) * | 1992-12-25 | 1994-06-29 | Dainippon Screen Mfg. Co., Ltd. | Méthode et appareil de conversion de signaux d'image |
| EP0612183A1 (fr) * | 1993-02-16 | 1994-08-24 | Fuji Photo Film Co., Ltd. | Procédé pour corriger l'équilibre du gris d'une image en couleur enrégistrée sur un film négatif |
| US5737248A (en) * | 1994-10-05 | 1998-04-07 | Semiconductor Energy Laboratory Co., Ltd. | Device for altering the output conditions of an information processing device according to input states at the user's keyboard |
| WO2000004492A2 (fr) * | 1998-07-15 | 2000-01-27 | Imation Corp. | Systeme et procede d'imagerie |
| EP1351488A2 (fr) * | 2002-03-20 | 2003-10-08 | Eastman Kodak Company | Procédé de traitement numérique d'images en couleur pour la reproduction améliorée d'échelles de tonalité |
| EP1400921A2 (fr) * | 2002-09-19 | 2004-03-24 | Eastman Kodak Company | Amélioration des charactéristiques tonales utilisant les points d'inflexion d'une fonction d'échelle tonale |
| US9350965B2 (en) | 2001-12-29 | 2016-05-24 | Samsung Electronics Co., Ltd. | Apparatus and method of controlling brightness of image |
Families Citing this family (12)
| Publication number | Priority date | Publication date | Assignee | Title |
|---|---|---|---|---|
| JPH04219067A (ja) * | 1990-12-19 | 1992-08-10 | Canon Inc | 画像処理方法 |
| EP0528618B1 (fr) * | 1991-08-21 | 1996-11-06 | Konica Corporation | Appareil de formation d'images |
| US5625705A (en) * | 1994-06-03 | 1997-04-29 | Neuromedical Systems, Inc. | Intensity texture based classification system and method |
| JP3413589B2 (ja) | 1998-03-09 | 2003-06-03 | 富士写真フイルム株式会社 | 画像処理方法および装置 |
| US6804418B1 (en) * | 2000-11-03 | 2004-10-12 | Eastman Kodak Company | Petite size image processing engine |
| US7057768B2 (en) * | 2001-07-02 | 2006-06-06 | Corel Corporation | Automatic color balance |
| US7009733B2 (en) * | 2001-07-02 | 2006-03-07 | Coral Corporation | Manual correction of an image color |
| JP3929057B2 (ja) * | 2004-03-31 | 2007-06-13 | キヤノン株式会社 | 発光強度解析方法及び装置 |
| US7715044B2 (en) * | 2005-03-29 | 2010-05-11 | Xerox Corporation | Two-dimensional gray component replacement |
| DE102008031735B4 (de) * | 2007-07-10 | 2019-11-07 | Heidelberger Druckmaschinen Ag | Graubalancekorrektur eines Druckverfahrens |
| DE102013209433A1 (de) * | 2013-05-22 | 2014-11-27 | Robert Bosch Gmbh | Verfahren und Vorrichtungen zum Bereitstellen von Informationen zu Wartungs- und Servicezwecken einer Batterie |
| JP6241192B2 (ja) * | 2013-10-18 | 2017-12-06 | 株式会社リコー | 画像処理装置、画像処理システム、画像処理方法、プログラム及び記録媒体 |
Citations (4)
| Publication number | Priority date | Publication date | Assignee | Title |
|---|---|---|---|---|
| JPS6349887A (ja) * | 1986-08-19 | 1988-03-02 | Matsushita Electric Ind Co Ltd | 画像変換装置 |
| EP0258740A2 (fr) * | 1986-09-02 | 1988-03-09 | Fuji Photo Film Co., Ltd. | Procédé et appareil de traitement d'images avec correction de gradation du signal d'image |
| EP0352491A1 (fr) * | 1988-06-30 | 1990-01-31 | Dainippon Screen Mfg. Co., Ltd. | Méthode de génération de courbe de correction de gradation pour corriger le caractère de gradation d'une image |
| EP0372390A2 (fr) * | 1988-12-09 | 1990-06-13 | Dainippon Screen Mfg. Co., Ltd. | Procédé et appareil pour l'établissement d'un point de référence sur une courbe de correction de gradation |
Family Cites Families (4)
| Publication number | Priority date | Publication date | Assignee | Title |
|---|---|---|---|---|
| JPS56102853A (en) * | 1980-01-21 | 1981-08-17 | Dainippon Screen Mfg Co Ltd | Metho for pretreating image signal of image copying apparatus |
| EP0286241B1 (fr) * | 1987-03-11 | 1993-02-10 | YAMATOYA & CO., LTD. | Appareil photomécanique utilisant l'analyse photo-électrique |
| JPH0614683B2 (ja) * | 1988-05-13 | 1994-02-23 | 株式会社ヤマトヤ商会 | 画像の階調変換処理法 |
| JP2796718B2 (ja) * | 1988-08-23 | 1998-09-10 | 株式会社ヤマトヤ商会 | 画像の階調変換方法 |
-
1990
- 1990-11-20 US US07/616,189 patent/US5117293A/en not_active Expired - Lifetime
- 1990-11-27 EP EP90122646A patent/EP0430165B1/fr not_active Expired - Lifetime
- 1990-11-27 DE DE69019923T patent/DE69019923T2/de not_active Expired - Fee Related
Patent Citations (4)
| Publication number | Priority date | Publication date | Assignee | Title |
|---|---|---|---|---|
| JPS6349887A (ja) * | 1986-08-19 | 1988-03-02 | Matsushita Electric Ind Co Ltd | 画像変換装置 |
| EP0258740A2 (fr) * | 1986-09-02 | 1988-03-09 | Fuji Photo Film Co., Ltd. | Procédé et appareil de traitement d'images avec correction de gradation du signal d'image |
| EP0352491A1 (fr) * | 1988-06-30 | 1990-01-31 | Dainippon Screen Mfg. Co., Ltd. | Méthode de génération de courbe de correction de gradation pour corriger le caractère de gradation d'une image |
| EP0372390A2 (fr) * | 1988-12-09 | 1990-06-13 | Dainippon Screen Mfg. Co., Ltd. | Procédé et appareil pour l'établissement d'un point de référence sur une courbe de correction de gradation |
Non-Patent Citations (1)
| Title |
|---|
| PATENT ABSTRACTS OF JAPAN vol. 12, no. 264 (P-734)23 July 1988 & JP-A-63 049 887 ( MATUSHITA ELECTRIC IND CO LTD ) 2 March 1988 * |
Cited By (21)
| Publication number | Priority date | Publication date | Assignee | Title |
|---|---|---|---|---|
| EP0533100A3 (fr) * | 1991-09-17 | 1993-05-19 | Matsushita Electric Industrial Co., Ltd. | Procédé et appareil de correction de gradation |
| US5296920A (en) * | 1991-09-17 | 1994-03-22 | Matsushita Electric Industrial, Co., Ltd. | Color gradation correction method and apparatus |
| EP0533100A2 (fr) * | 1991-09-17 | 1993-03-24 | Matsushita Electric Industrial Co., Ltd. | Procédé et appareil de correction de gradation |
| US5469275A (en) * | 1992-08-04 | 1995-11-21 | International Business Machines Corporation | Method and apparatus for grayscale adjustment |
| EP0583898A2 (fr) * | 1992-08-04 | 1994-02-23 | International Business Machines Corporation | Système de traitement de données et méthode de réglage des niveaux de gris |
| EP0583898A3 (en) * | 1992-08-04 | 1994-06-08 | Ibm | Data processing system and method for greyscale adjustment |
| EP0595353A1 (fr) * | 1992-10-30 | 1994-05-04 | Dainippon Screen Mfg. Co., Ltd. | Procédé et appareil pour générer une courbe de normalisation |
| EP0603908A3 (fr) * | 1992-12-25 | 1996-02-07 | Dainippon Screen Mfg | Méthode et appareil de conversion de signaux d'image. |
| EP0603908A2 (fr) * | 1992-12-25 | 1994-06-29 | Dainippon Screen Mfg. Co., Ltd. | Méthode et appareil de conversion de signaux d'image |
| US5475493A (en) * | 1993-02-16 | 1995-12-12 | Fuji Photo Film Co., Ltd. | Gray balance correcting method |
| EP0612183A1 (fr) * | 1993-02-16 | 1994-08-24 | Fuji Photo Film Co., Ltd. | Procédé pour corriger l'équilibre du gris d'une image en couleur enrégistrée sur un film négatif |
| US5737248A (en) * | 1994-10-05 | 1998-04-07 | Semiconductor Energy Laboratory Co., Ltd. | Device for altering the output conditions of an information processing device according to input states at the user's keyboard |
| WO2000004492A2 (fr) * | 1998-07-15 | 2000-01-27 | Imation Corp. | Systeme et procede d'imagerie |
| WO2000004492A3 (fr) * | 1998-07-15 | 2001-10-25 | Imation Corp | Systeme et procede d'imagerie |
| US9350965B2 (en) | 2001-12-29 | 2016-05-24 | Samsung Electronics Co., Ltd. | Apparatus and method of controlling brightness of image |
| EP1351488A2 (fr) * | 2002-03-20 | 2003-10-08 | Eastman Kodak Company | Procédé de traitement numérique d'images en couleur pour la reproduction améliorée d'échelles de tonalité |
| EP1351488A3 (fr) * | 2002-03-20 | 2004-10-27 | Eastman Kodak Company | Procédé de traitement numérique d'images en couleur pour la reproduction améliorée d'échelles de tonalité |
| US7085008B2 (en) | 2002-03-20 | 2006-08-01 | Eastman Kodak Company | Digital color image processing method for improved tone scale reproduction |
| EP1400921A3 (fr) * | 2002-09-19 | 2005-11-23 | Eastman Kodak Company | Amélioration des charactéristiques tonales utilisant les points d'inflexion d'une fonction d'échelle tonale |
| US7158686B2 (en) | 2002-09-19 | 2007-01-02 | Eastman Kodak Company | Enhancing the tonal characteristics of digital images using inflection points in a tone scale function |
| EP1400921A2 (fr) * | 2002-09-19 | 2004-03-24 | Eastman Kodak Company | Amélioration des charactéristiques tonales utilisant les points d'inflexion d'une fonction d'échelle tonale |
Also Published As
| Publication number | Publication date |
|---|---|
| EP0430165A3 (en) | 1992-03-25 |
| US5117293A (en) | 1992-05-26 |
| DE69019923T2 (de) | 1995-10-19 |
| EP0430165B1 (fr) | 1995-06-07 |
| DE69019923D1 (de) | 1995-07-13 |
Similar Documents
| Publication | Publication Date | Title |
|---|---|---|
| EP0430165B1 (fr) | Procédé et appareil pour la génération d'une courbe de conversion utilisable pour convertir la caractéristique de reproduction d'images | |
| US4931864A (en) | Image forming apparatus which performs gamma correction on the basis of a cumulative frequency distribution produced from a histogram of image data representing a selected area of an image | |
| US6118547A (en) | Image processing method and apparatus | |
| US6229625B1 (en) | Apparatus for determining image processing parameter, method of the same, and computer program product for realizing the method | |
| US5870491A (en) | Image processing apparatus which controls processing conditions of an image signal on detected features of the image signal | |
| US5018008A (en) | Method of and appartus for setting color separation | |
| US7081918B2 (en) | Image processing method, image processing apparatus and recording medium storing program therefor | |
| US5162899A (en) | Color data correction apparatus ultilizing neural network | |
| US6359703B1 (en) | Image processing apparatus and method | |
| US6417932B1 (en) | Image processor | |
| US5164837A (en) | Method of correcting setup parameter decision characteristics and automatic setup apparatus using a neural network | |
| EP0595353B1 (fr) | Procédé et appareil pour générer une courbe de normalisation | |
| US6734899B1 (en) | Method of establishing color correction functions | |
| US5268753A (en) | Color image forming apparatus and method thereof with color-correcting operation | |
| US5677967A (en) | Method of and apparatus for converting between a color appearance space and a colorant space | |
| US20020008762A1 (en) | Method, apparatus and recording medium for image processing | |
| EP0442369B1 (fr) | Circuit de correction de gradation | |
| US6744920B1 (en) | Method, apparatus, and recording medium for processing image data to obtain color-balance adjusted image data based on white-balance adjusted image data | |
| JPS6368863A (ja) | 原画の複製方法及び装置 | |
| JPH0832827A (ja) | ディジタル画像の階調補正装置 | |
| US7034959B1 (en) | Method, apparatus and recording medium for image processing | |
| US5724443A (en) | Color image forming apparatus | |
| US6433898B1 (en) | Method and apparatus for the conversion of color values | |
| US5406394A (en) | Color reproducing method used in an image data processing system comprising independent input and output devices | |
| EP0603908A2 (fr) | Méthode et appareil de conversion de signaux d'image |
Legal Events
| Date | Code | Title | Description |
|---|---|---|---|
| PUAI | Public reference made under article 153(3) epc to a published international application that has entered the european phase |
Free format text: ORIGINAL CODE: 0009012 |
|
| AK | Designated contracting states |
Kind code of ref document: A2 Designated state(s): DE FR GB |
|
| PUAL | Search report despatched |
Free format text: ORIGINAL CODE: 0009013 |
|
| AK | Designated contracting states |
Kind code of ref document: A3 Designated state(s): DE FR GB |
|
| 17P | Request for examination filed |
Effective date: 19920626 |
|
| 17Q | First examination report despatched |
Effective date: 19940418 |
|
| GRAA | (expected) grant |
Free format text: ORIGINAL CODE: 0009210 |
|
| AK | Designated contracting states |
Kind code of ref document: B1 Designated state(s): DE FR GB |
|
| PG25 | Lapsed in a contracting state [announced via postgrant information from national office to epo] |
Ref country code: FR Effective date: 19950607 |
|
| REF | Corresponds to: |
Ref document number: 69019923 Country of ref document: DE Date of ref document: 19950713 |
|
| EN | Fr: translation not filed | ||
| PLBE | No opposition filed within time limit |
Free format text: ORIGINAL CODE: 0009261 |
|
| STAA | Information on the status of an ep patent application or granted ep patent |
Free format text: STATUS: NO OPPOSITION FILED WITHIN TIME LIMIT |
|
| 26N | No opposition filed | ||
| REG | Reference to a national code |
Ref country code: GB Ref legal event code: IF02 |
|
| PGFP | Annual fee paid to national office [announced via postgrant information from national office to epo] |
Ref country code: DE Payment date: 20081120 Year of fee payment: 19 |
|
| PGFP | Annual fee paid to national office [announced via postgrant information from national office to epo] |
Ref country code: GB Payment date: 20081126 Year of fee payment: 19 |
|
| GBPC | Gb: european patent ceased through non-payment of renewal fee |
Effective date: 20091127 |
|
| PG25 | Lapsed in a contracting state [announced via postgrant information from national office to epo] |
Ref country code: DE Free format text: LAPSE BECAUSE OF NON-PAYMENT OF DUE FEES Effective date: 20100601 |
|
| PG25 | Lapsed in a contracting state [announced via postgrant information from national office to epo] |
Ref country code: GB Free format text: LAPSE BECAUSE OF NON-PAYMENT OF DUE FEES Effective date: 20091127 |