EP0488422B1 - Apparatus for reading fluorescent-labelled gel electrophoresis patterns - Google Patents
Apparatus for reading fluorescent-labelled gel electrophoresis patterns Download PDFInfo
- Publication number
- EP0488422B1 EP0488422B1 EP91120663A EP91120663A EP0488422B1 EP 0488422 B1 EP0488422 B1 EP 0488422B1 EP 91120663 A EP91120663 A EP 91120663A EP 91120663 A EP91120663 A EP 91120663A EP 0488422 B1 EP0488422 B1 EP 0488422B1
- Authority
- EP
- European Patent Office
- Prior art keywords
- light
- electrophoresis
- fluorescence
- gel
- gel member
- Prior art date
- Legal status (The legal status is an assumption and is not a legal conclusion. Google has not performed a legal analysis and makes no representation as to the accuracy of the status listed.)
- Expired - Lifetime
Links
Images


Classifications
-
- G—PHYSICS
- G01—MEASURING; TESTING
- G01N—INVESTIGATING OR ANALYSING MATERIALS BY DETERMINING THEIR CHEMICAL OR PHYSICAL PROPERTIES
- G01N27/00—Investigating or analysing materials by the use of electric, electrochemical, or magnetic means
- G01N27/26—Investigating or analysing materials by the use of electric, electrochemical, or magnetic means by investigating electrochemical variables; by using electrolysis or electrophoresis
- G01N27/416—Systems
- G01N27/447—Systems using electrophoresis
- G01N27/44704—Details; Accessories
- G01N27/44717—Arrangements for investigating the separated zones, e.g. localising zones
- G01N27/44721—Arrangements for investigating the separated zones, e.g. localising zones by optical means
Definitions
- the present invention relates to an apparatus for reading fluorescent-labelled gel electrophoresis patterns according to the preamble of claim 1, which is appropriate for the comparison of a plurality of electrophoresis patterns comprising samples labelled with fluorescent pigments having a different fluorescent wavelength, which have been subjected to electrophoresis simultaneously with each other.
- the analytical method of electrophoresis using labels with a radioactive isotope has been employed for analyzing the sequence of various genes, including the diagnosis of hereditary diseases deriving from genes, the structures of proteins such as amino acids, etc.
- the electrophoresis is a method for analyzing samples by labelling or replacing fragments of a sample with or by a radioactive isotope, subjecting the fragments of the sample to gel electrophoresis, and analyzing the pattern of distribution of the fragments of the sample developed by means of the electrophoresis.
- the human genome DNA consists of approximately 3 ⁇ 10 9 base pairs, the sequence of the bases is generally constant among the human beings, although there are deviations in the sequence of the bases among individuals. These deviations are called polymorphism of DNAs.
- the polymorphism of DNAs is seen in the non-hereditary region as well as in the hereditary region, and the polymorphism of DNAs appears in many cases as a polymorphism of proteins that is the phenotype of the polymorphism of DNAs.
- a variety of variations as seen among the human beings, such as the blood types, histocompatibility antigens, the difference of skin and hair colors among peoples, etc., are based on the polymorphism of DNAs.
- the polymorphism of the DNAs has been created on the basis of variations that have been accumulated in the DNAs of the genocytes of human groups up to the present time from the time when the human beings developed as an individual biological species in the course of the evolution.
- the pathologic state is called a hereditary disease. It is said that there are currently more than 3,000 kinds of hereditary diseases in the human group.
- the nosogenesis of hereditary diseases is an abnormality appearing on the DNA sequence.
- a disease can be recognized for the first time in several stages ranging from DNA through mRNA and proteins to pathogenic phenotype.
- the diagnosis as a disease is conducted usually in the last stage, and the diagnosis can be implemented at the DNA level or at the protein level if the disease would occur simply in the course of the several stages as described hereinabove.
- Southern blotting The basic technique for the diagnosis of DNAs is called Southern blotting; this method basically consists of six steps:
- DNAs extracted from any organ are employed, and the sample required for that purpose is usually peripheral blood in an amount of the order of several milliliters. DNAs are extracted from the leukocytes separated from the peripheral blood as the sample. Approximately five days are usually required from step 1 to step 6.
- a fraction pattern of a person tested is compared with a fraction pattern of a normal person. The person tested is decided as being normal when the fraction pattern of the person tested is determined to be identical with the fraction pattern of the normal person.
- JP-A-61-62 843/1986 discloses an electrophoresis apparatus capable of detecting a minute quantity of a sample labelled with a fluorescent pigment.
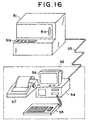
- Fig. 16 is a perspective view showing the appearance of a conventional electrophoresis apparatus of the fluorescent type.
- the electrophoresis apparatus comprises an electrophoresis and instrumentation unit 51 for implementing electrophoresis of a sample and measuring the distribution of fluorescence, a data processor 52 for performing data processing on the basis of measured data, and a cable 53 connecting the electrophoresis and instrumentation unit 51 to the data processor 52.
- the electrophoresis and instrumentation unit 51 has a door 5la through which are poured a gel serving as a base for performing electrophoresis for DNA fragments and a predetermined quantity of a sample for electrophoresis.
- the data processor 52 comprises a computer body 54, a keyboard 55 for entering an instruction from the operator, a display unit 56 for displaying the processing state and results, and a printer 57 for recording the processed results.
- Fig. 17 is a block diagram showing the configuration inside the electrophoresis and instrumentation unit 51.
- the overall configuration of the electrophoresis and instrumentation unit 51 (Fig. 16) comprises an electrophoresis unit section 63 and a signal processor unit section 64.
- the electrophoresis unit section 63 comprises an electrophoresis section 5 for implementing electrophoresis, a first electrode 2a and a second electrode 2b each for applying voltage to the electrophoresis section 5, a support plate 3 for supporting the electrophoresis section 5 as well as the first and second electrodes 2a and 2b, a power supply unit 4 for applying voltage to the electrophoresis section 5, a light source 11 for emitting light for exciting a fluorescent substance, an optical fiber 12 for leading the light from the light source 11, a light collector 14 of an optical system 13 for condensing and collecting fluorescence 13 generated by the fluorescent substance, an optical filter 15 for selectively passing light having a particular wavelength therethrough, and an optical sensor 16 for converting the condensed light into electric signals.
- the signal processor unit section 64 comprises an amplifier 17 for amplifying the electric signals from the optical sensor 16, an analog-digital converting circuit 18 for converting analog signals of the electric signals into digital data, a signal processing section 19 for pre-processing the digital data, for example, by performing addition average processing or the like, an interface 20 for implementing interface processing for feeding the pre-processed data to an external data processor, and a control circuit 10 for implementing overall control of the electrophoresis unit section and the signal processing system.
- the digital signal OUT generated from the signal processor unit section 64 is transmitted to the data processing unit 52 (Fig. 16), thereby implementing the data processing such as analysis processing and so on.
- a gel is poured into the electrophoresis section 5 disposed within the electrophoresis and instrumentation unit 51 and thereafter a sample of DNA fragments labelled with a fluorescent substance is poured thereinto.
- a switch of the instrument panel 51b is pressed to give an instruction to start electrophoresis, then voltage is applied from the first and second electrodes 2a and 2b of the power supply unit 4 to the electrophoresis section 5, thereby starting the electrophoresis.
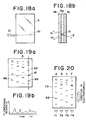
- the sample labelled with the fluorescent substance migrates, for example, in lanes 71, 72, 73 and 74, as shown in Fig.
- bands 66 are detected in a manner as shown in Figs. 18a and 18b by leading light from the light source through the optical fiber 12 to a light path 61 and irradiating the gel on the light path 61 with the light, exciting the labelled fluorescent substance concentrated on the bands 66 in the gel to generate fluorescence light 13, and detecting the fluorescence light 13.
- the fluorescence light 13 corresponds to the fluorescent substance in an extremely low concentration of approximately 10 -16 mole per band, the quantity of fluorescence being dependent upon the extinction coefficient of the fluorescent substance used, the quantum efficiency thereof, the intensity of the exciting light, etc.
- fluorescein isothiocyanate has a peak of the excitation wavelength at 490 nm, a peak of its fluorescent wavelength at 520 nm, an extinction coefficient of 7 ⁇ 10 4 mole -1 ⁇ mole -1 , and a quantum efficiency of approximately 0.65.
- fluorescein isothiocyanate employed is present in a concentration of 10 -16 mole per band, the fluorescence generated contains photons of the order as low as 10 10 /s, when calculated assuming the use of an argon ion laser of a wavelength of 488 nm at an output of 1 mW for exciting the fluorescent substance, although it may vary to some extent with the thickness of the gel or the like.
- the electrophoresis section 5 comprises a gel member 5a composed of polyacrylamide or the like and gel supporting members 5b and 5c, each made of glass for supporting the interposed gel member 5a from both sides.
- a sample of DNA fragments is poured into the gel member 5a of the electrophoresis section 5 from its upper portion, and the electrophoresis is carried out by applying the electrophoresis voltage to the first electrode 2a and the second electrode 2b (Fig. 17).
- the fluorescent substance contained in the bands of the electrophoresis pattern in the gel member 5a along the light path 61 is irradiated with rays of light sent out from the light source, such as laser light, which pass through the optical fiber 12 onto the light path 61 of the gel member 5a.
- the fluorescent substance present on the light path 61 to be excited to emit fluorescence light 13 that is led to a light collector 14 of optics consisting of a combination of lenses and then selected by the optical filter 15 after having been condensed, followed by conversion into electric signals by means of a one-dimensional optical sensor 16.
- the light is amplified 10 4 to 10 5 times with an image intensifier or the like, and the image is converted into electric signals by the optical sensor 16, such as a one-dimensional optical sensor of CCD type or the like.
- the electrical signals converted by the optical sensor 16 are then amplified to signals of a desired level by the amplifier 17, and the analog signals are converted into digital signals by the analog-digital converting circuit 18, followed by transmission to the signal processing section 19.
- the digital signals transmitted from the analog-digital converting circuit (A/D) 18 are then subjected to signal processing, such as addition average processing, or the like, in order to improve the signal-to-noise ratio (S/N ratio), and the resulting digital data are transmitted to the data processor unit section 52 through the interface 20.
- signal processing such as addition average processing, or the like, in order to improve the signal-to-noise ratio (S/N ratio)
- Figs. 19a and 19b are schematic representations for describing an example of signals of a pattern indicative of the fluorescence intensity of DNA fragments transmitted from the electrophoresis and instrumentation unit 51.
- the fluorescent substance present on the light path 61 is excited upon irradiation of the gel member 5a of the electrophoresis section 5 with the laser light in the course of the electrophoresis, thereby emitting fluorescence.
- the fluorescence is detected at predetermined positions of each lane in the direction of electrophoresis, as indicated by 62, as the time of electrophoresis elapses.
- the fluorescence is detected as the bands 66 of each lane pass through the positions of the light path 61, thereby detecting a pattern signal of fluorescence intensity in each of the lanes, as shown in Fig. 19b.
- the pattern signal of the fluorescence intensity as shown in Fig. 19b represents a pattern signal indicating the magnitude of fluorescence intensity of the bands 66 located in the direction of electrophoresis, as indicated by 62.
- the computer body 54 of the data processing unit 52 implements data processing for comparing molecular weights and determining the sequence of bases of a DNA on the basis of data of the pattern indicative of the fluorescence intensity in response to data of the pattern signals for the fluorescence intensity of the DNA fragments transmitted from the electrophoresis and instrumentation unit 51.
- the sequence of the bases and so on determined by the data processing is symbolized and then generated, thereby displaying the symbolized data on a display screen by the display unit 56 or printing it out by the printer 57.
- JP-A-1-167,649/1989 discloses another example of an apparatus capable of reading a fluorescent electrophoresis pattern.
- This apparatus is of such a type that the fluorescent pattern of the electrophoresis section is read as a whole after the end of the electrophoresis, unlike the aforesaid electrophoresis apparatus which reads the distribution of the fluorescent pattern passing through a reading section in the course of the electrophoresis.
- the gel electrophoresis method employed for the electrophoresis pattern reading apparatus on the basis of the fluorescence detection method is the same as the gel electrophoresis method which has been employed for the conventional apparatus in which the sample is labelled with a radioactive isotope.
- the gel electrophoresis method may cause a warp in the electrophoresis pattern because the speed of migration of the bands may vary with the position of the electrophoresis plate due to irregularities of the temperature within the gel and for other reasons, thereby causing a warp in the electrophoresis pattern.
- the electrophoresis and instrumentation unit for implementing electrophoresis and simultaneously measuring the distribution of the fluorescent substance passing through the reading unit adopts two-dimensional electrophoresis, it requires one-dimensional electrophoresis to be implemented by one device and two-dimensional electrophoresis to be conducted by another device, so that this operation is laborious.
- DE-A-4 011 730 relates to a fluorescent-type gel electrophoresis apparatus wherein a plurality of fluorescent substances may be used for labelling the samples.
- the pattern reading is carried out during the electrophoretic separation, the different fluorescence wavelength components being discriminated through band pass filters.
- the gel layer is irradiated laterally from one of the edges, and the fluorescence light is detected in the direction of the gel layer.
- EP-A-0 314 045 discloses a fluorescent-type gel electrophoresis apparatus similar to that of DE-A-40 11 730, where the excitation light is also irradiated laterally into the gel, and the measurement of the fluorescence light is carried out during the electrophoresis.
- the wavelength-dispersive element of this system is a direct-vision prism combined with a two-dimensional fluorescence detector.
- EP 0 294 524 deals with a real-time scanning electrophoresis apparatus of the fluorescent type.
- the gel pattern is scanned with a light beam, and the different fluorescence light components are discriminated by optical filters.
- this prior art system reads the electrophoresis pattern during electrophoresis, the optical system being mounted on a translational stage for moving the system parallel to the planar gel across the lanes.
- the light source means are a light source for generating irradiating light for emitting fluorescence by exciting two or more fluorescent substances labelled separately on the samples.
- a plurality of light sources may be provided to generate a mixed light.
- the light source means may be a single light source when the light resulting from the single light source has a predetermined range of wavelengths.
- the light scanning means are arranged to scan the irradiated light from the light source means and to irradiate in the direction of the thickness of the gel.
- the light receiving means have their light receiving surface set in a direction different from the optical axis of the irradiated light and are designed so as to receive the fluorescence from the electrophoresis pattern separated from the scattered light from the reading surface due to the spatial position relationship of the light receiving path.
- the optical filter means can separate the optical signals of the fluorescence received by the light receiving means into a plurality of fluorescence wavelengths.
- the optoelectric conversion means generate the electric signals by optoelectrically converting each of the optical signals separated by the optical filter means, and the amplifier means amplify very faint electrical signals by implementing an integration operation corresponding to the scanning of the irradiated light and generating the electric signals of fluorescence from the electrophoresis pattern one after another.
- the speed of the integration operation is so arranged as to correspond to the speed at which the irradiated light is scanned, thereby allowing a very faint fluorescence output to be amplified in an efficient way.
- the electrophoresis pattern reading apparatus having the configuration as described above can read the distribution of the fluorescent substances by the differences in the wavelength of fluorescence inherent in the fluorescent pigments from the electrophoresis pattern of the samples. Further, the electrophoresis pattern reading apparatus according to the present invention allows all the samples, including the comparative sample, to undergo an equal degree of warp due to electrophoresis, so that the electrophoresis results can be read without paying attention to the warp originating from electrophoresis.
- Fig. 1 is a schematic representation showing the overall configuration of the electrophoresis pattern reading apparatus of fluorescent type according to an embodiment of the present invention.
- Fig. 2 is a block diagram showing the configuration of the essential portion of the instrumentation section body.
- Fig. 3 is a view showing the position in which an electrophoresis unit to be mounted to the instrumentation section body.
- Fig. 4 is a view showing the light scanning mechanism for scanning a gel surface with laser beams by using a vibrating mirror.
- Fig. 5 is a graph showing the relationship between the angles of rotation of the vibrating mirror and the distance in which spot light of the laser beams moves.
- Fig. 6 is a block diagram showing the configuration of the essential portion of the control circuit for controlling a mirror driver for controlling the rotation of the vibrating mirror.
- Fig. 7 is a schematic representation showing the detail configuration of the optic system in a light collector.
- Fig. 8 is a schematic representation showing an example of the detail configuration of the optic system in the optoelectric conversion section.
- Fig. 9 is a schematic representation showing another example of the detail configuration of the optic system in the optoelectric conversion section.
- Fig. 10 is a circuit diagram showing the circuit configuration of an amplifier containing an integral circuit.
- Fig. 11 is a time chart showing the timing of reading operations by the amplifier.
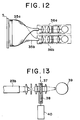
- Fig. 12 is a schematic representation showing another example of the configuration of the light collector for detecting plurally separated wavelength components of fluorescence and the optoelectric conversion section.
- Fig. 13 is a schematic representation showing an example of the configuration of the optoelectric conversion section to be employed when an optic filter is mechanically moved to change the wavelength component of fluorescence to be selected.
- Fig. 14 is a schematic representation showing an example of the configuration of the light source in which plural kinds of excited light having different wavelength are united into one beam.
- Fig. 15 is a schematic representation showing an example of output of an electrophoresis pattern obtained by reading the results of two-dimensional electrophoresis of a sample of a protein with the multi-colored electrophoresis pattern reading apparatus.
- Fig. 16 is a perspective view showing an outlook of a conventional electrophoresis apparatus of a fluorescent type.
- Fig. 17 is a block diagram showing the configuration of the inside of the electrophoresis and instrumentation unit of the conventional electrophoresis pattern reading apparatus.
- Figs. 18a and 18b are elevational view and a longitudinally sectional view showing the electrophoresis unit, respectively, in order to describe the principle of the operations for detecting the electrophoresis pattern by the fluorescence method.
- Fig. 19a is a schematic representation showing an example of a pattern of DNA fragments and Fig. 19b is a graph showing an example of signals of fluorescent intensity pattern of the DNA fragments to be generated from the electrophoresis and instrumentation unit.
- Fig. 20 is a schematic representation showing an example of distribution of DNA fragments electrophoresed.
- Fig. 1 is a schematic representation showing an overall configuration of the electrophoresis pattern reading apparatus of a fluorescent type according to an embodiment of the present invention.
- the multi-colored electrophoresis pattern reading apparatus of a fluorescent type comprises a combination in which an electrophoresis unit 1 is connected to a reading unit 6 disposed separately from the electrophoresis unit.
- the electrophoresis unit 1 comprises an electrophoresis unit section 5, a first electrode 2a, a second electrode 2b, a supporting plate member 3, and a power plant 4 for electrophoresis.
- the electrophoresis unit section 5 consists of a gel member serving as a base for electrophoresis and a gel support member for supporting the gel member by a glass panel or the like for interposing the gel member and it is mounted to the first and second electrodes 2a and 2b which in turn apply electrophoresis voltage to the electrophoresis unit section 5.
- the supporting plate member 3 is arranged to support the electrophoresis unit section 5 as well as the first and second electrodes 2a and 2b.
- the power plant 4 is to supply the electrophoresis voltage.
- the electrophoresis unit section 5 is composed of the gel member for developing a sample for electrophoresis, such as polyacryl amide or the like, and the gel support member for supporting the gel member interposed from both sides by the glass plate panels or the like (see Figs. 18a and 18b).
- a sample of DNA fragments to be electrophoresed is fed from an upper portion of the gel member of the electrophoresis unit section 5, the electrophoresis voltage is applied to the first and second electrodes 5a and 5b from the power plant 4, thereby enabling electrophoresis of the sample to give an electrophoresis pattern.
- the electrophoresis unit section 5 is removed or detached from the electrophoresis unit 1 after electrophoresis has been finished and mounted to the reading unit 6 for reading the resulting electrophoresis pattern.
- the electrophoresis unit section 5 is mounted to an instrumentation unit body 7 of the reading unit in a state in which it is removed or detached from the electrophoresis unit 1 or in a state in which only the gel member is removed from the electrophoresis unit section 5, the resulting electrophoresis pattern is read and data is then processed by the reading unit 6.
- the reading unit 6 has the instrumentation unit body 7 as an essential portion, and a data processor 8, an image printer 9 and other accessories are mounted to the instrumentation unit body 7.
- the data processor 8 is arranged to implement data processing, image processing and determination processing for the data resulting from the electrophoresis pattern read by the instrumentation unit body 7.
- the image printer 9 is to process and print the read electrophoresis pattern data out.
- the instrumentation unit body 7 has a reading table disposed immediately below a lid 7a mounted at the upper portion of the instrumentation unit body for reading the electrophoresis pattern from the electrophoresis unit section 5 consisting of the gel member and the gel support member, wherein the electrophoresis is performed.
- the lid 7a disposed at the upper portion of the instrumentation unit body 7 is opened and the electrophoresis unit section 5 is then mounted to the reading table.
- the lid 7a After mounting the electrophoresis unit section 5 to the reading table, the lid 7a is closed and a start switch for starting the reading of the electrophoresis pattern on an operational display panel 7b of the instrumentation unit body 7 is pressed, thereby starting reading the electrophoresis pattern of the gel member of the electrophoresis unit section 5.
- the reading of the electrophoresis pattern starts, the scanning of the irradiating light from a spot light source built in the instrumentation unit body 7 is started and the gel member of the electrophoresis unit section 5 is irradiated with the light for exciting a fluorescent substance, thereby emitting fluorescence. The fluorescence emitted upon irradiation with the light is received, and a pattern of distribution of the fluorescent substance is measured.
- the data processor 8 implements data processing the data read and measured by the instrumentation unit body 7 and further controls the instrumentation unit body 7 itself.
- the processed data is printed out by the image printer 9.
- the image printer 9 to be employed is of a type as capable of printing with a plurality of colors, thereby permitting the electrophoresis patterns to be printed out with multiple colors so as to correspond to the samples.
- Fig. 2 is a block diagram showing the configuration of the essential portion of the instrumentation unit body 7
- Fig. 3 is a view showing the position in which an electrophoresis unit to be mounted to the instrumentation section body 7.
- the samples of DNA fragments labelled with the fluorescent pigments or fluorescent substances are subjected to electrophoresis with the electrophoresis unit 1 for a predetermined period of time, for example, as long as approximately 5 hours.
- the electrophoresis unit section 5 is detached from the electrophoresis unit 1 and the gel member of the electrophoresis unit section 5 removed therefrom is then mounted to an upper portion of the reading table 7c through the lid 7a of the instrumentation unit body 7 of the reading unit 6, as shown in Fig.
- the gel member in such a state that the gel member is still interposed with the gel support member, such as glass plates, or that the gel support member is detached from the electrophoresis unit section 5. Then, the lid 7a is closed, thereby finishing the setting of the electrophoresis sample to the reading unit.
- the gel member When no gel member is yet labelled with the fluorescent pigment after electrophoresis, the gel member may be labelled therewith in this stage of mounting the electrophoresis pattern. The gel may be dried before mounting to the reading table.
- operations are performed for instructing the start of reading the electrophoresis pattern by pressing the read starting switch of the operation display panel 7b or by giving an instruction to start reading from the data processor 8.
- the state of mounting the electrophoresis unit section 5 to the instrumentation unit body 7 is transmitted through a control signal line to the data processor 8 which in turn controls the operations of the reading unit section of the instrumentation unit body 7 in accordance with the state of mounting the electrophoresis unit section 5.
- parameters such as reading speed and so on during operations may be set and registered in advance on the side of the data processor 8, thereby allowing the operations for starting the reading to be performed automatically and reducing burdens for operating the switches on the side of an operator.
- the read data on the distribution of the fluorescent pigments is transmitted to the data processor 8 which in turn implements desired processing programmed in advance, such as processing for detecting a peak of the intensity of fluorescence, electrophoresis distance, and so on.
- desired processing such as processing for detecting a peak of the intensity of fluorescence, electrophoresis distance, and so on.
- the data of the processed results is printed out, when needed, by the image printer 9 as image having a shade of color in accordance with the intensity of fluorescence or as image in which the intensity of fluorescence is divided by contour lines, colors or concentrations of color.
- the image having the shade of color in accordance with the intensity of fluorescence looks equal to an X-ray film image of data obtained by labelling the sample with a radioactive isotope in conventional manner and subjecting the sample to electrophoresis.
- the data of the results after data processing may be stored, when needed, as digital data in a magnetically or optically recording device.
- laser beams, as indicated by 31, emitted from the light source 21 are scanned in the direction from the front to the rear in the drawing with the vibrating mirror 22 to be driven by the mirror driver 30 and the gel member as an object of reading is exposed to the laser beams 31.
- the spot lights of the laser beams 31 scanned by the vibrating mirror 22 irradiates the gel member of the electrophoresis unit section 5 in the direction of thickness of the gel member thereof while moving.
- the gel member of the electrophoresis unit section 5 emits fluorescence upon irradiation with the spot lights of the scanned laser beams 31, and the resulting fluorescence, as indicated by 31, with the spot lights of the laser beams, as indicated by 31, and the resulting fluorescence is received by the light collector 23.
- the light collector 23 is arranged to have a light path for receiving fluorescence 13 having an optic axis so as to be deviated from the optic axis of the spot light thrown on the electrophoresis unit section 5 and the optical lens system is arranged in a spatial position relationship of the light path for receiving the fluorescence 13 so as to receive the fluorescence, as indicated by 13, with enhanced sensitivity to separate from the scattered light emitted from the irradiated surface of the electrophoresis unit section 5.
- the light received by the light collector 23 is converted into electric signals by the optoelectric conversion section 24 and then amplified by the amplifier 25.
- An optic trap 32 is mounted on the side opposite to the surface of the electrophoresis unit section 5 to be irradiated with the laser beams 31 in order for the laser beams 31, as stray light, to cause no adverse influence upon the surface of the electrophoresis unit section 5 after transmission through the gel member.
- the light collector 23 receives the fluorescence 13 through the optoelectric conversion section 24 with enhanced sensitivity to receiving of the fluorescence 13 to be detected, and the fluorescence 13 received is then converted through the optoelectric conversion section 24 into electric signals which in turn are amplified by the amplifier 25 and entered into the analog-digital conversion circuit 26, whereby the electric signals are converted into digital data.
- the signals detected from the fluorescence and converted into digital data is stored by the memory 28 and transmitted to the data processor 8 through the interface 29. The overall control over a series of signal processing is carried out by the control circuit 27.
- Fig. 4 is a view showing the light scanning mechanism for scanning a gel surface with laser beams by using the vibrating mirror
- Fig. 5 is a graph showing the relationship between the angles of rotation of the vibrating mirror and the distance in which spot light of the laser beams moves.
- the light source 21 and the vibrating mirror 22 are disposed in the positions relative to the electrophoresis unit section 5.
- This causes the difference in sensitivity to detect fluorescence to be detected between the central portion of the sample of the electrophoresis unit section 5 and its end portion.
- the speed of driving the vibrating mirror 22 is corrected in order to move the spot light of the laser beams at an equal speed on the gel member of the electrophoresis unit section 5.
- the relationship between the position X of the spot light and the angle ⁇ of the vibrating mirror 22 is set as shown in Fig. 5.
- the angle of rotation and the distance of travel for the light scanning mechanism of this type may be corrected by a f ⁇ lens, however, the f ⁇ lens is expensive and the unit for mounting the f ⁇ lens becomes heavy as a whole.
- the mirror driver 30 is provided with a control circuit for implementing variable control of the speed of rotating the vibrating mirror 22 to control the speed of driving the rotation of the vibrating mirror 22 of the light scanning mechanism and the distance of moving the vibrating mirror 22 thereof, thereby correcting the angle of rotating the vibrating mirror 22 thereof.
- Fig. 6 is a block diagram showing the configuration of the essential portion of the circuit for controlling a mirror driver for controlling the rotation of the vibrating mirror 22.
- a linear motor is employed as an actuator for the vibrating mirror 22, and the angle of rotating the vibrating mirror 22 can be controlled by applying voltage in proportion to the angle of rotation.
- the distance X of the surface thereof is so set as to become proportional to the time t .
- the generation of the control signal is controlled by the control circuit of the mirror driver 30, and the control signal is fed to the actuator of the vibrating mirror 22 for controlling the driving of the vibrating mirror 22.
- the mirror driver 30 comprises a read-only memory 30a having functional wave forms stored therein, a digital-analog conversion circuit 30b for converting the read function data into voltage signals, a driver 30c for amplifying the converted voltage signals and generating a control signal for controlling the driving of the mirror driver 30, a counter 30d for giving read addresses in time series to the memory 30a, and an oscillating circuit 30e for providing the counter with clock signals.
- the oscillating circuit 30e is operated by an instruction from the control circuit 27 of the instrumentation unit body 7, and clock signals is entered into the counter 30d from the oscillating circuit 30e, thereby counting the clock signals and generating the read addresses to be fed to the read-only memory 30a in time series.
- the function data stored in advance is read out one after another from the read-only memory 30a.
- the function data (as shown in Fig. 5) relating to the angle of rotation of the vibrating mirror 22, and such function data is read in time series.
- the number of bits of the function data is 12 bits
- the function data to be read out is converted by the digital-analog conversion circuit 30b into voltage signals of analog signals for controlling the angle of rotation of the vibrating mirror 22.
- the voltage signals are processed to remove noises in a step type by filtering with the mirror driver 30. After the voltage signals are then amplified, they are fed to the vibrating mirror 22, thereby allowing the vibrating mirror 22 to be rotated at a desired angular speed so as to become constant in the speed of moving (scanning) the spot lights of the laser beams on the electrophoresis unit section.
- the scanning speed is so set as to be variable at 0.5Hz, 1Hz, 5Hz, 10Hz, 20Hz, 50Hz, 100Hz and 200Hz in order to become approximately logarithmically equal. This arrangement permits an efficient reading by changing the reading speeds in accordance with the quantity of the fluorescent substances for use in labelling the samples for electrophoresis or the difference in the quantum efficiency of the fluorescent substances.
- the scanning speed can be designated through the operation display panel 7b or the data processor 8 by transmitting designation data from the control circuit 27 to the mirror driver 30 and controlling the counter 30d and the oscillating circuit 30e, thereby driving the vibrating mirror 22 at a desired scanning speed.
- the laser beams from the light source 21 are scanned and radiated as spot lights capable of moving on the electrophoresis unit section 5 at a constant speed.
- the irradiation of the gel member of the electrophoresis unit section 5 with the laser light excites the fluorescent substance present in the gel member thereof irradiated with the laser light, thereby emitting fluorescence as indicated by 13.
- Fig. 7 is a schematic representation showing the detail configuration of the optic system in the light collector 13 for receiving the light generated from the gel member
- Fig. 8 is a schematic representation showing an example of the detail configuration of the optic system in the optoelectric conversion section, particularly the light path.
- the gel member of the electrophoresis unit section 5 is interposed between the gel support members 5b and 5c, and each of the gel support members 5b and 5c is composed of boron silicate glass plates having a relatively less magnitude of fluorescence in this embodiment, although quartz glass plates or various optical glasses can also be employed as the gel support members 5b and 5c.
- the electrophoresis unit section 5 is irradiated with laser beams 31 which moves while being scanned, the light of the laser beams 31 is thrown on the gel support member 5c and transmits through the gel support member 5c in the direction of its thickness, reaching the gel member 5a through which in turn the irradiated light of the laser beams 31 advances in the direction of its thickness and the light transmits through the gel member 5a and then the gel member 5b.
- Each of the gel support members 5b and 5c is approximately 5 mm thick, and the gel member 5a is approximately 0.35 mm thick.
- the light of the laser beams 31 thrown on the gel support members 5b and 5c as well as the gel member 5a is so set as to reach the gel member 5a at a substantially equal light intensity in any position of the electrophoresis unit section 5. Further, the expansion of laser beams 31 or the reduction in its intensity due to scattered light to be generated on the plane of incidence of the irradiating light for the gel member 5a as well as the gel support members 5b and 5c can be decreased to a remarkable extent because their radiating light is thrown on in the direction perpendicular to the plane in the direction of thickness. Furthermore, the laser beams 31 are damped down by the optical trap 32 after transmission through the gel member, in order to cause no adverse influence as stray light.
- the fluorescence is generated from the inside of the gel member 5a by scanning the exciting light in the manner as described hereinabove, and the fluorescence is collected by the light collector 23, together with scattered light by the exciting light.
- the scattered light generated in the gel support members 5b and 5c is separated in a geometrical-optical way by the spatial position relationship of the light path for receiving the light, thereby extracting only the fluorescence from the gel member and transmitting it to the optoelectrical conversion section 24.
- the optoelectrical conversion section 24 the fluorescence and the scattered light generated in the gel member are separated from each other by the optic filter, and only the fluorescence separated from the gel member is transmitted to the optoelectrical conversion section 24 which can convert faint fluorescence into electric signals by a photomultiplier.
- the light collector 23 is so arranged as to collect the fluorescence resulting from the electrophoresis unit section 5 and scattered light of the irradiating light resulting from the gel support members 5b and 5c by means of a cylindrical lens 23a.
- the scattered light and fluorescence from the electrophoresis unit section 5, which were received by the cylindrical lens 23a, are formed as image on the side opposite to the cylindrical lens 23a.
- the point A is a focal point of the fluorescence resulting from the gel member 5a and of the scattered light of the exciting light generated from the gel member 5a.
- the scatter light of the exciting light generated on the surface of the gel support member 5c can form image at the focal point A'.
- the fluorescence can be separated from the scattered light resulting from the gel support members in a geometrical-optical manner due to the spatial position relationship of the light path for receiving the light by disposing the optical fiber array 23b at the focal point A so as to receive the fluorescence from the gel member 5a.
- a quantity of scattered light emitted in the boundary surfaces becomes very small because the refractive index of the gel member is approximately as low as 1.4 to 1.5 and relatively close to the refractive index of the gel support members, such as glass plates, and the gel member is closely attached to the gel support members to thereby form a tight boundary surface between them.
- the light received at the point A contains a lesser quantity of the scattered light of the exciting light emitting from the surface of the gel member 5a, while it contains a larger rate of fluorescence emitting from the inside of the gel member 5a.
- the scattered light may emit from the surface of the gel member in the quantity nearly equal to the quantity emitting from the surface of the glass plate panel as the gel support member.
- the glass plate of the reading table (7c in Fig. 3) of the instrumentation unit body 7 demonstrates substantially the same effect as the glass plate panel of the gel support member, thereby suppressing the detecting sensitivity from reducing to a great extent and permitting the fluorescence emitting from the surface of the gel member to be detected with high efficiency.
- cylindrical lenses and optic fiber arrays may be disposed at four locations so as to encircle the scanning line of the gel member emitting fluorescence, thereby increasing the quantity of light to be collected and enhancing the magnitude of fluorescence to be detected. In this case, it is effective to deviate the optic axes so as to cause no reflection from the surface of the cylindrical lens to adversely affect the cylindrical lens facing the other one.
- the fluorescence collected by the optic fiber array 23b is led to each of the optic fibers of the optic fiber arrays 23b, and the optic fibers are combined and entered into the optoelectric conversion section 24.
- the configuration of the optic system in the optoelectric conversion section 24 is arranged in such a way that the fluorescence entered into the optoelectric conversion section 24 from the optic fiber array 23b is so processed as to extract parallel light components only by a first lens 24a, a diaphragm 24b and a second lens 24c and the parallel light components are entered into the optic filter 24d which in turn is disposed at an angle of approximately 20 degrees relative to the direction perpendicular to the direction of passage of the light.
- the optic filter 24d is so designed as to have the band pass filter characteristic having the central wavelength of 605 nm for the transmitting light and, further, the characteristic of reflecting the light having the wavelength of the light other than the transmitting light, which reflects on the side of entering into the optic filter 24d.
- the wavelength component of fluorescence from a first fluorescent substance can be extracted from the light that has transmitted through the optic filter 24d.
- the wavelength component of the fluorescence is then collected by a third lens 24e and led to a first photomultiplier 24f where electric signals are produced for the intensity of fluorescence of the first wavelength component of the fluorescence.
- the fluorescence having the wavelength components of second and following fluorescent substances can be extracted from the light reflecting from the optic filter 24d.
- the light reflected from the optic filter 24d is further led to a second optic filter 24g which in turn remove the wavelength component of the exciting light, followed by collecting light with a fourth lens 24h and generating electric signals corresponding to the intensity of fluorescence of the wavelength of the second fluorescence through a second photomultiplier 24i.
- Fig. 9 is a schematic representation showing another example of the detail configuration of the optical filter section for separating fluorescence into a number of wavelength components through a number of optic filters.
- the optic filter section is configured as in Fig. 9, in which the second optic filter 24g is disposed at the position at which the light reflects from the first optic filter 24d and a third optic filter 24j is disposed at the position at which the light reflects from the second optic filter 24g, and further a fourth optic filter 24k is disposed at the position at which the light reflects from the third optic filter 24j.
- This arrangement can separate fluorescence having different wavelength components as lights A, B, C and D transmitting through the first, second, third and fourth optic filters 24d, 24g, 24j and 24k, respectively.
- the respective photomultipliers 24f and 24i By separating the resulting fluorescence from the scattered light of the exciting light, the respective photomultipliers 24f and 24i generate the electric signals corresponding to the intensity of fluorescence in accordance with the wavelength components of each fluorescence with the improved signal-to-noise ratio.
- the resulting electric signals are entered into the amplifiers of plural systems, each system of which amplifies faint signals to a sufficient extent in an amplification stage containing an integral circuit.
- Fig. 10 is a circuit diagram showing the circuit configuration of an amplifier containing the integral circuit.
- the amplifier 25 has the integral circuit composed of an operation amplifier in the front amplification stage and an output amplification circuit composed of an operation amplifier in the following amplification stage.
- the electric signals from the photomultiplier 24f are entered into an operational amplifier 25a which in turn constitutes the integral circuit, together with a condenser 25c and a switch 25d for controlling the integral operation.
- the output of the integral circuit is entered into an operational amplifier 25b and amplified with a gain to be determined by an external resistance, followed by transmission to an analog-digital converting circuit which follows.
- the output of the photomultiplier 24f has a very large output impedance so that it can be regarded as if it is a source of electric currents.
- the operational amplifier 25a there is employed a high-input impedance of a FET (Field Effective Transistor) input type.
- FET Field Effective Transistor
- Such integrating operations involves integrating for a period of time corresponding to one pixel, allowing a sampling circuit within the analog-digital conversion circuit 26 to sample signals at the timing of matching with a S/H clock, holding the resulting signals as it is, supplying the analog signals to the analog-digital converting circuit 26 where the analog signals are converted into digital signals.
- the C/D clock serving as a C/D control signal to be added to the switch 25d is made active, thereby discharging electric charges accumulated in the condenser 25c.
- the operations are repeated in the way as described hereinabove.
- the amplification stage using the integrating circuit by the operational amplifier can be a psudo-integrating circuit composed of a resistance and a condenser only. It is to be noted, however, that the integrating circuit in the operational amplifier having the configuration as described hereinabove can provide a higher signal-to-noise ratio because it can integrate the electric charges of the electric signals from the photomultiplier 24f to an almost complete level. Further, the integrating time can be changed in an arbitrary manner by changing the C/D clock of the C/D control signals for the switch 25d. Hence, a degree of amplification for amplifying faint signals in a comprehensive fashion can readily be adjusted.
- control can be carried out so as to agree with an area of the reading sample by corresponding to or synchronizing with the operation of the mirror driver 30 as shown in Fig. 4, thereby saving time by avoiding useless period of time for reading.
- speed of scanning the exciting light and the integrating time of the amplifier on the side of receiving light can be set so as to agree with the intensity of fluorescence from the sample with high freedom, thereby permitting a very flexible device configuration.
- the values of the condenser and the resistance can be shifted so as to become a time constant corresponding to the speed of scanning the irradiating light, so that the integrating operation can be realized in a pseudo fashion.
- the electric signals amplified by the amplifier 25 (Fig. 2) are entered into the analog-digital conversion circuit 26, where the analog signals are converted into digital signals.
- the signals indicative of the fluorescence detected, which are converted into digital data, are stored in the memory 28 and the data stored in the memory 28 is transmitted to the data processor 8 through an interface circuit 29.
- the overall control for performing such a series of signal processing is carried out by the control circuit 27.
- Fig. 12 is a schematic representation showing another example of the configuration of the light collector for detecting plurally separated wavelength components of fluorescence and the optoelectric conversion section.
- the configuration for separating a plurality of wavelength components of fluorescence is implemented by employing a plurality of optic filters for the optoelectric conversion unit 24.
- the fluorescence intensity of each of the desired fluorescent wavelength components can be detected by each of the optic filters by employing a plurality of systems consisting of the light collectors and the optoelectric conversion units.
- the wavelength components of fluorescence can be individually detected by the optic system of each of the light collectors and the optoelectric conversion units, so that even faint fluorescence can be detected with high sensitivity. As shown in Fig.
- this configuration provides electric signals of each of the wavelength components of fluorescence by dividing the fluorescence entering from the electrophoresis unit section 5 with the optic fiber arrays 35a and 35b of the plural light collectors so as to be distributed uniformly in the position in which each fluorescence enters and then by supplying the fluorescence collected by each of the optic fiber arrays 35a and 35b to each of the optoelectric conversion units 36a and 36b.
- a set of the optic fiber arrays 35a and 35b may further be disposed, thereby allowing the fluorescence to be divided into different wavelength components of the fluorescence. In this case, however, photons of each fluorescence divided are reduced in number.
- the characteristic of this configuration resides in the fact that, as the wavelength components of the fluorescence can be detected individually by the optic systems of each of the light collectors and the optoelectric conversion units, the wavelength of fluorescence to be detected can be changed individually and with freedom. Further, reliability can be improved, for instance, when there is employed a duplicate system for receiving the light of the identical wavelength.
- Fig. 13 is a schematic representation showing an example of the configuration of the optoelectric conversion section to be employed when the optic filter is mechanically moved to change the wavelength component of fluorescence to be selected.
- the fluorescence entered from the optic fiber array 23b is so processed as to collimate the parallel components only through the first lens, the diaphragm and the second lens and the parallel components of the fluorescence are then allowed to reach the photomultiplier 39 through the optic filter 37 or the optic filter 38.
- the optic filter 37 or 38 may be shifted so as to be selected in accordance with requirements by using an electromagnetically reciprocating solenoid 40.
- This arrangement allows a time sharing separation of the wavelength components of the fluorescence by shifting the plural optic filters in a time sharing way.
- This arrangement requires only one photomultiplier 39, which is very expensive, to separate the wavelength components of fluorescence in a time sharing fashion, so that costs of the device configuration can be reduced.
- Fig. 14 is a schematic representation showing an example of the configuration of the light source in which plural kinds of excited light having different wavelength are united into one beam.
- the laser beams generated from each of a first light source 41 and a second light source 42, each emitting light having a predetermined wavelength component are entered into a cube-shaped beam splitter 43.
- the light sources comprise the first light source 41 for emitting green laser beams having the wavelength of 532 nm and the second light source 42 for emitting argon ion laser.
- the surface 43a of a half mirror disposed in the beam splitter 43 has a membrane capable of transmitting the light from the first light source 41 while reflecting the light from the second light source 42. This arrangement permits the lights from the two light sources to be employed as one separate light beam.
- the kind of the fluorescent substances to be employed for labelling the samples can be increased by employing a plurality of light sources for emitting exciting lights for exciting the fluorescent substances contained in the electrophoresis pattern.
- the fluorescent substances such as Texas red, tetramethyl rhodamin isothiocyanate (TRITC) and so on can be excited by the light from the first light source 41, while the fluorescent substances such as fluorescein isothiocyanate, 4-chloro-7-nitrobenz-2-oxa-1-diazole (NBD chloride) and so on can be excited by the light from the second light source 42.
- one beam splitter is employed as a structuring element for the light source. It is to be noted, however, that two beam splitters may be employed by disposing the second beam splitter on the side of the beam united by the first beam splitter, thereby allowing two or more light beams to be admixed with each other and united into one beam. Further, it is to be noted that laser having a plurality of oscillating wavelength and laser capable of emitting higher harmonics may be employed as it is as a light source.
- Fig. 15 is a schematic representation showing an example of output of an electrophoresis pattern obtained by reading the results of electrophoresing a sample of a protein with the multi-colored electrophoresis pattern reading apparatus in a two-dimensional way.
- the data on the electrophoresis pattern read from a reference sample is colored in red and the data on the electrophoresis pattern read from a sample to be detected is colored in blue. It is noted as a matter of course that any combination of colors can be employed.
- bands identified by 45 on the electrophoresis pattern are colored in violet, as indicated by vertical dot lines in the drawing, and the bands 45 represent a combination of the band in red resulting from the reference sample and the band in blue resulting from the sample to be detected, each of the bands being located in the identical positions on the electrophoresis pattern.
- the sample to be detected contains the same structural fragment portion as the reference sample.
- the bands resulting from that fragment portions as indicated by 46 and 47 in the drawing, are located in different positions on the electrophoresis pattern and colored in red and blue, which originate from the reference sample and the sample to be detected, respectively.
- This electrophoresis pattern can serve to a great extent as a ready and simple comparison among the bands simply by determining the colors on the bands.
- experimental items such as experiment date, experiment number, conditions, etc. should be written with oil-base ink or the like for managing the image from X-ray films.
- they can be written together with output of the electrophoresis pattern for the apparatus according to the present invention merely by entering those experimental items at predetermined positions through an input unit. This permits the output results as electrophoresis patterns to be managed with ready reference and easy availability.
- the multi-colored electrophoresis pattern reading apparatus allows an electrophoresis plate itself (the electrophoresis unit section) to be read as it is after electrophoresis has been finished and mounted to the reading unit separately disposed from the electrophoresis unit, so that even if a long period of time is required as for the case in which two-dimensional electrophoresis results are to be read, the electrophoresis unit can be employed for electrophoresing another sample, thereby improving operational efficiency of the electrophoresis unit to a great extent.
- the multi-colored electrophoresis pattern reading apparatus can read a plurality of fluorescent pigments labelled on the samples by separating the light components by their wavelength, thereby permitting the electrophoresis results to be obtained from two or more different samples at the same time. Furthermore, the multi-colored electrophoresis pattern reading apparatus of the present invention is so arranged as to cause a deviation such as a warp resulting from electrophoresis to occur on the samples in the same manner, so that the molecular weights of the two samples or more and other parameters can be compared without correction of the electrophoresis results, thereby making a comparison of the electrophoresis results very simple and easy.
- the gel member is removed from the electrophoresis unit and mounted to the reading unit after the electrophoresis has been finished, so that the results obtainable by two-dimensional electrophoresis as well as by one-dimensional electrophoresis can be read in the same manner.
Description
- The present invention relates to an apparatus for reading fluorescent-labelled gel electrophoresis patterns according to the preamble of
claim 1, which is appropriate for the comparison of a plurality of electrophoresis patterns comprising samples labelled with fluorescent pigments having a different fluorescent wavelength, which have been subjected to electrophoresis simultaneously with each other. - Generally, the analytical method of electrophoresis using labels with a radioactive isotope has been employed for analyzing the sequence of various genes, including the diagnosis of hereditary diseases deriving from genes, the structures of proteins such as amino acids, etc. The electrophoresis is a method for analyzing samples by labelling or replacing fragments of a sample with or by a radioactive isotope, subjecting the fragments of the sample to gel electrophoresis, and analyzing the pattern of distribution of the fragments of the sample developed by means of the electrophoresis.
- Description will now be made of the diagnosis of hereditary diseases as an example for reading and analyzing electrophoresis patterns. The human genome DNA consists of approximately 3·109 base pairs, the sequence of the bases is generally constant among the human beings, although there are deviations in the sequence of the bases among individuals. These deviations are called polymorphism of DNAs. The polymorphism of DNAs is seen in the non-hereditary region as well as in the hereditary region, and the polymorphism of DNAs appears in many cases as a polymorphism of proteins that is the phenotype of the polymorphism of DNAs. A variety of variations as seen among the human beings, such as the blood types, histocompatibility antigens, the difference of skin and hair colors among peoples, etc., are based on the polymorphism of DNAs. The polymorphism of the DNAs has been created on the basis of variations that have been accumulated in the DNAs of the genocytes of human groups up to the present time from the time when the human beings developed as an individual biological species in the course of the evolution. When such a variation exists at a site that has a function of significance in terms of the existence as an individual person and when a nosogenic phenotype resulting from the variation occurs as a pathologic state, the pathologic state is called a hereditary disease. It is said that there are currently more than 3,000 kinds of hereditary diseases in the human group.
- The nosogenesis of hereditary diseases is an abnormality appearing on the DNA sequence. A disease can be recognized for the first time in several stages ranging from DNA through mRNA and proteins to pathogenic phenotype. The diagnosis as a disease is conducted usually in the last stage, and the diagnosis can be implemented at the DNA level or at the protein level if the disease would occur simply in the course of the several stages as described hereinabove.
- The basic technique for the diagnosis of DNAs is called Southern blotting; this method basically consists of six steps:
- Step 1:
- Extraction of DNAs as a sample;
- Step 2:
- Fragmentation of DNAs with restricting enzymes;
- Step 3:
- Fractionation of molecular weights of the DNA fragments through gel electrophoresis;
- Step 4:
- Migration of DNA fractions to a filter;
- Step 5:
- Hybridization of DNA fractions with probe DNAs (obtained by labelling DNA having the hemeomorphous sequence of the gene to be detected); and
- Step 6:
- Detection of the hybrid by autoradiography.
- For the diagnosis of hereditary diseases, DNAs extracted from any organ are employed, and the sample required for that purpose is usually peripheral blood in an amount of the order of several milliliters. DNAs are extracted from the leukocytes separated from the peripheral blood as the sample. Approximately five days are usually required from
step 1 tostep 6. In diagnosing the hereditary diseases, a fraction pattern of a person tested is compared with a fraction pattern of a normal person. The person tested is decided as being normal when the fraction pattern of the person tested is determined to be identical with the fraction pattern of the normal person. - Recently, attempts have been made to conduct tests by using a probe DNA labelled with a fluorescent pigment, in place of a radioactive isotope, excite the fluorescent pigment and read the electrophoresis pattern, from the point of view of safety and other environmental problems. However, highly sophisticated optical and signal processing techniques are required to give a signal-tonoise ratio equivalent to that obtained with radioactive isotopes, because the quantity of the sample required for diagnosis of the hereditary disease and determination of the sequence of bases is of the order of approximately 10-15 mole.
- JP-A-61-62 843/1986 discloses an electrophoresis apparatus capable of detecting a minute quantity of a sample labelled with a fluorescent pigment.
- Description will now be made of such an electrophoresis apparatus based on the fluorescence detection method.
- Fig. 16 is a perspective view showing the appearance of a conventional electrophoresis apparatus of the fluorescent type. The electrophoresis apparatus comprises an electrophoresis and
instrumentation unit 51 for implementing electrophoresis of a sample and measuring the distribution of fluorescence, adata processor 52 for performing data processing on the basis of measured data, and acable 53 connecting the electrophoresis andinstrumentation unit 51 to thedata processor 52. The electrophoresis andinstrumentation unit 51 has a door 5la through which are poured a gel serving as a base for performing electrophoresis for DNA fragments and a predetermined quantity of a sample for electrophoresis. As the door 51a is closed, a switch for starting electrophoresis on anoperation display panel 51b is pressed to start electrophoresis. As the electrophoresis has been started, a monitor of theoperation display panel 51b of the electrophoresis andinstrumentation unit 51 displays the operational state. The measured data are transmitted to thedata processor 52 in which the data are processed on the basis of a predetermined program stored in advance. Thedata processor 52 comprises acomputer body 54, akeyboard 55 for entering an instruction from the operator, adisplay unit 56 for displaying the processing state and results, and aprinter 57 for recording the processed results. - Fig. 17 is a block diagram showing the configuration inside the electrophoresis and
instrumentation unit 51. As shown in Fig. 17, the overall configuration of the electrophoresis and instrumentation unit 51 (Fig. 16) comprises anelectrophoresis unit section 63 and a signalprocessor unit section 64. Theelectrophoresis unit section 63 comprises anelectrophoresis section 5 for implementing electrophoresis, a first electrode 2a and asecond electrode 2b each for applying voltage to theelectrophoresis section 5, asupport plate 3 for supporting theelectrophoresis section 5 as well as the first andsecond electrodes 2a and 2b, apower supply unit 4 for applying voltage to theelectrophoresis section 5, a light source 11 for emitting light for exciting a fluorescent substance, anoptical fiber 12 for leading the light from the light source 11, alight collector 14 of anoptical system 13 for condensing and collectingfluorescence 13 generated by the fluorescent substance, anoptical filter 15 for selectively passing light having a particular wavelength therethrough, and anoptical sensor 16 for converting the condensed light into electric signals. The signalprocessor unit section 64 comprises anamplifier 17 for amplifying the electric signals from theoptical sensor 16, an analog-digital converting circuit 18 for converting analog signals of the electric signals into digital data, asignal processing section 19 for pre-processing the digital data, for example, by performing addition average processing or the like, aninterface 20 for implementing interface processing for feeding the pre-processed data to an external data processor, and acontrol circuit 10 for implementing overall control of the electrophoresis unit section and the signal processing system. The digital signal OUT generated from the signalprocessor unit section 64 is transmitted to the data processing unit 52 (Fig. 16), thereby implementing the data processing such as analysis processing and so on. - Description will now be made of the operation of the electrophoresis apparatus with reference to Figs. 16 and 17.
- After the door 51a of the electrophoresis and
instrumentation unit 51 is opened, a gel is poured into theelectrophoresis section 5 disposed within the electrophoresis andinstrumentation unit 51 and thereafter a sample of DNA fragments labelled with a fluorescent substance is poured thereinto. As a switch of theinstrument panel 51b is pressed to give an instruction to start electrophoresis, then voltage is applied from the first andsecond electrodes 2a and 2b of thepower supply unit 4 to theelectrophoresis section 5, thereby starting the electrophoresis. In the course of the electrophoresis, the sample labelled with the fluorescent substance migrates, for example, in lanes 71, 72, 73 and 74, as shown in Fig. 20, gathering the molecules having the same molecular weights together formingbands 66. The molecules having lower molecular weights migrate faster than those having higher molecular weights so that the former migrate in a distance longer than the latter within the same time. Thebands 66 are detected in a manner as shown in Figs. 18a and 18b by leading light from the light source through theoptical fiber 12 to alight path 61 and irradiating the gel on thelight path 61 with the light, exciting the labelled fluorescent substance concentrated on thebands 66 in the gel to generatefluorescence light 13, and detecting thefluorescence light 13. Thefluorescence light 13 corresponds to the fluorescent substance in an extremely low concentration of approximately 10-16 mole per band, the quantity of fluorescence being dependent upon the extinction coefficient of the fluorescent substance used, the quantum efficiency thereof, the intensity of the exciting light, etc. For instance, fluorescein isothiocyanate has a peak of the excitation wavelength at 490 nm, a peak of its fluorescent wavelength at 520 nm, an extinction coefficient of 7·104 mole-1 · mole-1, and a quantum efficiency of approximately 0.65. If fluorescein isothiocyanate employed is present in a concentration of 10-16 mole per band, the fluorescence generated contains photons of the order as low as 1010/s, when calculated assuming the use of an argon ion laser of a wavelength of 488 nm at an output of 1 mW for exciting the fluorescent substance, although it may vary to some extent with the thickness of the gel or the like. - Referring to the front view as shown in Fig. 18a and to the longitudinally sectional view as shown in Fig. 18b, the
electrophoresis section 5 comprises agel member 5a composed of polyacrylamide or the like andgel supporting members gel member 5a from both sides. A sample of DNA fragments is poured into thegel member 5a of theelectrophoresis section 5 from its upper portion, and the electrophoresis is carried out by applying the electrophoresis voltage to the first electrode 2a and thesecond electrode 2b (Fig. 17). While the electrophoresis is being carried out, the fluorescent substance contained in the bands of the electrophoresis pattern in thegel member 5a along thelight path 61 is irradiated with rays of light sent out from the light source, such as laser light, which pass through theoptical fiber 12 onto thelight path 61 of thegel member 5a. This allows the fluorescent substance present on thelight path 61 to be excited to emitfluorescence light 13 that is led to alight collector 14 of optics consisting of a combination of lenses and then selected by theoptical filter 15 after having been condensed, followed by conversion into electric signals by means of a one-dimensionaloptical sensor 16. In order to convert a faint quantity of light into electric signals in an efficient manner, the light is amplified 104 to 105 times with an image intensifier or the like, and the image is converted into electric signals by theoptical sensor 16, such as a one-dimensional optical sensor of CCD type or the like. The electrical signals converted by theoptical sensor 16 are then amplified to signals of a desired level by theamplifier 17, and the analog signals are converted into digital signals by the analog-digital convertingcircuit 18, followed by transmission to thesignal processing section 19. The digital signals transmitted from the analog-digital converting circuit (A/D) 18 are then subjected to signal processing, such as addition average processing, or the like, in order to improve the signal-to-noise ratio (S/N ratio), and the resulting digital data are transmitted to the dataprocessor unit section 52 through theinterface 20. - Figs. 19a and 19b are schematic representations for describing an example of signals of a pattern indicative of the fluorescence intensity of DNA fragments transmitted from the electrophoresis and
instrumentation unit 51. For instance, as shown in Fig. 19a, the fluorescent substance present on thelight path 61 is excited upon irradiation of thegel member 5a of theelectrophoresis section 5 with the laser light in the course of the electrophoresis, thereby emitting fluorescence. The fluorescence is detected at predetermined positions of each lane in the direction of electrophoresis, as indicated by 62, as the time of electrophoresis elapses. In other words, the fluorescence is detected as thebands 66 of each lane pass through the positions of thelight path 61, thereby detecting a pattern signal of fluorescence intensity in each of the lanes, as shown in Fig. 19b. As a peak of the fluorescence intensity is given when each of thebands 66 passes through the positions of thelight path 61, the pattern signal of the fluorescence intensity as shown in Fig. 19b represents a pattern signal indicating the magnitude of fluorescence intensity of thebands 66 located in the direction of electrophoresis, as indicated by 62. - The
computer body 54 of thedata processing unit 52 implements data processing for comparing molecular weights and determining the sequence of bases of a DNA on the basis of data of the pattern indicative of the fluorescence intensity in response to data of the pattern signals for the fluorescence intensity of the DNA fragments transmitted from the electrophoresis andinstrumentation unit 51. The sequence of the bases and so on determined by the data processing is symbolized and then generated, thereby displaying the symbolized data on a display screen by thedisplay unit 56 or printing it out by theprinter 57. - The embodiment explained above is directed to an example of the apparatus in which a fluorescent pigment is employed for labelling the sample. JP-A-1-167,649/1989 discloses another example of an apparatus capable of reading a fluorescent electrophoresis pattern. This apparatus is of such a type that the fluorescent pattern of the electrophoresis section is read as a whole after the end of the electrophoresis, unlike the aforesaid electrophoresis apparatus which reads the distribution of the fluorescent pattern passing through a reading section in the course of the electrophoresis.
- It is to be noted that the gel electrophoresis method employed for the electrophoresis pattern reading apparatus on the basis of the fluorescence detection method is the same as the gel electrophoresis method which has been employed for the conventional apparatus in which the sample is labelled with a radioactive isotope. The gel electrophoresis method may cause a warp in the electrophoresis pattern because the speed of migration of the bands may vary with the position of the electrophoresis plate due to irregularities of the temperature within the gel and for other reasons, thereby causing a warp in the electrophoresis pattern. Hence, for example, when electrophoresis of two kinds of samples or electrophoresis in a two-dimensional way is to be performed with the purpose to compare two kinds of electrophoresis patterns for the diagnosis of hereditary diseases, deviations of the electrophoresis positions may occur between the electrophoresis results due to the warp, and the comparison between the two electrophoresis patterns may be rendered difficult, independently of whether the samples have been labelled with a radioactive isotope or with a fluorescent substance, as long as the conventional gel electrophoresis method is employed. Further, the implementation of a correction of such electrophoresis patterns by means of data processing is also rendered laborious and difficult.
- Further, as the electrophoresis and instrumentation unit for implementing electrophoresis and simultaneously measuring the distribution of the fluorescent substance passing through the reading unit adopts two-dimensional electrophoresis, it requires one-dimensional electrophoresis to be implemented by one device and two-dimensional electrophoresis to be conducted by another device, so that this operation is laborious.
- DE-A-4 011 730 relates to a fluorescent-type gel electrophoresis apparatus wherein a plurality of fluorescent substances may be used for labelling the samples. The pattern reading is carried out during the electrophoretic separation, the different fluorescence wavelength components being discriminated through band pass filters. In this known system, the gel layer is irradiated laterally from one of the edges, and the fluorescence light is detected in the direction of the gel layer.
- EP-A-0 314 045 discloses a fluorescent-type gel electrophoresis apparatus similar to that of DE-A-40 11 730, where the excitation light is also irradiated laterally into the gel, and the measurement of the fluorescence light is carried out during the electrophoresis. The wavelength-dispersive element of this system is a direct-vision prism combined with a two-dimensional fluorescence detector.
-
EP 0 294 524 deals with a real-time scanning electrophoresis apparatus of the fluorescent type. The gel pattern is scanned with a light beam, and the different fluorescence light components are discriminated by optical filters. Also this prior art system reads the electrophoresis pattern during electrophoresis, the optical system being mounted on a translational stage for moving the system parallel to the planar gel across the lanes. - It is the underlying problem of the present invention to provide an apparatus for reading gel electrophoresis patterns of a plurality of samples subjected to electrophoresis simultaneously and being separately labelled with different fluorescent substances having different fluorescence wavelengths, which allows a comparison of electrophoresis patterns without correction because deviations such as a warp resulting from electrophoresis occur in the samples in the same manner.
- The above underlying problem is solved according to
claim 1. The dependent claims relate to preferred embodiments. - The apparatus of the present invention for reading gel electrophoresis patterns of a plurality of samples separately labelled with different fluorescent substances having different fluorescence wavelengths comprises
- light source means for irradiating the gel member comprising the electrophoresis pattern with irradiated light for exciting the fluorescent substances labelled on the respective samples to emit fluorescence light,
- light receiving means for receiving the fluorescence light resulting from a reading surface separated from scattered light on the basis of the spatial position relationship therewith,
- optical filter means for separating optical signals received by the light receiving means into the respective fluorescence wavelengths,
- optoelectric conversion means for optoelectric conversion of the optical signals separated by the optical filter means into electrical signals corresponding to the intensity of the respective fluorescence light,
- amplifier means for amplifying the electrical signals received from the optoelectric conversion means and generating corresponding electrical signals indicative of the fluorescence from the electrophoresis pattern one after another;
- the apparatus is designed for reading already developed electrophoresis patterns,
- light scanning means are provided for scanning the irradiated light and irradiating the gel member comprising the electrophoresis pattern in the direction of the thickness of the gel member,
- the optical axis of the light path of the light receiving means for receiving fluorescence light is arranged in a direction different from that of the optical axis of the irradiated light,
- the light receiving means (23) comprise a cylindrical lens (23a) arranged such as to receive the fluorescence light (13) resulting from the gel member (5a) and scattered light resulting from the gel member (5a) and from the surface of a gel support member (5b, 5c) and to focus the fluorescence light (13) and scattered light resulting from the gel member (5a) in a focal point A at the optoelectric conversion means (24), and focusing the scattered light resulting from a gel support member (5b, 5c) in a focal point A' at a position different from that of the focal point A,
- the amplifier means comprise an integration circuit.
- The light source means are a light source for generating irradiating light for emitting fluorescence by exciting two or more fluorescent substances labelled separately on the samples. In order to give light of a wavelength for exciting each of the fluorescent substances, for example, a plurality of light sources may be provided to generate a mixed light. The light source means may be a single light source when the light resulting from the single light source has a predetermined range of wavelengths. The light scanning means are arranged to scan the irradiated light from the light source means and to irradiate in the direction of the thickness of the gel. The light receiving means have their light receiving surface set in a direction different from the optical axis of the irradiated light and are designed so as to receive the fluorescence from the electrophoresis pattern separated from the scattered light from the reading surface due to the spatial position relationship of the light receiving path. The optical filter means can separate the optical signals of the fluorescence received by the light receiving means into a plurality of fluorescence wavelengths. The optoelectric conversion means generate the electric signals by optoelectrically converting each of the optical signals separated by the optical filter means, and the amplifier means amplify very faint electrical signals by implementing an integration operation corresponding to the scanning of the irradiated light and generating the electric signals of fluorescence from the electrophoresis pattern one after another. The speed of the integration operation is so arranged as to correspond to the speed at which the irradiated light is scanned, thereby allowing a very faint fluorescence output to be amplified in an efficient way.
- The electrophoresis pattern reading apparatus having the configuration as described above can read the distribution of the fluorescent substances by the differences in the wavelength of fluorescence inherent in the fluorescent pigments from the electrophoresis pattern of the samples. Further, the electrophoresis pattern reading apparatus according to the present invention allows all the samples, including the comparative sample, to undergo an equal degree of warp due to electrophoresis, so that the electrophoresis results can be read without paying attention to the warp originating from electrophoresis.
- Other objects, features and advantages of the present invention will become apparent in the course of the description of the preferred embodiments, which follows, with reference to the accompanying drawings.
- Fig. 1 is a schematic representation showing the overall configuration of the electrophoresis pattern reading apparatus of fluorescent type according to an embodiment of the present invention.
- Fig. 2 is a block diagram showing the configuration of the essential portion of the instrumentation section body.
- Fig. 3 is a view showing the position in which an electrophoresis unit to be mounted to the instrumentation section body.
- Fig. 4 is a view showing the light scanning mechanism for scanning a gel surface with laser beams by using a vibrating mirror.
- Fig. 5 is a graph showing the relationship between the angles of rotation of the vibrating mirror and the distance in which spot light of the laser beams moves.
- Fig. 6 is a block diagram showing the configuration of the essential portion of the control circuit for controlling a mirror driver for controlling the rotation of the vibrating mirror.
- Fig. 7 is a schematic representation showing the detail configuration of the optic system in a light collector.
- Fig. 8 is a schematic representation showing an example of the detail configuration of the optic system in the optoelectric conversion section.
- Fig. 9 is a schematic representation showing another example of the detail configuration of the optic system in the optoelectric conversion section.
- Fig. 10 is a circuit diagram showing the circuit configuration of an amplifier containing an integral circuit.
- Fig. 11 is a time chart showing the timing of reading operations by the amplifier.
- Fig. 12 is a schematic representation showing another example of the configuration of the light collector for detecting plurally separated wavelength components of fluorescence and the optoelectric conversion section.
- Fig. 13 is a schematic representation showing an example of the configuration of the optoelectric conversion section to be employed when an optic filter is mechanically moved to change the wavelength component of fluorescence to be selected.
- Fig. 14 is a schematic representation showing an example of the configuration of the light source in which plural kinds of excited light having different wavelength are united into one beam.
- Fig. 15 is a schematic representation showing an example of output of an electrophoresis pattern obtained by reading the results of two-dimensional electrophoresis of a sample of a protein with the multi-colored electrophoresis pattern reading apparatus.
- Fig. 16 is a perspective view showing an outlook of a conventional electrophoresis apparatus of a fluorescent type.
- Fig. 17 is a block diagram showing the configuration of the inside of the electrophoresis and instrumentation unit of the conventional electrophoresis pattern reading apparatus.
- Figs. 18a and 18b are elevational view and a longitudinally sectional view showing the electrophoresis unit, respectively, in order to describe the principle of the operations for detecting the electrophoresis pattern by the fluorescence method.
- Fig. 19a is a schematic representation showing an example of a pattern of DNA fragments and Fig. 19b is a graph showing an example of signals of fluorescent intensity pattern of the DNA fragments to be generated from the electrophoresis and instrumentation unit.
- Fig. 20 is a schematic representation showing an example of distribution of DNA fragments electrophoresed.
- Fig. 1 is a schematic representation showing an overall configuration of the electrophoresis pattern reading apparatus of a fluorescent type according to an embodiment of the present invention.
- As shown in Fig. 1, the multi-colored electrophoresis pattern reading apparatus of a fluorescent type according to the present invention comprises a combination in which an
electrophoresis unit 1 is connected to areading unit 6 disposed separately from the electrophoresis unit. Theelectrophoresis unit 1 comprises anelectrophoresis unit section 5, a first electrode 2a, asecond electrode 2b, a supportingplate member 3, and apower plant 4 for electrophoresis. Theelectrophoresis unit section 5 consists of a gel member serving as a base for electrophoresis and a gel support member for supporting the gel member by a glass panel or the like for interposing the gel member and it is mounted to the first andsecond electrodes 2a and 2b which in turn apply electrophoresis voltage to theelectrophoresis unit section 5. The supportingplate member 3 is arranged to support theelectrophoresis unit section 5 as well as the first andsecond electrodes 2a and 2b. Thepower plant 4 is to supply the electrophoresis voltage. As described hereinabove, theelectrophoresis unit section 5 is composed of the gel member for developing a sample for electrophoresis, such as polyacryl amide or the like, and the gel support member for supporting the gel member interposed from both sides by the glass plate panels or the like (see Figs. 18a and 18b). A sample of DNA fragments to be electrophoresed is fed from an upper portion of the gel member of theelectrophoresis unit section 5, the electrophoresis voltage is applied to the first andsecond electrodes power plant 4, thereby enabling electrophoresis of the sample to give an electrophoresis pattern. Theelectrophoresis unit section 5 is removed or detached from theelectrophoresis unit 1 after electrophoresis has been finished and mounted to thereading unit 6 for reading the resulting electrophoresis pattern. - As the
electrophoresis unit section 5 is mounted to aninstrumentation unit body 7 of the reading unit in a state in which it is removed or detached from theelectrophoresis unit 1 or in a state in which only the gel member is removed from theelectrophoresis unit section 5, the resulting electrophoresis pattern is read and data is then processed by thereading unit 6. As shown in Fig. 1, thereading unit 6 has theinstrumentation unit body 7 as an essential portion, and adata processor 8, animage printer 9 and other accessories are mounted to theinstrumentation unit body 7. Thedata processor 8 is arranged to implement data processing, image processing and determination processing for the data resulting from the electrophoresis pattern read by theinstrumentation unit body 7. Theimage printer 9 is to process and print the read electrophoresis pattern data out. Theinstrumentation unit body 7 has a reading table disposed immediately below alid 7a mounted at the upper portion of the instrumentation unit body for reading the electrophoresis pattern from theelectrophoresis unit section 5 consisting of the gel member and the gel support member, wherein the electrophoresis is performed. After theelectrophoresis unit section 5 is detached from theelectrophoresis unit 1 after electrophoresis, thelid 7a disposed at the upper portion of theinstrumentation unit body 7 is opened and theelectrophoresis unit section 5 is then mounted to the reading table. After mounting theelectrophoresis unit section 5 to the reading table, thelid 7a is closed and a start switch for starting the reading of the electrophoresis pattern on anoperational display panel 7b of theinstrumentation unit body 7 is pressed, thereby starting reading the electrophoresis pattern of the gel member of theelectrophoresis unit section 5. As the reading of the electrophoresis pattern starts, the scanning of the irradiating light from a spot light source built in theinstrumentation unit body 7 is started and the gel member of theelectrophoresis unit section 5 is irradiated with the light for exciting a fluorescent substance, thereby emitting fluorescence. The fluorescence emitted upon irradiation with the light is received, and a pattern of distribution of the fluorescent substance is measured. Thedata processor 8 implements data processing the data read and measured by theinstrumentation unit body 7 and further controls theinstrumentation unit body 7 itself. The processed data is printed out by theimage printer 9. In this embodiment, theimage printer 9 to be employed is of a type as capable of printing with a plurality of colors, thereby permitting the electrophoresis patterns to be printed out with multiple colors so as to correspond to the samples. - Fig. 2 is a block diagram showing the configuration of the essential portion of the
instrumentation unit body 7, and Fig. 3 is a view showing the position in which an electrophoresis unit to be mounted to theinstrumentation section body 7. - In performing the analysis of each of plural samples by means of electrophoresis with the multicolored electrophoresis pattern reading apparatus of fluorescent type, the samples of DNA fragments labelled with the fluorescent pigments or fluorescent substances are subjected to electrophoresis with the
electrophoresis unit 1 for a predetermined period of time, for example, as long as approximately 5 hours. After the electrophoresis has been finished, theelectrophoresis unit section 5 is detached from theelectrophoresis unit 1 and the gel member of theelectrophoresis unit section 5 removed therefrom is then mounted to an upper portion of the reading table 7c through thelid 7a of theinstrumentation unit body 7 of thereading unit 6, as shown in Fig. 3, in such a state that the gel member is still interposed with the gel support member, such as glass plates, or that the gel support member is detached from theelectrophoresis unit section 5. Then, thelid 7a is closed, thereby finishing the setting of the electrophoresis sample to the reading unit. When no gel member is yet labelled with the fluorescent pigment after electrophoresis, the gel member may be labelled therewith in this stage of mounting the electrophoresis pattern. The gel may be dried before mounting to the reading table. - Then, operations are performed for instructing the start of reading the electrophoresis pattern by pressing the read starting switch of the
operation display panel 7b or by giving an instruction to start reading from thedata processor 8. In starting the reading operations through thedata processor 8, the state of mounting theelectrophoresis unit section 5 to theinstrumentation unit body 7 is transmitted through a control signal line to thedata processor 8 which in turn controls the operations of the reading unit section of theinstrumentation unit body 7 in accordance with the state of mounting theelectrophoresis unit section 5. In this case, parameters such as reading speed and so on during operations may be set and registered in advance on the side of thedata processor 8, thereby allowing the operations for starting the reading to be performed automatically and reducing burdens for operating the switches on the side of an operator. - The read data on the distribution of the fluorescent pigments is transmitted to the
data processor 8 which in turn implements desired processing programmed in advance, such as processing for detecting a peak of the intensity of fluorescence, electrophoresis distance, and so on. The data of the processed results is printed out, when needed, by theimage printer 9 as image having a shade of color in accordance with the intensity of fluorescence or as image in which the intensity of fluorescence is divided by contour lines, colors or concentrations of color. The image having the shade of color in accordance with the intensity of fluorescence looks equal to an X-ray film image of data obtained by labelling the sample with a radioactive isotope in conventional manner and subjecting the sample to electrophoresis. The data of the results after data processing may be stored, when needed, as digital data in a magnetically or optically recording device. - Referring to Fig. 2 showing the configuration of the
instrumentation unit body 7, laser beams, as indicated by 31, emitted from thelight source 21 are scanned in the direction from the front to the rear in the drawing with the vibratingmirror 22 to be driven by themirror driver 30 and the gel member as an object of reading is exposed to the laser beams 31. The spot lights of thelaser beams 31 scanned by the vibratingmirror 22 irradiates the gel member of theelectrophoresis unit section 5 in the direction of thickness of the gel member thereof while moving. The gel member of theelectrophoresis unit section 5 emits fluorescence upon irradiation with the spot lights of the scannedlaser beams 31, and the resulting fluorescence, as indicated by 31, with the spot lights of the laser beams, as indicated by 31, and the resulting fluorescence is received by thelight collector 23. Thelight collector 23 is arranged to have a light path for receivingfluorescence 13 having an optic axis so as to be deviated from the optic axis of the spot light thrown on theelectrophoresis unit section 5 and the optical lens system is arranged in a spatial position relationship of the light path for receiving thefluorescence 13 so as to receive the fluorescence, as indicated by 13, with enhanced sensitivity to separate from the scattered light emitted from the irradiated surface of theelectrophoresis unit section 5. The light received by thelight collector 23 is converted into electric signals by theoptoelectric conversion section 24 and then amplified by theamplifier 25. Anoptic trap 32 is mounted on the side opposite to the surface of theelectrophoresis unit section 5 to be irradiated with thelaser beams 31 in order for thelaser beams 31, as stray light, to cause no adverse influence upon the surface of theelectrophoresis unit section 5 after transmission through the gel member. - The
light collector 23 receives thefluorescence 13 through theoptoelectric conversion section 24 with enhanced sensitivity to receiving of thefluorescence 13 to be detected, and thefluorescence 13 received is then converted through theoptoelectric conversion section 24 into electric signals which in turn are amplified by theamplifier 25 and entered into the analog-digital conversion circuit 26, whereby the electric signals are converted into digital data. The signals detected from the fluorescence and converted into digital data is stored by thememory 28 and transmitted to thedata processor 8 through theinterface 29. The overall control over a series of signal processing is carried out by thecontrol circuit 27. - Description will now be made of the configuration of each portion of the instrumentation unit body of the electrophoresis pattern reading apparatus (as shown in Fig. 2). Fig. 4 is a view showing the light scanning mechanism for scanning a gel surface with laser beams by using the vibrating mirror and Fig. 5 is a graph showing the relationship between the angles of rotation of the vibrating mirror and the distance in which spot light of the laser beams moves.
- As shown in Fig. 4, the
light source 21 and the vibratingmirror 22 are disposed in the positions relative to theelectrophoresis unit section 5. This position relationship causes the light spot to move at the both end portions of theelectrophoresis unit section 5 at a speed faster than at the portion in the vicinity of the central portion thereof (X = 0), for example, when the vibratingmirror 22 is driven by themirror driver 30 so as to vibrate at an isometric speed. This causes the difference in sensitivity to detect fluorescence to be detected between the central portion of the sample of theelectrophoresis unit section 5 and its end portion. Hence, in this embodiment, the speed of driving the vibratingmirror 22 is corrected in order to move the spot light of the laser beams at an equal speed on the gel member of theelectrophoresis unit section 5. In other words, the relationship between the position X of the spot light and the angle θ of the vibratingmirror 22 is set as shown in Fig. 5. The angle θ of the vibratingmirror 22 is represented by the following:
- X is
- the distance in the plane direction having the point as origin, a point from which the phantom line extends vertical to the surface of the gel member of the electrophoresis unit section from the center of rotation of the vibrating
mirror 22; and - Z is
- the distance from the center of rotation of the vibrating
mirror 22 to the gel member of theelectrophoresis unit section 5. - The angle of rotation and the distance of travel for the light scanning mechanism of this type may be corrected by a fθ lens, however, the fθ lens is expensive and the unit for mounting the fθ lens becomes heavy as a whole. In this embodiment, the
mirror driver 30 is provided with a control circuit for implementing variable control of the speed of rotating the vibratingmirror 22 to control the speed of driving the rotation of the vibratingmirror 22 of the light scanning mechanism and the distance of moving the vibratingmirror 22 thereof, thereby correcting the angle of rotating the vibratingmirror 22 thereof. - Fig. 6 is a block diagram showing the configuration of the essential portion of the circuit for controlling a mirror driver for controlling the rotation of the vibrating
mirror 22. - A linear motor is employed as an actuator for the vibrating
mirror 22, and the angle of rotating the vibratingmirror 22 can be controlled by applying voltage in proportion to the angle of rotation. In order to allow the spot lights of the laser beams to move at equal speeds on the surface of the gel member, the distance X of the surface thereof is so set as to become proportional to the time t. As the relationship between the angle θ of rotating the vibrating mirror and the distance X of moving the spot lights is as shown in Fig. 5, there is generated a signal in a wave form indicative of voltage corresponding to the graph of Fig. 5 wherein the axis of abscissas indicates the time and the axis of ordinates indicates the voltage and this signal serves as controlling the driving of the vibratingmirror 22. The generation of the control signal is controlled by the control circuit of themirror driver 30, and the control signal is fed to the actuator of the vibratingmirror 22 for controlling the driving of the vibratingmirror 22. - As shown in Fig. 6, the
mirror driver 30 comprises a read-only memory 30a having functional wave forms stored therein, a digital-analog conversion circuit 30b for converting the read function data into voltage signals, adriver 30c for amplifying the converted voltage signals and generating a control signal for controlling the driving of themirror driver 30, acounter 30d for giving read addresses in time series to thememory 30a, and anoscillating circuit 30e for providing the counter with clock signals. - The
oscillating circuit 30e is operated by an instruction from thecontrol circuit 27 of theinstrumentation unit body 7, and clock signals is entered into thecounter 30d from theoscillating circuit 30e, thereby counting the clock signals and generating the read addresses to be fed to the read-only memory 30a in time series. As the read addresses generated by thecounter 30d are fed to the read-only memory 30a in time series, the function data stored in advance is read out one after another from the read-only memory 30a. In the read-only memory 30a is in advance written the function data (as shown in Fig. 5) relating to the angle of rotation of the vibratingmirror 22, and such function data is read in time series. In this example, the number of bits of the function data is 12 bits, and the function data to be read out is converted by the digital-analog conversion circuit 30b into voltage signals of analog signals for controlling the angle of rotation of the vibratingmirror 22. The voltage signals are processed to remove noises in a step type by filtering with themirror driver 30. After the voltage signals are then amplified, they are fed to the vibratingmirror 22, thereby allowing the vibratingmirror 22 to be rotated at a desired angular speed so as to become constant in the speed of moving (scanning) the spot lights of the laser beams on the electrophoresis unit section. - The scanning speed is so set as to be variable at 0.5Hz, 1Hz, 5Hz, 10Hz, 20Hz, 50Hz, 100Hz and 200Hz in order to become approximately logarithmically equal. This arrangement permits an efficient reading by changing the reading speeds in accordance with the quantity of the fluorescent substances for use in labelling the samples for electrophoresis or the difference in the quantum efficiency of the fluorescent substances. The scanning speed can be designated through the
operation display panel 7b or thedata processor 8 by transmitting designation data from thecontrol circuit 27 to themirror driver 30 and controlling thecounter 30d and theoscillating circuit 30e, thereby driving the vibratingmirror 22 at a desired scanning speed. - By implementing the control of driving the vibrating
mirror 22 in the way as described hereinabove, the laser beams from thelight source 21 are scanned and radiated as spot lights capable of moving on theelectrophoresis unit section 5 at a constant speed. The irradiation of the gel member of theelectrophoresis unit section 5 with the laser light excites the fluorescent substance present in the gel member thereof irradiated with the laser light, thereby emitting fluorescence as indicated by 13. - Fig. 7 is a schematic representation showing the detail configuration of the optic system in the
light collector 13 for receiving the light generated from the gel member and Fig. 8 is a schematic representation showing an example of the detail configuration of the optic system in the optoelectric conversion section, particularly the light path. The gel member of theelectrophoresis unit section 5 is interposed between thegel support members gel support members gel support members - As shown in Fig. 7, as the
electrophoresis unit section 5 is irradiated withlaser beams 31 which moves while being scanned, the light of thelaser beams 31 is thrown on thegel support member 5c and transmits through thegel support member 5c in the direction of its thickness, reaching thegel member 5a through which in turn the irradiated light of thelaser beams 31 advances in the direction of its thickness and the light transmits through thegel member 5a and then thegel member 5b. Each of thegel support members gel member 5a is approximately 0.35 mm thick. The light of thelaser beams 31 thrown on thegel support members gel member 5a is so set as to reach thegel member 5a at a substantially equal light intensity in any position of theelectrophoresis unit section 5. Further, the expansion oflaser beams 31 or the reduction in its intensity due to scattered light to be generated on the plane of incidence of the irradiating light for thegel member 5a as well as thegel support members laser beams 31 are damped down by theoptical trap 32 after transmission through the gel member, in order to cause no adverse influence as stray light. - The fluorescence is generated from the inside of the
gel member 5a by scanning the exciting light in the manner as described hereinabove, and the fluorescence is collected by thelight collector 23, together with scattered light by the exciting light. The scattered light generated in thegel support members optoelectrical conversion section 24. In theoptoelectrical conversion section 24, the fluorescence and the scattered light generated in the gel member are separated from each other by the optic filter, and only the fluorescence separated from the gel member is transmitted to theoptoelectrical conversion section 24 which can convert faint fluorescence into electric signals by a photomultiplier. - Description will now be made of the configuration of the optic system in the
light collector 23 and theoptoelectrical conversion section 24 with reference to Figs. 7 and 8. - As shown in Fig. 7, the
light collector 23 is so arranged as to collect the fluorescence resulting from theelectrophoresis unit section 5 and scattered light of the irradiating light resulting from thegel support members electrophoresis unit section 5, which were received by the cylindrical lens 23a, are formed as image on the side opposite to the cylindrical lens 23a. In Fig. 7, the point A is a focal point of the fluorescence resulting from thegel member 5a and of the scattered light of the exciting light generated from thegel member 5a. On the other hand, for example, the scatter light of the exciting light generated on the surface of thegel support member 5c can form image at the focal point A'. It is to be noted herein that the fluorescence can be separated from the scattered light resulting from the gel support members in a geometrical-optical manner due to the spatial position relationship of the light path for receiving the light by disposing theoptical fiber array 23b at the focal point A so as to receive the fluorescence from thegel member 5a. In the method for irradiating the gel member with the irradiating light in the direction of thickness of the gel member, a quantity of scattered light emitted in the boundary surfaces becomes very small because the refractive index of the gel member is approximately as low as 1.4 to 1.5 and relatively close to the refractive index of the gel support members, such as glass plates, and the gel member is closely attached to the gel support members to thereby form a tight boundary surface between them. Hence, the light received at the point A contains a lesser quantity of the scattered light of the exciting light emitting from the surface of thegel member 5a, while it contains a larger rate of fluorescence emitting from the inside of thegel member 5a. - When the irradiating light is scanned directly on the
gel member 5a from which either one of or both of thegel support members instrumentation unit body 7 demonstrates substantially the same effect as the glass plate panel of the gel support member, thereby suppressing the detecting sensitivity from reducing to a great extent and permitting the fluorescence emitting from the surface of the gel member to be detected with high efficiency. It is to be noted herein that, if the removal of thegel support members gel member 5a with a pigment or the like, it is preferred to read thegel member 5a in such a state that thegel member 5a is interposed between thegel support members - Although one cylindrical lens is employed for the
light collector 23 in this embodiment, another cylindrical lens may be disposed at the position symmetrical to the surface on which the laser beams are scanning or on the side opposite to the sample side. Further, when a magnitude of the fluorescence is insufficient, for example, cylindrical lenses and optic fiber arrays may be disposed at four locations so as to encircle the scanning line of the gel member emitting fluorescence, thereby increasing the quantity of light to be collected and enhancing the magnitude of fluorescence to be detected. In this case, it is effective to deviate the optic axes so as to cause no reflection from the surface of the cylindrical lens to adversely affect the cylindrical lens facing the other one. The fluorescence collected by theoptic fiber array 23b is led to each of the optic fibers of theoptic fiber arrays 23b, and the optic fibers are combined and entered into theoptoelectric conversion section 24. - As shown in Fig. 8, the configuration of the optic system in the
optoelectric conversion section 24 is arranged in such a way that the fluorescence entered into theoptoelectric conversion section 24 from theoptic fiber array 23b is so processed as to extract parallel light components only by a first lens 24a, adiaphragm 24b and asecond lens 24c and the parallel light components are entered into theoptic filter 24d which in turn is disposed at an angle of approximately 20 degrees relative to the direction perpendicular to the direction of passage of the light. Theoptic filter 24d is so designed as to have the band pass filter characteristic having the central wavelength of 605 nm for the transmitting light and, further, the characteristic of reflecting the light having the wavelength of the light other than the transmitting light, which reflects on the side of entering into theoptic filter 24d. Hence, the wavelength component of fluorescence from a first fluorescent substance can be extracted from the light that has transmitted through theoptic filter 24d. The wavelength component of the fluorescence is then collected by athird lens 24e and led to afirst photomultiplier 24f where electric signals are produced for the intensity of fluorescence of the first wavelength component of the fluorescence. Likewise, the fluorescence having the wavelength components of second and following fluorescent substances can be extracted from the light reflecting from theoptic filter 24d. Hence, as in the embodiment as shown in Fig. 8, the light reflected from theoptic filter 24d is further led to asecond optic filter 24g which in turn remove the wavelength component of the exciting light, followed by collecting light with afourth lens 24h and generating electric signals corresponding to the intensity of fluorescence of the wavelength of the second fluorescence through a second photomultiplier 24i. - Fig. 9 is a schematic representation showing another example of the detail configuration of the optical filter section for separating fluorescence into a number of wavelength components through a number of optic filters.
- In separating the fluorescence into a number of wavelength components, the optic filter section is configured as in Fig. 9, in which the
second optic filter 24g is disposed at the position at which the light reflects from the firstoptic filter 24d and a thirdoptic filter 24j is disposed at the position at which the light reflects from thesecond optic filter 24g, and further a fourthoptic filter 24k is disposed at the position at which the light reflects from the thirdoptic filter 24j. This arrangement can separate fluorescence having different wavelength components as lights A, B, C and D transmitting through the first, second, third and fourthoptic filters - By separating the resulting fluorescence from the scattered light of the exciting light, the
respective photomultipliers 24f and 24i generate the electric signals corresponding to the intensity of fluorescence in accordance with the wavelength components of each fluorescence with the improved signal-to-noise ratio. The resulting electric signals are entered into the amplifiers of plural systems, each system of which amplifies faint signals to a sufficient extent in an amplification stage containing an integral circuit. - Fig. 10 is a circuit diagram showing the circuit configuration of an amplifier containing the integral circuit. As shown in Fig. 10, the
amplifier 25 has the integral circuit composed of an operation amplifier in the front amplification stage and an output amplification circuit composed of an operation amplifier in the following amplification stage. The electric signals from thephotomultiplier 24f are entered into anoperational amplifier 25a which in turn constitutes the integral circuit, together with a condenser 25c and aswitch 25d for controlling the integral operation. The output of the integral circuit is entered into anoperational amplifier 25b and amplified with a gain to be determined by an external resistance, followed by transmission to an analog-digital converting circuit which follows. - The operation in the
amplifier 25 containing the integrating circuit having the configuration as described hereinabove will now be described with reference to the timing chart as shown in Fig. 11. The output of thephotomultiplier 24f has a very large output impedance so that it can be regarded as if it is a source of electric currents. For theoperational amplifier 25a, there is employed a high-input impedance of a FET (Field Effective Transistor) input type. Hence, when theswitch 25d is turned off, the output current ip of thephotomultiplier 24f flows entirely as it is through the condenser 25c. The output voltage of theoperational amplifier 25a is converted into output in a lamp function type, as shown in Fig. 11. Such integrating operations involves integrating for a period of time corresponding to one pixel, allowing a sampling circuit within the analog-digital conversion circuit 26 to sample signals at the timing of matching with a S/H clock, holding the resulting signals as it is, supplying the analog signals to the analog-digital convertingcircuit 26 where the analog signals are converted into digital signals. After the signals are held, the C/D clock serving as a C/D control signal to be added to theswitch 25d is made active, thereby discharging electric charges accumulated in the condenser 25c. The operations are repeated in the way as described hereinabove. - The amplification stage using the integrating circuit by the operational amplifier can be a psudo-integrating circuit composed of a resistance and a condenser only. It is to be noted, however, that the integrating circuit in the operational amplifier having the configuration as described hereinabove can provide a higher signal-to-noise ratio because it can integrate the electric charges of the electric signals from the
photomultiplier 24f to an almost complete level. Further, the integrating time can be changed in an arbitrary manner by changing the C/D clock of the C/D control signals for theswitch 25d. Hence, a degree of amplification for amplifying faint signals in a comprehensive fashion can readily be adjusted. In this embodiment, the control can be carried out so as to agree with an area of the reading sample by corresponding to or synchronizing with the operation of themirror driver 30 as shown in Fig. 4, thereby saving time by avoiding useless period of time for reading. Further, the speed of scanning the exciting light and the integrating time of the amplifier on the side of receiving light can be set so as to agree with the intensity of fluorescence from the sample with high freedom, thereby permitting a very flexible device configuration. Furthermore, when the integral operations are to be implemented with the condenser and the resistance only, the values of the condenser and the resistance can be shifted so as to become a time constant corresponding to the speed of scanning the irradiating light, so that the integrating operation can be realized in a pseudo fashion. - The electric signals amplified by the amplifier 25 (Fig. 2) are entered into the analog-
digital conversion circuit 26, where the analog signals are converted into digital signals. The signals indicative of the fluorescence detected, which are converted into digital data, are stored in thememory 28 and the data stored in thememory 28 is transmitted to thedata processor 8 through aninterface circuit 29. The overall control for performing such a series of signal processing is carried out by thecontrol circuit 27. - Description will now be made of a variant example of the elements structuring the multi-colored electrophoresis pattern reading apparatus according to the embodiment of the present invention.
- Fig. 12 is a schematic representation showing another example of the configuration of the light collector for detecting plurally separated wavelength components of fluorescence and the optoelectric conversion section.
- In the previous embodiment, the configuration for separating a plurality of wavelength components of fluorescence is implemented by employing a plurality of optic filters for the
optoelectric conversion unit 24. It can further be noted that the fluorescence intensity of each of the desired fluorescent wavelength components can be detected by each of the optic filters by employing a plurality of systems consisting of the light collectors and the optoelectric conversion units. In this case, the wavelength components of fluorescence can be individually detected by the optic system of each of the light collectors and the optoelectric conversion units, so that even faint fluorescence can be detected with high sensitivity. As shown in Fig. 12, this configuration provides electric signals of each of the wavelength components of fluorescence by dividing the fluorescence entering from theelectrophoresis unit section 5 with theoptic fiber arrays optic fiber arrays optoelectric conversion units optic fiber arrays - Fig. 13 is a schematic representation showing an example of the configuration of the optoelectric conversion section to be employed when the optic filter is mechanically moved to change the wavelength component of fluorescence to be selected. The fluorescence entered from the
optic fiber array 23b is so processed as to collimate the parallel components only through the first lens, the diaphragm and the second lens and the parallel components of the fluorescence are then allowed to reach thephotomultiplier 39 through the optic filter 37 or theoptic filter 38. Theoptic filter 37 or 38 may be shifted so as to be selected in accordance with requirements by using anelectromagnetically reciprocating solenoid 40. This arrangement allows a time sharing separation of the wavelength components of the fluorescence by shifting the plural optic filters in a time sharing way. This arrangement requires only onephotomultiplier 39, which is very expensive, to separate the wavelength components of fluorescence in a time sharing fashion, so that costs of the device configuration can be reduced. - Fig. 14 is a schematic representation showing an example of the configuration of the light source in which plural kinds of excited light having different wavelength are united into one beam. In this configuration, the laser beams generated from each of a
first light source 41 and a secondlight source 42, each emitting light having a predetermined wavelength component, are entered into a cube-shapedbeam splitter 43. In this embodiment, the light sources comprise thefirst light source 41 for emitting green laser beams having the wavelength of 532 nm and the secondlight source 42 for emitting argon ion laser. Thesurface 43a of a half mirror disposed in thebeam splitter 43 has a membrane capable of transmitting the light from thefirst light source 41 while reflecting the light from the secondlight source 42. This arrangement permits the lights from the two light sources to be employed as one separate light beam. - It is to be noted that the kind of the fluorescent substances to be employed for labelling the samples can be increased by employing a plurality of light sources for emitting exciting lights for exciting the fluorescent substances contained in the electrophoresis pattern. In this embodiment, the fluorescent substances such as Texas red, tetramethyl rhodamin isothiocyanate (TRITC) and so on can be excited by the light from the
first light source 41, while the fluorescent substances such as fluorescein isothiocyanate, 4-chloro-7-nitrobenz-2-oxa-1-diazole (NBD chloride) and so on can be excited by the light from the secondlight source 42. - In the embodiment of the configuration of the light source as described hereinabove, one beam splitter is employed as a structuring element for the light source. It is to be noted, however, that two beam splitters may be employed by disposing the second beam splitter on the side of the beam united by the first beam splitter, thereby allowing two or more light beams to be admixed with each other and united into one beam. Further, it is to be noted that laser having a plurality of oscillating wavelength and laser capable of emitting higher harmonics may be employed as it is as a light source.
- Fig. 15 is a schematic representation showing an example of output of an electrophoresis pattern obtained by reading the results of electrophoresing a sample of a protein with the multi-colored electrophoresis pattern reading apparatus in a two-dimensional way. In this embodiment, for instance, the data on the electrophoresis pattern read from a reference sample is colored in red and the data on the electrophoresis pattern read from a sample to be detected is colored in blue. It is noted as a matter of course that any combination of colors can be employed. The example as shown in Fig. 15 reveals that bands identified by 45 on the electrophoresis pattern are colored in violet, as indicated by vertical dot lines in the drawing, and the
bands 45 represent a combination of the band in red resulting from the reference sample and the band in blue resulting from the sample to be detected, each of the bands being located in the identical positions on the electrophoresis pattern. This means that the sample to be detected contains the same structural fragment portion as the reference sample. When the samples have different structural fragment portions, the bands resulting from that fragment portions, as indicated by 46 and 47 in the drawing, are located in different positions on the electrophoresis pattern and colored in red and blue, which originate from the reference sample and the sample to be detected, respectively. This electrophoresis pattern can serve to a great extent as a ready and simple comparison among the bands simply by determining the colors on the bands. - Further, experimental items such as experiment date, experiment number, conditions, etc. should be written with oil-base ink or the like for managing the image from X-ray films. On the other hand, they can be written together with output of the electrophoresis pattern for the apparatus according to the present invention merely by entering those experimental items at predetermined positions through an input unit. This permits the output results as electrophoresis patterns to be managed with ready reference and easy availability.
- As described hereinabove, the multi-colored electrophoresis pattern reading apparatus according to the present invention allows an electrophoresis plate itself (the electrophoresis unit section) to be read as it is after electrophoresis has been finished and mounted to the reading unit separately disposed from the electrophoresis unit, so that even if a long period of time is required as for the case in which two-dimensional electrophoresis results are to be read, the electrophoresis unit can be employed for electrophoresing another sample, thereby improving operational efficiency of the electrophoresis unit to a great extent.
- Further, as described hereinabove, the multi-colored electrophoresis pattern reading apparatus according to the present invention can read a plurality of fluorescent pigments labelled on the samples by separating the light components by their wavelength, thereby permitting the electrophoresis results to be obtained from two or more different samples at the same time. Furthermore, the multi-colored electrophoresis pattern reading apparatus of the present invention is so arranged as to cause a deviation such as a warp resulting from electrophoresis to occur on the samples in the same manner, so that the molecular weights of the two samples or more and other parameters can be compared without correction of the electrophoresis results, thereby making a comparison of the electrophoresis results very simple and easy. In addition, the gel member is removed from the electrophoresis unit and mounted to the reading unit after the electrophoresis has been finished, so that the results obtainable by two-dimensional electrophoresis as well as by one-dimensional electrophoresis can be read in the same manner.
Claims (6)
- Apparatus for reading gel electrophoresis patterns of a plurality of samples separately labelled with different fluorescent substances having different fluorescence wavelengths,
comprising- light source means (21) for irradiating a gel member (5a) comprising the electrophoresis pattern with irradiated light (31) for exciting the fluorescent substances labelled on the respective samples to emit fluorescence light (13),- light receiving means (23) for receiving the fluorescence light (13) resulting from a reading surface of the gel member (5a) separated from scattered light on the basis of the spatial position relationship therebetween,- optical filter means (24d, 24g) for separating optical signals received by the light receiving means (23) into the respective fluorescence wavelengths,- optoelectric conversion means (24; 24f, 24i) for optoelectric conversion of the optical signals separated by the optical filter means (24d, 24g) into electrical signals corresponding to the intensity of the respective fluorescence light (13),and- amplifier means (25) for amplifying the electrical signals received from the optoelectric conversion means (24; 24f, 24i) and generating corresponding electrical signals indicative of the fluorescence from the electrophoresis pattern one after another,characterized in that- the apparatus (6) is designed for reading already developed electrophoresis patterns,- light scanning means (22, 30) are provided for scanning the irradiated light (31) and irradiating the gel member (5a) comprising the electrophoresis pattern in the direction of the thickness of the gel member (5a),- the optical axis of the light path of the light receiving means (23) for receiving fluorescence light (13) is arranged in a direction different from that of the optical axis of the irradiated light (31),- the light receiving means (23) comprise a cylindrical lens (23a) arranged such as to receive the fluorescence light (13) resulting from the gel member (5a) and scattered light resulting from the gel member (5a) and from the surface of a gel support member (5b, 5c) and to focus the fluorescence light (13) and scattered light resulting from the gel member (5a) in a focal point A at the optoelectric conversion means (24), and focusing the scattered light resulting from a gel support member (5b, 5c) in a focal point A' at a position different from that of the focal point A,and- the amplifier means (25) comprise an integration circuit (25a). - Apparatus according to claim 1, characterized in that it comprises a data processor (8) processing the signals obtained from the amplifier means (25) according to a predetermined program, and an image printer (9) for printing images on the basis of the data from the data processor, having a shade of color in accordance with the intensity of the fluorescence light (13) of the respective wavelengths, or in which the intensity of the fluorescence light (13), is indicated by contour lines, colors or color intensities of the respective wavelengths.
- Apparatus according to claim 1 and/or 2, characterized in that the optical filter means (24d, 24g, 24j, 24k) divide the optical signals transmitted from the light receiving means (23) into at least two separated optical signals (A, B, C, D) having different wavelengths.
- Apparatus according to any of claims 1 to 3, characterized in that the optical filter means (24d, 24g, 24j, 24k) are reflective filters having a wavelength for reflecting light different from the wavelength for light to be transmitted.
- Apparatus according to any of claims 1 to 3, characterized in that the optical filter means separate the light from the light receiving means (23) by shifting a plurality of optical filters (37, 38) in a time sharing way.
- Apparatus according to any of claims 1 to 4, characterized in that the light source means (21) comprise a plurality of light sources (41, 42) emitting light of different peak wavelength united into one beam forming the irradiated light (31).
Applications Claiming Priority (2)
| Application Number | Priority Date | Filing Date | Title |
|---|---|---|---|
| JP335554/90 | 1990-11-30 | ||
| JP2335554A JP2814409B2 (en) | 1990-11-30 | 1990-11-30 | Multicolor electrophoresis pattern reader |
Publications (3)
| Publication Number | Publication Date |
|---|---|
| EP0488422A2 EP0488422A2 (en) | 1992-06-03 |
| EP0488422A3 EP0488422A3 (en) | 1993-04-07 |
| EP0488422B1 true EP0488422B1 (en) | 1997-04-09 |
Family
ID=18289883
Family Applications (1)
| Application Number | Title | Priority Date | Filing Date |
|---|---|---|---|
| EP91120663A Expired - Lifetime EP0488422B1 (en) | 1990-11-30 | 1991-12-02 | Apparatus for reading fluorescent-labelled gel electrophoresis patterns |
Country Status (4)
| Country | Link |
|---|---|
| US (1) | US5213673A (en) |
| EP (1) | EP0488422B1 (en) |
| JP (1) | JP2814409B2 (en) |
| DE (1) | DE69125574T2 (en) |
Families Citing this family (28)
| Publication number | Priority date | Publication date | Assignee | Title |
|---|---|---|---|---|
| JPH083481B2 (en) * | 1989-06-07 | 1996-01-17 | 日立ソフトウェアエンジニアリング株式会社 | Fluorescent electrophoresis pattern reader |
| JP2873884B2 (en) * | 1991-03-22 | 1999-03-24 | 日立ソフトウェアエンジニアリング 株式会社 | Multicolor electrophoresis pattern reader |
| CA2094343A1 (en) * | 1992-07-17 | 1994-01-18 | Gerald L. Klein | Method and apparatus for displaying capillary electrophoresis data |
| US5268568A (en) * | 1992-11-30 | 1993-12-07 | Lee Thomas E | Marker dye band detector for gel electrophoresis using balanced light emitters |
| US5853979A (en) | 1995-06-30 | 1998-12-29 | Visible Genetics Inc. | Method and system for DNA sequence determination and mutation detection with reference to a standard |
| DE19535114B4 (en) | 1994-09-21 | 2013-09-05 | Hoya Corp. | Endoscope system with fluorescence diagnosis |
| US5710628A (en) * | 1994-12-12 | 1998-01-20 | Visible Genetics Inc. | Automated electrophoresis and fluorescence detection apparatus and method |
| US6014213A (en) * | 1994-12-12 | 2000-01-11 | Visible Genetics Inc. | High dynamic range apparatus for separation and detection of polynucleotide fragments |
| US5543018A (en) * | 1995-02-13 | 1996-08-06 | Visible Genetics Inc. | Method and apparatus for automated electrophoresis using light polarization detector |
| US5863504A (en) * | 1995-03-16 | 1999-01-26 | Bio-Rad Laboratories, Inc. | Fluorescence imaging instrument utilizing fish |
| US5784152A (en) * | 1995-03-16 | 1998-07-21 | Bio-Rad Laboratories | Tunable excitation and/or tunable detection microplate reader |
| US5981186A (en) * | 1995-06-30 | 1999-11-09 | Visible Genetics, Inc. | Method and apparatus for DNA-sequencing using reduced number of sequencing mixtures |
| JP3012794B2 (en) * | 1995-10-02 | 2000-02-28 | 日立ソフトウエアエンジニアリング株式会社 | Scanner device |
| US6432634B1 (en) | 1996-04-18 | 2002-08-13 | Visible Genetics Inc. | Method, apparatus and kits for sequencing of nucleic acids using multiple dyes |
| US5699157A (en) * | 1996-07-16 | 1997-12-16 | Caliper Technologies Corp. | Fourier detection of species migrating in a microchannel |
| US5871628A (en) | 1996-08-22 | 1999-02-16 | The University Of Texas System | Automatic sequencer/genotyper having extended spectral response |
| US6043506A (en) * | 1997-08-13 | 2000-03-28 | Bio-Rad Laboratories, Inc. | Multi parameter scanner |
| EP0902280A3 (en) * | 1997-09-11 | 2000-04-12 | Hitachi Software Engineering Co., Ltd. | Apparatus for reading a luminescence pattern of a sample |
| US6430512B1 (en) | 1997-12-30 | 2002-08-06 | Caliper Technologies Corp. | Software for the display of chromatographic separation data |
| US6051835A (en) * | 1998-01-07 | 2000-04-18 | Bio-Rad Laboratories, Inc. | Spectral imaging apparatus and methodology |
| JP3333449B2 (en) * | 1998-04-30 | 2002-10-15 | 富士写真フイルム株式会社 | Image reading device |
| DE19935766A1 (en) * | 1999-07-29 | 2001-02-01 | Friedrich Schiller Uni Jena Bu | Process for the optical excitation of fluorophore-labeled DNA and RNA |
| US6436641B1 (en) * | 2000-04-17 | 2002-08-20 | Visible Genetics Inc. | Method and apparatus for DNA sequencing |
| US6397150B1 (en) | 2000-07-27 | 2002-05-28 | Visible Genetics Inc. | Method and apparatus for sequencing of DNA using an internal calibrant |
| US7222059B2 (en) * | 2001-11-15 | 2007-05-22 | Siemens Medical Solutions Diagnostics | Electrophoretic trace simulator |
| JP4417116B2 (en) | 2002-03-05 | 2010-02-17 | カリパー・ライフ・サイエンシズ・インク. | Mixed microfluidic system |
| JP2004361239A (en) * | 2003-06-04 | 2004-12-24 | Enplas Corp | Optical system for micro analytical system |
| JP2010078559A (en) * | 2008-09-29 | 2010-04-08 | Sumitomo Electric Ind Ltd | Fluorescence analyzer and method |
Family Cites Families (12)
| Publication number | Priority date | Publication date | Assignee | Title |
|---|---|---|---|---|
| JPS5217899A (en) * | 1975-07-31 | 1977-02-10 | Matsushita Electric Ind Co Ltd | Data recording apparatus for densitometers |
| JPS613043A (en) * | 1984-06-18 | 1986-01-09 | Hitachi Ltd | Apparatus for determining base sequence of nucleic acid |
| US4657095A (en) * | 1985-10-08 | 1987-04-14 | Westinghouse Electric Corp. | Compact ice basket weighing tool |
| CA1340806C (en) * | 1986-07-02 | 1999-11-02 | James Merrill Prober | Method, system and reagents for dna sequencing |
| JPH0799353B2 (en) * | 1987-03-31 | 1995-10-25 | 株式会社島津製作所 | Nucleotide sequencer |
| EP0294524B1 (en) * | 1987-06-09 | 1997-11-26 | The Perkin-Elmer Corporation | Real time scanning electrophoresis apparatus for DNA sequencing |
| US4833332A (en) * | 1987-06-12 | 1989-05-23 | E. I. Du Pont De Nemours And Company | Scanning fluorescent detection system |
| JP2550106B2 (en) * | 1987-10-30 | 1996-11-06 | 株式会社日立製作所 | Optical dispersion detection type electrophoretic device |
| JPH01209351A (en) * | 1988-02-17 | 1989-08-23 | Shimadzu Corp | Base sequence determining apparatus |
| JPH0210266A (en) * | 1988-06-29 | 1990-01-16 | Shimadzu Corp | Apparatus for determining arrangement of base |
| JP2701412B2 (en) * | 1989-01-31 | 1998-01-21 | 株式会社島津製作所 | Gel electrophoresis device |
| US5062942A (en) * | 1989-04-12 | 1991-11-05 | Hitachi, Ltd. | Fluorescence detection type electrophoresis apparatus |
-
1990
- 1990-11-30 JP JP2335554A patent/JP2814409B2/en not_active Expired - Fee Related
-
1991
- 1991-11-29 US US07/800,847 patent/US5213673A/en not_active Expired - Lifetime
- 1991-12-02 EP EP91120663A patent/EP0488422B1/en not_active Expired - Lifetime
- 1991-12-02 DE DE69125574T patent/DE69125574T2/en not_active Expired - Lifetime
Also Published As
| Publication number | Publication date |
|---|---|
| JPH04204151A (en) | 1992-07-24 |
| DE69125574T2 (en) | 1997-11-13 |
| EP0488422A3 (en) | 1993-04-07 |
| US5213673A (en) | 1993-05-25 |
| DE69125574D1 (en) | 1997-05-15 |
| JP2814409B2 (en) | 1998-10-22 |
| EP0488422A2 (en) | 1992-06-03 |
Similar Documents
| Publication | Publication Date | Title |
|---|---|---|
| EP0488422B1 (en) | Apparatus for reading fluorescent-labelled gel electrophoresis patterns | |
| EP0504943B1 (en) | Multi-colored electrophoresis pattern reading system | |
| EP0644419B1 (en) | Scanner | |
| EP0440342B1 (en) | Laser excited confocol microscope fluorescence scanner and method | |
| US5051162A (en) | Fluorescence detection type electrophoresis apparatus and its supporting vessel | |
| US5538613A (en) | Electrophoresis analyzer | |
| US5242567A (en) | Fluorescent pattern reading apparatus | |
| US5556529A (en) | DNA base sequencer | |
| EP0626578B1 (en) | Apparatus for gel electrophoresis | |
| JPH1194743A (en) | Reader for fluorescent pattern | |
| JPS63231247A (en) | Electrophoretic separating and detecting device | |
| JP2516115B2 (en) | Fluorescent pattern reader | |
| JP2516112B2 (en) | Nucleic acid electrophoresis pattern reading method | |
| JPH0572179A (en) | Detecting device for two-dimensional fluorescent image of nucleic acid and protein | |
| JP2640704B2 (en) | Fluorescent pattern reader | |
| JP2692679B2 (en) | Electrophoretic separation detection method and apparatus | |
| JP3060001B2 (en) | Fluorescence electrophoresis pattern reader | |
| EP0523457A1 (en) | Method for making nylon membrane transparent | |
| JP2697719B2 (en) | Electrophoretic separation detection method and apparatus |
Legal Events
| Date | Code | Title | Description |
|---|---|---|---|
| PUAI | Public reference made under article 153(3) epc to a published international application that has entered the european phase |
Free format text: ORIGINAL CODE: 0009012 |
|
| AK | Designated contracting states |
Kind code of ref document: A2 Designated state(s): DE FR GB SE |
|
| PUAL | Search report despatched |
Free format text: ORIGINAL CODE: 0009013 |
|
| AK | Designated contracting states |
Kind code of ref document: A3 Designated state(s): DE FR GB SE |
|
| 17P | Request for examination filed |
Effective date: 19930414 |
|
| 17Q | First examination report despatched |
Effective date: 19950214 |
|
| GRAG | Despatch of communication of intention to grant |
Free format text: ORIGINAL CODE: EPIDOS AGRA |
|
| GRAH | Despatch of communication of intention to grant a patent |
Free format text: ORIGINAL CODE: EPIDOS IGRA |
|
| GRAH | Despatch of communication of intention to grant a patent |
Free format text: ORIGINAL CODE: EPIDOS IGRA |
|
| GRAA | (expected) grant |
Free format text: ORIGINAL CODE: 0009210 |
|
| AK | Designated contracting states |
Kind code of ref document: B1 Designated state(s): DE FR GB SE |
|
| REF | Corresponds to: |
Ref document number: 69125574 Country of ref document: DE Date of ref document: 19970515 |
|
| ET | Fr: translation filed | ||
| PLBE | No opposition filed within time limit |
Free format text: ORIGINAL CODE: 0009261 |
|
| STAA | Information on the status of an ep patent application or granted ep patent |
Free format text: STATUS: NO OPPOSITION FILED WITHIN TIME LIMIT |
|
| 26N | No opposition filed | ||
| REG | Reference to a national code |
Ref country code: GB Ref legal event code: IF02 |
|
| PGFP | Annual fee paid to national office [announced via postgrant information from national office to epo] |
Ref country code: FR Payment date: 20101221 Year of fee payment: 20 |
|
| PGFP | Annual fee paid to national office [announced via postgrant information from national office to epo] |
Ref country code: SE Payment date: 20101221 Year of fee payment: 20 Ref country code: GB Payment date: 20101201 Year of fee payment: 20 |
|
| PGFP | Annual fee paid to national office [announced via postgrant information from national office to epo] |
Ref country code: DE Payment date: 20101231 Year of fee payment: 20 |
|
| REG | Reference to a national code |
Ref country code: DE Ref legal event code: R071 Ref document number: 69125574 Country of ref document: DE |
|
| REG | Reference to a national code |
Ref country code: DE Ref legal event code: R071 Ref document number: 69125574 Country of ref document: DE |
|
| REG | Reference to a national code |
Ref country code: GB Ref legal event code: PE20 Expiry date: 20111201 |
|
| REG | Reference to a national code |
Ref country code: SE Ref legal event code: EUG |
|
| PG25 | Lapsed in a contracting state [announced via postgrant information from national office to epo] |
Ref country code: GB Free format text: LAPSE BECAUSE OF EXPIRATION OF PROTECTION Effective date: 20111201 |
|
| PG25 | Lapsed in a contracting state [announced via postgrant information from national office to epo] |
Ref country code: DE Free format text: LAPSE BECAUSE OF EXPIRATION OF PROTECTION Effective date: 20111203 |