EP0770352A1 - Ultrasonic diagnostic imaging with contrast agents - Google Patents
Ultrasonic diagnostic imaging with contrast agents Download PDFInfo
- Publication number
- EP0770352A1 EP0770352A1 EP96307359A EP96307359A EP0770352A1 EP 0770352 A1 EP0770352 A1 EP 0770352A1 EP 96307359 A EP96307359 A EP 96307359A EP 96307359 A EP96307359 A EP 96307359A EP 0770352 A1 EP0770352 A1 EP 0770352A1
- Authority
- EP
- European Patent Office
- Prior art keywords
- ultrasonic
- pulse
- contrast agent
- signals
- microbubbles
- Prior art date
- Legal status (The legal status is an assumption and is not a legal conclusion. Google has not performed a legal analysis and makes no representation as to the accuracy of the status listed.)
- Granted
Links
- 239000002872 contrast media Substances 0.000 title claims abstract description 85
- 238000002059 diagnostic imaging Methods 0.000 title description 2
- 238000000034 method Methods 0.000 claims abstract description 51
- 238000003384 imaging method Methods 0.000 claims abstract description 45
- 238000001514 detection method Methods 0.000 claims abstract description 27
- 239000002961 echo contrast media Substances 0.000 claims abstract description 24
- 230000010412 perfusion Effects 0.000 claims abstract description 18
- 230000001427 coherent effect Effects 0.000 claims abstract description 15
- 230000001960 triggered effect Effects 0.000 claims abstract description 5
- 238000002592 echocardiography Methods 0.000 claims description 58
- 230000006378 damage Effects 0.000 claims description 49
- 230000004044 response Effects 0.000 claims description 44
- 230000005540 biological transmission Effects 0.000 claims description 38
- 210000004369 blood Anatomy 0.000 claims description 22
- 239000008280 blood Substances 0.000 claims description 22
- 238000012545 processing Methods 0.000 claims description 14
- 239000000523 sample Substances 0.000 claims description 10
- 230000001066 destructive effect Effects 0.000 claims description 9
- 230000010410 reperfusion Effects 0.000 claims description 7
- 238000009877 rendering Methods 0.000 claims description 6
- 230000001747 exhibiting effect Effects 0.000 claims description 3
- 230000035790 physiological processes and functions Effects 0.000 claims 1
- 230000000694 effects Effects 0.000 abstract description 15
- 238000005259 measurement Methods 0.000 abstract description 5
- 230000008030 elimination Effects 0.000 abstract description 2
- 238000003379 elimination reaction Methods 0.000 abstract description 2
- 230000009977 dual effect Effects 0.000 abstract 1
- 210000001519 tissue Anatomy 0.000 description 26
- 210000002216 heart Anatomy 0.000 description 22
- 210000004165 myocardium Anatomy 0.000 description 11
- 230000004069 differentiation Effects 0.000 description 10
- 230000033001 locomotion Effects 0.000 description 9
- 230000017531 blood circulation Effects 0.000 description 8
- 210000001367 artery Anatomy 0.000 description 6
- 208000031481 Pathologic Constriction Diseases 0.000 description 5
- 230000008901 benefit Effects 0.000 description 5
- 238000013507 mapping Methods 0.000 description 5
- 210000003516 pericardium Anatomy 0.000 description 5
- 238000002604 ultrasonography Methods 0.000 description 5
- 210000003484 anatomy Anatomy 0.000 description 4
- 238000010586 diagram Methods 0.000 description 4
- 238000005070 sampling Methods 0.000 description 4
- 230000009471 action Effects 0.000 description 3
- 210000005242 cardiac chamber Anatomy 0.000 description 3
- 230000003111 delayed effect Effects 0.000 description 3
- 238000003745 diagnosis Methods 0.000 description 3
- 238000009792 diffusion process Methods 0.000 description 3
- 239000007789 gas Substances 0.000 description 3
- 210000000056 organ Anatomy 0.000 description 3
- 230000010355 oscillation Effects 0.000 description 3
- 230000002688 persistence Effects 0.000 description 3
- 230000008569 process Effects 0.000 description 3
- 230000003252 repetitive effect Effects 0.000 description 3
- 230000035945 sensitivity Effects 0.000 description 3
- 230000036262 stenosis Effects 0.000 description 3
- 208000037804 stenosis Diseases 0.000 description 3
- 238000010009 beating Methods 0.000 description 2
- 230000000747 cardiac effect Effects 0.000 description 2
- 239000003795 chemical substances by application Substances 0.000 description 2
- 238000000576 coating method Methods 0.000 description 2
- 125000004122 cyclic group Chemical group 0.000 description 2
- 230000007423 decrease Effects 0.000 description 2
- 210000004072 lung Anatomy 0.000 description 2
- 230000000541 pulsatile effect Effects 0.000 description 2
- 239000000126 substance Substances 0.000 description 2
- 230000002792 vascular Effects 0.000 description 2
- 238000012935 Averaging Methods 0.000 description 1
- 101100478277 Homo sapiens SPTA1 gene Proteins 0.000 description 1
- 102100037608 Spectrin alpha chain, erythrocytic 1 Human genes 0.000 description 1
- 230000003213 activating effect Effects 0.000 description 1
- 239000007864 aqueous solution Substances 0.000 description 1
- 210000002565 arteriole Anatomy 0.000 description 1
- 230000002238 attenuated effect Effects 0.000 description 1
- 230000036770 blood supply Effects 0.000 description 1
- 210000004204 blood vessel Anatomy 0.000 description 1
- 230000009172 bursting Effects 0.000 description 1
- 230000008859 change Effects 0.000 description 1
- 239000011248 coating agent Substances 0.000 description 1
- 239000003086 colorant Substances 0.000 description 1
- 210000004351 coronary vessel Anatomy 0.000 description 1
- 230000003247 decreasing effect Effects 0.000 description 1
- 238000011161 development Methods 0.000 description 1
- 230000003205 diastolic effect Effects 0.000 description 1
- 238000001914 filtration Methods 0.000 description 1
- 239000012530 fluid Substances 0.000 description 1
- 230000006872 improvement Effects 0.000 description 1
- 238000001802 infusion Methods 0.000 description 1
- 238000002347 injection Methods 0.000 description 1
- 239000007924 injection Substances 0.000 description 1
- 230000003993 interaction Effects 0.000 description 1
- 238000010253 intravenous injection Methods 0.000 description 1
- 238000011835 investigation Methods 0.000 description 1
- 210000003734 kidney Anatomy 0.000 description 1
- 210000005240 left ventricle Anatomy 0.000 description 1
- 210000004185 liver Anatomy 0.000 description 1
- 230000004807 localization Effects 0.000 description 1
- 238000004519 manufacturing process Methods 0.000 description 1
- 230000000873 masking effect Effects 0.000 description 1
- 239000000463 material Substances 0.000 description 1
- 230000007246 mechanism Effects 0.000 description 1
- 230000035515 penetration Effects 0.000 description 1
- 230000035479 physiological effects, processes and functions Effects 0.000 description 1
- 230000002685 pulmonary effect Effects 0.000 description 1
- 230000001105 regulatory effect Effects 0.000 description 1
- 210000005241 right ventricle Anatomy 0.000 description 1
- 238000012163 sequencing technique Methods 0.000 description 1
- 239000000243 solution Substances 0.000 description 1
- 230000002966 stenotic effect Effects 0.000 description 1
- 230000002459 sustained effect Effects 0.000 description 1
- 230000001360 synchronised effect Effects 0.000 description 1
- 230000002123 temporal effect Effects 0.000 description 1
- 210000003462 vein Anatomy 0.000 description 1
- 230000035899 viability Effects 0.000 description 1
- 238000012800 visualization Methods 0.000 description 1
- XLYOFNOQVPJJNP-UHFFFAOYSA-N water Substances O XLYOFNOQVPJJNP-UHFFFAOYSA-N 0.000 description 1
Images


Classifications
-
- A—HUMAN NECESSITIES
- A61—MEDICAL OR VETERINARY SCIENCE; HYGIENE
- A61B—DIAGNOSIS; SURGERY; IDENTIFICATION
- A61B8/00—Diagnosis using ultrasonic, sonic or infrasonic waves
- A61B8/54—Control of the diagnostic device
- A61B8/543—Control of the diagnostic device involving acquisition triggered by a physiological signal
-
- A—HUMAN NECESSITIES
- A61—MEDICAL OR VETERINARY SCIENCE; HYGIENE
- A61B—DIAGNOSIS; SURGERY; IDENTIFICATION
- A61B8/00—Diagnosis using ultrasonic, sonic or infrasonic waves
- A61B8/06—Measuring blood flow
-
- A—HUMAN NECESSITIES
- A61—MEDICAL OR VETERINARY SCIENCE; HYGIENE
- A61B—DIAGNOSIS; SURGERY; IDENTIFICATION
- A61B8/00—Diagnosis using ultrasonic, sonic or infrasonic waves
- A61B8/13—Tomography
-
- A—HUMAN NECESSITIES
- A61—MEDICAL OR VETERINARY SCIENCE; HYGIENE
- A61B—DIAGNOSIS; SURGERY; IDENTIFICATION
- A61B8/00—Diagnosis using ultrasonic, sonic or infrasonic waves
- A61B8/46—Ultrasonic, sonic or infrasonic diagnostic devices with special arrangements for interfacing with the operator or the patient
- A61B8/461—Displaying means of special interest
- A61B8/463—Displaying means of special interest characterised by displaying multiple images or images and diagnostic data on one display
-
- A—HUMAN NECESSITIES
- A61—MEDICAL OR VETERINARY SCIENCE; HYGIENE
- A61B—DIAGNOSIS; SURGERY; IDENTIFICATION
- A61B8/00—Diagnosis using ultrasonic, sonic or infrasonic waves
- A61B8/48—Diagnostic techniques
- A61B8/481—Diagnostic techniques involving the use of contrast agent, e.g. microbubbles introduced into the bloodstream
-
- A—HUMAN NECESSITIES
- A61—MEDICAL OR VETERINARY SCIENCE; HYGIENE
- A61K—PREPARATIONS FOR MEDICAL, DENTAL OR TOILETRY PURPOSES
- A61K49/00—Preparations for testing in vivo
- A61K49/22—Echographic preparations; Ultrasound imaging preparations ; Optoacoustic imaging preparations
- A61K49/222—Echographic preparations; Ultrasound imaging preparations ; Optoacoustic imaging preparations characterised by a special physical form, e.g. emulsions, liposomes
- A61K49/223—Microbubbles, hollow microspheres, free gas bubbles, gas microspheres
-
- G—PHYSICS
- G01—MEASURING; TESTING
- G01S—RADIO DIRECTION-FINDING; RADIO NAVIGATION; DETERMINING DISTANCE OR VELOCITY BY USE OF RADIO WAVES; LOCATING OR PRESENCE-DETECTING BY USE OF THE REFLECTION OR RERADIATION OF RADIO WAVES; ANALOGOUS ARRANGEMENTS USING OTHER WAVES
- G01S15/00—Systems using the reflection or reradiation of acoustic waves, e.g. sonar systems
- G01S15/88—Sonar systems specially adapted for specific applications
- G01S15/89—Sonar systems specially adapted for specific applications for mapping or imaging
- G01S15/8906—Short-range imaging systems; Acoustic microscope systems using pulse-echo techniques
- G01S15/8959—Short-range imaging systems; Acoustic microscope systems using pulse-echo techniques using coded signals for correlation purposes
- G01S15/8963—Short-range imaging systems; Acoustic microscope systems using pulse-echo techniques using coded signals for correlation purposes using pulse inversion
-
- G—PHYSICS
- G01—MEASURING; TESTING
- G01S—RADIO DIRECTION-FINDING; RADIO NAVIGATION; DETERMINING DISTANCE OR VELOCITY BY USE OF RADIO WAVES; LOCATING OR PRESENCE-DETECTING BY USE OF THE REFLECTION OR RERADIATION OF RADIO WAVES; ANALOGOUS ARRANGEMENTS USING OTHER WAVES
- G01S7/00—Details of systems according to groups G01S13/00, G01S15/00, G01S17/00
- G01S7/52—Details of systems according to groups G01S13/00, G01S15/00, G01S17/00 of systems according to group G01S15/00
- G01S7/52017—Details of systems according to groups G01S13/00, G01S15/00, G01S17/00 of systems according to group G01S15/00 particularly adapted to short-range imaging
- G01S7/52023—Details of receivers
- G01S7/52036—Details of receivers using analysis of echo signal for target characterisation
- G01S7/52038—Details of receivers using analysis of echo signal for target characterisation involving non-linear properties of the propagation medium or of the reflective target
- G01S7/52039—Details of receivers using analysis of echo signal for target characterisation involving non-linear properties of the propagation medium or of the reflective target exploiting the non-linear response of a contrast enhancer, e.g. a contrast agent
-
- G—PHYSICS
- G01—MEASURING; TESTING
- G01S—RADIO DIRECTION-FINDING; RADIO NAVIGATION; DETERMINING DISTANCE OR VELOCITY BY USE OF RADIO WAVES; LOCATING OR PRESENCE-DETECTING BY USE OF THE REFLECTION OR RERADIATION OF RADIO WAVES; ANALOGOUS ARRANGEMENTS USING OTHER WAVES
- G01S7/00—Details of systems according to groups G01S13/00, G01S15/00, G01S17/00
- G01S7/52—Details of systems according to groups G01S13/00, G01S15/00, G01S17/00 of systems according to group G01S15/00
- G01S7/52017—Details of systems according to groups G01S13/00, G01S15/00, G01S17/00 of systems according to group G01S15/00 particularly adapted to short-range imaging
- G01S7/52023—Details of receivers
- G01S7/52036—Details of receivers using analysis of echo signal for target characterisation
- G01S7/52038—Details of receivers using analysis of echo signal for target characterisation involving non-linear properties of the propagation medium or of the reflective target
- G01S7/52041—Details of receivers using analysis of echo signal for target characterisation involving non-linear properties of the propagation medium or of the reflective target detecting modification of a contrast enhancer, e.g. detecting the destruction of a contrast agent by an acoustic wave, e.g. loss of correlation
-
- A—HUMAN NECESSITIES
- A61—MEDICAL OR VETERINARY SCIENCE; HYGIENE
- A61B—DIAGNOSIS; SURGERY; IDENTIFICATION
- A61B8/00—Diagnosis using ultrasonic, sonic or infrasonic waves
- A61B8/08—Detecting organic movements or changes, e.g. tumours, cysts, swellings
-
- A—HUMAN NECESSITIES
- A61—MEDICAL OR VETERINARY SCIENCE; HYGIENE
- A61B—DIAGNOSIS; SURGERY; IDENTIFICATION
- A61B8/00—Diagnosis using ultrasonic, sonic or infrasonic waves
- A61B8/48—Diagnostic techniques
- A61B8/488—Diagnostic techniques involving Doppler signals
Definitions
- This invention relates to ultrasonic diagnosis and imaging of the body with ultrasonic contrast agents and, in particular, to new methods and apparatus for ultrasonically detecting and imaging with contrast agents.
- Ultrasonic diagnostic imaging systems are capable of imaging and measuring the physiology within the body in a completely noninvasive manner. Ultrasonic waves are transmitted into the body from the surface of the skin and are reflected from tissue and cells within the body. The reflected echoes are received by an ultrasonic transducer and processed to produce an image or measurement of blood flow. Diagnosis is thereby possible with no intervention into the body of the patient.
- ultrasonic contrast agents Materials known as ultrasonic contrast agents can be introduced into the body to enhance ultrasonic diagnosis. Contrast agents are substances which strongly interact with ultrasonic waves, returning echoes which may be clearly distinguished from those returned by blood and tissue.
- One class of substances which has been found to be especially useful as an ultrasonic contrast agent is gases, in the form of tiny bubbles called microbubbles. Microbubbles present a significant acoustic impedance mismatch in the body, and nonlinear behizate in certain acoustic fields which is readily detectable through special ultrasonic processing. Gases that have been stabilized in solutions in the form of tiny microbubbles are infused into the body and survive passage through the pulmonary system and circulate throughout the vascular system.
- Microbubble contrast agents are useful for imaging the body's vascular system, for instance, as the contrast agent can be injected into the bloodstream and will pass through the veins and arteries of the body with the blood supply until filtered from the blood stream in the lungs, kidneys and liver.
- microbubble contrast agent currently under investigation comprises coated microbubbles.
- the microbubbles of the contrast agent are covered with a thin biodegradable coating or shell.
- the microbubbles have diameters between 0.1 ⁇ m and 4.0 ⁇ m and a specific density about 1/10 of the density of water.
- the coated microbubbles are suspended in an aqueous solution for infusion into the blood stream.
- Coated microbubbles have the advantage of being stable in the body for a significant period of time, as the shells serve to protect the gases of the microbubbles from diffusion into the bloodstream.
- the size of the microbubbles is chosen to enable the microbubbles to pass through capillary beds in the body.
- the acoustic pressure waves can cause the shells of coated microbubbles to rupture, freeing the bubbles to behave as noncoated microbubbles until they diffuse into the bloodstream.
- acoustic energy can induce nonlinear motion of the microbubbles, itself a detectable ultrasonic phenomenon.
- This acoustically induced destruction and collapse of the microbubbles produces a high amplitude response and a characteristically bright pattern in the color Doppler mode.
- color Doppler is an advantageous modality for detecting the collapse of contrast agent microbubbles.
- U.S. Pat. 5,456,257 assigned to the same assignee as the present invention, describes a technique for detecting microbubbles through phase insensitive detection of microbubble destruction and differentiation of the detected signals on a spatial basis.
- Phase insensitive contrast agent detection advantageously reduces artifacts from moving tissue and also performs well when imaging contrast agent perfused tissue, where the contrast agent is finely distributed and moving slowly through the fine capillary structure of tissue. It is desirable to be able to perform contrast agent imaging with equal effect in large, rapidly moving blood pools such as the chambers of the heart. It is also desirable to specifically tailor the operation of the ultrasound machine to harmonic characteristics when performing harmonic contrast imaging.
- Ultrasonic apparatus for coherent imaging of ultrasonic contrast agents, which is advantageous in blood pool contrast imaging.
- the apparatus is specially tailored to be programmed with response characteristics suitable for harmonic contrast agents.
- the inventive apparatus also includes a display for simultaneously viewing a real time image which displays anatomical structures for localization of the contrast agent and a triggered contrast image displaying contrast enhanced images.
- Methods of employing the inventive apparatus with contrast agents include the measurement of perfusion rate characteristics, multizone contrast imaging, a technique for discerning larger vessels in a bed of fine capillary structures, multifrequency contrast imaging, the display of contrast enhanced tissue, a technique for the elimination of artifacts occurring during high PRF contrast image acquisition, and alternate polarity acquisition of nonlinear contrast effects.
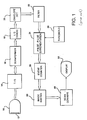
- an ultrasonic diagnostic system described in U.S. Pat. 5,456,257 is illustrated in block diagram form.
- This ultrasound system is capable of performing phase insensitive contrast agent detection as described in that patent.
- coherent echo signals produced by a beamformer 16 are quadrature demodulated by an I,Q demodulator 18 to produce quadrature I and Q signal components.
- the demodulated signal components are amplitude detected by an envelope detector 20.
- the detected signals are filtered by a filter 22 to remove noise and other extraneous signal components.
- Spatially aligned, temporally separated detected echo signals are differentiated by a pulse to pulse differentiation subsystem 24, and the differential signals are used to form contrast agent enhanced images.
- Performing pulse to pulse differentiation of envelope detected echo signals provides advantages in certain procedures.
- contrast agents When contrast agents are being used in a mode where microbubbles in the fine capillary structures of tissue are destroyed by ultrasonic waves, differentiation of the echo envelope is particularly useful.
- a first ultrasonic pulse destroys the microbubbles in the tissue and these destruction events are received and envelope detected.
- a second pulse is transmitted to the same locations, and the returning echoes, ideally, show an absence of microbubbles at the locations where the microbubbles were destroyed.
- the second set of echoes is subtracted from the first set on a spatial basis, yielding difference signals of substantial magnitude at the locations where the microbubbles were destroyed, which are then displayed at corresponding pixel locations on a display.
- the second set of echoes may not actually reveal voids where microbubbles were destroyed, due to motional effects, diffusion rates, and other bubble activity.
- the difference in bubble activity from one pulse to the next will provide a highly detectable response when differentiated on a pulse to pulse, spatial basis.
- microbubble destruction is referred to herein it encompasses the effects of phenomena such as these.
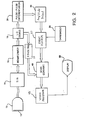
- FIGURE 2 A first embodiment of an ultrasonic diagnostic system constructed in accordance with the principles of the present invention is shown in FIGURE 2.
- This embodiment provides coherent detection of ultrasonic contrast agents.
- An ultrasonic probe 10 includes an array 12 of ultrasonic transducers which transmit and receive ultrasonic energy.
- an ultrasonic beamformer 16 controls the timing of actuation of the separate elements of the array 12 by activating the transducer pulsers of a transmitter/receiver 14 at appropriate times to pulse the transducer elements so that a steered and focused ultrasonic beam is produced.
- ultrasonic echoes received by the transducer elements are received by transmitter/receiver 14 and coupled to separate channels of the beamformer 16, where the signals are appropriately delayed then combined to form a sequence of coherent echo signals over the depth of reception in the body of the patient.
- the coherent echo signals are quadrature demodulated by an I,Q demodulator 18 which produces quadrature I and Q signal components.
- the demodulated signal components are coupled to a B mode processor 37 which filters, detects, and maps greyscale echo signals in the usual manner.
- the greyscale echo signals of the scanlines of an image are coupled to a scan converter 40 for display of a B mode image.
- the I and Q signal components are alternatively (or in addition) coupled to a pulse to pulse differentiation circuit 24 which differentiates echoes received from the same sample volume (location) in the body on a temporal basis.
- the results of this differentiation are coupled to an amplitude detector 20 and the differential response signals are coupled to an event discriminator 27.
- the event discriminator discriminates events of microbubble destruction at the sample volume location from the differentiated echo information.
- One convenient way to perform this discrimination is by comparison of the detected signals to a threshold from threshold generator 26, passing signals above a threshold and rejecting signals below the threshold. The discriminator will detect microbubble destruction events and reject low level noise.
- Detected events are coupled to the scan converter 40 for production of a spatial image of the microbubble destruction events in the desired image format.
- the destruction event image may be shown separately, or may be combined with the B mode image to show the contrast agent in relation to surrounding tissue structure.
- the images are coupled to a video processor 42 which produces video signals for display on an image display 50.
- This coherent contrast agent detection technique is highly sensitive to small variations in microbubble activity in the image area, and performs well when imaging the blood pool of a heart chamber, for instance.
- the probability of differential microbubble activity from one pulse to another is extremely high, explaining the high sensitivity of this technique for heart chamber imaging.
- coherent microbubble detection is more sensitive to tissue motion and more sensitive to individual microbubble events in high contrast agent concentrations. It is also possible to process received echoes both coherently and incoherently, to form an image which contains information from both processes.
- Contrast agent detection in accordance with the present invention provides excellent tissue clutter rejection.
- Microbubble echo signals are generally not received alone, but are usually accompanied by echo signals of much greater amplitude which are returned from neighboring tissue and structures. These tissue echoes can be several orders of magnitude greater than any of the microbubble echo signals, effectively masking them.
- the pulse to pulse differentiation processing can reject the tissue signals by effectively canceling them, revealing the contrast agent echoes which can then be more readily discriminated. This cancellation is enhanced by high PRF pulses, which further diminishes motional artifacts from tissue.
- microbubbles of a contrast agent exhibit greater sensitivity to ultrasonic pulses of certain characteristics and lesser sensitivity to pulses of other characteristics.
- the time of occurrence of microbubble destruction can be modulated and controlled.
- Microbubbles can be imaged in the bloodstream by scanning at a high frequency with low amplitude, (and to a lesser extent) short burst length pulses. When it is desired to stimulate microbubble destruction, higher power pulses of lower frequency and longer burst length are transmitted into the bloodstream.
- the ultrasound system of the present invention is provided with control presets for these two pulse transmission characteristics, enabling the clinician to switch from nondestructive imaging pulses to microbubble destruction pulses when the clinician so desires.
- the preferred display of anatomical structures and microbubble activity employs programmed switching between the destructive and nondestructive pulse modes for contrast agent and anatomical structure imaging.
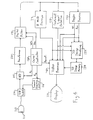
- FIGURE 4 A second embodiment of an ultrasonic diagnostic system constructed in accordance with the principles of the present invention for use with harmonic contrast agents is shown in FIGURE 4.
- the array transducer 112 of the probe 110 transmits ultrasonic energy and receives echoes returned in response to this transmission.
- the response characteristic of the transducer can exhibit two passbands, one around the central transmit frequency and another about the center of the received passband.
- a broadband transducer having a passband encompassing both the transmit and receive passbands is preferred.
- the transducer may be manufactured and tuned to exhibit a response characteristic as shown in FIGURE 5, in which the lower hump 60 of the response characteristic is centered about the center transmit frequency f t , and the upper hump 62 is centered about the center frequency f r of the response passband.
- the transducer response characteristic of FIGURE 6 is preferred, however, as the single dominant characteristic 64 allows the probe to be suitable for both harmonic contrast imaging and imaging without harmonic contrast agents.
- the characteristic 64 encompasses the central transmit frequency f t , and also the harmonic receive passband bounded between frequencies f L and f c , and centered about frequency f r .
- a typical harmonic contrast agent can have a response such that transmission about a central transmit frequency of 1.7 MHz will result in harmonic returning echo signals about a frequency of 3.4 MHz.
- a response characteristic 64 of approximately 2 MHz would be suitable for these harmonic frequencies.
- a central controller 120 provides a control signal f tr to a transmit frequency control circuit 121 to control the center frequency and time of transmission of the transmitted ultrasonic energy.
- the transmit frequency control circuit pulses the elements of the transducer array 112 by means of a transmit/receive switch 114.
- a preferred method of pulsing the transducer array is in bursts which scan with sufficient pulses to form an image, followed by intervals of no pulse transmission. Such bursts and intervals are shown in FIGURE 7, which shows a burst interval nPRF and a frame interval t Fr , the frame interval including the burst interval and an interval of no pulse transmission.
- the latter interval allows time for new contrast agent coursing through the body to infuse the vessels and tissue of the image plane between frame bursts.
- the frame intervals can be on the order of one second, and can be gated to the heart rate or asynchronous with respect to the heart rate.
- echoes from the same spatial locations can be gathered for Doppler processing.
- a high PRF rate such as 6 KHz is used. Imaging procedures of this type are the subject of U.S. Pats. [appl. serial nos. 08/439,619 and 08/540,463].
- Medical diagnostic ultrasonic scanning is limited by regulatory requirements in peak pressure amplitude of a transmitted pulse and the integral of the energy transmitted.
- the preferred scanning of contrast agents in accordance with the embodiment of FIGURE 4 utilizes relatively high peak pulse power, with the time integral of transmitted energy lessened by the intervals during which no pulses are transmitted.
- the ultrasound system is set to operate with a relatively high mechanical index and an SPTA moderated by the gated or interval bursts.
- Echoes received by the transducer array 112 are coupled through the T/R switch 114 and digitized by analog to digital converters 115.
- the sampling frequency f s of the A/D converters 115 is controlled by the central controller.
- the desired sampling rate dictated by sampling theory is at least twice the highest frequency f c of the received passband and, for the preceding exemplary frequencies, might be on the order of at least 8 MHz. Sampling rates higher than the minimum requirement are also desirable.
- the echo signal samples from the individual transducer elements are delayed and summed by a beamformer 116 to form coherent echo signals.
- the digital coherent echo signals are then filtered by a digital filter 118.
- the transmit frequency f t is not tied to the receiver, and hence the receiver is free to receive a band of frequencies which is separate from the transmitted band.
- the digital filter 118 bandpass filters the signals in the passband bounded by frequencies f L and f c in FIGURE 6, and can also shift the frequency band to a lower or baseband frequency range.
- the digital filter could be a filter with a 1 MHz passband and a center frequency of 3.4 MHz in the above example.
- a preferred digital filter is a series of multipliers 70-73 and accumulators 80-83 as shown in FIGURE 8.
- This arrangement is controlled by the central controller 120, which provides multiplier weights and decimation control which control the characteristics of the digital filter.
- the arrangement is controlled to operate as a finite impulse response (FIR) filter, and performs both filtering and decimation.
- FIR finite impulse response
- the first stage output 1 could be controlled to operate as a four tap FIR filter with a 4:1 decimation rate.
- Temporally discrete echo samples S are applied to the multiplier 70 of the first stage. As the samples S are applied, they are multiplied by weights provided by the central controller 120. Each of these products is stored in the accumulator 80 until four such products have been accumulated (added).
- An output signal is then produced at the first stage output 1.
- the output signal has been filtered by a four tap FIR filter since the accumulated total comprises four weighted samples. Since the time of four samples is required to accumulate the output signal, a 4:1 decimation rate is achieved. One output signal is produced for every four input samples. The accumulator is cleared and the process repeats. It is seen that the higher the decimation rate (the longer the interval between output signals), the greater can be the effective tap number of the filter.
- temporally separate samples are delayed by delay elements ⁇ and applied to the four multipliers 70-73, multiplied, and accumulated in the accumulators 80-83. After each accumulator has accumulated two products, the four output signals are combined as a single output signal.
- the filter is operating as an eight tap filter with a 2:1 decimation rate. With no decimation, the arrangement can be operated as a four tap FIR filter.
- the filter can also be operated by applying echo signals to all multipliers simultaneously and selectively time sequencing the weighting coefficients. A whole range of filter characteristics are possible through programming of the weighting and decimation rates of the filter, under control of the central controller.
- filtered echo signals from tissue are coupled to a B mode processor 37 for conventional B mode processing.
- Filtered echo signals of the contrast agent passband are coupled to a contrast signal detector 128 which eliminates stationary tissue signals by pulse to pulse subtraction of temporally discrete echoes from a given spatial location, amplitude or envelope detects the resulting difference signals, and discriminates for motion signal components on an amplitude basis.
- Simple two pulse subtraction of the form P 1 - P 2 may be employed where P 1 represents the echoes received following one pulse and P 2 represents the echoes received following another pulse.
- may be employed to accumulate more signals from successive bubble destruction pulses.
- the filtered echo signals from the digital filter 118 are also coupled to a Doppler processor 130 for conventional Doppler processing to produce velocity and power Doppler signals.
- the outputs of these processors are coupled to a 3D image rendering processor 132 for the rendering of three dimensional images, which are stored in a 3D image memory 134.
- Three dimensional rendering may be performed as described in U.S. Pat. [appl. serial no. 08/638,710], and in U.S. Pats. 5,474,073 and 5,485,842, the latter two patents illustrating three dimensional power Doppler ultrasonic imaging techniques.
- the signals from the contrast signal detector 128, the processors 37 and 130, and the three dimensional image signals are coupled to a video processor 140 where they may be selected for display on an image display 50 as dictated by user selection.
- the video processor preferably includes persistence processing, whereby momentary intensity peaks of detected contrast agents can be sustained in the image.
- One technique for providing persistence is through frame averaging, whereby new image frames are combined with previous frame information on a spatial basis. The combination can be done by weighting the contributions of the old and new frame information and the frame information can be combined in a recursive manner; that is, old frame information is fed back for combining with new frame information.
- a preferred persistence technique is the fast attack, slow decay technique described in U.S. Pat. 5,215,094, which can be applied to both Doppler and contrast agent images.
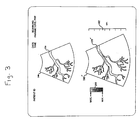
- a preferred display format for contrast agent imaging is depicted by the screen display of FIGURE 3.
- the signals produced by the B mode processor 37 are used to display a real time image display 160 of structure in the body such as a blood vessel 170.
- This real time image is used by the clinician to ascertain and locate the area of the body to be imaged.
- the B mode image is created from echoes returning from nondestructive ultrasonic imaging pulses. As discussed above, pulses of low amplitude, high frequency, and short burst duration will generally not destroy the microbubbles. However, echoes from pulses destructive of microbubbles are used by the contrast signal detector 128 to produce contrast agent images 160' on the same or an adjacent monitor.
- the contrast agent images 160' are triggered to be acquired at a predetermined phase of the heart cycle, using a heart gate triggering from the phases of the heartbeat waveform.
- a burst of relatively high amplitude, low frequency, long burst duration pulses are transmitted to destroy the microbubbles in the image plane and detect and display those events.
- a B mode image acquired at or near the same heartbeat phase is displayed, with the vessel or organ 170' filled in with the imaged microbubble destruction events.
- the display screen of FIGURE 3 will show a B mode image 160 in real time, and a contrast agent image 160'which is updated each heart cycle.
- a variation of this presentation is especially useful in radiology where tissue structure is more stationary.
- a real time B mode image 160 of anatomical structure is shown, with fluid flow 170' filled in with color Doppler.
- This real time color flow Doppler image is then periodically filled in with detected contrast agent, sharply illuminating the bloodflow.
- the colorflow Doppler display and the contrast agent display both of which are filling in the same areas of the anatomical display, may be shown in the same, similar, or contrasting colors and intensities.
- the periodicity of the overlaid contrast agent display may be synchronized to the heart cycle with an EKG trigger as described above, or the periodicity may be chosen by the user and asynchronous to the heart cycle.
- FIGURE 9a illustrates the travel of an intravenous injection of contrast agent to a capillary bed 200.
- the agent travels in the bloodstream as it moves from the injection site 208 and traverses the right ventricle 202, the lungs 204, and the left ventricle 206 before reaching an artery 209.
- the contrast agent then begins to infuse the tissue of the capillary bed 200 as blood flows from the artery 200 through the arterioles 210 and into the capillaries of the tissue.
- the perfusion rate into the capillary bed can be used to evaluate the viability of bloodflow in that region of the body or to identify the location of a stenosis.
- Ultrasonic pulses are transmitted to destroy microbubbles in a region 212 across the capillary bed 200, as shown in FIGURE 9b. If a stenosis 214 is impeding the flow of blood in the artery 209 and hence to the entire capillary bed 200, the rate of reperfusion of microbubbles will be slow across the entire region 212. But if the stenosis 216 is in an artery which feeds only part of the capillary bed 200, the rate of perfusion will be slow in only the portion 218 of the region which is fed through the stenotic artery.
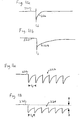
- FIGURES 10a and 10b This difference in the rate of reperfusion is illustrated graphically by the curves of FIGURES 10a and 10b.
- Each of these curves shows the same blood volume and hence the same initial microbubble concentration 220 before the microbubbles are destroyed in the capillary bed.
- ultrasonic pulses destroy the microbubbles as indicated by the vertical spike in each curve.
- curve 222 in FIGURE 10a When blood is flowing freely into the capillary bed, a rapid rate of reperfusion of microbubbles occurs as indicated by curve 222 in FIGURE 10a.
- the curve 222 rapidly rises back to the stable microbubble concentration level 220. But when the bloodflow is impeded, the rise of the curve 224 is much more gradual, as indicated in FIGURE 10b.
- FIGURE 11a shows a repetitive sequence of reperfusion curves 222, each returning to the full perfusion level 220 in a period of time t p .
- each curve 224 of the same duration t p is short of the full perfusion level 220 by an amount indicated by arrows B-B.
- the reperfusion curve may be reproduced as indicated in FIGURE 13.
- Ultrasonic pulses are transmitted at time t d to destroy the microbubbles in the capillary bed.
- a short time later pulses are transmitted again, the echoes received and imaged to this time measure the degree of microbubble reinfusion, either by destroying reinfused microbubbles and recording the destruction events, or by counting or integrating pixels in the area which show reinfused microbubbles.
- the measure of the number of microbubbles reinfused to the region is plotted as a point X of the curve 224.
- Nondestructive pulses can be repetitively transmitted and echoes received to plot a sequences of X points on the curve as shown in FIGURE 13.
- FIGURE 12 shows a heart cycle waveform 230, indicating the pulsatile action of bloodflow. At the peaks of the waveform 230, new blood is pumped into regions of the body during the systolic phase of the heart cycle. Advantage is taken of this reinfusing action by repetitively measuring the degree of contrast agent reinfusion at a constant point in the heart cycle, but following continually differing phases of microbubble destruction.
- FIGURE 12 the X points of reinfusion measurement all occur at the same phase of the heart cycle.
- the X points are preceded by changing times at which the microbubbles are destroyed, as indicated by arrows 232, 234, and 236, which successively precess to earlier times in the heart cycle.
- the purpose of ultrasonic transmission at the times of arrows 232, 234, and 236 is to destroy the microbubbles, it is not necessary to receive and analyze the returning echoes at these times. Echo reception and analysis is done at the times of the Xs, and the Xs shown in FIGURE 12 can be plotted as the successive Xs in FIGURE 13 due to the precession of the destruction time phases indicated by the arrows.
- Triggered or grated acquisition is especially significant in cardiac imaging to reduce tissue motion artifacts stemming from beating movement of the heart.
- This technique of measuring perfusion by microbubble destruction can also be used to image the flow in major vessels of a capillary bed.
- FIGURE 9d it is seen that the major vessels 240 reinfuse earlier than the fine capillaries in a microbubble depleted region 212.
- the major vessels 240 can be revealed by detecting microbubbles in the region 212 shortly after pulses have destroyed all of the microbubbles in the region, at which time only the major vessels 240 have been significantly reinfused with contrast agent.
- FIGURES 14a-14c A technique for overcoming these effects is shown in FIGURES 14a-14c.
- the horizontal axis represents depth into the body, with the skin line SL indicated at the left side of each drawing.
- a typical ultrasonic image may show the skin line at the top of the image and the deepest penetration into the body at the bottom of the image.
- focused pulses are transmitted to focus the ultrasonic energy on the microbubbles which are to be destroyed.
- the pulses will not be focused over the full image depth, but will come into focus around a particular focal point and then diverge at greater depths. This is indicated in FIGURE 14a, where a transmitted pulse is focused at a focal point F 1 which is in a focal zone Z 1 .
- this first focal zone Z 1 is a line 270, which represents complete microbubble destruction over this near field part of the focal zone Z 1 and about the focal point F 1 . Beyond the focal point the degree of microbubble destruction decreases, as indicated by the declining line 272.
- These lines are shown as straight lines for ease of explanation; it will be understood that the effect will usually be continually changing and that actual effects may follow a curved relationship.
- FIGURE 14a represents the transmission of a first pulse along a given beam direction, a result of which is that near field microbubbles are destroyed as indicated by lines 270 and 272. Following this microbubble destruction, a second pulse is transmitted to gather echoes from along the microbubble depleted beam direction.
- the echoes from the two pulses may be differentiated and displayed using the ultrasonic apparatus of FIGURES 1, 2, or 4.
- the next pulse transmission for microbubble destruction is focused at a second focal point F 2 in a second focal zone Z 2 of the beam.
- the transmitted pulse energy will readily reach the second focal zone, since the microbubbles in the nearer first zone were previously destroyed.
- FIGURE 14b illustrates this transmission to the second focal zone.
- Line 282 indicates that the remaining microbubbles at the end of the first zone and the beginning of the second will be destroyed by the second destruction pulse, as will microbubbles around the focal point as indicated by line 280. Beyond the second focal point F 2 the degree of microbubble destruction will decline as pulse energy declines, as indicated by line 284.
- a second interrrogation pulse may be transmitted following the second destructive pulse to differentially detect the second sequence of microbubble destruction events.
- a third destruction pulse is transmitted along the beam direction, focused at the deepest focal point F 3 in the deepest focal zone Z 3 .
- the pulse energy readily reaches the third focal zone due to the earlier depletion of microbubbles at shallower depths.
- the third destruction pulse destroys the remaining microbubbles between the second and third zones as indicated by line 292 in FIGURE 14c, destroys microbubbles around the focal point as indicated by line 290, and destroys a decreasing amount of microbubbles beyond the focal point F 3 as indicated by line 294.
- a third interrogation pulse follows for differential detection of the microbubble destruction events in and around zone Z 3 .
- the detected destruction events over the three zones are then combined in accordance with the expression
- the echoes from each focal zone are spliced together to form a complete image line to the maximum depth of the image.
- the technique conventionally used in multizone focus imaging echoes are detected over the full depth following each pulse.
- each pulse echo pair contains a line of echoes over the full image depth, which are then combined to record the maximum number of microbubble destruction events for the full image line.
- the echoes returned from later focal zone transmissions can be combined with earlier echoes to differentially detect destruction events. That is, the first term of the above expression could be
- the use of pulse pairs for each focal zone is preferred, as the aperture changes accompanying focal zone changes can deleteriously affect the precision of the technique.
- More uniform, artifact-free multizone microbubble destruction images can be obtained by pulsing nonadjacent beams with time successive pulses. This ensures that each line of microbubbles will be approximately uniformly undisturbed at the beginning of the multizone sequence, preventing successions of bright and dim lines in the ultrasonic image.
- FIGURES 15a, 15b and 16 illustrate a preferred technique for displaying contrast agent enhanced images when tissue perfusion is being observed.
- FIGURE 16 illustrates a cross sectional view of the heart, including the myocardium 260 and the blood pool 250 within a chamber of the heart.
- a contrast agent When a contrast agent has been introduced into the bloodstream, a great quantity of the agent will be contained within large blood pools such as the heart chambers and major vessels, while only a relatively small quantity of contrast agent will enter tissue and organs by way of capillary structures.
- a large quantity of contrast agent will be present in the blood pool 250 while a lesser amount will be infused by capillary flow into the myocardium 260.
- a conventional ultrasonic display of the cross sectional image of FIGURE 16 will cause pixels of greater signal level to be illuminated with greater brightness or color.
- a typical display mapping characteristic which provides this result is shown in FIGURE 15a by mapping characteristic 252. As detected pixel values increase, the display pixels are shown with increasing brightness or color until reaching a maximum plateau level. As a result, the blood pool area 250 in FIGURE 16 will be shown brightly or highly colored, whereas the myocardium 260 will be only dimly illuminated or colored.
- a display mapping characteristic such as that shown in FIGURE 15b is employed.
- the curve 254 in this drawing is seen to begin at a zero level to suppress noise in the image, then rises to a high level 256. Thereafter it declines to a level 258 for higher detected signal values.
- lower detected pixel values will be mapped to brightly illuminated or colored display pixels, and higher detected pixel values will be mapped to more dimly illuminated or colored display pixel values.
- the myocardium 260 in FIGURE 16 will be brightly illuminated or colored, while the central blood pool is only dimly colored or illuminated. This emphasis provides highlighting of contrast agent perfused tissue over blood pool areas.
- Pulse transmission techniques can afford further improvement in contrast agent destruction and detection. While the exact physical mechanisms caused the by interaction of microbubbles with acoustic energy are quite complex, the sizes of microbubbles have an effect upon their destruction at certain frequencies. Since a microbubble contrast agent is often comprised of microbubbles of a wide range of diameters, microbubble destruction events can be increased by transmitting a chirp or multifrequency pulse. By transmitting a frequency modulated pulse, the probability of transmitting destructive energy for a greater range of microbubble sizes is increased. In addition, by modulating both the frequency and amplitude of the destructive pulse, both microbubble destruction and controlled oscillation can be induced. The initial high amplitude, low frequency period of the pulse, followed by a lower amplitude, higher frequency period can induce microbubble shell destruction followed by oscillation of the released microbubble.
- FIGURE 17a illustrates the transmission of a first pulse P 1 for contrast agent imaging of the heart, followed by a second pulse P 2 .
- the pulses are transmitted at a low PRF, and a significant period of time exists between the transmission times of the pulses.
- echoes 300 are first received from contrast agent in the myocardium, and later echoes 302 are received from the more distant pericardium. Differentiation of the echoes following the two pulses will detect the presence of contrast agent in the myocardium, followed by detection of the pericardium itself.
- FIGURE 17b For procedures where it is only desirable to perform contrast agent imaging of the myocardium, a higher PRF transmission can be employed as shown in FIGURE 17b.
- the higher PRF pulses have the unfortunate result of artifact development. Echoes 300 return from the contrast agent in the myocardium following pulse P 1 . But echoes 302 returning from the pericardium in response to the first pulse P 1 appear in the interval following the second pulse P 2 and can manifest themselves as an artifact in the image when echoes following the two pulses are differentiated. To eliminate the artifact from the later returning echoes, incoherent detection is employed prior to differentiation by the apparatus of FIGURE 1.
- incoherent detection and differentiation results in positive polarity echoes 300'from the myocardium microbubbles, and negative polarity echoes 302' from the pericardium.
- the unwanted negative polarity echoes 302' from the pericardium can then be removed by thresholding or clipping at the baseline, leaving only the desired detection of the contrast agent in the myocardium.
- FIGURE 18a illustrates an echo waveform 310 received from the pulsing of a microbubble.
- the nonuniform amplitudes on either side of the zero reference level illustrate nonlinear reflexive action of microbubbles in the presence of acoustic waves, as the microbubbles nonlinearly compress and expand.
- the echo waveform of 310 FIGURE 18a results from transmission of an ultrasonic pulse exhibiting a first polarity.
- the echo waveform 312 of FIGURE 18b results.
- This waveform is similarly nonlinear, but out of phase with the first waveform due to the change in pulse polarity.
- a harmonic response is obtained, as shown in FIGURE 18c.
- the highly nonlinear waveform of FIGURE 18c is readily detected, causing the system to become highly sensitive to the contrast agent which produced the nonlinear echo responses.
Abstract
Description
- This invention relates to ultrasonic diagnosis and imaging of the body with ultrasonic contrast agents and, in particular, to new methods and apparatus for ultrasonically detecting and imaging with contrast agents.
- Ultrasonic diagnostic imaging systems are capable of imaging and measuring the physiology within the body in a completely noninvasive manner. Ultrasonic waves are transmitted into the body from the surface of the skin and are reflected from tissue and cells within the body. The reflected echoes are received by an ultrasonic transducer and processed to produce an image or measurement of blood flow. Diagnosis is thereby possible with no intervention into the body of the patient.
- Materials known as ultrasonic contrast agents can be introduced into the body to enhance ultrasonic diagnosis. Contrast agents are substances which strongly interact with ultrasonic waves, returning echoes which may be clearly distinguished from those returned by blood and tissue. One class of substances which has been found to be especially useful as an ultrasonic contrast agent is gases, in the form of tiny bubbles called microbubbles. Microbubbles present a significant acoustic impedance mismatch in the body, and nonlinear behavoir in certain acoustic fields which is readily detectable through special ultrasonic processing. Gases that have been stabilized in solutions in the form of tiny microbubbles are infused into the body and survive passage through the pulmonary system and circulate throughout the vascular system.
Microbubble contrast agents are useful for imaging the body's vascular system, for instance, as the contrast agent can be injected into the bloodstream and will pass through the veins and arteries of the body with the blood supply until filtered from the blood stream in the lungs, kidneys and liver. - One type of microbubble contrast agent currently under investigation comprises coated microbubbles. The microbubbles of the contrast agent are covered with a thin biodegradable coating or shell. The microbubbles have diameters between 0.1 µm and 4.0 µm and a specific density about 1/10 of the density of water. The coated microbubbles are suspended in an aqueous solution for infusion into the blood stream.
- Coated microbubbles have the advantage of being stable in the body for a significant period of time, as the shells serve to protect the gases of the microbubbles from diffusion into the bloodstream. The size of the microbubbles is chosen to enable the microbubbles to pass through capillary beds in the body.
- At moderately high sound pressure amplitudes the acoustic pressure waves can cause the shells of coated microbubbles to rupture, freeing the bubbles to behave as noncoated microbubbles until they diffuse into the bloodstream. In their noncoated form acoustic energy can induce nonlinear motion of the microbubbles, itself a detectable ultrasonic phenomenon. This acoustically induced destruction and collapse of the microbubbles produces a high amplitude response and a characteristically bright pattern in the color Doppler mode. Hence color Doppler is an advantageous modality for detecting the collapse of contrast agent microbubbles.
- U.S. Pat. 5,456,257, assigned to the same assignee as the present invention, describes a technique for detecting microbubbles through phase insensitive detection of microbubble destruction and differentiation of the detected signals on a spatial basis. Phase insensitive contrast agent detection advantageously reduces artifacts from moving tissue and also performs well when imaging contrast agent perfused tissue, where the contrast agent is finely distributed and moving slowly through the fine capillary structure of tissue. It is desirable to be able to perform contrast agent imaging with equal effect in large, rapidly moving blood pools such as the chambers of the heart. It is also desirable to specifically tailor the operation of the ultrasound machine to harmonic characteristics when performing harmonic contrast imaging.
- In accordance with the principles of present invention, new and improved apparatus and methods for the detection and imaging of ultrasonic contrast agents are provided. Ultrasonic apparatus is provided for coherent imaging of ultrasonic contrast agents, which is advantageous in blood pool contrast imaging. In a second embodiment, the apparatus is specially tailored to be programmed with response characteristics suitable for harmonic contrast agents. The inventive apparatus also includes a display for simultaneously viewing a real time image which displays anatomical structures for localization of the contrast agent and a triggered contrast image displaying contrast enhanced images. Methods of employing the inventive apparatus with contrast agents include the measurement of perfusion rate characteristics, multizone contrast imaging, a technique for discerning larger vessels in a bed of fine capillary structures, multifrequency contrast imaging, the display of contrast enhanced tissue, a technique for the elimination of artifacts occurring during high PRF contrast image acquisition, and alternate polarity acquisition of nonlinear contrast effects.
- In the drawings:
- FIGURE 1 illustrates in block diagram form an ultrasonic diagnostic system of U.S. Pat. 5,456,257 which is capable of performing phase insensitive contrast agent detection;
- FIGURE 2 illustrates in block diagram form an ultrasonic diagnostic system of the present invention which is capable of performing coherent contrast agent detection;
- FIGURE 3 illustrates an ultrasonic image display for contrast agent imaging;
- FIGURE 4 illustrates in block diagram form a second embodiment of the present invention which provides performance advantages for harmonic contrast agent detection;
- FIGURES 5 and 6 illustrate passband characteristics used to explain the performance of the embodiment of FIGURE 4;
- FIGURE 7 illustrates the principle of time separated pulsing when imaging contrast agents;
- FIGURE 8 illustrates an FIR filter structure suitable for use in the embodiment of FIGURE 4;
- FIGURES 9a-9d illustrate the effects of stenoses on contrast agent perfusion;
- FIGURES 10a and 10b illustrate perfusion curves for good and poor perfusion rates;
- FIGURES 11a and 11b illustrate repetitive perfusion curves for good and poor perfusion rates;
- FIGURE 12 illustrates a triggering technique for estimating the perfusion curve of FIGURE 13;
- FIGURES 14a-14c illustrate a multizone contrast agent scanning technique;
- FIGURES 15a and 15b illustrate display mapping characteristics for contrast agent imaging;
- FIGURE 16 illustrates the heart in cross section;
- FIGURES 17a-17c illustrate the removal of artifacts occurring during high PRF contrast imaging; and
- FIGURES 18a-18c illustrate nonlinear response waveforms produced by alternate polarity acquisition of contrast agent echoes.
- Referring to FIGURE 1, an ultrasonic diagnostic system described in U.S. Pat. 5,456,257 is illustrated in block diagram form. This ultrasound system is capable of performing phase insensitive contrast agent detection as described in that patent. In the illustrated system, coherent echo signals produced by a
beamformer 16 are quadrature demodulated by an I,Q demodulator 18 to produce quadrature I and Q signal components. The demodulated signal components are amplitude detected by anenvelope detector 20. The detected signals are filtered by afilter 22 to remove noise and other extraneous signal components. Spatially aligned, temporally separated detected echo signals are differentiated by a pulse topulse differentiation subsystem 24, and the differential signals are used to form contrast agent enhanced images. - Performing pulse to pulse differentiation of envelope detected echo signals provides advantages in certain procedures. When contrast agents are being used in a mode where microbubbles in the fine capillary structures of tissue are destroyed by ultrasonic waves, differentiation of the echo envelope is particularly useful. In this mode of operation a first ultrasonic pulse destroys the microbubbles in the tissue and these destruction events are received and envelope detected. A second pulse is transmitted to the same locations, and the returning echoes, ideally, show an absence of microbubbles at the locations where the microbubbles were destroyed. The second set of echoes is subtracted from the first set on a spatial basis, yielding difference signals of substantial magnitude at the locations where the microbubbles were destroyed, which are then displayed at corresponding pixel locations on a display. In a realistic setting the second set of echoes may not actually reveal voids where microbubbles were destroyed, due to motional effects, diffusion rates, and other bubble activity. However the difference in bubble activity from one pulse to the next will provide a highly detectable response when differentiated on a pulse to pulse, spatial basis.
- This dramatic difference in scattering characteristics of microbubbles from one pulse to another may be due to a host of factors: the bursting of microbubble coatings; oscillation and nonlinear microbubble motion; diffusion of a microbubble during the interpulse interval; or bubble repositioning, for instance. When microbubble destruction is referred to herein it encompasses the effects of phenomena such as these.
- A first embodiment of an ultrasonic diagnostic system constructed in accordance with the principles of the present invention is shown in FIGURE 2. This embodiment provides coherent detection of ultrasonic contrast agents. An
ultrasonic probe 10 includes anarray 12 of ultrasonic transducers which transmit and receive ultrasonic energy. During transmission, anultrasonic beamformer 16 controls the timing of actuation of the separate elements of thearray 12 by activating the transducer pulsers of a transmitter/receiver 14 at appropriate times to pulse the transducer elements so that a steered and focused ultrasonic beam is produced. During reception ultrasonic echoes received by the transducer elements are received by transmitter/receiver 14 and coupled to separate channels of thebeamformer 16, where the signals are appropriately delayed then combined to form a sequence of coherent echo signals over the depth of reception in the body of the patient. - The coherent echo signals are quadrature demodulated by an I,
Q demodulator 18 which produces quadrature I and Q signal components. The demodulated signal components are coupled to aB mode processor 37 which filters, detects, and maps greyscale echo signals in the usual manner. The greyscale echo signals of the scanlines of an image are coupled to ascan converter 40 for display of a B mode image. - In accordance with the principles of the present invention the I and Q signal components are alternatively (or in addition) coupled to a pulse to
pulse differentiation circuit 24 which differentiates echoes received from the same sample volume (location) in the body on a temporal basis. The results of this differentiation are coupled to anamplitude detector 20 and the differential response signals are coupled to anevent discriminator 27. The event discriminator discriminates events of microbubble destruction at the sample volume location from the differentiated echo information. One convenient way to perform this discrimination is by comparison of the detected signals to a threshold fromthreshold generator 26, passing signals above a threshold and rejecting signals below the threshold. The discriminator will detect microbubble destruction events and reject low level noise. - Detected events are coupled to the
scan converter 40 for production of a spatial image of the microbubble destruction events in the desired image format. The destruction event image may be shown separately, or may be combined with the B mode image to show the contrast agent in relation to surrounding tissue structure. The images are coupled to avideo processor 42 which produces video signals for display on animage display 50. - This coherent contrast agent detection technique is highly sensitive to small variations in microbubble activity in the image area, and performs well when imaging the blood pool of a heart chamber, for instance. In a large blood pool with a large population of moving microbubbles, the probability of differential microbubble activity from one pulse to another is extremely high, explaining the high sensitivity of this technique for heart chamber imaging. In comparison with the incoherent contrast agent detection technique, coherent microbubble detection is more sensitive to tissue motion and more sensitive to individual microbubble events in high contrast agent concentrations. It is also possible to process received echoes both coherently and incoherently, to form an image which contains information from both processes.
- Contrast agent detection in accordance with the present invention provides excellent tissue clutter rejection.
- Microbubble echo signals are generally not received alone, but are usually accompanied by echo signals of much greater amplitude which are returned from neighboring tissue and structures. These tissue echoes can be several orders of magnitude greater than any of the microbubble echo signals, effectively masking them. The pulse to pulse differentiation processing can reject the tissue signals by effectively canceling them, revealing the contrast agent echoes which can then be more readily discriminated. This cancellation is enhanced by high PRF pulses, which further diminishes motional artifacts from tissue.
- It has been found that the microbubbles of a contrast agent exhibit greater sensitivity to ultrasonic pulses of certain characteristics and lesser sensitivity to pulses of other characteristics. In general, the higher the amplitude, the lower the frequency, and (to a lesser extent) the longer the burst length, the more sensitive the microbubbles are to destruction. Thus, the time of occurrence of microbubble destruction can be modulated and controlled. Microbubbles can be imaged in the bloodstream by scanning at a high frequency with low amplitude, (and to a lesser extent) short burst length pulses. When it is desired to stimulate microbubble destruction, higher power pulses of lower frequency and longer burst length are transmitted into the bloodstream. The ultrasound system of the present invention is provided with control presets for these two pulse transmission characteristics, enabling the clinician to switch from nondestructive imaging pulses to microbubble destruction pulses when the clinician so desires. The preferred display of anatomical structures and microbubble activity employs programmed switching between the destructive and nondestructive pulse modes for contrast agent and anatomical structure imaging.
- A second embodiment of an ultrasonic diagnostic system constructed in accordance with the principles of the present invention for use with harmonic contrast agents is shown in FIGURE 4. In this second embodiment the array transducer 112 of the
probe 110 transmits ultrasonic energy and receives echoes returned in response to this transmission. The response characteristic of the transducer can exhibit two passbands, one around the central transmit frequency and another about the center of the received passband. For imaging harmonic contrast agents, a broadband transducer having a passband encompassing both the transmit and receive passbands is preferred. The transducer may be manufactured and tuned to exhibit a response characteristic as shown in FIGURE 5, in which thelower hump 60 of the response characteristic is centered about the center transmit frequency ft, and theupper hump 62 is centered about the center frequency fr of the response passband. The transducer response characteristic of FIGURE 6 is preferred, however, as the single dominant characteristic 64 allows the probe to be suitable for both harmonic contrast imaging and imaging without harmonic contrast agents. The characteristic 64 encompasses the central transmit frequency ft, and also the harmonic receive passband bounded between frequencies fL and fc, and centered about frequency fr. A typical harmonic contrast agent can have a response such that transmission about a central transmit frequency of 1.7 MHz will result in harmonic returning echo signals about a frequency of 3.4 MHz. A response characteristic 64 of approximately 2 MHz would be suitable for these harmonic frequencies. - In FIGURE 4 a central controller 120 provides a control signal ftr to a transmit
frequency control circuit 121 to control the center frequency and time of transmission of the transmitted ultrasonic energy. The transmit frequency control circuit pulses the elements of the transducer array 112 by means of a transmit/receiveswitch 114. A preferred method of pulsing the transducer array is in bursts which scan with sufficient pulses to form an image, followed by intervals of no pulse transmission. Such bursts and intervals are shown in FIGURE 7, which shows a burst interval nPRF and a frame interval tFr, the frame interval including the burst interval and an interval of no pulse transmission. The latter interval allows time for new contrast agent coursing through the body to infuse the vessels and tissue of the image plane between frame bursts. The frame intervals can be on the order of one second, and can be gated to the heart rate or asynchronous with respect to the heart rate. During each nPRF burst interval, echoes from the same spatial locations can be gathered for Doppler processing. Preferably a high PRF rate such as 6 KHz is used. Imaging procedures of this type are the subject of U.S. Pats. [appl. serial nos. 08/439,619 and 08/540,463]. - Medical diagnostic ultrasonic scanning is limited by regulatory requirements in peak pressure amplitude of a transmitted pulse and the integral of the energy transmitted. The preferred scanning of contrast agents in accordance with the embodiment of FIGURE 4 utilizes relatively high peak pulse power, with the time integral of transmitted energy lessened by the intervals during which no pulses are transmitted. The ultrasound system is set to operate with a relatively high mechanical index and an SPTA moderated by the gated or interval bursts.
- Echoes received by the transducer array 112 are coupled through the T/
R switch 114 and digitized by analog todigital converters 115. The sampling frequency fs of the A/D converters 115 is controlled by the central controller. The desired sampling rate dictated by sampling theory is at least twice the highest frequency fc of the received passband and, for the preceding exemplary frequencies, might be on the order of at least 8 MHz. Sampling rates higher than the minimum requirement are also desirable. - The echo signal samples from the individual transducer elements are delayed and summed by a
beamformer 116 to form coherent echo signals. The digital coherent echo signals are then filtered by a digital filter 118. In this embodiment, the transmit frequency ft is not tied to the receiver, and hence the receiver is free to receive a band of frequencies which is separate from the transmitted band. The digital filter 118 bandpass filters the signals in the passband bounded by frequencies fL and fc in FIGURE 6, and can also shift the frequency band to a lower or baseband frequency range. The digital filter could be a filter with a 1 MHz passband and a center frequency of 3.4 MHz in the above example. A preferred digital filter is a series of multipliers 70-73 and accumulators 80-83 as shown in FIGURE 8. This arrangement is controlled by the central controller 120, which provides multiplier weights and decimation control which control the characteristics of the digital filter. Preferably the arrangement is controlled to operate as a finite impulse response (FIR) filter, and performs both filtering and decimation. For example, only thefirst stage output 1 could be controlled to operate as a four tap FIR filter with a 4:1 decimation rate. Temporally discrete echo samples S are applied to themultiplier 70 of the first stage. As the samples S are applied, they are multiplied by weights provided by the central controller 120. Each of these products is stored in theaccumulator 80 until four such products have been accumulated (added). An output signal is then produced at thefirst stage output 1. The output signal has been filtered by a four tap FIR filter since the accumulated total comprises four weighted samples. Since the time of four samples is required to accumulate the output signal, a 4:1 decimation rate is achieved. One output signal is produced for every four input samples. The accumulator is cleared and the process repeats. It is seen that the higher the decimation rate (the longer the interval between output signals), the greater can be the effective tap number of the filter. - Alternatively, temporally separate samples are delayed by delay elements τ and applied to the four multipliers 70-73, multiplied, and accumulated in the accumulators 80-83. After each accumulator has accumulated two products, the four output signals are combined as a single output signal. This means that the filter is operating as an eight tap filter with a 2:1 decimation rate. With no decimation, the arrangement can be operated as a four tap FIR filter. The filter can also be operated by applying echo signals to all multipliers simultaneously and selectively time sequencing the weighting coefficients. A whole range of filter characteristics are possible through programming of the weighting and decimation rates of the filter, under control of the central controller.
- Returning to FIGURE 4, filtered echo signals from tissue, generally filtered by a passband centered about or demodulated from the transmit frequency, are coupled to a
B mode processor 37 for conventional B mode processing. Filtered echo signals of the contrast agent passband are coupled to a contrast signal detector 128 which eliminates stationary tissue signals by pulse to pulse subtraction of temporally discrete echoes from a given spatial location, amplitude or envelope detects the resulting difference signals, and discriminates for motion signal components on an amplitude basis. Simple two pulse subtraction of the form P1 - P2 may be employed where P1 represents the echoes received following one pulse and P2 represents the echoes received following another pulse. Three pulse subtraction of the form |P1-P2| + |P2-P3| may be employed to accumulate more signals from successive bubble destruction pulses. - The filtered echo signals from the digital filter 118 are also coupled to a
Doppler processor 130 for conventional Doppler processing to produce velocity and power Doppler signals. The outputs of these processors are coupled to a 3Dimage rendering processor 132 for the rendering of three dimensional images, which are stored in a3D image memory 134. Three dimensional rendering may be performed as described in U.S. Pat. [appl. serial no. 08/638,710], and in U.S. Pats. 5,474,073 and 5,485,842, the latter two patents illustrating three dimensional power Doppler ultrasonic imaging techniques. The signals from the contrast signal detector 128, theprocessors video processor 140 where they may be selected for display on animage display 50 as dictated by user selection. The video processor preferably includes persistence processing, whereby momentary intensity peaks of detected contrast agents can be sustained in the image. One technique for providing persistence is through frame averaging, whereby new image frames are combined with previous frame information on a spatial basis. The combination can be done by weighting the contributions of the old and new frame information and the frame information can be combined in a recursive manner; that is, old frame information is fed back for combining with new frame information. A preferred persistence technique is the fast attack, slow decay technique described in U.S. Pat. 5,215,094, which can be applied to both Doppler and contrast agent images. - Several imaging formats have been found to be preferred for contrast imaging. Power motion imaging as described in U.S. Pat. [appl. serial no. 08/655,391] in which the intensity of signals resulting from moving tissue is displayed, has been found to be highly diagnostic for structures such as the walls of the heart when perfused with contrast agents. Power Doppler imaging has been found to yield excellent results for bloodflow. Three dimensional power Doppler imaging of vessels infused with contrast agent provide excellent visualization of the continuity of bloodflow and stenoses. The combination of B mode or power motion structural information with power Doppler signals in accordance with the semi-transparent rendering techniques of the aforementioned patent [appl. serial no. 08/638,710] provides superb renderings of both flow and surrounding structure.
- A preferred display format for contrast agent imaging is depicted by the screen display of FIGURE 3. In this display the signals produced by the
B mode processor 37 are used to display a realtime image display 160 of structure in the body such as ablood vessel 170. This real time image is used by the clinician to ascertain and locate the area of the body to be imaged. Preferably the B mode image is created from echoes returning from nondestructive ultrasonic imaging pulses. As discussed above, pulses of low amplitude, high frequency, and short burst duration will generally not destroy the microbubbles. However, echoes from pulses destructive of microbubbles are used by the contrast signal detector 128 to produce contrast agent images 160' on the same or an adjacent monitor. Preferably the contrast agent images 160'are triggered to be acquired at a predetermined phase of the heart cycle, using a heart gate triggering from the phases of the heartbeat waveform. When the heartbeat is at the desired phase of its cycle, a burst of relatively high amplitude, low frequency, long burst duration pulses are transmitted to destroy the microbubbles in the image plane and detect and display those events. A B mode image acquired at or near the same heartbeat phase is displayed, with the vessel or organ 170' filled in with the imaged microbubble destruction events. Thus, the display screen of FIGURE 3 will show aB mode image 160 in real time, and a contrast agent image 160'which is updated each heart cycle. - While the foregoing image presentation is especially useful in cardiology where the beating heart is constantly in motion, a variation of this presentation is especially useful in radiology where tissue structure is more stationary. In the variation, a real time
B mode image 160 of anatomical structure is shown, with fluid flow 170' filled in with color Doppler. This real time color flow Doppler image is then periodically filled in with detected contrast agent, sharply illuminating the bloodflow. The colorflow Doppler display and the contrast agent display, both of which are filling in the same areas of the anatomical display, may be shown in the same, similar, or contrasting colors and intensities. The periodicity of the overlaid contrast agent display may be synchronized to the heart cycle with an EKG trigger as described above, or the periodicity may be chosen by the user and asynchronous to the heart cycle. - A contrast agent procedure which is advantageously performed in accordance with the present invention is the measurement of the rate of perfusion of an organ or area of the body. FIGURE 9a illustrates the travel of an intravenous injection of contrast agent to a
capillary bed 200. The agent travels in the bloodstream as it moves from theinjection site 208 and traverses the right ventricle 202, thelungs 204, and the left ventricle 206 before reaching an artery 209. The contrast agent then begins to infuse the tissue of thecapillary bed 200 as blood flows from theartery 200 through the arterioles 210 and into the capillaries of the tissue. - The perfusion rate into the capillary bed can be used to evaluate the viability of bloodflow in that region of the body or to identify the location of a stenosis. Ultrasonic pulses are transmitted to destroy microbubbles in a
region 212 across thecapillary bed 200, as shown in FIGURE 9b. If astenosis 214 is impeding the flow of blood in the artery 209 and hence to theentire capillary bed 200, the rate of reperfusion of microbubbles will be slow across theentire region 212. But if thestenosis 216 is in an artery which feeds only part of thecapillary bed 200, the rate of perfusion will be slow in only theportion 218 of the region which is fed through the stenotic artery. This difference in the rate of reperfusion is illustrated graphically by the curves of FIGURES 10a and 10b. Each of these curves shows the same blood volume and hence the sameinitial microbubble concentration 220 before the microbubbles are destroyed in the capillary bed. At time td ultrasonic pulses destroy the microbubbles as indicated by the vertical spike in each curve. When blood is flowing freely into the capillary bed, a rapid rate of reperfusion of microbubbles occurs as indicated bycurve 222 in FIGURE 10a. Thecurve 222 rapidly rises back to the stablemicrobubble concentration level 220. But when the bloodflow is impeded, the rise of thecurve 224 is much more gradual, as indicated in FIGURE 10b. The reperfusion curve can be repeated continually as shown by FIGURES 11a and 11b. FIGURE 11a shows a repetitive sequence of reperfusion curves 222, each returning to thefull perfusion level 220 in a period of time tp. In FIGURE 11b, eachcurve 224 of the same duration tp is short of thefull perfusion level 220 by an amount indicated by arrows B-B. - The reperfusion curve may be reproduced as indicated in FIGURE 13. Ultrasonic pulses are transmitted at time td to destroy the microbubbles in the capillary bed. A short time later pulses are transmitted again, the echoes received and imaged to this time measure the degree of microbubble reinfusion, either by destroying reinfused microbubbles and recording the destruction events, or by counting or integrating pixels in the area which show reinfused microbubbles. The measure of the number of microbubbles reinfused to the region is plotted as a point X of the
curve 224. Nondestructive pulses can be repetitively transmitted and echoes received to plot a sequences of X points on the curve as shown in FIGURE 13. - Another way to measure the X points on the reinfusion curve through readily detectable microbubble destruction events is to utilize a cyclic measure similar to the repetitive pattern of FIGURE 11b. The cyclic measure is useful where the flow in the region is strongly pulsatile due to the heartbeat cycle. FIGURE 12 shows a
heart cycle waveform 230, indicating the pulsatile action of bloodflow. At the peaks of thewaveform 230, new blood is pumped into regions of the body during the systolic phase of the heart cycle. Advantage is taken of this reinfusing action by repetitively measuring the degree of contrast agent reinfusion at a constant point in the heart cycle, but following continually differing phases of microbubble destruction. In FIGURE 12 the X points of reinfusion measurement all occur at the same phase of the heart cycle. The X points are preceded by changing times at which the microbubbles are destroyed, as indicated byarrows curve 224 of FIGURE 13. Since the purpose of ultrasonic transmission at the times ofarrows - For cardiac imaging it may be desirable to trigger the Xn times in synchronisation with the diastolic phase of the heart cycle when the coronary arteries are reinfused with blood. Triggered or grated acquisition is especially significant in cardiac imaging to reduce tissue motion artifacts stemming from beating movement of the heart.
- This technique of measuring perfusion by microbubble destruction can also be used to image the flow in major vessels of a capillary bed. In FIGURE 9d, for instance, it is seen that the
major vessels 240 reinfuse earlier than the fine capillaries in a microbubble depletedregion 212. Themajor vessels 240 can be revealed by detecting microbubbles in theregion 212 shortly after pulses have destroyed all of the microbubbles in the region, at which time only themajor vessels 240 have been significantly reinfused with contrast agent. - It has been found that it is at times not possible to destroy all microbubbles in the image plane due to several factors. Since microbubbles are destroyed by high energy, focused ultrasound beams tend to destroy more microbubbles near the beam focal point than at other locations. Also, when a dense concentration of microbubbles is to be destroyed, a great deal of the ultrasonic pulse energy is attenuated by the near field microbubbles, leaving insufficient energy to destroy far field microbubbles. A technique for overcoming these effects is shown in FIGURES 14a-14c. In these drawings, the horizontal axis represents depth into the body, with the skin line SL indicated at the left side of each drawing. A typical ultrasonic image may show the skin line at the top of the image and the deepest penetration into the body at the bottom of the image. To bring a maximum level of energy to bear on the microbubbles in the image plane, focused pulses are transmitted to focus the ultrasonic energy on the microbubbles which are to be destroyed. When imaging is to be done to a significant depth in the body, the pulses will not be focused over the full image depth, but will come into focus around a particular focal point and then diverge at greater depths. This is indicated in FIGURE 14a, where a transmitted pulse is focused at a focal point F1 which is in a focal zone Z1.
- Above this first focal zone Z1 is a
line 270, which represents complete microbubble destruction over this near field part of the focal zone Z1 and about the focal point F1. Beyond the focal point the degree of microbubble destruction decreases, as indicated by the decliningline 272. These lines are shown as straight lines for ease of explanation; it will be understood that the effect will usually be continually changing and that actual effects may follow a curved relationship. - FIGURE 14a represents the transmission of a first pulse along a given beam direction, a result of which is that near field microbubbles are destroyed as indicated by
lines - The next pulse transmission for microbubble destruction is focused at a second focal point F2 in a second focal zone Z2 of the beam. The transmitted pulse energy will readily reach the second focal zone, since the microbubbles in the nearer first zone were previously destroyed. FIGURE 14b illustrates this transmission to the second focal zone.
Line 282 indicates that the remaining microbubbles at the end of the first zone and the beginning of the second will be destroyed by the second destruction pulse, as will microbubbles around the focal point as indicated byline 280. Beyond the second focal point F2 the degree of microbubble destruction will decline as pulse energy declines, as indicated byline 284. A second interrrogation pulse may be transmitted following the second destructive pulse to differentially detect the second sequence of microbubble destruction events. - Similarly, a third destruction pulse is transmitted along the beam direction, focused at the deepest focal point F3 in the deepest focal zone Z3. The pulse energy readily reaches the third focal zone due to the earlier depletion of microbubbles at shallower depths. The third destruction pulse destroys the remaining microbubbles between the second and third zones as indicated by line 292 in FIGURE 14c, destroys microbubbles around the focal point as indicated by
line 290, and destroys a decreasing amount of microbubbles beyond the focal point F3 as indicated byline 294. A third interrogation pulse follows for differential detection of the microbubble destruction events in and around zone Z3. - In practice it has been found that peak microbubble destruction is not centered exactly about the focal point axially, but in a depth region just prior to the focal point. This factor should be taken into consideration when considering the placement and overlap of multizone microbubble destruction regions.
- The detected destruction events over the three zones are then combined in accordance with the expression

- It is also seen that, instead of transmitting a pair of pulses to interrogate each focal zone, the echoes returned from later focal zone transmissions can be combined with earlier echoes to differentially detect destruction events. That is, the first term of the above expression could be |PF1-PF2|, for instance. However, the use of pulse pairs for each focal zone is preferred, as the aperture changes accompanying focal zone changes can deleteriously affect the precision of the technique.
- More uniform, artifact-free multizone microbubble destruction images can be obtained by pulsing nonadjacent beams with time successive pulses. This ensures that each line of microbubbles will be approximately uniformly undisturbed at the beginning of the multizone sequence, preventing successions of bright and dim lines in the ultrasonic image.
- FIGURES 15a, 15b and 16 illustrate a preferred technique for displaying contrast agent enhanced images when tissue perfusion is being observed. FIGURE 16 illustrates a cross sectional view of the heart, including the
myocardium 260 and theblood pool 250 within a chamber of the heart. When a contrast agent has been introduced into the bloodstream, a great quantity of the agent will be contained within large blood pools such as the heart chambers and major vessels, while only a relatively small quantity of contrast agent will enter tissue and organs by way of capillary structures. In the heart image of FIGURE 16, a large quantity of contrast agent will be present in theblood pool 250 while a lesser amount will be infused by capillary flow into themyocardium 260. - A conventional ultrasonic display of the cross sectional image of FIGURE 16 will cause pixels of greater signal level to be illuminated with greater brightness or color. A typical display mapping characteristic which provides this result is shown in FIGURE 15a by mapping characteristic 252. As detected pixel values increase, the display pixels are shown with increasing brightness or color until reaching a maximum plateau level. As a result, the
blood pool area 250 in FIGURE 16 will be shown brightly or highly colored, whereas themyocardium 260 will be only dimly illuminated or colored. - When the myocardium is the area of interest in FIGURE 16, a display mapping characteristic such as that shown in FIGURE 15b is employed. The
curve 254 in this drawing is seen to begin at a zero level to suppress noise in the image, then rises to ahigh level 256. Thereafter it declines to alevel 258 for higher detected signal values. As a result, lower detected pixel values will be mapped to brightly illuminated or colored display pixels, and higher detected pixel values will be mapped to more dimly illuminated or colored display pixel values. As a consequence of this mapping, themyocardium 260 in FIGURE 16 will be brightly illuminated or colored, while the central blood pool is only dimly colored or illuminated. This emphasis provides highlighting of contrast agent perfused tissue over blood pool areas. - Pulse transmission techniques can afford further improvement in contrast agent destruction and detection. While the exact physical mechanisms caused the by interaction of microbubbles with acoustic energy are quite complex, the sizes of microbubbles have an effect upon their destruction at certain frequencies. Since a microbubble contrast agent is often comprised of microbubbles of a wide range of diameters, microbubble destruction events can be increased by transmitting a chirp or multifrequency pulse. By transmitting a frequency modulated pulse, the probability of transmitting destructive energy for a greater range of microbubble sizes is increased. In addition, by modulating both the frequency and amplitude of the destructive pulse, both microbubble destruction and controlled oscillation can be induced. The initial high amplitude, low frequency period of the pulse, followed by a lower amplitude, higher frequency period can induce microbubble shell destruction followed by oscillation of the released microbubble.
- Another transmission technique which affords high pulse rates (PRF) is illustrated in FIGURES 17a-l7c. FIGURE 17a illustrates the transmission of a first pulse P1 for contrast agent imaging of the heart, followed by a second pulse P2. In this example the pulses are transmitted at a low PRF, and a significant period of time exists between the transmission times of the pulses. During this time echoes 300 are first received from contrast agent in the myocardium, and later echoes 302 are received from the more distant pericardium. Differentiation of the echoes following the two pulses will detect the presence of contrast agent in the myocardium, followed by detection of the pericardium itself.
- For procedures where it is only desirable to perform contrast agent imaging of the myocardium, a higher PRF transmission can be employed as shown in FIGURE 17b. The higher PRF pulses have the unfortunate result of artifact development.
Echoes 300 return from the contrast agent in the myocardium following pulse P1. But echoes 302 returning from the pericardium in response to the first pulse P1 appear in the interval following the second pulse P2 and can manifest themselves as an artifact in the image when echoes following the two pulses are differentiated. To eliminate the artifact from the later returning echoes, incoherent detection is employed prior to differentiation by the apparatus of FIGURE 1. As shown in FIGURE 17c, incoherent detection and differentiation results in positive polarity echoes 300'from the myocardium microbubbles, and negative polarity echoes 302' from the pericardium. The unwanted negative polarity echoes 302' from the pericardium can then be removed by thresholding or clipping at the baseline, leaving only the desired detection of the contrast agent in the myocardium. - A third transmission technique which is useful for microbubble detection is to alternate the polarity of the transmitted pulses, which provides the benefits of suppressing the harmonic components of the transmitted signals while eliminating clutter. FIGURE 18a illustrates an
echo waveform 310 received from the pulsing of a microbubble. The nonuniform amplitudes on either side of the zero reference level illustrate nonlinear reflexive action of microbubbles in the presence of acoustic waves, as the microbubbles nonlinearly compress and expand. The echo waveform of 310 FIGURE 18a results from transmission of an ultrasonic pulse exhibiting a first polarity. - Following transmission of an ultrasonic pulse exhibiting the opposite polarity, the
echo waveform 312 of FIGURE 18b results. This waveform is similarly nonlinear, but out of phase with the first waveform due to the change in pulse polarity. When the two waveforms are combined, a harmonic response is obtained, as shown in FIGURE 18c. The highly nonlinear waveform of FIGURE 18c is readily detected, causing the system to become highly sensitive to the contrast agent which produced the nonlinear echo responses.
Claims (39)
- An ultrasonic diagnostic system for the coherent detection of ultrasonic contrast agents comprising:an ultrasonic transducer probe for transmitting ultrasonic pulses into a body infused with an ultrasonic contrast agent and receiving ultrasonic echo signals following a pulse transmission;a beamformer for forming coherent echo signals; means for differentiating coherent echo signals received from two pulse transmissions;means for detecting differentiated coherent echo signals; anda display for displaying detected differentiated signals emanating from said ultrasonic contrast agent.
- The ultrasonic diagnostic system of Claim 1, wherein said means for detecting comprises an amplitude detector.
- The ultrasonic diagnostic system of Claim 2, further comprising an event discriminator for discriminating detected signals which emanated from a contrast agent.
- The ultrasonic diagnostic system of Claim 3, wherein said event discriminator comprises means for comparing detected signals against a threshold level.
- The ultrasonic diagnostic system of Claim 1, further comprising a B mode processor for producing B mode image signals,
wherein said display displays a B mode image combined with the display of detected differentiated signals emanating from said ultrasonic contrast agent. - An ultrasonic diagnostic system for the detection of a harmonic ultrasonic contrast agent comprising:an ultrasonic transducer probe for transmitting ultrasonic pulses at a first frequency into a body infused with an ultrasonic contrast agent and receiving harmonic ultrasonic echo signals following a pulse transmission;a receiver for receiving harmonic signals emanating from said ultrasonic contrast agent;a programmable filter which filters said received harmonic signals with a passband excluding said first frequency and including a harmonic of said first frequency; anda contrast signal detector for detecting said received harmonic signals; anda display for displaying received harmonic signals.
- The ultrasonic diagnostic system of Claim 6, wherein said programmable filter comprises a programmable digital filter.
- The ultrasonic diagnostic system of Claim 7, wherein the programmable characteristics of said digital filter include the weighting of received signals and the decimation rate of the filtered signals produced by said filter.
- The ultrasonic diagnostic system of Claim 6, wherein said programmable filter comprises an FIR filter.
- The ultrasonic diagnostic system of Claim 6, further comprising a B mode processor for producing B mode image signals,wherein said programmable digital filter alternately provides signals for said B mode processor and said contrast signal detector.
- The ultrasonic diagnostic system of Claim 10, wherein said programmable digital filter provides filtered signals for said B mode processor which include signals of said B mode passband and excludes said harmonic of said first frequency, and provides filtered signals for said contrast signal detector which includes said harmonic of said first frequency and excludes signals of said first frequency.
- The ultrasonic diagnostic system of Claim 6, further comprising means for rendering three dimensional images of said received harmonic signals.
- A method for ultrasonically detecting the perfusion rate of tissue by ultrasonic contrast agents comprising the steps of:introducing an ultrasonic contrast agent of microbubbles into the bloodstream;transmitting an ultrasonic pulse which destroys microbubbles in said tissue; andfollowing the destruction of said microbubbles by a time interval, ultrasonically measuring the degree of microbubble reperfusion of said tissue during said time interval.
- The method of Claim 13, further comprising the steps of repeating said transmitting and measuring steps with a different time interval.
- The method of Claim 13, further comprising the steps of repeating said transmitting and measuring steps with the same time interval.
- The method of Claim 13, wherein said step of ultrasonically measuring comprises the step of acquiring echo signals following transmission of a second ultrasonic pulse into said tissue.
- The method of Claim 16, wherein said step of ultrasonically measuring further comprises the step of creating an ultrasonic image with said acquired echo signals.
- The method of Claim 17, wherein said step of transmitting comprises transmitting a relatively low frequency, high amplitude ultrasonic pulse into said tissue, and wherein said step of ultrasonically measuring comprises the step of transmitting a second ultrasonic pulse of relatively high frequency and low amplitude into said tissue.
- A method for ultrasonically imaging a region of the body which has been infused with a microbubble ultrasonic contrast agent comprising the steps of:transmitting a first pulse into the body which is focused at a first depth within the body to cause a response from microbubbles located at said first depth;receiving echoes following the transmission of said first pulse;transmitting a second pulse into the body which is focused at a second depth within the body to cause a response from microbubbles located at said second depth;receiving echoes following the transmission of said second pulse; andproducing an ultrasonic image from echoes received following said first and second pulses.
- The method of Claim 19, wherein said first and second pulses are transmitted along substantially the same beam direction.
- The method of Claim 20, wherein said microbubble response comprises the destruction of microbubbles.
- The method of Claim 20, wherein said steps of receiving echoes comprise receiving echoes from said first and second depths.
- A method of ultrasonically imaging tissue whose perfusion has been enhanced with an ultrasonic contrast agent in the presence of a blood pool containing contrast agent comprising the steps of:insonifying said perfused tissue and blood pool;receiving echoes returned from ultrasonic contrast agent in said perfused tissue and blood pool;processing said received echoes for display by displaying greater intensity echoes with a lesser brightness or color intensity than echoes of lesser intensity,whereby said perfused tissue is highlighted in the display relative to said blood pool.
- A method of ultrasonically detecting destruction events of microbubbles of a microbubble contrast agent present in the body comprising the steps of:transmitting an ultrasonic wave which is destructive of microbubbles, said wave exhibiting a range of frequencies including a frequency which is destructive of microbubbles of a given size; and receiving ultrasonic signals following said ultrasonic wave transmission,whereby said wave is destructive of microbubbles of a given range of sizes including said given size.
- A method of ultrasonically detecting a microbubble contrast agent present in the body by high PRF pulses comprising the steps of:transmitting a first ultrasonic pulse into the body which causes a first response from said microbubbles;receiving a desired microbubble response to said first ultrasonic pulse;transmitting a second ultrasonic pulse into the body which causes a second response from said microbubbles;receiving a desired microbubble response to said second ultrasonic pulse and an undesired echo response to said first ultrasonic pulse;processing said received microbubble responses by incoherent detection, whereby said desired and undesired responses exhibit opposite polarities; andeliminating said undesired response.
- The method of Claim 25, wherein said first microbubble response is microbubble destruction and said second microbubble response is an absence of microbubble destruction.
- The method of Claim 26, wherein said undesired echo response to said first ultrasonic pulse emanates from tissue located deeper in the body than microbubbles which cause said first response.
- The method of Claim 25, wherein said processing step includes the step of differentiating the received microbubble responses to said first and second pulses.
- A method of ultrasonically detecting the harmonic response of an ultrasonic harmonic contrast agent comprising the steps of:transmitting a first ultrasonic pulse to said harmonic contrast agent to cause a first harmonic response;transmitting a second ultrasonic pulse of a different polarity than said first ultrasonic pulse to said harmonic contrast agent to cause a second harmonic response;detecting said first and second harmonic responses; andcombining said first and second harmonic responses.
- The method of Claim 29, wherein said step of combining comprises differentiating said first and second harmonic responses.
- The method of Claim 29, wherein said transmitted pulses exhibit a pulse energy which is within a range which causes microbubbles of said harmonic contrast agent to oscillate without substantial microbubble destruction.
- An ultrasonic diagnostic system for the detection and display of ultrasonic contrast agents within the body comprising:an ultrasonic transducer probe for transmitting ultrasonic pulses into a body infused with an ultrasonic contrast agent and receiving ultrasonic echo signals following a pulse transmission,including means for transmitting high and low energy ultrasonic pulses;a trigger circuit responsive to a physiological function for triggering high energy ultrasonic pulse transmission;a contrast signal processor for processing echoes received in response to high energy pulse transmission;a B mode signal processor for processing echoes received in response to low energy pulse transmission; anda display for displaying simultaneous real time B mode images and triggered contrast agent images.
- The ultrasonic diagnostic system of Claim 32, wherein said means for transmitting comprises means for selectively generating low frequency, high amplitude pulses or high frequency, low amplitude pulses.
- The ultrasonic diagnostic system of Claim 32, wherein said trigger circuit is responsive to a heartbeat waveform.
- An ultrasonic diagnostic system for the detection and display of ultrasonic contrast agents within the body comprising:an ultrasonic transducer probe for transmitting ultrasonic pulses into a body infused with an ultrasonic contrast agent and receiving ultrasonic echo signals following a pulse transmission, including means for transmitting high and low energy ultrasonic pulses;a trigger circuit for periodically triggering high energy ultrasonic pulse transmission;a contrast signal processor for processing echoes received in response to high energy pulse transmission;a Doppler processor for processing Doppler echoes received by said transducer probe;a B mode signal processor for processing echoes received in response to low energy pulse transmission; anda display for displaying real time B mode images containing color Doppler image information and periodically containing contrast agent image information.
- The ultrasonic diagnostic system of Claim 35, wherein said trigger circuit comprises means for triggering high energy ultrasonic pulse transmission in response to a heartbeat signal.
- The ultrasonic diagnostic system of Claim 35, wherein said real time images comprise colorflow Doppler images.
- The ultrasonic diagnostic system of Claim 35, wherein the periodicity of said trigger circuit is selected by the system user.
- The method of Claim 19, further comprising the steps of:transmitting a third pulse following said first pulse which is focused at said first depth;transmitting a fourth pulse following said second pulse which is focused at said second depth;receiving echoes following the transmission of said third and fourth pulses; andwherein said producing step comprises producing a ultrasonic image from the combination of echoes received following said first and third pulses, and from the combination of echoes received following said second and fourth pulses.
Priority Applications (1)
| Application Number | Priority Date | Filing Date | Title |
|---|---|---|---|
| EP03077615A EP1374777A1 (en) | 1995-10-10 | 1996-10-09 | Ultrasonic diagnostic imaging with contrast agents |
Applications Claiming Priority (6)
| Application Number | Priority Date | Filing Date | Title |
|---|---|---|---|
| US500995P | 1995-10-10 | 1995-10-10 | |
| US5009 | 1995-10-10 | ||
| US1395096P | 1996-03-22 | 1996-03-22 | |
| US13950 | 1996-03-22 | ||
| US1809596P | 1996-05-22 | 1996-05-22 | |
| US18095 | 1996-05-22 |
Related Child Applications (2)
| Application Number | Title | Priority Date | Filing Date |
|---|---|---|---|
| EP03077615A Division EP1374777A1 (en) | 1995-10-10 | 1996-10-09 | Ultrasonic diagnostic imaging with contrast agents |
| EP03077615A Division-Into EP1374777A1 (en) | 1995-10-10 | 1996-10-09 | Ultrasonic diagnostic imaging with contrast agents |
Publications (2)
| Publication Number | Publication Date |
|---|---|
| EP0770352A1 true EP0770352A1 (en) | 1997-05-02 |
| EP0770352B1 EP0770352B1 (en) | 2004-12-29 |
Family
ID=27357769
Family Applications (2)
| Application Number | Title | Priority Date | Filing Date |
|---|---|---|---|
| EP96307359A Expired - Lifetime EP0770352B1 (en) | 1995-10-10 | 1996-10-09 | Ultrasonic diagnostic imaging with contrast agents |
| EP03077615A Ceased EP1374777A1 (en) | 1995-10-10 | 1996-10-09 | Ultrasonic diagnostic imaging with contrast agents |
Family Applications After (1)
| Application Number | Title | Priority Date | Filing Date |
|---|---|---|---|
| EP03077615A Ceased EP1374777A1 (en) | 1995-10-10 | 1996-10-09 | Ultrasonic diagnostic imaging with contrast agents |
Country Status (5)
| Country | Link |
|---|---|
| EP (2) | EP0770352B1 (en) |
| JP (2) | JP4159122B2 (en) |
| AT (1) | ATE285711T1 (en) |
| DE (1) | DE69634112T2 (en) |
| ES (1) | ES2235180T3 (en) |
Cited By (62)
| Publication number | Priority date | Publication date | Assignee | Title |
|---|---|---|---|---|
| WO1998046139A1 (en) * | 1997-04-11 | 1998-10-22 | Acuson Corporation | Ultrasound imaging enhancement methods and systems |
| WO1998047533A1 (en) * | 1997-04-24 | 1998-10-29 | Nycomed Imaging A.S. | Ultrasound imaging of tissue perfusion by pulse energy disruption of contrast agent |
| US5833614A (en) * | 1997-07-15 | 1998-11-10 | Acuson Corporation | Ultrasonic imaging method and apparatus for generating pulse width modulated waveforms with reduced harmonic response |
| WO1998053855A1 (en) * | 1997-05-30 | 1998-12-03 | Alliance Pharmaceutical Corp. | Methods and apparatus for monitoring and quantifying the movement of fluid |
| US5846202A (en) * | 1996-07-30 | 1998-12-08 | Acuson Corporation | Ultrasound method and system for imaging |
| US5860931A (en) * | 1997-10-10 | 1999-01-19 | Acuson Corporation | Ultrasound method and system for measuring perfusion |
| WO1999003401A1 (en) * | 1997-07-15 | 1999-01-28 | Acuson Corporation | Ultrasound harmonic imaging transmission method and apparatus |
| US5873830A (en) * | 1997-08-22 | 1999-02-23 | Acuson Corporation | Ultrasound imaging system and method for improving resolution and operation |
| US5882306A (en) * | 1997-04-11 | 1999-03-16 | Acuson Corporation | Ultrasound imaging methods and systems |
| WO1999017808A1 (en) * | 1997-10-03 | 1999-04-15 | University Of Virginia | Ultrasound bubble recognition imaging |
| US5897500A (en) * | 1997-12-18 | 1999-04-27 | Acuson Corporation | Ultrasonic imaging system and method for displaying composite fundamental and harmonic images |
| US5902243A (en) * | 1998-04-15 | 1999-05-11 | Acuson Corporation | Ultrasonic imaging method with multiple pulse cancellation |
| US5902242A (en) * | 1998-01-22 | 1999-05-11 | Acuson Corporation | System and method for forming a combined ultrasonic image |
| US5924991A (en) * | 1997-08-22 | 1999-07-20 | Acuson Corporation | Ultrasonic system and method for harmonic imaging in three dimensions |
| US5933389A (en) * | 1995-03-02 | 1999-08-03 | Acuson Corporation | Ultrasonic imaging system and method |
| US5935069A (en) * | 1997-10-10 | 1999-08-10 | Acuson Corporation | Ultrasound system and method for variable transmission of ultrasonic signals |
| US5944666A (en) * | 1997-08-21 | 1999-08-31 | Acuson Corporation | Ultrasonic method for imaging blood flow including disruption or activation of contrast agent |
| US5957852A (en) * | 1998-06-02 | 1999-09-28 | Acuson Corporation | Ultrasonic harmonic imaging system and method |
| US5957845A (en) * | 1997-04-11 | 1999-09-28 | Acuson Corporation | Gated ultrasound imaging apparatus and method |
| EP0947853A2 (en) * | 1998-03-31 | 1999-10-06 | General Electric Company | Method and apparatus for enhanced flow imaging in b-mode ultrasound |
| EP0948931A2 (en) * | 1998-03-31 | 1999-10-13 | General Electric Company | Ultrasound imaging using coded excitation on transmit and selective filtering on receive |
| WO1999053309A1 (en) * | 1998-04-15 | 1999-10-21 | Acuson Corporation | Ultrasonic imaging aberration correction system and method |
| US5971928A (en) * | 1998-11-02 | 1999-10-26 | Acuson Corporation | Diagnostic medical ultrasonic system and method for image subtraction |
| US6005827A (en) * | 1995-03-02 | 1999-12-21 | Acuson Corporation | Ultrasonic harmonic imaging system and method |
| US6009046A (en) * | 1995-03-02 | 1999-12-28 | Acuson Corporation | Ultrasonic harmonic imaging system and method |
| US6027448A (en) * | 1995-03-02 | 2000-02-22 | Acuson Corporation | Ultrasonic transducer and method for harmonic imaging |
| US6030344A (en) * | 1996-12-04 | 2000-02-29 | Acuson Corporation | Methods and apparatus for ultrasound image quantification |
| US6039690A (en) * | 1997-06-17 | 2000-03-21 | Acuson Corporation | Method and apparatus for frequency control of an ultrasound system |
| US6048316A (en) * | 1998-10-16 | 2000-04-11 | Acuson Corporation | Medical diagnostic ultrasonic imaging system and method for displaying composite fundamental and harmonic images |
| WO2000036980A1 (en) * | 1998-12-18 | 2000-06-29 | Koninklijke Philips Electronics N.V. | Ultrasonic diagnostic imaging systems with power modulation for contrast and harmonic imaging |
| WO2000042916A1 (en) * | 1999-01-21 | 2000-07-27 | Acuson Corporation | Method and apparatus for ultrasound contrast imaging |
| US6104670A (en) * | 1995-03-02 | 2000-08-15 | Acuson Corporation | Ultrasonic harmonic imaging system and method |
| US6106465A (en) * | 1997-08-22 | 2000-08-22 | Acuson Corporation | Ultrasonic method and system for boundary detection of an object of interest in an ultrasound image |
| US6116244A (en) * | 1998-06-02 | 2000-09-12 | Acuson Corporation | Ultrasonic system and method for three-dimensional imaging with opacity control |
| WO2000053242A1 (en) * | 1999-03-12 | 2000-09-14 | Medrad, Inc. | Agitation devices and fluid dispensing systems incorporating such agitation devices for use in medical ultrasound imaging |
| US6132374A (en) * | 1997-08-01 | 2000-10-17 | Acuson Corporation | Ultrasonic imaging method and system |
| US6174286B1 (en) | 1998-11-25 | 2001-01-16 | Acuson Corporation | Medical diagnostic ultrasound method and system for element switching |
| US6186949B1 (en) | 1998-03-31 | 2001-02-13 | General Electric Company | Method and apparatus for three-dimensional flow imaging using coded excitation |
| US6193659B1 (en) | 1997-07-15 | 2001-02-27 | Acuson Corporation | Medical ultrasonic diagnostic imaging method and apparatus |
| US6193663B1 (en) | 1997-12-18 | 2001-02-27 | Acuson Corporation | Diagnostic ultrasound imaging method and system with improved frame rate |
| US6206833B1 (en) | 1996-11-08 | 2001-03-27 | Research Corporation Technologiers, Inc. | Finite amplitude distortion-based inhomogeneous pulse echo ultrasonic imaging |
| US6224556B1 (en) | 1998-11-25 | 2001-05-01 | Acuson Corporation | Diagnostic medical ultrasound system and method for using a sparse array |
| US6312379B1 (en) | 1997-08-15 | 2001-11-06 | Acuson Corporation | Ultrasonic harmonic imaging system and method using waveform pre-distortion |
| WO2002056666A2 (en) * | 2001-01-19 | 2002-07-25 | Angelsen Bjoern A J | A method of detecting ultrasound contrast agent in soft tissue, and quantitating blood perfusion through regions of tissue |
| EP1293802A2 (en) | 2001-08-14 | 2003-03-19 | Esaote S.p.A. | Ultrasound system and method for receiving echo signals at a harmonic of the transmission frequency |
| WO2003071949A1 (en) * | 2002-02-28 | 2003-09-04 | Koninklijke Philips Electronics N.V. | Ultrasonic imaging to detect coronary artery stenosis at rest |
| EP1358849A1 (en) * | 2001-02-01 | 2003-11-05 | Hitachi Medical Corporation | Ultrasonic enhanced-contrast imager and its method |
| US6706020B1 (en) | 1998-08-28 | 2004-03-16 | Schering Aktiengesellschaft | Syringes and injectors incorporating magnetic fluid agitation devices |
| EP1428475A1 (en) * | 2001-08-22 | 2004-06-16 | Kabushiki Kaisha Toshiba | Ultrasonograph |
| US6755787B2 (en) | 1998-06-02 | 2004-06-29 | Acuson Corporation | Medical diagnostic ultrasound system and method for versatile processing |
| US6966894B1 (en) | 1998-08-28 | 2005-11-22 | Schering Aktiengesellschaft | Syringes and injectors incorporating mechanical fluid agitation devices |
| EP1774361A2 (en) * | 2004-06-18 | 2007-04-18 | ANGELSEN, Bjorn A. J. | Ultrasonic contrast agent detection and imaging by low frequency manipulation of high frequency scattering properties |
| DE102006057211B3 (en) * | 2006-12-01 | 2008-03-27 | Kompetenzzentrum Medizintechnik Ruhr (Kmr) E.V. | Object e.g. biological tissue, infusion measuring method, involves determining re-enrichment conditions in time period, in which no tomogram series is received, by mathematical approximation technique |
| WO2009025769A1 (en) * | 2007-08-17 | 2009-02-26 | Jan Medical, Inc. | Non-invasive characterization of human vasculature |
| WO2010103469A1 (en) | 2009-03-12 | 2010-09-16 | Koninklijke Philips Electronics, N.V. | Sonolysis of blood clots using low power, coded excitation pulses |
| EP2644099A1 (en) * | 2012-03-28 | 2013-10-02 | Samsung Medison Co., Ltd. | Ultrasound system and method of obtaining ultrasound image |
| JP2016503707A (en) * | 2013-01-17 | 2016-02-08 | コーニンクレッカ フィリップス エヌ ヴェKoninklijke Philips N.V. | How to reduce the effects of exercise |
| US9483821B2 (en) | 2014-01-28 | 2016-11-01 | Samsung Medison Co., Ltd. | Method and ultrasound apparatus for displaying ultrasound image corresponding to region of interest |
| WO2018109652A1 (en) * | 2016-12-16 | 2018-06-21 | Koninklijke Philips N.V. | Adaptive pulsing for sonothrombolysis treatment |
| US10092195B2 (en) | 2006-08-17 | 2018-10-09 | Jan Medical, Inc. | Noninvasive detection of human brain conditions and anomalies |
| US10307065B1 (en) | 2014-12-09 | 2019-06-04 | Jan Medical, Inc. | Non-invasive detection of cerebral vasospasm |
| US11950958B2 (en) | 2022-01-14 | 2024-04-09 | Koninklijke Philips N.V. | Adaptive pulsing for sonothrombolysis treatment |
Families Citing this family (32)
| Publication number | Priority date | Publication date | Assignee | Title |
|---|---|---|---|---|
| US6210332B1 (en) * | 1998-03-31 | 2001-04-03 | General Electric Company | Method and apparatus for flow imaging using coded excitation |
| US6102858A (en) * | 1998-04-23 | 2000-08-15 | General Electric Company | Method and apparatus for three-dimensional ultrasound imaging using contrast agents and harmonic echoes |
| JP4260920B2 (en) * | 1998-05-13 | 2009-04-30 | 株式会社東芝 | Ultrasonic diagnostic equipment |
| US6352509B1 (en) * | 1998-11-16 | 2002-03-05 | Kabushiki Kaisha Toshiba | Three-dimensional ultrasonic diagnosis apparatus |
| JP4408988B2 (en) * | 1999-05-31 | 2010-02-03 | 株式会社東芝 | Ultrasonic diagnostic equipment |
| US6139501A (en) * | 1999-06-08 | 2000-10-31 | Atl Ultrasound, Inc. | Coincident tissue and motion ultrasonic diagnostic imaging |
| US6896658B2 (en) * | 2001-10-20 | 2005-05-24 | Zonare Medical Systems, Inc. | Simultaneous multi-mode and multi-band ultrasonic imaging |
| JP2001061841A (en) * | 1999-08-30 | 2001-03-13 | Toshiba Corp | Ultrasonograph, and method of producing ultrasonic image |
| US6761691B2 (en) | 2000-07-21 | 2004-07-13 | Fuji Photo Film Co., Ltd. | Image forming method used in ultrasonic diagnosis, ultrasonic diagnostic apparatus, signal processing apparatus, and recording medium for recording signal processing program |
| JP4768914B2 (en) * | 2000-12-26 | 2011-09-07 | 株式会社東芝 | Ultrasonic diagnostic equipment |
| US6793626B2 (en) | 2001-01-17 | 2004-09-21 | Fuji Photo Film Co., Ltd. | Ultrasonic scatterer, ultrasonic imaging method and ultrasonic imaging apparatus |
| JP2002224108A (en) * | 2001-01-31 | 2002-08-13 | Ge Medical Systems Global Technology Co Llc | Ultrasonic photographing device |
| JP4157688B2 (en) * | 2001-09-20 | 2008-10-01 | 株式会社日立メディコ | Ultrasonic diagnostic equipment |
| JP2003093389A (en) * | 2001-09-27 | 2003-04-02 | Hitachi Medical Corp | Ultrasonograph |
| DE602004011478T2 (en) * | 2003-02-05 | 2009-01-15 | Koninklijke Philips Electronics N.V. | DISPLAY THE ACCURACY OF A QUANTITATIVE ANALYSIS |
| JP4373699B2 (en) | 2003-04-28 | 2009-11-25 | 株式会社東芝 | Ultrasonic diagnostic equipment |
| JP4607528B2 (en) | 2004-09-24 | 2011-01-05 | 株式会社東芝 | Ultrasonic diagnostic apparatus and image data generation method |
| US9451932B2 (en) | 2004-12-30 | 2016-09-27 | Crystalview Medical Imaging Limited | Clutter suppression in ultrasonic imaging systems |
| WO2006070362A2 (en) | 2004-12-30 | 2006-07-06 | Gil Zwirn | Clutter suppression in ultrasonic imaging systems |
| JP4599208B2 (en) * | 2005-03-31 | 2010-12-15 | 株式会社東芝 | Ultrasonic diagnostic equipment |
| JP5091617B2 (en) * | 2007-10-23 | 2012-12-05 | 株式会社東芝 | Ultrasonic diagnostic apparatus and ultrasonic diagnostic apparatus control program |
| WO2010032500A1 (en) * | 2008-09-18 | 2010-03-25 | コニカミノルタエムジー株式会社 | Ultrasonic diagnosing device |
| JP4945605B2 (en) * | 2009-07-21 | 2012-06-06 | 株式会社東芝 | Ultrasonic diagnostic equipment |
| JP5489154B2 (en) * | 2009-09-25 | 2014-05-14 | ジーイー・メディカル・システムズ・グローバル・テクノロジー・カンパニー・エルエルシー | Ultrasonic diagnostic apparatus and control program therefor |
| US9808222B2 (en) | 2009-10-12 | 2017-11-07 | Acist Medical Systems, Inc. | Intravascular ultrasound system for co-registered imaging |
| WO2013098732A1 (en) * | 2011-12-29 | 2013-07-04 | Koninklijke Philips Electronics N.V. | Apparatus and method for ultrasound monitoring of ablation by a combination of the breaking down of air bubbles and imaging sequences |
| EP2784748B1 (en) * | 2013-03-28 | 2017-11-01 | Expert Ymaging, SL | A computer implemented method for assessing vascular networks from medical images and uses thereof |
| US10653393B2 (en) | 2015-10-08 | 2020-05-19 | Acist Medical Systems, Inc. | Intravascular ultrasound imaging with frequency selective imaging methods and systems |
| US11369337B2 (en) | 2015-12-11 | 2022-06-28 | Acist Medical Systems, Inc. | Detection of disturbed blood flow |
| US10275881B2 (en) | 2015-12-31 | 2019-04-30 | Val-Chum, Limited Partnership | Semi-automated image segmentation system and method |
| WO2017200899A1 (en) | 2016-05-16 | 2017-11-23 | Acist Medical Systems, Inc. | Motion-based image segmentation systems and methods |
| US11024034B2 (en) | 2019-07-02 | 2021-06-01 | Acist Medical Systems, Inc. | Image segmentation confidence determination |
Citations (7)
| Publication number | Priority date | Publication date | Assignee | Title |
|---|---|---|---|---|
| EP0072330A2 (en) * | 1981-08-08 | 1983-02-16 | Fujitsu Limited | Pressure measuring system with ultrasonic wave |
| DE3839649A1 (en) * | 1987-11-24 | 1989-07-13 | Hitachi Ltd | DEVICE FOR MEASURING AND MEDICAL TREATMENT WITH ULTRASOUND |
| WO1991015999A1 (en) * | 1990-04-26 | 1991-10-31 | The Victoria University Of Manchester | Ultrasound imaging technique using non linear scattering from bubbles |
| US5135000A (en) * | 1990-09-19 | 1992-08-04 | Raizot University Authority For Applied Research & Industrial Development Ltd. | Method of measuring regional tissue blood flow |
| WO1993012720A1 (en) * | 1991-12-30 | 1993-07-08 | Sound Science Limited Partnership | Ultrasound contrast agent examination of tissue perfusion |
| US5456257A (en) * | 1994-11-23 | 1995-10-10 | Advanced Technology Laboratories, Inc. | Ultrasonic detection of contrast agents |
| US5474073A (en) * | 1994-11-22 | 1995-12-12 | Advanced Technology Laboratories, Inc. | Ultrasonic diagnostic scanning for three dimensional display |
Family Cites Families (4)
| Publication number | Priority date | Publication date | Assignee | Title |
|---|---|---|---|---|
| US4689986A (en) * | 1985-03-13 | 1987-09-01 | The University Of Michigan | Variable frequency gas-bubble-manipulating apparatus and method |
| DE3829999A1 (en) * | 1988-09-01 | 1990-03-15 | Schering Ag | ULTRASONIC METHOD AND CIRCUITS THEREOF |
| US5928152A (en) * | 1994-08-05 | 1999-07-27 | Acuson Corporation | Method and apparatus for a baseband processor of a receive beamformer system |
| US5560364A (en) | 1995-05-12 | 1996-10-01 | The Board Of Regents Of The University Of Nebraska | Suspended ultra-sound induced microbubble cavitation imaging |
-
1996
- 1996-10-09 EP EP96307359A patent/EP0770352B1/en not_active Expired - Lifetime
- 1996-10-09 EP EP03077615A patent/EP1374777A1/en not_active Ceased
- 1996-10-09 AT AT96307359T patent/ATE285711T1/en not_active IP Right Cessation
- 1996-10-09 DE DE69634112T patent/DE69634112T2/en not_active Expired - Lifetime
- 1996-10-09 ES ES96307359T patent/ES2235180T3/en not_active Expired - Lifetime
- 1996-10-11 JP JP28729196A patent/JP4159122B2/en not_active Expired - Lifetime
-
2007
- 2007-03-30 JP JP2007091745A patent/JP4351265B2/en not_active Expired - Lifetime
Patent Citations (7)
| Publication number | Priority date | Publication date | Assignee | Title |
|---|---|---|---|---|
| EP0072330A2 (en) * | 1981-08-08 | 1983-02-16 | Fujitsu Limited | Pressure measuring system with ultrasonic wave |
| DE3839649A1 (en) * | 1987-11-24 | 1989-07-13 | Hitachi Ltd | DEVICE FOR MEASURING AND MEDICAL TREATMENT WITH ULTRASOUND |
| WO1991015999A1 (en) * | 1990-04-26 | 1991-10-31 | The Victoria University Of Manchester | Ultrasound imaging technique using non linear scattering from bubbles |
| US5135000A (en) * | 1990-09-19 | 1992-08-04 | Raizot University Authority For Applied Research & Industrial Development Ltd. | Method of measuring regional tissue blood flow |
| WO1993012720A1 (en) * | 1991-12-30 | 1993-07-08 | Sound Science Limited Partnership | Ultrasound contrast agent examination of tissue perfusion |
| US5474073A (en) * | 1994-11-22 | 1995-12-12 | Advanced Technology Laboratories, Inc. | Ultrasonic diagnostic scanning for three dimensional display |
| US5456257A (en) * | 1994-11-23 | 1995-10-10 | Advanced Technology Laboratories, Inc. | Ultrasonic detection of contrast agents |
Cited By (110)
| Publication number | Priority date | Publication date | Assignee | Title |
|---|---|---|---|---|
| US7081092B2 (en) | 1994-09-28 | 2006-07-25 | Imcor Pharmaceutical Company | Methods and apparatus for monitoring and quantifying the movement of fluid |
| US5933389A (en) * | 1995-03-02 | 1999-08-03 | Acuson Corporation | Ultrasonic imaging system and method |
| US6222795B1 (en) | 1995-03-02 | 2001-04-24 | Acuson Corporation | Ultrasonic harmonic imaging system and method |
| US6122222A (en) * | 1995-03-02 | 2000-09-19 | Acuson Corporation | Ultrasonic transmit and receive system |
| US6104670A (en) * | 1995-03-02 | 2000-08-15 | Acuson Corporation | Ultrasonic harmonic imaging system and method |
| US6027448A (en) * | 1995-03-02 | 2000-02-22 | Acuson Corporation | Ultrasonic transducer and method for harmonic imaging |
| US6009046A (en) * | 1995-03-02 | 1999-12-28 | Acuson Corporation | Ultrasonic harmonic imaging system and method |
| US6005827A (en) * | 1995-03-02 | 1999-12-21 | Acuson Corporation | Ultrasonic harmonic imaging system and method |
| US5846202A (en) * | 1996-07-30 | 1998-12-08 | Acuson Corporation | Ultrasound method and system for imaging |
| US6206833B1 (en) | 1996-11-08 | 2001-03-27 | Research Corporation Technologiers, Inc. | Finite amplitude distortion-based inhomogeneous pulse echo ultrasonic imaging |
| US7004905B2 (en) | 1996-11-08 | 2006-02-28 | Research Corporation Technologies, Inc. | Finite amplitude distortion-based inhomogeneous pulse echo ultrasonic imaging |
| US7811233B2 (en) | 1996-11-08 | 2010-10-12 | Research Corporation Technologies, Inc. | Finite amplitude distortion-based inhomogeneous pulse echo ultrasonic imaging |
| US7513870B2 (en) | 1996-11-08 | 2009-04-07 | Research Corproation Technologies, Inc. | Finite amplitude distortion-based inhomogeneous pulse echo ultrasonic imaging |
| US7104956B1 (en) | 1996-11-08 | 2006-09-12 | Research Corporation Technologies, Inc. | Finite amplitude distortion-based inhomogeneous pulse echo ultrasonic imaging |
| US6030344A (en) * | 1996-12-04 | 2000-02-29 | Acuson Corporation | Methods and apparatus for ultrasound image quantification |
| US6626831B2 (en) | 1997-04-11 | 2003-09-30 | Acuson Corporation | Gated ultrasound imaging apparatus and method |
| US6110120A (en) * | 1997-04-11 | 2000-08-29 | Acuson Corporation | Gated ultrasound imaging apparatus and method |
| US5882306A (en) * | 1997-04-11 | 1999-03-16 | Acuson Corporation | Ultrasound imaging methods and systems |
| US6306095B1 (en) | 1997-04-11 | 2001-10-23 | Acuson Corporation | Gated ultrasound imaging apparatus and method |
| US5961460A (en) * | 1997-04-11 | 1999-10-05 | Acuson Corporation | Ultrasound imaging enhancement methods and systems |
| WO1998046139A1 (en) * | 1997-04-11 | 1998-10-22 | Acuson Corporation | Ultrasound imaging enhancement methods and systems |
| US5957845A (en) * | 1997-04-11 | 1999-09-28 | Acuson Corporation | Gated ultrasound imaging apparatus and method |
| US6315730B1 (en) | 1997-04-24 | 2001-11-13 | Nyomed Imaging As | Ultrasound imaging of tissue perfusion by pulse energy disruption of contrast agent |
| WO1998047533A1 (en) * | 1997-04-24 | 1998-10-29 | Nycomed Imaging A.S. | Ultrasound imaging of tissue perfusion by pulse energy disruption of contrast agent |
| WO1998053855A1 (en) * | 1997-05-30 | 1998-12-03 | Alliance Pharmaceutical Corp. | Methods and apparatus for monitoring and quantifying the movement of fluid |
| US6802813B2 (en) | 1997-05-30 | 2004-10-12 | Ernest G. Schutt | Methods and apparatus for monitoring and quantifying the movement of fluid |
| US6354997B1 (en) | 1997-06-17 | 2002-03-12 | Acuson Corporation | Method and apparatus for frequency control of an ultrasound system |
| US6050944A (en) * | 1997-06-17 | 2000-04-18 | Acuson Corporation | Method and apparatus for frequency control of an ultrasound system |
| US6039690A (en) * | 1997-06-17 | 2000-03-21 | Acuson Corporation | Method and apparatus for frequency control of an ultrasound system |
| EP0999788A1 (en) * | 1997-07-15 | 2000-05-17 | Acuson Corporation | Ultrasound imaging method and apparatus for generating pulse width modulated waveforms with reduced harmonic response |
| US6221018B1 (en) | 1997-07-15 | 2001-04-24 | Acuson Corporation | Medical ultrasonic diagnostic imaging method and apparatus |
| US5833614A (en) * | 1997-07-15 | 1998-11-10 | Acuson Corporation | Ultrasonic imaging method and apparatus for generating pulse width modulated waveforms with reduced harmonic response |
| US5913823A (en) * | 1997-07-15 | 1999-06-22 | Acuson Corporation | Ultrasound imaging method and system for transmit signal generation for an ultrasonic imaging system capable of harmonic imaging |
| US6193659B1 (en) | 1997-07-15 | 2001-02-27 | Acuson Corporation | Medical ultrasonic diagnostic imaging method and apparatus |
| WO1999003401A1 (en) * | 1997-07-15 | 1999-01-28 | Acuson Corporation | Ultrasound harmonic imaging transmission method and apparatus |
| EP0999788A4 (en) * | 1997-07-15 | 2000-07-26 | Acuson | Ultrasound imaging method and apparatus for generating pulse width modulated waveforms with reduced harmonic response |
| US6131458A (en) * | 1997-08-01 | 2000-10-17 | Acuson Corporation | Ultrasonic imaging aberration correction system and method |
| US6023977A (en) * | 1997-08-01 | 2000-02-15 | Acuson Corporation | Ultrasonic imaging aberration correction system and method |
| US6401539B1 (en) | 1997-08-01 | 2002-06-11 | Acuson Corporation | Ultrasonic imaging aberration correction system and method |
| US6223599B1 (en) | 1997-08-01 | 2001-05-01 | Acuson Corporation | Ultrasonic imaging aberration correction system and method |
| US6132374A (en) * | 1997-08-01 | 2000-10-17 | Acuson Corporation | Ultrasonic imaging method and system |
| US6905467B2 (en) | 1997-08-15 | 2005-06-14 | Acuson Corporation | Ultrasonic harmonic imaging system and method using waveform pre-distortion |
| US6312379B1 (en) | 1997-08-15 | 2001-11-06 | Acuson Corporation | Ultrasonic harmonic imaging system and method using waveform pre-distortion |
| US5947904A (en) * | 1997-08-21 | 1999-09-07 | Acuson Corporation | Ultrasonic method and system for imaging blood flow including disruption or activation of a contrast agent |
| US5944666A (en) * | 1997-08-21 | 1999-08-31 | Acuson Corporation | Ultrasonic method for imaging blood flow including disruption or activation of contrast agent |
| US6106465A (en) * | 1997-08-22 | 2000-08-22 | Acuson Corporation | Ultrasonic method and system for boundary detection of an object of interest in an ultrasound image |
| US5928151A (en) * | 1997-08-22 | 1999-07-27 | Acuson Corporation | Ultrasonic system and method for harmonic imaging in three dimensions |
| US6083168A (en) * | 1997-08-22 | 2000-07-04 | Acuson Corporation | Ultrasound imaging system and method for improving resolution and operation |
| US5924991A (en) * | 1997-08-22 | 1999-07-20 | Acuson Corporation | Ultrasonic system and method for harmonic imaging in three dimensions |
| US5873830A (en) * | 1997-08-22 | 1999-02-23 | Acuson Corporation | Ultrasound imaging system and method for improving resolution and operation |
| WO1999017808A1 (en) * | 1997-10-03 | 1999-04-15 | University Of Virginia | Ultrasound bubble recognition imaging |
| US5935069A (en) * | 1997-10-10 | 1999-08-10 | Acuson Corporation | Ultrasound system and method for variable transmission of ultrasonic signals |
| US5860931A (en) * | 1997-10-10 | 1999-01-19 | Acuson Corporation | Ultrasound method and system for measuring perfusion |
| US6679846B2 (en) | 1997-12-18 | 2004-01-20 | Acuson Corporation | Diagnostic ultrasound imaging method and system with improved frame rate |
| US5897500A (en) * | 1997-12-18 | 1999-04-27 | Acuson Corporation | Ultrasonic imaging system and method for displaying composite fundamental and harmonic images |
| US7540842B2 (en) | 1997-12-18 | 2009-06-02 | Siemens Medical Solutions Usa, Inc. | Diagnostic ultrasound imaging method and system with improved frame rate |
| US6193663B1 (en) | 1997-12-18 | 2001-02-27 | Acuson Corporation | Diagnostic ultrasound imaging method and system with improved frame rate |
| US5902242A (en) * | 1998-01-22 | 1999-05-11 | Acuson Corporation | System and method for forming a combined ultrasonic image |
| EP0948931A3 (en) * | 1998-03-31 | 2003-11-05 | General Electric Company | Ultrasound imaging using coded excitation on transmit and selective filtering on receive |
| EP0948931A2 (en) * | 1998-03-31 | 1999-10-13 | General Electric Company | Ultrasound imaging using coded excitation on transmit and selective filtering on receive |
| EP0947853A3 (en) * | 1998-03-31 | 2003-01-08 | General Electric Company | Method and apparatus for enhanced flow imaging in b-mode ultrasound |
| US6074348A (en) * | 1998-03-31 | 2000-06-13 | General Electric Company | Method and apparatus for enhanced flow imaging in B-mode ultrasound |
| EP0947853A2 (en) * | 1998-03-31 | 1999-10-06 | General Electric Company | Method and apparatus for enhanced flow imaging in b-mode ultrasound |
| US6186949B1 (en) | 1998-03-31 | 2001-02-13 | General Electric Company | Method and apparatus for three-dimensional flow imaging using coded excitation |
| US5902243A (en) * | 1998-04-15 | 1999-05-11 | Acuson Corporation | Ultrasonic imaging method with multiple pulse cancellation |
| WO1999053309A1 (en) * | 1998-04-15 | 1999-10-21 | Acuson Corporation | Ultrasonic imaging aberration correction system and method |
| US6116244A (en) * | 1998-06-02 | 2000-09-12 | Acuson Corporation | Ultrasonic system and method for three-dimensional imaging with opacity control |
| US5957852A (en) * | 1998-06-02 | 1999-09-28 | Acuson Corporation | Ultrasonic harmonic imaging system and method |
| US6755787B2 (en) | 1998-06-02 | 2004-06-29 | Acuson Corporation | Medical diagnostic ultrasound system and method for versatile processing |
| US6966894B1 (en) | 1998-08-28 | 2005-11-22 | Schering Aktiengesellschaft | Syringes and injectors incorporating mechanical fluid agitation devices |
| US6706020B1 (en) | 1998-08-28 | 2004-03-16 | Schering Aktiengesellschaft | Syringes and injectors incorporating magnetic fluid agitation devices |
| US6048316A (en) * | 1998-10-16 | 2000-04-11 | Acuson Corporation | Medical diagnostic ultrasonic imaging system and method for displaying composite fundamental and harmonic images |
| US5971928A (en) * | 1998-11-02 | 1999-10-26 | Acuson Corporation | Diagnostic medical ultrasonic system and method for image subtraction |
| US6174286B1 (en) | 1998-11-25 | 2001-01-16 | Acuson Corporation | Medical diagnostic ultrasound method and system for element switching |
| US6224556B1 (en) | 1998-11-25 | 2001-05-01 | Acuson Corporation | Diagnostic medical ultrasound system and method for using a sparse array |
| WO2000036980A1 (en) * | 1998-12-18 | 2000-06-29 | Koninklijke Philips Electronics N.V. | Ultrasonic diagnostic imaging systems with power modulation for contrast and harmonic imaging |
| US6234967B1 (en) | 1998-12-18 | 2001-05-22 | Atl Ultrasound | Ultrasonic diagnostic imaging systems with power modulation for contrast and harmonic imaging |
| WO2000042916A1 (en) * | 1999-01-21 | 2000-07-27 | Acuson Corporation | Method and apparatus for ultrasound contrast imaging |
| US6752762B1 (en) | 1999-01-21 | 2004-06-22 | Acuson Corporation | Method and apparatus for ultrasound contrast imaging |
| US7060049B2 (en) | 1999-03-12 | 2006-06-13 | Medrad, Inc. | Injection system having an agitation mechanism for circulating a fluid medium |
| US6575930B1 (en) | 1999-03-12 | 2003-06-10 | Medrad, Inc. | Agitation devices and dispensing systems incorporating such agitation devices |
| US7351221B2 (en) | 1999-03-12 | 2008-04-01 | Medrad, Inc. | Container for agitating and injecting a multi-component medium |
| WO2000053242A1 (en) * | 1999-03-12 | 2000-09-14 | Medrad, Inc. | Agitation devices and fluid dispensing systems incorporating such agitation devices for use in medical ultrasound imaging |
| WO2002056666A2 (en) * | 2001-01-19 | 2002-07-25 | Angelsen Bjoern A J | A method of detecting ultrasound contrast agent in soft tissue, and quantitating blood perfusion through regions of tissue |
| WO2002056666A3 (en) * | 2001-01-19 | 2003-02-27 | Bjoern A J Angelsen | A method of detecting ultrasound contrast agent in soft tissue, and quantitating blood perfusion through regions of tissue |
| US7198601B2 (en) | 2001-02-01 | 2007-04-03 | Hitachi Medical Corporation | Ultrasonic contrast medium imaging apparatus and method |
| EP1358849A1 (en) * | 2001-02-01 | 2003-11-05 | Hitachi Medical Corporation | Ultrasonic enhanced-contrast imager and its method |
| EP2305121A1 (en) * | 2001-02-01 | 2011-04-06 | Hitachi Medical Corporation | Ultrasonic enhanced-contrast imager |
| US7850612B2 (en) | 2001-02-01 | 2010-12-14 | Hitachi Medical Corporation | Ultrasonic enhanced-contrast imager and method |
| EP1358849A4 (en) * | 2001-02-01 | 2006-04-05 | Hitachi Medical Corp | Ultrasonic enhanced-contrast imager and its method |
| US7458935B2 (en) | 2001-08-14 | 2008-12-02 | Esaote, S.P.A. | Method and apparatus for transmitting ultrasound pulses and receiving echo signals at a harmonic of the transmission frequency |
| EP1293802A2 (en) | 2001-08-14 | 2003-03-19 | Esaote S.p.A. | Ultrasound system and method for receiving echo signals at a harmonic of the transmission frequency |
| EP1428475A4 (en) * | 2001-08-22 | 2009-08-19 | Toshiba Kk | Ultrasonograph |
| EP1428475A1 (en) * | 2001-08-22 | 2004-06-16 | Kabushiki Kaisha Toshiba | Ultrasonograph |
| WO2003071949A1 (en) * | 2002-02-28 | 2003-09-04 | Koninklijke Philips Electronics N.V. | Ultrasonic imaging to detect coronary artery stenosis at rest |
| US6730036B2 (en) | 2002-02-28 | 2004-05-04 | Koninklijke Philips Electronics, N.V. | Ultrasonic imaging to detect coronary artery stenosis at rest |
| EP1774361A2 (en) * | 2004-06-18 | 2007-04-18 | ANGELSEN, Bjorn A. J. | Ultrasonic contrast agent detection and imaging by low frequency manipulation of high frequency scattering properties |
| US10092195B2 (en) | 2006-08-17 | 2018-10-09 | Jan Medical, Inc. | Noninvasive detection of human brain conditions and anomalies |
| US8905932B2 (en) | 2006-08-17 | 2014-12-09 | Jan Medical Inc. | Non-invasive characterization of human vasculature |
| DE102006057211B3 (en) * | 2006-12-01 | 2008-03-27 | Kompetenzzentrum Medizintechnik Ruhr (Kmr) E.V. | Object e.g. biological tissue, infusion measuring method, involves determining re-enrichment conditions in time period, in which no tomogram series is received, by mathematical approximation technique |
| WO2009025769A1 (en) * | 2007-08-17 | 2009-02-26 | Jan Medical, Inc. | Non-invasive characterization of human vasculature |
| WO2010103469A1 (en) | 2009-03-12 | 2010-09-16 | Koninklijke Philips Electronics, N.V. | Sonolysis of blood clots using low power, coded excitation pulses |
| EP2644099A1 (en) * | 2012-03-28 | 2013-10-02 | Samsung Medison Co., Ltd. | Ultrasound system and method of obtaining ultrasound image |
| US9192360B2 (en) | 2012-03-28 | 2015-11-24 | Samsung Medison Co., Ltd. | Ultrasound system and method of obtaining ultrasound image |
| JP2016503707A (en) * | 2013-01-17 | 2016-02-08 | コーニンクレッカ フィリップス エヌ ヴェKoninklijke Philips N.V. | How to reduce the effects of exercise |
| US9483821B2 (en) | 2014-01-28 | 2016-11-01 | Samsung Medison Co., Ltd. | Method and ultrasound apparatus for displaying ultrasound image corresponding to region of interest |
| US10307065B1 (en) | 2014-12-09 | 2019-06-04 | Jan Medical, Inc. | Non-invasive detection of cerebral vasospasm |
| WO2018109652A1 (en) * | 2016-12-16 | 2018-06-21 | Koninklijke Philips N.V. | Adaptive pulsing for sonothrombolysis treatment |
| US11259781B2 (en) | 2016-12-16 | 2022-03-01 | Koninklijke Philips N.V. | Adaptive pulsing for sonothrombolysis treatment |
| US11950958B2 (en) | 2022-01-14 | 2024-04-09 | Koninklijke Philips N.V. | Adaptive pulsing for sonothrombolysis treatment |
Also Published As
| Publication number | Publication date |
|---|---|
| JPH09164138A (en) | 1997-06-24 |
| JP4351265B2 (en) | 2009-10-28 |
| EP1374777A1 (en) | 2004-01-02 |
| ES2235180T3 (en) | 2005-07-01 |
| DE69634112T2 (en) | 2005-12-08 |
| DE69634112D1 (en) | 2005-02-03 |
| JP4159122B2 (en) | 2008-10-01 |
| JP2007175542A (en) | 2007-07-12 |
| ATE285711T1 (en) | 2005-01-15 |
| EP0770352B1 (en) | 2004-12-29 |
Similar Documents
| Publication | Publication Date | Title |
|---|---|---|
| EP0770352B1 (en) | Ultrasonic diagnostic imaging with contrast agents | |
| US5833613A (en) | Ultrasonic diagnostic imaging with contrast agents | |
| US6171246B1 (en) | Realtime ultrasonic imaging of perfusion using ultrasonic contrast agents | |
| US6645147B1 (en) | Diagnostic medical ultrasound image and system for contrast agent imaging | |
| US6692438B2 (en) | Ultrasonic imaging system and method for displaying tissue perfusion and other parameters varying with time | |
| US5951478A (en) | Two pulse technique for ultrasonic harmonic imaging | |
| EP1501419B1 (en) | Contrast-agent enhanced color-flow imaging | |
| JP3625305B2 (en) | Ultrasonic diagnostic equipment | |
| US5846202A (en) | Ultrasound method and system for imaging | |
| EP1517636B1 (en) | Contrast agent imaging with synchronized persistence | |
| EP0626822A1 (en) | Ultrasound contrast agent examination of tissue perfusion | |
| EP0135170A2 (en) | Apparatus for observing blood flow patterns | |
| US6174287B1 (en) | Medical diagnostic ultrasound system and method for continuous M-mode imaging and periodic imaging of contrast agents | |
| US6783496B2 (en) | Method and apparatus for improving contrast-to-tissue ratio in ultrasound contrast imaging with subharmonic imaging | |
| EP2575623A1 (en) | Ultrasonic visualization of percutaneous needles, intravascular catheters and other invasive devices | |
| Kirkhorn et al. | Three-stage approach to ultrasound contrast detection | |
| Bruce et al. | Pulse inversion Doppler for blood flow detection in the macro-and microcirculation |
Legal Events
| Date | Code | Title | Description |
|---|---|---|---|
| PUAI | Public reference made under article 153(3) epc to a published international application that has entered the european phase |
Free format text: ORIGINAL CODE: 0009012 |
|
| AK | Designated contracting states |
Kind code of ref document: A1 Designated state(s): AT BE CH DE DK ES FR GB GR IE IT LI LU MC NL PT SE |
|
| 17P | Request for examination filed |
Effective date: 19971009 |
|
| 17Q | First examination report despatched |
Effective date: 20020503 |
|
| GRAP | Despatch of communication of intention to grant a patent |
Free format text: ORIGINAL CODE: EPIDOSNIGR1 |
|
| GRAS | Grant fee paid |
Free format text: ORIGINAL CODE: EPIDOSNIGR3 |
|
| GRAA | (expected) grant |
Free format text: ORIGINAL CODE: 0009210 |
|
| AK | Designated contracting states |
Kind code of ref document: B1 Designated state(s): AT BE CH DE DK ES FR GB GR IE IT LI LU MC NL PT SE |
|
| PG25 | Lapsed in a contracting state [announced via postgrant information from national office to epo] |
Ref country code: NL Free format text: LAPSE BECAUSE OF FAILURE TO SUBMIT A TRANSLATION OF THE DESCRIPTION OR TO PAY THE FEE WITHIN THE PRESCRIBED TIME-LIMIT Effective date: 20041229 Ref country code: LI Free format text: LAPSE BECAUSE OF FAILURE TO SUBMIT A TRANSLATION OF THE DESCRIPTION OR TO PAY THE FEE WITHIN THE PRESCRIBED TIME-LIMIT Effective date: 20041229 Ref country code: CH Free format text: LAPSE BECAUSE OF FAILURE TO SUBMIT A TRANSLATION OF THE DESCRIPTION OR TO PAY THE FEE WITHIN THE PRESCRIBED TIME-LIMIT Effective date: 20041229 Ref country code: BE Free format text: LAPSE BECAUSE OF FAILURE TO SUBMIT A TRANSLATION OF THE DESCRIPTION OR TO PAY THE FEE WITHIN THE PRESCRIBED TIME-LIMIT Effective date: 20041229 Ref country code: AT Free format text: LAPSE BECAUSE OF FAILURE TO SUBMIT A TRANSLATION OF THE DESCRIPTION OR TO PAY THE FEE WITHIN THE PRESCRIBED TIME-LIMIT Effective date: 20041229 |
|
| REG | Reference to a national code |
Ref country code: GB Ref legal event code: FG4D |
|
| RIN1 | Information on inventor provided before grant (corrected) |
Inventor name: HWANG, JUIN-JET Inventor name: AVERKIOU, MICHALAKIS Inventor name: BRUCE, MATTHEW Inventor name: POWERS, JEFFRY EARL |
|
| REG | Reference to a national code |
Ref country code: CH Ref legal event code: EP |
|
| REG | Reference to a national code |
Ref country code: IE Ref legal event code: FG4D |
|
| REF | Corresponds to: |
Ref document number: 69634112 Country of ref document: DE Date of ref document: 20050203 Kind code of ref document: P |
|
| PG25 | Lapsed in a contracting state [announced via postgrant information from national office to epo] |
Ref country code: SE Free format text: LAPSE BECAUSE OF FAILURE TO SUBMIT A TRANSLATION OF THE DESCRIPTION OR TO PAY THE FEE WITHIN THE PRESCRIBED TIME-LIMIT Effective date: 20050329 Ref country code: GR Free format text: LAPSE BECAUSE OF FAILURE TO SUBMIT A TRANSLATION OF THE DESCRIPTION OR TO PAY THE FEE WITHIN THE PRESCRIBED TIME-LIMIT Effective date: 20050329 Ref country code: DK Free format text: LAPSE BECAUSE OF FAILURE TO SUBMIT A TRANSLATION OF THE DESCRIPTION OR TO PAY THE FEE WITHIN THE PRESCRIBED TIME-LIMIT Effective date: 20050329 |
|
| NLV1 | Nl: lapsed or annulled due to failure to fulfill the requirements of art. 29p and 29m of the patents act | ||
| REG | Reference to a national code |
Ref country code: ES Ref legal event code: FG2A Ref document number: 2235180 Country of ref document: ES Kind code of ref document: T3 |
|
| REG | Reference to a national code |
Ref country code: CH Ref legal event code: PL |
|
| PG25 | Lapsed in a contracting state [announced via postgrant information from national office to epo] |
Ref country code: IE Free format text: LAPSE BECAUSE OF NON-PAYMENT OF DUE FEES Effective date: 20051010 |
|
| PG25 | Lapsed in a contracting state [announced via postgrant information from national office to epo] |
Ref country code: MC Free format text: LAPSE BECAUSE OF NON-PAYMENT OF DUE FEES Effective date: 20051031 Ref country code: LU Free format text: LAPSE BECAUSE OF NON-PAYMENT OF DUE FEES Effective date: 20051031 |
|
| PLBE | No opposition filed within time limit |
Free format text: ORIGINAL CODE: 0009261 |
|
| STAA | Information on the status of an ep patent application or granted ep patent |
Free format text: STATUS: NO OPPOSITION FILED WITHIN TIME LIMIT |
|
| 26N | No opposition filed |
Effective date: 20050930 |
|
| ET | Fr: translation filed | ||
| REG | Reference to a national code |
Ref country code: IE Ref legal event code: MM4A |
|
| PG25 | Lapsed in a contracting state [announced via postgrant information from national office to epo] |
Ref country code: PT Free format text: LAPSE BECAUSE OF NON-PAYMENT OF DUE FEES Effective date: 20050529 |
|
| PGFP | Annual fee paid to national office [announced via postgrant information from national office to epo] |
Ref country code: IT Payment date: 20070925 Year of fee payment: 12 Ref country code: ES Payment date: 20071008 Year of fee payment: 12 |
|
| PG25 | Lapsed in a contracting state [announced via postgrant information from national office to epo] |
Ref country code: IT Free format text: LAPSE BECAUSE OF NON-PAYMENT OF DUE FEES Effective date: 20081009 |
|
| REG | Reference to a national code |
Ref country code: ES Ref legal event code: FD2A Effective date: 20081010 |
|
| PG25 | Lapsed in a contracting state [announced via postgrant information from national office to epo] |
Ref country code: ES Free format text: LAPSE BECAUSE OF NON-PAYMENT OF DUE FEES Effective date: 20081010 |
|
| REG | Reference to a national code |
Ref country code: FR Ref legal event code: PLFP Year of fee payment: 20 |
|
| PGFP | Annual fee paid to national office [announced via postgrant information from national office to epo] |
Ref country code: GB Payment date: 20151030 Year of fee payment: 20 |
|
| PGFP | Annual fee paid to national office [announced via postgrant information from national office to epo] |
Ref country code: FR Payment date: 20151030 Year of fee payment: 20 |
|
| PGFP | Annual fee paid to national office [announced via postgrant information from national office to epo] |
Ref country code: DE Payment date: 20151230 Year of fee payment: 20 |
|
| REG | Reference to a national code |
Ref country code: DE Ref legal event code: R071 Ref document number: 69634112 Country of ref document: DE |
|
| REG | Reference to a national code |
Ref country code: GB Ref legal event code: PE20 Expiry date: 20161008 |
|
| PG25 | Lapsed in a contracting state [announced via postgrant information from national office to epo] |
Ref country code: GB Free format text: LAPSE BECAUSE OF EXPIRATION OF PROTECTION Effective date: 20161008 |