CROSS-REFERENCE TO RELATED APPLICATIONS
Not applicable.
STATEMENT REGARDING FEDERALLY SPONSORED RESEARCH
OR DEVELOPMENT
Not applicable.
BACKGROUND OF THE INVENTION
This invention relates to mass rate of measurement fluid flowmeters and flow controllers,
and more particularly, to an analog or digital flowmeter employed in manufacturing processes such
as the manufacture of semiconductor chips in which highly toxic and highly reactive fluids are
used, and because of which, such flowmeters are not calibrated using the fluid they will be
controlling during a process.
In the manufacture of semiconductors, integrated circuit (IC) chips and the like, it is
necessary to use a variety of fluids (gases) which are highly toxic and/or reactive. A reactive fluid
is a gas which is corrosive, flammable, or pyrophoric, among other things. Proper control of these
fluids, for example, dichlorosilane (SiH2Cl2), is therefore mandatory. The same is true in other
manufacturing processes as well; although these will not be discussed. Process control in the
critical process steps where these fluids are used is accomplished by monitoring the mass flow rate
of the gas and controlling appropriate valving to adjust the flow to a desired rate for the process
condition. Measuring mass flow rates is old in the art. Essentially it is done using either an analog
measuring system, or a digital based system. Regardless of which technique is used, there has
been, and until now, continues to be, substantial control problems which must be overcome in order
to maintain a process capable of producing quality chips.
There are a number of problems which currently effect flowmeter calibration and
performance. While these are discussed in more detail below, these problems are:
Because of thermal transport properties in gases such as those used in semiconductor
manufacture, for example, the accuracy of current mass flow controllers (whether analog or digital)
cannot be guaranteed to a level desirable both by the instrument maker and the end user. Ideally,
flow controllers would be tested with the actual gases they control in a process so as to properly
calibrate their performance for actual use. However, process capable calibration data generally
currently does not exist because the toxic and corrosive nature of certain of these gases require
special facilities be used to obtain the necessary information. To perform an instrument calibration
in a facility which may be suitable for use with a toxic or reactive fluid is currently very expensive.
This is particularly so where a controller may be used with one of many such gases and the
controller must be calibrated for use with each. Contracting out instrument calibration an available
facility is also expensive. It is not unusual for a calibration to cost well over a thousand dollars per
instrument. This procedure is simply not cost efficient. Rather, current practice is to calibrate the
instrument with an inert gas such as nitrogen (N2) rather than any of the gases with which the
controller will be used. The output of the instrument is then scaled using a conversion factor to
estimate the performance of the instrument with the process gas. Or, the instrument can be
calibrated using a "surrogate" gas. A surrogate gas is one which has specific heat properties which
are substantially close to a process gas with which the controller is used. Using a surrogate gas
reduces the magnitude of the conversion factor required to adapt the instrument's performance to
the process gas.
Another problem involved with instrument calibration does not involve either the gases
with which the controller will be used or the calibration facilities. Rather it involves certain
calibration fluids currently used and the residual effects such gases may have on the instrument.
For example, if a calibration is performed with a gas such as chlorine, unless subsequent purging of
the instrument effectively removes all traces of the gas, future exposure of the instrument to
moisture, as when the instrument is exposed to air, will result in hydrochloric acid (HCl) being
formed. Damage to the instrument caused by the acid will ruin the instrument, requiring a costly
replacement.
Yet another problem is simply that some gases are expensive to use and calibrating a
flowmeter with such gases is cost prohibitive.
The result of all of this is that process engineers responsible for controlling a manufacturing
process and for using mass flow controllers, have devised various techniques to insure the accuracy
of the instruments they employ. Each mass flow controller is delivered to its end user with a
complete set of calibration data, this data being based upon the inert gas with which the calibration
was performed. This data is expressed, for example, as a curve of flow versus set point, and the
curve covers the entire operating range of the instrument. The process engineer, using his
knowledge of the process and the behavior of the gas used in the process, is able to adapt the
calibration curve for the inert gas to the actual process gas using his prior experience. He may
employ a "black book" or the like containing conversion factors he will use to interpret instrument
readings for the process gas and meter fluid flow accordingly. This "tweaking" however. comes at
a price. Certain processes, such as the manufacture of semiconductor devices, require very precise
process control. If inaccuracies in instrumentation occur, useless product results. It will be
understood for example, that a conversion factor typically is accurate only at a single point, and the
further readings are away from that point, the greater the divergence from a "true" value and the
converter reading. Trial and error experimentation to determine what the adjustment factors for a
particular instrument should be can cause delays and also result in lost production, increased down
times, increased product costs, etc. Alleviation of problems concerning instrument calibration can
have an immediate beneficial impact on many industries.
Another area of concern is the error that arises because of the communications involved in
signal handling and processing. All controllers, whether analog or digital controllers, use analog
signals at one point or another throughout the processing and control functions performed by a
controller. A control system may include a central control computer which commands analog
input/output (L/O) cards of a process controller. The I/O card converts digital signals from the
computer to analog set point signals, and analog flow information signals to digital signals supplied
to the computer. The system includes the following sources of potential signal error: wire and
connector losses, noise pick-up, and analog-to-digital and digital-to-analog conversion errors. Use
of completely digital communications between a central computer and mass flow controllers will
eliminate various system errors.
BRIEF SUMMARY OF THE INVENTION
Among the several objects of the present invention may be noted the provision of improved
flowmeters and mass flow controllers having significantly greater accuracy than either existing
digital or analog flowmeters and mass flow controllers. The improvement in digital mass flow
controller accuracy, for example, is partially the result of improved signal processing techniques,
and partially a result of improved digital communications within the controller. Further,
flowmeters and flow controllers can now be individually customized for the process gases with
which they are used.
An important object of the present invention is the improvement in measurement accuracy
which result from the flowmeter's or flow controller's calibration for a customer's process gas or
gases. The calibration process now eliminates the need for "tweaking" by the user's technical
personnel and the "cut and try" techniques previously used by such personnel to accommodate a
calibrated flowmeter or flow controller to the particular process. The attendant costs and wastes
arising from these techniques are now also eliminated, and process development time is shortened
since these steps need no longer be performed.
Another important object of the invention is the capability of the improved flowmeter or
flow controller to be used in a variety of processes in which highly toxic, highly corrosive, or
expensive gases, or some combination thereof are normally used. Even though flowmeter or flow
controller calibration is performed on "safe" gases, the calibration is now such that the
thermodynamic transport properties of such gases are taken into account as part of the calibration
process.
A further object of the invention is the provision of an improved flowmeter or flow
controller in which either is independently calibrated for a number of gases with which they are
used and the calibration information for each gas is stored within the instrument and is readily
accessible by a user. The personnel using the controller now no longer need to maintain separate
"little black books" containing relevant information necessary to adjust the instrument's operation,
depending upon the gas currently being used in a process.
An additional object of the invention is the creation and usage of a database which contains
information relating performance of a flowmeter or flow controller with a gas used in a process as
well as that of the instrument with a calibration gas or gases. The database enables the instrument
to be readily used with process gases over the entire operating range of the instrument; that is, the
instrument is readily used with any of the number of gases for which the instrument is calibrated,
and for the entire range of flow rates of these gases in a particular process.
A further object of the invention is to provide a flowmeter or mass flow controller having
the capability to remotely zero the flow sensor used with the instrument. Other instrument
capabilitier include a digitally adjustable setpoint and ramprate, and temperature monitoring for
indicating the temperature outside the instrument's flow rate sensor. Also, direct indications can be
provided of a sensor's raw output signals and a valve drive signal from the instrument so clogging
or restriction of the sensor can be detected. Where a number of instruments are used in a process,
the instruments can be interconnected so, for example, their setpoints can be simultaneously
adjusted.
It is also a provision of the improved processor of the flowmeter or flow controller to have
sufficient data storage capability so all relevant information relating to a calibration is stored in the
instrument and is readily accessible by the user. This enables a relationship between data collected
for process gas and representative instrument calibration curves using a calibration gas (N2 for
example) to be derived. From their relationship a calibration curve for the process gas can be
determined and stored in the instrument, or in an external database accessible by the instrument so
this process gas calibration curve can be used during the process.
A further object of the invention is to provide an instrument having stored data sets for
various system operating pressures. The controller of the instrument is responsive to a pressure
sensor reading or pressure input information from a process control to interpolate between data sets
where the sensed pressure is intermediate the pressure values for which the data sets were produced.
Yet another object of the invention is the establishment of a system of fluid flowmeters or
flow controllers each of which independently functions within some part of a manufacturing
process. The system includes a communications network by which each flowmeter or flow
controller can separately, quickly access a database containing relevant information for use by the
instrument. This enables each instrument to have the information readily available by which the
instrument can readily and precisely monitor and/or control the fluid flow portion of the process
with which it is associated.
Finally, it is a particular object of the invention to provide a flowmeter and mass flow
controller which can be calibrated quickly, efficiently, and at a reasonable cost, yet provide the
necessary precision required when used in a manufacturing process. Further, it is also an object to
reduce the complexity of the monitoring and control system in which the instrument is used. This
is achieved by an improved communications system that minimizes wiring. In so doing, the overall
reliability of the monitoring and control system is significantly enhanced, resulting in substantial
savings in process costs for the manufacture of semiconductor devices, for example.
In accordance with the invention, generally stated, a flowmeter or mass flow controller is
used in a manufacturing process such as for the manufacture of semiconductor chips. The
flowmeter or mass flow controller meters, or meters and controls the flow of one of a variety of
fluids used in the process, and a number of meters and/or controllers may be used with the same or
different fluids. The process fluid is used in the process under a variety of temperature and pressure
conditions. And, the fluids may be toxic, corrosive, or otherwise reactive. The mass flow meter
comprises a fluid flow sensor for sensing fluid flow through a passage by which the fluid is directed
to a portion of the process where it is used. The flow meter provides an output signal to the user
that accurately represents the flow passing through the instrument at a given time. To do this, the
instrument includes a processor which accesses stored calibration information derived for one or
more process fluids the mass flowmeter measures and covers the operating range of the instrument.
The signal from the flow sensor is processed by the instrument's processor using the calibration
curve, temperature and pressure information to give an accurate indication of the flow rate.
The mass flow controller comprises the same sensing and signal processing elements as the
mass flowmeter with the addition of a valve drive that operates a fluid flow valve to control the
mass flow rate of fluid into the process and a control unit. A set point is established by an external
input supplied by the user to establish a desired flow rate for a process fluid. The control unit of the
instrument operates the valve drive. To do this, the control unit includes a processor which
accesses stored calibration information derived for one or more process fluids the mass flow
controller controls and which covers the operating range of the instrument. From this calibration
curve the fluid flow rate for the process fluid to be delivered by the valve is determined. The
calibration information stored in the instrument is derived from calibration data for a calibration
fluid which is not the process fluid whose flow is now being controlled, but which has similar
thermodynamic transport properties. The calibration information is stored in a data base and the
instrument's calibration is established for a particular process fluid by adapting the instrument's
calibration curve for a calibration gas at certain set point conditions over the operating range of the
instrument using the process fluid data stored in the data base. As a consequence, even though the
instrument is calibrated with an inert gas, for example, the instrument can now accurately meter
mass flow of a process fluid it is monitoring without external involvement. This, even though the
process fluid is a toxic, reactive fluid. A system of process control employing multiple mass
flowmeters and/or mass flow controllers in which set point information is supplied to each
instrument, and a method of calibrating a flowmeter or mass flow controller with an inert fluid and
adapting the resulting calibration curve so the instrument can be used for toxic, reactive process
fluids are also disclosed. Other objects and features will be in part apparent and in part pointed out
hereinafter.
BRIEF DESCRIPTION OF THE SEVERAL VIEWS OF THE DRAWINGS
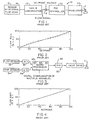
Fig. 1 is a block diagram representation of a prior art analog device for use
in mass flow control; Fig. 2 represents a characteristic flow curve for the analog mass flow controller; Fig. 3 is a block diagram representation of a prior art digital device for use in mass flow
control; Fig. 4 represents a characteristic flow curve for the digital mass flow controller; Fig. 5 is a block diagram representation of a digital mass flow controller of the present
invention used in a system of mass flow controllers for controlling process fluids at different
locations in a manufacturing process; Fig. 6 is a flow chart illustrating the creation and use of a process fluid data base for
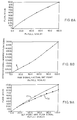
calibration of mass flow controllers; Fig. 7 is a flow chart illustrating how a data base for a particular process fluid is created; Figs. 8A and 8B are calibration curves illustrating a linearization method for calibrating a
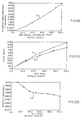
digital mass flow meter; Figs. 9A and 9B are similar calibration curves to those in Figs. 8A and 8B but reflect the
calibration method of the present invention; Figs. 10A and 10B are curves illustrating data set generation for use in calibrating digital
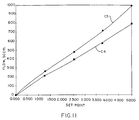
flowmeters in accordance with the present invention; and, Fig. 11 is a curve or data set generation for use in calibrating an analog flowmeter.
Corresponding reference characters indicate corresponding parts throughout the drawings.
DETAILED DESCRIPTION OF THE INVENTION
Referring to the drawings, Fig. 1 represents a prior art analog mass flow controller (MFC)
10. In an analog MFC, the functional components of the controller are implemented using
resistors, potentiometers, capacitors, amplifiers, etc. In this device, a flow rate sensor 12 is a
thermal sensor which, as is well-known in the art, converts the flow rate of a gas into an electrical
voltage signal. In a flow controller manufactured by the assignee of the present application, the
amplitude of this signal is a function of the thermal gradient (temperature difference) between an
upstream and downstream monitoring location, and hence measured flow rate. A thermistor 14 is
connected in series with windings (not shown) of the sensor to provide compensation for shifts in
the sensor calibration resulting from temperature effects on a measurement. Use of the thermistor
typically provides a linear or first order compensation. The full scale output voltage of sensor 12 is
on the order of 50 mVDC.
The sensor output is provided to a gain and linearization module 16 in which the analog
output signal from the sensor is amplified, linearized, and then supplied to a junction point 18.
Module 16 employs feedback to produce a linear output to the summing point and controller,
filtering to eliminate noise effects on the output signal, and adjustable components potentiometers)
for controller calibration. The output signal from module 16 is, for example, variable from 0-5VDC,
and a setpoint input to the controller also varies between 0-5VDC. These signals are
summed at junction point 18 and their difference is provided to a controller 20 which uses the
difference value to determine the position of a fluid flow control valve V. The valve position is
controlled by a valve drive 22 to which outputs from controller module 20 are provided. The
controller module takes into account factors such as the established operating setpoint, and
overshoot, undershoot, and steady-state operating conditions to determine the valve V position.
Calibration of analog device 10 is performed by determining and adjusting the flow of a
calibration fluid at three points within the metering range of the instrument. These points reflect
0%, 50%, and 100% of the instrument's scale range. Based upon the instrument's performance, the
potentiometers within module 16 are adjusted so the resulting calibration curve is essentially as
represented by the dashed line in Fig. 2. That is, they are adjusted to control the instrument's zero,
span, and linearity. As can be seen in the Fig., the ideal curve is a straight line (the solid line)
extending between the 0.0 and 100.100 co-ordinates on the curve. However, the calibration curve
may have a positive or negative offset at the respective ends of the curve; i.e., at the higher and
lower flow rates. It will be understood that the dashed line representation in the Fig. is exaggerated
for purposes of understanding the performance capabilities of the instrument. The actual worst case
error of a calibrated instrument is on the order of ±1% full scale.
Referring to Fig. 3, a prior art digital mass rate flow controller 30 includes a flow sensor 32
and a temperature sensor 34. Here, an analog output signal from each sensor is separately provided
to an analog-to-digital converter (ADC) 36, 38 respectively. ADC 36 is, for example, a twenty-four
bit converter, as is ADC 38. The digital output from each converter is applied as a separate
mathematical input to a microprocessor 40. Microprocessor 40 incorporates three elements. First
is a microcontroller 42, second is a 64K by 8 erasable programmable read-only-memory, or
EPROM 44, and third is a 4K by 8 EEPROM 46. Operating software for running controller 30 is
stored in EPROM 44, and product information and calibration tables are stored in EEPROM 46.
The software implemented in the microprocessor performs the linearization and filtering functions
performed in module 16 of the analog controller 10, as well as the controller 20 functions of the
analog instrument. In addition, the microprocessor has enhanced performance capabilities in these
areas as well as the capability to provide performance outputs to the user on a timely basis.
The control output from the microprocessor is a digital signal supplied to a digital-to-analog
converter (DAC) 48 which produces an analog signal for valve drive 22 to open and close valve V.
For purposes of this application, it will be understood that the distinction between an analog
and a digital flowmeter is that in an analog unit, the basic signal conditioning and control functions
are performed using an operational amplifier (op-amp). In a digital unit, a microprocessor performs
these functions. It will further be understood that in a flowmetering system, a digital flowmeter, for
example, may be used with an analog communications system. Other variations are also possible
depending upon the user's system in which a flowmeter or flow controller is installed.
Calibration of a digital flow controller differs significantly from the calibration of an analog
flow controller. Now using variable digital values, a full scale flow rate having an accuracy on the
order of ±2% is produced. Next, the flow controller is operated at a number of different set points
(ten, for example) over the operating range of the instrument. Performance data is accumulated for
each set point. An equation is now generated using the resulting text data. The equation represents
the calibration curve for the instrument over the entire operating range of the instrument. Using the
equation, a table of calibration points (twenty-five, for example) is created and stored in memory 46
of the controller. A plot of the flow rate vs. set point curve is illustrated in Fig. 4. The values
displayed on the curve of Fig. 4 are corrected using temperature information from sensor 34. The
combination of the information from the curve, and the temperature correction, result in a worst
case flow rate error on the order of ±0.2% full scale. Memory 46 of controller 30 is capable of
storing multiple calibration curves so the controller can be separately calibrated for multiple gases
and multiple flow rates.
As previously mentioned, it has heretofore been impractical to always calibrate a controller
with the process gas with which the controller is used. Rather, an inert calibration gas, or a
surrogate gas having similar fluid thermodynamic properties to the process gas have been used for
calibration. The subsequent user of the controller then applies a conversion factor between
measured flow rate data, and the calibration curve data, to generate a desired flow rate value for a
particular set point. This conversion factor is based upon the relative thermodynamic properties of
the calibration fluid and a process fluid with which the controller is used. As noted, users of the
flow controller have separately determined a conversion factor for use with a particular process
fluid under given set point conditions. This leads to process inefficiencies, as well as errors in
performance.
Referring now to Fig. 5, a flowmeter of the present invention is indicated generally 100 and
a flow controller 101. The flowmeter or flow controller can be used individually; or, as shown in
Fig. 5, in a system having a plurality of other flowmeters and flow controllers indicated
MFC2..MFCn. When used in a system, respective flowmeters and flow controllers are in
communication with a process control 102 is used to monitor the process and to establish set point
conditions for each instrument. In Fig. 5, flowmeter 100, which is shown to be a digital flowmeter,
is connected to a fluid flow control portion of a process 104. The portion of the process with which
flowmeter 100 is associated includes a fluid flow passage 106, an inlet 108 to the passage, an outlet
110 from the passage, and a bypass 112 through which a portion of the process fluid flows. In
common parlance, bypass 112 is also referred to as a restrictor, flow shunt, or flow splitter. Fluid
flow through bypass 112 is monitored by a flow sensor 114 of the flowmeter, and by a temperature
sensor 116. A pressure sensor 117 may also be used by the instrument. The fluid flow information
gathered by sensor 114 is an analog signal output to an A/D converter 118. Similarly, the output of
temperature sensor 116 (or pressure sensor 117) is an analog output which is provided as an input
to an A/D converter 120. The digital signal outputs of the A/D converters are supplied to a
microprocessor 122 of the flowmeter. Stored within a memory portion of the microprocessor are a
series of data sets representing calibration curves developed for the instrument using data developed
specifically for the process fluids with which the flowmeter or flow controller is used and for
specific fluid pressure and fluid flow conditions. The microprocessor, utilizing the data set or fluid
calibration curve for established set point conditions for the process, and the process fluid flow
data, is now able to generate a fluid flow signal by which accurate flow rates are achieved. The
result is the production of a control signal for a valve drive 124 by which the valve drive can open
or close a flow control valve 126 and precisely control process fluid flow through the passage. The
control signal from microprocessor 122 is a digital signal supplied to a D/A converter 128 to
produce an analog signal used by valve drive 124.
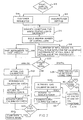
Referring to Figs. 6 and 7, the flow charts of the Figs. set forth how a determination is made
as whether or not a flowmeter 100 or mass flow controller 101 is to be used with a process fluid for
which flow control data exists, whether or not flow data for a particular process fluid is already
stored in a data base; and, if not, how flow control data for the process fluid is developed, stored in
the data base, and used to create a data set stored in a memory portion of microprocessor 122 of the
instrument. When an order for a flow controller is received as indicated at step S1, the order
typically includes a set of operating criteria in which the instrument will be used to control flow rate
of a process fluid. This criteria includes the process fluids with which the controller will be used, as
well as the flow range, and temperature and pressure conditions. A determination is therefore first
made as to whether flow control information for the fluid or fluids and the range of operating
conditions are currently in the data base. This is step S2 in Fig. 6. If so, the next determination is
whether the flowmeter or mass flow controller will be an analog or digital instrument. This occurs
at step S3.
If the instrument is an analog instrument, then the instrument is constructed and a
calibration is performed on the instrument using nitrogen gas, for example. This calibration is then
matched to a companion curve generated from the stored flow data for the process fluid. This is
step S4. At step S5, a quality control check is performed to verify that the companion curve does
match. If there is verification, then the instrument is shipped as indicated at step S6.
If the instrument is to be a digital flowmeter or mass flow controller, then at step S7, the
instrument is constructed and calibrated. Again, nitrogen gas is the calibration fluid. Now, a
scaling or conversion factor is used to determine full scale flow of nitrogen and a conversion factor
equation is developed based on the calibration results. Generation of the scaling factor is discussed
hereafter. The conversion factor equation is stored in the microprocessor memory of the
instrument. At step S8, the equation is used to produce a calibration for the instrument for the
process gas with which the controller is used, and the given set of operating conditions. Next, a
quality control check is made of the instrument. This is step S9. If successful, the digital mass
flow controller is shipped.
Returning to step S2, if there is currently no information in the data base for a particular
process fluid or set of operating conditions for a process fluid, then we proceed to step S10. At step
S10, it is determined if there is any flow data for a particular process fluid; and if so, what are the
"bounding" conditions for the data. That is, what are the temperature and pressure conditions for
which flow data was obtained, and how closely do these bounding conditions approximate those
under for which the instrument will be used with the fluid. If there is no relevant information, then
data base information will be developed at step S11 and as discussed with reference to Fig. 7. If
there is bounding information for the process gas as indicated at step S12, a conversion factor is
developed by which a companion curve can be generated for use in the instrument's calibration.
This is the conversion factor used at step S8 in the calibration of a digital mass flow controller.
Referring to Fig. 7, step S11 involves generation of process fluid information for inclusion
in a data base. The data is accumulated for a variety of process fluids for a range of operating
conditions. At step S13, the threshold question to be asked is what data to collect. There are two
sets of such data as indicated by steps S14 and S15. Step S14 is the information requested by the
customer for the process gases and sets of conditions under which the gas will be used. Step S14
includes the calibration information normally generated by the instrument manufacturer. That is,
the manufacturer will have a standard calibration procedure (or procedures) which is normally
performed on each instrument. From the information gathered at steps S14 and S15, an overall
calibration plan for the instrument is defined at step S16. This information now includes all of the
process fluids with which the instrument will possibly be used, full scale flow values, and the range
of temperature and pressure conditions for the various process fluids.
Next, the manufacturer builds a number of instruments as indicated at step S17. By
building a minimum number of instruments, statistical validity of the instruments' calibration can
be determined. As indicated at step S18, the instruments are then calibrated. Part of this procedure
includes ranging the full scale output for a calibration gas equivalent of the actual (process) gas for
given sets of conditions. That is, obtaining data for the defined range of conditions using a gas
having thermodynamic transport properties which closely match those of the process fluid. After
testing is complete, the instruments are transported (step S19) to a calibration installation which has
facilities to develop the flow data for the process fluids with which the instruments are used.
At the test facility, and as indicated at step S20, the instruments are separated into analog
and digital groupings. For an analog instrument, an actual gas calibration is performed using a
process fluid at each of a set of pressure and temperature conditions (i.e., P1-T1, P2-T2,...Pn-Tn).
This is step S21. At step S22, a calibration check procedure is performed using a calibration gas at
the same pressure conditions as the process gas and the calibration gas calibration data is compared
against that obtained for the process fluids. The instruments are then returned to the manufacturer
(step S23) where calibration tests are made at the various pressure conditions using the calibration
gas (step S24). The resulting calibration data is now checked (step S25) and if the results correlate
with those from the testing facility, the flow data for the process fluid for the given sets of
conditions are entered into a data base 200 established for this purpose. If the results do not
correlate, then the process set out in steps S20-S24 is repeated.
For a digital flowmeter, as indicated at step S26, data for the actual gas is collected at
specific set point (temperature and pressure) conditions. If additional testing is desired, in order to
obtain bounding conditions for performance predictions, then further actual gas testing is performed
for additional conditions (step S27). If no additional testing is done, then a calibration check
(similar to that performed at step S22 for analog controllers) is performed (step S29). Thereafter,
the instruments are returned to the manufacturer (step S30) for the manufacturer to perform a
calibration check at his facility (step S31). Again, if the calibrations check out, the data is
incorporated in data base 200. If not, steps S25-S31 are repeated.
It will be understood that now, unlike with previous instruments and calibration systems,
one or more data sets can be created for each flowmeter or mass flow controller, not only for each
process fluid with which the instrument is used, but for the range of flow conditions which will be
experienced in carrying out the process with which the fluid is used. These data sets are
represented by stored calibration curves. Now, when a set point is established, the control means of
the instrument can access the appropriate data set to provide the appropriate flow control signal to
the valve means for sensed temperature and/or pressure conditions. This capability eliminates the
need for external manipulation of process temperature and pressure data, to provide flow control
inputs into the process. Further, once the data base 200 is established, it can be updated, amended,
etc. as additional process fluid information is collected. This not only improves the quality of
instrument calibration, but reduces the time and cost involved in performing a calibration.
Referring now to Figs. 8A and 8B, there is presented a simplified calibration/linearization
method for a digital flowmeter or mass flow controller.
| 1 | 2 | 3 | 4 | 5 | 6 |
| Set point and Raw Signal | Measured Flow, N2 | Curve fit N2 Flow | Desired Flow, N2 | Desired Signal N2 as gas | Signal in Engr. Units, N2 |
| 0.000 | 0 | 0 | 0 | 0.000 | 0 |
| 0.625 | | 160 | 125 | 0.488 | 125 |
| 1.250 | 320 | 320 | 250 | 0.977 | 250 |
| 1.875 | | 470 | 375 | 1.496 | 375 |
| 2.500 | 600 | 600 | 500 | 2.083 | 500 |
| 3.125 | | 700 | 625 | 2.790 | 625 |
| 3.750 | 800 | 800 | 750 | 3.516 | 750 |
| 4.375 | | 900 | 875 | 4.253 | 875 |
| 5.000 | 1000 | 1000 | 1000 | 5.000 | 1000 |
Using the data from the above table 1, the curve shown in Fig. 8A is plotted for flow
volume in standard cubic centimeters per minute as the abscissa and a set point and raw signal
value as the ordinate. The range for the set point is from 0.0 to 5.0, and five points are plotted to
generate the curve. The set point values are listed in column 1 of the chart, the five plotted points in
column 2. Once the curve has been created, the curve fit flow values listed in column 3 are taken
directly from the plot.
Fig. 8B illustrates a calibration curve for a digital flowmeter or flow controller in which the
ordinate is the same as in Fig. 8A. Now, the abscissa is for a desired signal and represents a
modified set point value. These value are derived from the measured flow data for a set point as
follows:
A desired flow is listed in column 4 of the chart. The desired signal representing this flow
is equal to the desired flow value of column 4, divided by the curve fit flow value of column 3, and
with the result of the division multiplied by the raw signal value of column 1. That is,
Desired signal =(desired flow/curve fit flow)*raw signal
As an example of how the curve of Fig. 8B is generated, for a raw signal value of 0.625
(point X in Fig. 8B), the desired flow value in column 4 is 125, and the curve fit flow value in
column 3 is 160. Using the above equation, the desired signal value is
desired signal = (125/160)*0.625 = 0.488
which is the value entered in column 5. In column 6, the desired signal is expressed in engineering
units. The values in this column are arrived at by multiplying the desired signal value in column 5
by a gas scaling factor. The values calculated for columns 5 and 6 now represent stored calibration
data.
With respect to the curve shown in Fig. 8B, once all of the desired signal values have been
calculated, the calibration is linear fit between adjacent points. The table of data points for this
curve are stored in the memory portion of the microprocessor for the instrument. Now, when a set
point is established, the desired signal representing measured flow of the process fluid for that set
point can be found in a look up table in the memory. Thus, as illustrated in Fig. 8B, for a set point
of 4.000, the desired signal can be readily established. Here, it is approximately 3.850.
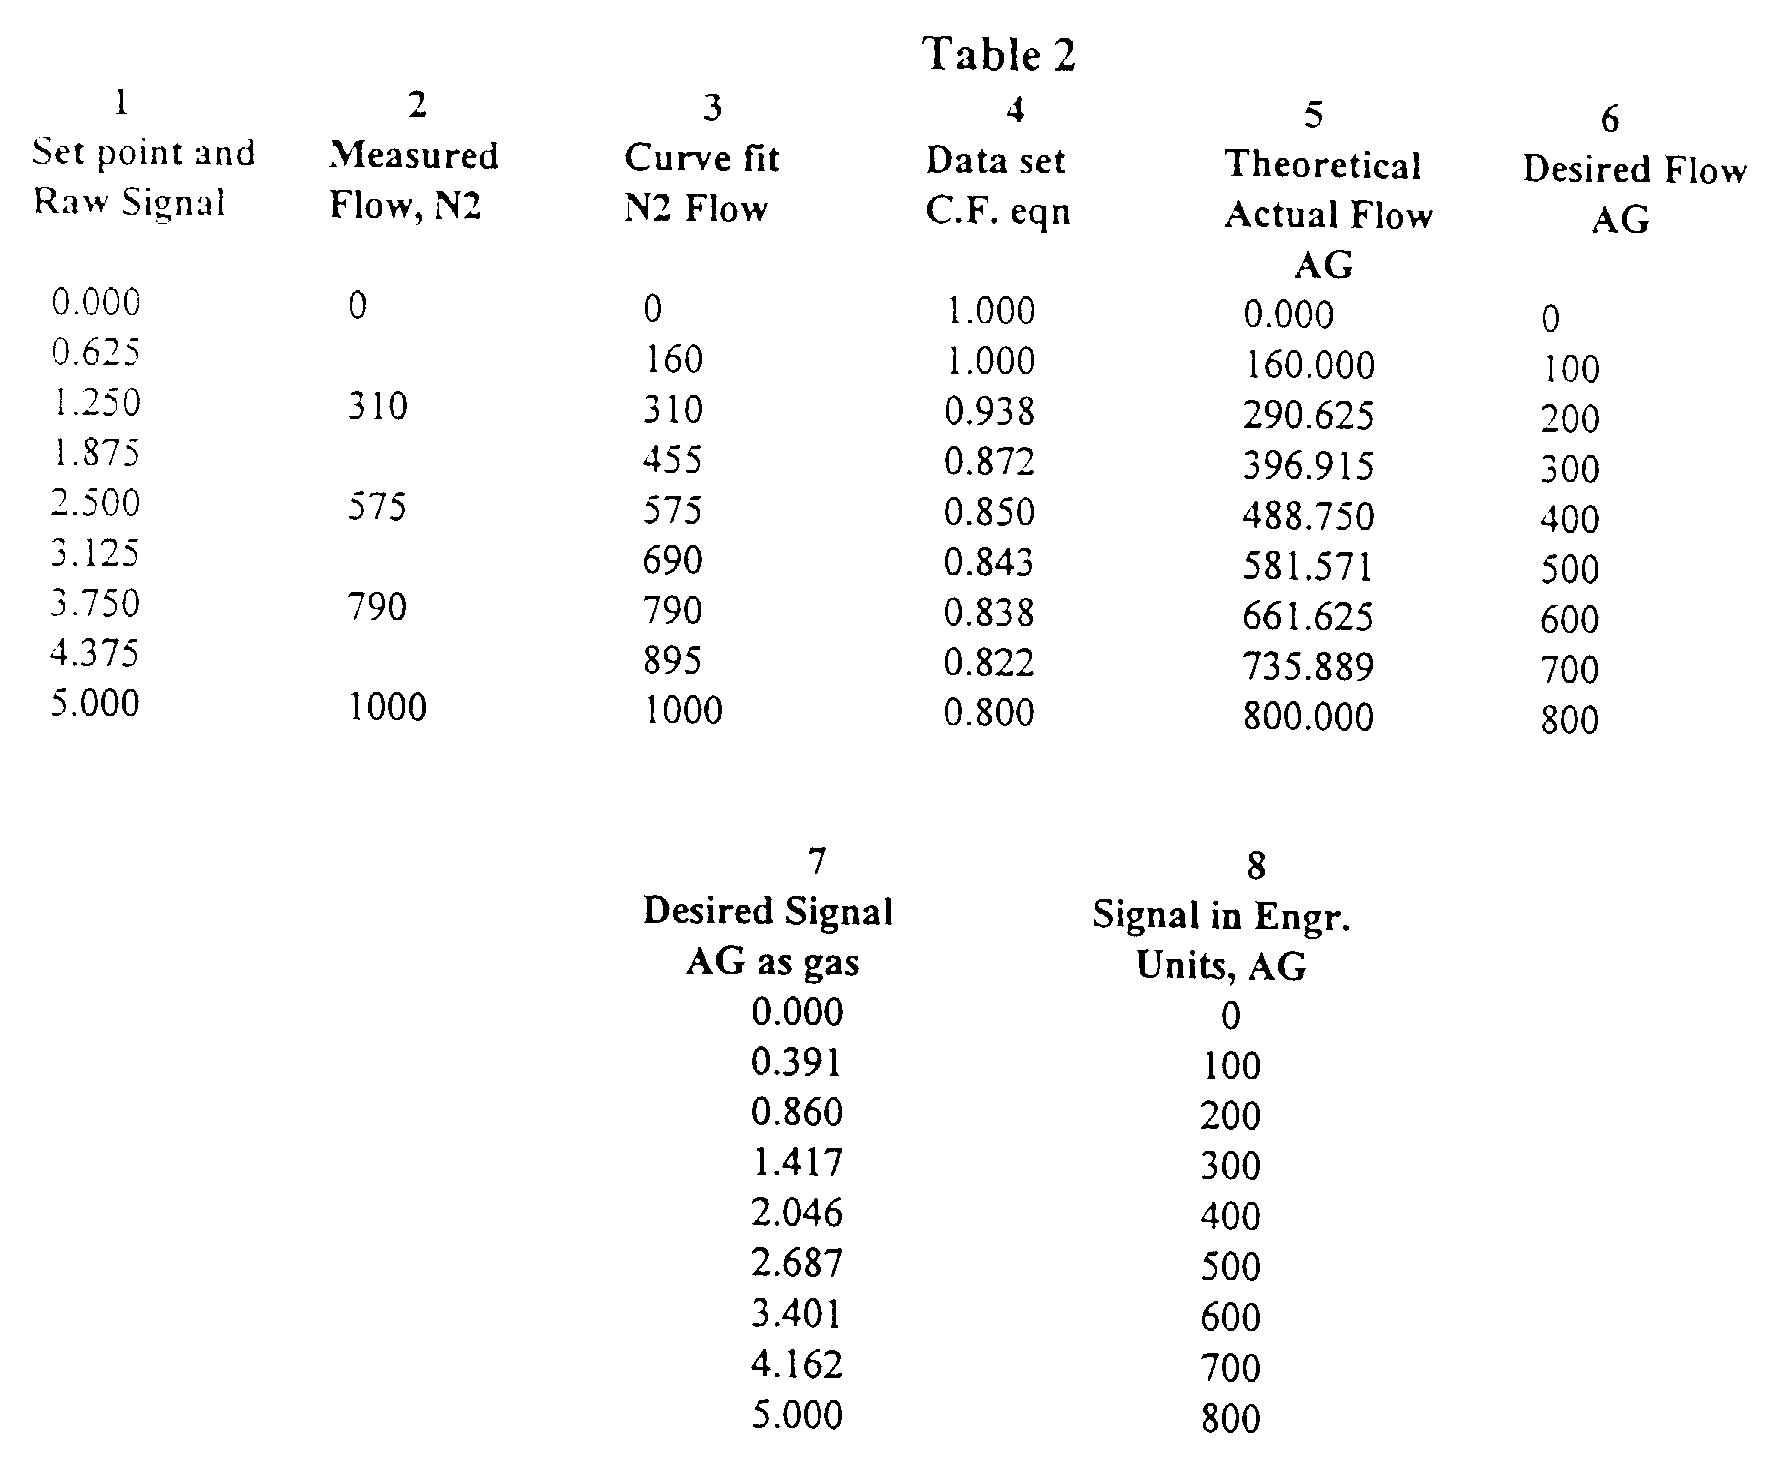
Referring to the table 2 set out below and the Figs. 9A and 9B, a calibration performed on a
digital flowmeter first compnses performing the steps involved in collecting the measured flow
data set out in column 2 of the table, using nitrogen gas, for the set point conditions listed in
column 1 of the table. As in the previously described calibration, a curve fit is made using the
measured flow data. The resulting fitted curve is indicated C1 in Fig. 9A. Next, similar data is
gathered for a process gas, the actual gas (AG), with which the digital flow meter would be used,
and a calculated AG curve is generated as indicated by curve C2 in Fig. 9A.
From these two curves, a ratio of values between the respective data values used in
generating the curves can be created. The respective ratios for each set point are tabulated in
column 4 above. Using this information, theoretical actual flow values for the actual gas can be
calculated using the equation:
theoretical actual flow = curve fit equation value (column 4)*curve fit N2 flow (column 3)
Using this equation, the values listed in column 5 are tabulated.
Referring to table 3, and Figs. 10A and 10B, the data set equation correction factors
tabulated in column 4 of table 2, are arrived at as follows.
| A | B | C | D | E | F |
| Set point and Raw Signal | Average Measured Flow, AG | Average Measured Flow, N2 | Average Curve Fit Ag flow | Average Curve Fit N2 Flow | Ratio of Average Curve Fits |
| 0.000 | 0 | 0 | 0 | 0 |
| 0.625 | | | 160 | 160 | 1.000 |
| 1.250 | 300 | 320 | 300 | 320 | 0.938 |
| 1.875 | | | 410 | 470 | 0.872 |
| 2.500 | 500 | 600 | 510 | 600 | 0.850 |
| 3.125 | | | 590 | 700 | 0.843 |
| 3.750 | 680 | 800 | 670 | 800 | 0.838 |
| 4.375 | | | 740 | 900 | 0.822 |
| 5.000 | 800 | 1000 | 800 | 1000 | 0.800 |
In Fig. 10A, curve X1 is a plot of the measured flow data for the actual gas, and curve X2
the measured flow data for the N2 gas. These plots are measured on the average measured flow
values listed in columns B and C of table 3. The values respectively listed in columns D and E are
the flow values for the set point values of column A, as taken from curves X1 and X2. The ratio
values listed in column F of the table are arrived at by dividing the value for actual gas flow listed
in column D by the N2 flow value in column E. Thus for the set point value 0.125, the actual gas
flow value 300 divided by the corresponding value 320 for N2 gas yields a ratio of 0.938. A curve
X3 shown in Fig. 10B is a plot of the calculated ratios shown in column F. In accordance with the
teachings of the invention, the actual gas and nitrogen or calibration gas values listed in table 3, and
the calculated ratio values, are stored in the data base now used for mass flow controller calibration.
In column 6 of table 2, desired flow values for the actual gas are listed. For each desired
flow level, a corresponding desired signal level can be determined from the equation:
desired signal = (desired flow/curve fit flow)*(raw signal)
Thus for example, for a desired actual gas flow of 100, the desired signal is calculated as
desired flow = (100 (column 6 value)/160 (column 2 value))*0.625 (column 1 value)
The resultant value is entered in column 7. After these values are produced, the curve C3
shown in Fig. 9B is generated. Also, and as listed in column 8 of the table, the signal in
engineering units for the actual gas can be created by multiplying the desired signal values of
column, 7 by a gas scaling factor.
For flowmeter 100 or flow controller 101 of Fig. 5, the microprocessor 122 has stored
therein data sets of process fluid calibration information which effectively comprises a series of
curves C3. These curves are for all the process gases with which the controller is used and allows
the instrument to provide accurate flow control for each of the process gases for the entire range of
set point conditions with which may be encountered by the instrument as part of the process. Each
of the other digital mass flow controllers MFC2-MFCn is similarly calibrated for the process fluids
with which they are used. The process control 102 to which each of the mass flow controllers is
connected, provides updated set point and other relevant information to each of the units. The
process control can poll each separate instrument to obtain status and other pertinent information
used to control the process.
An important advantage of such an instrument calibrated in accordance with the method of
the invention, is that the flow control curve C3 developed by each controller for each process fluid,
eliminates the need for "tweaking", or otherwise having to refine flow process information
developed by a flow controller to a fluid flow rate for a process fluid. As previously mentioned, it
is not only desirable to calibrate digital flowmeters and mass flow controllers using the method of
the invention, but analog instruments as well. Accordingly, table 4 includes calibration gas data
and process fluid or actual gas data.
| 1 | 2 | 3 | 4 | 5 |
| Set point and Raw Signal | Average Measured Flow, AG | Average Linearized Flow, AG | Average Measured Flow N2 | Average Curve Fit N2 Flow |
| 0.000 | 0 | 0 | 0 | 0 |
| 0.625 | | | | 140 |
| 1.250 | 300 | 220 | 270 | 270 |
| 1.875 | | | | 375 |
| 2.500 | 510 | 400 | 480 | 480 |
| 3.125 | | | | 590 |
| 3.750 | 680 | 580 | 720 | 720 |
| 4.375 | | | | 850 |
| 5.000 | 800 | 800 | 1000 | 1000 |
The data in column 2 of table 4 represents average measured flow data for the actual
process gas. After linearization, the data is plotted as shown by curve C4 in Fig. 11, and listed in
column 3 of the table. After data has been similarly acquired for the calibration gas, the process
steps previously described with respect to digital instrument calibrations are performed. The result
is the curve C5 in Fig. 11 and the data points listed in column 5 of the table.
The digital flow meters MFC1-MFCn shown in Fig. 5, could be analog flow meters with
the same process control capability being realizable. Again, the flow controllers could be
connected in a communications system with a process control whereby the process control is able
to provide set point and other relevant information to each controller and receive current process
fluid flow information in return.
A further advantage of the invention is the establishment of an improved, digital
communications system 300 for routing information to and from the process control and individual
instruments. This digital system eliminates signal errors resulting from noise and other effects.
Elimination of such errors increases the precision with which the process is controlled thereby
increasing the quality of the product produced by the process.
What has been described is an improved flowmeter or mass flow controller having
significantly greater accuracy than conventional digital or analog units. The instrument has both
improved signal processing and digital communications capabilities, and can be specifically
calibrated for the manufacturing process in which it will be used. It is a particular advantage of the
method of the invention to quickly and efficiently calibrate digital and analog flowmeters and mass
flow controllers, and to do so at a reasonable cost while providing a high precision instrument such
as is needed in certain manufacturing processes. Additionally, the complexity of signaling and
controlling a process is reduced because of the improved system's communications. Overall,
monitoring and control capabilities are increased which produces savings in process costs for the
manufacture of articles such as semiconductor devices. Calibration is based upon a particular
customer's process gas or gases and eliminates the "tweaking" and "cut and try" techniques now
used to accommodate an instrument to a particular application. Although calibration is done using
"safe" gases, instead of the highly toxic and highly reactive gases with which an instrument is
actually used, the thermodynamic transport properties of such gases are readily taken into account
during calibration. Representative units are independently calibrated for each of a number of gases
with which it is used, with the calibration information of each gas stored within a memory of a
flowmeter or flow controller, the instrument having sufficient data storage capability so all relevant
instrument and calibration data is stored in the instrument and is readily accessible by the user. To
facilitate instrument calibrations, a database is created containing information relating to a unit's
operation with a gas as well to that of the calibration gases. The database enables calibration
accuracy to be consistent over the unit's entire operating range, regardless of which gas with which
the instrument is used, and the entire range of gas flow rates. The improved instrument also has a
remote capability, a digitally adjustable setpoint and ramprate, and temperature monitoring for
indicating the temperature outside the instrument's flow rate sensor. A direct indication is also
provided of the raw sensor signal and valve drive signal to detect sensor clogging or restriction.
Multiple flow controllers can be interconnected into a flowmetering system for facilitating process
control wherein each flowmeter is able to access the database to obtain information pertinent to just
that flowmeter to enable each flowmeter to separately regulate fluid flow in respective areas of the
process.
In view of the foregoing, it will be seen that the several objects of the invention are
achieved and other advantageous results are obtained.
As various changes could be made in the above constructions without departing from the
scope of the invention, it is intended that all matter contained in the above description or shown in
the accompanying drawings shall be interpreted as illustrative and not in a limiting sense.
Having thus described the invention, what is claimed and desired to be secured by Letters Patent is: