EP0845720A1 - Method of analyzing and monitoring of transient processes - Google Patents
Method of analyzing and monitoring of transient processes Download PDFInfo
- Publication number
- EP0845720A1 EP0845720A1 EP97120787A EP97120787A EP0845720A1 EP 0845720 A1 EP0845720 A1 EP 0845720A1 EP 97120787 A EP97120787 A EP 97120787A EP 97120787 A EP97120787 A EP 97120787A EP 0845720 A1 EP0845720 A1 EP 0845720A1
- Authority
- EP
- European Patent Office
- Prior art keywords
- map
- trajectory
- neurons
- states
- variables
- Prior art date
- Legal status (The legal status is an assumption and is not a legal conclusion. Google has not performed a legal analysis and makes no representation as to the accuracy of the status listed.)
- Granted
Links
Images


Classifications
-
- G—PHYSICS
- G06—COMPUTING; CALCULATING OR COUNTING
- G06N—COMPUTING ARRANGEMENTS BASED ON SPECIFIC COMPUTATIONAL MODELS
- G06N3/00—Computing arrangements based on biological models
- G06N3/02—Neural networks
- G06N3/04—Architecture, e.g. interconnection topology
-
- G—PHYSICS
- G05—CONTROLLING; REGULATING
- G05B—CONTROL OR REGULATING SYSTEMS IN GENERAL; FUNCTIONAL ELEMENTS OF SUCH SYSTEMS; MONITORING OR TESTING ARRANGEMENTS FOR SUCH SYSTEMS OR ELEMENTS
- G05B19/00—Programme-control systems
- G05B19/02—Programme-control systems electric
- G05B19/04—Programme control other than numerical control, i.e. in sequence controllers or logic controllers
- G05B19/042—Programme control other than numerical control, i.e. in sequence controllers or logic controllers using digital processors
- G05B19/0423—Input/output
- G05B19/0425—Safety, monitoring
-
- Y—GENERAL TAGGING OF NEW TECHNOLOGICAL DEVELOPMENTS; GENERAL TAGGING OF CROSS-SECTIONAL TECHNOLOGIES SPANNING OVER SEVERAL SECTIONS OF THE IPC; TECHNICAL SUBJECTS COVERED BY FORMER USPC CROSS-REFERENCE ART COLLECTIONS [XRACs] AND DIGESTS
- Y10—TECHNICAL SUBJECTS COVERED BY FORMER USPC
- Y10S—TECHNICAL SUBJECTS COVERED BY FORMER USPC CROSS-REFERENCE ART COLLECTIONS [XRACs] AND DIGESTS
- Y10S706/00—Data processing: artificial intelligence
- Y10S706/902—Application using ai with detail of the ai system
- Y10S706/903—Control
- Y10S706/906—Process plant
- Y10S706/907—Power plant
Definitions
- the invention relates to a method for analyzing and displaying process states and process operations of a technical system.
- the method is suitable for the analysis and display of process states and Operations of a power plant.
- the invention has for its object to provide a method that Simultaneous and coherent evaluation and display of relevant process states and sequences of process states of a technical system. Especially should enable the analysis and display of transient process processes will. In addition, an extension of the procedure for diagnosis is intended transient processes can be specified.
- Another possible solution would be a method based on the main component analysis, a mathematical process for reducing dimensions, which is aimed at a data distribution from a high-dimensional room to describe as well as possible in a low-dimensional space.
- the main component analysis analysis of variance is achieved by a linear projection in a space - which is spanned by the eigenvectors of the data distribution - realized.
- this linear approach means restrictions, which is why the main component analysis not seen as a satisfactory solution to the task at hand becomes.
- a projection onto non-linear surfaces, so-called Major manifolds performed. These nonlinear areas are covered by so-called topology-preserving Kohonen maps spanned in the state space of the plant.
- such a card is a "self-organizing neural network" in which all neurons are arranged side by side.
- the self-organizing neural network is an established term for a special class of neural networks that structure themselves based on input signals, cf. A. Zell Simulation of neural networks , Addison-Wesley Verlag, 1994, pages 179 to 187.
- the spatial position of the individual neurons plays an important role in the Kohonen maps.
- the process state calculated by the method is preserved on this topology Map of potential process states plotted and visualized and is continue directly with others, e.g. previous process states, comparable.
- the map thus represents a topology-preserving, two-dimensional one window in the n-dimensional state space of the system Associated with this description that the points in the entrance space are close lie close together, also in the exit room, i.e. on the map will lie.
- the relevant n Process sizes offered In the method according to the invention, after appropriate data preprocessing a self-organizing network in a learning phase the relevant n Process sizes offered.
- the learning phase takes place in two steps: First unfolded the map in the status area of the system, then the system states visualized using a mathematical method.
- the visualization of the physical system status is based on a static one Visualization process in which the differences in the weight vectors of a calculated each neuron to its neighbors and prepared it accordingly, e.g. color-coded. Contiguous areas (e.g. bright areas in Fig. 2) have a small difference because their neurons are in the state space were placed close to each other. There is between these individual clusters Limits characterized by a large difference in the respective weight vectors are, e.g. visualized as dark areas (see FIG. 2). In order to can be a good visualization of the cluster boundaries and thus the real plant conditions see also G. Whittington, C. Spracklen: The Application of Neural Network Model to Sensor Data Fusion in Proc. of Applications of ANN Conference, Orlando, USA, 1990.
- the winner-takes-all algorithm is a procedure in which only the neuron that best fulfills a certain condition is active; all other neurons in the network or card are inactive (1-out-of-m selection).
- This special condition is, for example, the minimum distance between the current input vector and the weight vector of the individual neurons, see S. Hafner, Neural networks in automation technology , Oldenbourg Verlag, 1994, in particular pages 17 to 25.
- the process is automated in the sense that the process can automatically recognize deviations from process processes - represented as trajectories on a map - from a reference process and determine the underlying causes.
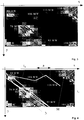
- Fig. 1 shows the structure of a system for performing the method for process analysis and diagnosis with a neural card. A description of the structure results from the description of the process steps.
- Process step 1 Recording and selection of the process variables
- a data acquisition and processing system for example a data server based on a computer in a control system, Cyclically records process values from a technical system, for example from a boiler of a power plant.
- a subsequent data analysis system subjects the selected and relevant data to a correlation analysis to determine the to determine independent, process-describing measurands.
- Process step 2 learning phase of the card (off-line)
- Step 2.1 Development of the self-organizing, neural network in the state space of the system, based on the algorithm by T. Kohonen.
- the Kohonen algorithm adapts the weight vectors of the neurons on the map, taking into account their neighborhood relationships and the input vector.
- Step 2.2 Representation of the unfolded network as a map - as a so-called map
- Application of a static visualization method by the differences of the Weight vectors of the neurons can be visualized.
- Fig. 2 shows an example - here in a black and white representation - the structured and color-coded, neural map for different system states of a boiler (bright contiguous areas). It shows the projection and visualization of several load states of the boiler on a neural map with 15 * 20 neurons. The current load of the power plant in megawatts is entered by hand for the respective clusters in the picture.
- the x axis indicates the number of neurons in the x direction
- the y axis the number of neurons in the y direction.
- the system states z and z + 1 represent two different load states of the system.
- the dark areas on the map form the boundaries between the different ones Plant states, since they represent neurons that are very far apart in the plant room are removed.
- the bright clusters of the map form neurons in the plant room are very close to each other, they correspond to the real load conditions the plant.
- each system state is based on 11 independent process variables is determined and thus 11-dimensional, can be a by the method Projection can be done on only two dimensions; this makes one significant better overview of the actual process states achieved than with the individual consideration of all 11 process variables.
- the number of simultaneously evaluated Process sizes are not limited to 11, they can be much larger.
- Process step 3 application - process analysis with the card (off-line / on-line)
- Step 3.1 Connection of the card to the process and representation of the current process status on the structured map.
- the current process state through a neural "winner-takes-all” algorithm evaluated and applied to the previously structured and color-coded map.
- the three black circles correspond to three plant states at different Times t.
- the current, generally high-dimensional system condition can be visualized in the context of other system states.
- the spatial location the current process status on the structured map provides information about the current status of the system.
- Step 3.2 Graphic connection of winning neurons
- the current winner neuron at time t 0 is marked, for example, by a black circle (cf. FIG. 2). If one connects these winning neurons with each other, a trajectory of the current process states develops on the structured map with the time t, which either grows continuously or moves on the map with a fixed, predetermined length.
- FIG. 3 shows - here in a black and white representation - an example of such a trajectory course on a structured, color-coded, neuronal map with 15 * 20 neurons when starting and changing a load of a boiler over a period of 250 minutes.
- the x-axis in FIG. 3 indicates the number of neurons in the x-direction, the y-axis the number of neurons in the y-direction.
- the various load conditions of the system are marked by bright clusters in the picture.
- Step 3.3 Superimposing trajectories of different process operations for visual comparison and analysis of complex dynamic processes
- FIG. 4 shows an example for two different boiler trips, the black trajectory t r corresponds to a 'good' reference approach, the white trajectory t u here represents a load change from 126 MW to 95 MW.
- the x-axis in FIG. 4 shows the number of neurons in the x direction, the y axis the number of neurons in the y direction.
- the potential load conditions of the system are marked by bright clusters in the picture.
- Step 4 Application - Diagnostic phase of the card
- Neuron 'N' is in the plant room placed virtually in the 28 MW state
- neuron 'M' speaks to the 130 MW load state
- their spatial position on the map is marked in Fig. 4 as a white circular area.
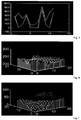
- FIG. 5 shows the weight distribution of these two map neurons.
- the x-axis in FIG. 5 corresponds to the weights w 1 , w 2 , .., w 11 of the neurons 'N' and 'M', the y-axis represent the normalized values of the individual weights. It can be seen that the neurons differ primarily in their weights w 10 , w 2 and w 3 . This is confirmed with a standard deviation calculation.
- the process analysis is made possible by calculating the correlation coefficient and the standard deviation of the weight distribution of selected (operator-selected) neurons.
- the operator can thus determine the cause of any two deviations on-line because he only needs to click on the neurons on the map in which the trajectories differ (visually) particularly, for example by distance a in FIG. 4.
- the cause of the deviations ie the process variables with the greatest standard deviations, are calculated below. This enables simple diagnosis options to be implemented with the card.
- Process step 5 Representation of process relationships with the map
- Step 5.1 Another possible processing step on the map leads to the use of data mining strategies in the power plant area, the weight distributions of individual process variables are shown over the entire map, FIGS. 6 and 7 illustrate this using an example. Since the process distribution in the weights of the neurons is coded on the map and the weight distribution can be shown on the map, this gives a clear statement about the distribution of the real process variables on the map and thus a distribution in the state space of the system.
- Fig. 6 shows the distribution of the feed water temperature (z-axis) over the map (x, y-axis)
- Fig. 7 shows the distribution of the coal feeder speed (z-axis) over the map (x, y-axis) .
- Step 5.2 By using the method for static visualization of weight differences (see previous chapter) for selected process variables there are correlations between these quantities and existing process states visualize that would not be recognizable if the complete weight distributions would be evaluated.
- Step 5.3 By means of a graphical extrapolation of the trajectory curve t u at a predeterminable time t o in a predeterminable time period ⁇ t along the reference curve t r to an expected process state at a second point in time t o + ⁇ t, future process values can be estimated by those belonging to the expected process state Process values are determined and output.
- Process step 6 automatic detection of process deviations
- the supervisor card thus realizes a further dimensional reduction is - as described - a sub-process of the process on the process map as a trajectory shown with m discrete trajectory positions on the supervisor card but this trajectory course becomes a single neuron, and thus summarized in a single point.
- the learning process According to Kohonen, neuron clusters are formed on the supervisor card, correspond to the similar trajectory sections on the process map.
- the trajectory section to be examined is on the process map - again from m discrete trajectory positions must exist - analyzed by the supervisor card and for similarity with compared previously learned trajectory sections.
- the similarity is shown in the Distance of the current winner neuron from the 'supervisor' neuron for the respective previously learned trajectory sections. This distance is therefore a measure of the similarity of two trajectory or partial trajectory courses.
- the diagnostic system recognizes automatically that the current trajectory course - e.g. a current one Can represent load changes - deviates from a previously learned reference curve.
- the system will then generate an error message and the cause of the trajectory deviation is automatically determined on the basis of method step 4, by calculating the causes for the respective trajectory deviations, through automatic analysis of the weight distribution of the underlying neurons.
- the advantage of the method described here is because you not only various process states to compare, but to record even complex and transient process operations such as complete on -or runs and automatically face can so that there is a powerful extension of current analysis systems for power plants.
- the process represents an automated diagnostic system for transient power plant processes.
- Another advantage of the process is the low engineering effort. There learning and structuring the maps and also recording the trajectories Automated and completely provided by the process, there is no need for time-consuming work Engineering of reference models. This engineering is more integral Part of the process itself.
Abstract
Description
Die Erfindung bezieht sich auf ein Verfahren zur Analyse und Darstellung von Prozeßzuständen und Prozeßvorgängen einer technischen Anlage.The invention relates to a method for analyzing and displaying process states and process operations of a technical system.
Das Verfahren ist geeignet zur Analyse und Darstellung von Prozeßzuständen und Vorgängen einer Kraftwerksanlage.The method is suitable for the analysis and display of process states and Operations of a power plant.
Es ist allgemein bekannt, einzelne Prozeßgrößen meßtechnisch zu erfassen, zu betrachten und auch prozeßzustandsabhängig auszuwerten. Eine bessere Beurteilung eines technischen Prozesses ist jedoch durch eine gleichzeitige, ganzheitliche Betrachtung aller relevanten Prozeßgrößen möglich.It is generally known to measure individual process variables, to consider them and also to evaluate it depending on the process status. A better assessment of a technical process, however, is through a simultaneous, holistic view all relevant process variables possible.
Der Erfindung liegt die Aufgabe zugrunde, ein Verfahren anzugeben, das eine gleichzeitige und zusammenhängige Bewertung und Anzeige relevanter Prozeßzustände und Folgen von Prozeßzuständen einer technischen Anlage ermöglicht. Insbesondere soll die Analyse und Darstellung von transienten Prozeßvorgängen ermöglicht werden. Außerdem soll eine Erweiterung des Verfahrens für eine Diagnose transienter Vorgänge angegeben werden.The invention has for its object to provide a method that Simultaneous and coherent evaluation and display of relevant process states and sequences of process states of a technical system. Especially should enable the analysis and display of transient process processes will. In addition, an extension of the procedure for diagnosis is intended transient processes can be specified.
Diese Aufgabe wird gelöst durch ein im Anspruch 1 angegebenes Verfahren zur Analyse und Darstellung von Prozeßzuständen einer technischen Anlage, bei dem alle für einen Prozeß relevanten Größen zusammengefaßt und durch eine neuronale Analyse auf der Grundlage von Kohonen-Karten in Beziehung zueinander ausgewertet werden, indem eine topologieerhaltende Projektion von Daten der relevanten Prozeßgrößen auf eine farbkodierte, neuronale Karte realisiert wird.This object is achieved by a method specified in claim 1 Analysis and display of process states of a technical system in which all variables relevant for a process are summarized and by a neural Analysis evaluated based on Kohonen maps in relation to each other by a topology-preserving projection of data of the relevant Process variables on a color-coded, neural card is realized.
Vorteilhafte Ausgestaltungen sind in weiteren Ansprüchen angegeben.Advantageous refinements are specified in further claims.
Ein anderer denkbarer Lösungsansatz wäre ein Verfahren auf Grundlage der Hauptkomponentenanalyse, also ein mathematisches Verfahren zur Dimensionsreduktion, mit dem angestrebt wird, eine Datenverteilung aus einem hoch-dimensionalen Raum möglichst gut in einem niedrig-dimensionalen Raum zu beschreiben. Bei der Hauptkomponentenanalyse bzw. Varianzanalyse wird das durch eine lineare Projektion in einem Raum - der durch die Eigenvektoren der Datenverteilung aufgespannt wird - realisiert. Dieser lineare Ansatz bedeutet aber Restriktionen, weshalb die Hauptkomponentenanalyse nicht als befriedigende Lösung der gestellten Aufgabe angesehen wird.Another possible solution would be a method based on the main component analysis, a mathematical process for reducing dimensions, which is aimed at a data distribution from a high-dimensional room to describe as well as possible in a low-dimensional space. In the main component analysis analysis of variance is achieved by a linear projection in a space - which is spanned by the eigenvectors of the data distribution - realized. However, this linear approach means restrictions, which is why the main component analysis not seen as a satisfactory solution to the task at hand becomes.
Durch die erfindungsgemäße Anwendung nichtlinearer, neuronaler Methoden wird eine allgemeine Realisierbarkeit des Verfahrens auch für schwierigste Datenverteilungen gewährleistet, sie unterliegt keinen linearen Restriktionen.By using nonlinear, neuronal methods according to the invention a general feasibility of the method even for the most difficult data distributions ensures that it is not subject to linear restrictions.
Durch den ganzheitlichen Ansatz werden nicht nur die Werte der einzelnen Prozeßgrößen, sondern auch gerade ihre gegenseitigen Einflüsse untereinander berücksichtigt.Through the holistic approach, not only the values of the individual process variables, but also take into account their mutual influences.
Es wird verfahrensgemäß eine Projektion auf nichtlineare Flächen, sogenannte Hauptmannigfaltigkeiten, durchgeführt. Diese nichtlinearen Flächen werden durch sogenannte topologieerhaltende Kohonen-Karten im Zustandsraum der Anlage aufgespannt.According to the method, a projection onto non-linear surfaces, so-called Major manifolds performed. These nonlinear areas are covered by so-called topology-preserving Kohonen maps spanned in the state space of the plant.
In der neuronalen Theorie versteht man unter einer solchen Karte ein "selbstorganisierendes
neuronales Netz", bei dem alle Neuronen nebeneinander angeordnet
sind. Das selbstorganisierende neuronale Netz ist ein eingeführter Begriff für eine
spezielle Klasse von neuronalen Netzen, die sich anhand von Eingangssignalen
selbst strukturieren, vgl. A. Zell ![]()
![]()
![]()
![]()
Der durch das Verfahren berechnete Prozeßzustand wird auf dieser topologieerhaltenden Karte von potentiellen Prozeßzuständen aufgetragen und visualisiert und ist weiterhin auch direkt mit anderen, z.B. vorherigen Prozeßzuständen, vergleichbar. Damit stellt die Karte im Prinzip ein topologieerhaltendes, 2-dimensionales Fenster in den n-dimensionalen Zustandsraum der Anlage dar. Topologieerhaltend heißt im Zusammenhang mit dieser Beschreibung, daß die Punkte, die im Eingangsraum nahe beieinander liegen, auch im Ausgangsraum, also auf der Karte, nahe beieinander liegen werden.The process state calculated by the method is preserved on this topology Map of potential process states plotted and visualized and is continue directly with others, e.g. previous process states, comparable. In principle, the map thus represents a topology-preserving, two-dimensional one window in the n-dimensional state space of the system Associated with this description that the points in the entrance space are close lie close together, also in the exit room, i.e. on the map will lie.
Beim erfindungsgemäßen Verfahren werden nach einer entsprechenden Datenvorverarbeitung einem selbstorganisierenden Netz in einer Lernphase die relevanten n Prozeßgrößen angeboten. Die Lernphase erfolgt in zwei Schritten: Zuerst entfaltet sich die Karte im Zustandsraum der Anlage, danach werden die Anlagenzustände durch Anwendung eines mathematischen Verfahrens visualisiert.In the method according to the invention, after appropriate data preprocessing a self-organizing network in a learning phase the relevant n Process sizes offered. The learning phase takes place in two steps: First unfolded the map in the status area of the system, then the system states visualized using a mathematical method.
Die Entfaltung der seltistorganisierenden Karte im Zustandsraum der Anlage wird
durch den "neuronalen Algorithmus nach T. Kohonen" realisiert. Der selbstorganisierende
neuronale Algorithmus wurde von Kohonen im Jahr 1982 eingeführt; vgl.
T. Kohonen,
Die Visualisierung der physikalischen Anlagenzustände geschieht nach einem statischen Visualisierungsverfahren, bei dem die Differenzen der Gewichtsvektoren eines jeden Neurons zu seinen Nachbarn berechnet und entsprechend graphisch aufbereitet, z.B. farbkodiert dargestellt werden. Zusammenhängende Gebiete (z.B. helle Flächen in Fig. 2) haben eine kleine Differenz, da ihre Neuronen im Zustandsraum nahe beieinander plaziert wurden. Zwischen diesen einzelnen Clustern gibt es Grenzen, die durch eine hohe Differenz der jeweiligen Gewichtsvektoren gekennzeichnet sind, diese werden z.B. als dunkle Flächen (vgl. Fig. 2) visualisiert. Damit läßt sich eine gute Visualisierung der Clustergrenzen und damit der realen Anlagenzustände erreichen, siehe auch G. Whittington, C. Spracklen: The Application of Neural Network Model to Sensor Data Fusion in Proc. of Applications of ANN Conference, Orlando, USA, 1990.The visualization of the physical system status is based on a static one Visualization process in which the differences in the weight vectors of a calculated each neuron to its neighbors and prepared it accordingly, e.g. color-coded. Contiguous areas (e.g. bright areas in Fig. 2) have a small difference because their neurons are in the state space were placed close to each other. There is between these individual clusters Limits characterized by a large difference in the respective weight vectors are, e.g. visualized as dark areas (see FIG. 2). In order to can be a good visualization of the cluster boundaries and thus the real plant conditions see also G. Whittington, C. Spracklen: The Application of Neural Network Model to Sensor Data Fusion in Proc. of Applications of ANN Conference, Orlando, USA, 1990.
Mit dieser Visualiserung wird eine topologieerhaltende Abbildung aller relevanten Anlagenzustände realisiert, d.h. in der Realität verschiedene Anlagenzustände werden auch auf der Karte räumlich getrennt voneinander dargestellt. Durch die Wahl der Farbkodierungen auf dieser neuronalen Karte werden verschiedene Datencluster für den Prozeßbeobachter visuell aufbereitet.With this visualization, a topology-preserving mapping of all relevant Plant states implemented, i.e. in reality different plant states also shown spatially separated on the map. By choice The color codes on this neural map become different data clusters visually prepared for the process observer.
In der Anwendungsphase der Karte können durch Aufbau und Entwicklung einer
Trajektorie von Prozeßzuständen auf dieser Karte mittels eines "Winner-takes-all
Eine Analyse der einzelnen Prozeßgrößenverteilungen auf der Karte, erlaubt das Erkennen von neuartigen Prozeßzusammenhängen und Störungen. Eine Rücktransformation der abstrakten Darstellung der Karte auf die einzelnen Prozeßgrößen erlaubt das Ermitteln von Ursachen für Prozeßabweichungen. Damit kann das Verfahren zur on-line Prozeßführung, Fehlerfrüherkennung und Diagnose eingesetzt werden.An analysis of the individual process size distributions on the map allows that Recognize novel process relationships and disruptions. A reverse transformation the abstract representation of the map on the individual process variables allowed determining the causes of process deviations. So that the procedure for online process management, early error detection and diagnosis.
Durch Aufbau und Entwicklung einer hierarchischen Kohonen-Karte wird das Verfahren automatisiert, in dem Sinne, daß das Verfahren Abweichungen von Prozeßvorgängen -dargestellt als Trajektorien auf einer Karte- von einem Referenzvorgang automatisch erkennen und die zugrundeliegenden Ursachen bestimmen kann. By building and developing a hierarchical Kohonen map, the process is automated in the sense that the process can automatically recognize deviations from process processes - represented as trajectories on a map - from a reference process and determine the underlying causes.
Eine weitere Beschreibung des Verfahrens erfolgt nachstehend anhand von in den Zeichnungsfiguren dargestellten Ausführungsbeispielen, die sich auf Lastzustände eines Kraftwerks beziehen.A further description of the method is given below using in the Drawings illustrated embodiments, which relate to load conditions of a power plant.
Es zeigen:
- Fig. 1
- ein Strukturbild, das die wesentlichen Komponenten eines Systems zur Durchführung des Verfahrens zeigt,
- Fig. 2
- eine neuronale Karte für neun verschiedene Lastzustände eines Kessels,
- Fig. 3 und 4
- den Trajektorienverlauf beim Anfahren und Lastwechsels eines Kessels für zwei verschiedenen Vorgänge,
- Fig. 5
- die unterschiedliche Gewichtsverteilung zweier Neuronen auf der entfalteten Karte,
- Fig. 6 und 7
- die Prozeßgrößenverteilung zweier ausgewählter Prozeßgrößen über der Karte und
- Fig. 8
- den schematischen Aufbau eines automatischen Fehlererkennungssystems mit hierarchischen Kohonen-Karten.
- Fig. 1
- a structural diagram showing the essential components of a system for performing the method,
- Fig. 2
- a neural map for nine different load states of a boiler,
- 3 and 4
- the trajectory course when starting and changing the load of a boiler for two different processes,
- Fig. 5
- the different weight distribution of two neurons on the unfolded map,
- 6 and 7
- the process variable distribution of two selected process variables over the map and
- Fig. 8
- the schematic structure of an automatic error detection system with hierarchical Kohonen maps.
Die Beschreibung des Verfahrens ist im folgenden in verschiedenen Verfahrensschritte gegliedert und wird anhand der in den Zeichnungsfiguren gezeigten Abbildungsbeispielen erläutert. Fig. 1 zeigt die Struktur eines Systems zur Durchführung des Verfahrens zur Prozeßanalyse und Diagnose mit neuronaler Karte. Eine Beschreibung der Struktur ergibt sich aus der Beschreibung der Verfahrensschritte.The description of the method is divided into different method steps below and is explained with reference to the illustration examples shown in the drawing figures. Fig. 1 shows the structure of a system for performing the method for process analysis and diagnosis with a neural card. A description of the structure results from the description of the process steps.
Aufnahme und Aufbereitung der Daten. Ein Datenerfassungs- und aufbereitungssystem, beispielsweise ein Datenserver basierend auf einem Rechner eines Leitsystems, erfaßt zyklisch Prozeßwerte aus einer technischen Anlage, beispielsweise von einem Kessel einer Kraftwerksanlage. Ein nachfolgendes Datenanalysesystem unterzieht die ausgewählten und relevanten Daten einer Korrelationsanalyse, um die unabhängigen, prozeßbeschreibenden Meßgrößen zu bestimmen. Recording and processing of the data. A data acquisition and processing system, for example a data server based on a computer in a control system, Cyclically records process values from a technical system, for example from a boiler of a power plant. A subsequent data analysis system subjects the selected and relevant data to a correlation analysis to determine the to determine independent, process-describing measurands.
Schritt 2.1. Entfaltung des selbstorganisierenden, neuronalen Netzes im Zustandsraum
der Anlage, basierend auf Algorithmus von T. Kohonen.
Prinzipiell werden durch den Kohonen-Algorithmus die Gewichtsvektoren der Neuronen
auf der Karte, unter Berücksichtigung ihrer Nachbarschaftsbeziehungen und
des Eingangsvektors adaptiert.Step 2.1. Development of the self-organizing, neural network in the state space of the system, based on the algorithm by T. Kohonen.
In principle, the Kohonen algorithm adapts the weight vectors of the neurons on the map, taking into account their neighborhood relationships and the input vector.
Als Eingangsgrößen für das Netz werden die physikalischen Prozeßwerte der o.g. Prozeßgrößen verwendet.The physical process values of the above are used as input variables for the network. Process variables used.
Schritt 2.2. Darstellung des entfalteten Netzes als Karte -als sogenannte Map-durch Anwendung einer statischen Visualisierungsmethode, indem die Differenzen der Gewichtsvektoren der Neuronen visualisiert werden.Step 2.2. Representation of the unfolded network as a map - as a so-called map Application of a static visualization method by the differences of the Weight vectors of the neurons can be visualized.
Fig. 2 zeigt beispielhaft - hier in einer Schwarz/weiß-Darstellung - die strukturierte und farbkodierte, neuronale Karte für verschiedene Anlagenzustände eines Kessels (helle zusammenhängende Flächen). Es stellt die Projektion und Visualisierung von mehreren Lastzuständen des Kessels auf einer neuronalen Karte mit 15*20 Neuronen dar. Die aktuelle Last des Kraftwerkes in Megawatt ist für die jeweiligen Cluster im Bild mit Hand eingetragen. In Fig. 2 gibt die x-Achse die Anzahl der Neuronen in x-Richtung, die y-Achse die Anzahl der Neuronen in y-Richtung an. Die Anlagenzustände z und z+1 stellen zwei unterschiedliche Lastzustände der Anlage dar. Fig. 2 shows an example - here in a black and white representation - the structured and color-coded, neural map for different system states of a boiler (bright contiguous areas). It shows the projection and visualization of several load states of the boiler on a neural map with 15 * 20 neurons. The current load of the power plant in megawatts is entered by hand for the respective clusters in the picture. In FIG. 2, the x axis indicates the number of neurons in the x direction, the y axis the number of neurons in the y direction. The system states z and z + 1 represent two different load states of the system.
Die dunklen Gebiete auf der Karte bilden die Grenzen zwischen den verschiedenen Anlagenzuständen, da sie Neuronen darstellen, die im Anlagenraum sehr weit voneinander entfernt sind. Die hellen Cluster der Karte bilden Neuronen, die im Anlagenraum sehr nahe beieinander liegen, sie entsprechen den realen Lastzuständen der Anlage.The dark areas on the map form the boundaries between the different ones Plant states, since they represent neurons that are very far apart in the plant room are removed. The bright clusters of the map form neurons in the plant room are very close to each other, they correspond to the real load conditions the plant.
Obwohl in diesem Beispiel jeder Anlagenzustand durch 11 unabhängige Prozeßgrößen bestimmt wird und damit 11-dimensional ist, kann durch das Verfahren eine Projektion auf nur zwei Dimensionen durchgeführt werden; damit wird eine erheblich bessere Übersichtlichkeit über die tatsächlichen Prozeßzustände erreicht als bei der einzelnen Betrachtung aller 11 Prozeßgrößen. Die Anzahl der gleichzeitig ausgewerteten Prozeßgrößen ist nicht auf 11 beschränkt, sie kann wesentlich höher sein.Although in this example, each system state is based on 11 independent process variables is determined and thus 11-dimensional, can be a by the method Projection can be done on only two dimensions; this makes one significant better overview of the actual process states achieved than with the individual consideration of all 11 process variables. The number of simultaneously evaluated Process sizes are not limited to 11, they can be much larger.
Mit diesem Verfahren wird somit eine topologieerhaltende Abbildung aller relevanten Anlagenzustände realisiert, z.B. in der Realität verschiedene Lastzustände werden auch auf der Karte räumlich getrennt dargestellt.With this method, a topology-preserving mapping of all relevant Plant states implemented, e.g. in reality there will be different load conditions also shown spatially separated on the map.
Schritt 3.1. Anbindung der Karte an den Prozeß und Darstellung des aktuellen Prozeßzustandes auf der strukturierten Karte.Step 3.1. Connection of the card to the process and representation of the current process status on the structured map.
In der Anwendungsphase, d.h. während des Betriebes der Kraftwerksanlage, wird der aktuelle Prozeßzustand durch einen neuronalen "Winner-takes-all" Algorithmus ausgewertet und auf der vorher strukturierten und farbkodierten Karte aufgetragen. In Fig. 2 entsprechen die drei schwarzen Kreise drei Anlagenzuständen zu verschiedenen Zeitpunkten t. Damit kann der aktuelle, i.a. hochdimensionale Anlagenzustand im Kontext anderer Anlagenzustände visualisiert werden. Die räumliche Lage des aktuellen Prozeßzustandes auf der strukturierten Karte gibt Auskunft über den aktuellen Zustand der Anlage.In the application phase, i.e. during the operation of the power plant the current process state through a neural "winner-takes-all" algorithm evaluated and applied to the previously structured and color-coded map. In Fig. 2, the three black circles correspond to three plant states at different Times t. The current, generally high-dimensional system condition can be visualized in the context of other system states. The spatial location the current process status on the structured map provides information about the current status of the system.
Schritt 3.2. Graphische Verbindung von Gewinnerneuronen
In der Anwendungsphase wird das jeweils aktuelle Gewinnerneuron zum Zeitpunkt t0
z.B. durch einen schwarzen Kreis markiert (vgl. Fig. 2). Verbindet man diese Gewinnerneuronen
miteinander, entwickelt sich auf der strukturierten Karte mit der Zeit t
eine Trajektorie der aktuellen Prozeßzustände, die entweder ständig wächst oder
bei fester vorgegebener Länge auf der Karte wandert.Step 3.2. Graphic connection of winning neurons
In the application phase, the current winner neuron at time t 0 is marked, for example, by a black circle (cf. FIG. 2). If one connects these winning neurons with each other, a trajectory of the current process states develops on the structured map with the time t, which either grows continuously or moves on the map with a fixed, predetermined length.
Fig. 3 zeigt - hier in einer Schwarz/Weiß-Darstellung - beispielhaft einen solchen Trajektorienverlauf auf einer strukturierten, farbkodierten, neuronalen Karte mit 15*20 Neuronen beim Anfahren und Lastwechsel eines Kessels über einen Zeitraum von 250 Minuten. Die x-Achse in den Fig. 3 gibt die Anzahl der Neuronen in x-Richtung, die y-Achse die Anzahl der Neuronen in y-Richtung an. Die verschiedenen Lastzustände der Anlage werden durch helle Cluster im Bild markiert. 3 shows - here in a black and white representation - an example of such a trajectory course on a structured, color-coded, neuronal map with 15 * 20 neurons when starting and changing a load of a boiler over a period of 250 minutes. The x-axis in FIG. 3 indicates the number of neurons in the x-direction, the y-axis the number of neurons in the y-direction. The various load conditions of the system are marked by bright clusters in the picture.
Schritt 3.3. Übereinanderlegen von Trajektorien verschiedener Prozeßvorgänge für visuellen Vergleich und Analyse komplexer dynamischer VorgängeStep 3.3. Superimposing trajectories of different process operations for visual comparison and analysis of complex dynamic processes
Da auf einer Karte mehrerer Trajektorien übereinandergelegt werden können, kann man einen beliebigen Prozeßvorgang tu mit einem vorherigen Referenzvorgang tr visuell vergleichen. So lassen sich nicht nur einzelne Prozeßzustände, sondern auch komplexe Prozeßvorgänge miteinander vergleichen; Abweichungen werden sehr schnell erkannt. Damit ist eine ganzheitliche, visuelle Fehlerdetektion selbst für dynamische Kraftwerksvorgänge möglich.Since several trajectories can be superimposed on a map, one can visually compare any process t u with a previous reference process t r . In this way, not only individual process states, but also complex process processes can be compared; Deviations are recognized very quickly. This enables holistic, visual error detection even for dynamic power plant operations.
Fig. 4 zeigt ein Beispiel für zwei verschiedene Kesselfahrten, die schwarze Trajektorie tr entspricht einer 'guten' Referenzanfahrt, die weiße Trajektorie tu stellt hier einen Lastwechsel von 126 MW auf 95 MW dar. Die x-Achse gibt in den Fig. 4 die Anzahl der Neuronen in x-Richtung, die y-Achse die Anzahl der Neuronen in y-Richtung an. Die potentiellen Lastzustände der Anlage werden durch helle Cluster im Bild markiert. FIG. 4 shows an example for two different boiler trips, the black trajectory t r corresponds to a 'good' reference approach, the white trajectory t u here represents a load change from 126 MW to 95 MW. The x-axis in FIG. 4 shows the number of neurons in the x direction, the y axis the number of neurons in the y direction. The potential load conditions of the system are marked by bright clusters in the picture.
Um die Ursache für Abweichungen zwischen dem Verlauf von Trajektorien zu bestimmen, kann man die Gewichtsverteilung der einzelnen Neuronen analysieren, da in den Gewichten die realen Werte der Prozeßgrößen kodiert sind.In order to determine the cause of deviations between the course of trajectories, you can analyze the weight distribution of the individual neurons, because the real values of the process variables are coded in the weights.
Um das zu verdeutlichen, sollen beispielhaft die unterschiedlichen Gewichtsverteilungen zweier Neuronen herausgegriffen werden: Neuron 'N' ist im Anlagenraum virtuell im Zustand 28 MW plaziert, Neuron 'M' spricht auf den Lastzustand 130 MW an, ihre räumliche Lage auf der Karte ist in Fig. 4 als weiße Kreisfläche markiert.In order to illustrate this, the different weight distributions should serve as examples two neurons are picked out: Neuron 'N' is in the plant room placed virtually in the 28 MW state, neuron 'M' speaks to the 130 MW load state , their spatial position on the map is marked in Fig. 4 as a white circular area.
Fig. 5 stellt die Gewichtsverteilung dieser zwei Karten-Neuronen dar. Die x-Achse in Fig. 5 entspricht den Gewichten w1,w2,..,w11 der Neuronen 'N' und 'M', die y-Achse stellt die normierte Werte der einzelnen Gewichte dar. Man sieht, daß sich die Neuronen vor allem in ihren Gewichten w10, w2 und w3 unterscheiden. Mit einer Standardabweichungsberechnung bestätigt man das. FIG. 5 shows the weight distribution of these two map neurons. The x-axis in FIG. 5 corresponds to the weights w 1 , w 2 , .., w 11 of the neurons 'N' and 'M', the y-axis represent the normalized values of the individual weights. It can be seen that the neurons differ primarily in their weights w 10 , w 2 and w 3 . This is confirmed with a standard deviation calculation.
Diese berechneten Indizes - im Beispiel (10,2,3) - lassen sich nun eindeutig auf die jeweiligen Prozeßwerte abbilden, da es -bedingt durch das Lernverfahren-eine eindeutige Zuordnung zwischen den Gewichten und den einzelnen Prozeßgrößen gibt. Im Beispiel liegen die Unterschiede in den Prozeßgrößen: Frischdampfmenge Kesselaustritt, Speisewassermenge Kesseleintritt, Speisewasserdruck Kesseleintritt.These calculated indices - in the example (10,2,3) - can now be clearly assigned to the depict the respective process values, because - due to the learning process - a clear Assignment between the weights and the individual process variables there. In the example, the differences are in the process variables: live steam quantity, boiler outlet, Feed water quantity boiler inlet, feed water pressure boiler inlet.
Durch eine Berechnung des Korrelationskoeffizienten und der Standardabweichung
der Gewichtsverteilung ausgewählter (vom Operator angewählter) Neuronen, wird
die Prozeßanalyse ermöglicht. Der Operator kann somit on-line die Ursache zweier
beliebiger Abweichungen ermitteln, denn er braucht auf der Karte nur noch die Neuronen
'anklicken![]()
![]()
Schritt 5.1. Ein weiterer möglicher Verarbeitungsschritt auf der Karte führt zur Anwendung von DataMining-Strategien im Kraftwerksbereich, dabei werden die Gewichtsverteilungen einzelner Prozeßgrößen über die gesamte Karte dargestellt, die Figuren 6 und 7 verdeutlichen das an einem Beispiel. Da die Prozeßverteilung in den Gewichten der Neuronen auf der Karte kodiert ist und die Gewichtsverteilung über der Karte dargestellt werden kann, erhält man damit eine eindeutige Aussage über die Verteilung der realen Prozeßgrößen über der Map und damit eine Verteilung im Zustandsraum der Anlage.Step 5.1. Another possible processing step on the map leads to the use of data mining strategies in the power plant area, the weight distributions of individual process variables are shown over the entire map, FIGS. 6 and 7 illustrate this using an example. Since the process distribution in the weights of the neurons is coded on the map and the weight distribution can be shown on the map, this gives a clear statement about the distribution of the real process variables on the map and thus a distribution in the state space of the system.
Die graphische Umsetzung dieser Gewichtsverteilungen auf eine dreidimensionalen Darstellung erfolgt in der Form, daß jeweils die Größe des Gewichtes wk jedes Neurons in der z-Achse über der Karte in den x-y-Achsen aufgetragen und visualisiert wird. Fig. 6 zeigt die Verteilung der Speisewassertemperatur (z-Achse) über der Karte (x,y-Achse) und Fig. 7 stellt die Verteilung der Kohlezuteiler-Drehzahl (z-Achse) über der Karte (x,y-Achse) dar. The graphical conversion of these weight distributions to a three-dimensional representation takes place in such a way that the size of the weight w k of each neuron is plotted and visualized in the z-axis above the map in the xy-axes. Fig. 6 shows the distribution of the feed water temperature (z-axis) over the map (x, y-axis) and Fig. 7 shows the distribution of the coal feeder speed (z-axis) over the map (x, y-axis) .
Beim Vergleich dieser Verteilungen mit den dargestellten (realen) Anlagenzuständen auf der Karte (Cluster) lassen sich neuartige Hypothesen über die verschiedenen Anlagenzustände ermitteln.When comparing these distributions with the (real) system states shown On the map (cluster), new hypotheses can be made about the different Determine system status.
Schritt 5.2. Durch Anwendung der Methode zur statischen Visualisierung von Gewichtsdifferenzen (vgl. vorheriges Kapitel) für ausgewählte Prozeßgrößen lassen sich Zusammenhänge zwischen diesen Größen und vorhandenen Prozeßzuständen visualisieren, die nicht erkennbar wären, wenn die kompletten Gewichtsverteilungen ausgewertet würden.Step 5.2. By using the method for static visualization of weight differences (see previous chapter) for selected process variables there are correlations between these quantities and existing process states visualize that would not be recognizable if the complete weight distributions would be evaluated.
Mit den o.g. Verfahrensschritten lassen sich die Möglichkeiten der Prozeßanalyse entscheidend erweitern, denn damit ist es möglich neuartige Prozeßzusammenhänge nicht nur zu verifizieren, sondern neues, vorher nicht bekanntes Wissen zu erzeugen.With the above Process steps can be the possibilities of process analysis significantly expand, because it is possible to create new process relationships not just to verify, but to generate new, previously unknown knowledge.
Schritt 5.3. Durch eine graphische Extrapolation des Trajektorienverlaufs tu zu einem vorgebbaren Zeitpunkt to in einem vorgebbaren Zeitabschnitt Δt entlang des Referenzverlaufes tr auf einen zu erwartenden Prozeßzustand zu einem zweiten Zeitpunkt to+Δt, lassen sich zukünftige Prozeßwerte schätzen, indem die zum erwarteten Prozeßzustand gehörenden Prozeßwerte ermittelt und ausgegeben werden.Step 5.3. By means of a graphical extrapolation of the trajectory curve t u at a predeterminable time t o in a predeterminable time period Δt along the reference curve t r to an expected process state at a second point in time t o + Δt, future process values can be estimated by those belonging to the expected process state Process values are determined and output.
Bisher wurde die Abweichung zweier Trajektorien visuell ermittelt, d.h. der Operator muß die Karte während der zu untersuchenden Prozeßvorgänge beobachten. Um diesen Vorgang zu automatisieren, wird mit hierarchischen Karten gearbeitet. Eine nachgeschaltete Supervisor-Karte 'beobachtet' die Trajektorien auf der vorherigen Prozeßkarte und wertet diese aus. Fig. 8 zeigt das schematisch, die Prozeßkarte ist mit K1 und die Supervisor-Karte mit K2 benannt. T stellt eine beliebige Trajektorie auf der Prozeßkarte und W das dazugehörige Gewinnerneuron auf der Supervisor-Karte dar.So far, the deviation of two trajectories has been determined visually, ie the operator has to observe the map during the process processes to be examined. In order to automate this process, hierarchical maps are used. A downstream supervisor card 'observes' the trajectories on the previous process card and evaluates them. Fig. 8 shows this schematically, the process card is named K1 and the supervisor card is named K2. T represents any trajectory on the process card and W the associated winning neuron on the supervisor card.
Dabei werden die zu lernenden diskreten Trajektorienpositionen t1,t2, ... tm auf der
Prozeßkarte K1 in Datenvektoren der Dimension m kodiert und der Supervisor-Karte
K2 als Eingangsdaten zur Verfügung gestellt. Diese Supervisor-Karte arbeitet wieder
nach dem Algorithmus von Kohonen, d.h. das Lernen der topologischen Zusammenhänge
der Trajektorien auf der Prozeßkarte erfolgt durch Anwendung dieses Algorithmus
auf der Supervisor-Karte. Damit lernt die Supervisor-Karte die Trajektorienverläufe
auf der Prozeßkarte und es lassen sich folgende Funktionalitäten realisieren:
Die Supervisor-Karte realisiert damit eine weitere Dimensionsreduktion und zwar wird -wie beschrieben- ein Teilvorgang des Prozesses auf der Prozeßkarte als Trajektorienverlauf mit m diskreten Trajektorienpositionen dargestellt, auf der Supervisor-Karte wird dieser Trajektorienverlauf aber zu einem einzigen Neuron, und damit zu einem einzigen Punkt zusammengefaßt. Durch Anwendung des Lernverfahrens nach Kohonen bilden sich somit auf der Supervisor-Karte Neuronencluster heraus, die ähnlichen Trajektorienabschnitten auf der Prozeßkarte entsprechen.The supervisor card thus realizes a further dimensional reduction is - as described - a sub-process of the process on the process map as a trajectory shown with m discrete trajectory positions on the supervisor card but this trajectory course becomes a single neuron, and thus summarized in a single point. By applying the learning process According to Kohonen, neuron clusters are formed on the supervisor card, correspond to the similar trajectory sections on the process map.
In der Anwendungsphase der Supervisor-Karte wird der zu untersuchende Trajektorienabschnitt auf der Prozeßkarte - der wieder aus m diskreten Trajektorienpositionen bestehen muß - durch die Supervisor-Karte analysiert und auf Ähnlichkeit mit vorher gelernten Trajektorienabschnitten verglichen. Die Ähnlichkeit zeigt sich im Abstand des aktuellen Gewinnerneurons von den 'Supervisor'-Neuron für die jeweiligen vorher gelernten Trajektorienabschnitte. Dieser Abstand ist damit ein Maß für die Ähnlichkeit zweier Trajektorien- bzw. Teiltrajektorienverläufe.In the application phase of the supervisor card, the trajectory section to be examined is on the process map - again from m discrete trajectory positions must exist - analyzed by the supervisor card and for similarity with compared previously learned trajectory sections. The similarity is shown in the Distance of the current winner neuron from the 'supervisor' neuron for the respective previously learned trajectory sections. This distance is therefore a measure of the similarity of two trajectory or partial trajectory courses.
Ist der Abstand größer als ein einstellbarer Schwellwert, erkennt das Diagnosesystem automatisch, daß der aktuelle Trajektorienverlauf -der z.B. einen aktuellen Lastwechsel darstellen kann- von einem vorher gelernten Referenzverlauf abweicht. If the distance is greater than an adjustable threshold value, the diagnostic system recognizes automatically that the current trajectory course - e.g. a current one Can represent load changes - deviates from a previously learned reference curve.
Damit wird das System eine Fehlermeldung generieren und die Ursache der Trajektorienabweichung wird auf Grundlage des Verfahrensschritts 4 automatisch ermittelt, indem für die jeweiligen Trajektorienabweichungen die Ursachen berechnet werden, durch automatische Anlayse der Gewichtsverteilungen zugrundeliegender Neuronen.The system will then generate an error message and the cause of the trajectory deviation is automatically determined on the basis of method step 4, by calculating the causes for the respective trajectory deviations, through automatic analysis of the weight distribution of the underlying neurons.
Durch Anwendung dieses Verfahren wird einem Prozeßbeobachter und -bediener die Möglichkeit gegeben, selbst hochkomplexe dynamische Prozesse intuitiv zu erfassen und die Auswirkungen seiner Prozeßeingriffe unmittelbar zu beobachten. Da das Verfahren in der Anwendungsphase echtzeitfähig ist, kann diese Prozeßanalyse und Diagnose zur Unterstützung der on-line Prozeßführung verwendet werden.By using this method, a process observer and operator is given the opportunity to intuitively grasp even highly complex dynamic processes and to directly observe the effects of his process interventions. Since the process is real-time capable in the application phase , this process analysis and diagnosis can be used to support the online process management.
Der Vorteil des hier beschriebenen Verfahrens liegt daran, daß man nicht nur verschiedene Prozeßzustände miteinander vergleichen, sondern selbst komplexe und transiente Prozeßvorgänge wie komplette An -oder Abfahrten aufzeichnen und automatisch gegenüberstellen kann, damit kommt es zu einer leistungsfähigen Erweiterung gängiger Analysesysteme im Kraftwerksbereich. Das Verfahren stellt ein automatisiertes Diagnosesystem für transiente Kraftwerksvorgänge dar.The advantage of the method described here is because you not only various process states to compare, but to record even complex and transient process operations such as complete on -or runs and automatically face can so that there is a powerful extension of current analysis systems for power plants. The process represents an automated diagnostic system for transient power plant processes.
Ein weiterer Vorteil des Verfahrens liegt in dem geringen Engineering-Aufwand. Da das Lernen und Strukturieren der Karten und auch das Aufzeichnen der Trajektorien automatisiert erfolgt und vollständig durch das Verfahren erbracht wird, entfällt aufwendiges Engineering von Referenzmodellen. Dieses Engineering ist integraler Bestandteil des Verfahrens selbst.Another advantage of the process is the low engineering effort. There learning and structuring the maps and also recording the trajectories Automated and completely provided by the process, there is no need for time-consuming work Engineering of reference models. This engineering is more integral Part of the process itself.
Claims (11)
Applications Claiming Priority (2)
| Application Number | Priority Date | Filing Date | Title |
|---|---|---|---|
| DE19649633 | 1996-12-02 | ||
| DE19649633A DE19649633A1 (en) | 1996-12-02 | 1996-12-02 | Process for the analysis and representation of transient process processes |
Publications (2)
| Publication Number | Publication Date |
|---|---|
| EP0845720A1 true EP0845720A1 (en) | 1998-06-03 |
| EP0845720B1 EP0845720B1 (en) | 1999-11-17 |
Family
ID=7813205
Family Applications (1)
| Application Number | Title | Priority Date | Filing Date |
|---|---|---|---|
| EP97120787A Expired - Lifetime EP0845720B1 (en) | 1996-12-02 | 1997-11-27 | Method of analyzing and monitoring of transient processes |
Country Status (3)
| Country | Link |
|---|---|
| US (1) | US6321216B1 (en) |
| EP (1) | EP0845720B1 (en) |
| DE (2) | DE19649633A1 (en) |
Cited By (5)
| Publication number | Priority date | Publication date | Assignee | Title |
|---|---|---|---|---|
| ES2169009A1 (en) * | 2000-12-14 | 2002-06-16 | Alma Bioinformatics S L | Gene expression data self-organizing algorithm |
| DE102008027605A1 (en) | 2008-06-10 | 2010-01-14 | Intelligement Ag | System and method for computer-based analysis of large amounts of data |
| DE102008058016A1 (en) | 2008-11-19 | 2010-11-04 | Optiminig Gmbh | System and method for computer-based analysis of large amounts of data |
| EP2696251A2 (en) | 2012-08-07 | 2014-02-12 | Prüftechnik Dieter Busch AG | Method for monitoring rotating machines |
| CN107729985A (en) * | 2016-08-11 | 2018-02-23 | 西门子公司 | The method of the process exception of more preferable identification technology facility and corresponding diagnostic system |
Families Citing this family (15)
| Publication number | Priority date | Publication date | Assignee | Title |
|---|---|---|---|---|
| US6785736B1 (en) * | 2000-09-12 | 2004-08-31 | International Business Machines Corporation | Method and system for optimizing the network path of mobile programs |
| US20020123996A1 (en) * | 2001-02-06 | 2002-09-05 | O'brien Christopher | Data mining system, method and apparatus for industrial applications |
| GB0505396D0 (en) * | 2005-03-16 | 2005-04-20 | Imp College Innovations Ltd | Spatio-temporal self organising map |
| US20060247798A1 (en) * | 2005-04-28 | 2006-11-02 | Subbu Rajesh V | Method and system for performing multi-objective predictive modeling, monitoring, and update for an asset |
| US7536364B2 (en) * | 2005-04-28 | 2009-05-19 | General Electric Company | Method and system for performing model-based multi-objective asset optimization and decision-making |
| JP4201012B2 (en) * | 2006-04-06 | 2008-12-24 | ソニー株式会社 | Data processing apparatus, data processing method, and program |
| US20080161652A1 (en) * | 2006-12-28 | 2008-07-03 | Potts Steven J | Self-organizing maps in clinical diagnostics |
| US20080221395A1 (en) * | 2006-12-28 | 2008-09-11 | Potts Steven J | Self-organizing maps in clinical diagnostics |
| US8756180B2 (en) * | 2011-11-28 | 2014-06-17 | General Electric Company | Method and system for managing plant operation |
| US10229092B2 (en) | 2017-08-14 | 2019-03-12 | City University Of Hong Kong | Systems and methods for robust low-rank matrix approximation |
| JP7021052B2 (en) * | 2018-11-06 | 2022-02-16 | 株式会社東芝 | Product condition estimator |
| DE102019215016A1 (en) * | 2018-12-28 | 2020-07-02 | Robert Bosch Gmbh | Measuring arrangement, method for setting up a measuring arrangement and method for operating a measuring arrangement |
| CN110320880B (en) * | 2019-07-31 | 2021-03-02 | 翔创科技(北京)有限公司 | Livestock slaughtering line monitoring method, device and equipment |
| EP4060433A1 (en) * | 2021-03-19 | 2022-09-21 | Siemens Aktiengesellschaft | Method and system for predicting the operation of a technical system |
| CN113344137B (en) * | 2021-07-06 | 2022-07-19 | 电子科技大学成都学院 | SOM-based data fusion method and device, storage medium and electronic equipment |
Citations (4)
| Publication number | Priority date | Publication date | Assignee | Title |
|---|---|---|---|---|
| JPH05130737A (en) * | 1991-09-10 | 1993-05-25 | Toshiba Corp | Supervisory controller for power system |
| JPH0649515A (en) * | 1992-08-05 | 1994-02-22 | Kobe Steel Ltd | Furnace heat controller for blast furnace |
| US5448681A (en) * | 1992-03-27 | 1995-09-05 | National Semiconductor Corporation | Intelligent controller with neural network and reinforcement learning |
| WO1997014113A2 (en) * | 1995-10-13 | 1997-04-17 | Asoc Ag Associative Computing | Method of processing data at a semantic level using 2d or 3d visualisation |
Family Cites Families (15)
| Publication number | Priority date | Publication date | Assignee | Title |
|---|---|---|---|---|
| CA2012702A1 (en) * | 1989-04-10 | 1990-10-10 | Peter Breitkopf | Multispectral remote sensing of minerals using neural networks |
| SE463338B (en) * | 1989-06-14 | 1990-11-05 | Ludwik Liszka | SETTING TO MONITOR AND / OR DIAGNOSTIC CURRENT OPERATING CONDITIONS WITH COMPLIED MACHINES |
| US5222210A (en) * | 1990-12-03 | 1993-06-22 | Motorola, Inc. | Method of displaying the state of an artificial neural network |
| DE4132666A1 (en) * | 1991-10-01 | 1993-04-08 | Dieter Dr Vetterkind | Learning process network for modelling entire complex processes - contains network of metacellular automata, double Pteri network, evolutionary process moudle and diverse operators. |
| DE4200260A1 (en) * | 1992-01-08 | 1993-07-22 | Dieter W Dr Ing Vetterkind | Process evolution computer for physical and technological process modelling - uses meta-cellular automats to run model processes as basis for deriving system characteristics and operator action recommendations |
| JPH05342191A (en) * | 1992-06-08 | 1993-12-24 | Mitsubishi Electric Corp | System for predicting and analyzing economic time sequential data |
| US5353207A (en) * | 1992-06-10 | 1994-10-04 | Pavilion Technologies, Inc. | Residual activation neural network |
| CA2157198A1 (en) * | 1993-03-02 | 1994-09-15 | James David Keeler | Method and apparatus for analyzing a neural network within desired operating parameter constraints |
| SE9304246L (en) * | 1993-12-22 | 1995-06-23 | Asea Brown Boveri | Procedure for monitoring multivariate processes |
| DE19518804A1 (en) * | 1994-05-27 | 1995-12-21 | Fraunhofer Ges Forschung | Process control |
| US5625751A (en) * | 1994-08-30 | 1997-04-29 | Electric Power Research Institute | Neural network for contingency ranking dynamic security indices for use under fault conditions in a power distribution system |
| US5602886A (en) * | 1995-10-10 | 1997-02-11 | The University Of Chicago | Neural net controlled tag gas sampling system for nuclear reactors |
| JPH1063634A (en) * | 1996-04-05 | 1998-03-06 | Nec Corp | Method and device for time sequential prediction/ classification |
| US5809490A (en) * | 1996-05-03 | 1998-09-15 | Aspen Technology Inc. | Apparatus and method for selecting a working data set for model development |
| DE19637651A1 (en) * | 1996-09-16 | 1998-03-19 | Abb Patent Gmbh | Process visualization methods |
-
1996
- 1996-12-02 DE DE19649633A patent/DE19649633A1/en not_active Withdrawn
-
1997
- 1997-11-27 DE DE59700716T patent/DE59700716D1/en not_active Expired - Lifetime
- 1997-11-27 EP EP97120787A patent/EP0845720B1/en not_active Expired - Lifetime
- 1997-12-02 US US08/982,613 patent/US6321216B1/en not_active Expired - Lifetime
Patent Citations (4)
| Publication number | Priority date | Publication date | Assignee | Title |
|---|---|---|---|---|
| JPH05130737A (en) * | 1991-09-10 | 1993-05-25 | Toshiba Corp | Supervisory controller for power system |
| US5448681A (en) * | 1992-03-27 | 1995-09-05 | National Semiconductor Corporation | Intelligent controller with neural network and reinforcement learning |
| JPH0649515A (en) * | 1992-08-05 | 1994-02-22 | Kobe Steel Ltd | Furnace heat controller for blast furnace |
| WO1997014113A2 (en) * | 1995-10-13 | 1997-04-17 | Asoc Ag Associative Computing | Method of processing data at a semantic level using 2d or 3d visualisation |
Non-Patent Citations (7)
| Title |
|---|
| HIROYUKI MORI ET AL: "AN ARTIFICIAL NEURAL-NET BASED TECHNIQUE FOR POWER SYSTEM DYNAMIC STABILITY WITH THE KOHONEN MODEL", 7 May 1991, PROCEEDINGS OF THE POWER INDUSTRY COMPUTER APPLICATION CONFERENCE, BALTIMORE, MAY 7 - 10, 1991, NR. CONF. 17, PAGE(S) 293 - 301, INSTITUTE OF ELECTRICAL AND ELECTRONICS ENGINEERS, XP000294083 * |
| KOHONEN T: "THE SELF-ORGANIZING MAP", 1 September 1990, PROCEEDINGS OF THE IEEE, VOL. 78, NR. 9, PAGE(S) 1464 - 1480, XP000165407 * |
| NIEBUR D ET AL: "POWER SYSTEM STATIC SECURITY ASSESSMENT USING THE KOHONEN NEURAL NETWORK CLASSIFIER", 7 May 1991, PROCEEDINGS OF THE POWER INDUSTRY COMPUTER APPLICATION CONFERENCE, BALTIMORE, MAY 7 - 10, 1991, NR. CONF. 17, PAGE(S) 270 - 277, INSTITUTE OF ELECTRICAL AND ELECTRONICS ENGINEERS, XP000294080 * |
| PATENT ABSTRACTS OF JAPAN vol. 017, no. 511 (E - 1432) 14 September 1993 (1993-09-14) * |
| PATENT ABSTRACTS OF JAPAN vol. 018, no. 285 (C - 1206) 31 May 1994 (1994-05-31) * |
| RITTER H ET AL: "KOHONEN'S SELF-ORGANIZING MAPS: EXPLORING THEIR COMPUTATIONAL CAPABILITIES", 24 July 1988, PROCEEDINGS OF THE INTERNATIONAL CONFERENCE ON NEURAL NETWORKS, SAN DIEGO, JULY 24 - 27, 1988, NR. 1988, PAGE(S) 109 - 116, INSTITUTE OF ELECTRICAL AND ELECTRONICS ENGINEERS, XP000014740 * |
| WHITTINGTON G ET AL: "AN EFFICIENT MULTIPROCESSOR MAPPING ALGORITHM FOR THE KOHONEN FEATURE MAP AND ITS DERIVATIVE MODELS", 27 June 1994, INTERNATIONAL CONFERENCE ON NEURAL NETWORKS/ WORLD CONGRESS ON COMPUTATIONAL INTELLIGENCE, ORLANDO, JUNE 27 - 29, 1994, VOL. 1, PAGE(S) 17 - 21, INSTITUTE OF ELECTRICAL AND ELECTRONICS ENGINEERS, XP000510384 * |
Cited By (8)
| Publication number | Priority date | Publication date | Assignee | Title |
|---|---|---|---|---|
| ES2169009A1 (en) * | 2000-12-14 | 2002-06-16 | Alma Bioinformatics S L | Gene expression data self-organizing algorithm |
| WO2002048963A1 (en) * | 2000-12-14 | 2002-06-20 | Alma Bioinformatics, S.L. | Gene expression data self-organizing algorithm |
| DE102008027605A1 (en) | 2008-06-10 | 2010-01-14 | Intelligement Ag | System and method for computer-based analysis of large amounts of data |
| DE102008058016A1 (en) | 2008-11-19 | 2010-11-04 | Optiminig Gmbh | System and method for computer-based analysis of large amounts of data |
| EP2696251A2 (en) | 2012-08-07 | 2014-02-12 | Prüftechnik Dieter Busch AG | Method for monitoring rotating machines |
| DE102012015485A1 (en) | 2012-08-07 | 2014-05-15 | Prüftechnik Dieter Busch AG | Method for monitoring rotating machines |
| CN107729985A (en) * | 2016-08-11 | 2018-02-23 | 西门子公司 | The method of the process exception of more preferable identification technology facility and corresponding diagnostic system |
| CN107729985B (en) * | 2016-08-11 | 2021-03-09 | 西门子公司 | Method for detecting process anomalies in a technical installation and corresponding diagnostic system |
Also Published As
| Publication number | Publication date |
|---|---|
| US6321216B1 (en) | 2001-11-20 |
| DE59700716D1 (en) | 1999-12-23 |
| DE19649633A1 (en) | 1998-06-04 |
| EP0845720B1 (en) | 1999-11-17 |
Similar Documents
| Publication | Publication Date | Title |
|---|---|---|
| EP0845720B1 (en) | Method of analyzing and monitoring of transient processes | |
| EP1330685B1 (en) | Testing method and testing device for starting up systems which are controlled by means of a program logic | |
| DE4008510C2 (en) | Control device with optimal decision unit | |
| EP1020815A2 (en) | Apparatus and method for automatic diagnosis of a technical system with efficient reuse of information | |
| WO1996014609A1 (en) | Process for analysing process data in an industrial plant | |
| EP3232282B1 (en) | Diagnostic device and method for monitoring the operation of a technical plant | |
| EP0789864B1 (en) | Monitoring system for an industrial plant | |
| EP2112568A2 (en) | Method for computer-supported control and/or regulation of a technical system | |
| DE19734947B4 (en) | Method for controlling process operations | |
| EP2414903A1 (en) | Device and method for creating a process model | |
| EP0875808A2 (en) | Method and system for generating a process model of a technical installation | |
| WO2020187591A1 (en) | Method and device for controlling a robot | |
| EP0829809B1 (en) | Method for process-visualization | |
| DE112019007889T5 (en) | MACHINING PROGRAM CONVERSION DEVICE, NUMERICAL CONTROL DEVICE AND MACHINING PROGRAM CONVERSION METHOD | |
| WO2002010866A2 (en) | Method for the remote diagnosis of a technological process | |
| EP0838054B1 (en) | Graphic control process and device for controlling operations in a network management system | |
| AT522639B1 (en) | Device and method for visualizing or assessing a process status | |
| DE10146901A1 (en) | Method and system for processing error hypotheses | |
| EP4193227A1 (en) | Device and method for identifying anomalies in an industrial system for carrying out a production process | |
| DE4308194A1 (en) | Fuzzy standard automation system for industrial plants | |
| EP4060433A1 (en) | Method and system for predicting the operation of a technical system | |
| DE19742906A1 (en) | Optimizing products and their production processes by neural analysis | |
| DE102019131613A1 (en) | Method for operating an electronic computing device for a product development process using machine learning, as well as electronic computing device | |
| DE102022214233B3 (en) | Determining the similarity of traffic scenes to improve machine learning systems or algorithms for trajectory prediction or maneuver planning for automated vehicles | |
| DE19748527A1 (en) | Simulation modelling method for hydraulic or electric circuit e.g. of motor |
Legal Events
| Date | Code | Title | Description |
|---|---|---|---|
| PUAI | Public reference made under article 153(3) epc to a published international application that has entered the european phase |
Free format text: ORIGINAL CODE: 0009012 |
|
| AK | Designated contracting states |
Kind code of ref document: A1 Designated state(s): DE FR GB |
|
| AX | Request for extension of the european patent |
Free format text: AL;LT;LV;MK;RO;SI |
|
| 17P | Request for examination filed |
Effective date: 19980713 |
|
| 17Q | First examination report despatched |
Effective date: 19981016 |
|
| AKX | Designation fees paid |
Free format text: DE FR GB |
|
| RBV | Designated contracting states (corrected) |
Designated state(s): DE FR GB |
|
| GRAG | Despatch of communication of intention to grant |
Free format text: ORIGINAL CODE: EPIDOS AGRA |
|
| GRAG | Despatch of communication of intention to grant |
Free format text: ORIGINAL CODE: EPIDOS AGRA |
|
| GRAH | Despatch of communication of intention to grant a patent |
Free format text: ORIGINAL CODE: EPIDOS IGRA |
|
| GRAH | Despatch of communication of intention to grant a patent |
Free format text: ORIGINAL CODE: EPIDOS IGRA |
|
| GRAA | (expected) grant |
Free format text: ORIGINAL CODE: 0009210 |
|
| AK | Designated contracting states |
Kind code of ref document: B1 Designated state(s): DE FR GB |
|
| REF | Corresponds to: |
Ref document number: 59700716 Country of ref document: DE Date of ref document: 19991223 |
|
| GBT | Gb: translation of ep patent filed (gb section 77(6)(a)/1977) |
Effective date: 19991206 |
|
| ET | Fr: translation filed | ||
| PLBE | No opposition filed within time limit |
Free format text: ORIGINAL CODE: 0009261 |
|
| STAA | Information on the status of an ep patent application or granted ep patent |
Free format text: STATUS: NO OPPOSITION FILED WITHIN TIME LIMIT |
|
| 26N | No opposition filed | ||
| REG | Reference to a national code |
Ref country code: GB Ref legal event code: IF02 |
|
| REG | Reference to a national code |
Ref country code: GB Ref legal event code: 732E |
|
| REG | Reference to a national code |
Ref country code: FR Ref legal event code: TP |
|
| REG | Reference to a national code |
Ref country code: DE Ref legal event code: R081 Ref document number: 59700716 Country of ref document: DE Owner name: TECDATA AG, CH Free format text: FORMER OWNER: OTTE, RALF, DR., 69469 WEINHEIM, DE Effective date: 20110823 |
|
| PGFP | Annual fee paid to national office [announced via postgrant information from national office to epo] |
Ref country code: GB Payment date: 20131122 Year of fee payment: 17 Ref country code: DE Payment date: 20131126 Year of fee payment: 17 Ref country code: FR Payment date: 20131119 Year of fee payment: 17 |
|
| REG | Reference to a national code |
Ref country code: DE Ref legal event code: R119 Ref document number: 59700716 Country of ref document: DE |
|
| GBPC | Gb: european patent ceased through non-payment of renewal fee |
Effective date: 20141127 |
|
| REG | Reference to a national code |
Ref country code: FR Ref legal event code: ST Effective date: 20150731 |
|
| PG25 | Lapsed in a contracting state [announced via postgrant information from national office to epo] |
Ref country code: GB Free format text: LAPSE BECAUSE OF NON-PAYMENT OF DUE FEES Effective date: 20141127 Ref country code: DE Free format text: LAPSE BECAUSE OF NON-PAYMENT OF DUE FEES Effective date: 20150602 |
|
| PG25 | Lapsed in a contracting state [announced via postgrant information from national office to epo] |
Ref country code: FR Free format text: LAPSE BECAUSE OF NON-PAYMENT OF DUE FEES Effective date: 20141201 |