EP0959427A2 - Method and apparatus for object recognition - Google Patents
Method and apparatus for object recognition Download PDFInfo
- Publication number
- EP0959427A2 EP0959427A2 EP99303611A EP99303611A EP0959427A2 EP 0959427 A2 EP0959427 A2 EP 0959427A2 EP 99303611 A EP99303611 A EP 99303611A EP 99303611 A EP99303611 A EP 99303611A EP 0959427 A2 EP0959427 A2 EP 0959427A2
- Authority
- EP
- European Patent Office
- Prior art keywords
- curvature
- local
- surface portion
- steps
- basis
- Prior art date
- Legal status (The legal status is an assumption and is not a legal conclusion. Google has not performed a legal analysis and makes no representation as to the accuracy of the status listed.)
- Withdrawn
Links
Images


Classifications
-
- G—PHYSICS
- G06—COMPUTING; CALCULATING OR COUNTING
- G06V—IMAGE OR VIDEO RECOGNITION OR UNDERSTANDING
- G06V10/00—Arrangements for image or video recognition or understanding
- G06V10/40—Extraction of image or video features
- G06V10/42—Global feature extraction by analysis of the whole pattern, e.g. using frequency domain transformations or autocorrelation
- G06V10/431—Frequency domain transformation; Autocorrelation
-
- G—PHYSICS
- G06—COMPUTING; CALCULATING OR COUNTING
- G06V—IMAGE OR VIDEO RECOGNITION OR UNDERSTANDING
- G06V20/00—Scenes; Scene-specific elements
- G06V20/60—Type of objects
- G06V20/68—Food, e.g. fruit or vegetables
Definitions
- the present invention relates to the field of optical object recognition, and more particularly to the use of local radii of curvatures to identify products and materials.
- Bar-code readers are used extensively in the retail grocery industry at checkout stations to identify tagged items affixed with bar-code tags.
- An item is identified by means of its bar-code using a data base stored in a host computer.
- a description of the item and its price are printed on a grocery receipt and an ongoing price total is kept as additional items are scanned.
- the use of bar-code readers has generally been well received by the public, due in part, to the reliability and reduced time spent in the checkout line.
- a reliable system is needed to identify items for which it is undesirable to attach bar-code labels, for example, fresh produce, such as fruits and vegetables.
- U.S. Patent No. 5,546,475 issued to Bolle et al. and assigned to IBM Corp. discloses a device that uses image processing to recognize objects within a scene.
- the prior art image processing device takes a first image at a high illumination level and a second image at a lower illumination level by using a controlled illumination source.
- a segmentation routine separates the background image from the object image by comparing the two images.
- Feature extraction is performed on the processed image and compared against stored reference images.
- shape is used as a recognition feature, where local boundary curvatures are used for the shape measurements.
- a disadvantage of this prior art device is that direct curvature information is not available since the device illuminates and captures images of the entire object. The curvature information is then derived from the available grey scale information. Since the grey scale information is directly related to the intensity levels captured by the camera, color variations in the objects make it difficult to determine accurate and consistent curvature information. A further drawback is that the intensity is also affected by the orientation of the object. As a result, an object recognition system is required that is independent of the varying characteristics of the object.
- the present invention is a method and a system that increases the accuracy and reliability of object recognition by analyzing distributions of local radii of curvatures to determine the unknown object.
- the system provides optical recognition of products that do not readily lend themselves to standard labeling techniques.
- the system can be employed with, and is integratable with, retail checkout systems which use bar code reader technology.
- the resulting combination provides a system which processes both labeled and non-labeled products reliably and accurately.
- a surface portion of an object is illuminated with a pattern of light that permits the extraction of three dimensional coordinates for a set of points on the surface portion of the object.
- An image data set of the surface portion of the object is then captured with a capture device that is positioned at an angular offset with respect to a source of the light. That is, the combination of the light pattern and the imaging device together generate a two dimensional captured image, from which it is possible to extract the three dimensional coordinates for the set of points on the surface portion of the object.
- An exemplary embodiment of such a light pattern may consist of a series of separately identifiable arcs projected on the surface portion of the object.
- a set of local radii of curvatures are then determined for a set of selected data points in the image data set.
- a spectrum representing a distribution of the curvatures is then computed for the set of local radii of curvatures. If the image data set is for the generation of a library of spectra, it is processed with other spectra of curvatures to form a reference library of known objects. If the image data set is for an unknown object, then it is compared against the reference library of known objects to make an identification.
- the method of the present invention provides three-dimensional curvature measurements because the angle between the light source and the capture device has the effect of making the reflected patterned light look curved. Moreover, the method is independent of object variations and object orientation since the library of spectra generally includes curvature distributions reflecting potential orientations of the objects. The amount of computer memory required is not significantly increased because basis functions and basis coefficients permit low dimensional representation and expansion of the spectra. Importantly, the present invention has to maintain only a fraction of the original data to make the required identification.
- the present invention product identifier an advantageous and practical solution for use at supermarket checkout counters to identify fresh produce, such as fruits and vegetables, which are not readily identifiable with a bar-code label.
- the product to be identified could be sitting on a scale and its weight could be measured during the identification process.
- the name and price of the item would be printed on a grocery receipt using the item identification, along with the weight and the price per pound which had been previously stored.
- the illustrative embodiment of the present invention is presented as comprising individual functional blocks (including functional blocks labeled as “controllers” and “processors”).
- the functions these blocks represent may be provided through the use of either shared or dedicated hardware, including, but not limited to, hardware capable of executing software.
- processors and controllers presented in Figures 1-2 may be provided by a single shared processor.
- controller or “processor” should not be construed to refer exclusively to hardware capable of executing software.
- Illustrative embodiments may comprise microprocessor and/or digital signal processor (“DSP”) hardware, read-only memory (“ROM”) for storing software performing the operations discussed below, and random access memory (“RAM”) for storing results.
- DSP digital signal processor
- ROM read-only memory
- RAM random access memory
- VLSI Very large scale integration
- the present invention provides a practical solution for use at supermarket checkout counters to identify fresh produce, such as fruits and vegetables, which are not readily identifiable with a bar-code label. Moreover, the product to be identified could be sitting on a scale and its weight could be measured during the identification process. In a similar manner to grocery items containing bar-code labels, the name and price of the item would be printed on a grocery receipt using the item identification, along with the weight and the price per pound which had been previously stored. As such, the present invention can be employed with, and is integratable with, retail checkout systems which use bar code reader technology. The resulting combination provides a system which processes both labeled and non-labeled products reliably and accurately. Although the present invention is discussed, in part, with respect to the identification of produce, it is implementable in any situation where bulk items are sold, for example, hardware stores.
- the present invention is a method and a system that accomplishes object recognition by analyzing distributions of local radii of curvatures to identify an unknown object.
- a pattern of light is applied to a surface portion of an object and a two dimensional image is captured by an imaging device that is positioned at angle with respect to a source of the light.
- the combination of the patterned light and offset imaging device permits extraction of three dimensional coordinates for a set of data points on the surface portion of the object from the two dimensional captured image.
- the method determines a set of local radii of curvatures for the selected data points in the data set and generates a spectrum representing a distribution of the local radii of curvatures. Specifically, the distributions indicate the mean and Gaussian curvatures for each of the selected data points.
- spectra of multiple objects along with their multiple orientations are compiled. These spectra are then processed with a dimension reduction analysis to determine a single set of basis functions representing all of the objects and a corresponding set of basis coefficients for each different type of object. If the data set is for an unknown object, then the unclassified spectra is expanded in a basis, resulting in a set of coefficients. This latter set is then statistically compared with the reference library of spectra to identify the product or at least designate the closest known products.
- Object recognition system 100 which utilizes the methods of the present invention to recognize and identify objects utilizing distributions or spectra of local radii of curvatures.
- Object recognition system 100 includes a source 110 for generating a pattern of light that permits extraction of three dimensional coordinates of object 150.
- Object recognition system 100 further includes a light capture device 120 that is positioned with respect to source 110 such that the direction of illumination and the direction of image capture are different and separated by a given angle.
- source 110 and light capture device 120 have an angular offset of 45°.
- Object recognition system 100 also includes a processor 140 that performs the analysis described below on the image data set received from light capture device 130.
- a controller 130 is coupled between processor 140 and source 110 and light capture device 120 to control the operation of the latter two devices.
- a user will place object 150 in an illumination path 160 of source 110.
- Source 110 then illuminates a spot on object 150 such that the reflected patterned light 170 provides a reasonable picture of the curvature and roughness of object 150.
- object 150 is not completely illuminated by source 110. Complete illumination of object 150 introduces the problem of segmentation into the analysis and more importantly, makes it very difficult to obtain curvature information.
- the size of the spot or surface portion illuminated by source 110 is nominally related to the size of object 150.
- Source 110 can be implemented using laser diodes to provide spot illumination.
- controller 130 controls source 110 to vary the size of the beam illuminating object 150.
- a standard spot size is selected to correspond to the smallest potential object that is to be identified by object recognition system 100. Alternatively, a range of sizes can be used.
- the angular offset between source 110 and light capture device 120 has the effect of providing three-dimensional information from a two-dimensional image when light that is transmitted in a first direction, is received in a second direction. For example, if the light is reflected from a flat surface, it will still look like a straight line. However, if the light is reflected from a sphere, then an arc is generated that has a local radius of curvature.
- light capture device 120 is implementable using a simple black and white camera to capture the two-dimensional image. Other devices can be used such as a color camera.
- source 110 must illuminate object 150 in such a manner that reflected patterned light 170 has a curved appearance, e.g., in the form of arcs.
- the pattern of light captured by light capture device 120 should permit extraction of three dimensional coordinates from the two dimensional image. This is achievable by illuminating object 150 with for example, a set of parallel light planes extending in a vertical direction, in a horizontal direction, in a diagonal direction, with a series of "x"s or with a grid type pattern.
- the number of lines or marks in either implementation is a trade-off between the level of accuracy required and in the amount of time required to complete the entire analysis for the selected number of lines.
- the number of lines is nominally between 5 and 10.
- the size of the lines would, of course, be controlled by the illumination spot size.
- light capture device 120 captures an image of the spot in question.
- processor 140 then generates local radii of curvatures corresponding to the selected data points in the image, where the selected data points are either inherently provided by the light pattern (i.e., the grid) or are interpolated by processor 140 using interpolation techniques (i.e., for the set of parallel lines).
- source 210 outputs a pattern of light onto a spot on unknown object 250.
- a light capture device 220 captures an image of the patterned light reflected from object 250 and forwards an electronic representation of the unknown image data set to processor 240.
- the unknown image data set is transferred through a controller 230.
- the analog signals from light capture device 220 are first converted to digital signals using a digitizer 260 and then analyzed by processor 240.
- digitizer 260 can be implemented as an analog-to-digital converter that may be included as part of processor 240 or as part of controller 230.
- the unknown image data set sent to processor 240 consists essentially of two dimensional data points representing the surface portion of object 250, from which three dimensional coordinates can be extracted. As described below, processor 240 analyzes a set of selected data points and determines a local radius of curvature for each selected data point. In FIG. 2, selectable data points are represented by "x"s. The resulting local radii of curvatures are then compiled using a smoothed, bivariate (or a transformed version such as log f(x)) histogram to generate an unknown spectrum 265, that represents a distribution of the local radii of curvatures.
- Sets of known spectra from like identifiable objects determine library of known spectra 275, and the unknown spectrum 265 is compared with the library of known spectra 275 using comparison processor 270.
- the library of known spectra 275 are created from the same type image capture data input to processor 240, but from known objects.
- processor 240 For each member of the library 275, an operator uses processor 240 to provide an electronic label such as "Macintosh Apple" and a price per unit weight. The operator then uses processor 240 to group and characterize individual spectrum from the known product into library 275.
- comparison processor 270 compares the unknown spectrum 265 with library of known spectra 50 utilizing statistical techniques. Comparison processor 270 takes into account how much the known spectra for a single item vary from one another in addition to storing the average spectrum. In an exemplary embodiment of this invention, spectra are obtained from multiple orientations of the object with respect to light source 210, for example, a top end, a bottom end, and a side for a piece of fruit. Comparison processor 270 then computes the most likely match for the single unknown spectrum or the set of unknown spectra and also calculates an indicator of the closeness of the match, e.g., a "distance" in a mathematical space or a probability value.
- an indicator of the closeness of the match e.g., a "distance" in a mathematical space or a probability value.
- Comparison processor 270 may also provide the next most likely possible matches and their probabilities.
- processor 240 may be coupled to a display device 285, which is in turn coupled to an input device/control input 290, such as a touch screen or keyboard for making operator selections.
- input device/control input 290 such as a touch screen or keyboard for making operator selections.
- display 285 and input device 290 may also be part of an existing cash register/checkout system, or alternatively that the system may be automated.
- display 285 reads out a list of possible matches in rank order that have a probability of match greater than a predetermined threshold, for example, greater than 80% probability.
- a predetermined threshold for example, greater than 80% probability.
- An operator may check that the first listed item is correct and either accept the first choice or indicate the correct choice using input device 290.
- the system could immediately accept the first choice, as in a fully automatic (unmanned) check-out system with a conveyor belt.
- the object to be identified would be sitting on a scale and its weight would also be measured as part of the identification process.
- the scale and optical recognition system 100 can be coupled to the processor 140 or 240 in order to transfer electrical data for processing.
- a total price for the identified item(s) can be computed using the weight and a previously stored price/unit figure.
- the name and price of the produce item just identified could be printed on a grocery receipt using the item description, the weight, and the price per pound which was previously stored in the database.
- FIG. 3 there is presented a more detailed flowchart 300 of the methodology of the present invention.
- a spectrum in the form of signals
- Construction of the library is therefore initially explained, followed by how the unknown spectrum is identified using the library in conjunction with the statistical comparison techniques.
- f denote one such smooth, bivariate surface.
- This type of expansion or dimension reduction means that we only have to store the coefficient ⁇ 1,..., ⁇ j for each of f , and not the whole function.
- the basis functions themselves are selected either because 1) they allow faithful representation of all the smooth surfaces in the library (that is, each f can be taken and expand as above and obtain get a good approximation) or 2) the expansion gives good classification performance.
- LDA linear discriminant analysis
- a transformation is obtained which can be applied to the coefficient vectors and permits use of nearest neighbor or non-negative least squares to perform the classification.
- penalized discriminant analysis is employed to both create the basis functions and determine the coefficients which are ultimately applied with the nearest neighbor classifier or the non-negative least square procedure.
- PDA is applied to the functions f ).
- image data set 310 represents the three dimensional coordinates of a set of data points on the surface of the object.
- the method analyzes a set of selected data points, for example, the selected data point can correspond to the "x"s in FIG. 2. These selected data points are then the basis from which the local radii of curvatures are computed. For example, if a 10x10 grid is used as light pattern, there could be 100 data points. As described below, each selected data point conveys curvature information about a subset of data points, where the selected data point is the central data point. This type of analysis conveys information regarding the smoothness or roughness of the object. The method also analyzes groups of selected data points, that is across a specific line, to convey information regarding the size of the object.
- the method analyzes the selected data points in various lengths. For each length of selected data points analyzed, a local radius of curvature is generated. These multiple curvatures are then compiled via a smoothed histogram to produce a spectrum representing a distribution of the local radii of curvatures.
- a number M of data points is selected from image data set 310.
- the selected neighborhood N i is rotated so that the outward normal to the surface of the object at the point x i is aligned vertically (step 320).
- the mean curvature is equal to 2*(e+f) and conveys information regarding the size of the object.
- the Gaussian curvature is equal to 4 *( e * f ) - d 2 and conveys information regarding the existence of saddle points in an object, such as a cucumber.
- smoothed, bivariate densities describing the mean and Gaussian curvatures are generated from an initial set of histograms (step 335). That is, a spectrum representing a distribution of the local radii of curvatures for the object are produced.
- Steps 310 through 335 are repeated for each object that is to be recognized by the system and moreover, curvature information is determined for multiple orientations of each object. This ensures that the present invention is independent of object orientation. FIGs.
- FIG. 4A-4E show spectra of mean curvature for a lemon, avocado, apple and orange. Specifically, FIG. 4A shows how the spectra differ for each different type of produce.
- FIGs. 5A-5C show spectra of Gaussian curvature v. mean curvature for an avocado and orange, respectively.
- FIG. 5A shows the differences between the two noted produce.
- the method of the present invention then derives a set of basis functions from the compiled set of spectra (step 340).
- the basis function analysis is performed on the mean curvature distribution, the Gaussian curvature distribution, on the joint distribution or a transformed version thereof.
- the number of basis functions generated is based on the desired accuracy of classification. Importantly, once the set of basis functions has been generated, it is the same for all categories of products.
- Corresponding to the set of basis functions is a set of basis coefficients, where a particular set of basis coefficients together with the basis functions represents one orientation of a specific object.
- the present invention needs to store only a given number of basis functions for all object categories and a corresponding set of basis coefficients for each measured object orientation.
- the number of basis functions to be extracted from the data depends upon how many are required to give good classifications of unknown objects without affecting the processing speed (i.e., a large set of basis functions is not desired).
- the basis functions and coefficients can be generated using a number of dimension reduction techniques.
- One method for generating the basis functions and coefficients is to use Fisher's linear discriminant analysis (“LDA”), which finds a low dimensional projection of the data such that in the resulting space, the ratio of between-category variation and within-category variation is the largest.
- LDA Fisher's linear discriminant analysis
- PDA penalized discriminant analysis
- the reference library stores one set of basis functions for all of the objects (with different orientations) to be identified, a corresponding set of basis coefficients for each object (with different orientations), and a label for each object (step 345).
- the unclassified set of basis coefficients is stored (step 385) and compared against the reference library (step 390) using one of several statistical classification techniques.
- the dimension reduction techniques discussed above are intended to make the job of classifying an unknown spectra more efficient by designing a reduced space in which J categories are separated as much as possible.
- Two classifying procedures: the nearest neighbor rule and the non-negative least squares methods are discussed below.
- Other statistical approaches can also be used to classify the unknown spectrum.
- the present invention optical recognition system may be implemented to recognize any item of commerce from which a local radius of curvature can be measured.
- the comparison results are then displayed to the user of the optical recognition system.
- the display can show a ranked order list of possible matches that have a probability of match greater than a predetermined threshold, for example, greater than 80% probability.
- a cashier could check that the first listed item is correct and either accept the first choice or indicate the correct choice using a supplied input device. The cashier could also indicate to the system to repeat the identification process. Alternatively, the system could immediately accept the first choice, as in a fully automatic (unmanned) check-out system.
- the outcome of the classification process could be combined with spectroscopic methods of characterizing the same objects.
- the outcome of the comparison analysis can be potentially re-ordered as a result of the color identification process. This could be done on a weighted or non-weighted basis, depending upon the relative accuracy of both the color and shape identification processes.
Abstract
A method and system for optically recognizing an object from a reference library
of known products based on a spectrum of local radius of curvature of the object. A
surface portion of an object is illuminated with a pattern of light that permits the
extraction of three dimensional coordinates for a set of points on the surface portion of
the object. An image data set of the surface portion of the object is then captured with a
capture device that is positioned at an angular offset with respect to a source of the light.
That is, the combination of the light pattern and the imaging device together generate a
two dimensional captured image, from which it is possible to extract the three
dimensional coordinates for the set of points on the surface portion of the object. A set
of local radii of curvatures are then determined for selected data points in the image data
set. A spectrum representing a distribution of the curvatures is then computed for the set
of local radii of curvatures. If the data set is for the generation of a library of spectra, it is
processed with a dimension reduction analysis to determine a single set of basis functions
representing all of the objects and a corresponding set of basis coefficients for each
different type of object. If the data set is for an unknown object, then the dimension
reduction analysis and the basis functions are applied to the data set to generate an
unidentified set of basis coefficients. This latter set is then statistically compared with the
reference library of spectra to identify the product or at least designate the closest known
products.
Description
- The present invention relates to the field of optical object recognition, and more particularly to the use of local radii of curvatures to identify products and materials.
- Bar-code readers are used extensively in the retail grocery industry at checkout stations to identify tagged items affixed with bar-code tags. An item is identified by means of its bar-code using a data base stored in a host computer. Typically, a description of the item and its price are printed on a grocery receipt and an ongoing price total is kept as additional items are scanned. The use of bar-code readers has generally been well received by the public, due in part, to the reliability and reduced time spent in the checkout line. However, a reliable system is needed to identify items for which it is undesirable to attach bar-code labels, for example, fresh produce, such as fruits and vegetables.
- The use of optical devices to characterize and recognize fresh produce has been explored to some extent in the prior art. Some general considerations involved in the optical identification of these products are discussed in a number of publications, including for example, "Postharvest Handling: A Systems Approach", by R.L. Shewfelt and S.E. Prussia (Academic Press, New York). An example of a particular application of produce recognition is a study by L. Bochereau et al. (J. Agric. Eng. Res. (1992) Vol. 51, 207-216) showing that near infrared spectra can be used to determine the quality of golden delicious apples, provided that a careful neural-network analysis is performed in the wavelength range from 1,000 to 1,500 nm.
- Specifically, a number of devices are disclosed in the prior art for recognizing products using image processing techniques. For example, U.S. Patent No. 5,546,475 issued to Bolle et al. and assigned to IBM Corp., discloses a device that uses image processing to recognize objects within a scene. The prior art image processing device takes a first image at a high illumination level and a second image at a lower illumination level by using a controlled illumination source. A segmentation routine separates the background image from the object image by comparing the two images. Feature extraction is performed on the processed image and compared against stored reference images. In one embodiment, shape is used as a recognition feature, where local boundary curvatures are used for the shape measurements.
- A disadvantage of this prior art device is that direct curvature information is not available since the device illuminates and captures images of the entire object. The curvature information is then derived from the available grey scale information. Since the grey scale information is directly related to the intensity levels captured by the camera, color variations in the objects make it difficult to determine accurate and consistent curvature information. A further drawback is that the intensity is also affected by the orientation of the object. As a result, an object recognition system is required that is independent of the varying characteristics of the object.
- The present invention is a method and a system that increases the accuracy and reliability of object recognition by analyzing distributions of local radii of curvatures to determine the unknown object. The system provides optical recognition of products that do not readily lend themselves to standard labeling techniques. Importantly, the system can be employed with, and is integratable with, retail checkout systems which use bar code reader technology. The resulting combination provides a system which processes both labeled and non-labeled products reliably and accurately.
- In an exemplary embodiment of the present invention, a surface portion of an object is illuminated with a pattern of light that permits the extraction of three dimensional coordinates for a set of points on the surface portion of the object. An image data set of the surface portion of the object is then captured with a capture device that is positioned at an angular offset with respect to a source of the light. That is, the combination of the light pattern and the imaging device together generate a two dimensional captured image, from which it is possible to extract the three dimensional coordinates for the set of points on the surface portion of the object. An exemplary embodiment of such a light pattern may consist of a series of separately identifiable arcs projected on the surface portion of the object. A set of local radii of curvatures are then determined for a set of selected data points in the image data set. A spectrum representing a distribution of the curvatures is then computed for the set of local radii of curvatures. If the image data set is for the generation of a library of spectra, it is processed with other spectra of curvatures to form a reference library of known objects. If the image data set is for an unknown object, then it is compared against the reference library of known objects to make an identification.
- Advantageously, the method of the present invention provides three-dimensional curvature measurements because the angle between the light source and the capture device has the effect of making the reflected patterned light look curved. Moreover, the method is independent of object variations and object orientation since the library of spectra generally includes curvature distributions reflecting potential orientations of the objects. The amount of computer memory required is not significantly increased because basis functions and basis coefficients permit low dimensional representation and expansion of the spectra. Importantly, the present invention has to maintain only a fraction of the original data to make the required identification.
- The above factors make the present invention product identifier an advantageous and practical solution for use at supermarket checkout counters to identify fresh produce, such as fruits and vegetables, which are not readily identifiable with a bar-code label. Moreover, the product to be identified could be sitting on a scale and its weight could be measured during the identification process. In a similar manner to grocery items containing bar-code labels, the name and price of the item would be printed on a grocery receipt using the item identification, along with the weight and the price per pound which had been previously stored.
- For a better understanding of the present invention, reference may be had to the following description of exemplary embodiments thereof, considered in conjunction with the accompanying drawings, in which:
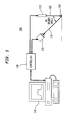
- FIG. 1 shows one preferred embodiment of the present invention optical recognition system;
- FIG. 2 shows a block diagram for one preferred embodiment of the present invention optical recognition system;
- FIG. 3 is a functional flowchart of the methodology of the present invention;
- FIGs. 4A-4E show plots of mean curvatures for a variety of objects in accordance with the methodology of the present invention; and
- FIGs. 5A-5C show plots of Gaussian curvatures v. mean curvatures for a variety of objects in accordance with the methodology of the present invention.
-
- For clarity of explanation, the illustrative embodiment of the present invention is presented as comprising individual functional blocks (including functional blocks labeled as "controllers" and "processors"). The functions these blocks represent may be provided through the use of either shared or dedicated hardware, including, but not limited to, hardware capable of executing software. For example the functions of processors and controllers presented in Figures 1-2 may be provided by a single shared processor. (Use of the term "controller" or "processor" should not be construed to refer exclusively to hardware capable of executing software.)
- Illustrative embodiments may comprise microprocessor and/or digital signal processor ("DSP") hardware, read-only memory ("ROM") for storing software performing the operations discussed below, and random access memory ("RAM") for storing results. Very large scale integration ("VLSI") hardware embodiments, as well as custom VLSI circuitry in combination with a general purpose DSP circuit, may also be provided.
- As is known, grocery products having bar-coded labels may be scanned at a bar-code reader to identify the product. In most cases, a description of the recognized item and its previously stored price are displayed, printed and automatically tabulated as part of a customer's grocery bill. In the case of grocery items which do not lend themselves to bar-code labeling, such as fresh produce, an alternative methodology is needed to automatically identify an item or items and record the price.
- As shown below, the present invention provides a practical solution for use at supermarket checkout counters to identify fresh produce, such as fruits and vegetables, which are not readily identifiable with a bar-code label. Moreover, the product to be identified could be sitting on a scale and its weight could be measured during the identification process. In a similar manner to grocery items containing bar-code labels, the name and price of the item would be printed on a grocery receipt using the item identification, along with the weight and the price per pound which had been previously stored. As such, the present invention can be employed with, and is integratable with, retail checkout systems which use bar code reader technology. The resulting combination provides a system which processes both labeled and non-labeled products reliably and accurately. Although the present invention is discussed, in part, with respect to the identification of produce, it is implementable in any situation where bulk items are sold, for example, hardware stores.
- In general, the present invention is a method and a system that accomplishes object recognition by analyzing distributions of local radii of curvatures to identify an unknown object. In accordance with present invention, a pattern of light is applied to a surface portion of an object and a two dimensional image is captured by an imaging device that is positioned at angle with respect to a source of the light. The combination of the patterned light and offset imaging device permits extraction of three dimensional coordinates for a set of data points on the surface portion of the object from the two dimensional captured image.
- The method then determines a set of local radii of curvatures for the selected data points in the data set and generates a spectrum representing a distribution of the local radii of curvatures. Specifically, the distributions indicate the mean and Gaussian curvatures for each of the selected data points. During the generation of a reference library of spectra, spectra of multiple objects along with their multiple orientations are compiled. These spectra are then processed with a dimension reduction analysis to determine a single set of basis functions representing all of the objects and a corresponding set of basis coefficients for each different type of object. If the data set is for an unknown object, then the unclassified spectra is expanded in a basis, resulting in a set of coefficients. This latter set is then statistically compared with the reference library of spectra to identify the product or at least designate the closest known products.
- Referring to FIG. 1, there is shown an exemplary embodiment of an
object recognition system 100 which utilizes the methods of the present invention to recognize and identify objects utilizing distributions or spectra of local radii of curvatures.Object recognition system 100 includes asource 110 for generating a pattern of light that permits extraction of three dimensional coordinates ofobject 150.Object recognition system 100 further includes alight capture device 120 that is positioned with respect tosource 110 such that the direction of illumination and the direction of image capture are different and separated by a given angle. In an exemplary embodiment,source 110 andlight capture device 120 have an angular offset of 45°.Object recognition system 100 also includes aprocessor 140 that performs the analysis described below on the image data set received fromlight capture device 130. Acontroller 130 is coupled betweenprocessor 140 andsource 110 andlight capture device 120 to control the operation of the latter two devices. - Operationally, a user will place
object 150 in anillumination path 160 ofsource 110.Source 110 then illuminates a spot onobject 150 such that the reflected patternedlight 170 provides a reasonable picture of the curvature and roughness ofobject 150. Importantly,object 150 is not completely illuminated bysource 110. Complete illumination ofobject 150 introduces the problem of segmentation into the analysis and more importantly, makes it very difficult to obtain curvature information. The size of the spot or surface portion illuminated bysource 110 is nominally related to the size ofobject 150.Source 110 can be implemented using laser diodes to provide spot illumination. In an exemplary embodiment,controller 130controls source 110 to vary the size of thebeam illuminating object 150. In another embodiment, a standard spot size is selected to correspond to the smallest potential object that is to be identified byobject recognition system 100. Alternatively, a range of sizes can be used. - As stated above, the angular offset between
source 110 andlight capture device 120 has the effect of providing three-dimensional information from a two-dimensional image when light that is transmitted in a first direction, is received in a second direction. For example, if the light is reflected from a flat surface, it will still look like a straight line. However, if the light is reflected from a sphere, then an arc is generated that has a local radius of curvature. In an exemplary embodiment,light capture device 120 is implementable using a simple black and white camera to capture the two-dimensional image. Other devices can be used such as a color camera. - In order to take advantage of the three-dimensional/two-dimensional relationship,
source 110 must illuminateobject 150 in such a manner that reflected patternedlight 170 has a curved appearance, e.g., in the form of arcs. The pattern of light captured bylight capture device 120 should permit extraction of three dimensional coordinates from the two dimensional image. This is achievable by illuminatingobject 150 with for example, a set of parallel light planes extending in a vertical direction, in a horizontal direction, in a diagonal direction, with a series of "x"s or with a grid type pattern. The number of lines or marks in either implementation is a trade-off between the level of accuracy required and in the amount of time required to complete the entire analysis for the selected number of lines. In an exemplary embodiment, the number of lines is nominally between 5 and 10. The size of the lines would, of course, be controlled by the illumination spot size. After illuminatingobject 150 in the manner described above,light capture device 120 captures an image of the spot in question. As described below,processor 140 then generates local radii of curvatures corresponding to the selected data points in the image, where the selected data points are either inherently provided by the light pattern (i.e., the grid) or are interpolated byprocessor 140 using interpolation techniques (i.e., for the set of parallel lines). - Referring now to FIG. 2, a block diagram 200 is presented of
object recognition system 100. For purposes of clarity, a top level functional overview of what takes place withinprocessor 140 for identifying an unknown object is presented first, followed by a more detailed explanation of the present invention methodology. As can be seen,source 210 outputs a pattern of light onto a spot onunknown object 250. Alight capture device 220 captures an image of the patterned light reflected fromobject 250 and forwards an electronic representation of the unknown image data set toprocessor 240. In one embodiment, the unknown image data set is transferred through acontroller 230. Specifically, the analog signals fromlight capture device 220 are first converted to digital signals using adigitizer 260 and then analyzed byprocessor 240. It will be understood thatdigitizer 260 can be implemented as an analog-to-digital converter that may be included as part ofprocessor 240 or as part ofcontroller 230. - The unknown image data set sent to
processor 240 consists essentially of two dimensional data points representing the surface portion ofobject 250, from which three dimensional coordinates can be extracted. As described below,processor 240 analyzes a set of selected data points and determines a local radius of curvature for each selected data point. In FIG. 2, selectable data points are represented by "x"s. The resulting local radii of curvatures are then compiled using a smoothed, bivariate (or a transformed version such as log f(x)) histogram to generate anunknown spectrum 265, that represents a distribution of the local radii of curvatures. Sets of known spectra from like identifiable objects determine library of knownspectra 275, and theunknown spectrum 265 is compared with the library of knownspectra 275 usingcomparison processor 270. As shown below, the library of knownspectra 275 are created from the same type image capture data input toprocessor 240, but from known objects. For each member of thelibrary 275, an operator usesprocessor 240 to provide an electronic label such as "Macintosh Apple" and a price per unit weight. The operator then usesprocessor 240 to group and characterize individual spectrum from the known product intolibrary 275. - In the present invention system,
comparison processor 270 compares theunknown spectrum 265 with library of known spectra 50 utilizing statistical techniques.Comparison processor 270 takes into account how much the known spectra for a single item vary from one another in addition to storing the average spectrum. In an exemplary embodiment of this invention, spectra are obtained from multiple orientations of the object with respect tolight source 210, for example, a top end, a bottom end, and a side for a piece of fruit.Comparison processor 270 then computes the most likely match for the single unknown spectrum or the set of unknown spectra and also calculates an indicator of the closeness of the match, e.g., a "distance" in a mathematical space or a probability value.Comparison processor 270 may also provide the next most likely possible matches and their probabilities. As can be seen,processor 240 may be coupled to adisplay device 285, which is in turn coupled to an input device/control input 290, such as a touch screen or keyboard for making operator selections. It will be understood thatdisplay 285 andinput device 290 may also be part of an existing cash register/checkout system, or alternatively that the system may be automated. - Once the matches have been computed, display 285 (for example, a monitor or a display on the existing cash register) reads out a list of possible matches in rank order that have a probability of match greater than a predetermined threshold, for example, greater than 80% probability. An operator may check that the first listed item is correct and either accept the first choice or indicate the correct choice using
input device 290. As an alternative, the system could immediately accept the first choice, as in a fully automatic (unmanned) check-out system with a conveyor belt. As mentioned earlier, in a preferred implementation of the system, the object to be identified would be sitting on a scale and its weight would also be measured as part of the identification process. The scale andoptical recognition system 100 can be coupled to theprocessor item identification 280 is made for the object in question, a total price for the identified item(s) can be computed using the weight and a previously stored price/unit figure. In a similar manner, then, to grocery items containing bar-code labels, the name and price of the produce item just identified could be printed on a grocery receipt using the item description, the weight, and the price per pound which was previously stored in the database. - Referring now to FIG. 3, there is presented a more detailed flowchart 300 of the methodology of the present invention. As stated above, a spectrum (in the form of signals) of an unknown object is compared against a library of known spectra. Construction of the library is therefore initially explained, followed by how the unknown spectrum is identified using the library in conjunction with the statistical comparison techniques.
- In general, for each piece of fruit scanned (that is, for each view of a single piece of fruit), there is a series of M measurements of the local mean and Gaussian curvature, from which a smoothed bivariate surface is formed (the spectrum shown in FIG. 5).
- Initially, a smoothing operation is performed so as to estimate the spectra since the actual data are a series of M points in the mean and Gaussian curvature plane (M pairs of mean and Gaussian curvature values, again see FIG. 5). From this data, a surface is created, the height of which at some point x represents the proportion of our M pairs that are near x (and x = (x1 x2 ) where x1 is mean curvature and x2 is Gaussian curvature). This is called density estimation, because we are estimating an unknown probability distribution. Alternatively, this can be thought of as smoothing a histogram (where the bars of the histogram represents the proportion or count of the M data points contained in the associated interval).
- Now, let f denote one such smooth, bivariate surface. The smooth function f (estimated for a single view of a single piece of fruit) is then compared against a library of spectra. This comparison is aided by approximating f for expanding f in a basiswhere x = (x1 , x2 ) and x 1 is a mean curvature and x2 is a Gaussian curvature (in some cases these basis functions are employed in the smoothing operation, in which case the approximate symbol becomes an equality in the above equation). This type of expansion or dimension reduction means that we only have to store the coefficient β 1,...,βj for each of f, and not the whole function. Now, the basis functions themselves are selected either because 1) they allow faithful representation of all the smooth surfaces in the library ( that is, each f can be taken and expand as above and obtain get a good approximation) or 2) the expansion gives good classification performance.

- If the first approach is taken, linear discriminant analysis ("LDA") is used on the coefficients of the expansions (which is also referred to as the basis coefficients) to derive a good classifier. As shown below, by using LDA, a transformation is obtained which can be applied to the coefficient vectors and permits use of nearest neighbor or non-negative least squares to perform the classification. (In the notation of Appendix A, the d-dimensional vector is just the vector of coefficients (β1,...,βj ) - implying that d = J). If the latter approach is used, then penalized discriminant analysis ("PDA") is employed to both create the basis functions and determine the coefficients which are ultimately applied with the nearest neighbor classifier or the non-negative least square procedure. (In the notation of the Appendix B, PDA is applied to the functions f).
- Specifically,
image data set 310 represents the three dimensional coordinates of a set of data points on the surface of the object. The method analyzes a set of selected data points, for example, the selected data point can correspond to the "x"s in FIG. 2. These selected data points are then the basis from which the local radii of curvatures are computed. For example, if a 10x10 grid is used as light pattern, there could be 100 data points. As described below, each selected data point conveys curvature information about a subset of data points, where the selected data point is the central data point. This type of analysis conveys information regarding the smoothness or roughness of the object. The method also analyzes groups of selected data points, that is across a specific line, to convey information regarding the size of the object. In sum, the method analyzes the selected data points in various lengths. For each length of selected data points analyzed, a local radius of curvature is generated. These multiple curvatures are then compiled via a smoothed histogram to produce a spectrum representing a distribution of the local radii of curvatures. - Specifically, a number M of data points is selected from
image data set 310. For each point xi = 1, . . . , M, the method identifies a set of neighboring points Ni. This is the set of all points within a given distance d of xi (step 3 15). For example, the number of points may represent 5-10% of the available data points. In equation form this is stated as: - The method then fits a local weighted least square polynomial to the translated and rotated neighborhood data (step 325). Assume that x* denotes the transformed points and that set x* = (x, y, z). Then, the method attempts to fit the height z to a quadratic function in x and y. That is, a, b, c, d, e and fare found to minimize
- From the above fitted quadratic, two measures of local radius of curvature are extracted, namely, mean curvature and Gaussian curvature (step 330). The mean curvature is equal to 2*(e+f) and conveys information regarding the size of the object. The Gaussian curvature is equal to 4 *(e * f) - d 2 and conveys information regarding the existence of saddle points in an object, such as a cucumber. Although a number of statistics can be extracted, the above two curvature measures are used in the exemplary embodiment of the present invention.
-
Steps 315 through 330 are repeated for all xi = 1, . . ., N, to establish a population of the two statistics. Once the mean and Gaussian curvatures have been extracted for each of the selected data points, smoothed, bivariate densities describing the mean and Gaussian curvatures are generated from an initial set of histograms (step 335). That is, a spectrum representing a distribution of the local radii of curvatures for the object are produced.Steps 310 through 335 are repeated for each object that is to be recognized by the system and moreover, curvature information is determined for multiple orientations of each object. This ensures that the present invention is independent of object orientation. FIGs. 4A-4E show spectra of mean curvature for a lemon, avocado, apple and orange. Specifically, FIG. 4A shows how the spectra differ for each different type of produce. FIGs. 5A-5C show spectra of Gaussian curvature v. mean curvature for an avocado and orange, respectively. FIG. 5A shows the differences between the two noted produce. - The method of the present invention then derives a set of basis functions from the compiled set of spectra (step 340). In alternate embodiments of the present invention, the basis function analysis is performed on the mean curvature distribution, the Gaussian curvature distribution, on the joint distribution or a transformed version thereof. The number of basis functions generated is based on the desired accuracy of classification. Importantly, once the set of basis functions has been generated, it is the same for all categories of products. Corresponding to the set of basis functions is a set of basis coefficients, where a particular set of basis coefficients together with the basis functions represents one orientation of a specific object. Thus the present invention needs to store only a given number of basis functions for all object categories and a corresponding set of basis coefficients for each measured object orientation. This greatly reduces the memory requirements of
recognition system 100 without decreasing accuracy in identification. The number of basis functions to be extracted from the data depends upon how many are required to give good classifications of unknown objects without affecting the processing speed (i.e., a large set of basis functions is not desired). - The basis functions and coefficients can be generated using a number of dimension reduction techniques. One method for generating the basis functions and coefficients is to use Fisher's linear discriminant analysis ("LDA"), which finds a low dimensional projection of the data such that in the resulting space, the ratio of between-category variation and within-category variation is the largest. For purposes of clarity, a description of the LDA procedure is presented in Appendix A. In an alternative embodiment of the present method, another approach termed penalized discriminant analysis ("PDA") is utilized for dimension reduction. This approach is particularly useful when the predictor variables are highly correlated. By imposing a smoothness constraint on the discriminant basis coefficients, the PDA technique results in improved prediction performance and interpretability. Again, for purposes of clarity, a description of the method is provided in Appendix B.
- The above represents the methodology utilized in constructing the reference library. As shown , the reference library stores one set of basis functions for all of the objects (with different orientations) to be identified, a corresponding set of basis coefficients for each object (with different orientations), and a label for each object (step 345).
- Referring still to FIG. 3, the process of how an unknown object is identified is now described. The process of analyzing unknown
image data set 350 is similar to that described above for the reference library. In sum, a local radius of curvature is extracted for each selected data point in unknown image data set (steps 355-370). The spectrum of the unknown object is then computed (step 375) and a set of basis coefficients is generated by fitting the same basis functions determined in making the library (step 380). - The unclassified set of basis coefficients is stored (step 385) and compared against the reference library (step 390) using one of several statistical classification techniques. The dimension reduction techniques discussed above are intended to make the job of classifying an unknown spectra more efficient by designing a reduced space in which J categories are separated as much as possible. Two classifying procedures: the nearest neighbor rule and the non-negative least squares methods are discussed below. Other statistical approaches can also be used to classify the unknown spectrum. As explained herein, the present invention optical recognition system may be implemented to recognize any item of commerce from which a local radius of curvature can be measured.
- The comparison results are then displayed to the user of the optical recognition system. As stated previously, the display can show a ranked order list of possible matches that have a probability of match greater than a predetermined threshold, for example, greater than 80% probability. A cashier could check that the first listed item is correct and either accept the first choice or indicate the correct choice using a supplied input device. The cashier could also indicate to the system to repeat the identification process. Alternatively, the system could immediately accept the first choice, as in a fully automatic (unmanned) check-out system.
- In one embodiment of the present invention, the outcome of the classification process could be combined with spectroscopic methods of characterizing the same objects. The outcome of the comparison analysis can be potentially re-ordered as a result of the color identification process. This could be done on a weighted or non-weighted basis, depending upon the relative accuracy of both the color and shape identification processes.


Claims (22)
- A method for recognizing an object from a reference library of known objects based on a spectrum of local radius of curvature of said object, said method comprising the steps of:illuminating a surface portion of said object with a pattern of light;capturing an image data set of said surface portion at an angular offset with respect to a source of said pattern of light, wherein said pattern of light and offset image capture permit extraction of three dimensional coordinates for data points in said image data set;determining a spectrum of local radii of curvatures for at least one selected data point in said image data set;constructing said reference library of known objects by repeating said steps of applying, capturing and determining with different objects; andcomparing an unknown spectrum of local radius of curvature against said reference library of known objects to make an identification.
- The method according to claim 1, wherein said source illuminates said object with a series of parallel planes of light.
- The method according to claim 1, wherein said source illuminates said object with a grid.
- The method according to claim 1, wherein said source illuminates said object with "x"s.
- The method according to claim 1, wherein said step of determining computes said spectrum of local radii of curvatures over varying lengths of data points in said image data set.
- The method according to claim 1, wherein said step of constructing includes repeating said steps of applying, capturing and determining with different orientations of each of said different objects.
- The method according to claim 1, wherein said step of determining includes the steps of:extracting a mean local radius of curvature for said object; andextracting a Gaussian local radius of curvature for said object.
- The method according to claim 1, wherein said step of determining includes the steps of:identifying a neighborhood of data points for said at least one selected data point;rotating said neighborhood of data points such that an outward normal to said surface portion of said object at said at least one selected point is aligned vertically;fitting a local weighted least square polynomial to said neighborhood of data points; andcalculating at least one measure of local radius of curvature for said at least one selected data point.
- The method according to claim 8, wherein said step of determining further includes the steps of:repeating said steps of identifying, rotating, fitting and calculating for each additional selected data point; andcompiling histograms of all measures of local radii of curvatures to form a spectrum representing a distribution of said at least one measure of local radius of curvature.
- The method according to claim 1, wherein a size of said surface portion is selectable from a range of sizes dependent upon an actual size of said object.
- The method according to claim 1, wherein a size of said surface portion is relative to an actual size of said object.
- The method according to claim 1, wherein said step of constructing further includes the step of generating a given set of basis functions for all of said different objects and a corresponding set of basis coefficients for each of said different objects when constructing said reference library of known objects.
- The method according to claim 12, wherein the step of comparing includes the steps of:generating a given set of basis coefficients for said object when utilizing said reference library of known objects to identify said object; andclassifying said given set of basis coefficients against said reference library of known objects to identify said corresponding set of basis coefficients most closely matching said given set of basis coefficients.
- The method according to claim 13, wherein linear discriminant analysis is used to generate said given set of basis functions, said corresponding set of basis coefficients and said given set of basis coefficients.
- The method according to claim 13, wherein said step of classifying is achieved using a non-negative least squares technique.
- The method according to claim 13, wherein said step of classifying is achieved using a nearest neighbor technique.
- The method according to claim 13, wherein penalized discriminant analysis is used to generate said given set of basis functions, said corresponding set of basis coefficients and said given set of basis coefficients.
- The method according to claim 1, wherein said step of comparing includes the steps of:generating a ranked order list of object choices;displaying said ranked order list on a display interface unit; andselecting one of said object choices on said ranked order list.
- The method according to claim 18, wherein said step of selecting is automatic.
- The method according to claim 18, wherein said step of selecting is manual.
- The method of claim 1, further including the steps of:characterizing said object using spectroscopic analysis; andstatistically combining said spectroscopic analysis with said step of comparing to produce a ranked order list of most closely matched product choices.
- An optical recognition system for recognizing an object from a reference library of known objects based on a spectrum of local radius of curvature of said object, said system comprising means arranged to carry out each step of a method as claimed in any of the preceding claims.
Applications Claiming Priority (2)
| Application Number | Priority Date | Filing Date | Title |
|---|---|---|---|
| US81469 | 1998-05-19 | ||
| US09/081,469 US6424745B1 (en) | 1998-05-19 | 1998-05-19 | Method and apparatus for object recognition |
Publications (1)
| Publication Number | Publication Date |
|---|---|
| EP0959427A2 true EP0959427A2 (en) | 1999-11-24 |
Family
ID=22164369
Family Applications (1)
| Application Number | Title | Priority Date | Filing Date |
|---|---|---|---|
| EP99303611A Withdrawn EP0959427A2 (en) | 1998-05-19 | 1999-05-10 | Method and apparatus for object recognition |
Country Status (3)
| Country | Link |
|---|---|
| US (1) | US6424745B1 (en) |
| EP (1) | EP0959427A2 (en) |
| JP (1) | JP2000030067A (en) |
Cited By (1)
| Publication number | Priority date | Publication date | Assignee | Title |
|---|---|---|---|---|
| EP3234880A1 (en) * | 2014-12-16 | 2017-10-25 | Amazon Technologies Inc. | Robotic grasping of items in inventory system |
Families Citing this family (23)
| Publication number | Priority date | Publication date | Assignee | Title |
|---|---|---|---|---|
| US6363366B1 (en) * | 1998-08-31 | 2002-03-26 | David L. Henty | Produce identification and pricing system for checkouts |
| JP3377465B2 (en) * | 1999-04-08 | 2003-02-17 | ファナック株式会社 | Image processing device |
| JP3428494B2 (en) * | 1999-05-19 | 2003-07-22 | 日本電気株式会社 | Character recognition device, its character recognition method, and recording medium storing its control program |
| US7540424B2 (en) * | 2000-11-24 | 2009-06-02 | Metrologic Instruments, Inc. | Compact bar code symbol reading system employing a complex of coplanar illumination and imaging stations for omni-directional imaging of objects within a 3D imaging volume |
| US7044370B2 (en) * | 2001-07-02 | 2006-05-16 | Ecr Software Corporation | Checkout system with a flexible security verification system |
| US6827266B2 (en) * | 2002-10-04 | 2004-12-07 | Ncr Corporation | Methods and apparatus for using imaging information to improve scanning accuracy in bar code scanners |
| AU2003286922A1 (en) * | 2002-11-06 | 2004-06-03 | Geometric Informatics Inc. | Analysis of geometric surfaces by conformal structure |
| US20050058350A1 (en) * | 2003-09-15 | 2005-03-17 | Lockheed Martin Corporation | System and method for object identification |
| US20050097064A1 (en) * | 2003-11-04 | 2005-05-05 | Werden Todd C. | Method and apparatus to determine product weight and calculate price using a camera |
| US7720291B2 (en) * | 2004-02-17 | 2010-05-18 | Corel Corporation | Iterative fisher linear discriminant analysis |
| US7334729B2 (en) * | 2006-01-06 | 2008-02-26 | International Business Machines Corporation | Apparatus, system, and method for optical verification of product information |
| US7740176B2 (en) * | 2006-06-09 | 2010-06-22 | Hand Held Products, Inc. | Indicia reading apparatus having reduced trigger-to-read time |
| US7784696B2 (en) | 2006-06-09 | 2010-08-31 | Hand Held Products, Inc. | Indicia reading apparatus having image sensing and processing circuit |
| US7633635B2 (en) * | 2006-08-07 | 2009-12-15 | GII Acquisitions, LLC | Method and system for automatically identifying non-labeled, manufactured parts |
| CN102346129B (en) * | 2011-06-30 | 2013-03-27 | 华中科技大学 | Gas radiation spectrum invariant characteristic extraction method suitable for temperature pressure change |
| JP5579202B2 (en) * | 2012-01-16 | 2014-08-27 | 東芝テック株式会社 | Information processing apparatus, store system, and program |
| US9110001B2 (en) * | 2012-07-02 | 2015-08-18 | Thermo Scientific Portable Analytical Instruments Inc. | Method for tagging reference materials of interest in spectroscopic searching applications |
| JP2013109773A (en) * | 2013-01-07 | 2013-06-06 | Olympus Corp | Feature matching method and article recognition system |
| JP6122805B2 (en) * | 2013-07-16 | 2017-04-26 | 東芝テック株式会社 | Information processing apparatus and program |
| JP6435647B2 (en) * | 2014-05-29 | 2018-12-12 | 株式会社ソシオネクスト | Object recognition method, object recognition apparatus, and object recognition program |
| CN105678684B (en) | 2014-11-18 | 2020-11-03 | 中兴通讯股份有限公司 | Method and device for intercepting image |
| US10650368B2 (en) * | 2016-01-15 | 2020-05-12 | Ncr Corporation | Pick list optimization method |
| LU100465B1 (en) | 2017-10-05 | 2019-04-09 | Applications Mobiles Overview Inc | System and method for object recognition |
Family Cites Families (7)
| Publication number | Priority date | Publication date | Assignee | Title |
|---|---|---|---|---|
| US4873651A (en) * | 1987-04-21 | 1989-10-10 | Case Western Reserve University | Method and apparatus for reconstructing three-dimensional surfaces from two-dimensional images |
| US5085325A (en) * | 1988-03-08 | 1992-02-04 | Simco/Ramic Corporation | Color sorting system and method |
| US5060290A (en) * | 1989-09-05 | 1991-10-22 | Dole Dried Fruit And Nut Company | Algorithm for gray scale analysis especially of fruit or nuts |
| US5164795A (en) * | 1990-03-23 | 1992-11-17 | Sunkist Growers, Inc. | Method and apparatus for grading fruit |
| US5729704A (en) * | 1993-07-21 | 1998-03-17 | Xerox Corporation | User-directed method for operating on an object-based model data structure through a second contextual image |
| JPH07181022A (en) * | 1993-12-22 | 1995-07-18 | Nikon Corp | Three-dimensional profile measuring apparatus |
| US5546475A (en) * | 1994-04-29 | 1996-08-13 | International Business Machines Corporation | Produce recognition system |
-
1998
- 1998-05-19 US US09/081,469 patent/US6424745B1/en not_active Expired - Lifetime
-
1999
- 1999-05-10 EP EP99303611A patent/EP0959427A2/en not_active Withdrawn
- 1999-05-14 JP JP11134566A patent/JP2000030067A/en active Pending
Cited By (1)
| Publication number | Priority date | Publication date | Assignee | Title |
|---|---|---|---|---|
| EP3234880A1 (en) * | 2014-12-16 | 2017-10-25 | Amazon Technologies Inc. | Robotic grasping of items in inventory system |
Also Published As
| Publication number | Publication date |
|---|---|
| US6424745B1 (en) | 2002-07-23 |
| JP2000030067A (en) | 2000-01-28 |
Similar Documents
| Publication | Publication Date | Title |
|---|---|---|
| EP0959427A2 (en) | Method and apparatus for object recognition | |
| EP0899680B1 (en) | Method for automatic detection of human eyes in digital images | |
| KR100190737B1 (en) | Produce recognition system | |
| US6592033B2 (en) | Item recognition method and apparatus | |
| Huang et al. | Shape localization based on statistical method using extended local binary pattern | |
| Amit et al. | A computational model for visual selection | |
| US5497314A (en) | Automated apparatus and method for object recognition at checkout counters | |
| US5450504A (en) | Method for finding a most likely matching of a target facial image in a data base of facial images | |
| US6185314B1 (en) | System and method for matching image information to object model information | |
| US6263088B1 (en) | System and method for tracking movement of objects in a scene | |
| US6295367B1 (en) | System and method for tracking movement of objects in a scene using correspondence graphs | |
| US6879709B2 (en) | System and method for automatically detecting neutral expressionless faces in digital images | |
| EP2737434B1 (en) | Gait recognition methods and systems | |
| US5058182A (en) | Method and apparatus for handwritten character recognition | |
| Wei et al. | Face detection for image annotation | |
| JPH08249475A (en) | Size featuring/deciding system of object | |
| JP2003108981A (en) | Method and computer program product for locating facial features | |
| GB2029994A (en) | Apparatus and method for recognizing a pattern | |
| WO2016190814A1 (en) | Method and system for facial recognition | |
| CN109741551B (en) | Commodity identification settlement method, device and system | |
| US6219438B1 (en) | Produce indentifier using barcode scanner and wavelet image processing and having compensation for dirt accumulated on viewing window | |
| US7570815B2 (en) | Comparing patterns | |
| EP0626656A2 (en) | Image processing system and method for automatic feature extraction | |
| Bobbit et al. | Visual item verification for fraud prevention in retail self-checkout | |
| US5040231A (en) | Vertical vector pattern recognition algorithm |
Legal Events
| Date | Code | Title | Description |
|---|---|---|---|
| PUAI | Public reference made under article 153(3) epc to a published international application that has entered the european phase |
Free format text: ORIGINAL CODE: 0009012 |
|
| AK | Designated contracting states |
Kind code of ref document: A2 Designated state(s): AT BE CH CY DE DK ES FI FR GB GR IE IT LI LU MC NL PT SE |
|
| AX | Request for extension of the european patent |
Free format text: AL;LT;LV;MK;RO;SI |
|
| STAA | Information on the status of an ep patent application or granted ep patent |
Free format text: STATUS: THE APPLICATION HAS BEEN WITHDRAWN |
|
| 18W | Application withdrawn |
Effective date: 20030129 |