EP1175115A2 - Apparatus and method for geostatistical analysis of wireless signal propagation - Google Patents
Apparatus and method for geostatistical analysis of wireless signal propagation Download PDFInfo
- Publication number
- EP1175115A2 EP1175115A2 EP00119460A EP00119460A EP1175115A2 EP 1175115 A2 EP1175115 A2 EP 1175115A2 EP 00119460 A EP00119460 A EP 00119460A EP 00119460 A EP00119460 A EP 00119460A EP 1175115 A2 EP1175115 A2 EP 1175115A2
- Authority
- EP
- European Patent Office
- Prior art keywords
- data
- propagation
- wireless
- communication system
- assessing
- Prior art date
- Legal status (The legal status is an assumption and is not a legal conclusion. Google has not performed a legal analysis and makes no representation as to the accuracy of the status listed.)
- Granted
Links
- 238000000034 method Methods 0.000 title claims abstract description 117
- 238000004458 analytical method Methods 0.000 title claims abstract description 16
- 238000004891 communication Methods 0.000 claims description 44
- 238000005259 measurement Methods 0.000 claims description 32
- 239000011159 matrix material Substances 0.000 claims description 6
- 238000001914 filtration Methods 0.000 claims description 4
- 238000012935 Averaging Methods 0.000 claims description 3
- 238000007619 statistical method Methods 0.000 claims 3
- 230000002411 adverse Effects 0.000 claims 1
- 230000001413 cellular effect Effects 0.000 abstract description 51
- 238000012360 testing method Methods 0.000 abstract description 21
- 238000009434 installation Methods 0.000 abstract description 2
- 238000007726 management method Methods 0.000 abstract description 2
- 230000008569 process Effects 0.000 description 28
- 230000002452 interceptive effect Effects 0.000 description 5
- 238000013480 data collection Methods 0.000 description 4
- 238000011161 development Methods 0.000 description 4
- 230000018109 developmental process Effects 0.000 description 4
- 238000009826 distribution Methods 0.000 description 4
- 238000005065 mining Methods 0.000 description 4
- 238000005070 sampling Methods 0.000 description 4
- 230000002596 correlated effect Effects 0.000 description 3
- 230000007423 decrease Effects 0.000 description 3
- 230000000694 effects Effects 0.000 description 3
- 238000000926 separation method Methods 0.000 description 3
- 238000001228 spectrum Methods 0.000 description 3
- 238000004422 calculation algorithm Methods 0.000 description 2
- 238000007405 data analysis Methods 0.000 description 2
- 238000012986 modification Methods 0.000 description 2
- 230000004048 modification Effects 0.000 description 2
- 238000007781 pre-processing Methods 0.000 description 2
- IRLPACMLTUPBCL-KQYNXXCUSA-N 5'-adenylyl sulfate Chemical compound C1=NC=2C(N)=NC=NC=2N1[C@@H]1O[C@H](COP(O)(=O)OS(O)(=O)=O)[C@@H](O)[C@H]1O IRLPACMLTUPBCL-KQYNXXCUSA-N 0.000 description 1
- 241000668842 Lepidosaphes gloverii Species 0.000 description 1
- 230000006978 adaptation Effects 0.000 description 1
- 230000004075 alteration Effects 0.000 description 1
- 230000008901 benefit Effects 0.000 description 1
- 238000004364 calculation method Methods 0.000 description 1
- 230000001186 cumulative effect Effects 0.000 description 1
- 238000005520 cutting process Methods 0.000 description 1
- 238000013499 data model Methods 0.000 description 1
- 230000003247 decreasing effect Effects 0.000 description 1
- 230000003467 diminishing effect Effects 0.000 description 1
- 238000011156 evaluation Methods 0.000 description 1
- 230000001747 exhibiting effect Effects 0.000 description 1
- 239000012530 fluid Substances 0.000 description 1
- 238000009499 grossing Methods 0.000 description 1
- 238000012886 linear function Methods 0.000 description 1
- 230000007246 mechanism Effects 0.000 description 1
- 238000010295 mobile communication Methods 0.000 description 1
- 238000012544 monitoring process Methods 0.000 description 1
- 238000005457 optimization Methods 0.000 description 1
- 238000013488 ordinary least square regression Methods 0.000 description 1
- 238000000513 principal component analysis Methods 0.000 description 1
- 230000000644 propagated effect Effects 0.000 description 1
- 238000003908 quality control method Methods 0.000 description 1
- 230000002441 reversible effect Effects 0.000 description 1
- 238000012502 risk assessment Methods 0.000 description 1
- 238000004088 simulation Methods 0.000 description 1
- 239000002689 soil Substances 0.000 description 1
- 238000010561 standard procedure Methods 0.000 description 1
- 238000010998 test method Methods 0.000 description 1
- 230000005641 tunneling Effects 0.000 description 1
- 238000010200 validation analysis Methods 0.000 description 1
- 238000012795 verification Methods 0.000 description 1
Images


Classifications
-
- H—ELECTRICITY
- H04—ELECTRIC COMMUNICATION TECHNIQUE
- H04W—WIRELESS COMMUNICATION NETWORKS
- H04W16/00—Network planning, e.g. coverage or traffic planning tools; Network deployment, e.g. resource partitioning or cells structures
- H04W16/18—Network planning tools
Definitions
- the present invention relates to cellular telephone systems and to modeling cellular telephone systems for optimizing utilization of the available overall radio spectrum. More particularly, the present invention relates to using measured network data and geostatistical modeling techniques to manage variations and growth within a cellular system and provide improved frequency plans for cellular networks under different variables.
- the service area of a wireless communications system is partitioned into connected service domains known as cells, where radio telephone (cellular) users communicate, via radio links, with the base station serving the cell.
- the cells can be further partitioned into sectors.
- the base station is coupled to the public service telephone network (PSTN).
- PSTN public service telephone network
- Presently available commercial mobile communication systems typically include a plurality of fixed cells each of which transmits signals to and receives signals from mobile units within their respective service areas.
- each base station is assigned a plurality of channels (each 30KHz wide) within a frequency spectrum over which it can communicate with mobile units.
- a mobile unit within range of the base station communicates with the base station using these channels.
- the channels used by a base station are separated from one another in some manner (typically skipping 1, 7 or 21 intermediate channels) sufficiently that signals on any channel do not interfere with signals on another channel used by that base station.
- an operator typically allots to a base station a group of channels each of which is widely separated from the next.
- the present invention will also operate with GSM and iDEN systems which do not rely on the same frequency divisions multiple access method.
- TDMA Time Division Multiple Access
- GSM Global System for Mobile Communications
- iDEN In a common type of mobile system called Time Division Multiple Access (TDMA), which includes IS-54 and IS-136, GSM and iDEN each frequency channel is further time divided into additional channels within each frequency. Each base station sends and receives in bursts during some number of different intervals or time slots. These time intervals within frequency bands then effectively constitute the individual channels.
- digital codes are used.
- IS-136 utilizes Digital Verification Color Codes unique to a channel at a cell, are used.
- GSM uses Base Station identification codes.
- each cell In order to allow mobile units to transmit and receive telephone communications as the units travel over a wide geographic area, each cell is normally physically positioned so that its area of coverage is adjacent to and overlaps the areas of coverage of a number of other cells.
- communications with the mobile unit are transferred (handed off) from one base station to another in an area where the coverage from the adjoining cells overlaps. Because of this overlapping coverage, the channels allotted to the individual cells are carefully selected so that adjoining cells do not transmit or receive on the same channels.
- This separation is typically accomplished by assigning a group of widely separated non-interfering channels to some central cell and then assigning other groups of widely separated non-interfering channels to the cells surrounding that central cell using a pattern which does not reuse the same channels for the cells surrounding the central cell.
- the pattern of channel assignments continues similarly with the other cells adjoining the first group of cells. Often adjacent or overlapping cells will transmit on the same frequency and both will be received by a mobile wireless unit. However, because of the digital codes identifying each channel, the mobile wireless unit can process the appropriate signal and ignore any additional reception.
- Geostatistics is a "spatial statistics" tool that can be applied to any practical problem of 1D, 2D, or 3D predictions of a random variable. In addition, it can be applied to 4D predictions of spatio-temporal geostatistics monitoring through time. Geostatistics has been used since the early 1950's for mining engineering, mainly for determining ore reserves estimations and exploitation scenario simulations. Data collected in mining consists of soil cores and cuttings from a limited number boreholes, as well as samples from outcrops. In the early 1960's a basic theoretical framework of geostatistics had been built that set new standard techniques in the mining industry. Over the past 30 years, this theoretical framework has been strengthened and successfully applied for other types of problems such as fluid flow modeling and subsurface wave propagation.
- Path loss is the attenuation that occurs as RF signals propagate from a transmitting antenna to a receiving antenna.
- Path loss data sampling, acquisition, and estimation over a cellular network shows great similarities with standard problems encountered in ore-body or reservoir forecasting.
- Geostatistics has therefore high potential to be implemented for such purposes.
- the theory of geostatistics applied to physical phenomenon makes it appropriate to use for combining a propagation model and data measurements for wireless network.
- This application provides for efficiency in collection and maximum use of collected wireless data that results in precise predictions of missing data in a wireless network.
- the method quantifies and assesses errors due to any measurement or any estimation process.
- the method provides downscale information and gives RF engineers a high-resolution model describing the path loss over a given area of interest. The method simulates different scenarios of path loss before a drive or between successive drives that would lead to better strategies of data collection.
- Geostatistical analysis techniques offer a way of describing the spatial continuity that is an essential feature of many natural phenomenon and provide adaptations of classical regression techniques to take advantage of this continuity.
- the purpose of spatial continuity analysis is to quantify the variability of path loss measurements with respect to distance and direction. Geographic location is only considered if the data exhibit a trend, a property known as non-stationarity. Quantifying the spatial information involves comparing data values measured at one location with values of the same attribute measured at other locations. For example, two path loss measurements in close proximity are more likely to have similar values than two path loss measurements further apart. By determining the correlation with respect to separation distance, estimates of the unmeasured locations can be made based upon the values at the measured locations.
- Figure 1 is an exemplary illustration of a expanding cell coverage in a cellular telephone system.
- Figure 2 is an exemplary illustration of radio coverage areas of a cellular telephone system.
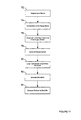
- Figure 3 is a flowchart of applying a geostatistical model to RF signal strength data.
- Figure 4 is an exemplary basemap of a city illustrating the location of base tower sites in a cellular telephone system.
- Figure 5 is a graphical view illustrating exemplary successfully decoded digital code signals data obtained in an exemplary no key up drive test of the basemap in Figure 4.
- Figure 6 is a tabular illustration of interference between channels in a cellular telephone system.
- Figure 7 is an exemplary illustration of gaps in RF signal strength data obtained in a drive test.
- Figure 8 illustrates the application of bins to the test area of the basemap in Figure 4.
- Figure 9 is a flowchart of the merge process applying a geostatistical model to RF signal strength data.
- Figure 10 is an illustration of a variogram having decreasing correlation with distance.
- Figure 11 is a flowchart of step three of the merge process applying a geostatistical model to RF signal strength data.
- Figure 12 is an illustration of finding an unknown data point using interpolation techniques.
- Figure 13 is an exemplary graphical view illustrating the results of the geostatistical method to the data of Figure 8.
- a goal of planning and expansion for a cellular telephone system is to determine new base tower locations, and frequency reuse based on propagation distance of radio signals between base stations.
- RF data is gathered from the system to perform further analysis and refinement of channel traffic, interference, service area, and total propagation area of a base station.
- Figure 1 is an exemplary illustration of a cellular telephone system.
- a plurality of antenna towers and base stations 10 are located within a geographic area. Calls from subscriber units 12 are directed through a mobile switching center (MSC) 14, which includes switching equipment needed to interconnect mobile equipment with the public services telephone network (PSTN) 16.
- MSC mobile switching center
- PSTN public services telephone network
- Towers 10 tie into a base station switch (BSS) 18, which has a remote switch connected to the PSTN 16.
- BSS base station switch
- Coverage of a wireless telephone system is typically illustrated with cells in the form of a honeycomb grid 20.
- cell 20 division may be implemented to add channels within the system through additional base stations 10.
- the addition of base stations subdivides the existing cellular system into smaller cells 22, thereby creating greater channel capacity within a coverage area.
- adding channel capacity and balancing frequency reuse between base stations 10 adds complexity to engineering RF signal coverage within a system.
- Figure 2 illustrates RF coverage areas for three exemplary base station cells.
- the calculated free space coverage of a cell is the theoretical attenuation limit of the RF signals without interference or blockage.
- Towers 10 are rarely placed to accurately account for all of the propagation factors that attenuate RF signals. Power levels and channel frequencies are typically adjusted after tower 10 installation.
- the radio coverage area for area cell A 24 partially overlaps cells B 26 and C 28. This overlap is a potential area for interference between identical channels.
- the radio coverage area for cells B 26 and C 28 have a hole between them. This hole is a potential area for dropped calls or lack of service coverage due to weak signals.
- FIG. 3 generally illustrates the steps of the preferred exemplary embodiment of collecting RF data, modeling the data with geostatistics, and applying modeled parameters to a basemap of the system.
- a raw RF data set 30 from a cellular system
- the data is first gathered through a drive test method 32.
- Collecting data 30 in a drive test 32 is described in copending application 09/567,709 Apparatus and Method for Non-disruptive Collection and Analysis of Wireless Signal Propagation, to the same assignee as the present application, and is incorporated herein by reference as if fully set forth herein.
- Figure 4 illustrates an exemplary basemap of a city having six cell sites 10, RF1 through RF6.
- the drive plan 34 is a carefully determined route which will efficiently collect representative RF signal data from a cellular system.
- the drive plan 34 is established by evaluation of the distribution of the antennas 10 of the cellular system and through analysis of the geographical features of the area of the cellular system.
- a vehicle equipped with appropriate cellular signal receiving and measuring equipment is driven through the cellular system in accordance with the drive test plan 34 map to collect actual signal reception data 30.
- a statistically significant number of measurements are taken throughout the cellular system to determine the relative signal strength between each base station 10 and each mobile unit location.
- a drive test 32 cannot cover all of the area of a cellular system.
- the present invention provides a method to find signal data 30 along the roads not covered by the drive plan 34. Total drive coverage is both impractical and impossible. Typically, an average of only 25% of the roads are covered in a drive test 32. It is impractical to cover all roads in a cellular system because of time and resource limitations. It is impossible because some parts of a cellular system are inaccessible due to natural and man made obstacles. The data 30 obtained by the drive test 32 process is also incomplete even in the areas tested because of the inherent imperfections of actual measurement conditions, even if parts of the drive plan 34 are driven multiple times.
- RF data 30 can be collected unobtrusively in a no key-up method rather than having to shut off channels, as described in copending application 09/567,709 Apparatus and Method for Non-disruptive Collection and Analysis of Wireless Signal Propagation to the same assignee as the present application and is incorporated herein by reference as if fully set forth herein.
- Digital channels send out color codes in each data frame that indicate the source of the channel.
- the location and color code data for each signal is gathered as raw cellular RF data 30 collected using a "no key up" method.
- the combination of channel number and color code creates an identification data point associated with a base station. If the color code can not be decoded during drive testing, the measurements are not able to associate the signal with the source base station.
- a PN code is the same concept as a color code. As the signal level drops, the ability to decode the color code correspondingly drops. Likewise, as interference increases, the probability of decoding the color code decreases. With the no-key up method, drive test 32 may yield data 30 displayed as data points in Figure 5.
- the collection equipment must not only determine signal strength but must also decode the digital code associate with the signal which identifies the digital channel and/or sending antenna. Accurately decoding a digital signal is more difficult than reception of raw RF and requires a stronger and/or clearer signal reception.
- Data points from multiple sectors are collected because they can exhibit different propagation characteristics normally found in RF measurement data. Propagation variations can be influenced by urban, suburban, and rural structural differences. In an urban environment, the signal typically propagates strongly along non-intersecting streets with the sector location, decaying rapidly away from the antenna, thereby exhibiting a "tunneling effect.”
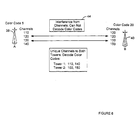
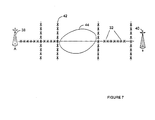
- FIG. 6 Exemplary illustrations of interference between two adjacent towers for a digital cellular system using DVCC are found in Figures 6 and 7.
- Figure 7 illustrates the result of RF interference in Figure 6.
- Tower A 38 transmits with color code five on channels 110, 120, 130, and 140.
- Tower B 40 transmits with color code 20 on channels 110, 120, 130, and 150.
- a drive test 32 along the roads 42 between the two towers 38, 40 gathers DVCC data 30 from both towers.
- Channels from the towers 38, 40 are unique except for channels 120 and 130.
- the color code from channels 120 and 130 can not be decoded due to interference between the similar channels. Therefore, the source of a signal on these two channels can not be identified even though a power level can be detected and a data gap 44 is formed.
- a drive test 32 could collect a color code from channels unique to each tower. Each mark on a road 42 represents a data collection point from such signals. Where propagation signals from tower A 38 and tower B 40 intersect, interference could result in a data gap 44. Data 30 may have interference from identical channels, and a drive test 32 will collect a signal measurement but not decode the color code if significant interference exists between the identical channels, resulting in significant gaps 44 the data collection 30. The existence of gaps 44 in the collected data 30 gives rise to the need for the interpretation of the data 30 as taught in the present invention to fill in the gaps 44.
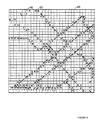
- the measurement area in the system is divided into a grid 46 in Figure 8.
- a grid is used to optimize data collection and sampling rates in a model.
- a bin 48 is one cell of the grid.
- Data analysis 52 of Figure 3 includes the process of binning average values of RF data 30 within a grid cell 48 to a value 50 located in the center of each bin 48. Therefore, each bin location 48 analyzed has a single RF data value 50 representing all the RF values within that particular bin location 48.
- the averaging of the data 30 reduces distortions which could result from a greater number of measurements in some areas and a lesser concentration of measurements in other areas.
- a 100m X 100m grid 46 is overlaid onto the cellular system.
- the grid 46 size and shape can vary. Varying shapes and densities of bins 48 within a grid are possible and sometimes useful for dense distributions of data within a cellular system.
- the next step of RF signal data analysis 52 is organizing the data.
- Data 30 collected from drive tests are organized and merged into a common database 54.
- a geostatistical model 56 is then built from the data in the merged database 54.
- a goal of the modeling step 56 is to create a geostatistical model that can estimate a value of a bin 48 based on the known values of surrounding bins 48 within a high degree of certainty.
- modeling 56 of cellular RF signals using geostatistical techniques comprises modeling known samples of data 30 to describe the variability of the data.
- the method of the preferred embodiment builds RF data models from a sample set of raw RF signals 30 produced by base stations 10 in a cellular system area.
- the models 56 are optimized to match measured data and show signal loss and radio interference beyond the sample data set, as well as co-channel interference.
- Modeled wireless RF signal data 56 can show the existence of large-scale trend effects. At a lower scale level, data is assumed to be stationary. To estimate the path loss, two methods can be utilized: working with transformed data to a normal variable and kriging in the normal space then get back to the real space; and the preferred exemplary method of de-trending the RF data using an empirical trend estimate with the least square fit of the relationship "path loss" vs. "distance”.
- the merge process 58 is a tool for RF path loss data pre-processing using the geostatistical modeling technique of kriging. For each sector at a base station 10, RF path loss measurements are given in raw format 54. Using the method of the exemplary embodiment, path loss measurements are processed in such a way to estimate a path loss at the bins 48 for the entire list of sectors at the global bin locations.
- the kernel of the merge process is the estimation workflow procedure found in Steps 1 through 4 on Figure 9. It is mathematically consistent and is designed within the framework of geostatistics. The form of the kernel is based on estimating and filtering a lognormal path loss trend.
- the Best Linear Unbiased Estimator (BLUE), known as the kriging, is applied to compute residuals and the underlying uncertainty. Residuals are path loss data that have the natural attenuation of radio signals away from a base station removed from the path loss data measurement. The final results are called the kriging estimate and kriging error of the path loss.
- the estimator is a linear function of the data with weights calculated according to the specifications of unbiasedness and minimum variance. The unbiasedness means that on the average the error of estimation is zero. Minimum variance means that the square estimation error is as small as possible.
- kriging accounts for the relative distance of measurements from each other and from the location where an estimate is sought. The weights are determined by solving a system of linear equations with coefficients that depend on the variogram that describes the spatial structure of the data.
- the basic merge loop begins with the step of reading the input data 60 from the path loss database and searching for duplicates 62 in the raw data 54.
- This data is read from the RF signal path loss measurements database 54 that was merged from the raw test drive data 30.
- the purpose of this step 60 is to eliminate any possibility of having non-reversible system matrix during the kriging.
- the data 54 will be treated in such a way that duplicated data elements are eliminated.
- Duplicate data may be due to overlapping drives or several measurements taken at the same location.
- RF data 54 coordinates are measured according to either the local coordinates or global coordinates at a site and transferred to the basemap. Typically, either latitude and longitude or UTM-X and UTM-Y coordinate systems are used on the drive plan basemap 34.
- the number of bins 48 depend upon the input size of the grid 46 that overlays the basemap 34.
- the number, location, value and other parameters of input data elements36 are all found from the records in the merged database 54 as organized for preprocessing.
- Step two 64 of the merge process begins with the estimation of the trend via a least square mean fit algorithm and filtering the trend from the path loss.
- Trend is assumed to be a logarithmic function, which is a function of the physical phenomenon of RF signal attenuation. Attenuation of a wireless signal is the decrease of the signal strength exponentially with distance away from the signal source.
- Detrending of the data 66 is performed in order to split the deterministic and random part of the path loss. The simplest method for detrending data 66 is using ordinary least squares method.
- the trend values are input 68 into the model separately from the merged database 54.
- Non-stationarity is expected because the Path Loss (signal) decays in free space and is approximately 20 log 10 [R], where R is the distance from the antenna. Assumptions for the purposes of the merge process are that the computations result in quasi-stationary residuals.
- the trend is also assumed to be omni-directional in spatial continuity. The assumption does not imply a belief that spatial continuity is the same for the trend in all directions. The assumption serves the use of focusing on distance parameters of the trend for simplified calculations. The assumption can be modified to include directional trends if the trend is derived in each direction.
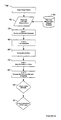
- Kriging the residuals at the bins is step three 70 of the merge process.
- a variogram such as the exemplary variogram 72 in Figure 10
- variogram 72 properties are known through a catalogue of different type of path loss spatial behavior. These assumptions can be optional depending on their relevancy to new data sets. Methods to overcome the assumptions include using the non-stationary geostatistical framework as an alternative. Such an alternative requires development of a generalized variogram within the framework of the Intrinsic Random Function (IRFk) theory.
- IRFk Intrinsic Random Function
- the variogram ⁇ (h) term is a measure of dissimilarity, or increasing variance as a function of distance.
- the variogram is the sum of the squared differences of all data pairs falling within a lag divided by twice the number of pairs found for that lag.
- ⁇ (h) tends to reach a constant value known as the sill.
- the sill is the variance ( ⁇ ⁇ ) of the measured data.
- the distance at which the sill is reached by the variogram is called the range or correlation length.
- the sill and range are useful properties when comparing directional trends in the data.
- Figure 10 illustrates a hypothetical anisotropic variogram 72 showing a short scale correlation range of 800 meters and a long scale range of 2200 m.
- parameters of the variogram are modeled from the data set.
- the steps to variogram modeling are run a variogram on collected data, feeding the variogram to theoretical model, and fitting the variogram to the measured data's variogram.
- different experimental variograms are computed, including near range, long range anisotropic and long range omni-directional. Better predictions can be made by accounting for anisotropy in the data.
- Anisotropic variograms account for scalar distance in one direction, all measured with the same distance between pairs of data points.
- finding a universal variogram is based on the entire set of data from all cellular system sectors that has been reduced by the dimensionality of the process.
- a wireless system may theoretically contain hundreds of sectors. Instead of modeling each sector, lists of correlated sectors are made. The principal component analysis is applied to reduce each correlated sector list to a representative component. This method can reduce the number of variogram models by orders of magnitude.
- Kriging is a geostatistical interpolation technique applied through computer software solutions.
- the preferred embodiment implements the merge process through customized software code to process input RF data from the merged database and output path loss measurements estimated at the global bin locations.
- the merge process is applied to thousands of sectors that can be efficiently performed on a computer.
- Kriging is a linear weighted-averaging method, similar to inverse weighted distance, but kriging weights depend upon a model of spatial correlation, the variogram model.
- Kriging uses the variogram to estimate variability. If a data point is unknown, the weights and values from neighboring points are calculated to find the unknown point of interest. Kriging eliminates bias by accounting for the spatial correlation of the neighboring points in addition to the distances from the point of interest.
- Step three 70 of the merge process is illustrated in the flowchart of Figure 11.
- the neighborhood search 72 finds data points within a defined area of interest.
- the area of interest is typically an elliptic shape centered on the bin 48 of interest.
- the orientation of the ellipse is dictated by the anisotropy in the pattern of spatial continuity.
- the major axis of the search ellipse is oriented on the RF signal data that are more continuous in one direction than another. There is no determinative size to the area of interest or how many samples to include.
- the next step is the computation of the kriging matrix 74 followed by the computation of the right hand side of the kriging system 76.
- the left hand side of the matrix depends on the mutual location of the RF data points present in the neighborhood of the target point.
- the right hand side of the kriging matrix depends on the location of the data points of the neighborhood with regard to the location of the target point. Both left and right hand sides of the matrix must be established each time.
- the vector of the kriging weights are obtained by solving the kriging system 78 of the linear combination of the estimated residuals 80 using the neighbors' and their weights. Finally, the variance of the path loss 82 and the residual 84 at each bin 48 location are calculated.
- Step four 86 of the merge process 58 concludes the kernel with estimations of the trend at the bins 48 and adding the estimated value of the residual.
- the path loss trend at the bins is then computed.
- the kriged residual is then added back to the path loss trend. This results in the computation of the kriged path loss for a specific bin location on the grid.
- FIG. 12 The resulting ability to calculate path loss at a geographic point within the model grid 46 is illustrated in Figure 12.
- Exemplary bins 48 are illustrated with grid lines 46.
- Data value in the center of each bin 50 are labeled Z 1 through Z 6 .
- Point Z a 88 is a geographic point, for example a point located on a road of the basemap, where a path loss measurement is unknown but desired.
- Reporting the results 90 is the last step of the merge process.
- Outputs can be customized depending on the requirements for engineering analysis and goals of optimizing a wireless network.
- the kriging error of the path loss can also be measured and output 92 as a report.
- An example of output data from the merge process can include histograms estimated at each bin location, probability maps showing the probability above or below a given cut-off, and risk maps estimating the value of path loss for a given probability number from 0 to 100%.
- Figure 13 illustrates a graphical representation 94 of estimated path loss data for the drive path illustrated in Figure 4.
- Quality control outputs of the merge process keep an account of the process of the kernel as it proceeds through the modeling processes. These outputs include progress indicators of the merge process steps, progress indicators of the merge process steps in percent of completion, and statistics of the success of the Merge process for each sector analyzed.
- Validation of the model compares the estimated values with measured values. If kriged estimates are unbiased, then averages of the estimated and measured values should be equal. This method is further discussed in copending application 09/567,709 to the same assignee as the present application, and is incorporated herein by reference as if fully set forth herein.
- the final steps of the flowchart in Figure 3 are to apply the modeled parameters to a basemap 96 and output the results 98.
- a goal of finding the kriged path loss is to find the wireless signal data at bins for which no data was collected, the data is questionable, missing, corrupted, or otherwise unusable.
- a weighted linear combination is used to estimate an unknown data value at specific locations. The weights take into account possible clustering and account for distance to the nearby samples. Geographically dispersed data values receive greater emphasis in the path loss interpolations than clustered points.
- Estimations can be a global cumulative distribution, local distribution, or individual data element. The ability to accurately identify areas of interference of cellular channels using geostatistical modeling.
- the geostatistical model can accurately identify areas where interference between channels is occurring and the sources of the interference.
- Another application of the exemplary embodiment of geostatistical modeling of cellular system RF data is to accurately determine the likely server area in a sector.
- the likely server in a sector is the base station that has the strongest signal in a sector to serve a mobile subscriber unit while the unit is located within that sector.
- the service area of each cell overlaps the service area of adjacent cells.
- one of two or more base stations might serve a mobile subscriber unit.
- Service areas are discussed in copending application number 08/887101 Improving a Cellular System to the same assignee as the present application, and is incorporated herein by reference as if fully set forth herein.
- the geostatistical model can also determine the propagation model for an adjacent sector's server area and total propagation area, and server areas and propagation areas from other cells.
- the likely server area of the sector of interest receives interfering signals from other server's signal propagation.
- interfering propagation signals from multiple service areas are modeled and interfering sources and signal propagation determined, thereby providing superior methods to optimize the cellular network.
- Geostatistical modeling can determine where data measurements are lacking in a cellular system and site locations where greater data acquisition is needed. Drive testing a cellular system gathers data from only a fraction of total roads in a cellular system. Data from certain geographic areas within a cell system may yield questionable or inconclusive results after modeling, or data gaps may occur due to interference or topographic factors. Geostatistical modeling of these data areas using the merge process of the preferred embodiment yields numerical and graphical results displayed on a basemap of the system that a system planner can use to accurately determine the locations in the system that require greater data acquisition in subsequent drive tests.
- a further utilization of the geostatistical modeling of RF data is identifying variations in the network caused when signal strength or direction of the antenna has been modified, or new interference is propagated, into a sector.
- Cellular division and frequency reuse depend upon adjusting the angle and tilt of antennas correctly at a base station, creating a server area that minimizes propagation interference of nearby channels.
- Changes in the angle and tilt of an antenna can be identified and graphed using geostatistical techniques. After analyzing and graphing a first set of drive test data with geostatistics, a subsequently acquired set of drive test data from the same sectors that has been similarly analyzed and graphed can be compared to the prior data set for changes in signal propagation.
- a geostatistical model of a cellular network also provides the ability to look beyond a reactionary view to changes in a cell network and accurately predict propagation models of the effects from adjusting angles and tilts.
- geostatistical techniques as implemented in the merge process can greatly reduce the iterations of adjustments of antennas necessary to reduce the propagation interference to other sectors while keeping respective service areas free from interference.
- Geostatistical modeling offers an additional enhanced reporting mechanism to enable a carrier's management team to track and trend growth within a wireless network. Frequency optimization demands the ability to track, trend, and forecast service quality and capital efficiency within a wireless network.
- the merge process methodology uses measured network data and geostatistical modeling techniques, the merge process methodology provides the ability to obtain a graphical and numerical view of optimal frequency plans for cellular networks under different variables. The models can determine the optimal frequency plan based on the current traffic demands and the projected traffic growth.
Abstract
Description
- The present invention relates to cellular telephone systems and to modeling cellular telephone systems for optimizing utilization of the available overall radio spectrum. More particularly, the present invention relates to using measured network data and geostatistical modeling techniques to manage variations and growth within a cellular system and provide improved frequency plans for cellular networks under different variables.
- The service area of a wireless communications system is partitioned into connected service domains known as cells, where radio telephone (cellular) users communicate, via radio links, with the base station serving the cell. The cells can be further partitioned into sectors. The base station is coupled to the public service telephone network (PSTN).
- Presently available commercial mobile communication systems typically include a plurality of fixed cells each of which transmits signals to and receives signals from mobile units within their respective service areas. In AMPS or FDMA systems, each base station is assigned a plurality of channels (each 30KHz wide) within a frequency spectrum over which it can communicate with mobile units. A mobile unit within range of the base station communicates with the base station using these channels. Typically, the channels used by a base station are separated from one another in some manner (typically skipping 1, 7 or 21 intermediate channels) sufficiently that signals on any channel do not interfere with signals on another channel used by that base station. To accomplish this, an operator typically allots to a base station a group of channels each of which is widely separated from the next. So long as a mobile unit is within the area in which the signal from a base station is strong enough and is communicating with only that base station, there is only a slight probability of interference with the communication. The present invention will also operate with GSM and iDEN systems which do not rely on the same frequency divisions multiple access method.
- In a common type of mobile system called Time Division Multiple Access (TDMA), which includes IS-54 and IS-136, GSM and iDEN each frequency channel is further time divided into additional channels within each frequency. Each base station sends and receives in bursts during some number of different intervals or time slots. These time intervals within frequency bands then effectively constitute the individual channels. In order to distinguish the channel divisions within a frequency and to distinguish channels of a common frequency between overlapping cells digital codes are used. For example, IS-136 utilizes Digital Verification Color Codes unique to a channel at a cell, are used. GSM uses Base Station identification codes.
- In order to allow mobile units to transmit and receive telephone communications as the units travel over a wide geographic area, each cell is normally physically positioned so that its area of coverage is adjacent to and overlaps the areas of coverage of a number of other cells. When a mobile unit moves from an area covered by one base station to an area covered by another base station, communications with the mobile unit are transferred (handed off) from one base station to another in an area where the coverage from the adjoining cells overlaps. Because of this overlapping coverage, the channels allotted to the individual cells are carefully selected so that adjoining cells do not transmit or receive on the same channels. This separation is typically accomplished by assigning a group of widely separated non-interfering channels to some central cell and then assigning other groups of widely separated non-interfering channels to the cells surrounding that central cell using a pattern which does not reuse the same channels for the cells surrounding the central cell. The pattern of channel assignments continues similarly with the other cells adjoining the first group of cells. Often adjacent or overlapping cells will transmit on the same frequency and both will be received by a mobile wireless unit. However, because of the digital codes identifying each channel, the mobile wireless unit can process the appropriate signal and ignore any additional reception.
- Geostatistics is a "spatial statistics" tool that can be applied to any practical problem of 1D, 2D, or 3D predictions of a random variable. In addition, it can be applied to 4D predictions of spatio-temporal geostatistics monitoring through time. Geostatistics has been used since the early 1950's for mining engineering, mainly for determining ore reserves estimations and exploitation scenario simulations. Data collected in mining consists of soil cores and cuttings from a limited number boreholes, as well as samples from outcrops. In the early 1960's a basic theoretical framework of geostatistics had been built that set new standard techniques in the mining industry. Over the past 30 years, this theoretical framework has been strengthened and successfully applied for other types of problems such as fluid flow modeling and subsurface wave propagation. The new applications allow the development of new solutions and new concepts within the framework of an advanced geostatistical theory. The objective of these new developments aim to combine "spatial statistics" and "differential equations" describing the behavior of a physical phenomenon. Today, geostatistics is widely recognized as a tool for accurate spatial estimation. Geostatistics has the correct tools to quantify uncertainty and therefore it is considered as a risk assessment tool for field development managers of related industries. Geostatistics has been applied to numerous industrial problems ranging from classical problems of mining oil and gas engineering to more complex and challenging problems such as pricing in a stock market.
- Path loss is the attenuation that occurs as RF signals propagate from a transmitting antenna to a receiving antenna. Path loss data sampling, acquisition, and estimation over a cellular network shows great similarities with standard problems encountered in ore-body or reservoir forecasting. Geostatistics has therefore high potential to be implemented for such purposes. The theory of geostatistics applied to physical phenomenon makes it appropriate to use for combining a propagation model and data measurements for wireless network. This application provides for efficiency in collection and maximum use of collected wireless data that results in precise predictions of missing data in a wireless network. The method quantifies and assesses errors due to any measurement or any estimation process. The method provides downscale information and gives RF engineers a high-resolution model describing the path loss over a given area of interest. The method simulates different scenarios of path loss before a drive or between successive drives that would lead to better strategies of data collection.
- Geostatistical analysis techniques offer a way of describing the spatial continuity that is an essential feature of many natural phenomenon and provide adaptations of classical regression techniques to take advantage of this continuity. In geostatistics, the application of highly developed algorithms modified to the parameters of the provision of cellular service, as taught in the present invention, yields significantly enhanced results over other data smoothing techniques. The purpose of spatial continuity analysis is to quantify the variability of path loss measurements with respect to distance and direction. Geographic location is only considered if the data exhibit a trend, a property known as non-stationarity. Quantifying the spatial information involves comparing data values measured at one location with values of the same attribute measured at other locations. For example, two path loss measurements in close proximity are more likely to have similar values than two path loss measurements further apart. By determining the correlation with respect to separation distance, estimates of the unmeasured locations can be made based upon the values at the measured locations.
- Figure 1 is an exemplary illustration of a expanding cell coverage in a cellular telephone system.
- Figure 2 is an exemplary illustration of radio coverage areas of a cellular telephone system.
- Figure 3 is a flowchart of applying a geostatistical model to RF signal strength data.
- Figure 4 is an exemplary basemap of a city illustrating the location of base tower sites in a cellular telephone system.
- Figure 5 is a graphical view illustrating exemplary successfully decoded digital code signals data obtained in an exemplary no key up drive test of the basemap in Figure 4.
- Figure 6 is a tabular illustration of interference between channels in a cellular telephone system.
- Figure 7 is an exemplary illustration of gaps in RF signal strength data obtained in a drive test.
- Figure 8 illustrates the application of bins to the test area of the basemap in Figure 4.
- Figure 9 is a flowchart of the merge process applying a geostatistical model to RF signal strength data.
- Figure 10 is an illustration of a variogram having decreasing correlation with distance.
- Figure 11 is a flowchart of step three of the merge process applying a geostatistical model to RF signal strength data.
- Figure 12 is an illustration of finding an unknown data point using interpolation techniques.
- Figure 13 is an exemplary graphical view illustrating the results of the geostatistical method to the data of Figure 8.
- A goal of planning and expansion for a cellular telephone system is to determine new base tower locations, and frequency reuse based on propagation distance of radio signals between base stations. RF data is gathered from the system to perform further analysis and refinement of channel traffic, interference, service area, and total propagation area of a base station. Figure 1 is an exemplary illustration of a cellular telephone system. A plurality of antenna towers and base stations 10 are located within a geographic area. Calls from subscriber units 12 are directed through a mobile switching center (MSC) 14, which includes switching equipment needed to interconnect mobile equipment with the public services telephone network (PSTN) 16. Towers 10 tie into a base station switch (BSS) 18, which has a remote switch connected to the PSTN 16. Coverage of a wireless telephone system is typically illustrated with cells in the form of a honeycomb grid 20. When traffic within a base station's service area an antenna 10 becomes overcrowded and subscribers 12 experience an intolerable amount of busy signals or dropped calls, cell 20 division may be implemented to add channels within the system through additional base stations 10. The addition of base stations subdivides the existing cellular system into smaller cells 22, thereby creating greater channel capacity within a coverage area. However, adding channel capacity and balancing frequency reuse between base stations 10 adds complexity to engineering RF signal coverage within a system.
- To add radio channels where spectrum allocation is limited, cellular providers reuse identical channels. The strategy for reusing channels is based on the fact that signal strength decreases exponentially with distance. Therefore, towers 10 that are far enough apart can use the same radio channels without causing interference with each other. Cellular system planning separates cell sites that use the same channels minimize interference.
- Figure 2 illustrates RF coverage areas for three exemplary base station cells. The calculated free space coverage of a cell is the theoretical attenuation limit of the RF signals without interference or blockage. Towers 10 are rarely placed to accurately account for all of the propagation factors that attenuate RF signals. Power levels and channel frequencies are typically adjusted after tower 10 installation. The radio coverage area for area cell A 24 partially overlaps cells B 26 and C 28. This overlap is a potential area for interference between identical channels. The radio coverage area for cells B 26 and C 28 have a hole between them. This hole is a potential area for dropped calls or lack of service coverage due to weak signals.
- The flowchart of Figure 3 generally illustrates the steps of the preferred exemplary embodiment of collecting RF data, modeling the data with geostatistics, and applying modeled parameters to a basemap of the system. To build a raw RF data set 30 from a cellular system, the data is first gathered through a drive test method 32. Collecting data 30 in a drive test 32 is described in copending application 09/567,709 Apparatus and Method for Non-disruptive Collection and Analysis of Wireless Signal Propagation, to the same assignee as the present application, and is incorporated herein by reference as if fully set forth herein. Figure 4 illustrates an exemplary basemap of a city having six cell sites 10, RF1 through RF6. The drive plan 34 is a carefully determined route which will efficiently collect representative RF signal data from a cellular system. The drive plan 34 is established by evaluation of the distribution of the antennas 10 of the cellular system and through analysis of the geographical features of the area of the cellular system. As detailed in copending applications, a vehicle equipped with appropriate cellular signal receiving and measuring equipment is driven through the cellular system in accordance with the drive test plan 34 map to collect actual signal reception data 30. A statistically significant number of measurements are taken throughout the cellular system to determine the relative signal strength between each base station 10 and each mobile unit location.
- A drive test 32 cannot cover all of the area of a cellular system. However, the present invention provides a method to find signal data 30 along the roads not covered by the drive plan 34. Total drive coverage is both impractical and impossible. Typically, an average of only 25% of the roads are covered in a drive test 32. It is impractical to cover all roads in a cellular system because of time and resource limitations. It is impossible because some parts of a cellular system are inaccessible due to natural and man made obstacles. The data 30 obtained by the drive test 32 process is also incomplete even in the areas tested because of the inherent imperfections of actual measurement conditions, even if parts of the drive plan 34 are driven multiple times.
- RF data 30 can be collected unobtrusively in a no key-up method rather than having to shut off channels, as described in copending application 09/567,709 Apparatus and Method for Non-disruptive Collection and Analysis of Wireless Signal Propagation to the same assignee as the present application and is incorporated herein by reference as if fully set forth herein. Digital channels send out color codes in each data frame that indicate the source of the channel. The location and color code data for each signal is gathered as raw cellular RF data 30 collected using a "no key up" method. The combination of channel number and color code creates an identification data point associated with a base station. If the color code can not be decoded during drive testing, the measurements are not able to associate the signal with the source base station. In CDMA, a PN code is the same concept as a color code. As the signal level drops, the ability to decode the color code correspondingly drops. Likewise, as interference increases, the probability of decoding the color code decreases. With the no-key up method, drive test 32 may yield data 30 displayed as data points in Figure 5. The collection equipment must not only determine signal strength but must also decode the digital code associate with the signal which identifies the digital channel and/or sending antenna. Accurately decoding a digital signal is more difficult than reception of raw RF and requires a stronger and/or clearer signal reception.
- Data points from multiple sectors are collected because they can exhibit different propagation characteristics normally found in RF measurement data. Propagation variations can be influenced by urban, suburban, and rural structural differences. In an urban environment, the signal typically propagates strongly along non-intersecting streets with the sector location, decaying rapidly away from the antenna, thereby exhibiting a "tunneling effect."
- Exemplary illustrations of interference between two adjacent towers for a digital cellular system using DVCC are found in Figures 6 and 7. Figure 7 illustrates the result of RF interference in Figure 6. In Figure 6, Tower A 38 transmits with color code five on channels 110, 120, 130, and 140. Tower B 40 transmits with color code 20 on channels 110, 120, 130, and 150. In Figure 7, a drive test 32 along the roads 42 between the two towers 38, 40 gathers DVCC data 30 from both towers. Channels from the towers 38, 40 are unique except for channels 120 and 130. The color code from channels 120 and 130 can not be decoded due to interference between the similar channels. Therefore, the source of a signal on these two channels can not be identified even though a power level can be detected and a data gap 44 is formed. At similar power levels, a drive test 32 could collect a color code from channels unique to each tower. Each mark on a road 42 represents a data collection point from such signals. Where propagation signals from tower A 38 and tower B 40 intersect, interference could result in a data gap 44. Data 30 may have interference from identical channels, and a drive test 32 will collect a signal measurement but not decode the color code if significant interference exists between the identical channels, resulting in significant gaps 44 the data collection 30. The existence of gaps 44 in the collected data 30 gives rise to the need for the interpretation of the data 30 as taught in the present invention to fill in the gaps 44.
- The measurement area in the system is divided into a grid 46 in Figure 8. A grid is used to optimize data collection and sampling rates in a model. A bin 48 is one cell of the grid. Data analysis 52 of Figure 3 includes the process of binning average values of RF data 30 within a grid cell 48 to a value 50 located in the center of each bin 48. Therefore, each bin location 48 analyzed has a single RF data value 50 representing all the RF values within that particular bin location 48. The averaging of the data 30 reduces distortions which could result from a greater number of measurements in some areas and a lesser concentration of measurements in other areas. When conducting a drive test 32, sampling is performed at a constant rate, however, the rate of travel of the sampling vehicle may vary and therefore a greater number of data samples 30 will be obtained in an area where the vehicle is traveling slower. In the exemplary embodiment, a 100m X 100m grid 46 is overlaid onto the cellular system. The grid 46 size and shape can vary. Varying shapes and densities of bins 48 within a grid are possible and sometimes useful for dense distributions of data within a cellular system.
- The next step of RF signal data analysis 52 is organizing the data. Data 30 collected from drive tests are organized and merged into a common database 54. A geostatistical model 56 is then built from the data in the merged database 54. A goal of the modeling step 56 is to create a geostatistical model that can estimate a value of a bin 48 based on the known values of surrounding bins 48 within a high degree of certainty. Generally, modeling 56 of cellular RF signals using geostatistical techniques comprises modeling known samples of data 30 to describe the variability of the data. The method of the preferred embodiment builds RF data models from a sample set of raw RF signals 30 produced by base stations 10 in a cellular system area. The models 56 are optimized to match measured data and show signal loss and radio interference beyond the sample data set, as well as co-channel interference.
- Modeled wireless RF signal data 56 can show the existence of large-scale trend effects. At a lower scale level, data is assumed to be stationary. To estimate the path loss, two methods can be utilized: working with transformed data to a normal variable and kriging in the normal space then get back to the real space; and the preferred exemplary method of de-trending the RF data using an empirical trend estimate with the least square fit of the relationship "path loss" vs. "distance".
- The merge process 58, illustrated in the flowchart of Figure 9, is a tool for RF path loss data pre-processing using the geostatistical modeling technique of kriging. For each sector at a base station 10, RF path loss measurements are given in raw format 54. Using the method of the exemplary embodiment, path loss measurements are processed in such a way to estimate a path loss at the bins 48 for the entire list of sectors at the global bin locations. The kernel of the merge process is the estimation workflow procedure found in Steps 1 through 4 on Figure 9. It is mathematically consistent and is designed within the framework of geostatistics. The form of the kernel is based on estimating and filtering a lognormal path loss trend. The Best Linear Unbiased Estimator (BLUE), known as the kriging, is applied to compute residuals and the underlying uncertainty. Residuals are path loss data that have the natural attenuation of radio signals away from a base station removed from the path loss data measurement. The final results are called the kriging estimate and kriging error of the path loss. The estimator is a linear function of the data with weights calculated according to the specifications of unbiasedness and minimum variance. The unbiasedness means that on the average the error of estimation is zero. Minimum variance means that the square estimation error is as small as possible. In selecting the weights of the linear estimator, kriging accounts for the relative distance of measurements from each other and from the location where an estimate is sought. The weights are determined by solving a system of linear equations with coefficients that depend on the variogram that describes the spatial structure of the data.
- The basic merge loop begins with the step of reading the input data 60 from the path loss database and searching for duplicates 62 in the raw data 54. This data is read from the RF signal path loss measurements database 54 that was merged from the raw test drive data 30. The purpose of this step 60 is to eliminate any possibility of having non-reversible system matrix during the kriging. The data 54 will be treated in such a way that duplicated data elements are eliminated. Duplicate data may be due to overlapping drives or several measurements taken at the same location.
- RF data 54 coordinates are measured according to either the local coordinates or global coordinates at a site and transferred to the basemap. Typically, either latitude and longitude or UTM-X and UTM-Y coordinate systems are used on the drive plan basemap 34. The number of bins 48 depend upon the input size of the grid 46 that overlays the basemap 34. The number, location, value and other parameters of input data elements36 are all found from the records in the merged database 54 as organized for preprocessing.
- Step two 64 of the merge process begins with the estimation of the trend via a least square mean fit algorithm and filtering the trend from the path loss. Trend is assumed to be a logarithmic function, which is a function of the physical phenomenon of RF signal attenuation. Attenuation of a wireless signal is the decrease of the signal strength exponentially with distance away from the signal source. Detrending of the data 66 is performed in order to split the deterministic and random part of the path loss. The simplest method for detrending data 66 is using ordinary least squares method. Therefore, at each bin 48 where a path loss value is located, the trend at the bin 48 is estimated by plotting the path loss versus the log of the distance and use a least squares regression method according to
- For each RF measurement point (xm, ym), x refers to the radial distance dm, where
- Restated then, for each measurement point (xm,ym), the path loss trend is found with:
- Therefore, to find the path loss residual, the formula
- Non-stationarity is expected because the Path Loss (signal) decays in free space and is approximately 20 log10[R], where R is the distance from the antenna. Assumptions for the purposes of the merge process are that the computations result in quasi-stationary residuals. The trend is also assumed to be omni-directional in spatial continuity. The assumption does not imply a belief that spatial continuity is the same for the trend in all directions. The assumption serves the use of focusing on distance parameters of the trend for simplified calculations. The assumption can be modified to include directional trends if the trend is derived in each direction.
- Kriging the residuals at the bins is step three 70 of the merge process. Prior to kriging, a variogram, such as the exemplary variogram 72 in Figure 10, describing the system's spatial continuity is developed or assumed. In the exemplary embodiment, variogram 72 properties are known through a catalogue of different type of path loss spatial behavior. These assumptions can be optional depending on their relevancy to new data sets. Methods to overcome the assumptions include using the non-stationary geostatistical framework as an alternative. Such an alternative requires development of a generalized variogram within the framework of the Intrinsic Random Function (IRFk) theory.
- The variogram γ(h) term is a measure of dissimilarity, or increasing variance as a function of distance. The variogram is the sum of the squared differences of all data pairs falling within a lag divided by twice the number of pairs found for that lag. Computing and plotting γ(h) as a function of increasing lag distance, h , results in a plot of the experimental variogram72.
- With increasing distance, γ(h) tends to reach a constant value known as the sill. For a variogram, the sill is the variance (σ) of the measured data. The distance at which the sill is reached by the variogram is called the range or correlation length. The sill and range are useful properties when comparing directional trends in the data. Figure 10 illustrates a hypothetical anisotropic variogram 72 showing a short scale correlation range of 800 meters and a long scale range of 2200 m.
- In an alternative exemplary embodiment, parameters of the variogram are modeled from the data set. The steps to variogram modeling are run a variogram on collected data, feeding the variogram to theoretical model, and fitting the variogram to the measured data's variogram. For each azimuth and lag (separation) distance studied, all measured values can be spatially correlated and expressed as the statistical value known as the variogram, and is calculated using the following expression:
- In an additional alternative embodiment, different experimental variograms are computed, including near range, long range anisotropic and long range omni-directional. Better predictions can be made by accounting for anisotropy in the data. Anisotropic variograms account for scalar distance in one direction, all measured with the same distance between pairs of data points. The near range variogram and long range variograms for RF signal measurements demonstrate that RF data has an inherent trend of diminishing power as a function of distance. Data with an inherent trend is referred to as non-stationary and will tend not to flatten at the sill (variance = 1.0), rather it continues to increase in variance with distance. Non-stationarity is expected because path loss decays in Free Space as approximately 20 log10[R], where R is the distance from the antenna. Correct variogram modeling requires modeling residuals to avoid biasing the interpolated values during geostatistical analysis of the data.
- In an additional alternative embodiment, finding a universal variogram is based on the entire set of data from all cellular system sectors that has been reduced by the dimensionality of the process. A wireless system may theoretically contain hundreds of sectors. Instead of modeling each sector, lists of correlated sectors are made. The principal component analysis is applied to reduce each correlated sector list to a representative component. This method can reduce the number of variogram models by orders of magnitude.
- Kriging is a geostatistical interpolation technique applied through computer software solutions. The preferred embodiment implements the merge process through customized software code to process input RF data from the merged database and output path loss measurements estimated at the global bin locations. The merge process is applied to thousands of sectors that can be efficiently performed on a computer. Kriging is a linear weighted-averaging method, similar to inverse weighted distance, but kriging weights depend upon a model of spatial correlation, the variogram model. Kriging uses the variogram to estimate variability. If a data point is unknown, the weights and values from neighboring points are calculated to find the unknown point of interest. Kriging eliminates bias by accounting for the spatial correlation of the neighboring points in addition to the distances from the point of interest.
- Step three 70 of the merge process is illustrated in the flowchart of Figure 11. The neighborhood search 72 finds data points within a defined area of interest. For anisotropic data, the area of interest is typically an elliptic shape centered on the bin 48 of interest. The orientation of the ellipse is dictated by the anisotropy in the pattern of spatial continuity. The major axis of the search ellipse is oriented on the RF signal data that are more continuous in one direction than another. There is no determinative size to the area of interest or how many samples to include. The next step is the computation of the kriging matrix 74 followed by the computation of the right hand side of the kriging system 76. The left hand side of the matrix depends on the mutual location of the RF data points present in the neighborhood of the target point. The right hand side of the kriging matrix depends on the location of the data points of the neighborhood with regard to the location of the target point. Both left and right hand sides of the matrix must be established each time. The vector of the kriging weights are obtained by solving the kriging system 78 of the linear combination of the estimated residuals 80 using the neighbors' and their weights. Finally, the variance of the path loss 82 and the residual 84 at each bin 48 location are calculated.
- Step four 86 of the merge process 58 concludes the kernel with estimations of the trend at the bins 48 and adding the estimated value of the residual. The path loss trend at the bins is then computed. The kriged residual is then added back to the path loss trend. This results in the computation of the kriged path loss for a specific bin location on the grid.
- The resulting ability to calculate path loss at a geographic point within the model grid 46 is illustrated in Figure 12. Exemplary bins 48 are illustrated with grid lines 46. Data value in the center of each bin 50 are labeled Z1 through Z6. Point Za 88 is a geographic point, for example a point located on a road of the basemap, where a path loss measurement is unknown but desired. Values Z1 through Z6 are the neighboring data points chosen for the kriging process. After kriging the neighborhood, weights are calculated for each bin count. The following equation is then applied to find the RF path loss value at Za:
- Reporting the results 90 is the last step of the merge process. Outputs can be customized depending on the requirements for engineering analysis and goals of optimizing a wireless network. The kriging error of the path loss can also be measured and output 92 as a report. An example of output data from the merge process can include histograms estimated at each bin location, probability maps showing the probability above or below a given cut-off, and risk maps estimating the value of path loss for a given probability number from 0 to 100%. Figure 13 illustrates a graphical representation 94 of estimated path loss data for the drive path illustrated in Figure 4.
- Quality control outputs of the merge process keep an account of the process of the kernel as it proceeds through the modeling processes. These outputs include progress indicators of the merge process steps, progress indicators of the merge process steps in percent of completion, and statistics of the success of the Merge process for each sector analyzed.
- Validation of the model compares the estimated values with measured values. If kriged estimates are unbiased, then averages of the estimated and measured values should be equal. This method is further discussed in copending application 09/567,709 to the same assignee as the present application, and is incorporated herein by reference as if fully set forth herein.
- The final steps of the flowchart in Figure 3 are to apply the modeled parameters to a basemap 96 and output the results 98. A goal of finding the kriged path loss is to find the wireless signal data at bins for which no data was collected, the data is questionable, missing, corrupted, or otherwise unusable. To estimate an unknown data value at specific locations, a weighted linear combination is used. The weights take into account possible clustering and account for distance to the nearby samples. Geographically dispersed data values receive greater emphasis in the path loss interpolations than clustered points. Estimations can be a global cumulative distribution, local distribution, or individual data element. The ability to accurately identify areas of interference of cellular channels using geostatistical modeling. Using the merge process of the preferred embodiment, a high confidence level of the quality of the data can be gained. With the ability to accurately estimate a data value at any point in the cellular system, the geostatistical model can accurately identify areas where interference between channels is occurring and the sources of the interference.
- Another application of the exemplary embodiment of geostatistical modeling of cellular system RF data is to accurately determine the likely server area in a sector. The likely server in a sector is the base station that has the strongest signal in a sector to serve a mobile subscriber unit while the unit is located within that sector. To give the mobile unit uninterrupted service over a wide area, the service area of each cell overlaps the service area of adjacent cells. Within the overlapping areas, one of two or more base stations might serve a mobile subscriber unit. Service areas are discussed in copending application number 08/887101 Improving a Cellular System to the same assignee as the present application, and is incorporated herein by reference as if fully set forth herein. Through geostatistics, an accurate measurement of the likely server area for a sector can be determined. The geostatistical model can also determine the propagation model for an adjacent sector's server area and total propagation area, and server areas and propagation areas from other cells. The likely server area of the sector of interest receives interfering signals from other server's signal propagation. Using geostatistics, interfering propagation signals from multiple service areas are modeled and interfering sources and signal propagation determined, thereby providing superior methods to optimize the cellular network.
- Geostatistical modeling can determine where data measurements are lacking in a cellular system and site locations where greater data acquisition is needed. Drive testing a cellular system gathers data from only a fraction of total roads in a cellular system. Data from certain geographic areas within a cell system may yield questionable or inconclusive results after modeling, or data gaps may occur due to interference or topographic factors. Geostatistical modeling of these data areas using the merge process of the preferred embodiment yields numerical and graphical results displayed on a basemap of the system that a system planner can use to accurately determine the locations in the system that require greater data acquisition in subsequent drive tests.
- A further utilization of the geostatistical modeling of RF data is identifying variations in the network caused when signal strength or direction of the antenna has been modified, or new interference is propagated, into a sector. Cellular division and frequency reuse depend upon adjusting the angle and tilt of antennas correctly at a base station, creating a server area that minimizes propagation interference of nearby channels. Changes in the angle and tilt of an antenna can be identified and graphed using geostatistical techniques. After analyzing and graphing a first set of drive test data with geostatistics, a subsequently acquired set of drive test data from the same sectors that has been similarly analyzed and graphed can be compared to the prior data set for changes in signal propagation. A geostatistical model of a cellular network also provides the ability to look beyond a reactionary view to changes in a cell network and accurately predict propagation models of the effects from adjusting angles and tilts. By predicting server areas and propagation models geostatistical techniques as implemented in the merge process can greatly reduce the iterations of adjustments of antennas necessary to reduce the propagation interference to other sectors while keeping respective service areas free from interference.
- Geostatistical modeling offers an additional enhanced reporting mechanism to enable a carrier's management team to track and trend growth within a wireless network. Frequency optimization demands the ability to track, trend, and forecast service quality and capital efficiency within a wireless network. Using measured network data and geostatistical modeling techniques, the merge process methodology provides the ability to obtain a graphical and numerical view of optimal frequency plans for cellular networks under different variables. The models can determine the optimal frequency plan based on the current traffic demands and the projected traffic growth.
- Although the present invention has been described in terms of preferred embodiments, it will be appreciated that various modifications and alterations, might be made by those skilled in the art without departing from the spirit and scope of the invention. The above-described exemplary embodiments are therefore intended to be illustrative in all respects, rather than restrictive, of the present invention. Thus the present invention is capable of many variations in detailed implementation that can be derived from the description contained herein. All such variations and modifications are considered to be within the scope and spirit of the present invention as defined by the following claims.
Claims (37)
- A method for assessing RF propagation in a wireless communication system, comprising the steps of:collecting measured RF path loss data within said wireless communication system corresponding to known geographic locations within said wireless communication system;interpolating said measured RF path loss data;establishing a data set of interpolated path loss signal strength levels from said collected measured path loss data;creating a final RF propagation data set including said measured data for said known geographic locations and selected data points from said interpolated data set for geographic locations having no corresponding measured data.
- A method for assessing RF propagation in a wireless communication system according to Claim 1, wherein:said creating a final RF propagation data set includes factoring into said interpolation a correlation that varies as a function of distance.
- A method for assessing RF propagation in a wireless communication system according to Claim 1, further including:utilizing said final RF propagation data set to determine data values for geographic locations not associated with any said data values within said wireless system.
- A method for assessing RF propagation in a wireless communication system according to Claim 1, wherein:the weights of dispersed neighboring data values are equilibrated to clustered neighboring data values for said interpolation technique.
- A method for assessing RF propagation in a wireless communication system according to Claim 1, further comprising:interpolating a plurality of data sources utilizing the variance of said data sources to weight the significance of said data.
- A method for assessing RF propagation in a wireless communication system according to Claim 1, further comprising:utilizing said final RF propagation data set to plan additional collection of said measured RF path loss data.
- A method for assessing RF propagation in a wireless communication system according to Claim 1, further comprising:creating a first final propagation data set in said wireless system;creating a second updated propagation data set after a predetermined elapse of time after said creation of said first propagation model, to monitor network changes over time.
- A method for assessing RF propagation in a wireless communication system, comprising the steps of:collecting wireless signal data from one or more wireless base stations;associating the data elements of said wireless signal data with geographic locations corresponding to the location at which each said data element was gathered;associating said data elements with a source;applying an interpolation model to said wireless signal data based on a spatial continuity analysis;using said interpolation model to manage a wireless network.
- A method for assessing RF propagation in a wireless communication system according to Claim 8, wherein:said step of associating said data elements with a source includes identifying a digital identification code within said wireless signal data.
- A method for assessing RF propagation in a wireless communication system according to Claim 9, wherein:said step of identifying a digital identification code includes utilizing a rapid color code decoder to increase the probability of obtaining information under adverse conditions.
- A method for assessing RF propagation in a wireless communication system according to Claim 8, wherein:said step of using said model to manage a wireless network includes determining probable signal strength path loss values of unknown data elements at known geographical locations within said wireless system.
- A method for assessing RF propagation in a wireless communication system according to Claim 8, wherein:said interpolation model utilizes geostatistical techniques.
- A method for assessing RF propagation in a wireless communication system according to Claim 8, further comprising the step of:said applying a geostatistical interpolation model includes applying a linear weighted-averaging method depending upon a model of spatial correlation.
- A method for assessing RF propagation in a wireless communication system according to Claim 8, further comprising the step of:defining a spatial trend in said gathered wireless data;detrending said wireless data by filtering said spatial trend from said wireless data; andutilizing said detrended wireless data in the step of said applying a geostatistical model to said wireless signal data.
- A method for assessing RF propagation in a wireless communication system according to Claim 8, wherein:said applying an interpolation model includes:creating a model consisting of a plurality of bins overlaying at least part of said wireless system;creating a second residual data set by removing a spatial trend from said data at each said bin;interpolating said second residual data set using geostatistical techniques;adding said spatial trend data to said interpolated second residual data set;reporting wireless signal path loss estimations at said bins.
- A method for assessing RF propagation in a wireless communication system according to Claim 15, wherein:said step of interpolating said second residual data set using geostatistical techniques includes kriging, cokriging, kriging with external drift, or colocation cokriging to calculate path losses of said wireless signal data.
- A method for assessing RF propagation in a wireless communication system according to Claim 16,wherein said interpolation techniques include:searching a neighborhood of said wireless signal data near a bin;computation of a kriging matrix;finding the weights of linear combinations of said neighboring values and weights of said neighboring values;calculating the variance of the estimation of the path loss;computing the estimated residual data point at a bin location.
- A method for assessing RF propagation in a wireless communication system, comprising the steps of:collecting wireless signal data from one or more wireless base stations;associating the data elements of said wireless signal data with geographic locations corresponding to the location at which each said data element was gathered;associating said data elements with a source;applying an interpolation model to said wireless signal data based on a spatial continuity analysis;using said interpolation model to determine probable signal strength path loss values of unknown data elements at known geographical locations within said wireless system.
- A method for assessing RF propagation in a wireless communication system according to claim 18,wherein:said interpolation model is based upon geostatistical techniques.
- A method for assessing RF propagation in a wireless communication system, comprising the steps of:creating a model consisting of a plurality of bins overlaying at least part of a wireless system;creating residuals by removing a spatial trend from said data at said bins;modeling said residuals with an interpolation technique based on spatial continuity analysis;adding said spatial trend data to modeled residuals;reporting modeled path loss data at said bins.
- The method of claim 20, wherein said removing a spatial trend from said data includes:recognizing a spatial trend in said gathered wireless data;detrending said wireless data by filtering said spatial trend from said wireless data; andutilizing said detrended data in the step of said applying a geostatistical interpolation technique to said wireless signal data.
- A method for assessing RF propagation in a wireless communication system according to claim 20,wherein:said step of modeling said path loss measurements with an interpolation technique based on spatial continuity analysis includes geostatistical interpolation techniques.
- A method for assessing RF propagation in a wireless communication system according to claim 22,wherein:said step of modeling said path loss measurements with geostatistical techniques includes kriging, cokriging, kriging with external drift, or colocation cokriging to calculate path losses of said wireless signal data.
- A method for assessing RF propagation in a wireless communication system, comprising the steps of:collecting data sets of measured path loss signal strength levels gathered from within said wireless system from known geographic locations within said wireless communication system;analyzing said data sets using multivariate statistical techniques;deriving independent parameter sets from said multivariate statistical analysis of said data set for input into a plurality of propagation models of said data sets, each said model corresponding to one of said multivariate statistical analysis.
- A method for assessing RF propagation in a wireless communication system according to claim 24,wherein:said multivariate statistical analysis includes multivariate geostatistical analysis techniques.
- A method for assessing RF propagation in a wireless communication system, comprising the steps of:collecting data sets of measured path loss signal strength levels gathered from within said wireless system from known geographic locations within said wireless communication system;analyzing said data sets using spatio-temporal statistical techniques;deriving propagation interpolation parameters for determining the likely RF propagation value for unmeasured geographic locations within said wireless system.
- A method for assessing RF propagation in a wireless communication system according to Claim 26,wherein:said spatio-temporal statistical techniques includes geostatistical techniques.
- An apparatus for assessing RF propagation in a wireless communication system, comprising:wireless receiving equipment for gathering wireless signal data from one or more wireless base stations;geographic location equipment connected to said wireless receiving equipment for associating the data elements of said wireless signal data with geographic locations corresponding to the location at which each said data element was gathered;signal strength measuring equipment for determine the signal strength of each element of said gathered data;digital decoding equipment for identifying a digital identification code within said gathered data;a processor for establishing a data set of interpolated path loss signal strength levels from said collected measured path loss data; and creating a final RF propagation data set including said measured data for said known geographic locations and selected data points from said interpolated data set for geographic locations having no corresponding measured data.
- An apparatus for assessing RF propagation in a wireless communication system according to Claim 28,wherein:said processor factors into said interpolation a correlation that varies as a function of distance.
- An apparatus for assessing RF propagation in a wireless communication system according to Claim 28, wherein:said processor utilizes said final RF propagation data set to determine data values for geographic locations not associated with any said data values within said wireless system.
- An apparatus for assessing RF propagation in a wireless communication system according to Claim 28,wherein:the weights of dispersed neighboring data values are equilibrated to clustered neighboring data values for said interpolation technique.
- An apparatus for assessing RF propagation in a wireless communication system according to Claim 28, further comprising:said processor interpolating a plurality of data sources utilizing the variance of said data sources to weight the significance of said data.
- An apparatus for assessing RF propagation in a wireless communication system according to Claim 28,further comprising:said processor interpolates a plurality of data sources utilizing the variance of said data sources to weight the significance of said data.
- An apparatus for assessing RF propagation in a wireless communication system according to Claim 28,further comprising:said processor utilizing said final RF propagation data set to plan additional collection of said measured RF path loss data.
- An apparatus for assessing RF propagation in a wireless communication system according to Claim 28, further comprising:said processor creating a first final propagation data set in said wireless system;said processor creating a second updated propagation data set after a predetermined elapse of time after said creation of said first propagation model, to monitor network changes over time.
- An apparatus for assessing RF propagation in a wireless communication system, comprising:wireless receiving equipment for gathering wireless signal data from one or more wireless base stations;geographic location equipment connected to said wireless receiving equipment for associating the data elements of said wireless signal data with geographic locations corresponding to the location at which each said data element was gathered;signal strength measuring equipment for determine the signal strength of each element of said gathered data;digital decoding equipment for identifying a digital identification code within said gathered data;a processor for associating said data elements with a source; and for applying an interpolation model to said wireless signal data based on a spatial continuity analysis; and for using said interpolation model to determine probable signal strength path loss values of unknown data elements at known geographical locations within said wireless system.
- An apparatus for assessing RF propagation in a wireless communication system according to Claim 36,wherein:said interpolation model utilized geostatistical interpolation techniques.
Priority Applications (1)
| Application Number | Priority Date | Filing Date | Title |
|---|---|---|---|
| EP05112375A EP1662827B1 (en) | 2000-07-21 | 2000-09-14 | Apparatus and method for geostatistical analysis of wireless signal propagation |
Applications Claiming Priority (2)
| Application Number | Priority Date | Filing Date | Title |
|---|---|---|---|
| US620850 | 2000-07-21 | ||
| US09/620,850 US6711404B1 (en) | 2000-07-21 | 2000-07-21 | Apparatus and method for geostatistical analysis of wireless signal propagation |
Related Child Applications (1)
| Application Number | Title | Priority Date | Filing Date |
|---|---|---|---|
| EP05112375A Division EP1662827B1 (en) | 2000-07-21 | 2000-09-14 | Apparatus and method for geostatistical analysis of wireless signal propagation |
Publications (3)
| Publication Number | Publication Date |
|---|---|
| EP1175115A2 true EP1175115A2 (en) | 2002-01-23 |
| EP1175115A3 EP1175115A3 (en) | 2002-05-15 |
| EP1175115B1 EP1175115B1 (en) | 2006-02-15 |
Family
ID=24487674
Family Applications (2)
| Application Number | Title | Priority Date | Filing Date |
|---|---|---|---|
| EP00119460A Expired - Lifetime EP1175115B1 (en) | 2000-07-21 | 2000-09-14 | Apparatus and method for geostatistical analysis of wireless signal propagation |
| EP05112375A Expired - Lifetime EP1662827B1 (en) | 2000-07-21 | 2000-09-14 | Apparatus and method for geostatistical analysis of wireless signal propagation |
Family Applications After (1)
| Application Number | Title | Priority Date | Filing Date |
|---|---|---|---|
| EP05112375A Expired - Lifetime EP1662827B1 (en) | 2000-07-21 | 2000-09-14 | Apparatus and method for geostatistical analysis of wireless signal propagation |
Country Status (9)
| Country | Link |
|---|---|
| US (1) | US6711404B1 (en) |
| EP (2) | EP1175115B1 (en) |
| JP (1) | JP2002057614A (en) |
| KR (1) | KR100803677B1 (en) |
| AR (1) | AR026455A1 (en) |
| AT (2) | ATE318057T1 (en) |
| BR (1) | BR0004214A (en) |
| CA (1) | CA2325075A1 (en) |
| DE (2) | DE60025978T2 (en) |
Cited By (19)
| Publication number | Priority date | Publication date | Assignee | Title |
|---|---|---|---|---|
| WO2006096923A1 (en) * | 2005-03-18 | 2006-09-21 | Seeker Wireless Pty Limited | Enhanced mobile location |
| WO2007056552A2 (en) * | 2005-11-08 | 2007-05-18 | Siemens Technology-To-Business Center, Llc | Radio frequency planning with consideration of inter-building effects |
| US7379829B2 (en) | 2006-02-23 | 2008-05-27 | Siemens Aktiengesellschaft | Method and apparatus for automated characterization of objects with unknown RF characteristics |
| WO2008123809A1 (en) * | 2007-04-04 | 2008-10-16 | Telefonaktiebolaget Lm Ericsson (Publ) | Method and arrangement for improved radio network planning, simulation and analyzing in telecommunications |
| US7583855B2 (en) * | 2006-02-23 | 2009-09-01 | Siemens Aktiengesellschaft | Signal source data input for radio frequency planning |
| EP2254362A1 (en) * | 2008-03-11 | 2010-11-24 | ZTE Corporation | Testing method and system for the wireless signal propagation model of the cellular network |
| GB2473514A (en) * | 2009-09-09 | 2011-03-16 | Arieso Ltd | Method and apparatus for deriving pathloss estimation values |
| US8244236B2 (en) | 2010-04-29 | 2012-08-14 | Wavemarket, Inc. | System and method for aggregating and disseminating mobile device tag data |
| US8359044B2 (en) | 2005-03-18 | 2013-01-22 | Wavemarket, Inc. | Enhanced mobile location method and system |
| US8463285B2 (en) | 2005-04-08 | 2013-06-11 | Wavemarket, Inc. | Systems and methods for mobile terminal location determination using profiles of radio signal parameter measurements |
| US8504077B2 (en) | 2010-12-04 | 2013-08-06 | Wavemarket, Inc. | System and method for monitoring and disseminating mobile device location information |
| US8737985B2 (en) | 2007-11-26 | 2014-05-27 | Wavemarket, Inc. | Methods and systems for zone creation and adaption |
| US8787171B2 (en) | 2008-04-07 | 2014-07-22 | Wavemarket, Inc. | Efficient collection of wireless transmitter characteristics |
| US8798613B2 (en) | 2007-09-17 | 2014-08-05 | Wavemarket, Inc. | Systems and method for triggering location based voice and/or data communications to or from mobile ratio terminals |
| CN105069298A (en) * | 2015-08-14 | 2015-11-18 | 华中农业大学 | Estimation method of node missing data in agricultural product information collecting system |
| US9402155B2 (en) | 2014-03-03 | 2016-07-26 | Location Labs, Inc. | System and method for indicating a state of a geographic area based on mobile device sensor measurements |
| US9438685B2 (en) | 2013-03-15 | 2016-09-06 | Location Labs, Inc. | System and method for display of user relationships corresponding to network-enabled communications |
| EP3700253A1 (en) * | 2019-02-25 | 2020-08-26 | P3 Communications GmbH | Predicting geographical distribution of mobile communication network quality |
| US11445379B2 (en) * | 2020-09-29 | 2022-09-13 | At&T Intellectual Property I, L.P. | Facilitating heterogeneous network analysis and resource planning for advanced networks |
Families Citing this family (96)
| Publication number | Priority date | Publication date | Assignee | Title |
|---|---|---|---|---|
| US6587781B2 (en) * | 2000-08-28 | 2003-07-01 | Estimotion, Inc. | Method and system for modeling and processing vehicular traffic data and information and applying thereof |
| US7035632B2 (en) * | 2000-09-26 | 2006-04-25 | Scoreboard, Inc. | Path loss data normalization for growth management of a cellular system |
| AU2002253958A1 (en) * | 2001-02-15 | 2002-08-28 | Invertix Corporation | System and method for providing location information concerning wireless handsets via the internet |
| GB0105910D0 (en) * | 2001-03-09 | 2001-04-25 | Cellular Design Services Ltd | Measurement-based prediction method for radiation path loss |
| US7095983B1 (en) * | 2001-03-30 | 2006-08-22 | Bellsouth Intellectual Property Corporation | System and method for determining mobile communication system carrier frequency propagation characteristics |
| US6704286B2 (en) * | 2002-05-28 | 2004-03-09 | Interdigital Technology Corporation | Modeling of hybrid time-code division multiple access communication systems |
| AU2003259357B2 (en) * | 2002-08-29 | 2009-08-13 | Inrix Uk Limited | Apparatus and method for providing traffic information |
| US7773985B2 (en) * | 2003-09-22 | 2010-08-10 | United Parcel Service Of America, Inc. | Symbiotic system for testing electromagnetic signal coverage in areas near transport routes |
| US7660577B2 (en) * | 2003-09-22 | 2010-02-09 | United Parcel Service Of America, Inc. | Network testing systems and methods |
| US7209710B2 (en) * | 2003-10-31 | 2007-04-24 | Agilent Technologies, Inc. | Bandwidth management in a wireless measurement system using statistical processing of measurement data |
| US6993442B2 (en) * | 2004-05-14 | 2006-01-31 | Agilent Technologies, Inc. | Adaptive data collection |
| US7620402B2 (en) * | 2004-07-09 | 2009-11-17 | Itis Uk Limited | System and method for geographically locating a mobile device |
| JP2006042566A (en) * | 2004-07-30 | 2006-02-09 | Yazaki Corp | Feeding device |
| US7643936B1 (en) | 2004-11-19 | 2010-01-05 | Sprint Spectrum L.P. | Method and system for automatic analysis and management of drive test routes |
| US8060102B2 (en) * | 2004-12-14 | 2011-11-15 | Bce Inc. | System and method for coverage analysis in a wireless network |
| WO2006116766A1 (en) * | 2005-04-27 | 2006-11-02 | The Regents Of The University Of California | Physics-based statistical model and simulation method of rf propagation in urban environments |
| US7392017B2 (en) * | 2005-06-30 | 2008-06-24 | Google Inc. | Assessing wireless network quality |
| US7522918B2 (en) * | 2005-07-08 | 2009-04-21 | Cta Communications, Inc. | Method and System for Evaluating Radio Coverage |
| BRPI0617807A2 (en) * | 2005-10-24 | 2011-08-09 | Seeker Wireless Pty Ltd | method for detecting an inconsistency between a radiocommunications network and a network database, network processor, radiocommunications network, and method for detecting a nonoperating cell in a radiocommunication network |
| RU2008122355A (en) * | 2005-11-04 | 2009-12-10 | Сикер Уайрлесс Пти Лимитед (Au) | COMMUNICATION-BASED SERVICE PROFILE |
| US8359288B1 (en) | 2005-12-30 | 2013-01-22 | Dp Technologies, Inc. | Method and apparatus to utilize sensor, monitor, device (SMD) data based on location |
| US20070243904A1 (en) * | 2006-04-13 | 2007-10-18 | Chin Frances M | Customized wallpaper to called party mobile terminal |
| US7865194B2 (en) * | 2006-04-13 | 2011-01-04 | Carrier Iq, Inc. | Systems and methods for characterizing the performance of a wireless network |
| US7551579B2 (en) | 2006-05-08 | 2009-06-23 | Skyhook Wireless, Inc. | Calculation of quality of wlan access point characterization for use in a wlan positioning system |
| US7515578B2 (en) * | 2006-05-08 | 2009-04-07 | Skyhook Wireless, Inc. | Estimation of position using WLAN access point radio propagation characteristics in a WLAN positioning system |
| US7554440B2 (en) * | 2006-07-25 | 2009-06-30 | United Parcel Service Of America, Inc. | Systems and methods for monitoring travel conditions |
| EP2070053A2 (en) * | 2006-09-12 | 2009-06-17 | Itis Holdings PLC | Apparatus and method for implementing a road pricing scheme |
| US9351171B2 (en) * | 2006-09-26 | 2016-05-24 | Polaris Wireless, Inc. | Efficient deployment of mobile test units to gather location-dependent radio-frequency data |
| KR101209576B1 (en) * | 2006-09-26 | 2012-12-07 | 미쓰비시덴키 가부시키가이샤 | Data communication method and mobile communication system |
| US20080077472A1 (en) * | 2006-09-26 | 2008-03-27 | Polaris Wireless, Inc. | Efficient Deployment of Mobile Test Units to Gather Location-Dependent Radio-Frequency Data |
| US20080077516A1 (en) * | 2006-09-26 | 2008-03-27 | Polaris Wireless, Inc. | Efficient Deployment of Mobile Test Units to Gather Location-Dependent Radio-Frequency Data |
| WO2008044783A1 (en) * | 2006-10-06 | 2008-04-17 | Nec Corporation | Radio lan system communication quality evaluation method, communication quality evaluation device, and communication quality evaluation program |
| US7856234B2 (en) | 2006-11-07 | 2010-12-21 | Skyhook Wireless, Inc. | System and method for estimating positioning error within a WLAN-based positioning system |
| EP2118810B1 (en) * | 2007-02-05 | 2012-08-15 | Andrew Corporation | System and method for optimizing location estimate of mobile unit |
| US20100087194A1 (en) * | 2007-03-13 | 2010-04-08 | Macnaughtan Malcolm David | Enhanced zone determination |
| US8107949B1 (en) * | 2007-10-29 | 2012-01-31 | Sprint Spectrum L.P. | Selective logging of drive testing data depending on reverse link data transmission rate |
| KR100914324B1 (en) * | 2007-12-05 | 2009-08-27 | 한국전자통신연구원 | Path loss calculation considering the reflection paths as dominant paths |
| US8140067B1 (en) * | 2008-01-03 | 2012-03-20 | Sprint Communications Company L.P. | Systems and methods for call analysis |
| US20090215443A1 (en) * | 2008-02-27 | 2009-08-27 | Pctel, Inc. | Cellular Drive Test System Network |
| US7949503B2 (en) * | 2008-07-07 | 2011-05-24 | King Fahd University Of Petroleum And Minerals | Facilities optimization method |
| WO2010030341A1 (en) * | 2008-09-09 | 2010-03-18 | United Parcel Service Of America, Inc. | Systems and methods of utilizing telematics data to improve fleet management operations |
| US11482058B2 (en) | 2008-09-09 | 2022-10-25 | United Parcel Service Of America, Inc. | Systems and methods for utilizing telematics data to improve fleet management operations |
| US8379532B2 (en) | 2008-10-06 | 2013-02-19 | Root Wireless, Inc. | Web server and method for hosting a web page for presenting location based user quality data related to a communication network |
| US9113345B2 (en) * | 2008-10-06 | 2015-08-18 | Root Wireless, Inc. | Web server and method for hosting a web page for presenting location based user quality data related to a communication network |
| EP2350916A4 (en) * | 2008-11-07 | 2015-06-10 | Landmark Graphics Corp | Systems and methods for computing and validating a variogram model |
| GB0901588D0 (en) | 2009-02-02 | 2009-03-11 | Itis Holdings Plc | Apparatus and methods for providing journey information |
| WO2011037939A1 (en) * | 2009-09-22 | 2011-03-31 | Jesse Caulfield | Method, system, and computer-readable medium for improved prediction of spectrum occupancy and estimation of radio signal field strength |
| CN101801001B (en) * | 2010-01-08 | 2012-07-04 | 华为技术有限公司 | Method and device for planning neighbouring areas |
| US9143961B2 (en) | 2010-07-02 | 2015-09-22 | T-Mobile Usa, Inc. | Switching matrix and test platform |
| US9183221B2 (en) | 2010-08-11 | 2015-11-10 | Root Wireless, Inc. | Component and method for overlying information bearing hexagons on a map display |
| KR101789046B1 (en) * | 2010-12-23 | 2017-10-23 | 한국전자통신연구원 | Method of analyzing interference between data communication terminals |
| US9953468B2 (en) | 2011-03-31 | 2018-04-24 | United Parcel Service Of America, Inc. | Segmenting operational data |
| US9208626B2 (en) | 2011-03-31 | 2015-12-08 | United Parcel Service Of America, Inc. | Systems and methods for segmenting operational data |
| GB2492369B (en) | 2011-06-29 | 2014-04-02 | Itis Holdings Plc | Method and system for collecting traffic data |
| US8838147B2 (en) * | 2011-08-31 | 2014-09-16 | Nokia Corporation | Method and apparatus for determining environmental context utilizing features obtained by multiple radio receivers |
| WO2013136129A1 (en) | 2012-03-15 | 2013-09-19 | Nokia Corporation | Encoding and decoding of data |
| CN104584616B (en) * | 2012-08-24 | 2018-04-27 | 埃克提克斯有限责任公司 | For the joint in cellular communications networks and the method for coordinating load balancing and covering and capacity optimization |
| CN103906083A (en) * | 2012-12-26 | 2014-07-02 | 中兴通讯股份有限公司 | Drive test positioning method and device |
| US20140279053A1 (en) * | 2013-03-14 | 2014-09-18 | Did-It | System and method for applying spatially indexed data to digital advertising bids |
| US8787836B1 (en) | 2013-03-15 | 2014-07-22 | DGS Global Systems, Inc. | Systems, methods, and devices having databases and automated reports for electronic spectrum management |
| US8798548B1 (en) | 2013-03-15 | 2014-08-05 | DGS Global Systems, Inc. | Systems, methods, and devices having databases for electronic spectrum management |
| US8805292B1 (en) | 2013-03-15 | 2014-08-12 | DGS Global Systems, Inc. | Systems, methods, and devices for electronic spectrum management for identifying signal-emitting devices |
| US10231206B2 (en) | 2013-03-15 | 2019-03-12 | DGS Global Systems, Inc. | Systems, methods, and devices for electronic spectrum management for identifying signal-emitting devices |
| US10219163B2 (en) | 2013-03-15 | 2019-02-26 | DGS Global Systems, Inc. | Systems, methods, and devices for electronic spectrum management |
| US10237770B2 (en) | 2013-03-15 | 2019-03-19 | DGS Global Systems, Inc. | Systems, methods, and devices having databases and automated reports for electronic spectrum management |
| US10257728B2 (en) | 2013-03-15 | 2019-04-09 | DGS Global Systems, Inc. | Systems, methods, and devices for electronic spectrum management |
| US10257729B2 (en) | 2013-03-15 | 2019-04-09 | DGS Global Systems, Inc. | Systems, methods, and devices having databases for electronic spectrum management |
| US10271233B2 (en) | 2013-03-15 | 2019-04-23 | DGS Global Systems, Inc. | Systems, methods, and devices for automatic signal detection with temporal feature extraction within a spectrum |
| US8750156B1 (en) | 2013-03-15 | 2014-06-10 | DGS Global Systems, Inc. | Systems, methods, and devices for electronic spectrum management for identifying open space |
| US10299149B2 (en) | 2013-03-15 | 2019-05-21 | DGS Global Systems, Inc. | Systems, methods, and devices for electronic spectrum management |
| US10122479B2 (en) | 2017-01-23 | 2018-11-06 | DGS Global Systems, Inc. | Systems, methods, and devices for automatic signal detection with temporal feature extraction within a spectrum |
| US10257727B2 (en) | 2013-03-15 | 2019-04-09 | DGS Global Systems, Inc. | Systems methods, and devices having databases and automated reports for electronic spectrum management |
| US10244504B2 (en) | 2013-03-15 | 2019-03-26 | DGS Global Systems, Inc. | Systems, methods, and devices for geolocation with deployable large scale arrays |
| US9622041B2 (en) | 2013-03-15 | 2017-04-11 | DGS Global Systems, Inc. | Systems, methods, and devices for electronic spectrum management |
| US11646918B2 (en) | 2013-03-15 | 2023-05-09 | Digital Global Systems, Inc. | Systems, methods, and devices for electronic spectrum management for identifying open space |
| US9805521B1 (en) | 2013-12-03 | 2017-10-31 | United Parcel Service Of America, Inc. | Systems and methods for assessing turns made by a vehicle |
| EP3609214B1 (en) * | 2014-02-11 | 2021-08-11 | Guangdong Oppo Mobile Telecommunications Corp., Ltd. | A method for coverage determination using predefined paths |
| US9609524B2 (en) * | 2014-05-30 | 2017-03-28 | Honeywell International Inc. | Apparatus and method for planning and validating a wireless network |
| JP6326646B2 (en) * | 2014-08-28 | 2018-05-23 | 株式会社国際電気通信基礎技術研究所 | Attenuation characteristic function estimation device, attenuation characteristic function estimation method, and program |
| JP6481339B2 (en) | 2014-11-12 | 2019-03-13 | 富士ゼロックス株式会社 | BANDWIDTH PREDICTION DEVICE, BANDWIDTH PREDICTION SYSTEM, BANDWIDTH PREDICTION PROGRAM, BANDWIDTH PREDICTION METHOD, AND RECORDING MEDIUM |
| US20160334221A1 (en) | 2015-05-11 | 2016-11-17 | United Parcel Service Of America, Inc. | Determining street segment headings |
| CN108293193A (en) * | 2015-11-19 | 2018-07-17 | 华为技术有限公司 | A kind of efficient computational methods for completing drive test data |
| KR101625660B1 (en) * | 2015-11-20 | 2016-05-31 | 한국지질자원연구원 | Method for making secondary data using observed data in geostatistics |
| US9913146B2 (en) * | 2016-01-06 | 2018-03-06 | Southern Methodist University | Using geographical features to reduce in-field propagation experimentation |
| US10149269B2 (en) | 2016-08-08 | 2018-12-04 | Blackberry Limited | Mobile transceiver having route monitoring and method of operation |
| US10477505B2 (en) | 2016-08-08 | 2019-11-12 | Blackberry Limited | Mobile transceiver for asset tracking having a power saving scheme for network access |
| US10498951B2 (en) | 2017-01-23 | 2019-12-03 | Digital Global Systems, Inc. | Systems, methods, and devices for unmanned vehicle detection |
| US10459020B2 (en) | 2017-01-23 | 2019-10-29 | DGS Global Systems, Inc. | Systems, methods, and devices for automatic signal detection based on power distribution by frequency over time within a spectrum |
| US10529241B2 (en) | 2017-01-23 | 2020-01-07 | Digital Global Systems, Inc. | Unmanned vehicle recognition and threat management |
| US10700794B2 (en) | 2017-01-23 | 2020-06-30 | Digital Global Systems, Inc. | Systems, methods, and devices for automatic signal detection based on power distribution by frequency over time within an electromagnetic spectrum |
| KR102442490B1 (en) * | 2017-09-27 | 2022-09-13 | 삼성전자 주식회사 | Method and apparatus of analyzing for network design based on distributed processing in wireless communication system |
| WO2019211792A1 (en) * | 2018-05-02 | 2019-11-07 | Jerusalem College Of Technology | Machine learning methods for sir prediction in cellular networks |
| EP3804387A1 (en) * | 2018-05-24 | 2021-04-14 | Telefonaktiebolaget Lm Ericsson (Publ) | Cell border shifting for multiple frequency bands |
| US10943461B2 (en) | 2018-08-24 | 2021-03-09 | Digital Global Systems, Inc. | Systems, methods, and devices for automatic signal detection based on power distribution by frequency over time |
| KR102135766B1 (en) * | 2018-10-18 | 2020-07-20 | 한국전자통신연구원 | Method and apparatus for assessing interference effect of the fixed system by the mobile system considering time percentage |
| CN113221813B (en) * | 2021-05-26 | 2022-12-06 | 广东省科学院广州地理研究所 | Coastline remote sensing extraction method |
Citations (3)
| Publication number | Priority date | Publication date | Assignee | Title |
|---|---|---|---|---|
| US5465390A (en) * | 1992-02-14 | 1995-11-07 | France Telecom | Method for laying out the infrastructure of a cellular communications network |
| US5926762A (en) * | 1996-05-17 | 1999-07-20 | Internet Mobility Corporation | Cellular telephone interference prediction and frequency reuse planning |
| US5987306A (en) * | 1994-06-01 | 1999-11-16 | Telefonaktiebolaget L M Ericsson | System for monitoring telephone networks and/or data communication networks, especially mobile telephone networks |
Family Cites Families (9)
| Publication number | Priority date | Publication date | Assignee | Title |
|---|---|---|---|---|
| WO1990010342A1 (en) * | 1989-03-03 | 1990-09-07 | Televerket | Method for planning radio cells |
| SE8903208L (en) * | 1989-09-29 | 1991-03-30 | Televerket | METHOD FOR PREPARING DRAWING DEGREES IN A MOBILE RADIO SYSTEM |
| GB2243055B (en) * | 1990-03-31 | 1994-11-23 | Motorola Ltd | Base station transceiver diagnostics equipment |
| JPH06209279A (en) * | 1993-01-11 | 1994-07-26 | Fujitsu Ltd | Mobile communication simulating system |
| JPH07253446A (en) * | 1994-03-16 | 1995-10-03 | Mitsubishi Electric Corp | Method and device for finding electric field strength distribution |
| JPH109903A (en) * | 1996-06-19 | 1998-01-16 | Chubu Electric Power Co Inc | Method for estimating stratum boundary layer |
| JP2001517304A (en) * | 1997-02-13 | 2001-10-02 | パッカード バイオサイエンス カンパニー | Calibration method for radiation spectroscopy |
| US6405043B1 (en) | 1997-07-02 | 2002-06-11 | Scoreboard, Inc. | Method to characterize the prospective or actual level of interference at a point, in a sector, and throughout a cellular system |
| US6606494B1 (en) | 2000-05-10 | 2003-08-12 | Scoreboard, Inc. | Apparatus and method for non-disruptive collection and analysis of wireless signal propagation |
-
2000
- 2000-07-21 US US09/620,850 patent/US6711404B1/en not_active Expired - Fee Related
- 2000-09-14 DE DE60025978T patent/DE60025978T2/en not_active Expired - Lifetime
- 2000-09-14 EP EP00119460A patent/EP1175115B1/en not_active Expired - Lifetime
- 2000-09-14 DE DE60042708T patent/DE60042708D1/en not_active Expired - Lifetime
- 2000-09-14 AT AT00119460T patent/ATE318057T1/en not_active IP Right Cessation
- 2000-09-14 AT AT05112375T patent/ATE439019T1/en not_active IP Right Cessation
- 2000-09-14 EP EP05112375A patent/EP1662827B1/en not_active Expired - Lifetime
- 2000-09-15 BR BR0004214-5A patent/BR0004214A/en not_active IP Right Cessation
- 2000-11-02 CA CA002325075A patent/CA2325075A1/en not_active Abandoned
- 2000-11-13 AR ARP000105980A patent/AR026455A1/en active IP Right Grant
-
2001
- 2001-04-10 KR KR1020010018855A patent/KR100803677B1/en not_active IP Right Cessation
- 2001-04-20 JP JP2001123140A patent/JP2002057614A/en active Pending
Patent Citations (3)
| Publication number | Priority date | Publication date | Assignee | Title |
|---|---|---|---|---|
| US5465390A (en) * | 1992-02-14 | 1995-11-07 | France Telecom | Method for laying out the infrastructure of a cellular communications network |
| US5987306A (en) * | 1994-06-01 | 1999-11-16 | Telefonaktiebolaget L M Ericsson | System for monitoring telephone networks and/or data communication networks, especially mobile telephone networks |
| US5926762A (en) * | 1996-05-17 | 1999-07-20 | Internet Mobility Corporation | Cellular telephone interference prediction and frequency reuse planning |
Non-Patent Citations (1)
| Title |
|---|
| ETL 1110-1-175 (1997-06-30): 'Engineering and Design - Practical Aspects of Applying Geostatistics at Hazardous, Toxic, and Radioactive Waste Sites'; Chapter 2; retrieved from http://www.usace.army.mil/usace-docs/eng-t ech-ltrs/ XP002193129 * |
Cited By (29)
| Publication number | Priority date | Publication date | Assignee | Title |
|---|---|---|---|---|
| US8355737B2 (en) | 2005-03-18 | 2013-01-15 | Wavemarket, Inc. | Enhanced mobile location |
| US8359044B2 (en) | 2005-03-18 | 2013-01-22 | Wavemarket, Inc. | Enhanced mobile location method and system |
| WO2006096923A1 (en) * | 2005-03-18 | 2006-09-21 | Seeker Wireless Pty Limited | Enhanced mobile location |
| US8700069B2 (en) | 2005-04-08 | 2014-04-15 | Wavemarket, Inc. | Systems and methods for mobile terminal location determination using radio signal parameter measurements |
| US8463285B2 (en) | 2005-04-08 | 2013-06-11 | Wavemarket, Inc. | Systems and methods for mobile terminal location determination using profiles of radio signal parameter measurements |
| WO2007056552A2 (en) * | 2005-11-08 | 2007-05-18 | Siemens Technology-To-Business Center, Llc | Radio frequency planning with consideration of inter-building effects |
| WO2007056552A3 (en) * | 2005-11-08 | 2007-07-05 | Siemens Tech To Business Ct | Radio frequency planning with consideration of inter-building effects |
| US7711360B2 (en) | 2005-11-08 | 2010-05-04 | Siemens Aktiengesellschaft | Radio frequency planning with consideration of inter-building effects |
| US7840091B2 (en) | 2006-02-23 | 2010-11-23 | Siemens Aktiengesellschaft | Signal source data input for radio frequency planning |
| US7583855B2 (en) * | 2006-02-23 | 2009-09-01 | Siemens Aktiengesellschaft | Signal source data input for radio frequency planning |
| US7379829B2 (en) | 2006-02-23 | 2008-05-27 | Siemens Aktiengesellschaft | Method and apparatus for automated characterization of objects with unknown RF characteristics |
| US8768368B2 (en) | 2007-04-04 | 2014-07-01 | Telefonaktiebolaget L M Ericsson (Publ) | Method and arrangement for improved radio network planning, simulation and analyzing in telecommunications |
| WO2008123809A1 (en) * | 2007-04-04 | 2008-10-16 | Telefonaktiebolaget Lm Ericsson (Publ) | Method and arrangement for improved radio network planning, simulation and analyzing in telecommunications |
| US8798613B2 (en) | 2007-09-17 | 2014-08-05 | Wavemarket, Inc. | Systems and method for triggering location based voice and/or data communications to or from mobile ratio terminals |
| US8737985B2 (en) | 2007-11-26 | 2014-05-27 | Wavemarket, Inc. | Methods and systems for zone creation and adaption |
| EP2254362A4 (en) * | 2008-03-11 | 2015-06-24 | Zte Corp | Testing method and system for the wireless signal propagation model of the cellular network |
| EP2254362A1 (en) * | 2008-03-11 | 2010-11-24 | ZTE Corporation | Testing method and system for the wireless signal propagation model of the cellular network |
| US8787171B2 (en) | 2008-04-07 | 2014-07-22 | Wavemarket, Inc. | Efficient collection of wireless transmitter characteristics |
| GB2473514B (en) * | 2009-09-09 | 2013-10-02 | Arieso Ltd | Method and apparatus for deriving pathloss estimation values |
| GB2473514A (en) * | 2009-09-09 | 2011-03-16 | Arieso Ltd | Method and apparatus for deriving pathloss estimation values |
| US8244236B2 (en) | 2010-04-29 | 2012-08-14 | Wavemarket, Inc. | System and method for aggregating and disseminating mobile device tag data |
| US8457626B2 (en) | 2010-04-29 | 2013-06-04 | Wavemarket, Inc. | System and method for aggregating and disseminating mobile device tag data |
| US8504077B2 (en) | 2010-12-04 | 2013-08-06 | Wavemarket, Inc. | System and method for monitoring and disseminating mobile device location information |
| US9438685B2 (en) | 2013-03-15 | 2016-09-06 | Location Labs, Inc. | System and method for display of user relationships corresponding to network-enabled communications |
| US9402155B2 (en) | 2014-03-03 | 2016-07-26 | Location Labs, Inc. | System and method for indicating a state of a geographic area based on mobile device sensor measurements |
| CN105069298A (en) * | 2015-08-14 | 2015-11-18 | 华中农业大学 | Estimation method of node missing data in agricultural product information collecting system |
| CN105069298B (en) * | 2015-08-14 | 2018-08-03 | 华中农业大学 | A kind of evaluation method of agricultural product information acquisition system interior joint missing data |
| EP3700253A1 (en) * | 2019-02-25 | 2020-08-26 | P3 Communications GmbH | Predicting geographical distribution of mobile communication network quality |
| US11445379B2 (en) * | 2020-09-29 | 2022-09-13 | At&T Intellectual Property I, L.P. | Facilitating heterogeneous network analysis and resource planning for advanced networks |
Also Published As
| Publication number | Publication date |
|---|---|
| DE60025978T2 (en) | 2006-10-19 |
| ATE318057T1 (en) | 2006-03-15 |
| EP1662827B1 (en) | 2009-08-05 |
| BR0004214A (en) | 2002-04-02 |
| ATE439019T1 (en) | 2009-08-15 |
| EP1662827A1 (en) | 2006-05-31 |
| DE60042708D1 (en) | 2009-09-17 |
| KR100803677B1 (en) | 2008-02-20 |
| AR026455A1 (en) | 2003-02-12 |
| DE60025978D1 (en) | 2006-04-20 |
| US6711404B1 (en) | 2004-03-23 |
| KR20020008744A (en) | 2002-01-31 |
| JP2002057614A (en) | 2002-02-22 |
| EP1175115A3 (en) | 2002-05-15 |
| EP1175115B1 (en) | 2006-02-15 |
| CA2325075A1 (en) | 2002-01-21 |
Similar Documents
| Publication | Publication Date | Title |
|---|---|---|
| US6711404B1 (en) | Apparatus and method for geostatistical analysis of wireless signal propagation | |
| EP1154661B1 (en) | Apparatus and method for collection and analysis of wireless signal propagation in a wireless system | |
| US7853267B2 (en) | Wireless system signal propagation collection and analysis | |
| CN107466103B (en) | Terminal positioning method and network equipment | |
| US7668708B2 (en) | Method and apparatus for network planning | |
| CN110418354A (en) | It is a kind of that propagation model wireless network planning method is exempted from based on machine learning | |
| EP3777253B1 (en) | Wireless network service assessment | |
| CN104904287A (en) | System and method for localizing wireless devices | |
| Fida et al. | Zipweave: Towards efficient and reliable measurement based mobile coverage maps | |
| Qureshi et al. | Enhanced MDT-based performance estimation for AI driven optimization in future cellular networks | |
| CN101637042B (en) | Wireless cell monitoring method, its device, and its program | |
| CN114828026A (en) | Base station planning method, device, equipment, storage medium and program product | |
| CN113839725A (en) | Wireless signal propagation prediction method and device | |
| Galindo-Serrano et al. | Cellular coverage optimization: A radio environment map for minimization of drive tests | |
| Storsaeter et al. | A GIS-based tool for optimizing C-ITS communication infrastructure | |
| Heidari et al. | Performance evaluation of indoor geolocation systems using PROPSim hardware and ray tracing software | |
| MXPA00012106A (en) | Apparatus and method for geostatistical analysis of wireless signal propagation | |
| Waheed et al. | DeepChannel: Robust Multimodal Outdoor Channel Model Prediction in LTE Networks Using Deep Learning | |
| Chang et al. | Development of machine learning-based radio propagation models and benchmarking for mobile networks | |
| Fida et al. | Understanding mobile network quality and infrastructure with user-side measurements | |
| WO2022090810A1 (en) | Cell similarity indicator based on coverage area morphology | |
| CN115866623A (en) | Planning station coverage prediction method based on AOA-free | |
| CN110519769A (en) | Bus stop planning method and system based on the domain O Yu B numeric field data |
Legal Events
| Date | Code | Title | Description |
|---|---|---|---|
| PUAI | Public reference made under article 153(3) epc to a published international application that has entered the european phase |
Free format text: ORIGINAL CODE: 0009012 |
|
| AK | Designated contracting states |
Kind code of ref document: A2 Designated state(s): AT BE CH CY DE DK ES FI FR GB GR IE IT LI LU MC NL PT SE |
|
| AX | Request for extension of the european patent |
Free format text: AL;LT;LV;MK;RO;SI |
|
| PUAL | Search report despatched |
Free format text: ORIGINAL CODE: 0009013 |
|
| AK | Designated contracting states |
Kind code of ref document: A3 Designated state(s): AT BE CH CY DE DK ES FI FR GB GR IE IT LI LU MC NL PT SE |
|
| AX | Request for extension of the european patent |
Free format text: AL;LT;LV;MK;RO;SI |
|
| 17P | Request for examination filed |
Effective date: 20021113 |
|
| AKX | Designation fees paid |
Designated state(s): AT BE CH CY DE DK ES FI FR GB GR IE IT LI LU MC NL PT SE |
|
| 17Q | First examination report despatched |
Effective date: 20030731 |
|
| GRAP | Despatch of communication of intention to grant a patent |
Free format text: ORIGINAL CODE: EPIDOSNIGR1 |
|
| GRAS | Grant fee paid |
Free format text: ORIGINAL CODE: EPIDOSNIGR3 |
|
| GRAA | (expected) grant |
Free format text: ORIGINAL CODE: 0009210 |
|
| AK | Designated contracting states |
Kind code of ref document: B1 Designated state(s): AT BE CH CY DE DK ES FI FR GB GR IE IT LI LU MC NL PT SE |
|
| PG25 | Lapsed in a contracting state [announced via postgrant information from national office to epo] |
Ref country code: NL Free format text: LAPSE BECAUSE OF FAILURE TO SUBMIT A TRANSLATION OF THE DESCRIPTION OR TO PAY THE FEE WITHIN THE PRESCRIBED TIME-LIMIT Effective date: 20060215 |
|
| REG | Reference to a national code |
Ref country code: CH Ref legal event code: EP Ref country code: GB Ref legal event code: FG4D |
|
| REG | Reference to a national code |
Ref country code: IE Ref legal event code: FG4D |
|
| REF | Corresponds to: |
Ref document number: 60025978 Country of ref document: DE Date of ref document: 20060420 Kind code of ref document: P |
|
| RAP2 | Party data changed (patent owner data changed or rights of a patent transferred) |
Owner name: ALLEN TELECOM, LLC. |
|
| PG25 | Lapsed in a contracting state [announced via postgrant information from national office to epo] |
Ref country code: DK Free format text: LAPSE BECAUSE OF FAILURE TO SUBMIT A TRANSLATION OF THE DESCRIPTION OR TO PAY THE FEE WITHIN THE PRESCRIBED TIME-LIMIT Effective date: 20060515 |
|
| PG25 | Lapsed in a contracting state [announced via postgrant information from national office to epo] |
Ref country code: ES Free format text: LAPSE BECAUSE OF FAILURE TO SUBMIT A TRANSLATION OF THE DESCRIPTION OR TO PAY THE FEE WITHIN THE PRESCRIBED TIME-LIMIT Effective date: 20060526 |
|
| RAP2 | Party data changed (patent owner data changed or rights of a patent transferred) |
Owner name: ALLEN TELECOM, INC |
|
| REG | Reference to a national code |
Ref country code: SE Ref legal event code: TRGR |
|
| RAP2 | Party data changed (patent owner data changed or rights of a patent transferred) |
Owner name: ADIRONDACKS, LLC |
|
| RAP2 | Party data changed (patent owner data changed or rights of a patent transferred) |
Owner name: ALLEN TELECOM, LLC. |
|
| REG | Reference to a national code |
Ref country code: CH Ref legal event code: NV Representative=s name: MOINAS & SAVOYE SA |
|
| NLT2 | Nl: modifications (of names), taken from the european patent patent bulletin |
Owner name: ALLEN TELECOM, LLC. Effective date: 20060503 |
|
| PG25 | Lapsed in a contracting state [announced via postgrant information from national office to epo] |
Ref country code: PT Free format text: LAPSE BECAUSE OF FAILURE TO SUBMIT A TRANSLATION OF THE DESCRIPTION OR TO PAY THE FEE WITHIN THE PRESCRIBED TIME-LIMIT Effective date: 20060717 |
|
| NLV1 | Nl: lapsed or annulled due to failure to fulfill the requirements of art. 29p and 29m of the patents act | ||
| PGFP | Annual fee paid to national office [announced via postgrant information from national office to epo] |
Ref country code: AT Payment date: 20060913 Year of fee payment: 7 |
|
| PG25 | Lapsed in a contracting state [announced via postgrant information from national office to epo] |
Ref country code: IE Free format text: LAPSE BECAUSE OF NON-PAYMENT OF DUE FEES Effective date: 20060914 |
|
| PG25 | Lapsed in a contracting state [announced via postgrant information from national office to epo] |
Ref country code: MC Free format text: LAPSE BECAUSE OF NON-PAYMENT OF DUE FEES Effective date: 20060930 |
|
| REG | Reference to a national code |
Ref country code: FR Ref legal event code: TP |
|
| ET | Fr: translation filed | ||
| PLBE | No opposition filed within time limit |
Free format text: ORIGINAL CODE: 0009261 |
|
| STAA | Information on the status of an ep patent application or granted ep patent |
Free format text: STATUS: NO OPPOSITION FILED WITHIN TIME LIMIT |
|
| 26N | No opposition filed |
Effective date: 20061116 |
|
| BECA | Be: change of holder's address |
Owner name: *ALLEN TELECOM LLC10500 WEST 153RD STREET, ORLANDO Effective date: 20060215 |
|
| BECH | Be: change of holder |
Owner name: *ALLEN TELECOM LLC Effective date: 20060215 |
|
| PG25 | Lapsed in a contracting state [announced via postgrant information from national office to epo] |
Ref country code: GR Free format text: LAPSE BECAUSE OF FAILURE TO SUBMIT A TRANSLATION OF THE DESCRIPTION OR TO PAY THE FEE WITHIN THE PRESCRIBED TIME-LIMIT Effective date: 20060516 |
|
| PG25 | Lapsed in a contracting state [announced via postgrant information from national office to epo] |
Ref country code: AT Free format text: LAPSE BECAUSE OF NON-PAYMENT OF DUE FEES Effective date: 20070914 |
|
| PG25 | Lapsed in a contracting state [announced via postgrant information from national office to epo] |
Ref country code: LU Free format text: LAPSE BECAUSE OF NON-PAYMENT OF DUE FEES Effective date: 20060914 |
|
| PG25 | Lapsed in a contracting state [announced via postgrant information from national office to epo] |
Ref country code: CY Free format text: LAPSE BECAUSE OF FAILURE TO SUBMIT A TRANSLATION OF THE DESCRIPTION OR TO PAY THE FEE WITHIN THE PRESCRIBED TIME-LIMIT Effective date: 20060215 |
|
| PGFP | Annual fee paid to national office [announced via postgrant information from national office to epo] |
Ref country code: CH Payment date: 20100930 Year of fee payment: 11 |
|
| PGFP | Annual fee paid to national office [announced via postgrant information from national office to epo] |
Ref country code: FI Payment date: 20100929 Year of fee payment: 11 Ref country code: IT Payment date: 20100925 Year of fee payment: 11 |
|
| PGFP | Annual fee paid to national office [announced via postgrant information from national office to epo] |
Ref country code: BE Payment date: 20100927 Year of fee payment: 11 Ref country code: DE Payment date: 20100929 Year of fee payment: 11 |
|
| PGFP | Annual fee paid to national office [announced via postgrant information from national office to epo] |
Ref country code: SE Payment date: 20100929 Year of fee payment: 11 |
|
| PGFP | Annual fee paid to national office [announced via postgrant information from national office to epo] |
Ref country code: FR Payment date: 20111005 Year of fee payment: 12 Ref country code: GB Payment date: 20110926 Year of fee payment: 12 |
|
| BERE | Be: lapsed |
Owner name: *ALLEN TELECOM LLC Effective date: 20110930 |
|
| REG | Reference to a national code |
Ref country code: CH Ref legal event code: PL |
|
| PG25 | Lapsed in a contracting state [announced via postgrant information from national office to epo] |
Ref country code: FI Free format text: LAPSE BECAUSE OF NON-PAYMENT OF DUE FEES Effective date: 20110914 Ref country code: IT Free format text: LAPSE BECAUSE OF NON-PAYMENT OF DUE FEES Effective date: 20110914 |
|
| PG25 | Lapsed in a contracting state [announced via postgrant information from national office to epo] |
Ref country code: BE Free format text: LAPSE BECAUSE OF NON-PAYMENT OF DUE FEES Effective date: 20110930 |
|
| REG | Reference to a national code |
Ref country code: SE Ref legal event code: EUG |
|
| REG | Reference to a national code |
Ref country code: DE Ref legal event code: R119 Ref document number: 60025978 Country of ref document: DE Effective date: 20120403 |
|
| PG25 | Lapsed in a contracting state [announced via postgrant information from national office to epo] |
Ref country code: CH Free format text: LAPSE BECAUSE OF NON-PAYMENT OF DUE FEES Effective date: 20110930 Ref country code: LI Free format text: LAPSE BECAUSE OF NON-PAYMENT OF DUE FEES Effective date: 20110930 Ref country code: DE Free format text: LAPSE BECAUSE OF NON-PAYMENT OF DUE FEES Effective date: 20120403 |
|
| PG25 | Lapsed in a contracting state [announced via postgrant information from national office to epo] |
Ref country code: SE Free format text: LAPSE BECAUSE OF NON-PAYMENT OF DUE FEES Effective date: 20110915 |
|
| GBPC | Gb: european patent ceased through non-payment of renewal fee |
Effective date: 20120914 |
|
| REG | Reference to a national code |
Ref country code: FR Ref legal event code: ST Effective date: 20130531 |
|
| PG25 | Lapsed in a contracting state [announced via postgrant information from national office to epo] |
Ref country code: GB Free format text: LAPSE BECAUSE OF NON-PAYMENT OF DUE FEES Effective date: 20120914 |
|
| PG25 | Lapsed in a contracting state [announced via postgrant information from national office to epo] |
Ref country code: FR Free format text: LAPSE BECAUSE OF NON-PAYMENT OF DUE FEES Effective date: 20121001 |