EP1391734A2 - Sample dispensing apparatus and automatic analyzer using the same - Google Patents
Sample dispensing apparatus and automatic analyzer using the same Download PDFInfo
- Publication number
- EP1391734A2 EP1391734A2 EP03017862A EP03017862A EP1391734A2 EP 1391734 A2 EP1391734 A2 EP 1391734A2 EP 03017862 A EP03017862 A EP 03017862A EP 03017862 A EP03017862 A EP 03017862A EP 1391734 A2 EP1391734 A2 EP 1391734A2
- Authority
- EP
- European Patent Office
- Prior art keywords
- sample
- dispensing
- abnormality
- probe
- pressure
- Prior art date
- Legal status (The legal status is an assumption and is not a legal conclusion. Google has not performed a legal analysis and makes no representation as to the accuracy of the status listed.)
- Granted
Links
Images


Classifications
-
- G—PHYSICS
- G01—MEASURING; TESTING
- G01N—INVESTIGATING OR ANALYSING MATERIALS BY DETERMINING THEIR CHEMICAL OR PHYSICAL PROPERTIES
- G01N35/00—Automatic analysis not limited to methods or materials provided for in any single one of groups G01N1/00 - G01N33/00; Handling materials therefor
- G01N35/10—Devices for transferring samples or any liquids to, in, or from, the analysis apparatus, e.g. suction devices, injection devices
- G01N35/1009—Characterised by arrangements for controlling the aspiration or dispense of liquids
- G01N35/1016—Control of the volume dispensed or introduced
- G01N2035/1018—Detecting inhomogeneities, e.g. foam, bubbles, clots
Definitions
- the present invention relates to a sample dispensing apparatus for dispensing a liquid sample, such as blood and urine, and an automatic analyzer using the sample dispensing apparatus. More particularly, the present invention relates to a sample dispensing apparatus with a function of enabling clogging of a suction/ejection nozzle to be detected with high accuracy, and an automatic analyzer using the sample dispensing apparatus.
- An automatic analyzer such as a biochemical automatic analyzer or an immune automatic analyzer, includes a sample dispensing apparatus for automatically sucking and ejecting (hereinafter referred to as "dispensing") a liquid sample from a sample vessel from and into a reaction vessel.
- the sample dispensing apparatus comprises a sample probe, a dispensing syringe connected to the sample probe, and a mechanism for moving the sample probe to a predetermined position.
- the sample dispensing apparatus repeats a dispensing operation as follows. A fore end of the sample probe is inserted in a sample, and the dispensing syringe is driven to move over a predetermined distance to suck a predetermined amount of sample. Then, the sample probe is moved to the reaction vessel into which the sucked sample is ejected.
- sample tests such as biochemical tests, blood serum and plasma are employed as samples in many cases. If these samples are left to stand for a long time from sampling to inspection, a solid (hereinafter referred to as a clot), e.g., fibrin, is generated in the sample. Then, if such a sample is put, as it is, in an automatic analyzer, the sample probe may clog with the generated clot. Upon the clogging of the sample probe, a predetermined amount of sample cannot be dispensed to the reaction vessel and an accurate analysis result can no longer be obtained. This results in a great loss of analysis reliability in the automatic analyzer.
- a solid hereinafter referred to as a clot
- fibrin fibrin
- Japanese Unexamined Patent Application Publication No. 7-198726 pays attention to a second derivative value of a waveform of the pressure fluctuations and states that abnormal suction can be detected by comparing the second derivative value with a threshold (hereinafter referred to as "first related art"). Also, Japanese Unexamined Patent Application Publication No.
- 11-83868 pays attention to a pressure remaining on the negative side after the end of the sucking operation and it compares the remaining pressure with a threshold to determine the occurrence of clogging when the remaining pressure is lower than the threshold (hereinafter referred to as "second related art").
- Japanese Unexamined Patent Application Publication No. 2000-39440 discloses a technique of comparing an area value, which is obtained by integrating an output of a pressure sensor, with a preset reference value and determining an abnormality in the sample dispensing operation (hereinafter referred to as "third related art").
- the abnormal dispensing causing an analysis failure does not always occur only upon the above-described clogging of the sample probe.
- a sample dispensing apparatus for detecting a level of the sample surface from a change of an electrical variable, such as a resistance value or a capacitance, which occurs upon the sample probe contacting with the sample when a sample having many bubbles in its surface is dispensed, it is determined that the sample probe has reached the sample surface, in spite of the sample probe being present in a bubble layer.
- the operation of sucking the sample is performed to suck air instead of the sample (hereinafter referred to as "empty suction"). Also in this case, therefore, a certain amount of sample cannot be dispensed and an accurate analysis result can no longer be obtained.
- any related art has a problem that it can only detect a certain type of abnormality, and cannot detect another type of abnormality.
- Figs. 2A to 2I each show a waveform of pressure fluctuations resulting when a sample is sucked in a sample dispensing apparatus provided with a pressure sensor.
- the vertical axis represents a pressure and the horizontal axis represents a time.
- an upper side represents a positive pressure and a lower side represents a negative pressure with the atmospheric pressure being a reference.
- Fig. 2A shows the waveform of the pressure fluctuations in the case of normal suction.
- the pressure starts to lower at the same time as the start of the suction and then moderately changes during a sample suction zone.
- Such a moderate change during the sample suction zone depends on sample properties, such as viscosity and density, and the suction speed, i.e., the driving speed of the dispensing syringe.
- the suction speed i.e., the driving speed of the dispensing syringe.
- the pressure largely deflected to the negative pressure side returns toward the atmospheric pressure reference.
- Figs. 2B, 2C and 2D each show the case in which the sample probe is clogged with a clot during the sample suction and the sample probe is brought into a completely blocked state (hereinafter referred to as "complete clogging".
- complete clogging the amount of sample which should have been sucked after the clogging is lost and an accurate analysis result cannot be obtained.
- the waveform of the pressure fluctuations the pressure lowers to a large extent at the same time as the occurrence of clogging, and does not restore even after the end of the sample suction.
- the waveform of the pressure fluctuations apparently exhibits different features from those in the case of normal suction both during and after the sample suction, and therefore abnormal suction can be reliably detected with the related art.
- Figs. 2E, 2F and 2G each show the waveform of the pressure fluctuations resulting when a clot is sucked. More specifically, the clot size is not so large as to completely clog the sample probe and is smaller than the diameter of an opening of the sample probe to such an extent that the clot is sucked into the sample probe (hereinafter referred to as "small clot suction". If a small clot is present in the dispensed sample, the amount of the sucked sample is lost correspondingly, and there is a risk that the clot may adversely affect the analysis. For that reason, the small clot suction is also categorized into abnormal dispensing. In general, the sample probe is of a structure that the probe opening has the smallest diameter.
- the small clot undergoes resistance when passing through the probe opening and causes a disturbance in the waveform of the pressure fluctuations. Subsequently, when the sucked small clot reaches, for example, an inner space of the sample probe of which diameter is larger than the opening diameter, the disturbance in the waveform of the pressure fluctuations is settled. In such a case, because the pressure after the suction is restored to a level comparable to that in the normal suction, the abnormal suction cannot be detected by the second related art wherein attention is paid to the pressure remaining on the negative side after the end of the sucking operation. Also, when employing the third related art wherein the sensor output is integrated, it is very difficult to detect the cases of Figs.
- Fig. 2H shows the waveform of the pressure fluctuations in the case of sucking a highly viscous sample (hereinafter referred to as "highly viscous sample suction").
- highly viscous sample suction a highly viscous sample
- a larger negative pressure appears in the sample suction zone, and the pressure after the end of the sucking operation returns toward the atmospheric pressure reference at a later timing. Accordingly, the sample probe is withdrawn from the sample surface before the pressure is not sufficiently restored, and a certain amount of sample is left without being sucked. This also results in abnormal dispensing.
- the pressure fluctuations in this case exhibit a large negative pressure, but change moderately. Such pressure fluctuations cannot hence be detected by the first related art wherein an abrupt pressure change is detected by utilizing differentiation (second derivative value).
- Fig. 21 shows the waveform of the pressure fluctuations in the case of empty suction.
- the pressure is hardly deflected to the negative side.
- the empty suction may be caused by not only false detection of arrival of the sample probe to the sample surface as described above, but also by missed placement of the sample or an insufficient amount of sample.
- a first object of the present invention is to detect all types of abnormal dispensing causing analysis failures, including the complete clogging, the small clot suction, the highly viscous sample suction, and the empty suction, regardless of the type and the extent of abnormality.
- the variations of the pressure value are caused by variations of a pressure measuring system and variations of a pressure measured system, as well as by errors due to variations of viscosity of the dispensed sample and an influence of external environment.
- the variations of the pressure measuring system include, for example, variations of sensitivity of the pressure sensor and variations of components of an amplification circuit for amplifying an output signal of the pressure sensor. Ideally, when the same pressure is measured, the same output value is to be obtained. In practice, however, exactly the same output value is not always resulted due to the above-mentioned variations. Also, even when the same dispensing operation is performed using the same pressure measuring system, the pressure itself may vary with variations of the pressure measured system, e.g., variations of the inner diameter of the sample probe and variations of the length of a dispensing flow passage.
- a second object of the present invention is to accurately detect an abnormality of dispensing without reducing the detection ability with no need of performing close adjustment or narrowing working tolerances.
- subsequent operations for dealing with the abnormal dispensing is desirably processed in an automatic manner.
- the sample probe is clogged with a clot
- operations of washing the sample probe and confirming whether the clogging is removed be automatically performed.
- the amount of sample dispensed after the removal cannot be regarded as reliable.
- a technique of confirming the removal of the clogging it is also proposed to check a pressure value after the washing (Japanese Unexamined Patent Application Publication No. 6-109745). In this technique, however, variations of the pressure value also cause a problem as described above.
- a third object of the present invention is to provide a system for carrying out operations subsequent to the abnormal dispensing without reducing the analysis processing ability and the analysis reliability, including reliable confirmation of the removal of the clogging.
- a sample dispensing apparatus is constructed as follows.
- a sample dispensing apparatus comprising a probe for sucking and ejecting a sample, a dispensing syringe for generating a pressure in the probe to suck and eject the sample, a dispensing flow passage connecting the probe and the dispensing syringe, and a control unit for controlling sucking and ejection operations of the sample
- the apparatus further comprises at least one pressure sensor for detecting a pressure in the dispensing flow passage; a pressure value storing unit for time-serially storing output values of the pressure sensor during an operation of dispensing the sample; a storage unit for storing a reference database consisted of time-serial output values of the pressure sensor, which are obtained when the sample is normally sucked or ejected by the probe; and a determining unit for carrying out multi-variable analysis of both the reference database and comparison data created based on the output values of the pressure sensor time-serially stored in the pressure value storing unit, and for determining the presence or absence of an abnormal
- the above-mentioned multi-variable analysis can be typically carried out by a method using the Mahalanobis distance (called MTS: Mahalanobis & Taguchi System), or a method using a neural network.
- MTS Mahalanobis & Taguchi System
- any other method is also applicable so long as it can perform the multi-variable analysis executing comparison in consideration of not only the magnitude of an item value itself, but also the correlation between items.
- the MTS method is a method used in a multi-variable analysis which is applied in a various field, and described in detail, for example, in "Japan Standard Association, Quality engineering application course, Technical development in MTS system, June 20, 2002".
- the apparatus and its functions are constituted as follows.
- the apparatus further comprises a discriminating unit for, when the abnormality of sample dispensing is detected, comparing a pressure value immediately before the end of the sample sucking operation with a preset threshold, and for discriminating one of plural causes of the dispensing abnormality.
- the sample dispensing apparatus makes a determination as to an abnormality of dispensing when a fluid having a known physical property, such as viscosity and density, is dispensed as a sample, thereby determining the presence or absence of an abnormality in the dispensing function of the sample dispensing apparatus.
- the sample dispensing apparatus has a function of, when the abnormality of sample dispensing is detected in a cleaning unit for cleaning the interior of the dispending flow passage, including the sample probe, and in the sample dispensing apparatus, washing the interior of the dispensing flow passage including the sample probe, then dispensing a fluid having a known physical property, such as viscosity and density, and determining the dispensing abnormality in the fluid dispensing, thereby determining whether the dispensing function of the sample dispensing apparatus is restored. Further, in the sample dispensing apparatus, the dispensing operation is stopped when the abnormality of sample dispensing is detected and thereafter the dispensing function of the sample dispensing apparatus is not restored even after repeating the washing a predetermined number of times.
- an automatic analyzer comprises the sample dispensing apparatus, a cleaning tank for washing the interior of the dispensing flow passage, including a sample probe, and an outer surface of the sample probe, a reaction vessel cleaning mechanism, and a reaction vessel repeatedly used after being washed by the reaction vessel cleaning mechanism, when an abnormality of dispensing is detected during suction of a sample, the sample is discarded into the cleaning tank without ejecting the sample into the reaction vessel.
- the automatic analyzer including the sample dispensing apparatus, when the abnormality of sample dispensing is detected, a cause of the dispensing abnormality is found out from among a plurality of classified causes and a counteraction corresponding to the cause is performed.
- the relevant sample when the abnormality of sample dispensing is detected, the relevant sample is repeatedly dispensing within a predetermined number of times. Moreover, in the automatic analyzer including the sample dispensing apparatus, when the dispensing abnormality still continues even after repeatedly dispensing the relevant sample within the predetermined number of times, the dispensing of the relevant sample is canceled and dispensing of a next sample is started.
- the present invention since various types of abnormal dispensing causing analysis failures can be all detected regardless of the type and extent of abnormality, reliability of the sample dispensing apparatus and analysis results of the automatic analyzer employing the sample dispensing apparatus can be increased. Consequently, the present invention is also effective in reducing labor and cost required for management of samples in an inspection room.
- the method of determining an abnormality of dispensing according to the present invention has sufficient robustness against variations of sensitivity of the pressure sensor, and is able to accurately detect the abnormality of dispensing without reducing the detection ability with no need of performing close adjustment or narrowing working tolerances. As a result, it is possible to suppress the cost that is otherwise expected to increase due to the necessity of those additional steps.
- the subsequent actions for dealing with the abnormality can be automatically performed, and therefore the processing efficiency can be increased. Also, in the event of an abnormality, whether the abnormality has been removed can be detected with high accuracy, and hence higher reliability is ensured.
- Fig. 1 is a block diagram of a sample dispensing apparatus according to the present invention.
- a sample probe 1 is connected to a dispensing syringe 3 through a tube 2, and the interiors of these components are filled with a liquid.
- the dispensing syringe 3 comprises a cylinder 3a and a plunger 3b.
- a dispensing syringe drive means 4 is connected to the plunger 3b.
- the cylinder 3a is held stationary, and the plunger 3b is driven by the dispensing syringe drive means 4 to move up and down so that a sample is dispensed.
- a sample probe drive means 5 is connected to the sample probe 1 and moves the sample probe 1 to a predetermined position.
- the dispensing syringe drive means 4 and the sample probe drive means 5 are each controlled by a control unit 6.
- the dispensing syringe drive means 4 is driven to start the sucking operation of the dispensing syringe 3. It is here assumed that, before the sample probe 1 enters the liquid sample 8, air (segmenting air) is sucked in advance to prevent the sample 8 from mixing with the liquid filled in the sample probe 1.
- air sugmenting air
- the sample probe 1 is moved to a sample ejection position at which the dispensing syringe 3 performs the ejecting operation.
- cleaning water 11 in a water supply tank 10 is sucked by a water supply pump 9 to flow under high pressure so that the sample probe 1 can be washed.
- the flow of the cleaning water is switched over by a solenoid valve 12 that is controlled by the control unit 6.
- a pressure sensor 13 which is a means for detecting the abnormal dispensing in accordance with the main object of the present invention, is connected through a branching block 14 to a dispensing flow passage system including the sample probe 1, the tube 2, and the dispensing syringe 3.
- the pressure sensor 13 be connected to the dispensing flow passage system at a position as close as possible to the sample probe 1.
- An output signal of the pressure sensor 13 is amplified by an amplifier 15 and converted into a digital signal by an A/D converter 16.
- An output of the A/D converter 16 is sent to a microcomputer 17 in which an input signal is processed, as described later, to determine whether the dispensing is normally performed.
- Fig. 3 is a control flowchart for detection of abnormal dispensing in the present invention.
- the internal pressure of the dispensing flow passage system, including the sample probe, during the sample dispensing always changes, including small changes, and the output of the pressure sensor also changes in a following way.
- a pressure value changing from moment to moment is time-serially taken in, and a set of taken-in pressure values (hereinafter referred to as a "group of time-serial pressure data") are employed as they are (S1)
- S1 a set of taken-in pressure values
- the Mahalanobis distance is calculated from the group of time-serial pressure data obtained in the above step (S2).
- the Mahalanobis distance is one method of multi-variable analysis, and represents a scale for measuring whether a sample under inspection belongs to a reference group (hereinafter referred to as a "reference space").
- a reference group hereinafter referred to as a "reference space"
- this group is employed as the reference space.
- the Mahalanobis distance takes a value near 1 when the dispensing is normally performed, whereas the Mahalanobis distance takes a value much larger than 1 when the dispensing is abnormal. By utilizing such a tendency, whether the dispensing is normal or abnormal is determined based on threshold determination (S3).
- Fig. 4 shows the method of taking in the group of time-serial pressure data. As shown in Fig. 4, pressure values at k points are taken in from the waveform of pressure fluctuations changing from moment to moment.
- the group of time-serial pressure data is taken in from a region with the sample suction zone being at the center. It is confirmed that the abnormality can be detected with high accuracy by using the group of time-serial pressure data belonging only to the sample suction zone, but the accuracy is further improved by adding pressure values at several points before and after the sample suction zone. Further, because a sign of the dispensing abnormality appears as a disturbance of the pressure fluctuations in the sample suction zone in many cases, the pressure fluctuations in the sample suction zone may also be taken in.
- An interval at which the group of time-serial pressure data is to be taken in may be constant or variable.
- the sampling interval is not always required to be constant.
- the sampling interval may be narrowed in a region where the abnormality of dispensing is apt to occur, or conversely it is widened in a region where the abnormality of dispensing hardly occurs, thus causing data to be taken in at a rough density.
- the pressure value be taken in at a constant interval during the sample suction zone. If the sampling interval is too wide, an abnormality occurred between adjacent sampling points corresponding to the interval would be missed. Conversely, if the sampling interval is too narrow and the number of taken-in data is increased, a later-described process of calculating the Mahalanobis distance would take a longer time. For those reasons, the sampling interval is desirably widened within the range in which the abnormality of dispensing can be detected.
- the sampling interval can be set to 1/2 of the shortest pressure abnormal zone.
- a method of taking in the group of time-serial pressure data at the k points can be performed by a manner of designating a sampling time at each point in advance and obtaining data only at the k points, or by a manner of initially taking in data at intervals as narrow as possible and thinning out the taken-in data to leave data only at the k points.
- the group of time-serial pressure data thus obtained is put together as shown in Fig. 5.
- the pressure values at the respective points of time in Fig. 5 are utilized as items when calculating the Mahalanobis distance.
- the group of time-serial pressure data can be obtained as a reference.
- Fig. 6 shows the groups of time-serial pressure data obtained by performing the normal dispensing n times.
- these groups constitute a reference space of n events and k items.
- normal dispensing means that a normal sample is dispensed in a state in which normal dispensing is sufficiently feasible.
- normal sample means a sample which has viscosity in the viscosity range of samples handled by the sample dispensing apparatus and which contains no solid foreign matters, etc.
- the normal sample employed in, for example, the sample dispensing apparatus for use in a biochemical automatic analyzer for blood is a sample which has viscosity comparable to that of human serum and which contains no clots, etc.
- the term "state in which normal dispensing is feasible” means a state in which variations of components of the sample dispensing apparatus, such as variations of the inner diameter of the sample probe and variations of sensitivity of the pressure sensor, fall within a predetermined tolerance regardless of possible causes, such as individual differences in manufacture between the components, influences of external environment, and deterioration over time, and the sample dispensing apparatus can sufficiently develop its own function without causing an abnormality, e.g., clogging of the sample probe.
- the number n of events contained in the reference space is preferably larger for the purpose of increasing the accuracy in the abnormality detection.
- the economic cost would increase to a level not offset by the obtained information. Therefore, it is advantageous to determine the number n of events in consideration of the detection accuracy and the economic cost.
- the number n of events must be larger than the number of items k because a correlation matrix described later cannot be determined if n is smaller k.
- the use of the groups of time-serial pressure data and reference space, obtained as described above, is not limited to the case of dispensing the sample in a predetermined amount.
- the sample is dispensed in accordance with a dispensing speed and a drive sequence of the dispensing syringe and the sample probe (hereinafter referred to as a "dispensing sequence"), which are optimum for the dispensing of the sample in a resulting amount, and the waveform of pressure fluctuations is also changed correspondingly.
- the number of the groups of time-serial pressure data to be taken in and the method of taking in the groups of time-serial pressure data are changed for each amount of the dispensed sample, and the reference space is also prepared for each amount of the dispensed sample.
- maximum and minimum amounts of the dispensed sample and resolution of the dispensing are decided depending on specifications of a sample dispensing apparatus, and the number of different amounts of the dispensed sample is finite. Therefore, the groups of time-serial pressure data and the reference spaces are required just in that finite number.
- the reference space is expressed as a matrix of n columns and k rows, and a matrix A of k ⁇ k is derived by obtaining a correlation matrix of the matrix of n columns and k rows.
- the Mahalanobis distance D 2 can be expressed by a formula (2) given below:
- the average and the standard deviation for each item of the reference space and the inversed matrix of the correlation matrix in the reference space may be calculated in advance, and the calculated results may be prepared as parameters beforehand. This is advantageous in omitting the effort of carrying out the calculations and simplifying the calculation process when repeatedly calculating the Mahalanobis distance.
- control unit 6 When dispensing of some sample is requested on the sample dispensing apparatus, the control unit 6 sends control commands to the dispensing syringe drive means 4 and the sample probe drive means 5. At the same time, instructions from the control unit 6 are also sent to the microcomputer 17 to make effective the function of detecting the abnormality of dispensing.
- the microcomputer 17 takes in the group of time-serial pressure data and stores the taken-in data in a RAM 19.
- the method of taking in the data is selected as one optimum for the amount of sample dispensed at that time.
- a CPU 18 calculates the Mahalanobis distance based on the above formulae (1) and (2).
- the parameters required for the calculations i.e., the average and the standard deviation for each item of the reference space and the inversed matrix of the correlation matrix in the reference space have been calculated for each of all available amounts of the dispensed sample and stored in a ROM 20 beforehand. Therefore, the parameters in match with the amount of sample dispensed at that time are selected.
- threshold determination is performed based on the calculated value.
- the threshold is not required to be prepared as a different value for each of the amounts of the dispensed sample, and it is just required to be set to one value.
- the reason resides in that the Mahalanobis distance is an index indicating whether a target is equal to or different from a reference waveform, and the reference waveform is prepared separately for each of the amounts of the dispensed sample.
- a result of the threshold determination is returned to the control unit 6, and based on the determination result, the control unit 6 makes determination in the subsequent process.
- the Mahalanobis distance is calculated for each of various practical waveforms of pressure fluctuations as follows.
- Fig. 7 shows results obtained by calculating the Mahalanobis distance for each of the waveforms of the pressure fluctuations shown in Figs. 2A to 21.
- Fig. 9A shows waveforms of pressure fluctuations resulting from shifting the original waveform by 5 kPa in each of the positive and negative sides of the vertical axis on an assumption that the output of the pressure sensor is susceptible to offset.
- Fig. 9B shows waveforms of pressure fluctuations resulting from multiplying the original waveform by 0.5 and 1.5 in the direction of the vertical axis on an assumption that the gain of the pressure sensor varies.
- Fig. 10 shows results obtained by carrying out similar waveform processing carried out on the each of the waveforms of the pressure fluctuations shown in Figs. 2A to 21 and then calculating the Mahalanobis distances for each waveform.
- the Mahalanobis distance usually takes a value near 1, it may take a value larger than 1 even in the normal case shown in Fig. 2A with the waveform processing described above.
- the Mahalanobis distance there still exists a significant difference in the Mahalanobis distance from a value calculated in the case of abnormal dispensing, and hence discrimination can be satisfactorily made between the normal and abnormal cases.
- the method used in the present invention compares the measured value with the reference in consideration of not only the magnitude of an item value itself, but also the correlation between items.
- the waveform of the pressure fluctuations is disturbed to a large extent as shown in Fig. 2B, for example, such a disturbance is apparently detected to be abnormal because not only item values in a disturbing region, but also the correlation between items differ from those resulting from the reference waveform.
- the output offset and gain variations of the pressure sensor occur as shown in Figs. 9A and 9B, the item values are deviated from the reference values, but the correlation between items is held substantially the same. As a result, such a case is detected to be normal based on overall determination.
- the related art is not robust against the output offset and gain variations of the pressure sensor shown in Figs. 9A and 9B because the determination is made based on only a value still belonging to the pressure dimension in any of the case of using a value extracted from a part of the waveform of the pressure fluctuations and the case of using a value resulting from integration or differentiation.
- the output offset and gain of the pressure sensor must be adjusted at a considerable cost, or the detection ability must be reduced by moderating the threshold reference.
- the present invention can effectively deal with the case in which the waveform of the pressure fluctuations is regularly disturbed.
- Fig. 11 shows a waveform of pressure fluctuations obtained when dispensing a sample in accordance with a certain dispensing sequence.
- the dispensing sequence used in this case lowers the sample probe twice; namely, it comprises the steps of lowering the sample probe as a first stroke to a level below the sample surface, and then lowering the sample probe twice to avoid the empty suction that will otherwise occur as a result of a descent of the sample surface due to the sample suction.
- the sample probe is connected to the pressure sensor through the tube, etc., the liquid in the dispensing flow passage, including the sample probe, vibrates with movement of the sample probe, and the vibration is transmitted to the pressure sensor.
- the pressure sensor may pick up other kinds of vibrations depending on how the pressure sensor is fixed.
- Such a disturbance of the waveform of the pressure fluctuations is unavoidably caused depending on the dispensing sequence, and it can be regarded as a regular disturbance caused in the same positions each time the sample is dispensed in accordance with the same sequence. Therefore, that disturbance is not an abnormal sign and must not be falsely detected as being abnormal.
- the disturbance when preparing the reference space, the disturbance such as shown in Fig. 11 appears as a larger variation of the item value (pressure value) taken in the region where the disturbance has occurred.
- the standard deviation of the relevant value increases and, looking from the viewpoint of the above-mentioned formula (1), a weighting factor for the relevant item is reduced correspondingly. Therefore, the calculated result of the Mahalanobis distance is not so affected even with a disturbance of the value of the relevant item.
- the present invention can satisfactorily deal with a regular disturbance of the pressure fluctuations because of considering the point of time at which the disturbance occurs and the information regarding the extent of disturbance.
- the abnormal dispensing occurs in various forms such as the complete clogging, the small clot suction, the highly viscous sample suction, and the empty suction, and the waveform of the pressure fluctuations changes depending on the various abnormal cases as shown in Figs. 2A to 21.
- the empty suction differs from the other abnormal cases in that, upon the occurrence of an abnormality, the pressure is changed toward the positive pressure side relative to the normal waveform.
- the group of time-serial pressure data is taken in (S4), the Mahalanobis distance is calculated at that time (S5), and the calculated value is compared with the threshold (S6) as described above. When the compared result exceeds the threshold, this case is detected to be abnormal. If the abnormality is detected, the data immediately before the end of the sample suction zone is extracted from among the group of time-serial pressure data that has already been taken in, and then compared with a threshold (S7). In the case of empty suction, the pressure at the point of time immediately before the end of the sample suction zone is not deflected toward the negative pressure side.
- this case can be discriminated as the empty suction, and an alarm indicating the empty suction is issued (S8). If the extracted data exceeds the certain range of threshold, it is thought that this case represents a sample abnormality other than the empty suction, and an alarm indicating that fact is issued (S9).
- the above-mentioned method utilizes the pressure value.
- the threshold determination using only a value is not robust against the output offset and gain variations of the pressure sensor, and increases a risk of false detection and missing of an abnormality.
- the influence of the output offset can be suppressed by calculating the difference from a value taken in before sucking the sample, but the gain cannot be compensated.
- the threshold range used for discriminating them can be set to a relatively wide range. As a result, the empty suction can surely be discriminated from another type of dispensing abnormality.
- Utilizing the technique of the present invention makes it possible, in addition to the determination whether the dispensing is normally performed, to check an abnormality of the dispensing flow passage system, such as clogging of the sample probe, (hereinafter referred to as a "dispensing system abnormality check") by dispensing a normal sample as a reference (hereinafter referred to as a "reference sample”) and looking at the waveform of the pressure fluctuations measured at that time.
- Fig. 13 shows a control flow for the dispensing system abnormality check.
- the reference sample As conditions required for the reference sample, it is important that individual differences of characteristics, such as viscosity and density, for each sample be hardly present, and that the sample can easily be prepared. Also, as a matter of course, the sample must not contain solid foreign matters, such as a clot. Examples of the reference sample satisfying those conditions include controlled serum and refined water. Alternatively, air is employed as the reference sample so that the empty suction is performed. Performing the empty suction is advantageous in that the necessity of preparing the reference sample is eliminated and there are no limiting conditions for the dispensing system abnormality check.
- the reference sample is sucked (S10), the group of time-serial pressure data is taken in from the waveform of the pressure fluctuations at that time (S11) and the Mahalanobis distance is calculated (S12).
- the threshold determination is then made on a calculated value of the Mahalanobis distance (S13). If the calculated value exceeds the threshold, this can be regarded as indicating that any abnormality occurs in the dispensing flow passage system.
- the check can be performed by deciding the amount of the dispensed reference sample to a certain value and dispensing the reference sample in the decided amount for each time. Stated another way, it is just required to decide one value of the amount of the dispensed reference sample and one type of the reference sample, and then to prepare one reference space for the dispensing system abnormality check.
- the present invention is applicable to not only the check for detecting the presence or absence of clogging, but also to a check for detecting an abnormality of the pressure measuring system, e.g., a check for detecting a failure of the pressure sensor.
- the dispensing system abnormality check routinely once per day or week and recording checked results in a recorder, it is possible to predict the extent of deterioration of the apparatus in advance, and to utilize a predicted result for effective maintenance. For example, when the sample probe is repeatedly used, contaminants are attached to the opening end of the sample probe and gradually clog the probe opening. By predicting the progress of the clogging in advance, the contaminants can be removed or the sample probe can be replaced before the clogging cause a problem. Thus, reliable dispensing can be performed at all times.
- Fig. 14 shows a flowchart for such control.
- the washing and the dispensing system abnormality check are repeated again.
- the number of times at which the washing and the dispensing system abnormality check are repeated is counted (S25). If a counted value exceeds a predetermined number of times, this is regarded as indicating that the relevant abnormality is an abnormality which cannot be removed by the washing, and hence the dispensing operation is stopped (S24).
- the number of times at which the washing and the dispensing system abnormality check are repeated is not limited to a particular value. Alternatively, the number of times may be set to one so that the dispensing operation is stopped without repeating the washing.
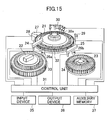
- FIG. 15 schematically shows the construction of an automatic analyzer according to the present invention.
- the automatic analyzer primarily comprises a reaction disk 21, a sample storing unit 22, a reagent storing unit 23, a sample dispensing apparatus 24, a reagent dispensing apparatus 25, cleaning baths 26a and 26b, a photometer 27, a reaction bath 28, an stirring mechanism 29, a cleaning mechanism 30, and a control unit 31.
- a reaction disk 21 there are arranged a plurality of reaction vessels 32 for mixing and stirring a sample and a reagent.
- a plurality of sample vessels 33 containing samples are arranged in the sample storing unit 22, and a plurality of reagent vessels 34 containing reagents are arranged in the reagent storing unit 23.
- the automatic analyzer of the present invention further comprises an input device 35, an output device 36, an auxiliary memory 37, etc.
- the control unit 31 supervises and controls the overall operation. With that configuration, an analysis item can be designated through the input device, and the analysis result and the presence or absence of dispensing abnormality can be displayed on the output device.
- the automatic analyzer thus constructed carries out analysis through the following procedures.
- the reaction disk 21 including the plurality of reaction vessels 32 arranged thereon is rotated to move to a predetermined position, and a fixed amount of sample is dispensed from the sample storing unit 22 into the reaction vessel 32 by using the sample dispensing apparatus 24.
- a fixed amount of reagent is dispensed from the reagent storing unit 23 into the reaction vessel 32, into which the sample has been just dispensed, by using the reagent dispensing apparatus 25.
- the reaction vessel 32, into which both the sample and the reagent have been dispensed is rotated for transfer to the position of the stirring mechanism 29 for mixing and stirring.
- the sample and the reagent turn to a reaction liquid under the stirring and are transferred to the position of the photometer 27.
- the absorbance of the reaction liquid is measured for analysis of the sample.
- the reaction vessel 32 is transferred to the position of the cleaning mechanism 30 in which the interior of the reaction vessel 32 is washed. Subsequently, a new sample and reagent are dispensed into the washed reaction vessel 32. Such a series of successive operations are repeatedly performed for each of the plurality of reaction vessels 32.
- the automatic analyzer of this embodiment is featured in washing the reaction vessel 32, which has finished the analysis, by using the cleaning mechanism 30, and then employing the reaction vessel 32 repeatedly.
- the cleaning mechanism 30 has a plurality of cleaning nozzles 30a through which the reaction liquid is sucked, the cleaning material, e.g., an acid or alkali, is ejected and sucked, and the cleaning water is ejected and sucked.
- the automatic analyzer thus constructed accompanies with a problem that, when a sample including a clot is sucked by the sample dispensing apparatus 24 and the sample is ejected, as it is, into the reaction vessel 32, the clot is clogged in the cleaning nozzle 30a during the washing and the subsequent reaction vessels 32 can no longer be washed.
- Fig. 16 shows a control flow for that purpose.
- the group of time-serial pressure data is taken in with the sample suction zone being at the center, the Mahalanobis distance is calculated from the taken-in data group, and the threshold determination is made (S27).
- Those steps of processing are performed before the sample ejection, and it is determined based on the determination result whether the sucked sample is to be ejected into the reaction vessel. If it is determined that a normal sample has been sucked, the sample is ejected, as it is, into the reaction vessel (S29) and the subsequent dispensing operation is started (S30).
- the operation of ejecting the sample into the reaction vessel is canceled (S31), and the sample dispensing apparatus is directly moved to the cleaning bath for washing (S33). It is desirable that, at the same time as canceling the operation of ejecting the sample into the reaction vessel, the other operations, such as the dispensing of a reagent and the stirring, which are to be performed for the relevant sample, be also canceled. This cancellation is advantageous in reducing a waste of the reagent.
- the sample dispensing apparatus is subjected to the dispensing system abnormality check (S34). Based on a check result, it is determined whether the dispensing operation is to be continued (S36) or stopped (S38).
- the present invention it is possible not only to merely detect an abnormality during the dispensing, but also to determine whether the detected abnormality is caused by an abnormality of the sample or the empty suction. Therefore, the present invention enables a counteraction to be performed depending on the various different causes.
- Fig. 17 shows a control flow for that counteraction.
- the sample probe is washed (S46) and the dispensing operation is performed again on the same sample. Because the empty suction is possibly attributable to the fact that a descent amount of the sample probe is insufficient, the sample probe is descended in the next cycle of dispensing in a larger amount than that in the previous cycle of dispensing so as to enter the sample vessel to a larger extent (S49). While repeating similar processing in subsequent cycles of dispensing, the number of times of the empty suction is counted (S48). If the empty suction is continued in excess of a predetermined number of times, this is regarded as indicating that no sample is present in the sample vessel.
- the analysis of the remaining analysis items for the relevant sample is canceled, and an alarm indicating the abnormality is displayed on the output device (S50).
- the abnormality of dispensing is determined as empty suction, the sample dispensing apparatus is free from any abnormality, such as that the clogging of the sample probe cannot be removed. In other words, the dispensing can be continued without problems. Accordingly, even after the analysis of the relevant sample has been canceled, the operation proceeds to the dispensing of a next sample without stopping the automatic analyzer (S51).
- the number of times at which the dispensing is repeated for the same sample is not limited to a particular value. Alternatively, the number of times may be set to one so that the analysis of the relevant sample is canceled at once and the dispensing of a next sample is started.
- the sample probe is washed (S53). Thereafter, a reference sample is dispensed to carry out the dispensing system abnormality check (S54). If a check result is abnormal, the washing is repeated. If the abnormality is not removed even after repeating the washing, an operator must manually remove the abnormality. In this case, the sample dispensing apparatus stops the dispensing (S58), and an alarm indicating the abnormal condition is issued to the output device. Because the dispensing is no longer continued in this case unless the abnormality is removed, another auditory or visual alarm, such as an alarm sound or light, may also be issued.
- another auditory or visual alarm such as an alarm sound or light
- the dispensing is performed again on the same sample. If the sample abnormality is continued in excess of a predetermined number of times while the dispensing is repeated on the same sample, this is regarded as indicating that the relevant sample includes many clots. Therefore, the analysis of the remaining analysis items for the relevant sample is canceled, and an alarm indicating the abnormality is displayed on the output device (S60). However, the cancellation is made only for the relevant sample, and the operation proceeds to the dispensing of a next sample without stopping the automatic analyzer (S61).
- the present invention since various types of abnormal dispensing causing analysis failures can be all detected regardless of the type and extent of abnormality, reliability of the sample dispensing apparatus and analysis results of the automatic analyzer employing the sample dispensing apparatus can be increased. Consequently, the present invention is also effective in reducing labor and cost required for management of samples in an inspection room.
- the method of determining an abnormality of dispensing according to the present invention has sufficient robustness against variations of sensitivity of the pressure sensor, and is able to accurately detect the abnormality of dispensing without reducing the detection ability with no need of performing close adjustment or narrowing working tolerances. As a result, it is possible to suppress the cost that is otherwise expected to increase due to the necessity of those additional steps.
- the subsequent actions for dealing with the abnormality can be automatically performed, and therefore the processing efficiency can be increased. Also, in the event of an abnormality, whether the abnormality has been removed can be detected with high accuracy, and hence higher reliability is ensured.
Abstract
Description


Claims (15)
- A sample dispensing apparatus comprising a probe for sucking and ejecting a sample, a dispensing syringe for generating a pressure in said probe to suck and eject the sample, a dispensing flow passage connecting said probe and said dispensing syringe, and a control unit for controlling sucking and ejection operations of the sample, said apparatus further comprising:at least one pressure sensor for detecting a pressure in said dispensing flow passage;pressure value storing means for time-serially storing output values of said pressure sensor during an operation of dispensing the sample;storage means for storing a reference database consisted of time-serial output values of said pressure sensor, which are obtained when the sample is normally sucked or ejected by said probe; anddetermining means for carrying out multi-variable analysis of both said reference database and comparison data created based on the output values of said pressure sensor time-serially stored in said pressure value storing means, and for determining the presence or absence of an abnormality in the dispensing operation of the sample based on an analysis result.
- A sample dispensing apparatus comprising a probe for sucking and ejecting a sample, a dispensing syringe for generating a pressure in said probe to suck and eject the sample, a dispensing flow passage connecting said probe and said dispensing syringe, and a control unit for controlling sucking and ejection operations of the sample, the apparatus further comprising:at least one pressure sensor for detecting a pressure in said dispensing flow passage;pressure value storing means for time-serially storing output values of said pressure sensor during an operation of dispensing the sample;storage means for storing a reference database consisted of time-serial output values of said pressure sensor, which are obtained when the sample is normally sucked or ejected by said probe; anddetermining means for determining an abnormality of sample dispensing by comparing the Mahalanobis distance calculated from both comparison data prepared based on the output values of said pressure sensor time-serially stored in said pressure value storing means and said reference database, with a preset threshold.
- A sample dispensing apparatus according to Claim 2,
wherein said reference database is prepared depending on an amount of dispensed sample, and the abnormality of sample dispensing is determined by comparing the Mahalanobis distance calculated from both said comparison data and reference database corresponding to the amount of dispensed sample, with a preset threshold. - A sample dispensing apparatus according to Claim 1, further comprising discriminating means for, when the abnormality of sample dispensing is detected, comparing a pressure value immediately before the end of the sample sucking operation with a preset threshold, and for discriminating a cause of the dispensing abnormality.
- A sample dispensing apparatus according to Claim 1, further comprising dispensing-function abnormality determining means for, when a fluid having a known physical property, such as viscosity and density, is dispensed as the sample, determining the abnormality of dispensing and determining the presence or absence of an abnormality in a dispensing function of said sample dispensing apparatus.
- A sample dispensing apparatus according to Claim 5, wherein said sample dispensing apparatus has a function of determining the abnormality of dispensing each time said sample dispensing apparatus is started up, and determining the presence or absence of the abnormality in the dispensing function of said sample dispensing apparatus.
- A sample dispensing apparatus according to Claim 5, further comprising recording means for routinely determining the abnormality of dispensing and time-serially recording determination results, and means for discriminating the extent of deterioration in the dispensing function of said sample dispensing apparatus.
- A sample dispensing apparatus according to Claim 1, further comprising:wherein said sample dispensing apparatus has a function of, when the abnormality of sample dispensing is detected, washing the interior of said dispensing flow passage including said sample probe, then dispensing a fluid having a known physical property, such as viscosity and density, and determining the dispensing abnormality in the fluid dispensing, thereby determining whether the dispensing function of said sample dispensing apparatus is restored.cleaning means for washing the interior of said dispensing flow passage including said sample probe; and
- A sample dispensing apparatus according to Claim 8, wherein said sample dispensing apparatus has a function of stopping the dispensing operation when the abnormality of sample dispensing is detected and thereafter the dispensing function of said sample dispensing apparatus is not restored even after repeating the washing a predetermined number of times.
- An automatic analyzer including a sample dispensing apparatus according to Claim 1, a cleaning bath for cleaning an outer surface of a sample probe, a reaction vessel cleaning mechanism, and a reaction vessel repeatedly used after being washed by said reaction vessel cleaning mechanism,
wherein said automatic analyzer has a function of, when an abnormality of dispensing is detected during suction of a sample, discarding the sample into said cleaning bath without ejecting the sample into said reaction vessel. - An automatic analyzer including a sample dispensing apparatus according to Claim 4, wherein said automatic analyzer has a function of, when an abnormality of sample dispensing is detected, finding out a cause of the dispensing abnormality from among a plurality of classified causes and displaying the found-out cause.
- An automatic analyzer according to Claim 11, wherein said automatic analyzer has a function of displaying the cause of the dispensing abnormality and performing a counteraction corresponding to the cause.
- An automatic analyzer including a sample dispensing apparatus according to Claim 1, wherein said automatic analyzer has a function of, when an abnormality of sample dispensing is detected, repeatedly dispensing the relevant sample within a predetermined number of times.
- An automatic analyzer including a sample dispensing apparatus according to Claim 1, wherein said automatic analyzer has a function of, when an abnormality of sample dispensing is detected and then the dispensing abnormality still continues even after repeatedly dispensing the relevant sample within a predetermined number of times, canceling the dispensing of the relevant sample and starting to dispense a next sample.
- A method of detecting an abnormality during sample dispensing, comprising the steps of:sucking a sample by using a probe;time-serially storing output values of a pressure sensor representing pressures in said probed and detected during sample suction;creating comparison data based on the stored output values of said pressure sensor; andcarrying out multi-variable analysis of both the comparison data created in said step and reference database consisted of time-serial output values of said pressure sensor, which are obtained when the sample is normally sucked or ejected by said probe, and determining the presence or absence of an abnormality in the dispensing operation of the sample based on an analysis result.
Applications Claiming Priority (4)
| Application Number | Priority Date | Filing Date | Title |
|---|---|---|---|
| JP2002229374 | 2002-08-07 | ||
| JP2002229374 | 2002-08-07 | ||
| JP2003202163 | 2003-07-28 | ||
| JP2003202163A JP4248328B2 (en) | 2002-08-07 | 2003-07-28 | Sample dispensing apparatus and automatic analyzer using the same |
Publications (3)
| Publication Number | Publication Date |
|---|---|
| EP1391734A2 true EP1391734A2 (en) | 2004-02-25 |
| EP1391734A3 EP1391734A3 (en) | 2010-10-06 |
| EP1391734B1 EP1391734B1 (en) | 2013-04-24 |
Family
ID=31190365
Family Applications (1)
| Application Number | Title | Priority Date | Filing Date |
|---|---|---|---|
| EP20030017862 Expired - Lifetime EP1391734B1 (en) | 2002-08-07 | 2003-08-05 | Sample dispensing apparatus and automatic analyzer using the same |
Country Status (2)
| Country | Link |
|---|---|
| EP (1) | EP1391734B1 (en) |
| JP (1) | JP4248328B2 (en) |
Cited By (26)
| Publication number | Priority date | Publication date | Assignee | Title |
|---|---|---|---|---|
| EP1607746A2 (en) * | 2004-06-17 | 2005-12-21 | Sysmex Corporation | Clinical specimen processing apparatus and clinical specimen processing system |
| EP1612536A3 (en) * | 2004-06-29 | 2007-03-07 | Sysmex Corporation | Clinical specimen processsing apparatus |
| EP1895309A1 (en) | 2006-08-31 | 2008-03-05 | Hitachi High-Technologies Corporation | Automatic analyzer |
| EP1966731A2 (en) * | 2005-12-19 | 2008-09-10 | Siemens Healthcare Diagnostics Inc. | Method for ascertaining interferants in small liquid samples in an automated clinical analyzer |
| EP2295987A1 (en) * | 2008-07-02 | 2011-03-16 | Beckman Coulter, Inc. | Dispensing device |
| EP2752667A1 (en) * | 2011-09-01 | 2014-07-09 | Hitachi High-Technologies Corporation | Autoanalyzer |
| EP2891888A1 (en) * | 2012-08-28 | 2015-07-08 | Hitachi High-Technologies Corporation | Automatic analysis device |
| EP2952902A4 (en) * | 2013-01-31 | 2016-09-21 | Hitachi High Tech Corp | Automated analysis device |
| EP2956403A4 (en) * | 2013-02-15 | 2016-10-12 | Siemens Healthcare Diagnostics | Real-time volume confirmation dispensing apparatus and methods |
| EP3165931A1 (en) * | 2015-11-09 | 2017-05-10 | Euroimmun Medizinische Labordiagnostika AG | Use of a pressure sensor in life science applications |
| WO2018071512A1 (en) | 2016-10-11 | 2018-04-19 | Rheosense, Inc. | Viscometer and methods for using the same |
| EP3443947A1 (en) * | 2017-08-15 | 2019-02-20 | Prodictis SA | Device for preparing a dose of material |
| CN110383075A (en) * | 2017-03-10 | 2019-10-25 | 株式会社日立高新技术 | Automatic analysing apparatus |
| CN110501515A (en) * | 2018-05-16 | 2019-11-26 | 日本电子株式会社 | Automatic analysing apparatus and automatic analysis method |
| CN110967500A (en) * | 2018-09-30 | 2020-04-07 | 深圳迈瑞生物医疗电子股份有限公司 | Sample detection method and device, sample analyzer and storage medium |
| EP3671221A1 (en) * | 2018-12-18 | 2020-06-24 | Tecan Trading AG | Classifying liquid handling procedures with a neural network |
| EP3680631A1 (en) * | 2019-01-09 | 2020-07-15 | Jeol Ltd. | Automatic analyzer and program |
| CN111602061A (en) * | 2018-01-15 | 2020-08-28 | 株式会社日立高新技术 | Automatic analyzer |
| CN111727366A (en) * | 2017-12-19 | 2020-09-29 | 株式会社日立高新技术 | Signal processing apparatus and signal processing method |
| CN113039439A (en) * | 2019-01-07 | 2021-06-25 | 深圳迈瑞生物医疗电子股份有限公司 | Sample analysis apparatus and method of evaluating reagent dispensing |
| CN113574391A (en) * | 2019-03-15 | 2021-10-29 | 株式会社日立高新技术 | Automatic analyzer |
| US11162885B2 (en) | 2014-04-11 | 2021-11-02 | Rheosense, Inc. | Viscometer and methods for using the same |
| CN113933351A (en) * | 2021-09-30 | 2022-01-14 | 深圳市中金岭南有色金属股份有限公司凡口铅锌矿 | Pulp pH value detection method and device and computer readable storage medium |
| CN114166830A (en) * | 2021-12-08 | 2022-03-11 | 苏州长光华医生物医学工程有限公司 | Sampling needle pipeline and sampling judgment method |
| WO2023207208A1 (en) * | 2022-04-24 | 2023-11-02 | 深圳市帝迈生物技术有限公司 | Sample analyzer and pressure buildup control method therefor |
| CN113574391B (en) * | 2019-03-15 | 2024-04-16 | 株式会社日立高新技术 | Automatic analysis device |
Families Citing this family (30)
| Publication number | Priority date | Publication date | Assignee | Title |
|---|---|---|---|---|
| JP2004177308A (en) * | 2002-11-28 | 2004-06-24 | Toshiba Medical System Co Ltd | Method for judging attraction state and automatic chemical analyzer |
| JP3840450B2 (en) * | 2002-12-02 | 2006-11-01 | 株式会社日立ハイテクノロジーズ | Analysis equipment |
| JP4045211B2 (en) * | 2003-06-27 | 2008-02-13 | 株式会社日立ハイテクノロジーズ | Automatic analyzer |
| JP4524642B2 (en) * | 2005-04-22 | 2010-08-18 | 東ソー株式会社 | How to check the suction status |
| JP2007303937A (en) * | 2006-05-10 | 2007-11-22 | Olympus Corp | Autoanalyzer |
| JP2007322319A (en) * | 2006-06-02 | 2007-12-13 | Olympus Corp | Sample dispenser |
| JP2008175731A (en) * | 2007-01-19 | 2008-07-31 | Toshiba Corp | Automatic analysis apparatus and its maintenance method |
| JP5106906B2 (en) * | 2007-04-05 | 2012-12-26 | 株式会社日立ハイテクノロジーズ | Automatic analyzer |
| JP2009121838A (en) * | 2007-11-12 | 2009-06-04 | Hitachi High-Technologies Corp | Specimen dispenser and automatic analyzer |
| US7926325B2 (en) * | 2008-04-23 | 2011-04-19 | Siemens Healthcare Diagnostics Inc. | Differentiating between abnormal sample viscosities and pipette clogging during aspiration |
| EP2320238B1 (en) * | 2008-07-31 | 2020-09-23 | Hitachi High-Tech Corporation | Automatic analyzing device |
| JP2010038578A (en) * | 2008-07-31 | 2010-02-18 | Olympus Corp | Automatic analyzing apparatus |
| US9176156B2 (en) | 2008-09-30 | 2015-11-03 | Hitachi High-Technologies Corporation | Automatic analyzer including pressure sensor for washing solution |
| JP2010223638A (en) * | 2009-03-19 | 2010-10-07 | Beckman Coulter Inc | Dispensing device, automatic analyzer, and dispensation monitoring method of dispensing device |
| JP5518598B2 (en) * | 2010-07-02 | 2014-06-11 | 東京エレクトロン株式会社 | PARTICLE DISTRIBUTION ANALYSIS SUPPORT METHOD AND RECORDING MEDIUM CONTAINING PROGRAM FOR IMPLEMENTING THE METHOD |
| JP6072421B2 (en) * | 2012-03-02 | 2017-02-01 | 株式会社日立ハイテクノロジーズ | Analysis apparatus and analysis method |
| JP5912787B2 (en) * | 2012-04-06 | 2016-04-27 | 株式会社日立ハイテクノロジーズ | Automatic analyzer |
| JP6025397B2 (en) * | 2012-05-22 | 2016-11-16 | 株式会社日立ハイテクノロジーズ | Automatic analyzer |
| JP5899075B2 (en) | 2012-07-20 | 2016-04-06 | 株式会社日立ハイテクノロジーズ | Automatic analyzer |
| JP6204104B2 (en) * | 2013-07-29 | 2017-09-27 | 株式会社堀場製作所 | Liquid analyzer |
| JP2015031586A (en) * | 2013-08-02 | 2015-02-16 | 株式会社日立ハイテクノロジーズ | Analyzer and liquid suction device |
| CN105917239B (en) * | 2014-01-27 | 2017-09-22 | 株式会社日立高新技术 | Automatic analysing apparatus |
| JP6521567B2 (en) * | 2014-02-27 | 2019-05-29 | キヤノンメディカルシステムズ株式会社 | Clinical examination equipment |
| JP6554301B2 (en) * | 2015-03-27 | 2019-07-31 | 古野電気株式会社 | Dispensing device, automatic analyzer and dispensing method |
| JP6567890B2 (en) * | 2015-06-19 | 2019-08-28 | 株式会社日立ハイテクノロジーズ | Automatic analyzer |
| JP6760243B2 (en) * | 2017-10-25 | 2020-09-23 | 株式会社Sumco | A method for determining the quality of a silicon single crystal, a method for manufacturing a silicon single crystal, and a method for manufacturing a silicon wafer. |
| US11719714B2 (en) | 2018-03-28 | 2023-08-08 | Hitachi High-Tech Corporation | Automatic analyzer |
| US11519886B2 (en) * | 2018-05-01 | 2022-12-06 | Shimadzu Corporation | Autosampler and liquid chromatograph |
| EP4012419A4 (en) | 2019-08-05 | 2023-08-09 | Hitachi High-Tech Corporation | Liquid dispensing device |
| EP3786634A1 (en) * | 2019-08-27 | 2021-03-03 | Roche Diagnostics GmbH | Techniques for checking state of analyzers |
Family Cites Families (9)
| Publication number | Priority date | Publication date | Assignee | Title |
|---|---|---|---|---|
| JPS6375565A (en) * | 1986-09-18 | 1988-04-05 | Toshiba Corp | Sampling monitor |
| US5463895A (en) * | 1990-11-09 | 1995-11-07 | Abbott Laboratories | Sample pipetting method |
| JP2725940B2 (en) * | 1992-03-03 | 1998-03-11 | アロカ株式会社 | Dispensing device |
| JP3318629B2 (en) * | 1993-06-18 | 2002-08-26 | ソニー株式会社 | Liquid suction / discharge device and method |
| US5537880A (en) * | 1995-06-07 | 1996-07-23 | Abbott Laboratories | Automatic pipetting apparatus with leak detection and method of detecting a leak |
| US5965828A (en) * | 1995-12-14 | 1999-10-12 | Abbott Laboratories | Fluid handler and method of handling a fluid |
| JP3733216B2 (en) * | 1997-09-11 | 2006-01-11 | オリンパス株式会社 | Sample dispensing device |
| US6121049A (en) * | 1997-12-05 | 2000-09-19 | Bayer Corporation | Method of verifying aspirated volume in automatic diagnostic system |
| US6370942B1 (en) * | 2000-05-15 | 2002-04-16 | Dade Behring Inc. | Method for verifying the integrity of a fluid transfer |
-
2003
- 2003-07-28 JP JP2003202163A patent/JP4248328B2/en not_active Expired - Lifetime
- 2003-08-05 EP EP20030017862 patent/EP1391734B1/en not_active Expired - Lifetime
Non-Patent Citations (1)
| Title |
|---|
| None |
Cited By (48)
| Publication number | Priority date | Publication date | Assignee | Title |
|---|---|---|---|---|
| US7776271B2 (en) | 2004-06-17 | 2010-08-17 | Sysmex Corporation | Clinical specimen processing apparatus and clinical specimen processing system |
| EP1607746A3 (en) * | 2004-06-17 | 2007-01-17 | Sysmex Corporation | Clinical specimen processing apparatus and clinical specimen processing system |
| EP1607746A2 (en) * | 2004-06-17 | 2005-12-21 | Sysmex Corporation | Clinical specimen processing apparatus and clinical specimen processing system |
| US9110042B2 (en) | 2004-06-17 | 2015-08-18 | Sysmex Corporation | Clinical specimen processing apparatus and clinical specimen processing system |
| US7951330B2 (en) | 2004-06-29 | 2011-05-31 | Sysmex Corporation | Clinical specimen processing apparatus |
| EP1612536A3 (en) * | 2004-06-29 | 2007-03-07 | Sysmex Corporation | Clinical specimen processsing apparatus |
| EP1966731A2 (en) * | 2005-12-19 | 2008-09-10 | Siemens Healthcare Diagnostics Inc. | Method for ascertaining interferants in small liquid samples in an automated clinical analyzer |
| EP1966731A4 (en) * | 2005-12-19 | 2009-11-11 | Siemens Healthcare Diagnostics | Method for ascertaining interferants in small liquid samples in an automated clinical analyzer |
| EP1895309A1 (en) | 2006-08-31 | 2008-03-05 | Hitachi High-Technologies Corporation | Automatic analyzer |
| EP2295987A4 (en) * | 2008-07-02 | 2013-03-06 | Beckman Coulter Inc | Dispensing device |
| US8449840B2 (en) | 2008-07-02 | 2013-05-28 | Beckman Coulter, Inc. | Dispensing device |
| EP2295987A1 (en) * | 2008-07-02 | 2011-03-16 | Beckman Coulter, Inc. | Dispensing device |
| EP2752667A1 (en) * | 2011-09-01 | 2014-07-09 | Hitachi High-Technologies Corporation | Autoanalyzer |
| EP2752667A4 (en) * | 2011-09-01 | 2015-04-22 | Hitachi High Tech Corp | Autoanalyzer |
| US9599631B2 (en) | 2011-09-01 | 2017-03-21 | Hitachi High-Technologies Corporation | Automatic analyzer |
| EP2891888A1 (en) * | 2012-08-28 | 2015-07-08 | Hitachi High-Technologies Corporation | Automatic analysis device |
| EP2891888A4 (en) * | 2012-08-28 | 2016-07-06 | Hitachi High Tech Corp | Automatic analysis device |
| EP2952902A4 (en) * | 2013-01-31 | 2016-09-21 | Hitachi High Tech Corp | Automated analysis device |
| EP2956403A4 (en) * | 2013-02-15 | 2016-10-12 | Siemens Healthcare Diagnostics | Real-time volume confirmation dispensing apparatus and methods |
| US9989551B2 (en) | 2013-02-15 | 2018-06-05 | Siemens Healthcare Diagnostics Inc. | Real-time volume confirmation dispensing apparatus and methods |
| US11162885B2 (en) | 2014-04-11 | 2021-11-02 | Rheosense, Inc. | Viscometer and methods for using the same |
| EP3165931A1 (en) * | 2015-11-09 | 2017-05-10 | Euroimmun Medizinische Labordiagnostika AG | Use of a pressure sensor in life science applications |
| EP3526580A4 (en) * | 2016-10-11 | 2020-05-27 | Rheosense Inc. | Viscometer and methods for using the same |
| WO2018071512A1 (en) | 2016-10-11 | 2018-04-19 | Rheosense, Inc. | Viscometer and methods for using the same |
| US11320443B2 (en) | 2017-03-10 | 2022-05-03 | Hitachi High-Tech Corporation | Automatic analysis device |
| CN110383075B (en) * | 2017-03-10 | 2023-10-20 | 株式会社日立高新技术 | automatic analysis device |
| EP3594694A4 (en) * | 2017-03-10 | 2020-12-30 | Hitachi High-Tech Corporation | Automatic analysis device |
| CN110383075A (en) * | 2017-03-10 | 2019-10-25 | 株式会社日立高新技术 | Automatic analysing apparatus |
| EP3443947A1 (en) * | 2017-08-15 | 2019-02-20 | Prodictis SA | Device for preparing a dose of material |
| CN111727366A (en) * | 2017-12-19 | 2020-09-29 | 株式会社日立高新技术 | Signal processing apparatus and signal processing method |
| CN111602061B (en) * | 2018-01-15 | 2023-07-14 | 株式会社日立高新技术 | Automatic analysis device |
| CN111602061A (en) * | 2018-01-15 | 2020-08-28 | 株式会社日立高新技术 | Automatic analyzer |
| CN110501515A (en) * | 2018-05-16 | 2019-11-26 | 日本电子株式会社 | Automatic analysing apparatus and automatic analysis method |
| CN110501515B (en) * | 2018-05-16 | 2023-04-14 | 日本电子株式会社 | Automatic analysis device and automatic analysis method |
| CN110967500A (en) * | 2018-09-30 | 2020-04-07 | 深圳迈瑞生物医疗电子股份有限公司 | Sample detection method and device, sample analyzer and storage medium |
| EP3671221A1 (en) * | 2018-12-18 | 2020-06-24 | Tecan Trading AG | Classifying liquid handling procedures with a neural network |
| WO2020126694A1 (en) | 2018-12-18 | 2020-06-25 | Tecan Trading Ag | Classifying liquid handling procedures with a neural network |
| EP4030170A1 (en) | 2018-12-18 | 2022-07-20 | Tecan Trading AG | Classifying liquid handling procedures with a neural network |
| CN113039439A (en) * | 2019-01-07 | 2021-06-25 | 深圳迈瑞生物医疗电子股份有限公司 | Sample analysis apparatus and method of evaluating reagent dispensing |
| EP3680631A1 (en) * | 2019-01-09 | 2020-07-15 | Jeol Ltd. | Automatic analyzer and program |
| CN113574391A (en) * | 2019-03-15 | 2021-10-29 | 株式会社日立高新技术 | Automatic analyzer |
| CN113574391B (en) * | 2019-03-15 | 2024-04-16 | 株式会社日立高新技术 | Automatic analysis device |
| EP3913376A4 (en) * | 2019-03-15 | 2022-10-05 | Hitachi High-Tech Corporation | Automated analyzer |
| CN113933351A (en) * | 2021-09-30 | 2022-01-14 | 深圳市中金岭南有色金属股份有限公司凡口铅锌矿 | Pulp pH value detection method and device and computer readable storage medium |
| CN113933351B (en) * | 2021-09-30 | 2023-12-22 | 深圳市中金岭南有色金属股份有限公司凡口铅锌矿 | Pulp pH value detection method and device and computer readable storage medium |
| CN114166830B (en) * | 2021-12-08 | 2023-07-14 | 苏州长光华医生物医学工程有限公司 | Sampling needle pipeline and sampling judgment method |
| CN114166830A (en) * | 2021-12-08 | 2022-03-11 | 苏州长光华医生物医学工程有限公司 | Sampling needle pipeline and sampling judgment method |
| WO2023207208A1 (en) * | 2022-04-24 | 2023-11-02 | 深圳市帝迈生物技术有限公司 | Sample analyzer and pressure buildup control method therefor |
Also Published As
| Publication number | Publication date |
|---|---|
| JP4248328B2 (en) | 2009-04-02 |
| JP2004125780A (en) | 2004-04-22 |
| EP1391734A3 (en) | 2010-10-06 |
| EP1391734B1 (en) | 2013-04-24 |
Similar Documents
| Publication | Publication Date | Title |
|---|---|---|
| EP1391734B1 (en) | Sample dispensing apparatus and automatic analyzer using the same | |
| US7027935B2 (en) | Sample dispensing apparatus and automatic analyzer using the same | |
| JP5899075B2 (en) | Automatic analyzer | |
| JP5865633B2 (en) | Automatic analyzer | |
| EP1882951B1 (en) | Method of detecting dispensed quantity, and liquid suction monitoring dispensing apparatus | |
| EP2006689B1 (en) | Sample dispensing apparatus and method | |
| JP6076108B2 (en) | Automatic analyzer | |
| JP2004271266A (en) | Dispensing device and autoanalyzer using the same | |
| JPWO2015111442A1 (en) | Automatic analyzer | |
| JP2002333449A (en) | Sample dispensing apparatus and autoanalyzer using the same | |
| CN111602061B (en) | Automatic analysis device | |
| JP6204087B2 (en) | Automatic analyzer | |
| JP2003294774A (en) | Automatic analyzer | |
| JP5536727B2 (en) | Dispensing method and dispensing apparatus | |
| JP4410506B2 (en) | Automatic analyzer | |
| EP1812163B1 (en) | Method for checking the condition of a sample when metering liquid | |
| WO2020188897A1 (en) | Automated analyzer | |
| CN113574391B (en) | Automatic analysis device | |
| US11366129B2 (en) | Automatic analyzer and automatic analysis method | |
| CN117295954A (en) | Dispensing device, automatic analysis device, and dispensing method | |
| JP2005164293A (en) | Dispensing device | |
| KR20120128176A (en) | Method for detecting flow and abnormal driving of fluid dispensing system |
Legal Events
| Date | Code | Title | Description |
|---|---|---|---|
| PUAI | Public reference made under article 153(3) epc to a published international application that has entered the european phase |
Free format text: ORIGINAL CODE: 0009012 |
|
| AK | Designated contracting states |
Kind code of ref document: A2 Designated state(s): AT BE BG CH CY CZ DE DK EE ES FI FR GB GR HU IE IT LI LU MC NL PT RO SE SI SK TR |
|
| AX | Request for extension of the european patent |
Extension state: AL LT LV MK |
|
| 17P | Request for examination filed |
Effective date: 20060331 |
|
| PUAL | Search report despatched |
Free format text: ORIGINAL CODE: 0009013 |
|
| AK | Designated contracting states |
Kind code of ref document: A3 Designated state(s): AT BE BG CH CY CZ DE DK EE ES FI FR GB GR HU IE IT LI LU MC NL PT RO SE SI SK TR |
|
| AX | Request for extension of the european patent |
Extension state: AL LT LV MK |
|
| 17Q | First examination report despatched |
Effective date: 20101214 |
|
| AKX | Designation fees paid |
Designated state(s): DE FR GB |
|
| GRAP | Despatch of communication of intention to grant a patent |
Free format text: ORIGINAL CODE: EPIDOSNIGR1 |
|
| GRAS | Grant fee paid |
Free format text: ORIGINAL CODE: EPIDOSNIGR3 |
|
| GRAP | Despatch of communication of intention to grant a patent |
Free format text: ORIGINAL CODE: EPIDOSNIGR1 |
|
| GRAA | (expected) grant |
Free format text: ORIGINAL CODE: 0009210 |
|
| AK | Designated contracting states |
Kind code of ref document: B1 Designated state(s): DE FR GB |
|
| REG | Reference to a national code |
Ref country code: GB Ref legal event code: FG4D |
|
| REG | Reference to a national code |
Ref country code: DE Ref legal event code: R096 Ref document number: 60343847 Country of ref document: DE Effective date: 20130620 |
|
| PLBE | No opposition filed within time limit |
Free format text: ORIGINAL CODE: 0009261 |
|
| STAA | Information on the status of an ep patent application or granted ep patent |
Free format text: STATUS: NO OPPOSITION FILED WITHIN TIME LIMIT |
|
| 26N | No opposition filed |
Effective date: 20140127 |
|
| GBPC | Gb: european patent ceased through non-payment of renewal fee |
Effective date: 20130805 |
|
| REG | Reference to a national code |
Ref country code: DE Ref legal event code: R097 Ref document number: 60343847 Country of ref document: DE Effective date: 20140127 |
|
| PG25 | Lapsed in a contracting state [announced via postgrant information from national office to epo] |
Ref country code: GB Free format text: LAPSE BECAUSE OF NON-PAYMENT OF DUE FEES Effective date: 20130805 |
|
| REG | Reference to a national code |
Ref country code: FR Ref legal event code: PLFP Year of fee payment: 14 |
|
| REG | Reference to a national code |
Ref country code: FR Ref legal event code: PLFP Year of fee payment: 15 |
|
| REG | Reference to a national code |
Ref country code: FR Ref legal event code: PLFP Year of fee payment: 16 |
|
| REG | Reference to a national code |
Ref country code: DE Ref legal event code: R082 Ref document number: 60343847 Country of ref document: DE Representative=s name: STREHL SCHUEBEL-HOPF & PARTNER MBB PATENTANWAE, DE Ref country code: DE Ref legal event code: R081 Ref document number: 60343847 Country of ref document: DE Owner name: HITACHI HIGH-TECH CORPORATION, JP Free format text: FORMER OWNER: HITACHI HIGH-TECHNOLOGIES CORPORATION, TOKYO, JP |
|
| PGFP | Annual fee paid to national office [announced via postgrant information from national office to epo] |
Ref country code: DE Payment date: 20220629 Year of fee payment: 20 |
|
| PGFP | Annual fee paid to national office [announced via postgrant information from national office to epo] |
Ref country code: FR Payment date: 20220709 Year of fee payment: 20 |
|
| REG | Reference to a national code |
Ref country code: DE Ref legal event code: R071 Ref document number: 60343847 Country of ref document: DE |