EP1868320B1 - Management system and method for wireless communication network and associated graphic user interface - Google Patents
Management system and method for wireless communication network and associated graphic user interface Download PDFInfo
- Publication number
- EP1868320B1 EP1868320B1 EP07252426A EP07252426A EP1868320B1 EP 1868320 B1 EP1868320 B1 EP 1868320B1 EP 07252426 A EP07252426 A EP 07252426A EP 07252426 A EP07252426 A EP 07252426A EP 1868320 B1 EP1868320 B1 EP 1868320B1
- Authority
- EP
- European Patent Office
- Prior art keywords
- forecast
- network
- value
- effect ratio
- operation index
- Prior art date
- Legal status (The legal status is an assumption and is not a legal conclusion. Google has not performed a legal analysis and makes no representation as to the accuracy of the status listed.)
- Active
Links
- 238000004891 communication Methods 0.000 title claims abstract description 41
- 238000000034 method Methods 0.000 title claims abstract description 15
- 230000000694 effects Effects 0.000 claims description 53
- 238000007726 management method Methods 0.000 claims description 21
- 238000012800 visualization Methods 0.000 abstract 1
- 101150117600 msc1 gene Proteins 0.000 description 13
- 238000010586 diagram Methods 0.000 description 4
- 101150093388 MSC3 gene Proteins 0.000 description 3
- 238000003745 diagnosis Methods 0.000 description 3
- 101150079307 BSC3 gene Proteins 0.000 description 2
- 101100078001 Saccharomyces cerevisiae (strain ATCC 204508 / S288c) MSC2 gene Proteins 0.000 description 2
- 230000003287 optical effect Effects 0.000 description 2
- 241000577979 Peromyscus spicilegus Species 0.000 description 1
- 230000004075 alteration Effects 0.000 description 1
- 230000003466 anti-cipated effect Effects 0.000 description 1
- 230000015556 catabolic process Effects 0.000 description 1
- 239000003086 colorant Substances 0.000 description 1
- 230000007423 decrease Effects 0.000 description 1
- 238000006731 degradation reaction Methods 0.000 description 1
- 230000004069 differentiation Effects 0.000 description 1
- 238000005516 engineering process Methods 0.000 description 1
- 230000007774 longterm Effects 0.000 description 1
- 230000007246 mechanism Effects 0.000 description 1
- 238000010295 mobile communication Methods 0.000 description 1
- 238000012986 modification Methods 0.000 description 1
- 230000004048 modification Effects 0.000 description 1
- 238000007619 statistical method Methods 0.000 description 1
Images


Classifications
-
- H—ELECTRICITY
- H04—ELECTRIC COMMUNICATION TECHNIQUE
- H04L—TRANSMISSION OF DIGITAL INFORMATION, e.g. TELEGRAPHIC COMMUNICATION
- H04L41/00—Arrangements for maintenance, administration or management of data switching networks, e.g. of packet switching networks
- H04L41/14—Network analysis or design
- H04L41/147—Network analysis or design for predicting network behaviour
-
- H—ELECTRICITY
- H04—ELECTRIC COMMUNICATION TECHNIQUE
- H04L—TRANSMISSION OF DIGITAL INFORMATION, e.g. TELEGRAPHIC COMMUNICATION
- H04L41/00—Arrangements for maintenance, administration or management of data switching networks, e.g. of packet switching networks
- H04L41/22—Arrangements for maintenance, administration or management of data switching networks, e.g. of packet switching networks comprising specially adapted graphical user interfaces [GUI]
-
- H—ELECTRICITY
- H04—ELECTRIC COMMUNICATION TECHNIQUE
- H04L—TRANSMISSION OF DIGITAL INFORMATION, e.g. TELEGRAPHIC COMMUNICATION
- H04L43/00—Arrangements for monitoring or testing data switching networks
-
- H—ELECTRICITY
- H04—ELECTRIC COMMUNICATION TECHNIQUE
- H04W—WIRELESS COMMUNICATION NETWORKS
- H04W24/00—Supervisory, monitoring or testing arrangements
-
- H—ELECTRICITY
- H04—ELECTRIC COMMUNICATION TECHNIQUE
- H04L—TRANSMISSION OF DIGITAL INFORMATION, e.g. TELEGRAPHIC COMMUNICATION
- H04L41/00—Arrangements for maintenance, administration or management of data switching networks, e.g. of packet switching networks
- H04L41/14—Network analysis or design
- H04L41/149—Network analysis or design for prediction of maintenance
-
- H—ELECTRICITY
- H04—ELECTRIC COMMUNICATION TECHNIQUE
- H04L—TRANSMISSION OF DIGITAL INFORMATION, e.g. TELEGRAPHIC COMMUNICATION
- H04L43/00—Arrangements for monitoring or testing data switching networks
- H04L43/08—Monitoring or testing based on specific metrics, e.g. QoS, energy consumption or environmental parameters
- H04L43/0805—Monitoring or testing based on specific metrics, e.g. QoS, energy consumption or environmental parameters by checking availability
- H04L43/0817—Monitoring or testing based on specific metrics, e.g. QoS, energy consumption or environmental parameters by checking availability by checking functioning
-
- H—ELECTRICITY
- H04—ELECTRIC COMMUNICATION TECHNIQUE
- H04L—TRANSMISSION OF DIGITAL INFORMATION, e.g. TELEGRAPHIC COMMUNICATION
- H04L43/00—Arrangements for monitoring or testing data switching networks
- H04L43/16—Threshold monitoring
-
- H—ELECTRICITY
- H04—ELECTRIC COMMUNICATION TECHNIQUE
- H04L—TRANSMISSION OF DIGITAL INFORMATION, e.g. TELEGRAPHIC COMMUNICATION
- H04L67/00—Network arrangements or protocols for supporting network services or applications
- H04L67/01—Protocols
- H04L67/04—Protocols specially adapted for terminals or networks with limited capabilities; specially adapted for terminal portability
-
- H—ELECTRICITY
- H04—ELECTRIC COMMUNICATION TECHNIQUE
- H04W—WIRELESS COMMUNICATION NETWORKS
- H04W24/00—Supervisory, monitoring or testing arrangements
- H04W24/08—Testing, supervising or monitoring using real traffic
Definitions
- the present invention relates to a wireless communications network, and more particularly, to a management system and method for the wireless communications network and an associated graphic user interface.
- a wireless communications network such as a mobile network
- the prior art does not provide an efficient and convenient tool for the telecom user to make prediction and perform network diagnosis.
- the prior art predicts the future operation status of the network component by the time series prediction technique, which often lacks accuracy since only history data of the network component itself is considered.
- WO 2006/015441 defines a method and apparatus for managing a network by comparing measured performance values with expected performance values and alerts when a degradation is detected
- US 2005/097161 defines a system and method for network planning via a time series prediction mechanism that predicts future mobility and future traffic values.
- an aim of the present invention to provide a management system and method for a wireless communications network which provides an efficient and convenient graphic user interface for displaying the future operation status of network components, thereby facilitating the telecom user to perform network diagnosis and network adjustment for remedy.
- Another aim of the present invention is to provide a management system and method for a wireless communications network which provides more accurate prediction by considering the influence from the parent, son, and neighbour components of a network component.
- the present invention provides a management system for a wireless communications network, the system comprising: a forecast module for generating a forecast value for a first operation index of at least a first network component of the wireless communications network during at least a forecast period; and a display module, connected to the forecast module, for providing a graphic user interface which comprises a forecast table to show the forecast value; wherein the forecast module determines whether to enable a warning function of the graphic user interface according to a comparison of the forecast value and a warning value; characterised in that: the forecast module generates the forecase value according to an initial prediction value and a total effect ratio, the forecast module generating the initial prediction value by a time series prediction technique, and generating the total effect ratio according to a parent effect ratio, a son effect ratio and a neighbour effect ratio; and in that the parent effect ratio is determined according to a variation of the first operation index of each parent network component of the first network component, the son effect ratio is determined according to a variation of the first operation index of each son network component of the first network component, and the
- GSM Global System for Mobile communication
- GSM Global System for Mobile communication
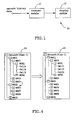
- Fig. is a block diagram of a preferred embodiment of a management system for a wireless communication network according to the present invention.
- the wireless communication network includes a plurality of network components deployed as a multi-level structure.
- a GSM network may contain, from top to bottom, a network level (the GSM network itself), a MSC (i.e. mobile switching center) level, a BSC (i.e. base station controller) level, a BTS (i.e. base transceiver station) level and a cell level.
- the management system 10 includes a forecast module 11 and a display module 12.
- the forecast module 11 According to received network history data, the forecast module 11 generates a forecast value for each available operation index of the network components of the wireless communication network during a plurality of forecast periods.
- the network history data record network traffic status or network user behavior during past periods, and are provided by various sources, such as an operation and maintenance center (OMC) or operation support system (OSS), a database, or an optical disk.
- OMC operation and maintenance center
- OSS operation support system
- the OMC usually provides real-time or short-term statistic data, while long-term statistic data are stored in the database and the optical disk.
- an operation index of a network component reflects a specific network traffic status or network user behavior involving the network component, and history values of the operation index can be retrieved or derived from the network history data.
- the types of the operation index are various, for example, the operation index of a MSC includes Erlang, port, BHCA (i.e. busy hour call attempt), CPU loading, etc. These examples of the operation index are well known to people skilled in the art and will not be described in detail here. Besides, the operation index may be directly used as a network performance index, such as a key performance index (KPI).
- KPI key performance index
- the display module 12 is connected to the forecast module 11, and provides a graphic user interface 20 for a telecom user or network administrator to manage the wireless communication network.
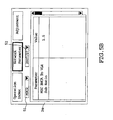
- Fig.2 is a diagram showing an embodiment of the graphic user interface 20, where the graphic user interface 20 includes a forecast table 21, a network tree graph 22, a map 23, and a function window 24.
- the forecast table 21 shows a forecast value for a certain operation index (selected by an index-selecting field 211) of each network component of a certain level (selected by a level-selecting field 212) of the wireless communication network during a plurality of forecast periods.
- the graphic user interface 20 in Fig.2 takes a GSM network as example, and the forecast table 21 shows the forecast values for the operation index "Erlang" of the network components (i.e. MSC1 ⁇ MSC3) of the MSC level during June of 2007 to October of 2007. It is notable that the forecast table 21 can also show the forecast values for more forecast periods and the history values for past periods, thereby facilitating the telecom user to observe the
- the forecast module 11 determines whether to enable a warning function of the graphic user interface 20 according to a comparison of the forecast value and a warning value for the operation index of the network component. If the forecast value exceeds the warning value, it means the network component is under an overloaded state and needs an adjustment for remedy. It is notable that the warning value for the same operation index of different network components can be different.
- the warning function warns the telecom user by using a distinct color (e.g. red) to show the forecast value that exceeds the warning value.
- Fig.2 the forecast values for Erlang of MSC2 during August to October of 2007 exceed the warning value, and are shown in the distinct color (represented by oblique lines in Fig.2 ). It is notable that more than one warning value can be used to indicate various warning degrees, and the warning function can use different colors to show the forecast values for differentiation.
- the graphic user interface 20 further includes a plan-selecting field 25 for selecting an original or adjusted network plan of the wireless communication network to show the forecast value of the operation index thereunder.
- a network plan means how the components of a network are organized or connected.
- various types of adjustments (will be further described below) can be made on the original network plan to generate an adjusted network plan.
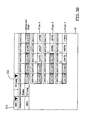
- the forecast table 21 can then show the forecast values of the operation index under different network plans for comparison. For example, the telecom user can take June to October of 2007 as a planning period to generate three different adjusted plans by performing different (or different sets of) adjustments during different forecast periods, as shown in Fig.3A .
- Fig.3A Plan-1 is generated by making Adjustment A in 2007/06 and Adjustment B in 2007/08
- Plan-2 is generated by making Adjustment A in 2007/06 and Adjustment C in 2007/09
- Plan-3 is generated by making Adjustment A in 2007/06, Adjustment B in 2007/08 and Adjustment D in 2007/09.
- Fig.3B the time series of the forecast values of the operation index (Erlang as shown) under the original and adjusted plans during 2007/06-2007/10 are shown in the forecast table 21 for convenient comparison.
- a" 0 "symbol (other identifiable symbol can also be used) in front of a forecast period means that there is an adjustment made during this period.
- the network tree graph 22 displays a tree structure of the network components of the wireless communication network.
- the tree structure is inherent in the multi-level structure of the network, and an upper-level (or parent) component manages at least one lower-level (or son) component.
- the network tree graph 22 shows a five-level (i.e. network level, MSC level, BSC level, BTS level and cell level) tree structure of Plan-1 of the GSM network.
- the "+" symbol in front of a network component means there are hidden lower-level components under it, and the "-" symbol means the hidden lower-level components are explicitly shown.
- the tree structure can be easily adjusted. For example, by using a pointing device (e.g. mouse), BSC3 can be easily moved (rehomed) from MSC 1 to MSC2, as shown by Fig.4 .
- a pointing device e.g. mouse
- the map 23 shows where the network components of the wireless communication network are located.
- the network components can be shown in a visualized manner for convenient observation.
- the components of different levels can be shown in different shapes, such as circles (i.e. BTS in Fig.2 ), triangles (i.e. BSC in Fig.2 ), rectangles (i.e. MSC in Fig.2 ), etc.
- the son components belonging to the same parent component can be shown in the same color.
- the content of the forecast table 21, the network tree graph 22, and the map 23 can be updated and shown synchronously. That is, if a forecast period in the forecast table 21 is selected (e.g. by using a point device to click any of the columns 2007/06-2007/10 in Fig.2 ), the network tree graph 22 will show the corresponding tree structure during the selected forecast period, and the map 23 will show where the network components are located during the selected forecast period.
- the telecom user can easily perform a network diagnosis by observing the status of parent and son components and neighboring components of some problematic component.
- the telecom user can observe whether the specific MSC contains too many BSCs through the network tree graph 22 or observe the distribution of the BSCs of the specific MSC through the map 23 to find out the problem cause.
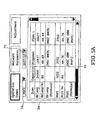
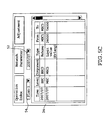
- the function window 24 provides several functions to facilitate the telecom user to manage the wireless communication network. As shown in Fig.2 , the function window 24 includes three function tabs: Operation Index, Network Parameter and Adjustment, and the content of these tabs are shown in Fig.5A-5C .
- Fig.5A shows the content of the Operation Index tab, which includes a component-selecting field 51 for selecting a network component and a period-selecting field 52 for selecting a forecast period.
- the other content of the Operation Index tab are arranged into a plurality of columns for showing related information for each available operation index of the selected component during the selected forecast period.
- the column "Item" includes the name, percentage and formula for each available operation index.
- the limit value of Erlang of MSC 1 is 24000 and the warning percentage of Erlang of MSC 1 is 80 during 2007/07.
- the fields corresponding to the items of name, percentage and formula are respectively the forecast value, the percentage of the forecast value to the limit value and the formula used for calculating the forecast value under the respective plan.
- the formula is determined according to at least an operation index and at least a network parameter, such as mathematical operations on the operation index and network parameter.
- the forecast value of Erlang of MSC1 is 16437 and the percentage of the forecast value to the limit value under the original plan is 68.49 during 2007/07;
- the formula for calculating the forecast value of Erlang of MSC1 is "[MSC BHCA] * [MSC BHCA To VLR Sub Ratio]" (the full expression of the formula can be shown by using a pointing device to click the corresponding field), where "MSC BHCA” is another operation index and MSC BHCA To VLR Sub Ratio is a network parameter.
- the warning value for an operation index can be adjusted by directly changing the field of the "Capacity” column for recording the limit value or the warning percentage of the operation index.
- the formula for calculating the forecast value of an operation index can also be adjusted by directly changing the fields of the Original, Plan-1, Plan-2 or Plan-3 column for recording the formula.
- Fig.5B shows the content of the Network Parameter tab, which also includes the component-selecting field 51 and the period-selecting field 52.
- the other content of the Network Parameter tab are arranged into "Parameter” and "Value" columns for recording the setting value for each network parameter included in the formulas for calculating the forecast values for the operation indexes of the selected component during the selected forecast period.
- the setting value of MSC BHCA To VLR Sub Ratio which is included in the formula for calculating the forecast value of Erlang of MSC 1 during 2007/07, is 1.5.
- the setting value of a network parameter can be adjusted by directly changing the field of the "Value" column for recording the setting value of the network parameter.
- Fig.5C shows the content of the Adjustment tab, which includes the period-selecting field 52 and a plan-selecting field 54 for selecting the original plan or an adjusted plan.
- the other content of the Adjustment tab are arranged into the columns of "Time”, “Level”, “Component”, “Type”, “From (former state)” and “To (target state)” for recording related information of each adjustment performed not later than the selected forecast period under the selected plan.
- the types of the adjustment include:
- the prediction module After an adjustment is performed, its related information will be recorded in the Adjustment tab of the function window 24. If the performed adjustment influences a forecast value or the warning state of a forecast value thereafter, the prediction module will update the influenced forecast value or warning state according to the performed adjustment and show the updated result in the graphic user interface 20.
- the forecast module 11 is a computer running a forecast software
- the display module 12 is a CRT or LDC monitor.
- the graphic user interface 20 is a window interface of an operating system.
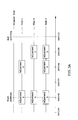
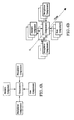
- the forecast module 11 When generating a forecast value for an operation index of a certain network component, the forecast module 11 not only uses the time series of history values, but also considers the influence from the parent, son, and neighbor components of the certain component, as shown in Fig.6A . Further, the generated forecast values can be used as part of the time series data to generate the next forecast value, as shown in Fig.6B , such that the forecast values with more accuracy can be generated.
- the influence from the parent, son and neighbor components can be respectively modeled as a parent effect ratio, a son effect ratio and a neighbor effect ratio.
- the parent effect ratio can be determined according to the variation of the operation index of the parent component.
- the variation of the operation index of its parent component i.e. the whole network
- the estimated growth rate can be generated according to marketing effect, the growth/decline of new/old technology (e.g. 3G/2G network), etc.
- the variation of the operation index of the whole network e.g. 10%
- a distribution percentage which can be determined according to, for example, the average ratio of the operation index of MSC1 to that of the whole network during past periods.
- the parent effect ratio of MSC1 can be determined from the variation of the operation index of the whole network and the distribution percentage.
- the parent effect ratio of a BSC or a BTS can also be determined in the manner similar to above.
- the neighbor effect ratio can be determined according to the variation of the operation index of the neighbor component. For instance, if some neighbor MSC of MSC is over-loaded, then a portion of traffic of the neighbor MSC will be re-assigned to MSC 1 (reflected in the variation of the operation index of the neighbor MSC); a newly added neighbor MSC will share some loading of MSC1 (reflected in the variation of the operation index of the new MSC). Then, the neighbor effect ratio of MSC1 can be determined from the factors as described above. The neighbor effect ratio of a BSC or a BTS can also be determined in the similar manner.
- Fig.7 is a flow chart of a preferred embodiment of the management method for a wireless communication network according to the present invention.
- the flow in Fig.7 comprises steps of:
Abstract
Description
- The present invention relates to a wireless communications network, and more particularly, to a management system and method for the wireless communications network and an associated graphic user interface.
- In a wireless communications network such as a mobile network, it is useful for a telecom user or network administrator to know in advance the future operation status of a network component. If a problem such as the overloading of the network component is anticipated, then the telecom user can have enough time to prepare a solution for the problem. However, the prior art does not provide an efficient and convenient tool for the telecom user to make prediction and perform network diagnosis.
- Besides, the prior art predicts the future operation status of the network component by the time series prediction technique, which often lacks accuracy since only history data of the network component itself is considered.
- Known wireless communications networks are described in
WO 2006/015441 , which defines a method and apparatus for managing a network by comparing measured performance values with expected performance values and alerts when a degradation is detected, andUS 2005/097161 , which defines a system and method for network planning via a time series prediction mechanism that predicts future mobility and future traffic values. - It is, therefore, an aim of the present invention to provide a management system and method for a wireless communications network which provides an efficient and convenient graphic user interface for displaying the future operation status of network components, thereby facilitating the telecom user to perform network diagnosis and network adjustment for remedy.
- Another aim of the present invention is to provide a management system and method for a wireless communications network which provides more accurate prediction by considering the influence from the parent, son, and neighbour components of a network component.
- The present invention provides a management system for a wireless communications network, the system comprising: a forecast module for generating a forecast value for a first operation index of at least a first network component of the wireless communications network during at least a forecast period; and a display module, connected to the forecast module, for providing a graphic user interface which comprises a forecast table to show the forecast value; wherein the forecast module determines whether to enable a warning function of the graphic user interface according to a comparison of the forecast value and a warning value; characterised in that: the forecast module generates the forecase value according to an initial prediction value and a total effect ratio, the forecast module generating the initial prediction value by a time series prediction technique, and generating the total effect ratio according to a parent effect ratio, a son effect ratio and a neighbour effect ratio; and in that the parent effect ratio is determined according to a variation of the first operation index of each parent network component of the first network component, the son effect ratio is determined according to a variation of the first operation index of each son network component of the first network component, and the neighbour effect ratio is determined according to a variation of the first operation index of each neighbour network component of the first network component.
- 1. The invention also provides a management method for a wireless communications network, the method comprising: generating a forecast value for an operation index of at least a network component of the wireless communications network during at least a forecast period; providing a graphic user interface which comprises a forecast table to show the forecast value; displaying a tree structure of a plurality of network components of the wireless communications network by a network tree graph of the graphic user interface; showing where the network components are located by a map of the graphic user interface; and determining whether to enable a warning function of the graphic user interface according to a comparison of the forecast value and a warning value; characterised in that: the forecast value is generated according to an initial prediction value and a total effect ratio, the initial prediction value being generated by a time series prodiction technique, and the total effect ratio being generated according to a parent effect ratio, a son effect ratio and a neighbour effect ratio; and in that the parent effect ratio is determined according to a variation of the operation index of each parent network component of the at least a network component, the son effect ratio is determined according to a variation of the operation index of each son network component of the at least network component, and the neighbour effect ratio is determined according to a variation of the operation index of each neighbour network component of the at least a network component.
-
-
Fig.1 is a block diagram of a preferred embodiment of a management system for a wireless communication network according to the present invention. -
Fig.2 is a diagram showing an embodiment of a graphic user interface provided by the display module inFig.1 . -
Fig.3A shows an example of generating adjusted plans of the wireless communication network. -
Fig.3B shows an example of the time series of forecast values of an operation index under the original and adjusted plans. -
Fig.4 shows an adjustment of the tree structure of the wireless communication network by means of the network tree graph inFig.2 . -
Fig.5A to 5C respectively show the content of each function tab of the function window inFig.2 . -
Fig.6A and 6B shows how the forecast module inFig.1 considers the influence from the parent, son, and neighbor components of a certain component. -
Fig.7 is a flow chart of a preferred embodiment of the management method for a wireless communication network according to the present invention. - Though the embodiments described below may take a GSM (i.e. Global System for Mobile communication) network for example, people skilled in the art can easily apply technological features of the present invention to other wireless communication networks. Thus, the scope of the present invention is not limited to the GSM network.
- Fig. is a block diagram of a preferred embodiment of a management system for a wireless communication network according to the present invention. The wireless communication network includes a plurality of network components deployed as a multi-level structure. For example, a GSM network may contain, from top to bottom, a network level (the GSM network itself), a MSC (i.e. mobile switching center) level, a BSC (i.e. base station controller) level, a BTS (i.e. base transceiver station) level and a cell level. As shown in
Fig. 1 , themanagement system 10 includes aforecast module 11 and adisplay module 12. According to received network history data, theforecast module 11 generates a forecast value for each available operation index of the network components of the wireless communication network during a plurality of forecast periods. The network history data record network traffic status or network user behavior during past periods, and are provided by various sources, such as an operation and maintenance center (OMC) or operation support system (OSS), a database, or an optical disk. The OMC usually provides real-time or short-term statistic data, while long-term statistic data are stored in the database and the optical disk. In general, an operation index of a network component reflects a specific network traffic status or network user behavior involving the network component, and history values of the operation index can be retrieved or derived from the network history data. The types of the operation index are various, for example, the operation index of a MSC includes Erlang, port, BHCA (i.e. busy hour call attempt), CPU loading, etc. These examples of the operation index are well known to people skilled in the art and will not be described in detail here. Besides, the operation index may be directly used as a network performance index, such as a key performance index (KPI). - The
display module 12 is connected to theforecast module 11, and provides agraphic user interface 20 for a telecom user or network administrator to manage the wireless communication network.Fig.2 is a diagram showing an embodiment of thegraphic user interface 20, where thegraphic user interface 20 includes a forecast table 21, anetwork tree graph 22, amap 23, and afunction window 24. The forecast table 21 shows a forecast value for a certain operation index (selected by an index-selecting field 211) of each network component of a certain level (selected by a level-selecting field 212) of the wireless communication network during a plurality of forecast periods. Thegraphic user interface 20 inFig.2 takes a GSM network as example, and the forecast table 21 shows the forecast values for the operation index "Erlang" of the network components (i.e. MSC1~MSC3) of the MSC level during June of 2007 to October of 2007. It is notable that the forecast table 21 can also show the forecast values for more forecast periods and the history values for past periods, thereby facilitating the telecom user to observe the variation trend of the operation index. - Moreover, for each network component shown in the forecast table 21, the
forecast module 11 determines whether to enable a warning function of thegraphic user interface 20 according to a comparison of the forecast value and a warning value for the operation index of the network component. If the forecast value exceeds the warning value, it means the network component is under an overloaded state and needs an adjustment for remedy. It is notable that the warning value for the same operation index of different network components can be different. The warning function warns the telecom user by using a distinct color (e.g. red) to show the forecast value that exceeds the warning value. InFig.2 , the forecast values for Erlang of MSC2 during August to October of 2007 exceed the warning value, and are shown in the distinct color (represented by oblique lines inFig.2 ). It is notable that more than one warning value can be used to indicate various warning degrees, and the warning function can use different colors to show the forecast values for differentiation. - The
graphic user interface 20 further includes a plan-selectingfield 25 for selecting an original or adjusted network plan of the wireless communication network to show the forecast value of the operation index thereunder. A network plan means how the components of a network are organized or connected. Through thegraphic user interface 20, various types of adjustments (will be further described below) can be made on the original network plan to generate an adjusted network plan. The forecast table 21 can then show the forecast values of the operation index under different network plans for comparison. For example, the telecom user can take June to October of 2007 as a planning period to generate three different adjusted plans by performing different (or different sets of) adjustments during different forecast periods, as shown inFig.3A . InFig.3A , Plan-1 is generated by making Adjustment A in 2007/06 and Adjustment B in 2007/08, Plan-2 is generated by making Adjustment A in 2007/06 and Adjustment C in 2007/09, and Plan-3 is generated by making Adjustment A in 2007/06, Adjustment B in 2007/08 and Adjustment D in 2007/09. Then, inFig.3B , the time series of the forecast values of the operation index (Erlang as shown) under the original and adjusted plans during 2007/06-2007/10 are shown in the forecast table 21 for convenient comparison. It is notable that infig.3B , a" 0 "symbol (other identifiable symbol can also be used) in front of a forecast period means that there is an adjustment made during this period. - The
network tree graph 22 displays a tree structure of the network components of the wireless communication network. The tree structure is inherent in the multi-level structure of the network, and an upper-level (or parent) component manages at least one lower-level (or son) component. InFig.2 , thenetwork tree graph 22 shows a five-level (i.e. network level, MSC level, BSC level, BTS level and cell level) tree structure of Plan-1 of the GSM network. The "+" symbol in front of a network component means there are hidden lower-level components under it, and the "-" symbol means the hidden lower-level components are explicitly shown. By means of thenetwork tree graph 22, the tree structure can be easily adjusted. For example, by using a pointing device (e.g. mouse), BSC3 can be easily moved (rehomed) fromMSC 1 to MSC2, as shown byFig.4 . - The
map 23 shows where the network components of the wireless communication network are located. The network components can be shown in a visualized manner for convenient observation. For example, the components of different levels can be shown in different shapes, such as circles (i.e. BTS inFig.2 ), triangles (i.e. BSC inFig.2 ), rectangles (i.e. MSC inFig.2 ), etc. Also, the son components belonging to the same parent component can be shown in the same color. - The content of the forecast table 21, the
network tree graph 22, and themap 23 can be updated and shown synchronously. That is, if a forecast period in the forecast table 21 is selected (e.g. by using a point device to click any of the columns 2007/06-2007/10 inFig.2 ), thenetwork tree graph 22 will show the corresponding tree structure during the selected forecast period, and themap 23 will show where the network components are located during the selected forecast period. By combining the forecast table 21, thenetwork tree graph 22, and themap 23, the telecom user can easily perform a network diagnosis by observing the status of parent and son components and neighboring components of some problematic component. For instance, if the forecast table 21 indicates that the forecast value for a specific operation index of a specific MSC exceeds the warning value, then the telecom user can observe whether the specific MSC contains too many BSCs through thenetwork tree graph 22 or observe the distribution of the BSCs of the specific MSC through themap 23 to find out the problem cause. - The
function window 24 provides several functions to facilitate the telecom user to manage the wireless communication network. As shown inFig.2 , thefunction window 24 includes three function tabs: Operation Index, Network Parameter and Adjustment, and the content of these tabs are shown inFig.5A-5C .Fig.5A shows the content of the Operation Index tab, which includes a component-selectingfield 51 for selecting a network component and a period-selectingfield 52 for selecting a forecast period. The other content of the Operation Index tab are arranged into a plurality of columns for showing related information for each available operation index of the selected component during the selected forecast period. The column "Item" includes the name, percentage and formula for each available operation index. In the column "Capacity", the fields corresponding to the items of name and percentage are respectively a limit value of the operation index and the warning percentage of the limit value, i.e. warning value = limit value * warning percentage%. For example, inFig.5A , the limit value of Erlang ofMSC 1 is 24000 and the warning percentage of Erlang ofMSC 1 is 80 during 2007/07. - In the "Original" (i.e. original plan) and "Plan-1" columns (Plan-2 and Plan-3 columns can be shown by scrolling a scrolling bar 53), the fields corresponding to the items of name, percentage and formula are respectively the forecast value, the percentage of the forecast value to the limit value and the formula used for calculating the forecast value under the respective plan. The formula is determined according to at least an operation index and at least a network parameter, such as mathematical operations on the operation index and network parameter. For example, in
Fig.5A , the forecast value of Erlang of MSC1 is 16437 and the percentage of the forecast value to the limit value under the original plan is 68.49 during 2007/07; the formula for calculating the forecast value of Erlang of MSC1 is "[MSC BHCA] * [MSC BHCA To VLR Sub Ratio]" (the full expression of the formula can be shown by using a pointing device to click the corresponding field), where "MSC BHCA" is another operation index and MSC BHCA To VLR Sub Ratio is a network parameter. - Moreover, the warning value for an operation index can be adjusted by directly changing the field of the "Capacity" column for recording the limit value or the warning percentage of the operation index. The formula for calculating the forecast value of an operation index can also be adjusted by directly changing the fields of the Original, Plan-1, Plan-2 or Plan-3 column for recording the formula.
-
Fig.5B shows the content of the Network Parameter tab, which also includes the component-selectingfield 51 and the period-selectingfield 52. The other content of the Network Parameter tab are arranged into "Parameter" and "Value" columns for recording the setting value for each network parameter included in the formulas for calculating the forecast values for the operation indexes of the selected component during the selected forecast period. For example, inFig.5B , the setting value of MSC BHCA To VLR Sub Ratio, which is included in the formula for calculating the forecast value of Erlang ofMSC 1 during 2007/07, is 1.5. There may be other network parameters and are not shown inFig.5B for simplicity. The setting value of a network parameter can be adjusted by directly changing the field of the "Value" column for recording the setting value of the network parameter. -
Fig.5C shows the content of the Adjustment tab, which includes the period-selectingfield 52 and a plan-selectingfield 54 for selecting the original plan or an adjusted plan. The other content of the Adjustment tab are arranged into the columns of "Time", "Level", "Component", "Type", "From (former state)" and "To (target state)" for recording related information of each adjustment performed not later than the selected forecast period under the selected plan. The types of the adjustment include: - (1) Rehome adjustment: this means moving a son component from its former parent component to a new parent component. The rehome adjustment can be achieved by means of the
network tree graph 22, as described above. For example, inFig.5C , a rehome adjustment is performed during 2007/07 at BSC level under Plan-1, where BSC3 is moved fromMSC 1 to MSC3. - (2) Warning value adjustment: this can be achieved by changing the limit value or the warning percentage of an operation index via the Operation Index tab of the
function window 24, as described above. For example, inFig.5C , a warning value adjustment is performed during 2007/07 at MSC level under Plan-1, where the limit value of Erlang of MSC3 is changed from 24000 to 54000. - (3) Formula adjustment: this can be achieved by directly changing the field in the Operation Index tab of the
function window 24 for recording a formula, as described above. - (4) Parameter adjustment: this can be achieved by directly changing the field in the Network Parameter tab of the
function window 24 for recording the setting value of a network parameter, as described above. - After an adjustment is performed, its related information will be recorded in the Adjustment tab of the
function window 24. If the performed adjustment influences a forecast value or the warning state of a forecast value thereafter, the prediction module will update the influenced forecast value or warning state according to the performed adjustment and show the updated result in thegraphic user interface 20. - In one embodiment, the
forecast module 11 is a computer running a forecast software, and thedisplay module 12 is a CRT or LDC monitor. In another embodiment, thegraphic user interface 20 is a window interface of an operating system. - When generating a forecast value for an operation index of a certain network component, the
forecast module 11 not only uses the time series of history values, but also considers the influence from the parent, son, and neighbor components of the certain component, as shown inFig.6A . Further, the generated forecast values can be used as part of the time series data to generate the next forecast value, as shown inFig.6B , such that the forecast values with more accuracy can be generated. - The influence from the parent, son and neighbor components can be respectively modeled as a parent effect ratio, a son effect ratio and a neighbor effect ratio. A total effect ratio can be generated according to these three effect ratios, e.g. total effect ratio = parent effect ratio + son effect ratio + neighbor effect ratio. Therefore, when generating a forecast value, the
forecast module 11 first generates an initial prediction value by the time series prediction technique (which is well known to people skilled in the art and will not be elaborated here), and then multiplies the initial prediction value with the total effect ratio to generate the forecast value. That is, the total effect ratio is used to correct the value generated by the time series prediction, thereby providing the forecast value with more accuracy. - The parent effect ratio can be determined according to the variation of the operation index of the parent component. For instance, for a certain MSC (e.g. MSC1), the variation of the operation index of its parent component (i.e. the whole network) can be derived from an estimated growth rate of subscribers (or traffic) of the whole network. The estimated growth rate can be generated according to marketing effect, the growth/decline of new/old technology (e.g. 3G/2G network), etc. Next, the variation of the operation index of the whole network (e.g. 10%) can be distributed to MSC1 according to a distribution percentage, which can be determined according to, for example, the average ratio of the operation index of MSC1 to that of the whole network during past periods. Then, the parent effect ratio of MSC1 can be determined from the variation of the operation index of the whole network and the distribution percentage. The parent effect ratio of a BSC or a BTS can also be determined in the manner similar to above.
- The son effect ratio can be determined according to the variation of the operation index of the son component. For instance, if MSC1 includes n BSCs (i.e.
BSC 1~BSC n), then the variation of the operation index of MSC1 = the sum of [(the variation of the operation index of BSC k)*ak], where k=1~n and ak is the weight coefficient determined by statistical methods. Then, the son effect ratio of MSC1 can be determined from the variation of the operation index of MSC1, which results from the variation of the operation index of itsson components BSC 1~BSC n. It is notable that a newly added or rehomed BSC may be included inBSC 1~BSC n. The son effect ratio of a BSC or a BTS can also be determined in the manner similar to above. - The neighbor effect ratio can be determined according to the variation of the operation index of the neighbor component. For instance, if some neighbor MSC of MSC is over-loaded, then a portion of traffic of the neighbor MSC will be re-assigned to MSC 1 (reflected in the variation of the operation index of the neighbor MSC); a newly added neighbor MSC will share some loading of MSC1 (reflected in the variation of the operation index of the new MSC). Then, the neighbor effect ratio of MSC1 can be determined from the factors as described above. The neighbor effect ratio of a BSC or a BTS can also be determined in the similar manner.
-
Fig.7 is a flow chart of a preferred embodiment of the management method for a wireless communication network according to the present invention. The flow inFig.7 comprises steps of: - 71 generating a forecast value for an operation index of at least a network component of the wireless communication network during at least a forecast period;
- 72 providing a graphic user interface which comprises a forecast table to show the forecast value;
- 73 displaying a tree structure of a plurality of network components of the wireless communications network by a network tree graph of the graphic user interface;
- 74 showing where the network components are located by a map of the graphic user interface; and
- 75 determining whether to enable a warning function of the graphic user interface according to a comparison of the forecast value and a warning value.
- While the present invention has been shown and described with reference to the preferred embodiments thereof, and in terms of the illustrative drawings, it should not be considered as limited thereby. Various possible modifications and alterations could be conceived of by one skilled in the art to the form and the content of any particular embodiment, without departing from the scope of the present invention as defined by the wording of the claims.
Claims (11)
- A management system for a wireless communications network, the system comprising:a forecast module (11) for generating a forecast value for a first operation index of at least a first network component of the wireless communications network during at least one forecast period; anda display module (12), connected to the forecast module, for providing a graphic user interface (20) which comprises a forecast table (21) to show the forecast value;wherein the forecast module determines whether to enable a warning function of the graphic user interface according to a comparison of the forecast value and a warning value; characterised in that:the forecast module generates the forecast value according to
an initial prediction value and a total effect ratio, the forecast module generating the initial prediction value by a time series prediction technique, and generating the total effect ratio according to a parent effect ratio, a son effect ratio and a neighbour effect ratio; and in that
the parent effect ratio is determined according to a variation of a first operation index of each parent network component of the first network component, the son effect ratio is determined according to a variation of a first operation index of each son network component of the first network component, and the neighbour effect ratio is determined according to a variation of a first operation index of each neighbour network component of the first network component. - A management system as claimed in claim 1, wherein the forecast table (21) comprises a level-selecting field (212) for selecting one of a plurality of levels of the wireless communications network, wherein the forecast table shows forecast values for the first operation index of a plurality of network components of the selected level during at least the one forecast period.
- A management system as claimed in claim 2, wherein the graphic user interface (20) further comprises a network tree graph (22) for displaying a tree structure of the network components of the levels, and an adjustment of the tree structure is performed by means of the network tree graph.
- A management system as claimed in any one of claims 1 to 3, wherein the graphic user interface (20) further comprises a map (23) for showing where a plurality of network components of the wireless communications network are located.
- A management system as claimed in any one of claims 1 to 4, wherein the graphic user interface (20) further comprises a function window (24) for showing the warning value, and the warning value is adjusted by means of the function window.
- A management system as claimed in claim 5, wherein the function window (24) further shows a formula for calculating the warning value, and the formula is adjusted by means of the function window.
- A management system as claimed in claim 5 or claim 6, wherein an adjustment for the wireless communications system is performed by means of the graphic user interface (20), wherein the adjustment is one of the following types: rehome adjustment, warning value adjustment, formula adjustment, and parameter adjustment.
- A management system as claimed in claim 7, wherein the forecast value and the warning value are selectively updated according to the adjustment.
- A management system as claimed in claim 7 or claim 8, wherein the function window (24) records a related information of the adjustment, wherein the related information comprises at least one of the following: performing time, performing level, performed network component, adjustment type, former state and target state.
- A management system as claimed in any one of claims 7 to 9, wherein the forecast table (21) shows a first forecast value and a second forecast value for the first operation index of the first network component during the forecast period, wherein the first forecast value and the second forecast value respectively correspond to a first set of adjustments and a second set of adjustments, both of which are performed not later than the forecast period.
- A management method for a wireless communications network, the method comprising:generating a forecast value for an operation index of at least a first network component of the wireless communications network during at least one forecast period;providing a graphic user interface (20) which comprises a forecast table (21) to show the forecast value;displaying a tree structure of a plurality of network components of the wireless communications network by a network tree graph (22) of the graphic user interface;showing where the network components are located by a map (23) of the graphic user interface; anddetermining whether to enable a warning function of the graphic user interface according to a comparison of the forecast value and a warning value; characterised in that:the forecast value is generated according to an initial prediction value and a total effect ratio, the initial prediction value being generated by a time series prodiction technique, and the total effect ratio being generated according to a parent effect ratio, a son effect ratio and a neighbour effect ratio; and in thatthe parent effect ratio is determined according to a variation of an operation index of each parent network component of the at least first network component, the son effect ratio is determined according to a variation of an operation index of each son network component of the at least first network component, and the neighbour effect ratio is determined according to a variation of an operation index of each neighbour network component of the at least first network component.
Applications Claiming Priority (1)
| Application Number | Priority Date | Filing Date | Title |
|---|---|---|---|
| US81393206P | 2006-06-16 | 2006-06-16 |
Publications (3)
| Publication Number | Publication Date |
|---|---|
| EP1868320A2 EP1868320A2 (en) | 2007-12-19 |
| EP1868320A3 EP1868320A3 (en) | 2008-08-27 |
| EP1868320B1 true EP1868320B1 (en) | 2010-08-11 |
Family
ID=38531734
Family Applications (1)
| Application Number | Title | Priority Date | Filing Date |
|---|---|---|---|
| EP07252426A Active EP1868320B1 (en) | 2006-06-16 | 2007-06-14 | Management system and method for wireless communication network and associated graphic user interface |
Country Status (4)
| Country | Link |
|---|---|
| US (1) | US8549406B2 (en) |
| EP (1) | EP1868320B1 (en) |
| AT (1) | ATE477642T1 (en) |
| DE (1) | DE602007008322D1 (en) |
Families Citing this family (16)
| Publication number | Priority date | Publication date | Assignee | Title |
|---|---|---|---|---|
| US7561876B2 (en) * | 2003-02-21 | 2009-07-14 | Groundhog Technologies Inc. | System with user interface for network planning and mobility management optimization in a mobile communication network and method thereof |
| EP1702301A4 (en) | 2004-01-06 | 2014-01-01 | Cerion Optimization Services Inc | System and method for analyzing strategic network investments in wireless networks |
| US7929459B2 (en) * | 2004-10-19 | 2011-04-19 | At&T Mobility Ii Llc | Method and apparatus for automatically determining the manner in which to allocate available capital to achieve a desired level of network quality performance |
| EP2008479A4 (en) * | 2006-04-18 | 2013-07-10 | Cerion Optimization Services Inc | System and method for reduction of cost of ownership for wireless communication networks |
| DE602007008322D1 (en) | 2006-06-16 | 2010-09-23 | Groundhog Technologies Inc | A management system and method for a wireless communication network and associated graphical user interface |
| ES2447468T3 (en) * | 2006-10-02 | 2014-03-12 | Cerion Optimization Services, Inc. | System and method for optimization of relocation sequencing |
| US9659063B2 (en) * | 2010-12-17 | 2017-05-23 | Software Ag | Systems and/or methods for event stream deviation detection |
| WO2013058764A1 (en) * | 2011-10-21 | 2013-04-25 | Iomnis Surveillance Solution | Network design system |
| US8886576B1 (en) | 2012-06-22 | 2014-11-11 | Google Inc. | Automatic label suggestions for albums based on machine learning |
| EP2750432A1 (en) * | 2012-12-28 | 2014-07-02 | Telefónica, S.A. | Method and system for predicting the channel usage |
| US9439081B1 (en) * | 2013-02-04 | 2016-09-06 | Further LLC | Systems and methods for network performance forecasting |
| EP2934037B1 (en) * | 2014-04-15 | 2016-04-13 | Telefonaktiebolaget LM Ericsson (publ) | Technique for Evaluation of a Parameter Adjustment in a Mobile Communications Network |
| US10200877B1 (en) * | 2015-05-14 | 2019-02-05 | Roger Ray Skidmore | Systems and methods for telecommunications network design, improvement, expansion, and deployment |
| US9792259B2 (en) | 2015-12-17 | 2017-10-17 | Software Ag | Systems and/or methods for interactive exploration of dependencies in streaming data |
| US10367697B2 (en) * | 2017-04-28 | 2019-07-30 | Cisco Technology, Inc. | Graphical timeline display of network client connections with wireless endpoints |
| TWI776287B (en) * | 2020-11-24 | 2022-09-01 | 威聯通科技股份有限公司 | Cloud file accessing apparatus and method |
Family Cites Families (12)
| Publication number | Priority date | Publication date | Assignee | Title |
|---|---|---|---|---|
| JP3159979B2 (en) * | 1990-05-01 | 2001-04-23 | 株式会社日立製作所 | Network management display processing system and method |
| ATE191112T1 (en) * | 1995-02-02 | 2000-04-15 | Cabletron Systems Inc | METHOD AND ARRANGEMENT FOR LEARNING BEHAVIOR TRENDS OF NETWORKS AND PREDICTING THE FUTURE BEHAVIOR OF DATA TRANSMISSION NETWORKS |
| US6456306B1 (en) * | 1995-06-08 | 2002-09-24 | Nortel Networks Limited | Method and apparatus for displaying health status of network devices |
| DE19746904B4 (en) * | 1997-10-23 | 2004-09-30 | Telefonaktiebolaget L M Ericsson (Publ) | Traffic data evaluation device and associated method for a network with dynamic switching |
| US6590587B1 (en) * | 1999-11-30 | 2003-07-08 | Agilent Technologies, Inc. | Monitoring system and method implementing navigation interface logic |
| US20040136379A1 (en) * | 2001-03-13 | 2004-07-15 | Liao Raymond R | Method and apparatus for allocation of resources |
| US7093010B2 (en) * | 2002-05-20 | 2006-08-15 | Telefonaktiebolaget Lm Ericsson (Publ) | Operator-defined consistency checking in a network management system |
| US7561876B2 (en) | 2003-02-21 | 2009-07-14 | Groundhog Technologies Inc. | System with user interface for network planning and mobility management optimization in a mobile communication network and method thereof |
| WO2006015441A1 (en) | 2004-08-13 | 2006-02-16 | Remasys Pty Ltd | Monitoring and management of distributed information systems |
| JP4673727B2 (en) * | 2005-11-21 | 2011-04-20 | 株式会社リコー | Demand forecasting method and demand forecasting program |
| US20070192065A1 (en) * | 2006-02-14 | 2007-08-16 | Sun Microsystems, Inc. | Embedded performance forecasting of network devices |
| DE602007008322D1 (en) | 2006-06-16 | 2010-09-23 | Groundhog Technologies Inc | A management system and method for a wireless communication network and associated graphical user interface |
-
2007
- 2007-06-14 DE DE602007008322T patent/DE602007008322D1/en active Active
- 2007-06-14 EP EP07252426A patent/EP1868320B1/en active Active
- 2007-06-14 AT AT07252426T patent/ATE477642T1/en not_active IP Right Cessation
- 2007-06-15 US US11/812,248 patent/US8549406B2/en active Active
Also Published As
| Publication number | Publication date |
|---|---|
| EP1868320A3 (en) | 2008-08-27 |
| EP1868320A2 (en) | 2007-12-19 |
| DE602007008322D1 (en) | 2010-09-23 |
| US8549406B2 (en) | 2013-10-01 |
| ATE477642T1 (en) | 2010-08-15 |
| US20080109731A1 (en) | 2008-05-08 |
Similar Documents
| Publication | Publication Date | Title |
|---|---|---|
| EP1868320B1 (en) | Management system and method for wireless communication network and associated graphic user interface | |
| US7561876B2 (en) | System with user interface for network planning and mobility management optimization in a mobile communication network and method thereof | |
| US6356758B1 (en) | Wireless tools for data manipulation and visualization | |
| US7295119B2 (en) | System and method for indicating the presence or physical location of persons or devices in a site specific representation of a physical environment | |
| US7747254B2 (en) | Management system and method for wireless communication network and associated user interface | |
| EP2082537B1 (en) | System and method for re-home sequencing optimization | |
| CN101904189B (en) | System and process for dimensioning a cellular telecommunications network | |
| US8185124B2 (en) | Base station system performance measurement system in a GSM radio communication network | |
| US7295960B2 (en) | System and method for automated placement or configuration of equipment for obtaining desired network performance objectives | |
| US20140357260A1 (en) | Mobile phone network management systems | |
| US8433598B2 (en) | Methods, systems, and computer-readable media for providing future job information | |
| CA2403763A1 (en) | Handling unscheduled tasks in a scheduling process | |
| AU5443796A (en) | Method and apparatus for displaying information in a communication system | |
| CA2258055A1 (en) | Tools for data manipulation and visualization | |
| CN103581982A (en) | Service hotspot detecting, determining and positioning methods and devices | |
| EP1398975A1 (en) | Method for maintaining a radio network having elements coming from more than one supplier, and components therefor | |
| Mende et al. | Mobile radio network management supported by a planning tool | |
| Wilfred et al. | Investigation of Call Drop in a Cognitive GSM Network | |
| US7107181B2 (en) | Methods, systems, and storage mediums for maintaining timing supplies and assignments | |
| KR20230141747A (en) | System and method for identifying low utilization of telecommunication services in a predefined area | |
| Rimini et al. | Business process monitoring: BT Italy case study |
Legal Events
| Date | Code | Title | Description |
|---|---|---|---|
| PUAI | Public reference made under article 153(3) epc to a published international application that has entered the european phase |
Free format text: ORIGINAL CODE: 0009012 |
|
| 17P | Request for examination filed |
Effective date: 20070629 |
|
| AK | Designated contracting states |
Kind code of ref document: A2 Designated state(s): AT BE BG CH CY CZ DE DK EE ES FI FR GB GR HU IE IS IT LI LT LU LV MC MT NL PL PT RO SE SI SK TR |
|
| AX | Request for extension of the european patent |
Extension state: AL BA HR MK YU |
|
| PUAL | Search report despatched |
Free format text: ORIGINAL CODE: 0009013 |
|
| AK | Designated contracting states |
Kind code of ref document: A3 Designated state(s): AT BE BG CH CY CZ DE DK EE ES FI FR GB GR HU IE IS IT LI LT LU LV MC MT NL PL PT RO SE SI SK TR |
|
| AX | Request for extension of the european patent |
Extension state: AL BA HR MK RS |
|
| RIC1 | Information provided on ipc code assigned before grant |
Ipc: H04L 12/24 20060101ALI20080718BHEP Ipc: H04L 12/26 20060101AFI20080718BHEP |
|
| 17Q | First examination report despatched |
Effective date: 20090401 |
|
| AKX | Designation fees paid |
Designated state(s): AT BE BG CH CY CZ DE DK EE ES FI FR GB GR HU IE IS IT LI LT LU LV MC MT NL PL PT RO SE SI SK TR |
|
| GRAP | Despatch of communication of intention to grant a patent |
Free format text: ORIGINAL CODE: EPIDOSNIGR1 |
|
| GRAS | Grant fee paid |
Free format text: ORIGINAL CODE: EPIDOSNIGR3 |
|
| GRAA | (expected) grant |
Free format text: ORIGINAL CODE: 0009210 |
|
| AK | Designated contracting states |
Kind code of ref document: B1 Designated state(s): AT BE BG CH CY CZ DE DK EE ES FI FR GB GR HU IE IS IT LI LT LU LV MC MT NL PL PT RO SE SI SK TR |
|
| REG | Reference to a national code |
Ref country code: GB Ref legal event code: FG4D |
|
| REG | Reference to a national code |
Ref country code: CH Ref legal event code: EP |
|
| REG | Reference to a national code |
Ref country code: IE Ref legal event code: FG4D |
|
| REF | Corresponds to: |
Ref document number: 602007008322 Country of ref document: DE Date of ref document: 20100923 Kind code of ref document: P |
|
| REG | Reference to a national code |
Ref country code: NL Ref legal event code: VDEP Effective date: 20100811 |
|
| LTIE | Lt: invalidation of european patent or patent extension |
Effective date: 20100811 |
|
| PG25 | Lapsed in a contracting state [announced via postgrant information from national office to epo] |
Ref country code: LT Free format text: LAPSE BECAUSE OF FAILURE TO SUBMIT A TRANSLATION OF THE DESCRIPTION OR TO PAY THE FEE WITHIN THE PRESCRIBED TIME-LIMIT Effective date: 20100811 Ref country code: AT Free format text: LAPSE BECAUSE OF FAILURE TO SUBMIT A TRANSLATION OF THE DESCRIPTION OR TO PAY THE FEE WITHIN THE PRESCRIBED TIME-LIMIT Effective date: 20100811 Ref country code: NL Free format text: LAPSE BECAUSE OF FAILURE TO SUBMIT A TRANSLATION OF THE DESCRIPTION OR TO PAY THE FEE WITHIN THE PRESCRIBED TIME-LIMIT Effective date: 20100811 Ref country code: FI Free format text: LAPSE BECAUSE OF FAILURE TO SUBMIT A TRANSLATION OF THE DESCRIPTION OR TO PAY THE FEE WITHIN THE PRESCRIBED TIME-LIMIT Effective date: 20100811 |
|
| PG25 | Lapsed in a contracting state [announced via postgrant information from national office to epo] |
Ref country code: BG Free format text: LAPSE BECAUSE OF FAILURE TO SUBMIT A TRANSLATION OF THE DESCRIPTION OR TO PAY THE FEE WITHIN THE PRESCRIBED TIME-LIMIT Effective date: 20101111 Ref country code: IS Free format text: LAPSE BECAUSE OF FAILURE TO SUBMIT A TRANSLATION OF THE DESCRIPTION OR TO PAY THE FEE WITHIN THE PRESCRIBED TIME-LIMIT Effective date: 20101211 Ref country code: CY Free format text: LAPSE BECAUSE OF FAILURE TO SUBMIT A TRANSLATION OF THE DESCRIPTION OR TO PAY THE FEE WITHIN THE PRESCRIBED TIME-LIMIT Effective date: 20100811 Ref country code: PL Free format text: LAPSE BECAUSE OF FAILURE TO SUBMIT A TRANSLATION OF THE DESCRIPTION OR TO PAY THE FEE WITHIN THE PRESCRIBED TIME-LIMIT Effective date: 20100811 Ref country code: PT Free format text: LAPSE BECAUSE OF FAILURE TO SUBMIT A TRANSLATION OF THE DESCRIPTION OR TO PAY THE FEE WITHIN THE PRESCRIBED TIME-LIMIT Effective date: 20101213 Ref country code: SI Free format text: LAPSE BECAUSE OF FAILURE TO SUBMIT A TRANSLATION OF THE DESCRIPTION OR TO PAY THE FEE WITHIN THE PRESCRIBED TIME-LIMIT Effective date: 20100811 |
|
| PG25 | Lapsed in a contracting state [announced via postgrant information from national office to epo] |
Ref country code: GR Free format text: LAPSE BECAUSE OF FAILURE TO SUBMIT A TRANSLATION OF THE DESCRIPTION OR TO PAY THE FEE WITHIN THE PRESCRIBED TIME-LIMIT Effective date: 20101112 Ref country code: SE Free format text: LAPSE BECAUSE OF FAILURE TO SUBMIT A TRANSLATION OF THE DESCRIPTION OR TO PAY THE FEE WITHIN THE PRESCRIBED TIME-LIMIT Effective date: 20100811 Ref country code: BE Free format text: LAPSE BECAUSE OF FAILURE TO SUBMIT A TRANSLATION OF THE DESCRIPTION OR TO PAY THE FEE WITHIN THE PRESCRIBED TIME-LIMIT Effective date: 20100811 Ref country code: LV Free format text: LAPSE BECAUSE OF FAILURE TO SUBMIT A TRANSLATION OF THE DESCRIPTION OR TO PAY THE FEE WITHIN THE PRESCRIBED TIME-LIMIT Effective date: 20100811 |
|
| PG25 | Lapsed in a contracting state [announced via postgrant information from national office to epo] |
Ref country code: DK Free format text: LAPSE BECAUSE OF FAILURE TO SUBMIT A TRANSLATION OF THE DESCRIPTION OR TO PAY THE FEE WITHIN THE PRESCRIBED TIME-LIMIT Effective date: 20100811 |
|
| PG25 | Lapsed in a contracting state [announced via postgrant information from national office to epo] |
Ref country code: CZ Free format text: LAPSE BECAUSE OF FAILURE TO SUBMIT A TRANSLATION OF THE DESCRIPTION OR TO PAY THE FEE WITHIN THE PRESCRIBED TIME-LIMIT Effective date: 20100811 Ref country code: RO Free format text: LAPSE BECAUSE OF FAILURE TO SUBMIT A TRANSLATION OF THE DESCRIPTION OR TO PAY THE FEE WITHIN THE PRESCRIBED TIME-LIMIT Effective date: 20100811 Ref country code: IT Free format text: LAPSE BECAUSE OF FAILURE TO SUBMIT A TRANSLATION OF THE DESCRIPTION OR TO PAY THE FEE WITHIN THE PRESCRIBED TIME-LIMIT Effective date: 20100811 Ref country code: EE Free format text: LAPSE BECAUSE OF FAILURE TO SUBMIT A TRANSLATION OF THE DESCRIPTION OR TO PAY THE FEE WITHIN THE PRESCRIBED TIME-LIMIT Effective date: 20100811 Ref country code: SK Free format text: LAPSE BECAUSE OF FAILURE TO SUBMIT A TRANSLATION OF THE DESCRIPTION OR TO PAY THE FEE WITHIN THE PRESCRIBED TIME-LIMIT Effective date: 20100811 |
|
| PLBE | No opposition filed within time limit |
Free format text: ORIGINAL CODE: 0009261 |
|
| STAA | Information on the status of an ep patent application or granted ep patent |
Free format text: STATUS: NO OPPOSITION FILED WITHIN TIME LIMIT |
|
| PG25 | Lapsed in a contracting state [announced via postgrant information from national office to epo] |
Ref country code: ES Free format text: LAPSE BECAUSE OF FAILURE TO SUBMIT A TRANSLATION OF THE DESCRIPTION OR TO PAY THE FEE WITHIN THE PRESCRIBED TIME-LIMIT Effective date: 20101122 |
|
| 26N | No opposition filed |
Effective date: 20110512 |
|
| PGFP | Annual fee paid to national office [announced via postgrant information from national office to epo] |
Ref country code: GB Payment date: 20110623 Year of fee payment: 5 |
|
| REG | Reference to a national code |
Ref country code: DE Ref legal event code: R097 Ref document number: 602007008322 Country of ref document: DE Effective date: 20110512 |
|
| PGFP | Annual fee paid to national office [announced via postgrant information from national office to epo] |
Ref country code: FR Payment date: 20110801 Year of fee payment: 5 |
|
| PG25 | Lapsed in a contracting state [announced via postgrant information from national office to epo] |
Ref country code: MT Free format text: LAPSE BECAUSE OF FAILURE TO SUBMIT A TRANSLATION OF THE DESCRIPTION OR TO PAY THE FEE WITHIN THE PRESCRIBED TIME-LIMIT Effective date: 20100811 |
|
| REG | Reference to a national code |
Ref country code: CH Ref legal event code: PL |
|
| REG | Reference to a national code |
Ref country code: IE Ref legal event code: MM4A |
|
| PG25 | Lapsed in a contracting state [announced via postgrant information from national office to epo] |
Ref country code: IE Free format text: LAPSE BECAUSE OF NON-PAYMENT OF DUE FEES Effective date: 20110614 Ref country code: LI Free format text: LAPSE BECAUSE OF NON-PAYMENT OF DUE FEES Effective date: 20110630 Ref country code: CH Free format text: LAPSE BECAUSE OF NON-PAYMENT OF DUE FEES Effective date: 20110630 |
|
| GBPC | Gb: european patent ceased through non-payment of renewal fee |
Effective date: 20120614 |
|
| REG | Reference to a national code |
Ref country code: FR Ref legal event code: ST Effective date: 20130228 |
|
| PG25 | Lapsed in a contracting state [announced via postgrant information from national office to epo] |
Ref country code: MC Free format text: LAPSE BECAUSE OF NON-PAYMENT OF DUE FEES Effective date: 20110630 Ref country code: GB Free format text: LAPSE BECAUSE OF NON-PAYMENT OF DUE FEES Effective date: 20120614 Ref country code: FR Free format text: LAPSE BECAUSE OF NON-PAYMENT OF DUE FEES Effective date: 20120702 |
|
| PG25 | Lapsed in a contracting state [announced via postgrant information from national office to epo] |
Ref country code: LU Free format text: LAPSE BECAUSE OF NON-PAYMENT OF DUE FEES Effective date: 20110614 |
|
| PG25 | Lapsed in a contracting state [announced via postgrant information from national office to epo] |
Ref country code: TR Free format text: LAPSE BECAUSE OF FAILURE TO SUBMIT A TRANSLATION OF THE DESCRIPTION OR TO PAY THE FEE WITHIN THE PRESCRIBED TIME-LIMIT Effective date: 20100811 |
|
| PG25 | Lapsed in a contracting state [announced via postgrant information from national office to epo] |
Ref country code: HU Free format text: LAPSE BECAUSE OF FAILURE TO SUBMIT A TRANSLATION OF THE DESCRIPTION OR TO PAY THE FEE WITHIN THE PRESCRIBED TIME-LIMIT Effective date: 20100811 |
|
| REG | Reference to a national code |
Ref country code: DE Ref legal event code: R081 Ref document number: 602007008322 Country of ref document: DE Owner name: GROUNDHOG INC., TW Free format text: FORMER OWNER: GROUNDHOG TECHNOLOGIES INC., CAMBRIDGE, MASS., US Ref country code: DE Ref legal event code: R082 Ref document number: 602007008322 Country of ref document: DE Representative=s name: HASELTINE LAKE KEMPNER LLP, DE Ref country code: DE Ref legal event code: R082 Ref document number: 602007008322 Country of ref document: DE Representative=s name: HL KEMPNER PATENTANWALT, RECHTSANWALT, SOLICIT, DE Ref country code: DE Ref legal event code: R082 Ref document number: 602007008322 Country of ref document: DE Representative=s name: TETZNER & PARTNER MBB PATENT- UND RECHTSANWAEL, DE Ref country code: DE Ref legal event code: R081 Ref document number: 602007008322 Country of ref document: DE Owner name: GROUNDHOG TECHNOLOGIES INC. TAIWAN BRANCH, TW Free format text: FORMER OWNER: GROUNDHOG TECHNOLOGIES INC., CAMBRIDGE, MASS., US |
|
| REG | Reference to a national code |
Ref country code: DE Ref legal event code: R082 Ref document number: 602007008322 Country of ref document: DE Representative=s name: HL KEMPNER PATENTANWAELTE, SOLICITORS (ENGLAND, DE Ref country code: DE Ref legal event code: R082 Ref document number: 602007008322 Country of ref document: DE Representative=s name: HASELTINE LAKE KEMPNER LLP, DE Ref country code: DE Ref legal event code: R081 Ref document number: 602007008322 Country of ref document: DE Owner name: GROUNDHOG INC., TW Free format text: FORMER OWNER: GROUNDHOG TECHNOLOGIES INC. TAIWAN BRANCH, TAIPEI, TW Ref country code: DE Ref legal event code: R082 Ref document number: 602007008322 Country of ref document: DE Representative=s name: HL KEMPNER PATENTANWALT, RECHTSANWALT, SOLICIT, DE |
|
| REG | Reference to a national code |
Ref country code: DE Ref legal event code: R082 Ref document number: 602007008322 Country of ref document: DE Representative=s name: HL KEMPNER PATENTANWAELTE, SOLICITORS (ENGLAND, DE Ref country code: DE Ref legal event code: R082 Ref document number: 602007008322 Country of ref document: DE Representative=s name: HL KEMPNER PATENTANWALT, RECHTSANWALT, SOLICIT, DE |
|
| REG | Reference to a national code |
Ref country code: DE Ref legal event code: R079 Ref document number: 602007008322 Country of ref document: DE Free format text: PREVIOUS MAIN CLASS: H04L0012240000 Ipc: H04L0041000000 |
|
| PGFP | Annual fee paid to national office [announced via postgrant information from national office to epo] |
Ref country code: DE Payment date: 20230629 Year of fee payment: 17 |