EP2157524A2 - Methods for identifying, diagnosing, and predicting survival of lymphomas - Google Patents
Methods for identifying, diagnosing, and predicting survival of lymphomas Download PDFInfo
- Publication number
- EP2157524A2 EP2157524A2 EP09170243A EP09170243A EP2157524A2 EP 2157524 A2 EP2157524 A2 EP 2157524A2 EP 09170243 A EP09170243 A EP 09170243A EP 09170243 A EP09170243 A EP 09170243A EP 2157524 A2 EP2157524 A2 EP 2157524A2
- Authority
- EP
- European Patent Office
- Prior art keywords
- lymphoma
- genes
- validation
- training
- gene expression
- Prior art date
- Legal status (The legal status is an assumption and is not a legal conclusion. Google has not performed a legal analysis and makes no representation as to the accuracy of the status listed.)
- Withdrawn
Links
Images


Classifications
-
- C—CHEMISTRY; METALLURGY
- C12—BIOCHEMISTRY; BEER; SPIRITS; WINE; VINEGAR; MICROBIOLOGY; ENZYMOLOGY; MUTATION OR GENETIC ENGINEERING
- C12Q—MEASURING OR TESTING PROCESSES INVOLVING ENZYMES, NUCLEIC ACIDS OR MICROORGANISMS; COMPOSITIONS OR TEST PAPERS THEREFOR; PROCESSES OF PREPARING SUCH COMPOSITIONS; CONDITION-RESPONSIVE CONTROL IN MICROBIOLOGICAL OR ENZYMOLOGICAL PROCESSES
- C12Q1/00—Measuring or testing processes involving enzymes, nucleic acids or microorganisms; Compositions therefor; Processes of preparing such compositions
- C12Q1/68—Measuring or testing processes involving enzymes, nucleic acids or microorganisms; Compositions therefor; Processes of preparing such compositions involving nucleic acids
- C12Q1/6876—Nucleic acid products used in the analysis of nucleic acids, e.g. primers or probes
- C12Q1/6883—Nucleic acid products used in the analysis of nucleic acids, e.g. primers or probes for diseases caused by alterations of genetic material
- C12Q1/6886—Nucleic acid products used in the analysis of nucleic acids, e.g. primers or probes for diseases caused by alterations of genetic material for cancer
-
- G—PHYSICS
- G16—INFORMATION AND COMMUNICATION TECHNOLOGY [ICT] SPECIALLY ADAPTED FOR SPECIFIC APPLICATION FIELDS
- G16B—BIOINFORMATICS, i.e. INFORMATION AND COMMUNICATION TECHNOLOGY [ICT] SPECIALLY ADAPTED FOR GENETIC OR PROTEIN-RELATED DATA PROCESSING IN COMPUTATIONAL MOLECULAR BIOLOGY
- G16B25/00—ICT specially adapted for hybridisation; ICT specially adapted for gene or protein expression
- G16B25/30—Microarray design
-
- G—PHYSICS
- G16—INFORMATION AND COMMUNICATION TECHNOLOGY [ICT] SPECIALLY ADAPTED FOR SPECIFIC APPLICATION FIELDS
- G16B—BIOINFORMATICS, i.e. INFORMATION AND COMMUNICATION TECHNOLOGY [ICT] SPECIALLY ADAPTED FOR GENETIC OR PROTEIN-RELATED DATA PROCESSING IN COMPUTATIONAL MOLECULAR BIOLOGY
- G16B40/00—ICT specially adapted for biostatistics; ICT specially adapted for bioinformatics-related machine learning or data mining, e.g. knowledge discovery or pattern finding
- G16B40/20—Supervised data analysis
-
- C—CHEMISTRY; METALLURGY
- C12—BIOCHEMISTRY; BEER; SPIRITS; WINE; VINEGAR; MICROBIOLOGY; ENZYMOLOGY; MUTATION OR GENETIC ENGINEERING
- C12Q—MEASURING OR TESTING PROCESSES INVOLVING ENZYMES, NUCLEIC ACIDS OR MICROORGANISMS; COMPOSITIONS OR TEST PAPERS THEREFOR; PROCESSES OF PREPARING SUCH COMPOSITIONS; CONDITION-RESPONSIVE CONTROL IN MICROBIOLOGICAL OR ENZYMOLOGICAL PROCESSES
- C12Q2600/00—Oligonucleotides characterized by their use
- C12Q2600/112—Disease subtyping, staging or classification
-
- C—CHEMISTRY; METALLURGY
- C12—BIOCHEMISTRY; BEER; SPIRITS; WINE; VINEGAR; MICROBIOLOGY; ENZYMOLOGY; MUTATION OR GENETIC ENGINEERING
- C12Q—MEASURING OR TESTING PROCESSES INVOLVING ENZYMES, NUCLEIC ACIDS OR MICROORGANISMS; COMPOSITIONS OR TEST PAPERS THEREFOR; PROCESSES OF PREPARING SUCH COMPOSITIONS; CONDITION-RESPONSIVE CONTROL IN MICROBIOLOGICAL OR ENZYMOLOGICAL PROCESSES
- C12Q2600/00—Oligonucleotides characterized by their use
- C12Q2600/118—Prognosis of disease development
-
- C—CHEMISTRY; METALLURGY
- C12—BIOCHEMISTRY; BEER; SPIRITS; WINE; VINEGAR; MICROBIOLOGY; ENZYMOLOGY; MUTATION OR GENETIC ENGINEERING
- C12Q—MEASURING OR TESTING PROCESSES INVOLVING ENZYMES, NUCLEIC ACIDS OR MICROORGANISMS; COMPOSITIONS OR TEST PAPERS THEREFOR; PROCESSES OF PREPARING SUCH COMPOSITIONS; CONDITION-RESPONSIVE CONTROL IN MICROBIOLOGICAL OR ENZYMOLOGICAL PROCESSES
- C12Q2600/00—Oligonucleotides characterized by their use
- C12Q2600/158—Expression markers
-
- G—PHYSICS
- G16—INFORMATION AND COMMUNICATION TECHNOLOGY [ICT] SPECIALLY ADAPTED FOR SPECIFIC APPLICATION FIELDS
- G16B—BIOINFORMATICS, i.e. INFORMATION AND COMMUNICATION TECHNOLOGY [ICT] SPECIALLY ADAPTED FOR GENETIC OR PROTEIN-RELATED DATA PROCESSING IN COMPUTATIONAL MOLECULAR BIOLOGY
- G16B25/00—ICT specially adapted for hybridisation; ICT specially adapted for gene or protein expression
-
- Y—GENERAL TAGGING OF NEW TECHNOLOGICAL DEVELOPMENTS; GENERAL TAGGING OF CROSS-SECTIONAL TECHNOLOGIES SPANNING OVER SEVERAL SECTIONS OF THE IPC; TECHNICAL SUBJECTS COVERED BY FORMER USPC CROSS-REFERENCE ART COLLECTIONS [XRACs] AND DIGESTS
- Y02—TECHNOLOGIES OR APPLICATIONS FOR MITIGATION OR ADAPTATION AGAINST CLIMATE CHANGE
- Y02A—TECHNOLOGIES FOR ADAPTATION TO CLIMATE CHANGE
- Y02A90/00—Technologies having an indirect contribution to adaptation to climate change
- Y02A90/10—Information and communication technologies [ICT] supporting adaptation to climate change, e.g. for weather forecasting or climate simulation
Definitions
- the present invention relates to the field of diagnosing, identifying, and predicting survival in lymphoproliferative disorders.
- Table 1 contains a list of the B and T cell neoplasms that have been recognized by the WHO classification. Each malignancy is listed according to its WHO classification nomenclature, followed by a WHO classification number.
- Table 1 B-cell neoplasms Category Name WHO ID # Precursor B-cell neoplasms Precursor B-cell lymphoblastic leukemia 9835/3 Precursor B-cell lymphoblastic lymphoma 9728/3 Mature B-cell neoplasms Chronic lymphocytic leukemla 9823/3 Small lymphocytic lymphoma 9670/3 B-cell prolymphocytic leukemia 9833/3 Lymphopiasmacytic lymphoma 9671/3 Splenic marginal zone lymphoma 9689/3 Hairy cell leukemia 9940/3 Plasma cell myeloma 9732/3 Solitary plasmacytoma of bone 9731/3 Extraosseous plasmacytoma 9734/3 Extranodal marginal zone B-cell
- lymphoma type or subtype in a subject suffering from a lymphoproliferative disorder is important for developing an appropriate therapeutic strategy.
- Previous attempts have been made to identify lymphoma using gene expression data obtained using a microarray.
- gene expression data obtained using a microarray.
- there is a need in the art for more accurate and predictive methods of analyzing this gene expression data.
- the present invention discloses a novel microarray for obtaining gene expression data to be used in identifying lymphoma types and predicting survival in a subject.
- the present invention further discloses a variety of methods for analyzing gene expression data obtained from a lymphoma sample, and specific algorithms for predicting survival and clinical outcome in a subject suffering from a lymphoma.
- compositions comprising the set of probes listed in Table 2, located at the end of the Detailed Description section.
- this composition comprises a microarray.
- the present invention provides a method of generating a survival predictor for a particular lymphoma type.
- a method of generating a survival predictor for a particular lymphoma type In this method, one or more biopsy samples that have been diagnosed as belonging to a particular lymphoma type are obtained. Gene expression data is obtained for these samples, and genes with expression patterns associated with longer or shorter survival are identified. Hierarchical clustering is performed to group these genes into gene expression signatures, and the expression of all genes within each signature are averaged to obtain a gene expression signature value for each signature. These gene expression signature values are then used to generate a multivariate survival predictor.
- the present invention provides a method for predicting survival in a follicular lymphoma (FL) subject,
- a biopsy sample is obtained from the subject and gene expression data is obtained from the biopsy sample.
- the expression level of those genes belonging to an immune response-1 or immune response-2 gene expression signature are averaged to generate gene expression signature values for each signature.
- a survival predictor score is then calculated using an equation: [2.71*(immune response-2 gene expression signature value)] - [2.36*(immune response-1 gene expression signature value)].
- a higher survival predictor score is associated with a less favorable outcome.
- the gene expression data used in this method is obtained using a microarray.
- the present invention provides another method for predicting survival in a follicular lymphoma (FL) subject.
- a biopsy sample is obtained from the subject and gene expression data is obtained from the biopsy sample.
- the expression level of those genes belonging to a B cell differentiation, T-cell, or macrophage gene expression signature are averaged to generate gene expression signature values for each signature.
- a survival predictor score is then calculated using an equation: [2.053*(macrophage gene expression signature value)] - [2.344*(T-cell gene expression signature value)] - [0.729*(B-cell gene expression signature value)].
- a higher survival predictor score is associated with a less favorable outcome,
- the gene expression data used in this method is obtained using a microarray.
- the present invention provides yet another method for predicting survival in a follicular lymphoma (FL) subject.
- a biopsy sample is obtained from the subject and gene expression data is obtained from the biopsy sample.
- the expression level of those genes belonging to a macrophage, T-cell, or B-cell differentiation gene expression signature are averaged to generate gene expression signature values for each signature.
- a survival predictor score is then calculated using an equation: [1.51*(macrophage gene expression signature value)]- [2.11*(T-cell gene expression signature value)] - [0.505*(B-cell differentiation gene expression signature value)].
- a higher survival predictor score is associated with a less favorable outcome.
- the gene expression data used in this method is obtained using a microarray.
- the present invention provides a method for predicting survival in a diffuse large B cell lymphoma (DLBCL) subject.
- a biopsy sample is obtained from the subject and gene expression data is obtained from the biopsy sample.
- the expression level of those genes belonging to an ABC DLBCL high, lymph node, or MHC class II gene expression signature are averaged to generate gene expression signature values for each signature.
- a survival predictor score is then calculated using an equation: [0,586*(ABC DLBCL high gene expression signature value)]- [0.468*(lymph node gene expression signature value)] - [0.336*(MHC class II gene expression signature value)].
- a higher survival predictor score is associated with a less favorable outcome.
- the gene expression data used in this method is obtained using a microarray.
- the present invention provides another method for predicting survival in a diffuse large B cell lymphoma (DLBCL) subject.
- a biopsy sample is obtained from the subject and gene expression data is obtained from the biopsy sample.
- the expression level of those genes belonging to a lymph node, germinal B cell, proliferation, or MHC class II gene expression signature are averaged to generate gene expression signature values for each signature.
- a survival predictor score is then calculated using an equation: [-0.4337*(lymph node gene expression signature)] + [0,09*(proliferation gene expression signature)]- [0.4144*(germinal center B-cell gene expression signature)] - [0.2006*(MHC class II gene expression signature)].
- a higher survival predictor score is associated with a less favorable outcome.
- the gene expression data used in this method is obtained using a microarray.
- the present invention provides yet another method for predicting survival in a diffuse large B cell lymphoma (DLBCL) subject.
- a biopsy sample is obtained from the subject and gene expression data is obtained from the biopsy sample.
- the expression level of those genes belonging to a lymph node, germinal B cell, or MHC class Il gene expression signature are averaged to generate gene expression signature values for each signature.
- a survival predictor score is then calculated using an equation: [-0.32*(lymph node gene expression signature)]- [0.176*(germinal B cell gene expression signature)]-[0,206*(MHC class II gene expression signature)].
- a higher survival predictor score is associated with a less favorable outcome.
- the gene expression data used in this method is obtained using a microarray.
- the gene expression data is obtained using RT-PCR.
- the present invention provides a method for predicting survival in a mantle cell lymphoma (MCL) subject.
- MCL mantle cell lymphoma
- a biopsy sample is obtained from the subject and gene expression data is obtained from the biopsy sample.
- the expression level of those genes belonging to a proliferation gene expression signature are averaged to generate a gene expression signature value.
- a survival predictor score is then calculated using an equation: [1.66*(proliferation gene expression signature value)].
- a higher survival predictor score is associated with a less favorable outcome.
- the gene expression data used in this method is obtained using a microarray.
- the present invention provides a method for determining the probability that a sample X belongs to a first lymphoma type or a second lymphoma type.
- a set of genes is identified that is differentially expressed between the two lymphoma types in question, and a set of scale factors representing the difference in expression between the lymphoma types for each of these genes are calculated.
- a series of linear predictor scores are generated for samples belonging to either of the two lymphoma types based on expression of these genes.
- Gene expression data is then obtained for sample X , and a linear predictor score is calculated for this sample.
- the probability that sample X belongs to the first lymphoma type is calculated using an equation that incorporates the linear predictor score of sample X and the mean and variance of the linear predictor scores for the known samples of either lymphoma type.
- the present invention provides a method for determining the lymphoma type of a sample X .
- a set of genes is identified that is differentially expressed between a first lymphoma type and a second lymphoma type, and a set of scale factors representing the difference in expression of each of these genes between the two lymphoma types are calculated.
- a series of linear predictor scores are generated for samples belonging to either of the two lymphoma types based on expression of these genes. Gene expression data is then obtained for sample X , and a linear predictor score is calculated for this sample.
- the probability that sample X belongs to the first lymphoma type is calculated using an equation that incorporates the linear predictor score of sample X and the mean and variance of the linear predictor scores for the known samples of either lymphoma type. This entire process is then repeated with various lymphoma types being substituted for the first lymphoma type, the second lymphoma type, or both.
- the present invention provides another method for determining the lymphoma type of a sample X .
- a series of lymphoma type pairs are created, with each pair consisting of a first lymphoma type and a second lymphoma type.
- gene expression data is obtained for a set of genes, and a series of scale factors representing the difference in expression of each of these genes between the two lymphoma types are calculated.
- a subset of z genes with the largest scale factors are identified, and a series of linear predictor scores are generated for samples belonging to either of the two lymphoma types. Linear predictor scores are calculated for anywhere from 1 to z of these genes.
- the number of genes from 1 to z that results in the largest difference in linear predictor scores between the two lymphoma types is selected, and gene expression data for these genes is obtained for sample X .
- a linear predictor score is generated for sample X , and the probability that the sample belongs to the first lymphoma type is calculated using an equation that incorporates the linear predictor score for sample X and the mean and variance of the linear predictor scores for the known samples of either lymphoma type.
- the present invention provides another method for determining the lymphoma type of a sample X .
- a series of lymphoma type pairs are created, with each pair consisting of a first lymphoma type and a second lymphoma type.
- gene expression data is obtained for a set of genes, and a series of scale factors representing the difference in expression of each of these genes between the two lymphoma types are calculated.
- the set of genes is divided into gene-list categories indicating correlation with a gene expression signature. Within each gene-list category, a subset of z genes with the largest scale factors are identified, and a series of linear predictor scores are generated for samples belonging to either of the two lymphoma types.
- Linear predictor scores are calculated for anywhere from 1 to z of these genes. The number of genes from 1 to z that results in the largest difference in linear predictor scores between the two lymphoma types is selected, and gene expression data for these genes is obtained for sample X . A linear predictor score is generated for sample X , and the probability q that the sample belongs to the first lymphoma type is calculated using an equation that incorporates the linear predictor score for sample X and the mean and variance of the linear predictor scores for the known samples of either lymphoma type.
- a high probability q indicates that sample X belongs to the first lymphoma type
- a low probability q indicates that sample X belongs to the second lymphoma type
- a middle probability q indicates that sample X belongs to neither lymphoma type
- the cut-off point between high, middle, and low probability values is determined by ranking samples of known lymphoma type according to their probability values, then analyzing every possible cut-off point between adjacent samples using the equation: 3,99*[(% of first lymphoma type misidentified as second lymphoma type) + (% of second lymphoma type misidentified as a first lymphoma type)]+ [(% of first lymphoma type identified as belonging to neither lymphoma type) + (% of second lymphoma type identified as belonging to neither lymphoma type)].
- the final cut-off points are those that minimize the value of this equation.
- Gene expression profiling of a cancer cell or biopsy reflects the molecular phenotype of a cancer at the time of diagnosis.
- the detailed picture provided by the genomic expression pattern provides the basis for a new systematic classification of cancers and more accurate predictors of survival and response to treatment.
- the present invention discloses methods for identifying, diagnosing, and/or classifying a lymphoma, lymphoid malignancy, or lymphoproliferative disorder based on its gene expression patterns.
- the present invention also discloses methods for predicting survival in a subject diagnosed with a particular lymphoma type or subtype using gene expression data. The information obtained using these methods will be useful in evaluating the optimal therapeutic approach to be employed with regards to a particular subject.
- lymphoproliferative disorder refers to any tumor of lymphocytes, and may refer to both malignant and benign tumors.
- lymphocytes and may refer to both malignant and benign tumors.
- lymphoid malignancy refer specifically to malignant tumors derived from lymphocytes and lymphoblasts.
- lymphomas include, but are not limited to, follicular lymphomas (FL), Burkitt lymphoma (BL), mantle cell lymphoma (MCL), follicular hyperplasia (FH), small cell lymphocytic lymphoma (SLL), mucosa-associated lymphoid tissue lymphoma (MALT), splenic lymphoma, multiple myeloma, lymphoplasmacytic lymphoma, post-transplant lymphoproliferative disorder (PTLD), lymphoblastic lymphoma, nodal marginal zone lymphoma (NMZ), germinal center B cell-like diffuse large B cell lymphoma (GCB), activated B cell-like diffuse large B cell lymphoma (ABC) and primary mediastinal B cell lymphoma (PMBL).
- FL follicular lymphomas
- BL Burkitt lymphoma
- MCL mantle cell lymphoma
- FH small cell lymphocytic lymphoma
- lymphoma type refers to a diagnostic classification of a lymphoma.
- the phrase may refer to a broad lymphoma class (e.g., DLBCL, FL, MCL, etc.) or to a subtype or subgroup failing within a broad lymphoma class (e.g., GCB DLBCL, ABC DLBCL).
- gene expression data refers to information regarding the relative or absolute level of expression of a gene or set of genes in a cell or group of cells.
- the level of expression of a gene may be determined based on the level of RNA, such as mRNA, encoded by the gene. Alternatively, the level of expression may be determined based on the level of a polypeptide or fragment thereof encoded by the gene.
- Gene expression data may be acquired for an individual cell, or for a group of cells such as a tumor or biopsy sample.
- microarray refers to a plurality of nucleic acid probes coupled to the surface of a substrate in different known locations.
- the substrate is preferably solid.
- Microarrays have been generally described in the art in, for example, U.S. Patent Nos. 5,143,854 (Pirrung ), 6,424,186 (Fodor ), 5,445,934 (Fodor ), 5,677,195 (Winkler ), 5,744,305 (Fodor ), 5,800,992 (Fodor ), 6,040,193 (Winkler ), and Fodor et al. 1991. Light-directed, spatially addressable parallel chemical synthesis. Science, 251:767-777 . Each of these references is incorporated by reference herein in their entirety.
- gene expression signature refers to a group of coordinately expressed genes.
- the genes making up this signature may be expressed in a specific cell lineage, stage of differentiation, or during a particular biological response.
- the genes can reflect biological aspects of the tumors in which they are expressed, such as the cell of origin of the cancer, the nature of the non-malignant cells in the biopsy, and the oncogenic mechanisms responsible for the cancer (Shaffer 2001).
- Examples of gene expression signatures include lymph node (Shaffer 2001), proliferation (Rosenwald 2002), MHC class II, ABC DLBCL high, B-cell differentiation, T-cell, macrophage, immune response-1, immune response-2, and germinal center B cell.
- survival predictor score refers to a score generated by a multivariate model used to predict survival based on gene expression. A subject with a higher survival predictor score is predicted to have poorer survival than a subject with a lower survival predictor score.
- survival may refer to the probability or likelihood of a subject surviving for a particular period of time. Alternatively, it may refer to the likely term of survival for a subject, such as expected mean or median survival time for a subject with a particular gene expression pattern.
- linear predictor score refers to a score that denotes the probability that a sample belongs to a particular lymphoma type.
- a linear predictor score may be generated by other methods including but not limited to linear discriminant analysis (Dudoit 2002), support vector machines (Furey 2000), or shrunken centroids (Tibshirani 2002)
- scale factor refers to a factor that defines the relative difference in expression of a particular gene between two samples.
- An example of a scale factor is a t-score generated by a Student's t-test.
- lymphoma subject wherein “lymphoma” is a specific lymphoma type (e.g., "follicular lymphoma subject”), may refer to a subject that has been diagnosed with a particular lymphoma by any method known in the art or discussed herein. This phrase may also refer to a subject with a known or suspected predisposition or risk of developing a particular lymphoma type.
- the pattern of expression of a particular gene is closely connected to the biological role and effect of its gene product. For this reason, the systematic study of variations in gene expression provides an alternative approach for linking specific genes with specific diseases and for recognizing heritable gene variations that are important for immune function. For example, alielic differences in the regulatory region of a gene may influence the expression levels of that gene. An appreciation for such quantitative traits in the immune system may help elucidate the genetics of autoimmune diseases and lymphoproliferative disorders.
- Genes that encode components of the same multi-subunit protein complex are often coordinately regulated. Coordinate regulation is also observed among genes whose products function in a common differentiation program or in the same physiological response pathway. Recent application of gene expression profiling to the immune system has shown that lymphocyte differentiation and activation are accompanied by parallel changes in expression among hundreds of genes. Gene expression databases may be used to interpret the pathological changes in gene expression that accompany autoimmunity, immune deficiencies, cancers of immune cells and of normal immune responses.
- Mathematical analysis of gene expression generally has three goals. First, it may be used to identify groups of genes that are coordinately regulated within a biological system. Second, it may be used to recognize and interpret similarities between biological samples on the basis of similarities In gene expression patterns. Third, it may be used to recognize and identify those features of a gene expression pattern that are related to distinct biological processes or phenotypes.
- Mathematical analysis of gene expression data often begins by establishing the expression pattern for each gene on an array across n experimental samples.
- the expression pattern of each gene can be represented by a point in n-dimensional space, with each coordinate specified by an expression measurement in one of the n samples (Eisen 1998).
- a clustering algorithm that uses distance metrics can then be applied to locate clusters of genes in this n-dimensional space. These clusters indicate genes with similar patterns of variation in expression over a series of experiments.
- Clustering methods that have been applied to microarray data in the past include hierarchical clustering (Eisen 1998), self-organizing maps (SOMs) (Tamayo 1999), k-means (Tavazoie 1999), and deterministic annealing (Alon 1999).
- Hierarchical clustering begins by determining the gene expression correlation coefficients for each pair of the n genes studied. Genes with similar gene expression correlation coefficients are grouped next to one another in a hierarchical fashion. Generally, genes with similar expression patterns under a particular set of conditions encode protein products that play related roles in the physiological adaptation to those conditions. Novel genes of unknown function that are clustered with a large group of functionally related genes are likely to participate in the same biological process. Likewise, the other clustering methods mentioned herein may also group genes together that encode proteins with related biological function.
- Gene expression maps may be constructed by organizing the gene expression data from multiple samples using any of the various clustering algorithms outlined herein. The ordered tables of data may then be displayed graphically in a way that allows researchers and clinicians to assimilate both the choreography of gene expression on a broad scale and the fine distinctions in expression of individual genes.
- genes that are clustered together reflect a particular biological function, and are termed gene expression signatures (Shaffer 2001).
- One general type of gene expression signature includes genes that are characteristically expressed in a particular cell type or at a particular stage of cellular differentiation or activation.
- Another general type of gene expression signature includes genes that are regulated in their expression by a particular biological process such as proliferation, or by the activity of a particular transcription factor or signaling pathway.
- the pattern of gene expression in a biological sample provides a distinctive and accessible molecular picture of its functional state and identity (DeRisi 1997; Cho 1998; Chu 1998; Holstege 1998; Spellman 1998). Each cell transduces variation in its environment, internal state, and developmental state into readily measured and recognizable variation in gene expression patterns. Two different samples that have related gene expression patterns are therefore likely to be biologically and functionally similar to one another. Some biological processes are reflected by the expression of genes in a gene expression signature, as described above. The expression of gene expression signatures in a particular sample can provide important biological insights regarding its cellular composition and the function of various intracellular pathways within the cells.
- the present invention discloses a variety of gene expression signatures related to the clinical outcome of lymphoma patients. While several of these signatures share a name with a previously disclosed signature, each of the gene expression signatures disclosed herein comprises a novel combination of genes.
- the lymph node signature disclosed herein includes genes encoding extracellular matrix components and genes that are characteristically expressed In macrophage, NK, and T cells (e.g., ⁇ -Actinln, collagen type III ⁇ 1, connective tissue growth factor, fibronectin, KIAA0233, urokinase plasminogen activator).
- the proliferation signature includes genes that are characteristically expressed by cells that are rapidly multiplying or proliferating (e.g., c-myc, E21G3, NPM3, BMP6).
- the MHC class II signature includes genes that interact with lymphocytes in order to allow the recognition of foreign antigens (e.g., HLA-DP ⁇ , HLA-DQ ⁇ , HLA-DR ⁇ , HLA-DR ⁇ ).
- the immune response-1 signature includes genes encoding T cell markers (e.g., CD7, CD8B1, ITK, LEF1, STAT4), as well as genes that are highly expressed in macrophages (e.g., ACTN1, TNFSF13B).
- the immune response-2 signature includes genes known to be preferentially expressed in macrophages and/or dendritic cells (e.g., TLR5, FCGR1A, SEPT10, LGMN, C3AR1).
- the germinal center B cell signature includes genes known to be overexpressed at this stage of B cell differentiation (e.g., MME, MEF2C, BCL6, LMO2, PRSPAP2, MBD4, EBF, MYBL1.
- genes from the germinal center B-cell signature in a lymphoma biopsy suggests that the lymphoma is derived from this stage of B cell differentiation.
- the expression of genes from the T cell signature can be used to estimate the degree of infiltration of the tumor by host T cells, while the expression of genes from the proliferation signature can be used to quantitate the tumor cell proliferation rate.
- gene expression signatures provide an "executive summary" of the biological properties of a tumor specimen. Gene expression signatures can also be helpful in interpreting the results of a supervised analysis of gene expression data.
- Gene expression profiles can be used to create multivariate models for predicting survival.
- the methods for creating these models are called "supervised” because they use clinical data to guide the selection of genes to be used in the prognostic classification.
- a supervised method might identify genes with expression patterns that correlate with the length of overall survival following chemotherapy.
- the general method used to create a multivariate model for predicting survival may utilize the following steps:
- This approach has been utilized in the present invention to create novel survival prediction models for FL, DLBCL, and MCL.
- Each of these models generates a survival predictor score, with a higher score being associated with worse clinical outcome.
- Each of these models may be used separately to predict survival. Alternatively, these models may be used in conjunction with one or more other models, disclosed herein or in other references, to predict survival.
- Gene expression data can also be used to diagnose and identify lymphoma types.
- a statistical method based on Bayesian analysis was developed to classify lymphoma specimens according to their gene expression profiles. This method does not merely assign a tumor to a particular lymphoma type, but also determines the probability that the tumor belongs to that lymphoma type.
- Many different methods have been formulated to predict cancer subgroups (Golub 1999; Ramaswamy 2001; Dudoit 2002; Radmacher 2002). These methods assign tumors to one of two subgroups based on expression of a set of differentially expressed genes. However, they do not provide a probability of membership in a subgroup.
- the method disclosed herein used Bayes' rule to estimate this probability, thus allowing one to vary the probability cut-off for assignment of a tumor to a particular subgroup.
- the present method allows samples that do not meet the gene expression criteria of known subgroups to fall into an unclassified group with intermediate probability.
- a cancer subgroup predictor of the type described herein may be used clinically to provide quantitative diagnostic information for an individual cancer patient. This information can in turn be used to provide a predictor of treatment outcome for a particular cancer patient.
- lymphoma If only two types of lymphoma are being distinguished, then a single probability score is sufficient to discriminate between the two types. However, if more than two lymphoma types are being distinguished, multiple scores will be needed to highlight specific differences between the types.
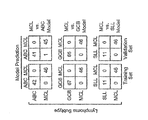
- a novel microarray entitled the Lymph Dx microarray was developed for the identification and diagnosis of lymphoma types.
- the Lymph Dx microarray contains cDNA probes corresponding to approximately 2,653 genes, fewer than the number seen on microarrays that have been used previously for lymphoma diagnosis.
- the reduced number of probes on the Lymph Dx microarray is the result of eliminating genes that are less useful for the identification of lymphoma types and predicting clinical outcome. This reduction allows for simplified analysis of gene expression data.
- the genes represented on the Lymph Dx microarray can be divided into four broad categories: 1,101 lymphoma predictor genes identified previously using the Affymetrix U133 microarray, 171 outcome predictor genes, 167 new genes not found on the Affymetrix U133 microarray, and 1,121 named genes.
- a list of the probe sets on the Lymph Dx microarray is presented in Table 2, located at the end of the Detailed Description section.
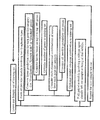
- gene expression data obtained using the Lymph Dx microarray was used to identify and classify lymphomas using Bayesian analysis. This method was similar to that outlined above, but included additional steps designed to optimize the number of genes used and the cut-off points between lymphoma types. A general overview of this method is presented in Figure 1 .
- Each gene represented on the Lymph Dx microarrays was placed into one of three gone-list categories based on its correlation with the lymph node or proliferation gene expression signatures: lymph node, proliferation, or standard. These signatures were identified by clustering of the DLBCL cases using hierarchical clustering and centrold-correlation of 0.35. Standard genes were those with expression patterns that did not correlate highly with expression of the lymph node or proliferation signatures.
- Lymph Dx gene expression data was first used to identify samples as FL, MCL, SLL, FH, or DLBCL/BL, then to identify DLBCL/BL samples as ABC, GCB, PMBL, or BL.
- a series of pair-wise models was created, with each model containing a different pair of lymphoma types (e.g., FL vs. MCL, SLL vs. FH, etc.).
- the difference in expression of each gene on the microarray was measured, and a t-statistic was generated representing this difference.
- Genes from each gene-list category were ordered based on their t-statistic, and those with the largest t-statistics were used to generate a series of LPSs for samples belonging to either lymphoma type.
- the number of genes used to generate the LPSs was optimized by repeating the calculation using between five and 100 genes from each gene-list category.
- the number of genes from each category used in the final LPS calculation was that which gave rise to the largest difference in LPS between the two lymphoma types. Once the number of genes in each gene-list category was optimized, four different LPSs were calculated for each sample.
- LPS(X) is the LPS for sample X
- ⁇ ( x; ⁇ , ⁇ ) is the normal density function with mean ⁇ and standard deviation ⁇
- ⁇ 1 and ⁇ 1 are the mean and variance of the LPSs for samples belonging to the first lymphoma type
- ⁇ 2 and ⁇ 2 are the mean and variance of the LPSs for samples belonging to the second lymphoma type. Samples with high q values were classified as the first lymphoma type, samples with low q values were classified as the second lymphoma type, and samples with middle range q values were deemed unclassified.
- every possible cut-off point between adjacent samples was analyzed by an equation: 3.99 * % of type 1 misidentified as type 2 + % of type 2 misidentified as type 1 + % of type 1 unclassified + % of type 2 misidentified .
- This equation was used to favor the assignment of a sample to an "unclassified" category rather than to an incorrect lymphoma type.
- the final cut-off points were those which minimized this equation.
- the coefficient of 3.99 was chosen arbitrarily to allow an additional classification error only if the adjustment resulted in four or more unclassified samples becoming correctly classified.
- the coefficient can be varied to achieve a different set of trade-offs between the number of unclassified and misidentified samples.
- each model was validated by leave-one-out cross-validation. This entailed removing each sample of known lymphoma type from the data one at a time, and then determining whether the model could predict the missing sample. This process confirmed the accuracy of the prediction method.
- a lymphoproliferative disorder in accordance with embodiments of the present invention may be used in combination with any other effective classification feature or set of features.
- a disorder may be classified by a method of the present invention in conjunction with WHO suggested guidelines, morphological properties, histochemical properties, chromosomal structure, genetic mutation, cellular proliferation rates, immunoreactivity, clinical presentation, and/or response to chemical, biological, or other agents.
- Embodiments of the present invention may be used in lieu of or in conjunction with other methods for lymphoma diagnosis, such as immunohistochemistry, flow cytometry, FISH for translocations, or viral diagnostics.
- lymphoma type in a subject allows for better selection and application of therapeutic methods.
- Knowledge about the exact lymphoma affecting a subject allows a clinician to select therapies or treatments that are most appropriate and useful for that subject, while avoiding therapies that are nonproductive or even counterproductive.
- CNS prophylaxis may be useful for treating BL but not DLBCL
- CHOP treatment may be useful for treating DLBCL but not blastic MCL (Fisher 1993; Khouri 1998)
- subjects with follicular lymphoma frequently receive treatment while subjects with follicular hyperplasia do not.
- the lymphoma types or subtypes in question can be difficult to distinguish using prior art diagnostic methods.
- the diagnostic and identification methods of the present invention allow for more precise delineation between these lymphomas, which simplifies the decision of whether to pursue a particular therapeutic option.
- the survival prediction methods disclosed in the present invention also allow for better selection of therapeutic options.
- a subject with a very low survival predictor score i.e., very good prognosis
- survival predictor scores increase (i.e., prognosis gets worse)
- subjects may receive more intensive treatments.
- Those subjects with the highest survival predictor scores i.e., very poor prognosis
- Accurate survival prediction using the methods disclosed herein provides an improved tool for selecting treatment options and for predicting the likely clinical outcome of those options.
- gene expression data may be measured or estimated using one or more microarrays.
- the microarrays may be of any effective type, including but not limited to nucleic acid based or antibody based.
- Gene expression may also be measured by a variety of other techniques, including but not limited to PCR, quantitative RT-PCR, real-time PCR, RNA amplification, in situ hybridization, immunohistochemistry, immunocytochemistry, FACS, serial analysis of gene expression (SAGE) (Velculescu 1995), Northern blot hybridization, or western blot hybridization.
- Nucleic acid microarrays generally comprise nucleic acid probes derived from individual genes and placed in an ordered array on a support.
- This support may be, for example, a glass slide, a nylon membrane, or a silicon wafer.
- Gene expression patterns in a sample are obtained by hybridizing the microarray with the gene expression product from the sample.
- This gene expression product may be, for example, total cellular mRNA, rRNA, or cDNA obtained by reverse transcription of total cellular mRNA.
- the gene expression product from a sample is labeled with a radioactive, fluorescent, or other label to allow for detection.
- the microarray is washed, and hybridization of gene expression product to each nucleic acid probe on the microarray is detected and quantified using a detection device such as a phosphorimager or scanning confocal microscope.
- cDNA arrays consist of hundreds or thousands of cDNA probes immobilized on a solid support. These cDNA probes are usually 100 nucleotides or greater in size.
- nitrocellulose filter array which is generally prepared by robotic spotting of purified DNA fragments or lysates of bacteria containing cDNA clones onto a nitrocellulose filter (Southern 1992; Southern 1994; Gress 1996; Pietu 1996).
- cDNA arrays The other commonly used cDNA arrays is fabricated by robotic spotting of PCR fragments from cDNA clones onto glass microscope slides (Schena 1995; DeRisi 1996; Schena 1996; Shalon 1996; DeRisi 1997; Heller 1997; Lashkari 1997). These cDNA microarrays are simultaneously hybridized with two fluorescent cDNA probes, each labeled with a different fluorescent dye (typically Cy3 or Cy5). In this format, the relative mRNA expression in two samples is directly compared for each gene on the microarray. Oligonucleotide arrays differ from cDNA arrays in that the probes are 20- to 25-mer oligonucleotides.
- Oligonucleotide arrays are generally produced by in situ oligonucleotide synthesis in conjunction with photolithographic masking techniques (Pease 1994; Lipshutz 1995; Chee 1996; Lockhart 1996; Wodicka 1997).
- the solid support for oligonucleotide arrays is typically a glass or silicon surface.
- Microarrays may generally be produced using a variety of techniques, such as mechanical or light directed synthesis methods that incorporate a combination of photolithographic methods and solid phase synthesis methods. Techniques for the synthesis of microarrays using mechanical synthesis methods are described in, for example, U.S. Patent Nos. 5,384,261 (Winkler ) and 6,040,193 (Winkler ). Although a planar array surface is preferred, the microarray may be fabricated on a surface of virtually any shape, or even on a multiplicity of surfaces. Microarrays may be nucleic acids on beads, gels, polymeric surfaces, fibers such as fiber optics, glass or any other appropriate substrate. See, for example, U.S. Patent Nos.
- Microarrays may be packaged in such a manner as to allow for diagnostic use, or they can be an all-inclusive device. See, for example, U.S. Patent Nos. 5,856,174 (Lipshutz ) and 5,922,591 (Anderson ), both of which are incorporated by reference herein in their entirety.
- Microarrays directed to a variety of purposes are commercially available from Affymetrix (Affymetrix, Santa Clara, CA). For instance, these microarrays may be used for genotyping and gene expression monitoring for a variety of eukaryotic and prokaryotic species.
- Example 1 Collection and analysis of gene expression data using Affymetrix U133A and U133B microarrays:
- the 231 DLBCL samples were subdivided into the following lymphoma types based on gene expression (see below):
- the 16 MALT samples were subdivided into the following four group based on tumor origin:
- Each of the 568 cell samples was given a unique sample ID number consisting of the lymphoma type followed by a unique numerical identifier.
- “ABC_304” refers to an ABC DLBCL sample numbered 304.
- Cells were purified and RNA was isolated from the purified cells according to known methods described in the literature.
- RNA from each sample were applied to Affymetrix U133A and Affymetrix U133B microarrays according to standard Affymetrix protocol.
- the U133A and U133B microarrays are divided into probe sets, with each probe set consisting of up to 69 oligonucleotide probes 25 nucleotides in length. Each probe set represents a distinct human gene. Information pertaining to these microarrays is available at www.affymetrix.com.
- Each microarray was scanned using an Affymetrix scanner, which records signal intensity for every probe on the microarray.
- This information can be transformed into summary signal values for each probe set using a number of different algorithms, including MAS 5.0, D-chip (Li 2001), or Bioconductor's RMA algorithms (Irizarry 2003).
- the images produced by the scanner were evaluated by Affymetrix MAS 5.0 software.
- the signal value for each probe on the U133A and U133B microarrays was normalized to a target value of 500, and the base-2 log of the normalized values was used for the following analyses.
- Log-signal files were statistically analyzed using S+ software and the following S+ subtype predictor script: Although the log-signal values were analyzed using S+ software and the above algorithm, any effective software/algorithm combination may be used.
- Example 2 Collection of gene expression data using the novel Lymph Dx microarray :
- the novel Lymph Dx microarray contains cDNA probes corresponding to approximately 2,734 genes, 174 of these are "housekeeping" genes present for quality control, since they represent genes that are most variably expressed across all lymphoma samples. Other genes represented on the microarray were selected for their utility in identifying particular lymphoma samples and predicting survival in those samples.
- the genes represented on the Lymph Dx microarray can be divided into four broad categories: 1,101 lymphoma predictor genes identified previously using the Affymetrix U133 microarray, 171 outcome predictor genes identified using the Affymetrix U133 microarray, 167 genes not found on the Affymetrix U133 microarray but represented on the Lymphochip microarray (Alizadeh 1999), and 1,121 named genes.
- BL_2032_52748 refers to a Burkitt lymphoma sample with the numerical identifier 2032_52748.
- Cells were purified and RNA was isolated from the purified cells according to known methods described in the literature.
- RNA from each sample was applied to the Lymph Dx microarrays according to standard Affymetrix microarray protocol.
- Each microarray was scanned on an Affymetrix scanner. This scanner produced an image of the microarray, which was then evaluated by Affymetrix MAS 5.0 software.
- the signal intensity for each probe on the microarray can be transformed into summary signal values for each probe set through a number of different algorithms, including but not limited to MAS 5.0, D-chip (Li 2001), or Bioconductor's RMA algorithms (Irizarry 2003),
- Example 3 Development of a first FL survival predictor using gene expression data from Affymetrix U133A and U133B microarrays:
- Survival Signature Analysis begins by identifying genes whose expression patterns are statistically associated with survival. A hierarchical clustering algorithm is then used to identify subsets of these genes with correlated expression patterns across the lymphoma samples. These subsets are operationally defined as "survival-associated signatures.” Evaluating a limited number of survival-associated signatures mitigates the multiple comparison problems that are inherent in the use of large-scale gene expression data sets to create statistical models of survival (Ransohoff 2004).
- FL samples were divided into two equivalent groups: a training set (95 samples) for developing the survival prediction model, and a validation set (96 samples) for evaluating the reproducibility of the model.
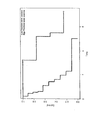
- the overall survival of this cohort is depicted in Figure 3 .
- the median age at diagnosis was 51 years (ranging from 23 to 81 years), and the patients had a median follow-up of 6.6 years (8.1 years for survivors, with a range of ⁇ 1 to 28.2 years).
- Gene expression data from Affymetrix U133A and U133B microarrays was obtained for each sample.
- a Cox proportional hazards model was used to identify "survival predictor" genes, which were genes whose expression levels were, associated with long survival (good prognosis genes) or short survival (poor prognosis genes).
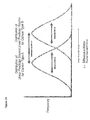
- a hierarchical clustering algorithm (Eisen 1998) was used to identify gene expression signatures within the good and poor prognosis genes according to their expression pattern across all samples. Ten gene expression signatures were observed within either the good prognosis or poor prognosis gene sets ( Figure 4 ). The expression level of every component gene in each of these ten gene expression signatures was averaged to create a gene expression signature value.
- the immune response-1 gene expression signature included genes encoding T cell markers (e.g., CD7, CD8B1, ITK, LEF1, STAT4) and genes that are highly expressed in macrophages (e.g., ACTN1, TNFSF13B).
- the immune response-1 signature is not merely a surrogate for the number of T cells in the FL biopsy sample because many other standard T cell genes (e.g., CD2, CD4, LAT, TRIM, SH2D1A) were not associated with survival.
- the immune response-2 gene expression signature included genes known to be preferentially expressed in macrophages and/or dendritic cells (e.g., TLR5, FCGR1A, SEPT10, LGMN, C3AR1). Table 4 lists the genes that were used to generate the gene expression signature values for the immune response-1 and immune response-2 signatures.
- the binary model formed by combining the two was more predictive of survival in the training set than any other binary model (p ⁇ .001).
- the immune response-1 and immune response-2 gene expression signatures contributed to the predictive power of the model in both the training set and the validation set.
- survival predictor score 2.71 * immune response - 2 gene expression signature value - 2.36 ⁇ immune response - 1 gene expression signature value .
- the two-signature model was associated with survival in a statistically significant fashion in both the training set (p ⁇ 0,001) and the validation set (p ⁇ 0.001), which demonstrated that the model was reproducible.
- the survival predictor score had a mean of 1.6 and a standard deviation of 0.894, with each unit increase in the predictor score corresponding to a 2.5 fold increase in the relative risk of death. Data for all 191 samples is shown in Table 6.
- Prognostic Index 4 Scores 0-1 63.1 47.5 N/A 0.029 2.28 (1.46- 3.57) ⁇ 0.001 Scores 2-3 33.3 45 2.07 (1.07- 4.00) Scores 4-5 3.6 7.5 3.73 (1.18- 11.18) 1 Due to rounding, percentages may not total 100 2 Relative risk of death (RR) based on 2-fold increase in expression 3 RR for grades 2 and 3 calculated with respect to risk of death for grade 1. The p-value is calculated for all grades. 4 RR for scores 2-3 and 4-5 calculated with respect to risk of death for scores 0-1. The p-value is calculated for all grades.
- the samples in the validation set were divided into three groups based on their IPI score, and the relationship between survival and IPI score was visualized by Kaplan-Meier plot ( Figure 6 ).
- the gene-expression-based survival predictor could stratify patients into groups differing by more than 5 years with regards to median survival ( Figure 7 ).
- the high-risk IPI group (IPI 4-5) comprised less than 5% of the samples, and was omitted from this analysis.
- Example 4 Development of a second FL survival predictor using gene expression data from Affymetrix U133A and U133B microarrays :
- 191 FL were divided into two equivalent groups: a training set (95 samples) for developing the survival prediction model, and a validation set (96 samples) for evaluating the reproducibility of the model.
- Gene expression data from Affymetrix U133A and U133B microarrays was obtained for each of the samples.
- a Cox proportional hazards model was used to identify survival predictor genes whose expression levels were associated with long survival (good prognosis genes) or short survival (poor prognosis genes) in the training set.
- a positive Cox coefficient indicated increasing mortality with increasing expression of the gene, while a negative Cox coefficient indicated decreasing mortality with increasing expression of the gene.
- a hierarchical clustering algorithm (Eisen 1998) was used to identify gene expression signatures within the good and poor prognosis genes according to their expression pattern across all samples. Eight clusters of coordinately regulated genes were observed within the good prognosis gene set and six clusters were observed in the poor prognosis gene sets. The expression level of every component gene in each of these gene expression signatures was averaged to create a gene expression signature value, After averaging, only ten of the gene expression signatures were found to be significantly associated with survival in the training set (p ⁇ 0.01). To create a multivariate model of survival, different combinations of these ten gene expression signature averages were generated and evaluated for their ability to predict survival within the training set.
- T-cell and macrophage based on the biological function of certain genes within each signature.
- the T-cell gene expression signature included genes that were typically expressed in T-cells, while the macrophage gene expression signature included a number of genes typically expressed in macrophages.
- these two signatures taken individually were not the best predictors of survival, the binary model formed by combining the two was more predictive than any combination of three signatures that did not contain these two signatures. Using these two signatures as an anchor, other signatures were added to the model using a step up procedure (Drapner 1966).
- the B-cell differentiation signature included a number of genes that appear to be involved in B-cell signal transduction. Table 9 lists the genes that were used to generate the gene expression signature values for the T-cell, macrophage, and B-cell differentiation gene expression signatures. Table 9 Signature UNIQID Unigene ID Build 167 (http://www.ncbi.nlm.
- Survival predictor score [ 2.053 * ( macrophage gene expression signature value ) ] - 2.344 * T - cell gene expression signature value - 0.729 * B - cell differentiation gene expression signature value .
- Example 5 Development of a third FL survival predictor using gene expression data from the Lymph Dx microarray :
- 191 FL samples were divided into two equivalent groups: a training set for developing the survival prediction model, and a validation set for evaluating the reproducibility of the model.
- Example 6 Development of a first DLBCL survival predictor using gene expression data from Affymetrix U133A and U133B microarrays:
- Genes that were significantly correlated with survival were grouped into gene expression signatures using a hierarchical clustering algorithm. The expression level of every component gene in each of these gene expression signatures was averaged for each sample to create a gene expression signature value.
- a step-up procedure (Drapner 1966) was applied to determine the optimal number of gene signatures to use In the survival predictor model. First, the gene expression signature that was most significantly associated with survival was included in the model. Next, the gene expression signature with the second highest association with survival was added to the model to form a two-component model. This procedure was repeated until there was no gene expression signature to add to the model with a p-value of ⁇ 0.05.
- the final prediction model Incorporated gene expression signature values from three gene expression signatures.
- the first gene expression signature added to the model was termed “ABC DLBCL high,” because it included genes that were more highly expressed in ABC than in GCB (Rosenwald 2002).
- the second gene expression signature added to the model was termed “lymph node,” because it reflected the response of non-tumor cells in the lymph node to the malignant lymphoma cells.
- the final gene expression signature added to the model was termed "MHC class II,” because it included all of the genes encoding the MHC class II alpha and beta chains. Table 14 shows the genes that were averaged to form each of these signatures.
- Survival predictor score 0.586 * ABC DLBCL high gene expression signature value - [ 0.468 * ( lymph node gene expression signature value ) ] - 0.336 * MHC Class II gene expression signature value .
- Example 7 Development of a second DLBCL survival predictor using gene expression data from the Lymph Dx microarray :
- DLBCL survival model based on gene expression had been developed previously using proliferation, germinal center B-cell, lymph node, and MHC class II gene expression signatures and the expression of the single gene BMP-6 (Rosenwald 2002). BMP-6 expression was poorly measured on the Lymph Dx microarray, but genes associated with each of these four gene expression signatures exhibited associations with survival similar to those observed using Lymphochip microarrays. DLBCL samples were divided into two groups: a training set (100 samples) for developing the survival prediction model, and a validation set (100 samples) for evaluating the reproducibility of the model. Gene expressed in the training set samples were clustered, and lymph node, germinal center B-cell, MHC class II, and proliferation gene expression signatures were identified.
- Table 17 lists p-values for the association of each signature with survival in the training set, the validation set, and overall.
- Table 17 Signature Training set Validation set Overall Lymph node 4.0 x 10 -5 2.3 x 10 -6 6.8 x 10 -10 Proliferation 8.1 x 10 -5 3.4 x 10 -3 2.1 x 10 -6 Germinal center B-cell 6.2 x 10 -6 2.1 x 10 -3 5.0 x 10 -8 MHC class II 2.4 x 10 -2 2.7 x 10 -3 3.1 x 10 -4
- Survival predictor score - 0.4337 * lymph node gene expression signature value + 0.09 * proliferation gene expression signature value - 0.4144 * germinal center B - cell gene expression signature value - 0.2006 * MHC class II gene expression signature value .
- the survival predictor score had a mean of 5.7 and a standard deviation of 0.78, with each unit increase in the predictor score corresponding to an approximately 2.7 fold increase in the relative risk of death. Data for all 200 samples is presented in Table 18.
- Example 8 Development of a third DLBCL survival predictor using gene expression data from the Lymph Dx microarray :
- the number of genes used to generate the DLBCL survival predictor in Example 7 were reduced in order to create a survival predictor compatible with RT-PCR.
- the list of genes from the lymph node and germinal center B-cell gene expression signatures was narrowed to those three genes from each signature that were most closely correlated with the lymph node and germinal center B-cell gene expression signature values, respectively.
- the genes from the proliferation gene expression signature did not add significantly to the reduced gene survival prediction model, so they were removed entirely.
- the expression of the genes within each signature was averaged on the log 2 scale to generate a gene expression signature value for each signature. Table 19 lists the genes that were used to generate these gene expression signature values.
- Table 20 lists p-values for the association of each signature with survival in the training set, the validation set, and overall.
- Table 20 Signature Training set Validation set Overall Lymph node 6.1 x 10 -6 0.0021 2.1 x 10 -17 Germinal center B-cell 3.5 x 10 -4 0.0099 2.7 x 10 -5 MHC class II 0.024 0.0026 0.00031
- Survival predictor score - 0.32 * lymph node gene expression signature value - [ 0.176 * ( germinal center B - cell gene expression signature value ) ] - 0.206 * MHC class II gene expression signature value .
- the survival predictor score had a mean of 6.54 and a standard deviation of 0.69, with each unit increase in the predictor score corresponding to an approximately 2.7 fold increase in the relative risk of death. Data for all 200 samples is presented in Table 21.
- Example 9 Development of an MCL survival predictor using gene expression data from Affymetrix U133A and U133B microarrays:
- survival predictor score 1.66 * proliferation gene expression signature value .
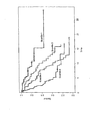
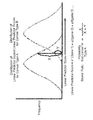
- the 21 MCL samples were divided into two equivalent groups based on their survival predictor scores. Those samples with survival predictor scores above the median were placed in the high proliferation group, while those with survival predictor scores below the median were placed in the low proliferation group.
- Figure 13 illustrates the Kaplan Meier survival estimates for these two groups, Median survival for the high proliferation group was 1.07 years, while median survival for the low proliferation group was 5.18 years.
- Example 10 Development of an MCL survival predictor using gene expression data from the Lymph Dx microarray :
- the 21 MCL samples were divided into two equivalent groups based on their survival predictor scores. Those samples with survival predictor scores above the median were placed in the high proliferation group, while those with survival predictor scores below the median were placed in the low proliferation group.
- Figure 14 illustrates the Kaplan Meier survival estimates for these two groups.
- Example 11 Identification of lymphoma samples as MCL based on Bayesian analysis of gene expression data from Affymetrix U133A and U133B microarrays:
- a statistical method based on Bayesian analysis was developed to distinguish MCL samples from samples belonging to other lymphoma types based on gene expression profiling. This method was developed using the gene expression data obtained in Example 1 for the following lymphoma types: ABC, GCB, PMBL, BL, FH, FL, MALT, MCL, PTLD, SLL, and splenic marginal zone lymphoma (splenic).
- Each predictor model calculates the probability that the sample belongs to a first lymphoma type rather than a second lymphoma type.
- a method was developed to determine whether a sample was MCL, or one of the following lymphoma types: ABC, BL, FH, FL, GCB, MALT, PMBL, PTLD, SLL, or splenic. This method required ten different predictor models, each designed to determine whether the sample belonged to MCL or one of the other ten lymphoma types (e.g., MCL vs. ABC, MCL vs. BL, etc.).
- lymphoma samples analyzed displayed a tendency towards elevated or reduced expression of genes from the lymph node and proliferation gene expression signatures. These genes are likely to be highly differentially expressed between the lymphoma types, but they do not serve as good predictor genes because they are often variably expressed within a single lymphoma type. For this reason, any gene that displayed a correlation with the proliferation or lymph node signatures was eliminated from consideration.
- LPS linear predictor score
- type 1 is MCL
- type 2 is one of the other nine lymphoma types
- ⁇ ( x ; ⁇ , ⁇ ) is the normal density function with mean ⁇ and standard deviation ⁇
- ⁇ 1 and ⁇ 1 are the sample mean and variance of the LPS values for lymphoma type 1
- ⁇ 2 and ⁇ 2 are the sample mean and variance of the LPS values for lymphoma type 2.
- This method was used to develop ten predictor models, one for each pairing of MCL and a second lymphoma type.
- a sample was classified as MCL if each of the ten predictors generated at least a 90% probability that the sample was MCL. If any of the ten predictors indicated a probability of less than 90%, the sample was classified as non-MCL.
- Table 26 MCL vs. ABC predictor genes UNIQID Gene name Scale Factor 1103711 Homo sapiens cDNA FLJ11833 fis, clone HEMBA1008579.
- Example 12 Identification of lymphoma samples as MCL based on Bayesian analysis of gene expression data from a Lymphochip microarray:
- Lymphoma samples with morphology consistent with MCL were identified by pathological review. Since t(11;14) translocation and cyclin D1 overexpression have been consistently associated with MAL, cyclin D1 mRNA levels were measured in each sample by quantitative RT-PCR. Of the 101 samples analyzed, 92 expressed cyclin D1 mRNA. These 92 samples, which were deemed the "core group" of MCLs, were divided into a training set and a validation set. Gene expression was measured in all 101 samples using a Lymphochip microarray (Alizadeh 1999). For comparison, gene expression was measured in 20 samples identified as SLL.
- MCL expression data was compared to expression data obtained previously for GCB (134 cases) and ABC (83 cases) (Rosenwald 2002).
- Several thousand genes were differentially expressed between cyclin D1-posltive MCL and the other lymphoma types with high statistical significance (p ⁇ 0.001). A complete listing of these genes is available at http://llmpp.nih.gov/MCl.
- MCL vs. SLL Three different binary predictor models were developed: MCL vs. SLL, MCL vs. GCB, and MCL vs. ABC. Each of these models was designed to calculate the probability that a sample was MCL rather than the other iymphoma type in the pair. For each pair, the genes that were most differentially expressed between MCL and the other lymphoma type in the pair were identified, and the difference in expression between the lymphoma types was quantified using a Student's t-test.
- LPS X ⁇ j ⁇ G t j ⁇ X j , where X j is the expression of gene j in sample X and t j is the t-statistic for the difference in expression of gene j between the two lymphoma types in the pair. Cyclin D1 was excluded from the calculation of LPS so that the model could be used to identify potential MCL cases that were cyclin D1 negative.
- ⁇ ( x ; ⁇ , ⁇ ) is the normal density function with mean ⁇ and standard deviation ⁇
- ⁇ MCL and ⁇ MCL are the sample mean and variance of the LPS values for MCL
- ⁇ 2 and ⁇ 2 are the sample mean and variance of the LPS values for the second lymphoma type of the pair.
- a cut-off point of 90% was selected for assigning a sample to a particular lymphoma type. Every sample in the training set were classified correctly using this model ( Figure 16 ). When applied to the validation set, the model correctly classified 98% of the cyclin D1-positive MCL cases as MCL ( Figure 16 ).
- This diagnostic test was applied to nine lymphoma cases that were morphologically consistent with MCL, but negative for cyclin D1 expression. Seven of these samples were classified as MCL, one was classified as GCB, and one was not assigned to any lymphoma type because none of the pairs generated a probability of 90% or greater.
- Example 13 Classification of DLBCL samples based on Bayesian analysis of gene expression data from the Lymphochip microarray:
- a statistical method to classify DLBCL samples based on Bayesian analysis was developed using gene expression data obtained using the Lymphochip cDNA microarray ((Rosenwald 2002). This data is available at http://llmpp.nih.gov/DLBCL. The data was divided into two sets: a training set used to create and optimize the prediction model, and a validation set to evaluate the performance of the model.
- the training set consisted of 42 ABC DLBCL samples and 67 GCB DLBCL samples
- the validation set consisted of 41 ABC DLBCL samples, 67 GCB DLBCL samples, and 57 type 3 DLBCL samples (Shipp 2002).
- LPS X ⁇ j t j ⁇ X j
- X j represents the expression level of gene j
- t j is a scaling factor whose value depends on the difference in expression of gene j between the two lymphoma types.
- the scaling factor used in this example was the t-statistic generated by a t test of the difference in gene j expression between two lymphoma types. Only those genes with the largest t-statistics were included when calculating the LPS for each sample. The list of genes used to generate the LPS was narrowed further by including only those genes that were most variably expressed within the training set.
- the LPS is a linear combination of gene expression values
- its distribution within each lymphoma type should be approximately normal, provided that it includes a sufficient number of genes and the correlation structure of those genes is not extreme.
- the mean and variance of these normal distributions within a lymphoma type can then be estimated from the combined LPS's of all samples within the type.
- the LPS distribution of two lymphoma types can be used to estimate the probability that a new sample belongs to one of the types using Bayes' rule.
- Example 14 Classification of DLBCL samples based on Bayesian analysis of gene expression data from the Affymetrix HU6800 microarray:
- Example 13 The prediction method described in Example 13 above was applied to gene expression data from 58 DLBCL samples obtained using an Affymetrix HU 6800 oligonucleotide microarray (Shipp 2002). This data is available at www.genome.wi.mit.edu/MPR/lymphoma. The first step in analyzing this data was to exclude all microarray features with a median signal value of ⁇ 200 across the samples. Multiple microarray features representing the same gene were then averaged. Of the 27 genes in the DLBCL subtype predictor developed using the Lymphochip data (above), only 14 were represented on the Affymetrix array and passed this filtering process. These 14 genes are listed in Table 39.
- Example 15 Identification of DLBCL samples as PMBL based on Bayesian analysis of gene expression data from the Lymphochip microarray:
- lymphoma biopsy samples identified as DLBCL by a panel of hematopathologists were divided into a 36 sample training set and a 274 sample validation set, with the validation set consisting of the DLBCL samples classified previously in Example 13. All patients from whom the samples were derived had been treated with anthracycline-containing multiagent chemotherapy protocols, with some patients additionally receiving radiation therapy.
- the training set was profiled for gene expression using Lymphochip microarrays comprising 15,133 cDNA elements as described previously (Alizadeh 2000). This data is available at http://llmpp.nih.gov/PMBL.
- the validation set had previously been profiled using Lymphochip microarrays comprising 12,196 cDNA elements (Rosenwald 2002).
- a hierarchical clustering algorithm (Eisen 1998) was used to organize the genes by their expression patterns across the 36 samples in the training set.
- This cluster of genes included two genes, MAL and FIG1 , previously shown to be highly expressed in PMBL (Copie-Bergman 2002; Copie-Bergman 2003).
- Several of the lymphomas with mediastinal involvement did not express this set of putative PMBL signature genes, and it was suspected that these samples were more likely to be conventional DLBCL than PMBL.
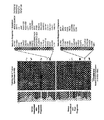
- Hierarchical clustering was used to organize the samples according to their expression of the PMBL signature genes, resulting in two major clusters of cases ( Figure 20B ).
- One cluster contained 21 samples designated "PMBL core” samples by virtue of their higher expression of PMBL signature genes.
- the other cluster contained some samples that had virtually no expression of these genes, and other samples that did express these genes but at lower levels than the PMBL core samples.
- a gene expression-based method for distinguishing PMBL core cases from GCB and ABC DLBCL cases based on Bayesian analysis was developed using the methods described in Examples 13 and 14.
- a set of genes were selected that were differentially expressed between the PMBL core samples and both GCB and ABC (p ⁇ 0.001).
- This set of genes included all of the PMBL signature genes identified by hierarchical clustering ( Figure 20A ), as well as a large number of additional genes. Many of the genes in this set belonged to the lymph node gene expression signature (Alizadeh 2000; Rosenwald 2002). These genes were excluded from the final predictor because they might cause some DLBCL samples with higher expression of lymph node gene expression signature genes to be misclassified as PMBL.
- the list of PMBL distinction genes was refined by adding a requirement that they also be differential expressed between the PMBL core samples and a subgroup of six DLBCL samples with higher expression of lymph node gene expression signature genes (p ⁇ 0.001).
- the resulting set of 46 genes included 35 genes that were more highly expressed in PMBL and 11 genes that were more highly expressed in DLBCL ( Figure 21A ).
- the 46 genes in this set were PDL2, SNFT, IL13RA1, FGFR1, FLJ10420, CCL17/TARC, TNFRSF8/CD30, E2F2, MAL, TNFSF4/OX40 ligand, IL411/ Fig1 , IMAGE:686580, BST2, FLJ31131, FCER2/CD23, SAMSN1, JAK2, FLJ00066, MST1R, TRAF1, SLAM, LY75, TNFRSF6/Fas, FNBP1, TLR7, TNFRSF17/BCMA, CDKN1A/p21CIP1, RGS9, IMAGE:1340506, NFKB2, KIAA0339, ITGAM, IL23A, SPINT2, MEF2A, PFDN5, ZNF141, IMAGE:4154313, IMAGE:825382, DLEU1, ITGAE, SH3BP5, BANK, TCL1A, PRKAR1B, and CARD11.
- a series of linear predictor scores were generated based on the expression of this gene set. Based on the distribution of linear predictor scores within a particular lymphoma type, Bayes' rule can be used to estimate the probability that a particular sample belongs to either of the two types. An arbitrary probability cut-off of 90% or greater was used to classify a sample as a particular lymphoma type. All of the PMBL core samples were classified as PMBL using this method, as were six of the other lymphoma samples with mediastinal involvement. However, nine of the lymphoma samples with mediastinal involvement were classified as a DLBCL, as were all of the GCB and ABC samples.
- PMBL represents a third subgroup of DLBCL than can be distinguished from ABC and GCB by gene expression profiling.
- Table 40 compares the clinical parameters of patients assigned to the PMBL, ABC, and GCB subgroups of DLBCL using this prediction method.
- Table 40 ABC DLBCL GCB DLBCL PMBL Training set PMBL Validation set PMBL All cases
- PMBL patients were significantly younger than other DLBCL patients, with a median age at diagnosis of 33 years compared with a median age of 66 and 61 years for ABC and GCB patients, respectively. Although there was no significant difference in gender distribution among the DLBCL subgroups, young women ( ⁇ 35 years) accounted for 35% of PMBL patients, more than any other DLBCL subgroup. Young men ( ⁇ 35 years) were also more frequently represented in the PMBL subgroup, accounting for 19% of the patients. Correspondingly, older men and women (age >60) were significantly underrepresented in the PMBL subgroup. These clinical characteristics were observed In both the training set and the validation set of PMBL cases, demonstrating that the PMBL predictor reproducibly identified a clinically distinct subgroup of DLBCL patients.
- the PMBL subgroup defined by the PMBL predictor had a relatively favorable overall survival rate after therapy ( Figure 22 ).
- Example 16 Classification of lymphomas into types based on Bayesian analysis of gene expression data from the Lymph Dx microarray:
- a cluster of "proliferation signature” genes and a cluster of "lymph node signature” genes were identified. The expression of these genes was averaged to form a proliferation signature and a lymph node signature.
- Each gene represented on the Lymph Dx microarray was placed into one of three “gene-list categories” based on its correlation with the proliferation or lymph node gene signatures. "Proliferation" genes were defined as those genes for which the correlation between their expression and the proliferation signature was greater than 0.35.
- Lymph node genes were defined as those genes for which the correlation between their expression and the lymph node signature was greater than 0.35.
- the remaining genes on the array were classified as standard genes. This classification resulted in 323 proliferation genes and 375 lymph node genes.
- the samples were divided into five types: FL, MCL, SLL, FH, and a class of aggressive lymphomas that included DLBCL and BL.
- Samples obtained from subjects with other diagnoses e.g., MALT, LPC
- Data from the Lymph Dx microarray was then used to compare gene expression in each possible lymphoma type pair (e.g., FH vs. FL, MCL vs. SLL, etc.). This resulted in the creation of ten "pair-wise models" (one for each possible lymphoma type pair) for predicting whether a sample fell into a particular lymphoma type.
- each lymphoma type pair For each lymphoma type pair, the difference in expression between the two types for every gene on the microarray was calculated, and a t-statistic was generated to represent this difference.
- gene-list category proliferation, lymph node, and standard
- individual genes were ordered based on the absolute value of their t-statistic. Only those genes that displayed a statistically significant difference in expression between the two types were included in the model. Those genes with largest absolute t-statistics in each gene-list category were then used to generate a linear predictor score (LPS) for each sample.
- LPS linear predictor score
- LPS X ⁇ j ⁇ G t j ⁇ X j
- X j is the expression of gene j in the sample
- t j is the t-statistic representing the difference in expression of gene j between the two lymphoma types.
- This formulation of LPS known as the compound covariate predictor, has previously been used successfully (Radmacher 2002; Rosenwald 2003; Wright 2003).
- Other ways to formulate an LPS include Fisher linear discriminant analysis (Dudoit 2002), weighted voting (Golub 1999), linear support vector machines (Ramaswamy 2001), and nearest shrunken centroids (Tibshirani 2002).
- LPS's were calculated for each sample using four different combinations. In the first, LPS was calculated using the standard genes only. In the second, LPS's were calculated for both the standard and proliferation genes, but not the lymph node genes. In the third, LPS's were calculated for both the standard and lymph node genes, but not the proliferation genes. In the fourth, LPS's were calculated using all three gene-list categories.
- each sample could be thought of as a vector in a space of between one and three dimensions. Since the LPSs were sums of individual expressions, it was reasonable to approximate the distributions as normal. Multivariate normal distributions are defined by two quantities: a mean vector, which indicates the average value of each of the models within a given lymphoma type, and a covariance matrix, which indicates the magnitude and orientation spread of points away from this center. Both of these quantities can be estimated empirically from the observed data.
- Figure 24 shows the Standard and Proliferation LPS's for the FL vs. DLBCL/BL pair-wise model. The dotted lines indicate the standard deviations from the fitted multivariate normal distributions.
- Bayes' rule (Bayes 1763) can be used to estimate the probability that a given sample belongs to one lymphoma type or another. Bayesian analysis of an LPS has been successfully employed in the past to distinguish DLBCL subtypes (Rosenwald 2003, Wright 2003).
- LPS(X) is the linear predictor score for sample X
- ⁇ ( x; ⁇ , ⁇ ) is the normal density function with mean ⁇ and standard deviation ⁇
- ⁇ 1 and ⁇ 1 are the mean and variance of the LPS's for the first lymphoma type
- ⁇ 2 and ⁇ 2 are the mean and variance of the LPS's for the second lymphoma type.
- a single probability q value can be developed for each sample and for each of the four LPS combinations. This q value can then be used to classify a sample as a first lymphoma type, a second lymphoma type, or unclassified. Samples with the highest q values are classified as the first lymphoma type, while samples with the lowest q values are classified as the second lymphoma type. Samples with middle range q values are deemed unclassified. Classifying the samples in this manner requires two cut-off points: a lower cut-off point between the second lymphoma type and unclassified, and an upper cut-off point between unclassified and the first lymphoma type.
- the cut-off point would be adjusted to allow an additional error only if this adjustment resulted in four or more unclassified samples becoming correctly classified.
- the final model and cut-off point for a given pair-wise analysis was that which minimized this equation.
- the equation utilizes percentages rather than the actual number of cases in order to account for the different number of samples in each class.
- cut-off point optimality is defined in terms of dividing the data into subtypes, all cut-off points between a pair of borderline cases will be equally optimal.
- values were chosen that would lead to a larger unclassified region.
- a value would be chosen that was 1/5 of the way from the smallest borderline case to the largest.
- a value would be chosen that was 4/5 of the way from the smallest borderline case to the largest.
- Figure 25 illustrates the q -results of optimizing the cut-point for the FL versus DLBCL/BL samples.
- Figure 26 indicates how this choice of cut-off points divided the space of LPS's.
- each pair-wise model will produce one of three possible results: 1) the sample belongs to the first lymphoma type of the pair-wise model, 2) the sample belongs to the second lymphoma type of the pair-wise model, or 3) the sample is unclassified. If each of the n -1 models agrees that the sample belongs to a particular lymphoma type, then the sample is designated as belonging to that type. If the n -1 models do not all agree that the sample belongs to a particular lymphoma type, the sample is designated as unclassified.
- Tables 41 and 42 The results of the leave-one-out predictions are set forth in Tables 41 and 42, below.
- the rows in each table correspond to different sample groups, while the columns indicate the prediction results.
- the standard to which the prediction results were compared in this stage was the diagnoses of a panel of eight expert hematopathologists who used histological morphology and immunohistochemistry to classify the samples.
- Table 41 provides classification results for the five lymphoma types tested (DLBCL/BL, FL, FH, MCL, SLL), while Table 42 provides more specific results for classification of subtypes within these five lymphoma types.
- the results set forth in Table 41 are also summarized in Figure 27 .
- Example 17 Classification of DLBCL/BL samples into subtypes based on Bayesian analysis of gene expression data from the Lymph Dx microarray:
- Example 16 Samples identified as DLBCL/BL in Example 16 were subdivided into four types: ABC, GCB, PMBL, and BL. These samples were then used to generate six pair-wise models using the same procedure described in Example 16. The results of the leave-one-out predictions using these pair-wise models are set forth in Table 43, below. These results are also summarized in Figure 28 . The rows in the table correspond to different sample groups, while the columns indicate the prediction results. In this stage, the ability of the prediction method to identify BL was again measured against the diagnoses of hematopathologists.
- the above classification was implemented using S+ software and the S+ subtype predictor script contained in the file entitled "Subtype_Predictor.txt,” located in the computer program listing appendix contained on CD number 22 of 22.
- This S+ script implements the lymphoma prediction algorithm.
- this script is pasted into an S+ script window and run in a working directory containing the data set files discussed below, it will produce a text file entitled "PredictionResults.txt,” which indicates the results of the predictive algorithm.
- the other files in the computer program listing appendix contain the required data sets, in their required format, for carrying out the lymphoma type identification described above.
- the file entitled “GeneData.txt” contains the gene expression values for each sample analyzed.
- the file entitled “GeneID.txt” contains information about the genes in the GeneData.txt file, and is also included in the working directory when the S+ subtype predictor script is run. This file indicates the UNIQID for each gene, as well as the extent to which the gene is associated with the lymph node and proliferation signatures ("LN.cor” and "pro.cor,” respectively).
- the file entitled “SampleID.txt” contains information about the samples included in the "GeneData.txt” file, specifically the original classification of all the samples. This file is also included in the working directory when the S+ subtype predictor script is run.
- the file entitled “PredictionResults.txt” is an example of the productive output of the prediction algorithm.
- Tables 44-59 indicate for each of the pair wise models the list of genes used, the weight given to each of those genes, the signature with which each gene was associated, the mean values and covariance matrices associated with the subtypes being compared, and the q-value cut-points of the pairwise model.
- Table 44 ABC vs. BL Signature Scale UNIQID Unigene ID Build 167 http://www.ncbi.nlm.
- ABC activated B-cell-like diffuse large B cell lymphoma
- BL Burkitt lymphoma
- CHOP cyclophosphamide, doxorubicine, vincristine, and prednisone
- Cl confidence interval
- CNS central nervous system
- DLBCL diffuse large B-cell lymphoma
- ECOG Eastern Cooperative Oncology Group
- EST expressed sequence tag
- FACS fluorescence-activated cell sorting
- FH follicular hyperplasia
- FL follicular lymphoma
- GCB germinal center B-cell-like diffuse large B cell lymphoma
- IPI International Prognostic Index
- LPC lymphoplasmacytic lymphoma
- LPS linear predictor score
- MALT mucosa-associated lymphoid tissue lymphomas
- MCL mantle cell lymphoma
- MHC major histocompatibility complex
- NA not available
- NK natural killer
- NMZ NMZ
Abstract
Description
- The present utility application claims priority to provisional patent application
U.S. Serial No. 60/500,377 (Staudt et al.), filed September 3, 2003 - The present invention relates to the field of diagnosing, identifying, and predicting survival in lymphoproliferative disorders.
- A variety of systems for identifying and classifying lymphomas have been proposed over the last 20 years. In the 1980's, the Working Formulation was introduced as a method of classifying lymphomas based on morphological and clinical characteristics. In the 1990's, the Revised European-American Lymphoma (REAL) system was introduced in an attempt to take into account immunophenotypic and genetic characteristics in classifying lymphomas (Harris 1994). The most recent standard, set forth by the World Health Organization (WHO), attempts to build on these previous systems (Jaffe 2001). The WHO classification of lymphomas is based on several factors, including tumor morphology, immunophenotype, recurrent genetic abnormalities, and clinical features. Table 1, below, contains a list of the B and T cell neoplasms that have been recognized by the WHO classification. Each malignancy is listed according to its WHO classification nomenclature, followed by a WHO classification number.
Table 1 B-cell neoplasms Category Name WHO ID # Precursor B-cell neoplasms Precursor B-cell lymphoblastic leukemia 9835/3 Precursor B-cell lymphoblastic lymphoma 9728/3 Mature B-cell neoplasms Chronic lymphocytic leukemla 9823/3 Small lymphocytic lymphoma 9670/3 B-cell prolymphocytic leukemia 9833/3 Lymphopiasmacytic lymphoma 9671/3 Splenic marginal zone lymphoma 9689/3 Hairy cell leukemia 9940/3 Plasma cell myeloma 9732/3 Solitary plasmacytoma of bone 9731/3 Extraosseous plasmacytoma 9734/3 Extranodal marginal zone B-cell lymphoma of mucosa-associated lymphoid tissue (MALT lymphoma) 9699/3 Nodal marginal zone B-cell lymphoma 9699/3 Follicular lymphoma ( Grade 9690/3 Mantle cell lymphoma 9673/3 Diffuse large B-cell lymphoma 9680/3 Medlastinal (thymic) large B-cell lymphoma 9679/3 Intravascular large B-cell lymphoma 9680/3 Primary effusion lymphoma 9678/3 Burkitt lymphoma 9687/3 Burkitt leukemia 9826/3 B-cell proliferations of uncertain malignant potential Lymphomatold granulomatosis 9766/1 Post-transplant lymphoproliferative disorder, polymorphic 9970/1 T-cell and NK-cell neoplasms Precursor T-cell and NK-cell neoplasms Precursor T lymphoblastic leukemia 9837/3 Precursor T lymphoblastic lymphoma 9729/3 Blastic NK-cell lymphoma 9727/3 Mature T-cell and NK-cell neoplasms T-cell prolymphocytic leukemia 9834/3 T-cell large granular lymphocytic leukemia 9831/3 Aggressive NK-cell leukemia 9948/3 Adult T-cell leukemia/lymphoma 9827/3 Extranodal NK-/T-cell lymphoma, nasal type 9719/3 Enteropathy-type T-cell lymphoma 9717/3 Hepatosplenic T-cell lymphoma 9716/3 Subcutaneous panniculitis-like T-cell lymphoma 9708/3 Mycosis fungoides 9700/3 Sezary syndrome (9701/3) 9701/3 Primary cutaneous anaplastic large cell lymphoma (C-ALCL) 9718/3 Peripheral T-cell lymphoma, unspecified 9702/3 Angloimmunoblastic T-cell lymphoma 9705/3 Anaplastic large cell lymphoma 9714/3 T-cell proliferation of uncertain malignant potential Lymphomatold papulosis 9718/3 Hodgkin lymphoma Nodular lymphocyte predominant Hodgkin lymphoma 9659/3 Classical Hodgkin lymphoma 9650/3 Classical Hodgkin lymphoma, nodular sclerosis 9663/3 Classical Hodgkin lymphoma, lymphocyte-rich 9651/3 Classical Hodgkin lymphoma, mixed cellularity 9652/3 Classical Hodgkin lymphoma, lymphocyte depleted 9653/3 - Other diagnoses that have not been given WHO diagnostic numbers include HIV-associated lymphomas, germinal center B cell-like subtype of diffuse large B cell lymphoma, activated B cell-like subtype of diffuse large B-cell lymphoma, follicular hyyperplasia (non-malignant), and infectious mononucleosis (non-malignant).
- Although the WHO classification has proven useful in patient management and treatment, patients assigned to the same WHO diagnostic category often have noticeably different clinical outcomes. In many cases, these different outcomes appear to be due to molecular differences between tumors that cannot be readily observed by analyzing tumor morphology. More precise methods are needed for identifying and classifying lymphomas based on their molecular characteristics.
- Accurate identification of lymphoma type or subtype in a subject suffering from a lymphoproliferative disorder is important for developing an appropriate therapeutic strategy. Previous attempts have been made to identify lymphoma using gene expression data obtained using a microarray. However, there is a need in the art for more accurate and predictive methods of analyzing this gene expression data. In addition, there is a need for more specific and efficient methods of obtaining gene expression data.
- The present invention discloses a novel microarray for obtaining gene expression data to be used in identifying lymphoma types and predicting survival in a subject. The present invention further discloses a variety of methods for analyzing gene expression data obtained from a lymphoma sample, and specific algorithms for predicting survival and clinical outcome in a subject suffering from a lymphoma.
- One embodiment of the present invention provides a composition comprising the set of probes listed in Table 2, located at the end of the Detailed Description section. Preferably, this composition comprises a microarray.
- In another embodiment, the present invention provides a method of generating a survival predictor for a particular lymphoma type. In this method, one or more biopsy samples that have been diagnosed as belonging to a particular lymphoma type are obtained. Gene expression data is obtained for these samples, and genes with expression patterns associated with longer or shorter survival are identified. Hierarchical clustering is performed to group these genes into gene expression signatures, and the expression of all genes within each signature are averaged to obtain a gene expression signature value for each signature. These gene expression signature values are then used to generate a multivariate survival predictor.
- In another embodiment, the present invention provides a method for predicting survival in a follicular lymphoma (FL) subject, In this method, a biopsy sample is obtained from the subject and gene expression data is obtained from the biopsy sample. The expression level of those genes belonging to an immune response-1 or immune response-2 gene expression signature are averaged to generate gene expression signature values for each signature. A survival predictor score is then calculated using an equation: [2.71*(immune response-2 gene expression signature value)] - [2.36*(immune response-1 gene expression signature value)]. A higher survival predictor score is associated with a less favorable outcome. In one embodiment, the gene expression data used in this method is obtained using a microarray.
- In another embodiment, the present invention provides another method for predicting survival in a follicular lymphoma (FL) subject. In this method, a biopsy sample is obtained from the subject and gene expression data is obtained from the biopsy sample. The expression level of those genes belonging to a B cell differentiation, T-cell, or macrophage gene expression signature are averaged to generate gene expression signature values for each signature. A survival predictor score is then calculated using an equation: [2.053*(macrophage gene expression signature value)] - [2.344*(T-cell gene expression signature value)] - [0.729*(B-cell gene expression signature value)]. A higher survival predictor score is associated with a less favorable outcome, In one embodiment, the gene expression data used in this method is obtained using a microarray.
- In another embodiment, the present invention provides yet another method for predicting survival in a follicular lymphoma (FL) subject. In this method, a biopsy sample is obtained from the subject and gene expression data is obtained from the biopsy sample. The expression level of those genes belonging to a macrophage, T-cell, or B-cell differentiation gene expression signature are averaged to generate gene expression signature values for each signature. A survival predictor score is then calculated using an equation: [1.51*(macrophage gene expression signature value)]- [2.11*(T-cell gene expression signature value)] - [0.505*(B-cell differentiation gene expression signature value)]. A higher survival predictor score is associated with a less favorable outcome. In one embodiment, the gene expression data used in this method is obtained using a microarray.
- In another embodiment, the present invention provides a method for predicting survival in a diffuse large B cell lymphoma (DLBCL) subject. In this method, a biopsy sample is obtained from the subject and gene expression data is obtained from the biopsy sample. The expression level of those genes belonging to an ABC DLBCL high, lymph node, or MHC class II gene expression signature are averaged to generate gene expression signature values for each signature. A survival predictor score is then calculated using an equation: [0,586*(ABC DLBCL high gene expression signature value)]- [0.468*(lymph node gene expression signature value)] - [0.336*(MHC class II gene expression signature value)]. A higher survival predictor score is associated with a less favorable outcome. In one embodiment, the gene expression data used in this method is obtained using a microarray.
- In another embodiment, the present invention provides another method for predicting survival in a diffuse large B cell lymphoma (DLBCL) subject. In this method, a biopsy sample is obtained from the subject and gene expression data is obtained from the biopsy sample. The expression level of those genes belonging to a lymph node, germinal B cell, proliferation, or MHC class II gene expression signature are averaged to generate gene expression signature values for each signature. A survival predictor score is then calculated using an equation: [-0.4337*(lymph node gene expression signature)] + [0,09*(proliferation gene expression signature)]- [0.4144*(germinal center B-cell gene expression signature)] - [0.2006*(MHC class II gene expression signature)]. A higher survival predictor score is associated with a less favorable outcome. In one embodiment, the gene expression data used in this method is obtained using a microarray.
- In another embodiment, the present invention provides yet another method for predicting survival in a diffuse large B cell lymphoma (DLBCL) subject. In this method, a biopsy sample is obtained from the subject and gene expression data is obtained from the biopsy sample. The expression level of those genes belonging to a lymph node, germinal B cell, or MHC class Il gene expression signature are averaged to generate gene expression signature values for each signature. A survival predictor score is then calculated using an equation: [-0.32*(lymph node gene expression signature)]- [0.176*(germinal B cell gene expression signature)]-[0,206*(MHC class II gene expression signature)]. A higher survival predictor score is associated with a less favorable outcome. In one embodiment, the gene expression data used in this method is obtained using a microarray. In another embodiment, the gene expression data is obtained using RT-PCR.
- In another embodiment, the present invention provides a method for predicting survival in a mantle cell lymphoma (MCL) subject. In this method, a biopsy sample is obtained from the subject and gene expression data is obtained from the biopsy sample. The expression level of those genes belonging to a proliferation gene expression signature are averaged to generate a gene expression signature value. A survival predictor score is then calculated using an equation: [1.66*(proliferation gene expression signature value)]. A higher survival predictor score is associated with a less favorable outcome. In one embodiment, the gene expression data used in this method is obtained using a microarray.
- In another embodiment, the present invention provides a method for determining the probability that a sample X belongs to a first lymphoma type or a second lymphoma type. In this method, a set of genes is identified that is differentially expressed between the two lymphoma types in question, and a set of scale factors representing the difference in expression between the lymphoma types for each of these genes are calculated. A series of linear predictor scores are generated for samples belonging to either of the two lymphoma types based on expression of these genes. Gene expression data is then obtained for sample X, and a linear predictor score is calculated for this sample. The probability that sample X belongs to the first lymphoma type is calculated using an equation that incorporates the linear predictor score of sample X and the mean and variance of the linear predictor scores for the known samples of either lymphoma type.
- In another embodiment, the present invention provides a method for determining the lymphoma type of a sample X. In this method, a set of genes is identified that is differentially expressed between a first lymphoma type and a second lymphoma type, and a set of scale factors representing the difference in expression of each of these genes between the two lymphoma types are calculated. A series of linear predictor scores are generated for samples belonging to either of the two lymphoma types based on expression of these genes. Gene expression data is then obtained for sample X, and a linear predictor score is calculated for this sample. The probability that sample X belongs to the first lymphoma type is calculated using an equation that incorporates the linear predictor score of sample X and the mean and variance of the linear predictor scores for the known samples of either lymphoma type. This entire process is then repeated with various lymphoma types being substituted for the first lymphoma type, the second lymphoma type, or both.
- In another embodiment, the present invention provides another method for determining the lymphoma type of a sample X. In this method, a series of lymphoma type pairs are created, with each pair consisting of a first lymphoma type and a second lymphoma type. For each type pair, gene expression data is obtained for a set of genes, and a series of scale factors representing the difference in expression of each of these genes between the two lymphoma types are calculated. A subset of z genes with the largest scale factors are identified, and a series of linear predictor scores are generated for samples belonging to either of the two lymphoma types. Linear predictor scores are calculated for anywhere from 1 to z of these genes. The number of genes from 1 to z that results in the largest difference in linear predictor scores between the two lymphoma types is selected, and gene expression data for these genes is obtained for sample X. A linear predictor score is generated for sample X, and the probability that the sample belongs to the first lymphoma type is calculated using an equation that incorporates the linear predictor score for sample X and the mean and variance of the linear predictor scores for the known samples of either lymphoma type.
- In another embodiment, the present invention provides another method for determining the lymphoma type of a sample X. In this method, a series of lymphoma type pairs are created, with each pair consisting of a first lymphoma type and a second lymphoma type. For each type pair, gene expression data is obtained for a set of genes, and a series of scale factors representing the difference in expression of each of these genes between the two lymphoma types are calculated. The set of genes is divided into gene-list categories indicating correlation with a gene expression signature. Within each gene-list category, a subset of z genes with the largest scale factors are identified, and a series of linear predictor scores are generated for samples belonging to either of the two lymphoma types. Linear predictor scores are calculated for anywhere from 1 to z of these genes. The number of genes from 1 to z that results in the largest difference in linear predictor scores between the two lymphoma types is selected, and gene expression data for these genes is obtained for sample X. A linear predictor score is generated for sample X, and the probability q that the sample belongs to the first lymphoma type is calculated using an equation that incorporates the linear predictor score for sample X and the mean and variance of the linear predictor scores for the known samples of either lymphoma type. A high probability q indicates that sample X belongs to the first lymphoma type, a low probability q indicates that sample X belongs to the second lymphoma type, and a middle probability q indicates that sample X belongs to neither lymphoma type, The cut-off point between high, middle, and low probability values is determined by ranking samples of known lymphoma type according to their probability values, then analyzing every possible cut-off point between adjacent samples using the equation: 3,99*[(% of first lymphoma type misidentified as second lymphoma type) + (% of second lymphoma type misidentified as a first lymphoma type)]+ [(% of first lymphoma type identified as belonging to neither lymphoma type) + (% of second lymphoma type identified as belonging to neither lymphoma type)]. The final cut-off points are those that minimize the value of this equation.
-
-
Figure 1 : Method for identifying lymphoma type. Flow chart depicts a general method for identifying lymphoma type using gene expression data. -
Figure 2 : Survival signature analysis. Flow chart depicts method for developing a lymphoma survival predictor based on gene expression patterns. -
Figure 3 : FL survival data. Survival data for 191 subjects diagnosed with FL. Median age at diagnosis was 51 years (ranging from 23 to 81 years), and the subjects had a median follow-up of 6.6 years (8.1 years for survivors, with a range of <1 to 28.2 years). -
Figure 4 : Hierarchical clustering of survival associated genes in FL samples. Each column represents a single FL sample, while each row represents a single gene. Relative gene expression is depicted according to the color scale at the bottom of the figure. The dendrogram to the left indicates the degree to which the expression pattern of each gene is correlated with that of the other genes. The colored bars indicate sets of coordinately regulated genes defined as gene expression signatures. Genes comprising the immune response-1 and immune response-2 gene expression signature are listed on the right. -
Figure 5 : Kaplan-Meier plot of survival in FL samples based on survival predictor scores. 191 FL samples were divided into quartiles based on their survival predictor scores. The survival predictor scores were calculated using the equation: [(2.71*immune response-2 gene expression signature value)]- [(2.36 x immune response-1 gene expression signature value)]. -
Figure 6 : Kaplan-Meier plot of survival in FL samples based on IPI score. 96 FL samples were divided into three groups based on their IPI scores. -
Figure 7 : Kaplan-Meier plot of survival in FL samples with low or high risk IPI scores based on survival predictor scores. 96 FL samples with low risk (left panel) or intermediate risk (right panel) IPI scores were divided into quartiles based on their survival predictor scores. The survival predictor scores were calculated using the equation: [(2.71*immune response-2 gene expression signature value)] - [(2.36 x immune response-1 gene expression signature value)]. -
Figure 8 : Kaplan-Meier plot of survival in FL samples based on survival predictor scores. 191 FL samples were divided into quartiles based on their survival predictor scores. The survival predictor scores were calculated using the equation: [2.053*(macrophage gene expression signature value)]- [2.344*(T-cell gene expression signature value)]- [0.729*(B-cell differentiation gene expression signature value)]. -
Figure 9 : Kaplan-Meier plot of survival in FL samples based on survival predictor scores. 191 FL samples were divided into quartiles based on their survival predictor scores. The survival predictor scores were calculated using the equation: [1.51*(macrophage gene expression signature value)]- [2.11*(T-cell gene expression signature value)]- [0.505*(B-cell differentiation gene expression signature value)]. -
Figure 10 : Kaplan-Meier plot of survival in DLBCL samples based on survival predictor scores. 231 DLBCL samples were divided into quartiles based on their survival predictor scores. The survival predictor scores were calculated using the equation: [0.586*(ABC DLBCL high gene expression signature value)]-[0.468*(lymph node gene expression signature value)]- [(0.336*MHC Class II gene expression signature value)]. -
Figure 11 : Kaplan-Meier plot of survival in DLBCL samples based on survival predictor scores. 200 DLBCL samples were divided into quartiles based on their survival predictor scores. The survival predictor scores were calculated using the equation: [-0.4337*(lymph node gene expression signature value)] + [0.09*(proliferatian gene expression signature value)]- [0.4144*(germinal center B-cell gene expression signature value)]- [0.2006*(MHC class II gene expression signature value)]. -
Figure 12 : Kaplan-Meier plot of survival in DLBCL samples based on survival predictor scores. 200 DLBCL samples were divided into quartiles based on their survival predictor scores. The survival predictor scores were calculated using the equation:[-0.32*(lymph node gene expression signature value)]- [0.176*(germinal center B-cell gene expression signature value)]- [0.206*(MHC class II gene expression signature value)]. -
Figure 13 : Kaplan-Meier plot of survival in MCL samples based on survival predictor scores. 21 MCL samples were divided into two equivalent groups based on their survival predictor scores. The survival predictor scores were calculated using the equation: 1.66*(proliferation gene expression signature value). -
Figure 14 : Kaplan-Meier plot of survival in MCL samples based on survival predictor scores. 21 MCL samples were divided into two equivalent groups based on their survival predictor scores. The survival predictor scores were calculated using the equation: 1.66*(proliferation gene expression signature value). -
Figure 15 : Predicting lymphoma type using Bayesian analysis. Bayes' rule can be used to determine the probability that an unknown sample belongs to a first lymphoma type rather than a second lymphoma type. A linear predictor score is generated for the sample, and the probability that the sample belongs to the first lymphoma type is determined based on the distribution of linear predictor scores within the first and second lymphoma type. -
Figure 16 : Performance of MCL predictor model. Results of the gene-expression based predictor model for MCL are shown for three models (MCL vs. ABC, MCL vs. GCB, MCL vs. SLL). Performance is shown for both the training set and the validation set. - X
Figure 17 : Gene expression-based identification of DLBCL. Expression levels for 27 genes in a subgroup predictor are shown for 274 DLBCL samples. Expression levels are depicted according to the color scale shown at the left. The 14 genes used to predict the DLBCL subgroups in the Affymetrix data set are indicated with asterisks. The probabilities that the DLBCL samples belong to the ABC or GCB subtypes are graphed at the top, and the DLBCL cases are arranged accordingly. Cases belonging to either ABC or GCB with 90% or greater probability are indicated. -
Figure 18 : Performance of DLBCL subtype predictor model. Assignments of DLBCL samples to the ABC or GCB subtypes based on hierarchical clustering vs. the predictor model disclosed herein are compared within the training, validation, and total set of samples. -
Figure 19 : Relationship of gene expression in normal B cell subpopulations to DLBCL subtypes. Relative gene expression in the indicated purified B cell populations is depicted according to the color scale inFigure 17 . The P value of the difference in expression of these genes between the GCB and ABC DLBCL subtypes is shown, and the subtype with the higher expression is shown is indicated (blue, ABC; orange, GCB). A. DLBCL subtype distinction genes that are more highly expressed in germinal center B cells than at other B cell differentiation stages. B. DLBCL subtype distinction genes that are more highly expressed in plasma cells than at other B cell differentiation stages. -
Figure 20 : Identification of a PMBL gene expression signature. A. Hierarchical clustering identified a set of 23 PMBL signature genes that were more highly expressed in most lymphomas with a clinical diagnosis of PMBL than in lymphomas assigned to the GCB or ABC subtypes. Each row presents gene expression measurements from a single Lymphochip microarray feature representing the genes indicated. Each column represents a single lymphoma biopsy sample. Relative gene expression is depicted according to the color scale shown. B. Hierarchical clustering of the lymphoma biopsy samples based on expression of the PMBL signature genes identified in (A). A "core" cluster of lymphoma cases was identified that highly expressed the PMBL signature genes. -
Figure 21 : Development of a gene expression-based molecular diagnosis of PMBL. A. A PMBL predictor was created based on expression of the 46 genes shown. Relative gene expression for each lymphoma biopsy sample is presented according to the color scale shown inFigure 20 . The probability that each sample is PMBL or DLBCL based on gene expression is shown at the top. B. The PMBL predictor was used to classify 274 lymphoma samples as PMBL or DLBCL. Prediction results are summarized on the right, and the relative gene expression for each case that was classified by the predictor as PMBL is shown on the left. Average expression of each gene in samples classified as DLBCL is also shown. The 20 genes listed are those represented on the Lymphochip that were more highly expressed in PMBL than in DLBCL. Not shown are eight genes from the PMBL predictor that were more highly expressed in DLBCL than in PMBL. -
Figure 22 : Clinical characteristics of PMBL patients. Kaplan-Meier plot of overall survival in PMBL, GCB, and ABC patients after chemotherapy. -
Figure 23 : Optimization of gene number in lymphoma predictor. The optimal number of genes for inclusion in the lymphoma type predictor model is that number which generates a maximum t-statistic when comparing the LPS of two samples from different lymphoma types. -
Figure 24 : LPS distribution among FL and DLBCL/BL samples. Standard and proliferation LPSs for FL (x) and DLBCL/BL (+) samples. Dotted lines indicate standard deviations from the fitted multivariate normal distributions. -
Figure 25 : Determination of cut-off points for lymphoma classification. The cut-off points between samples classified as DLBCL/BL, FL, or unclassified were optimized to minimize the number of samples classified as the wrong lymphoma type. The optimal lower cut-off point was at q=0.49, while the optimal upper cut-off point was at q=0.84. -
Figure 26 : Division of LPSs among FL and DLBCL/FL samples. Illustration of how the cut-off points described inFigure 25 divided the space between the LPSs of FL (x) and DLBCL/BL (+) samples. -
Figure 27 : Lymphoma classification results. Results of lymphoma classification based on gene expression. 100% of SLL, MCL, and FH samples were classified correctly, and only 3% of DLBCL/BL and FL samples were classified incorrectly. -
Figure 28 : DLBCL classification results. Results of DLBCL subtype classification based on gene expression. None of the ABC samples were classified as the wrong subtype, while only one of the BL samples was classified incorrectly. Of the GCB and PMBL samples, only 5% and 6%, respectively, were classified incorrectly. - The following description of the invention is merely intended to illustrate various embodiments of the invention. As such, the specific modifications discussed are not to be construed as limitations on the scope of the invention. It will be apparent to one skilled in the art that various equivalents, changes, and modifications may be made without departing from the scope of the invention, and it us understood that such equivalent embodiments are to be included herein.
- Gene expression profiling of a cancer cell or biopsy reflects the molecular phenotype of a cancer at the time of diagnosis. As a consequence, the detailed picture provided by the genomic expression pattern provides the basis for a new systematic classification of cancers and more accurate predictors of survival and response to treatment. The present invention discloses methods for identifying, diagnosing, and/or classifying a lymphoma, lymphoid malignancy, or lymphoproliferative disorder based on its gene expression patterns. The present invention also discloses methods for predicting survival in a subject diagnosed with a particular lymphoma type or subtype using gene expression data. The information obtained using these methods will be useful in evaluating the optimal therapeutic approach to be employed with regards to a particular subject.
- The term "lymphoproliferative disorder" as used herein refers to any tumor of lymphocytes, and may refer to both malignant and benign tumors. The terms "lymphoma" and "lymphoid malignancy" as used herein refer specifically to malignant tumors derived from lymphocytes and lymphoblasts. Examples of lymphomas include, but are not limited to, follicular lymphomas (FL), Burkitt lymphoma (BL), mantle cell lymphoma (MCL), follicular hyperplasia (FH), small cell lymphocytic lymphoma (SLL), mucosa-associated lymphoid tissue lymphoma (MALT), splenic lymphoma, multiple myeloma, lymphoplasmacytic lymphoma, post-transplant lymphoproliferative disorder (PTLD), lymphoblastic lymphoma, nodal marginal zone lymphoma (NMZ), germinal center B cell-like diffuse large B cell lymphoma (GCB), activated B cell-like diffuse large B cell lymphoma (ABC) and primary mediastinal B cell lymphoma (PMBL).
- The phrase "lymphoma type" (or simply "type") as used herein refers to a diagnostic classification of a lymphoma. The phrase may refer to a broad lymphoma class (e.g., DLBCL, FL, MCL, etc.) or to a subtype or subgroup failing within a broad lymphoma class (e.g., GCB DLBCL, ABC DLBCL).
- The phrase "gene expression data" as used herein refers to information regarding the relative or absolute level of expression of a gene or set of genes in a cell or group of cells. The level of expression of a gene may be determined based on the level of RNA, such as mRNA, encoded by the gene. Alternatively, the level of expression may be determined based on the level of a polypeptide or fragment thereof encoded by the gene. "Gene expression data" may be acquired for an individual cell, or for a group of cells such as a tumor or biopsy sample.
- The term "microarray," "array," or "chip" refers to a plurality of nucleic acid probes coupled to the surface of a substrate in different known locations. The substrate is preferably solid. Microarrays have been generally described in the art in, for example,
U.S. Patent Nos. 5,143,854 (Pirrung ),6,424,186 (Fodor ),5,445,934 (Fodor ),5,677,195 (Winkler ),5,744,305 (Fodor ),5,800,992 (Fodor ),6,040,193 (Winkler ), and Fodor et al. 1991. Light-directed, spatially addressable parallel chemical synthesis. Science, 251:767-777. Each of these references is incorporated by reference herein in their entirety. - The term "gene expression signature" or "signature" as used herein refers to a group of coordinately expressed genes. The genes making up this signature may be expressed in a specific cell lineage, stage of differentiation, or during a particular biological response. The genes can reflect biological aspects of the tumors in which they are expressed, such as the cell of origin of the cancer, the nature of the non-malignant cells in the biopsy, and the oncogenic mechanisms responsible for the cancer (Shaffer 2001). Examples of gene expression signatures include lymph node (Shaffer 2001), proliferation (Rosenwald 2002), MHC class II, ABC DLBCL high, B-cell differentiation, T-cell, macrophage, immune response-1, immune response-2, and germinal center B cell.
- The phrase "survival predictor score" as used herein refers to a score generated by a multivariate model used to predict survival based on gene expression. A subject with a higher survival predictor score is predicted to have poorer survival than a subject with a lower survival predictor score.
- The term "survival" as used herein may refer to the probability or likelihood of a subject surviving for a particular period of time. Alternatively, it may refer to the likely term of survival for a subject, such as expected mean or median survival time for a subject with a particular gene expression pattern.
- The phrase "linear predictor score" or "LPS" as used herein refers to a score that denotes the probability that a sample belongs to a particular lymphoma type. An LPS may be calculated using an equation such as:

where Sj is the expression of gene j from gene set G in a sample S, and tj is a scale factor representing the difference in expression of gene j between a first lymphoma type and a second lymphoma type. Alternatively, a linear predictor score may be generated by other methods including but not limited to linear discriminant analysis (Dudoit 2002), support vector machines (Furey 2000), or shrunken centroids (Tibshirani 2002) - The phrase "scale factor" as used herein refers to a factor that defines the relative difference in expression of a particular gene between two samples. An example of a scale factor is a t-score generated by a Student's t-test.
- The phrase "lymphoma subject," wherein "lymphoma" is a specific lymphoma type (e.g., "follicular lymphoma subject"), may refer to a subject that has been diagnosed with a particular lymphoma by any method known in the art or discussed herein. This phrase may also refer to a subject with a known or suspected predisposition or risk of developing a particular lymphoma type.
- The pattern of expression of a particular gene is closely connected to the biological role and effect of its gene product. For this reason, the systematic study of variations in gene expression provides an alternative approach for linking specific genes with specific diseases and for recognizing heritable gene variations that are important for immune function. For example, alielic differences in the regulatory region of a gene may influence the expression levels of that gene. An appreciation for such quantitative traits in the immune system may help elucidate the genetics of autoimmune diseases and lymphoproliferative disorders.
- Genes that encode components of the same multi-subunit protein complex are often coordinately regulated. Coordinate regulation is also observed among genes whose products function in a common differentiation program or in the same physiological response pathway. Recent application of gene expression profiling to the immune system has shown that lymphocyte differentiation and activation are accompanied by parallel changes in expression among hundreds of genes. Gene expression databases may be used to interpret the pathological changes in gene expression that accompany autoimmunity, immune deficiencies, cancers of immune cells and of normal immune responses.
- Scanning and interpreting large bodies of relative gene expression data is a formidable task. This task is greatly facilitated by algorithms designed to organize the data in a way that highlights systematic features, and by visualization tools that represent the differential expression of each gene as varying intensities and hues of color (Elsen 1998). The development of microarrays, which are capable of generating massive amounts of expression data in a single experiment, has greatly increased the need for faster and more efficient methods of analyzing large-scale expression data sets. In order to effectively utilize microarray gene expression data for the identification and diagnosis of lymphoma and for the prediction of survival in lymphoma patients, new algorithms must be developed to identify important information and convert it to a more manageable format. In addition, the microarrays used to generate this data should be streamlined to incorporate probe sets that are useful for diagnosis and survival prediction. Embodiments of the present invention disclose methods and compositions that address both of these considerations.
- The mathematical analysis of gene expression data is a rapidly evolving science based on a rich mathematics of pattern recognition developed in other contexts (Kohonen 1997). Mathematical analysis of gene expression generally has three goals. First, it may be used to identify groups of genes that are coordinately regulated within a biological system. Second, it may be used to recognize and interpret similarities between biological samples on the basis of similarities In gene expression patterns. Third, it may be used to recognize and identify those features of a gene expression pattern that are related to distinct biological processes or phenotypes.
- Mathematical analysis of gene expression data often begins by establishing the expression pattern for each gene on an array across n experimental samples. The expression pattern of each gene can be represented by a point in n-dimensional space, with each coordinate specified by an expression measurement in one of the n samples (Eisen 1998). A clustering algorithm that uses distance metrics can then be applied to locate clusters of genes in this n-dimensional space. These clusters indicate genes with similar patterns of variation in expression over a series of experiments. Clustering methods that have been applied to microarray data in the past include hierarchical clustering (Eisen 1998), self-organizing maps (SOMs) (Tamayo 1999), k-means (Tavazoie 1999), and deterministic annealing (Alon 1999).
- A variety of different algorithms, each emphasizing distinct orderly features of the data, may be required to glean the maximal biological insight from a set of samples (Alizadeh 1998). One such algorithm, hierarchical clustering, begins by determining the gene expression correlation coefficients for each pair of the n genes studied. Genes with similar gene expression correlation coefficients are grouped next to one another in a hierarchical fashion. Generally, genes with similar expression patterns under a particular set of conditions encode protein products that play related roles in the physiological adaptation to those conditions. Novel genes of unknown function that are clustered with a large group of functionally related genes are likely to participate in the same biological process. Likewise, the other clustering methods mentioned herein may also group genes together that encode proteins with related biological function.
- Gene expression maps may be constructed by organizing the gene expression data from multiple samples using any of the various clustering algorithms outlined herein. The ordered tables of data may then be displayed graphically in a way that allows researchers and clinicians to assimilate both the choreography of gene expression on a broad scale and the fine distinctions in expression of individual genes.
- In such a gene expression map, genes that are clustered together reflect a particular biological function, and are termed gene expression signatures (Shaffer 2001). One general type of gene expression signature includes genes that are characteristically expressed in a particular cell type or at a particular stage of cellular differentiation or activation. Another general type of gene expression signature includes genes that are regulated in their expression by a particular biological process such as proliferation, or by the activity of a particular transcription factor or signaling pathway.
- The pattern of gene expression in a biological sample provides a distinctive and accessible molecular picture of its functional state and identity (DeRisi 1997; Cho 1998; Chu 1998; Holstege 1998; Spellman 1998). Each cell transduces variation in its environment, internal state, and developmental state into readily measured and recognizable variation in gene expression patterns. Two different samples that have related gene expression patterns are therefore likely to be biologically and functionally similar to one another. Some biological processes are reflected by the expression of genes in a gene expression signature, as described above. The expression of gene expression signatures in a particular sample can provide important biological insights regarding its cellular composition and the function of various intracellular pathways within the cells.
- The present invention discloses a variety of gene expression signatures related to the clinical outcome of lymphoma patients. While several of these signatures share a name with a previously disclosed signature, each of the gene expression signatures disclosed herein comprises a novel combination of genes. For example, the lymph node signature disclosed herein includes genes encoding extracellular matrix components and genes that are characteristically expressed In macrophage, NK, and T cells (e.g., α-Actinln, collagen
type III α 1, connective tissue growth factor, fibronectin, KIAA0233, urokinase plasminogen activator). The proliferation signature includes genes that are characteristically expressed by cells that are rapidly multiplying or proliferating (e.g., c-myc, E21G3, NPM3, BMP6). The MHC class II signature includes genes that interact with lymphocytes in order to allow the recognition of foreign antigens (e.g., HLA-DPα, HLA-DQα, HLA-DRα, HLA-DRβ). The immune response-1 signature includes genes encoding T cell markers (e.g., CD7, CD8B1, ITK, LEF1, STAT4), as well as genes that are highly expressed in macrophages (e.g., ACTN1, TNFSF13B). The immune response-2 signature includes genes known to be preferentially expressed in macrophages and/or dendritic cells (e.g., TLR5, FCGR1A, SEPT10, LGMN, C3AR1). The germinal center B cell signature includes genes known to be overexpressed at this stage of B cell differentiation (e.g., MME, MEF2C, BCL6, LMO2, PRSPAP2, MBD4, EBF, MYBL1. - Databases of gene expression signatures have proven quite useful in elucidating the complex gene expression patterns of various cancers. For example, expression of genes from the germinal center B-cell signature in a lymphoma biopsy suggests that the lymphoma is derived from this stage of B cell differentiation. I n the same lymphoma biopsy, the expression of genes from the T cell signature can be used to estimate the degree of infiltration of the tumor by host T cells, while the expression of genes from the proliferation signature can be used to quantitate the tumor cell proliferation rate. In this manner, gene expression signatures provide an "executive summary" of the biological properties of a tumor specimen. Gene expression signatures can also be helpful in interpreting the results of a supervised analysis of gene expression data. Supervised analysis generates a long list of genes with expression patterns that are correlated with survival. Gene expression signatures can be useful in assigning these "predictive" genes to functional categories. In building a multivariate model of survival based on gene expression data, this functional categorization helps to limit the inclusion of multiple genes in the model that measure the same aspect of tumor biology.
- Gene expression profiles can be used to create multivariate models for predicting survival. The methods for creating these models are called "supervised" because they use clinical data to guide the selection of genes to be used in the prognostic classification. For example, a supervised method might identify genes with expression patterns that correlate with the length of overall survival following chemotherapy. The general method used to create a multivariate model for predicting survival may utilize the following steps:
- 1. Identify genes with expression patterns that are univariately associated with a particular clinical outcome using a Cox proportional hazards model. Generally, a univariate p-value of <0.01 is considered the cut-off for significance. These genes are termed "predictor" genes.
- 2. Within a set of predictor genes, identify gene expression signatures.
- 3. For each gene expression signature that is significantly associated with survival, average the expression of the component genes within this signature to generate a gene expression signature value.
- 4. Build a multivariate Cox model of clinical outcome using the gene expression signature values.
- 5. If possible, include additional genes in the model that do not belong to a gene expression signature but which add to the statistical power of the model.
- This approach has been utilized in the present invention to create novel survival prediction models for FL, DLBCL, and MCL. Each of these models generates a survival predictor score, with a higher score being associated with worse clinical outcome. Each of these models may be used separately to predict survival. Alternatively, these models may be used in conjunction with one or more other models, disclosed herein or in other references, to predict survival.
- A first FL survival predictor was generated using gene expression data obtained using Affymetrix U133A and U133B microarrays. This predictor incorporated immune response-1 and immune response-2 gene expression signatures. Fitting the Cox proportional hazards model to the gene expression signature values obtained from these signatures resulted in the following model:

- A second FL survival predictor was generated using gene expression data obtained using Affymetrix U133A and U133B microarrays. This predictor incorporated macrophage, T-cell, and B-cell differentiation gene expression signatures. Fitting the Cox proportional hazards model to the gene expression signature values obtained from these signatures resulted in the following model:

- A third FL survival predictor was generated using gene expression data obtained using the Lymph Dx microarray. This predictor incorporated macrophage, T-cell, and B-cell differentiation gene expression signatures. Fitting the Cox proportional hazards model to the gene expression signature values obtained from these signatures resulted in the following model:

- A first DLBCL survival predictor was generated using gene expression data obtained using Affymetrix U133A and U133B microarrays. This predictor incorporated ABC DLBCL high, lymph node, and MHC class II gene expression signatures. Fitting the Cox proportional hazards model to the gene expression signature values obtained from these signatures resulted in the following model:

- A second DLBCL survival predictor was generated using gene expression data obtained using the Lymph Dx microarray. This predictor incorporated lymph node, proliferation, germinal center B-cell, and MHC class II gene expression signatures. Fitting the Cox proportional hazards model to the gene expression signature values obtained from these signatures resulted in the following model:

- A third DLBCL survival predictor was generated using gene expression data obtained using the Lymph Dx microarray. This predictor incorporated lymph node, germinal center B cell, and MHC class II gene expression signatures. Fitting the Cox proportional hazards model to the gene expression signature values obtained from these signatures resulted in the following model:


- An MCL survival predictor was generated using gene expression data obtained using Affymetrix U133A, Affymetrix U133B, and Lymph Dx microarrays. This predictor incorporated a proliferation gene expression signature. Fitting the Cox proportional hazards model to the gene expression signature values obtained from these signatures resulted in the following model:

- Gene expression data can also be used to diagnose and identify lymphoma types, In an embodiment of the present invention, a statistical method based on Bayesian analysis was developed to classify lymphoma specimens according to their gene expression profiles. This method does not merely assign a tumor to a particular lymphoma type, but also determines the probability that the tumor belongs to that lymphoma type. Many different methods have been formulated to predict cancer subgroups (Golub 1999; Ramaswamy 2001; Dudoit 2002; Radmacher 2002). These methods assign tumors to one of two subgroups based on expression of a set of differentially expressed genes. However, they do not provide a probability of membership in a subgroup. By contrast, the method disclosed herein used Bayes' rule to estimate this probability, thus allowing one to vary the probability cut-off for assignment of a tumor to a particular subgroup. In tumor types in which unknown additional subgroups may exist, the present method allows samples that do not meet the gene expression criteria of known subgroups to fall into an unclassified group with intermediate probability. A cancer subgroup predictor of the type described herein may be used clinically to provide quantitative diagnostic information for an individual cancer patient. This information can in turn be used to provide a predictor of treatment outcome for a particular cancer patient.
- For any two lymphoma types A and B, there is a set of genes with significantly higher expression in type A than type B, and a set of genes with significantly lower expression In type A than in type B. By observing the expression of these genes in an unknown sample, it is possible to determine to which of the two types the sample belongs. Evaluating the likelihood that a particular sample belongs to one or the other lymphoma type by Bayesian analysis may be done using the following steps:
- 1) Identify those genes that are most differentially expressed between the two lymphoma types. This can be done by selecting those genes with the largest t-statistic between the two lymphoma types. The genes in this step may be subdivided into gene expression signatures in certain cases, with genes from each signature analyzed separately.
- 2) Create a series of linear predictor score (LPS) for samples belonging to either lymphoma type.
- 3) Evaluate the LPS for each sample in a training set, and estimate the distribution of these scores within each lymphoma type according to a normal distribution.
- 4) Use Bayes' rule to evaluate the probability that each subsequent sample belongs to one or the other lymphoma type.
- If only two types of lymphoma are being distinguished, then a single probability score is sufficient to discriminate between the two types. However, if more than two lymphoma types are being distinguished, multiple scores will be needed to highlight specific differences between the types.
- In an embodiment of the present invention, a novel microarray entitled the Lymph Dx microarray was developed for the identification and diagnosis of lymphoma types. The Lymph Dx microarray contains cDNA probes corresponding to approximately 2,653 genes, fewer than the number seen on microarrays that have been used previously for lymphoma diagnosis. The reduced number of probes on the Lymph Dx microarray is the result of eliminating genes that are less useful for the identification of lymphoma types and predicting clinical outcome. This reduction allows for simplified analysis of gene expression data. The genes represented on the Lymph Dx microarray can be divided into four broad categories: 1,101 lymphoma predictor genes identified previously using the Affymetrix U133 microarray, 171 outcome predictor genes, 167 new genes not found on the Affymetrix U133 microarray, and 1,121 named genes. A list of the probe sets on the Lymph Dx microarray is presented in Table 2, located at the end of the Detailed Description section.
- In an embodiment of the present invention, gene expression data obtained using the Lymph Dx microarray was used to identify and classify lymphomas using Bayesian analysis. This method was similar to that outlined above, but included additional steps designed to optimize the number of genes used and the cut-off points between lymphoma types. A general overview of this method is presented in
Figure 1 . Each gene represented on the Lymph Dx microarrays was placed into one of three gone-list categories based on its correlation with the lymph node or proliferation gene expression signatures: lymph node, proliferation, or standard. These signatures were identified by clustering of the DLBCL cases using hierarchical clustering and centrold-correlation of 0.35. Standard genes were those with expression patterns that did not correlate highly with expression of the lymph node or proliferation signatures. Lymph Dx gene expression data was first used to identify samples as FL, MCL, SLL, FH, or DLBCL/BL, then to identify DLBCL/BL samples as ABC, GCB, PMBL, or BL. For each stage, a series of pair-wise models was created, with each model containing a different pair of lymphoma types (e.g., FL vs. MCL, SLL vs. FH, etc.). For each pair, the difference in expression of each gene on the microarray was measured, and a t-statistic was generated representing this difference. Genes from each gene-list category were ordered based on their t-statistic, and those with the largest t-statistics were used to generate a series of LPSs for samples belonging to either lymphoma type. The number of genes used to generate the LPSs was optimized by repeating the calculation using between five and 100 genes from each gene-list category. The number of genes from each category used in the final LPS calculation was that which gave rise to the largest difference in LPS between the two lymphoma types. Once the number of genes in each gene-list category was optimized, four different LPSs were calculated for each sample. The first included genes from the standard gene-list category only, the second included genes from the proliferation and standard gene-list categories, the third included genes from the lymph node and standard gene-list categories, and the fourth included genes from all three categories. The probability q that a sample X belongs to the first lymphomas type of a pair-wise model can then be calculated using an equation:
- LPS(X) is the LPS for sample X, φ(x;µ,σ) is the normal density function with mean µ and standard deviation σ, µ̂1 and σ̂1 are the mean and variance of the LPSs for samples belonging to the first lymphoma type, and µ̂2 and σ̂2 are the mean and variance of the LPSs for samples belonging to the second lymphoma type. Samples with high q values were classified as the first lymphoma type, samples with low q values were classified as the second lymphoma type, and samples with middle range q values were deemed unclassified. To determine the proper cut-off point between high, low, and middle q values, every possible cut-off point between adjacent samples was analyzed by an equation:

- This equation was used to favor the assignment of a sample to an "unclassified" category rather than to an incorrect lymphoma type. The final cut-off points were those which minimized this equation. The coefficient of 3.99 was chosen arbitrarily to allow an additional classification error only if the adjustment resulted in four or more unclassified samples becoming correctly classified. The coefficient can be varied to achieve a different set of trade-offs between the number of unclassified and misidentified samples.
- To ensure that the accuracy of the model was not a result of overfitting, each model was validated by leave-one-out cross-validation. This entailed removing each sample of known lymphoma type from the data one at a time, and then determining whether the model could predict the missing sample. This process confirmed the accuracy of the prediction method.
- The classification of a lymphoproliferative disorder in accordance with embodiments of the present invention may be used in combination with any other effective classification feature or set of features. For example, a disorder may be classified by a method of the present invention in conjunction with WHO suggested guidelines, morphological properties, histochemical properties, chromosomal structure, genetic mutation, cellular proliferation rates, immunoreactivity, clinical presentation, and/or response to chemical, biological, or other agents.
- Embodiments of the present invention may be used in lieu of or in conjunction with other methods for lymphoma diagnosis, such as immunohistochemistry, flow cytometry, FISH for translocations, or viral diagnostics.
- Accurate determination of lymphoma type in a subject allows for better selection and application of therapeutic methods. Knowledge about the exact lymphoma affecting a subject allows a clinician to select therapies or treatments that are most appropriate and useful for that subject, while avoiding therapies that are nonproductive or even counterproductive. For example, CNS prophylaxis may be useful for treating BL but not DLBCL, CHOP treatment may be useful for treating DLBCL but not blastic MCL (Fisher 1993; Khouri 1998), and subjects with follicular lymphoma frequently receive treatment while subjects with follicular hyperplasia do not. In each of these situations, the lymphoma types or subtypes in question can be difficult to distinguish using prior art diagnostic methods. The diagnostic and identification methods of the present invention allow for more precise delineation between these lymphomas, which simplifies the decision of whether to pursue a particular therapeutic option. Likewise, the survival prediction methods disclosed in the present invention also allow for better selection of therapeutic options. A subject with a very low survival predictor score (i.e., very good prognosis) may not receive treatment, but may instead be subjected to periodic check-ups and diligent observation. As survival predictor scores increase (i.e., prognosis gets worse), subjects may receive more intensive treatments. Those subjects with the highest survival predictor scores (i.e., very poor prognosis) may receive experimental treatments or treatments with novel agents. Accurate survival prediction using the methods disclosed herein provides an improved tool for selecting treatment options and for predicting the likely clinical outcome of those options.
- Any effective method of quantifying the expression of at least one gene, gene set, or group of gene sets may be used to acquire gene expression data for use in embodiments of the present invention. For example, gene expression data may be measured or estimated using one or more microarrays. The microarrays may be of any effective type, including but not limited to nucleic acid based or antibody based. Gene expression may also be measured by a variety of other techniques, including but not limited to PCR, quantitative RT-PCR, real-time PCR, RNA amplification, in situ hybridization, immunohistochemistry, immunocytochemistry, FACS, serial analysis of gene expression (SAGE) (Velculescu 1995), Northern blot hybridization, or western blot hybridization.
- Nucleic acid microarrays generally comprise nucleic acid probes derived from individual genes and placed in an ordered array on a support. This support may be, for example, a glass slide, a nylon membrane, or a silicon wafer. Gene expression patterns in a sample are obtained by hybridizing the microarray with the gene expression product from the sample. This gene expression product may be, for example, total cellular mRNA, rRNA, or cDNA obtained by reverse transcription of total cellular mRNA. The gene expression product from a sample is labeled with a radioactive, fluorescent, or other label to allow for detection. Following hybridization, the microarray is washed, and hybridization of gene expression product to each nucleic acid probe on the microarray is detected and quantified using a detection device such as a phosphorimager or scanning confocal microscope.
- There are two broad classes of microarrays: cDNA and oligonucleotide arrays. cDNA arrays consist of hundreds or thousands of cDNA probes immobilized on a solid support. These cDNA probes are usually 100 nucleotides or greater in size. There are two commonly used designs for cDNA arrays. The first is the nitrocellulose filter array, which is generally prepared by robotic spotting of purified DNA fragments or lysates of bacteria containing cDNA clones onto a nitrocellulose filter (Southern 1992; Southern 1994; Gress 1996; Pietu 1996). The other commonly used cDNA arrays is fabricated by robotic spotting of PCR fragments from cDNA clones onto glass microscope slides (Schena 1995; DeRisi 1996; Schena 1996; Shalon 1996; DeRisi 1997; Heller 1997; Lashkari 1997). These cDNA microarrays are simultaneously hybridized with two fluorescent cDNA probes, each labeled with a different fluorescent dye (typically Cy3 or Cy5). In this format, the relative mRNA expression in two samples is directly compared for each gene on the microarray. Oligonucleotide arrays differ from cDNA arrays in that the probes are 20- to 25-mer oligonucleotides. Oligonucleotide arrays are generally produced by in situ oligonucleotide synthesis in conjunction with photolithographic masking techniques (Pease 1994; Lipshutz 1995; Chee 1996; Lockhart 1996; Wodicka 1997). The solid support for oligonucleotide arrays is typically a glass or silicon surface.
- Methods and techniques applicable to array synthesis and use have been described in, for example,
U.S. Patent Nos. 5,143,854 (Pirrung ),5,242,974 (Holmes ),5,252,743 (Barrett ),5,324,633 (Fodor ),5,384,261 (Winkler ),5,424,186 (Fodor ),5,445,934 (Fodor ),5,451,683 (Barrett ),5,482,867 (Barrett ),5,491,074 (Aldwin ),5,527,681 (Holmes ),5,550,215 (Holmes ),5,571,639 (Hubbell ),5,578,832 (Trulson ),5,593,839 (Hubbell ),5,599,695 (Pease ),5,624,711 (Sundberg ),5,631,734 (Stern ),5,795,716 (Chee ),5,831,070 (Pease ),5,837,832 (Chee ),5,856,101 (Hubbell ),5,858,659 (Sapolsky ),5,936,324 (Montagu ),5,968,740 (Fodor ),5,974,164 (Chee ),5,981,185 (Matson ),5,981,956 (Stern ),6,025,601 (Trulson ),6,033,860 (Lockhart ),6,040,193 (Winkler ),6,090,555 (Fiekowsky ), and6,410,229 (Lockhart ), andU.S. Patent Application Publication No. 20030104411 (Fodor ). Each of the above patents and applications is incorporated by reference herein in its entirety. - Microarrays may generally be produced using a variety of techniques, such as mechanical or light directed synthesis methods that incorporate a combination of photolithographic methods and solid phase synthesis methods. Techniques for the synthesis of microarrays using mechanical synthesis methods are described in, for example,
U.S. Patent Nos. 5,384,261 (Winkler ) and6,040,193 (Winkler ). Although a planar array surface is preferred, the microarray may be fabricated on a surface of virtually any shape, or even on a multiplicity of surfaces. Microarrays may be nucleic acids on beads, gels, polymeric surfaces, fibers such as fiber optics, glass or any other appropriate substrate. See, for example,U.S. Patent Nos. 5,708,153 (Dower );5,770,358 (Dower );5,789,162 (Dower );5,800,992 (Fodor ); and6,040,193 (Winkler ), each of which is incorporated by reference herein in its entirety. - Microarrays may be packaged in such a manner as to allow for diagnostic use, or they can be an all-inclusive device. See, for example,
U.S. Patent Nos. 5,856,174 (Lipshutz ) and5,922,591 (Anderson ), both of which are incorporated by reference herein in their entirety. - Microarrays directed to a variety of purposes are commercially available from Affymetrix (Affymetrix, Santa Clara, CA). For instance, these microarrays may be used for genotyping and gene expression monitoring for a variety of eukaryotic and prokaryotic species.
- The following examples are provided to better illustrate the claimed invention and are not to be interpreted as limiting the scope of the invention. To the extent that specific materials are mentioned, it is merely for purposes of illustration and is not intended to limit the invention. One skilled in the art may develop equivalent means or reactants without the exercise of inventive capacity and without departing from the scope of the invention. It will be understood that many variations can be made in the procedures herein described while still remaining within the bounds of the present invention. It is the intention of the inventors that such variations are included within the scope of the invention.
- 568 cell samples representing various forms of human lymphoid malignancies were obtained by biopsy using known methods described in the literature. The samples were reviewed by a panel of hematopathologists and classified into the following lymphoma types based on current diagnostic criteria:
- 231 diffuse large B cell lymphomas (DLBCL)
- 191 follicular lymphomas (FL)
- 26 Burkitt lymphomas (BL)
- 21 mantle cell lymphoma (MCL)
- 18 follicular hyperplasias (FH)
- 17 small cell lymphocytic lymphomas (SLL)
- 16 mucosa-associated lymphoid tissue lymphomas (MALT)
- 13 splenic lymphomas (Splenic)
- 10 cyclin-D1 negative lymphomas with MCL morphology (CD1negMCL)
- 9 multiple myeloma (Mult_Myeloma)
- 6 lymphoplasmacytic lymphomas (LPC)
- 4 post-transplant lymphoproliferative disorders (PTLD)
- 3 lymphoblastic lymphomas (Lymbl)
- 3 nodal marginal zone lymphomas (NMZ)
- The 231 DLBCL samples were subdivided into the following lymphoma types based on gene expression (see below):
- 88 germinal center B cell-like (GCB)
- 78 activated B cell-like (ABC)
- 33 primary mediastinal B cell lymphoma (PMBL)
- 32 samples for which the subtype could not be determined (UC_DLBCL)
- The 16 MALT samples were subdivided into the following four group based on tumor origin:
- 9 from the gastric region (MALT_gastric)
- 1 from the salivary gland (MALT_salivary)
- 1 from the lung (MALT_lung)
- 1 from the tonsil (MALT_tonsil)
- 4 of unknown origin (MALT_unk)
- Each of the 568 cell samples was given a unique sample ID number consisting of the lymphoma type followed by a unique numerical identifier. For example, "ABC_304" refers to an ABC DLBCL sample numbered 304. Cells were purified and RNA was isolated from the purified cells according to known methods described in the literature.
- Aliquots of RNA from each sample were applied to Affymetrix U133A and Affymetrix U133B microarrays according to standard Affymetrix protocol. The U133A and U133B microarrays are divided into probe sets, with each probe set consisting of up to 69 oligonucleotide probes 25 nucleotides in length. Each probe set represents a distinct human gene. Information pertaining to these microarrays is available at www.affymetrix.com. Each microarray was scanned using an Affymetrix scanner, which records signal intensity for every probe on the microarray. This information can be transformed into summary signal values for each probe set using a number of different algorithms, including MAS 5.0, D-chip (Li 2001), or Bioconductor's RMA algorithms (Irizarry 2003). The images produced by the scanner were evaluated by Affymetrix MAS 5.0 software.
- The signal value for each probe on the U133A and U133B microarrays was normalized to a target value of 500, and the base-2 log of the normalized values was used for the following analyses. Log-signal files were statistically analyzed using S+ software and the following S+ subtype predictor script:


 Although the log-signal values were analyzed using S+ software and the above algorithm, any effective software/algorithm combination may be used.
- The novel Lymph Dx microarray contains cDNA probes corresponding to approximately 2,734 genes, 174 of these are "housekeeping" genes present for quality control, since they represent genes that are most variably expressed across all lymphoma samples. Other genes represented on the microarray were selected for their utility in identifying particular lymphoma samples and predicting survival in those samples. The genes represented on the Lymph Dx microarray can be divided into four broad categories: 1,101 lymphoma predictor genes identified previously using the Affymetrix U133 microarray, 171 outcome predictor genes identified using the Affymetrix U133 microarray, 167 genes not found on the Affymetrix U133 microarray but represented on the Lymphochip microarray (Alizadeh 1999), and 1,121 named genes. The types of genes making up each of these broad categories are summarized in Table 3, below, while the specific genes represented on the Lymph Dx microarray are listed in Table 2, located at the end of the Detailed Descriptions section.
Table 3 Gene type Number of genes Lymphoma predictor genes 1101 Subtype specific 763 Lymph node signature 178 Proliferation signature 160 Outcome predictor genes 171 DLBCL 79 FL 81 MCL 11 New genes not on U133 167 Lymphochip lymphoma predictor genes 84 EBV and NHV8 viral genes 18 BCL-2/cyclln D1/INK4a specialty probes 14 Named genes missing from U133 51 Named genes 1121 Protein kinase 440 Interleukin 35 Interleukin receptor 29 Chemokine 51 Chemokine receptor 29 TNF family 26 TNF receptor family 51 Adhesion 45 Surface marker 264 Oncogene/tumor suppressor 49 Apoptosls 46 Drug target 10 Regulatory 46 - Cell samples representing various forms of human lymphoid malignancy were obtained by biopsy using known methods described in the literature. These 634 biopsy samples were reviewed by a panel of hematopathologists and classified into the following lymphoma types based on current diagnostic criteria:
- 201 diffuse large B-cell lymphomas (DLBCL)
- 191 follicular lymphomas (FL)
- 60 Burkitt lymphomas (BL)
- 21 mantle cell lymphomas (MCL)
- 30 primary mediastinal B cell lymphoma (PMBL)
- 18 follicular hyperplasias (FH)
- 18 small cell lymphocytic lymphomas (SLL)
- 17 mucosa-associated lymphoid tissue lymphomas (MALT), including 9 gastric MALTs (GMALT)
- 16 chronic lymphocytic leukemias (CLL)
- 13 splenic lymphomas (SPL)
- 11 lymphoplasmacytic lymphomas (LPC)
- 11 transformed DLBCL (trDLBCL) (DLBCL that arose from an antecedent FL)
- 10 cyclin D1 negative lymphomas with MCL morphology (CD1N)
- 6 peripheral T-cell lymphoma (PTCL)
- 4 post-transplant lymphoproliferative disorders (PTLD)
- 4 nodal marginal zone lymphomas (NMZ)
- 3 lymphoblastic lymphomas (LBL)
- Each of the 634 samples was given a unique sample ID number consisting of the lymphoma type followed by a unique numerical identifier, For example, "BL_2032_52748" refers to a Burkitt lymphoma sample with the numerical identifier 2032_52748. Cells were purified and RNA was isolated from the purified cells according to known methods described in the literature.
- Aliquots of purified RNA from each sample was applied to the Lymph Dx microarrays according to standard Affymetrix microarray protocol. Each microarray was scanned on an Affymetrix scanner. This scanner produced an image of the microarray, which was then evaluated by Affymetrix MAS 5.0 software. The signal intensity for each probe on the microarray can be transformed into summary signal values for each probe set through a number of different algorithms, including but not limited to MAS 5.0, D-chip (Li 2001), or Bioconductor's RMA algorithms (Irizarry 2003),
- An analytical method entitled Survival Signature Analysis was developed to create survival prediction models for lymphoma. This method is summarized in
Figure 2 . The key feature of this method is the identification of gene expression signatures. Survival Signature Analysis begins by identifying genes whose expression patterns are statistically associated with survival. A hierarchical clustering algorithm is then used to identify subsets of these genes with correlated expression patterns across the lymphoma samples. These subsets are operationally defined as "survival-associated signatures." Evaluating a limited number of survival-associated signatures mitigates the multiple comparison problems that are inherent in the use of large-scale gene expression data sets to create statistical models of survival (Ransohoff 2004). - FL samples were divided into two equivalent groups: a training set (95 samples) for developing the survival prediction model, and a validation set (96 samples) for evaluating the reproducibility of the model. The overall survival of this cohort is depicted in
Figure 3 . The median age at diagnosis was 51 years (ranging from 23 to 81 years), and the patients had a median follow-up of 6.6 years (8.1 years for survivors, with a range of <1 to 28.2 years). Gene expression data from Affymetrix U133A and U133B microarrays was obtained for each sample. Within the training set, a Cox proportional hazards model was used to identify "survival predictor" genes, which were genes whose expression levels were, associated with long survival (good prognosis genes) or short survival (poor prognosis genes). A hierarchical clustering algorithm (Eisen 1998) was used to identify gene expression signatures within the good and poor prognosis genes according to their expression pattern across all samples. Ten gene expression signatures were observed within either the good prognosis or poor prognosis gene sets (Figure 4 ). The expression level of every component gene in each of these ten gene expression signatures was averaged to create a gene expression signature value. - To create a multivariate model of survival, different combinations of the ten gene expression signature values were generated and evaluated for their ability to predict survival within the training set. Among models consisting of two signatures, an exceptionally strong statistical synergy was observed between one signature from the good prognosis group and one signature from the poor prognosis group, These signatures were deemed "immune, response-1" and "immune response-2," respectively, based on the biological function of certain genes within each signature. The immune response-1 gene expression signature included genes encoding T cell markers (e.g., CD7, CD8B1, ITK, LEF1, STAT4) and genes that are highly expressed in macrophages (e.g., ACTN1, TNFSF13B). The immune response-1 signature is not merely a surrogate for the number of T cells in the FL biopsy sample because many other standard T cell genes (e.g., CD2, CD4, LAT, TRIM, SH2D1A) were not associated with survival. The immune response-2 gene expression signature included genes known to be preferentially expressed in macrophages and/or dendritic cells (e.g., TLR5, FCGR1A, SEPT10, LGMN, C3AR1). Table 4 lists the genes that were used to generate the gene expression signature values for the immune response-1 and immune response-2 signatures.
Table 4 Signature UNIQID Unigene ID Build 167 (http://www.ncbi.nlm, nih.gov/UniGene) Gene symbol Immune response-1 1095985 83883 TMEPAI Immune response-1 1096579 117339 HCST Immune response-1 1097255 380144 Immune response-1 1097307 379754 LOC340061 Immune response-1 1097329 528675 TEAD1 Immune response-1 1097561 19221 C20orf112 Immune response-1 1098152 377588 KIAA1450 Immune response-1 1098405 362807 IL7R Immune response-1 1098548 436639 NFIC Immune response-1 1098893 43577 ATP8B2 Immune response-1 1099053 376041 Immune response-1 1100871 48353 Immune response-1 1101004 2969 SKI Immune response-1 1103303 49605 C9orf52 Immune response-1 1107713 171806 Immune response-1 1115194 270737 TNFSF13B Immune response-1 1119251 433941 SEPW1 Immune response-1 1119838 469951 GNAQ Immune response-1 1119924 32309 INPP1 Immune response-1 1120196 173802 TBC1D4 Immune response-1 1120267 256278 TNFRSF1B Immune response-1 1121313 290432 HOXB2 Immune response-1 1121406 NA TNFSF12 Immune response-1 1121720 80642 STAT4 Immune response-1 1122956 113987 LGALS2 Immune response-1 1123038 119000 ACTN1 Immune response-1 1123092 437191 PTRF Immune response-1 1123875 428 FLT3LG immune response-1 1124760 419149 JAM3 Immune response-1 1128356 415792 C1 RL Immune response-1 1128395 7188 SEMA4C Immune response-1 1132104 173802 TBC1D4 Immune response-1 1133408 12802 DDEF2 Immune response-1 1134069 405667 CD8B1 Immune response-1 1134751 106185 RALGDS Immune response-1 1134945 81897 KIAA1128 Immune response-1 1135743 299558 TNFRSF25 Immune response-1 1135968 119000 ACTN1 Immune response-1 1136048 299558 TNFRSF25 Immune response-1 1136087 211576 ITK Immune response-1 1137137 195464 FLNA Immune response-1 1137289 36972 CD7 Immune response-1 1137534 36972 CD7 Immune response-1 1139339 47099 GALNT12 Immune response-1 1139461 14770 BIN2 Immune response-1 1140391 44865 LEF1 Immune response-1 1140524 10784 C6orf37 Immune response-1 1140759 298530 RAB27A Immune response-2 1118755 127826 EPOR Immune response-2 1118966 19196 LOC51619 Immune response-2 1121053 1690 FGFBP1 Immune response-2 1121267 334629 SLN Immune response-2 1121331 8980 TESK2 Immune response-2 1121766 396566 MPP3 Immune response-2 1121852 421391 LECT1 Immune response-2 1122624 126378 ABCG4 Immune response-2 1122679 232770 ALOXE3 Immune response-2 1122770 66578 CRHR2 Immune response-2 1123767 1309 CD1A Immune response-2 1123841 389 ADH7 Immune response-2 1126097 498015 Immune response-2 1126380 159408 Immune response-2 1126628 254321 CTNNA1 Immune response-2 1126836 414410 NEK1 Immune response-2 1127277 121494 SPAM1 immune response-2 1127519 NA Immune response-2 1127648 285050 Immune response-2 1128483 444359 SEMA4G Immune response-2 1128818 115830 HS3ST2 Immune response-2 1129012 95497 SLC2A9 Immune response-2 1129582 272236 C21orf77 Immune response-2 1129658 58356 PGLYRP4 Immune response-2 1129705 289368 ADAM19 Immune response-2 1129867 283963 G6PC2 Immune response-2 1130003 432799 Immune response-2 1130388 19196 LOC51619 Immune response-2 1131837 156114 PTPNS1 Immune response-2 1133843 6682 SLC7A11 Immune response-2 1133949 502092 PSG9 immune response-2 1134447 417628 CRHR1 Immune response-2 1135117 512646 PSG6 immune response-2 1136017 1645 CYP4A11 Immune response-2 1137478 315235 ALDOB Immune response-2 1137745 26776 NTRK3 Immune response-2 1137768 479985 Immune response-2 1138476 351874 HLA-DOA Immune response-2 1138529 407604 CRSP2 Immune response-2 1138601 149473 PRSS7 Immune response-2 1139862 251383 CHST4 Immune response-2 1140189 287369 IL22 Immune response-2 1140389 22116 CDC14B - Although the immune response-1 and immune response-2 gene expression signatures taken individually were not ideal predictors of survival, the binary model formed by combining the two was more predictive of survival in the training set than any other binary model (p<.001). Using this binary model as an anchor, other signatures were added to the model using a step up procedure (Drapner 1966). Of the remaining eight signatures, only one signature contributed significantly to the model in the training set (p<0.01), resulting in a three-variable model for survival. This model was associated with survival in a highly statistically significant fashion in both the training (p<0.001) and validation sets (p=0.003). However, only the immune response-1 and immune response-2 gene expression signatures contributed to the predictive power of the model in both the training set and the validation set. The predictive power of each of these signatures is summarized in Table 5.
Table 5 Gene expression signature Contribution of signature to model in validation set (p-value) Relative risk of death among patients in validation set (95% C.I.) Effect of increased expression on survival Immune response-1 <0,001 0.15 (0.05-0.46) Favorable Immune response-2 <0.001 9.35 (3.02-28,9) Poor - Based on this information, the third signature was removed from the model and the two-signature model was used to generate a survival predictor score using the following equation:

- A higher survival predictor score was associated with worse outcome. The two-signature model was associated with survival in a statistically significant fashion in both the training set (p<0,001) and the validation set (p<0.001), which demonstrated that the model was reproducible. For the 187 FL samples with available clinical data, the survival predictor score had a mean of 1.6 and a standard deviation of 0.894, with each unit increase in the predictor score corresponding to a 2.5 fold increase in the relative risk of death. Data for all 191 samples is shown in Table 6.
Table 6 Sample ID # Set Length of follow-up
(years)Status at follow-up Immune response-1 signature value Immune response-2 signature value Survival predictor score FL_1073 Training 7.68 Dead 9,20 8.67 1.77 FL_1074 Training 4.52 Dead 9.10 8.57 1.74 FL_1075 Validation 4.52 Dead 8.97 8.69 2.38 FL_1076 Training 3.22 Dead 9.20 8.55 1.44 FL_1077 Training 7.06 Alive 9.80 8.46 -0.20 FL_1078 Training 4.95 Alive 9.32 8.23 0.30 FL_1080 Training 6.05 Alive 9.45 8.94 1.93 FL_1081 Validation 6.61 Alive 9.00 8.22 1.05 FL_1083 Training 10.01 Alive 9.82 8.72 0.47 FL_1085 Validation 8.84 Alive 9.31 8.58 1.29 FL_1086 Validation 1.98 Dead 9.49 9.09 2.22 FL_1087 Training 8.19 Alive 9.98 9.27 1.57 FL_1088 Validation 5.30 Alive 9.22 8.47 1.20 FL_1089 Training 10.72 Alive 9.42 8.35 0.40 FL_1090 Validation 10.20 Alive 9.27 8.37 0.82 FL_1097 Validation 8.79 Dead 9.87 8.92 0.87 FL_1098 Validation 5.34 Dead 9.33 8.81 1.87 FL_1099 Training 7.65 Alive 9.73 9.04 1.54 FL_1102 Validation 13.20 Dead 9.45 8.89 1.79 FL_1104 Training 8.42 Dead 9.30 8.27 0.48 FL_1106 Validation 7.94 Alive 9.13 9.19 3.36 FL_1107 Training 5.01 Dead 9.41 9.32 3.07 FL_1183 Training 11.56 Dead 9.31 8.53 1.16 FL_1184 Training 6.93 Dead 9.66 8.83 1.13 FL_1185 Validation 7.02 Dead 9.23 9.09 2.86 FL_1186 Training 1.34 Dead 9.01 8.84 2.68 FL_1416 Validation 6.21 Alive 9.50 8.67 1.08 FL_1417 Training 2.40 Dead 8.47 8.39 2.73 FL_1418 Validation 3.59 Alive 8.94 8.42 1.72 FL_1419 Training 3.85 Alive 9.82 8.56 0.03 FL_1422 Training 5.72 Alive 9.46 8.49 0.68 FL_1425 Validation 4.26 Alive 8.93 8.50 1.98 FL_1426 Training 7.32 Alive 9.08 8.26 0.97 FL_1427 Training 5.22 Alive 8.57 8.28 2.22 FL_1428 Validation 5.41 Dead 9.22 8.44 1.10 FL_1432 Training 3.66 Alive 9.22 8.95 2.51 FL_1436 Training 9.08 Dead 9.48 8.63 1.02 FL_1440 Training 7.85 Alive 9.07 8.35 1.22 FL_1445 Training 9.24 Dead 8.67 8.66 3.01 FL_1450 Validation 0.65 Dead 9.83 9.99 3.86 FL_1472 Validation 16.72 Alive 8,85 8.49 2.10 FL_1473 Training 15.07 Alive 9.75 8.50 0.02 FL_1474 Validation 2.75 Dead 9.34 9.10 2.62 FL_1476 Validation 4.08 Dead 9.51 8.87 1.60 FL_1477 Training 0.59 Dead 9.64 9.06 1.83 FL_1478 Training 12.47 Dead 9.60 8.87 1.39 FL_1479 Training 2.29 Dead 8.71 9.07 4.01 FL_1480 Training 16.29 Alive 9.40 8.67 1.30 FL_1579 Training 8.22 Dead 8.81 8.44 2.10 FL_1580 Training 19.30 Ailve 9.58 8.52 0.49 FL_1581 Training 9.52 Dead 9.08 9.02 3.00 FL_1582 Validation 1.30 Dead 8.40 8.18 2.36 FL_1583 Training 15.26 Dead 9.47 8.79 1.48 FL_1584 Training 15.73 Dead 9.44 8.55 0.89 FL_1585 Validation 0.01 Alive 8.96 8.53 1.96 FL_1586 Validation 3.11 Alive 9.38 8.55 1.03 FL_1588 Training 0.49 Dead 9.52 9.06 2.08 FL_1589 Training 3.15 Alive 9.72 8.74 0.72 FL_1591 Training 11.22 Alive 9.49 8.62 0.97 FL_1594 Validation 11.19 Alive 9.25 8.59 1.47 FL_1595 Training 8.03 Alive 9.75 9.60 3.01 FL_1598 Validation 2.80 Dead 8.81 8.33 1.79 FL_1599 Validation 6.17 Alive 9.48 8.65 1.06 FL_1603 Training 5.17 Dead 9.66 9.75 3.63 FL_1604 Training 3.98 Dead 9.24 8.86 2.20 FL_1606 Validation 4.22 Dead 9.45 9.18 2.57 FL_1607 Validation 8.12 Alive 9.40 8.60 1.13 FL_1608 Validation 9.70 Alive 8.92 8.41 1.72 FL_1610 Validation 2.05 Dead 9.33 9.35 3.32 FL_1611 Validation 10.15 Alive 9.42 8.69 1.31 FL_1616 Training 2.36 Dead 9.38 8.82 1.78 FL_1617 Validation 7.85 Alive 8,96 8,49 1.87 FL_1619 Validation 9.24 Dead 9.43 8.56 0.94 FL_1620 Validation 9.36 Dead 9.14 8.35 1.04 FL_1622 Training 14.01 Alive 9,23 8.53 1.33 FL_1623 Training 9.72 Alive 9.67 8.93 1.38 FL_1624 Validation 3.98 Dead 9.05 8.50 1.70 FL_1625 Validation 11.16 Alive 8.98 8.47 1.75 FL_1626 Validation 6.47 Dead 8.59 8.14 1.76 FL_1628 Validation 0.82 Dead 9.80 8.72 0.51 FL_1637 Validation 18.81 Alive 9.95 9.58 2.48 FL_1638 Validation 4.06 Alive 9.13 8.88 2.51 FL_1639 Training 4.75 Alive 9.53 8.89 1.62 FL_1643 Training 0.77 Dead 9,73 9.06 1.58 FL_1644 Validation 3.84 Alive 9.55 8.68 0.98 FL_1645 Training 3.56 Alive 9.49 8.70 1.18 FL_1646 Training 1.97 Dead 9.25 8.61 1.50 FL_1647 Training 1.22 Dead 9.12 8.89 2.55 FL_1648 Training 11.01 Alive 9.13 8.12 0.46 FL_1652 Training 3.72 Dead 9.50 9.14 2,35 FL_1654 Validation 0.30 Dead 8.74 8.28 1.82 FL_1655 Training 8.45 Alive 9.51 8.85 1.53 FL_1656 Validation 9.36 Alive 9.06 8.58 1.87 FL_1657 Training 10.09 Alive 9.53 8.46 0.44 FL_1660 Training 2.32 Alive 8.81 8.38 1.91 FL_1661 Validation 1.48 Alive 9.86 8.90 0.85 FL_1662 Validation 0.74 Dead 9.57 9.15 2.21 FL_1664 Validation 4.53 Dead 9.34 8.62 1.31 FL_1669 Training 4.40 Dead 8.87 8.58 2.30 FL_1670 Training 1.88 Alive 9.64 9.45 2.86 FL_1675 Training 4.57 Alive 9.36 8.46 0.84 FL_1681 Validation 4.23 Alive 9.52 8.63 0.91 FL_1683 Validation 4.03 Dead 9.95 9.10 1.19 FL_1684 Training 2.88 Dead 9.53 8.73 1.18 FL_1716 Validation 9.69 Alive 8.95 8.35 1.50 FL_1717 Validation 2.01 Dead 9.35 8.88 1.98 FL_1718 Training 10.35 Alive 9.23 8.13 0.26 FL_1719 Validation 7.70 Dead 9.13 8.50 1.49 FL_1720 Training 3.91 Dead 8.78 8.88 3.33 FL_1729 Training 8.06 Alive 9.35 8.65 1.39 FL_1732 Validation 0.71 Dead 7.81 8.59 4.86 FL_1761 Validation 10.83 Alive 9.31 8.55 1.22 FL_1764 Training 0.42 Dead 9.25 8.87 2.21 FL_1768 Training 13.04 Alive 9.42 8.47 0.72 FL_1771 Training 9.26 Dead 9.09 8.67 2.06 FL_1772 Validation 13.64 Dead 9.49 8.49 0.61 FL_1788 Training 1.00 Dead 9.09 9.13 3.29 FL_1790 Training 1.42 Alive 9.85 9.40 2.22 FL_1792 Validation 2.01 Dead 9.33 8.72 1.61 FL_1795 Training 0.71 Dead 10.19 9.27 1.08 FL_1797 Validation 7.17 Alive 9.34 8.92 2.14 FL_1799 Training 14.18 Alive 9.32 8.63 1.38 FL_1810 Validation 9.91 Alive 8.66 8.41 2.35 FL_1811 Validation 3.04 Alive 9.38 8.27 0.29 FL_1825 Training 2.98 Alive 9.46 9.07 2.25 FL_1827 Training 3.66 Alive 9.80 8.84 0.83 FL_1828 Validation 11.51 Alive 8.99 8.09 0.72 FL_1829 Validation 4.11 Alive 9.57 8.73 1.08 FL_1830 Validation 5.65 Dead 9.01 8.68 2.25 FL_1833 Training 11.95 Alive 9.74 8.67 0.51 FL_1834 Validation 15.92 Alive 9.22 8.72 1.88 FL_1835 Validation 12.49 Alive 9.26 8.83 2.10 FL_1836 Validation 12.24 Alive 9.55 8.64 0.85 FL_1837 Validation 0.55 Dead 9.47 8.84 1.62 FL_1838 Validation 2.54 Alive 9.90 9.12 1.34 FL_1839 Training 4.48 Alive 8.56 8.32 2.34 FL_1841 Training 0.88 Dead 9.32 9.10 2.66 FL_1842 Validation 4.56 Alive 9.73 8.87 1.07 FL_1844 Validation 13.39 Alive 9.41 8.55 0.98 FL_1845 Training 12.92 Dead 9.89 9.04 1.16 FL_1846 Validation 1.80 Dead 9.79 9.61 2.93 FL_1848 Training 12.52 Alive 9.76 8.81 0.82 FL_1851 Training 4.08 Dead 9.43 9.01 2.18 FL_1853 Validation 12.50 Alive 9.28 8.54 1.25 FL_1854 Validation 13.81 Alive 9.32 8.84 1.98 FL_1855 Validation 9.96 Dead 9.31 8.39 0.75 FL_1857 Validation 8.39 Dead 9.80 9.14 1.65 FL_1861 Validation 3.19 Dead 9.47 8.57 0.88 FL_1862 Validation 7.22 Dead 8.96 8.33 1.44 FL_1863 Validation 10.77 Dead 9.31 8.85 2.00 FL_1864 Training 14.25 Alive 9.98 9.12 1.17 FL_1866 Training 10.72 Dead 9.93 8.94 0.79 FL_1870 Validation 6.41 Dead 10.01 9.22 1.36 FL_1873 Training 7.78 Dead 9.39 8.66 1.30 FL_1874 Validation 3.15 Dead 9.38 8.74 1.53 FL_1876 Validation 15.07 Alive 9.59 8.72 0.98 FL_1879 Training 7.13 Dead 9.25 8.62 1.53 FL_1880 Validation 12.84 Dead 8.82 8.35 1.82 FL_1882 Training 8.84 Dead 9.43 8.76 1.49 FL_1884 Validation 11.92 Dead 9.48 9.14 2.41 FL_1885 Validation 15.49 Alive 9.70 8.85 1.11 FL_1887 Training 5.14 Dead 9.47 8.57 0.87 FL_1888 Training 15.08 Alive 9.83 8.97 1.11 FL_1890 Training 3.03 Dead 9.29 9.05 2.60 FL_1894 Training 11.37 Dead 9.01 8.64 2.13 FL_1896 Training 12.03 ' Alive 9.80 8.56 0.08 FL_1897 Training 9.63 Alive 9.02 8.33 1.29 FL_1898 Training 5.20 Alive 8.82 8.25 1.54 FL_1900 Validation 7.38 Alive 9.13 8.26 0.85 FL_1903 Validation 28.25 Alive 9.07 8.46 1.54 FL_1904 Validation 7.36 Alive 9.16 8.53 1.50 FL_1905 Validation 3.68 Dead 9.25 8.38 0.87 FL_1906 Training 2.35 Dead 8.04 8.69 4.56 FL 1907 Validation 2.35 Dead 8.11 8.21 3.11 FL 1910 Training 13.84 Alive 9.36 8.72 1.56 FL_1912 Validation 0.73 Dead 9.30 9.21 3.02 FL 1913 Training 2.57 Alive 9.77 8.51 0.01 FL 1916 Validation 11.61 Alive 9.22 8.49 1.24 FL 1918 Validation 9.95 Dead 9.54 8.77 1.26 FL 1919 Training 10.84 Dead 9.51 8.81 1.44 FL 735 Validation 11.05 Dead 8.81 8.23 1.53 FL 738 Validation 10.15 Dead 9.19 8.79 2.13 FL 739 Training 10.80 Dead 9.29 8.77 1.85 FL 878 Validation 3.87 Dead 8.85 8.54 2.26 FL 879 Training 4.34 Dead 8.95 8.74 2.56 FL 886 Validation 3.29 Alive 9.43 8.72 1.40 FL 888 Validation 1.32 Dead 8.76 8.49 2.34 FL 1627 Training NA NA 9.60 8.51 0.40 FL 1429 Training NA NA 8.69 8.28 1.93 FL 1850 Validation NA NA 9.75 8.83 0.92 FL 1735 Validation NA NA 7.32 8.30 5.24 - In order to visualize the predictive power of the model, the FL samples were ranked according to their survival predictor scores and divided into four quartiles. Kaplan-Meier plots of overall survival showed clear differences in survival rate in the validation set (
Figure 5 ), The median survival for each of the four quartiles is set forth in Table 7.Table 7 Quartile Median survival (years) 1 13.6 2 11.1 3 10.8 4 3.9 - Various clinical variables were found to be significantly associated with survival, including the IPI and some of its components and the presence of B-symptoms. The gene expression-based model was independent of each of these variables at predicting survival. These clinical variables and the relative risk of death associated with each are summarized in Table 8.
Table 8 Clinical variable Criteria % of patients1 % of patients1 Univariate (clinical variable only) relative risk of death among patients In validation set Multivariate (clinical variable + survival predictor score) relative risk of death among patients in validation set Training set Validation set RR2 (95% C.I.) p-value RR2 (95% C.I.) p-value Age 60 64.5 70.2 1.90 (1.02- 3.56) 0.044 2.21 (1.48- 3.29) <0.001 >60 35.5 29.8 Stage I-II 33.3 25 1.31 (0.65- 2.64) 0.447 2.31 (1.51- 3.52) <0.001 III-IV 66.7 75 Extranodal sites (#) 2 5.4 20.2 1.58 (0.83- 2.99) 0.163 2.21 (1.48- 3.30) <0.001 <2 94.6 79.8 LDH Normal 77.1 66.2 1.77 (0.97- 3.24) 0.065 2.40 (1.57- 3.67) <0.001 Greater than normal 22.9 33.8 ECOG performance status 2 9.4 12.5 2.05 (0.89- 4.71) 0.090 2.17 (1.40- 3.35) <0.001 <2 90.6 87.5 Gender Male 42 65 1.62 (0.90- 2.90) 0.105 2.17 (1.45- 3.25) <0.001 Female 58 35 B-symptoms Present 17.2 21.3 2.05 (1.08- 0.029 2.10 (1.37- 3.23) <0.001 Absent 82.8 78.7 Grade 1 45 43.4 N/A 0.118 2.55 (1.63- 3.99) <0.001 2 34.8 33.3 2.03 (1.04- 3.96) 3 20.2 23.3 1.39 (0.65- 2.98) Int'l. Prognostic Index4 Scores 0-1 63.1 47.5 N/A 0.029 2.28 (1.46- 3.57) <0.001 Scores 2-3 33.3 45 2.07 (1.07- 4.00) Scores 4-5 3.6 7.5 3.73 (1.18- 11.18) 1 Due to rounding, percentages may not total 100
2 Relative risk of death (RR) based on 2-fold increase in expression
3 RR forgrades grade 1. The p-value is calculated for all grades.
4 RR for scores 2-3 and 4-5 calculated with respect to risk of death for scores 0-1. The p-value is calculated for all grades. - The samples in the validation set were divided into three groups based on their IPI score, and the relationship between survival and IPI score was visualized by Kaplan-Meier plot (
Figure 6 ). Among validation set samples from the low-risk (IPI 0-1) and intermediate risk (IPI 2-3) IPI groups, the gene-expression-based survival predictor could stratify patients into groups differing by more than 5 years with regards to median survival (Figure 7 ). The high-risk IPI group (IPI 4-5) comprised less than 5% of the samples, and was omitted from this analysis. These results demonstrate that the gene expression-based model is not merely acting as a surrogate for clinical variables that are known to predict survival in FL, but rather it identifies distinct biological attributes of the tumors that are associated with survival. - 191 FL were divided into two equivalent groups: a training set (95 samples) for developing the survival prediction model, and a validation set (96 samples) for evaluating the reproducibility of the model. Gene expression data from Affymetrix U133A and U133B microarrays was obtained for each of the samples. A Cox proportional hazards model was used to identify survival predictor genes whose expression levels were associated with long survival (good prognosis genes) or short survival (poor prognosis genes) in the training set. A positive Cox coefficient indicated increasing mortality with increasing expression of the gene, while a negative Cox coefficient indicated decreasing mortality with increasing expression of the gene.
- A hierarchical clustering algorithm (Eisen 1998) was used to identify gene expression signatures within the good and poor prognosis genes according to their expression pattern across all samples. Eight clusters of coordinately regulated genes were observed within the good prognosis gene set and six clusters were observed in the poor prognosis gene sets. The expression level of every component gene in each of these gene expression signatures was averaged to create a gene expression signature value, After averaging, only ten of the gene expression signatures were found to be significantly associated with survival in the training set (p<0.01). To create a multivariate model of survival, different combinations of these ten gene expression signature averages were generated and evaluated for their ability to predict survival within the training set. Among models consisting of two signatures, an exceptionally strong statistical synergy was noted between one signature from the good prognosis group and one from the poor prognosis group. These gene expression signatures were termed "T-cell" and "macrophage" based on the biological function of certain genes within each signature. The T-cell gene expression signature included genes that were typically expressed in T-cells, while the macrophage gene expression signature included a number of genes typically expressed in macrophages. Although these two signatures taken individually were not the best predictors of survival, the binary model formed by combining the two was more predictive than any combination of three signatures that did not contain these two signatures. Using these two signatures as an anchor, other signatures were added to the model using a step up procedure (Drapner 1966). Only one of the remaining eight signatures, termed the B-cell differentiation signature, contributed significantly to the model in the training set (p=0.054). The B-cell differentiation signature included a number of genes that appear to be involved in B-cell signal transduction. Table 9 lists the genes that were used to generate the gene expression signature values for the T-cell, macrophage, and B-cell differentiation gene expression signatures.
Table 9 Signature UNIQID Unigene ID Build 167 (http://www.ncbi.nlm. nih.gov/UniGene) Gene symbol B-cell differentiation 1199350 331141 ALDH2 B-cell differentiation 1130922 459987 ANP32B B-cell differentiation 1130923 459987 ANP32B B-cell differentiation 1099291 130774 C9orf105 B-cell differentiation 1102859 446195 FLJ42418 B-cell differentiation 1120976 245644 GCHFR B-cell differentiation 1098862 303669 MGC26694 B-cell differentiation 1111070 202201 B-cell differentiation 1105935 B-cell differentiation 1139017 274424 NANS B-cell differentiation 1108988 3532 NLK B-cell differentiation 1194726 3532 NLK B-cell differentiation 1097897 266175 PAG B-cell differentiation 1097901 266175 PAG B-cell differentiation 1199813 155342 PRKCD B-cell differentiation 1123298 20191 SIAH2 B-cell differentiation 1101439 63335 TERF2 B-cell differentiation 1120316 63335 TERF2 B-cell differentiation 1096035 105794 UGCGL1 T-cell 1134945 81897 KIAA1128 T-cell 1134069 405667 CD8B1 T-cell 1137809 405667 CD8B1 T-cell 1119251 433941 SEPW1 T-cell 1096579 117339 HCST T-cell 1101004 2969 SKI T-cell 1137137 195464 FLNA T-cell 1100871 48353 T-cell 1139461 14770 BIN2 T-cell 1128395 7188 SEMA4C T-cell 1119880 442844 FMOD T-cell 1130676 194431 KIAA0992 T-cell 1130668 194431 KIAA0992 T-cell 1135968 119000 ACTN1 T-cell 1097329 528675 TEAD1 T-cell 1098548 436639 NFIC T-cell 1123038 119000 ACTN1 T-cell 1128356 415792 C1RL T-cell 1133408 12802 DDEF2 T-cell 1140524 10784 C6orf37 T-cell 1119838 469951 GNAQ T-cell 1097255 380144 T-cell 1098152 377588 KIAA1450 T-cell 1115194 270737 TNFSF13B T-cell 1124760 419149 JAM3 T-cell 1120267 256278 TNFRSF1B T-cell 1137289 36972 CD7 T-cell 1137534 36972 CD7 T-cell 1097307 379754 LOC340061 T-cell 1123613 97087 CD3Z T-cell 1121720 80642 STAT4 T-cell 1120196 173802 TBC1D4 T-cell 1136087 211576 ITK T-cell 1132104 173802 TBC1D4 T-cell 1140391 44865 LEF1 T-cell 1098405 362807 IL7R T-cell 1135743 299558 TNFRSF25 T-cell 1136048 299558 TNFRSF25 T-cell 1123875 428 FLT3LG T-cell 1098893 43577 ATP8B2 T-cell 1097561 19221 C20orf112 T-cell 1122956 113987 LGALS2 T-cell 1121406 TNFSF12 T-cell 1125532 T-cell 1138538 2014 TRD T-cell 1103303 49605 C9orf52 T-cell 1119924 32309 INPP1 Macrophage 1123682 114408 TLR5 Macrophage 1099124 355455 SEPT10 Macrophage 1123401 50130 NDN Macrophage 1134379 150833 C4A Macrophage 1137481 150833 C4A Macrophage 1132220 448805 GPRC5B Macrophage 1119400 181046 DUSP3 Macrophage 1131119 349656 SCARAB2 Macrophage 1123566 155935 C3AR1 Macrophage 1138443 77424 FCGR1A Macrophage 1127943 9641 C1QA Macrophage 1119998 8986 C1QB Macrophage 1132433 14732 ME1 Macrophage 1119260 18069 LGMN Macrophage 1098278 166017 MITF - The three signatures were used to generate a survival predictor score using the following equation:


- A higher survival predictor score was associated with worse outcome. According to a likelihood ratio test adjusted for the number of variables included, this model was significant in predicting survival in both the training set (p=1.8 x 10⁻⁸) and the validation set (p=2.0 x 10⁻⁵). For the 187 FL samples with available clinical data, the survival predictor score had a mean of -11.9 and a standard deviation of 0.9418, with each unit increase in the predictor score corresponding to a 2.5 fold increase in the relative risk of death. Data for all 191 samples is shown in Table 10.
Table 10 Sample ID # Set B cell differentiation signature value T-cell signature value Macrophage signature value Survival predictor score FL_1073 Training 9.70 9.14 8.58 -10.89 FL_1074 Training 11.11 9.06 8.52 -11.84 FL_1075 Validation 11.23 8.92 8.75 -11.15 FL_1076 Training 10.02 9.21 8.59 -11.25 FL_1077 Training 9.94 9.77 8.44 -12.82 FL_1078 Training 10.67 9.32 8.21 -12.76 FL_1080 Training 10.62 9.44 8.88 -11.64 FL_1081 Validation 10.38 9.00 8.09 -12.04 FL_1083 Training 10.29 9.77 8.74 -12.47 FL_1085 Validation 9.87 9.24 8.43 -11.55 FL_1086 Validation 10.03 9.50 9.02 -11.06 FL_1087 Training 9.83 9.98 9.37 -11.31 FL_1088 Validation 10.57 9.21 8.29 -12.27 FL 1089 Training 10.30 9.38 8.27 -12.53 FL_1090 Validation 9.74 9.24 8.20 -11.93 FL_1097 Validation 9.57 9.82 8.80 -11.93 FL 1098 Validation 11.08 9.40 8.97 -11.69 FL 1099 Training 10.23 9.70 9.12 -11.46 FL_1102 Validation 9.66 9.46 8.90 -10.93 FL_1104 Training 10.72 9.19 8.20 -12.53 FL_1106 Validation 11.11 9.17 9.57 -9.96 FL_1107 Training 9.70 9.42 9.55 9.54 FL_1183 Training 9.85 9.25 8.44 -11.54 FL_1184 Training 10.12 9.57 8.86 -11.63 FL 1185 Validation 10.75 9.21 9.13 -10.68 FL 1186 Training 9.76 8.88 8.83 -9.80 FL_1416 Validation 9.94 9.45 8.59 -11.77 FL_1417 Training 10.12 8.53 8.43 -10.08 FL_1418 Validation 9.35 8.86 8.27 -10.59 FL_1419 Training 10.20 9.76 8.53 -12.81 FL_1422 Training 10.22 9.48 8.40 -12.43 FL 1425 Validation 9.61 8.89 8.58 -10.23 FL 1426 Training 10.80 9.06 8.13 -12.41 FL_1427 Training 10.27 8.56 8.13 -10.87 FL 1428 Validation 10.76 9.25 8.38 -12.32 FL_1432 Training 10.51 9.17 9.04 -10.59 FL_1436 Training 9.69 9.40 8.61 -11.42 FL 1440 Training 9.82 9.04 8.21 -11.50 FL 1445 Training 9.24 8.69 8.62 -9.41 FL 1450 Validation 9.70 9.88 10.37 -8.93 FL 1472 Validation 10.78 8.96 8.51 -11.40 FL 1473 Training 9.99 9.70 8.41 -12.75 FL 1474 Validation 10.21 9.27 9.05 -10.59 FL 1476 Validation 9.82 9.44 8.78 -11.27 FL 1477 Training 9.32 9.61 9.03 -10.78 FL_1478 Training 10.19 9.60 8.81 -11.83 FL_1479 Training 10.69 8.78 9.09 -9.71 FL 1480 Training 10.10 9.42 8.70 -11.57 FL_1579 Training 10.15 8.82 8.24 -11.15 FL_1580 Training 10.31 9.59 8.50 -12.54 FL_1581 Training 9.91 8.96 9.05 -9.66 FL_1582 Validation 9.73 8.31 8.06 -10.03 FL_1583 Training 10.95 9.45 8.86 -11.95 FL 1584 Training 9.98 9.38 8.46 -11.89 FL_1585 Validation 10.53 8.88 8.46 -11.11 FL 1586 Validation 10.00 9.30 8.42 -11.81 FL 1588 Training 9.59 9.41 8.94 -10.68 FL_1589 Training 10.29 9.68 8.73 -12.27 FL 1591 Training 10.44 9.45 8.56 -12.18 FL_1594 Validation 10.01 9.25 8.56 -11.41 FL_1595 Training 9.61 9.75 9.65 -10.07 FL_1598 Validation 11.18 8.80 8.31 -11.71 FL 1599 Validation 10.55 9.48 8.60 -12.24 FL_1603 Training 9.40 9.60 9.77 -9.31 FL 1604 Training 9.92 9.21 8.90 -10.54 FL 1606 Validation 9.87 9.45 9.17 -10.52 FL 1607 Validation 9.76 9.37 8.50 -11.63 FL_1608 Validation 9.92 8.90 8.39 -10.85 FL 1610 Validation 10.02 9.38 9.74 -9.30 FL 1611 Validation 10.18 9.41 8.69 -11.64 FL_1616 Training 9.62 9.33 8.85 -10.71 FL 1617 Validation 9.90 8.96 8.39 -10.98 FL 1619 Validation 9.98 9.37 8.47 -11.85 FL 1620 Validation 9.43 8.95 8.12 -11.19 FL_1622 Training 9.84 9.15 8.31 -11.56 FL_1623 Training 9.95 9.61 8.97 -11.37 FL_1624 Validation 10.55 9.06 8.43 -11.61 FL_1625 Validation 10.00 8.89 8.23 -11.22 FL_1626 Validation 11.05 8.62 8.10 -11.62 FL_1628 Validation 10.08 9.81 8.66 -12.57 FL 1637 Validation 9.77 9.95 9.59 -10.76 FL 1638 Validation 10.25 9.20 9.07 -10.41 FL 1639 Training 10.29 9.52 8.99 -11.35 FL 1643 Training 9.80 9.72 9.00 -11.46 FL 1644 Validation 9.51 9.46 8.61 -11.43 FL_1645 Training 9.39 9.46 8.70 -11.15 FL_1646 Training 9.90 9.25 8.52 -11.42 FL 1647 Training 9.51 9.12 8.95 -9.92 FL_1648 Training 10.02 9.18 7.86 -12.67 FL 1652 Training 9.62 9.39 9.19 -10.16 FL_1654 Validation 10.32 8.59 8.10 -11.02 FL_1655 Training 10.12 9.53 8.75 -11.74 FL_1656 Validation 10.54 9.08 8.55 -11.42 FL_1657 Training 10.53 9.53 8.55 -12.46 FL_1660 Training 10.24 8.75 8.27 -10.99 FL_1661 Validation 10.08 9.85 9.00 -11.97 FL_1662 Validation 9.85 9.56 9.49 -10.11 FL_1664 Validation 10.16 9.35 8.48 -11.92 FL_1669 Training 9.48 8.76 8.28 -10.45 FL_1670 Training 9.76 9.66 9.66 -9.92 FL_1675 Training 10.67 9.28 8.41 -12.18 FL_1681 Validation 10.48 9.52 8.66 -12.19 FL_1683 Validation 9.88 9.92 9.07 -11.83 FL_1684 Training 9.64 9.53 8.85 -19.20 FL_1716 Validation 9.90 8.91 8.22 -11.23 FL_1717 Validation 9.87 9.34 8.95 -10.71 FL_1718 Training 10.00 9.21 7.98 -12.49 FL_1719 Validation 9.87 9.06 8.42 -11.14 FL_1720 Training 10.70 8.77 8.92 -10.05 FL_1729 Training 10.50 9.23 8.65 -11.53 FL_1732 Validation 9.91 7.68 8.54 -7.69 FL_1761 Validation 9.81 9.22 8.39 -11.54 FL_1764 Training 9.81 9.24 8.77 -10.80 FL_1768 Training 10.12 9.36 8.50 -11.86 FL_1771 Training 9.92 9.12 8.68 -10.79 FL_1772 Validation 9.72 9.42 8.43 -11.87 FL_1788 Training 9.65 9.05 9.12 -9.51 FL_1790 Training 9.58 9.83 9.48 -10.56 FL_1792 Validation 9.79 9.29 8.67 -11.11 FL_1795 Training 9.58 10.18 9.33 -11.69 FL_1797 Validation 9.93 9.26 8.79 -10.90 FL_1799 Training 10.49 9.28 8.64 -11.65 FL_1810 Validation 10.06 8.55 8.21 -10.52 FL_1811 Validation 9.84 9.37 8.08 -12.56 FL_1825 Training 10.49 9.44 9.03 -11.24 FL_1827 Training 10.06 9.76 8.84 -12.08 FL_1828 Validation 10.55 8.93 7.67 -12.87 FL_1829 Validation 9.85 9.58 8.65 -11.87 FL_1830 Validation 10.80 8.99 8.67 -11.15 FL_1833 Training 10.41 9.83 8.82 -12.52 FL_1834 Validation 10.81 9.25 8.63 -11.85 FL_1835 Validation 9.36 9.25 8.91 -10.21 FL_1836 Validation 10.58 9.58 8.61 -12.50 FL_1837 Validation 10.22 9.47 8.76 -11.68 FL_1838 Validation 10.51 9.89 9.19 -11.98 FL_1839 Training 10.79 8.54 8.19 -11.09 FL_1841 Training 10.32 9.31 9.18 -10.48 FL_1842 Validation 10.36 9.69 8.92 -11.95 FL_1844 Validation 10.92 9.43 8.49 -12.65 FL_1845 Training 9.87 9.87 9.06 -11.73 FL_1846 Validation 9.66 9.81 9.93 -9.63 FL_1848 Training 9.82 9.74 8.70 -12.14 FL_1851 Training 9.89 9.47 9.03 -10.87 FL_1853 Validation 9.96 9.28 8.54 -11.49 FL_1854 Validation 9.97 9.29 8.73 -11.12 FL_1855 Validation 9.95 9.33 8.42 -11.85 FL_1857 Validation 10.35 9.81 9.28 -11.50 FL_1861 Validation 9.73 9.46 8.43 -11.96 FL_1862 Validation 10.42 8.94 8.22 -11.69 FL_1863 Validation 10.79 9.29 8.82 -11.54 FL_1864 Training 9.67 9.97 9.07 -11.80 FL_1866 Training 10.19 9.88 8.89 -12.33 FL_1870 Validation 9.78 10.07 9.30 -11.63 FL_1873 Training 10.09 9.41 8.77 -11.40 FL_1874 Validation 10.05 9.33 8.69 -11.37 FL_1876 Validation 10.15 9.59 8.67 -12.08 FL_1879 Training 9.73 9.21 8.58 -11.06 FL_1880 Validation 10.02 8.79 8.35 -10.77 FL_1882 Training 9.59 9.44 8.80 -11.05 FL_1884 Validation 9.76 9.51 9.26 -10.38 FL_1885 Validation 10.48 9.66 8.75 -12.32 FL_1887 Training 9.98 9.42 8.47 -11.96 FL_1888 Training 9.73 9.83 8.99 -11.67 FL_1890 Training 10.06 9.33 8.98 -10.76 FL_1894 Training 9.85 8.99 8.75 -10.29 FL_1896 Training 10.21 9.80 8.51 -12.94 FL_1897 Training 10.67 8.99 8.26 -11.90 FL_1898 Training 9.59 8.77 8.21 -10.68 FL_1900 Validation 10.12 9.10 8.10 -12.08 FL_1903 Validation 11.08 8.99 8.39 -11.93 FL_1904 Validation 10.20 9.16 8.30 -11.87 FL_1905 Validation 9.73 9.21 8.22 -11.80 FL_1906 Training 9.95 8.15 8.44 -9.01 FL_1907 Validation 10.12 7.95 7.99 -9.62 FL_1910 Training 11.03 9.38 8.74 -12.10 FL 1912 Validation 9.83 9.38 9.36 -9.95 FL_1913 Training 9.81 9.75 8.43 -12.69 FL_1916 Validation 9.83 9.18 8.40 -11.43 FL_1918 Validation 9.86 9.52 8.79 -11.45 FL_1919 Training 9.87 9.53 8.79 -11.48 FL_735 Validation 10.48 8.73 8.23 -11.20 FL_738 Validation 11.05 9.10 8.75 -11.43 FL_739 Training 9.66 9.25 8.74 -10.78 FL_878 Validation 10.61 8.92 8.65 -10.89 FL_879 Training 9.92 8.94 8.78 -10.14 FL_886 Validation 10.16 9.41 8.63 -11.73 FL_888 Validation 9.35 8.76 8.38 -10.15 FL_1627 Training 9.82 9.48 8.49 -11.94 FL_1429 Training 10.06 8.70 8.14 -11.01 FL_1850 Validation 9.58 9.73 8.70 -11.93 FL_1735 Validation 9.60 7.46 8.42 -7.19 - In order to visualize the predictive power of the model, the FL samples were ranked according to their survival predictor scores and divided into four quartiles. Kaplan-Meier plots of overall survival showed clear differences in survival rate in the validation set (
Figure 8 ). The median survival for each of the four quartiles is set forth in Table 11.Table 11 Quartile Median survival (yrs.) 5-year survival 10- year survival 1 NR 94% 79% 2 11.6 82% 62% 2 8.8 69% 39% 4 3.9 38% 22% - 191 FL samples were divided into two equivalent groups: a training set for developing the survival prediction model, and a validation set for evaluating the reproducibility of the model. Gene expression data from the Lymph Dx microarray was obtained for those genes listed in Table 9, above. This gene expression data was used to calculate gene expression signature values for the macrophage, T-cell, and B-cell differentiation gene expression signatures, and these signature values were used to generate a survival predictor score using the following equation:

- A higher survival predictor score was associated with worse outcome. For the 187 FL samples with available clinical data, the survival predictor score had a mean of - 10.1 and a standard deviation of 0.69, with each unit increase in the predictor score corresponding to a 2.7 fold increase in the relative risk of death. Data for all 191 samples is shown in Table 12.
Table 12 Sample ID # Set B cell differentiation signature value T-cell signature value Macrophage signature value Survival predictor score FL_1073 Training 8.26 8.17 7.36 -10.30 FL_1074 Training 9.53 8.12 7.56 -10.53 FL_1075 Validation 9.81 8.00 7.99 -9.77 FL_1076 Training 8.46 8.10 7.62 -9.86 FL_1077 Training 8.45 8.66 7.32 -11.49 FL_1078 Training 9.23 8.32 7.32 -11.18 FL_1080 Training 9.18 8.37 7.86 -10.42 FL_1081 Validation 8.96 8.01 6.94 -10.96 FL_1083 Training 8.72 8.65 7.89 -10.75 FL_1085 Validation 8.34 8.17 7.54 -10.07 FL_1086 Validation 8.50 8.35 7.94 -9.94 FL_1087 Training 8.02 8.88 8.48 -10.00 FL_1088 Validation 9.10 8.15 7.38 -10.65 FL_1089 Training 8.76 8.31 7.35 -10.86 FL_1090 Validation 8.18 8.23 7.43 -10.28 FL_1097 Validation 8.07 8.81 7.90 -10.73 FL_1098 Validation 9.53 8.30 8.09 -10.11 FL_1099 Training 8.44 8.56 8.26 -9.86 FL_1102 Validation 7.92 8.43 7.94 -9.80 FL_1104 Training 9.17 8.07 7.21 -10.78 FL 1106 Validation 9.71 8.15 8.77 -8.85 FL 1107 Training 8.16 8.44 8.60 -8.95 FL 1183 Training 8.49 8.15 7.23 -10.56 FL 1184 Training 8.81 8.49 7.91 -10.43 FL 1185 Validation 9.31 8.19 8.06 -9.80 FL_1186 Training 8.43 7.87 7.83 -9.04 FL_1416 Validation 8.42 8.34 7.63 -10.34 FL_1417 Training 8.65 7.51 7.05 -9.58 FL_1418 Validation 7.96 7.82 7.22 -9.62 FL_1419 Training 8.80 8.71 7.55 -11.43 FL_1422 Training 8.63 8.35 7.39 -10.83 FL_1425 Validation 8.21 7.92 7.62 -9.36 FL_1426 Training 9.39 8.09 7.15 -11.01 FL_1427 Training 8.66 7.51 7.00 -9.65 FL_1428 Validation 9.33 8.18 7.39 -10.81 FL_1432 Training 8.98 8.17 7.93 -9.81 FL_1436 Training 8.04 8.17 7.35 -10.20 FL_1440 Training 8.29 7.82 7.15 -9.89 FL_1445 Training 8.04 7.78 7.63 -8.94 FL_1450 Validation 8.25 8.81 9.52 -8.39 FL_1472 Validation 9.29 7.88 7.33 -10.26 FL_1473 Training 8.49 8.57 7.52 -11.03 FL_1474 Validation 8.59 8.09 8.53 -8.54 FL_1476 Validation 8.26 8.39 7.71 -10.23 FL_1477 Training 7.94 8.57 7.88 -10.21 FL_1478 Training 8.57 8.40 7.88 -10.16 FL_1479 Training 9.15 7.83 7.87 -9.27 FL_1480 Training 8.25 8.38 7.44 -10.63 FL_1579 Training 8.70 7.73 7.43 -9.48 FL_1580 Training 8.86 8.46 7.64 -10.79 FL_1581 Training 8.41 7.89 8.08 -8.69 FL_1582 Validation 8.20 7.42 6.99 -9.24 FL_1583 Training 9.34 8.34 7.94 -10.32 FL_1584 Training 8.50 8.33 7.75 -10.17 FL_1585 Validation 9.08 7.96 7.72 -9.72 FL_1586 Validation 8.52 8.25 7.36 -10.61 FL_1588 Training 7.97 8.35 7.73 -9.98 FL_1589 Training 8.85 8.48 7.76 -10.66 FL_1591 Training 8.92 8.36 7.77 -10.42 FL_1594 Validation 8.54 8.22 7.74 -9.96 FL_1595 Training 8.05 8.82 8.68 -9.57 FL_1598 Validation 9.74 7.81 6.97 -10.88 FL_1599 Validation 9.13 8.42 7.69 -10.77 FL_1603 Training 7.97 8.66 8.90 -8.86 FL_1604 Training 8.47 8.14 7.75 -9.75 FL_1606 Validation 8.34 8.32 8.11 -9.51 FL_1607 Validation 8.33 8.30 7.39 -10.57 FL 1608 Validation 8.35 7.88 6.98 -10.31 FL_1610 Validation 8.48 8.35 8.86 -8.52 FL_1611 Validation 8.54 8.33 7.64 -10.37 FL_1616 Training 8.03 8.39 7.67 -10.18 FL_1617 Validation 8.30 7.85 7.52 -9.40 FL_1619 Validation 8.53 8.31 7.64 -10.32 FL_1620 Validation 8.09 7.99 7.17 -10.11 FL_1622 Training 8.14 8.10 7.36 -10.09 FL_1623 Training 8.45 8.52 8.15 -9.93 FL_1624 Validation 9.13 8.12 7.46 -10.49 FL _1625 Validation 8.53 7.94 7.17 -10.23 FL_1626 Validation 9.63 7.67 7.17 -10.22 FL_1628 Validation 8.63 8.76 7.95 -10.86 FL_1637 Validation 8.07 8.81 8.79 -9.38 FL_1638 Validation 8.52 8.18 8.19 -9.18 FL_1639 Training 8.70 8.33 7.89 -10.06 FL_1643 Training 8.26 8.62 8.01 -10.26 FL_1644 Validation 8.28 8.33 7.77 -10.02 FL_1645 Training 7.84 8.32 7.68 -9.91 FL_1646 Training 8.40 8.26 7.71 -10.01 FL_1647 Training 8.10 8.04 7.92 -9.10 FL_1648 Training 8.33 8.08 6.87 -10.90 FL_1652 Training 8.15 8.33 8.37 -9.07 FL_1654 Validation 8.67 7.62 7.03 -9.85 FL_1655 Training 8.53 8.41 7.75 -10.36 FL_1656 Validation 9.09 8.09 7.62 -10.16 FL_1657 Training 8.95 8.44 7.58 -10.89 FL_1660 Training 8.82 7.79 7.26 -9.93 FL_1661 Validation 8.56 8.79 8.17 -10.53 FL_1662 Validation 8.30 8.47 8.69 -8.93 FL_1664 Validation 8.62 8.23 7.56 -10.31 FL_1669 Training 7.89 7.67 7.39 -9.02 FL_1670 Training 8.01 8.54 8.64 -9.03 FL_1675 Training 9.00 8.21 7.36 -10.76 FL_1681 Validation 8.83 8.39 7.59 -10.72 FL_1683 Validation 8.14 8.85 7.97 -10.74 FL_1684 Training 7.99 8.42 7.84 -9.97 FL_1716 Validation 8.28 7.90 7.26 -9.88 FL_1717 Validation 8.27 8.21 7.89 -9.60 FL_1718 Training 8.50 8.17 7.15 -10.75 FL_1719 Validation 8.35 8.02 7.21 -10.26 FL_1720 Training 9.03 7.65 8.01 -8.61 FL_1729 Training 8.97 8.27 7.69 -10.37 FL_1732 Validation 8.49 6.82 7.71 -7.02 FL_1761 Validation 8.36 8.19 7.29 -10.49 FL_1764 Training 8.52 8.24 7.94 -9.69 FL_1768 Training 8.70 8.25 7.63 -10.28 FL_1771 Training 8.55 8.19 7.65 -10.04 FL_1772 Validation 8.30 8.38 7.41 -10.71 FL_1788 Training 8.14 8.06 8.11 -8.87 FL_1790 Training 7.95 8.69 8.36 -9.74 FL_1792 Validation 8.16 8.20 7.64 -9.88 FL_1795 Training 7.94 9.08 8.37 -10.54 FL 1797 Validation 8.17 8.21 7.87 -9.57 FL_1799 Training 9.02 8.21 7.77 -10.14 FL_1810 Validation 8.43 7.52 7.06 -9.47 FL_1811 Validation 8.33 8.24 7.07 -10.93 FL_1825 Training 8.90 8.39 7.97 -10.18 FL_1827 Training 8.47 8.77 7.96 -10.76 FL_1828 Validation 9.13 7.87 6.76 -11.01 FL_1829 Validation 8.34 8.51 7.59 -10.71 FL_1830 Validation 9.26 8.04 7.62 -10.13 FL_1833 Training 8.82 8.86 7.88 -11.26 FL_1834 Validation 9.25 8.17 7.62 -10.39 FL_1835 Validation 7.71 8.16 8.01 -9.02 FL_1836 Validation 9.06 8.52 7.59 -11.09 FL_1837 Validation 8.57 8.33 7.37 -10.79 FL_1838 Validation 8.78 8.72 8.04 -10.69 FL_1839 Training 9.27 7.36 7.37 -9.08 FL_1841 Training 8.66 8.35 8.17 -9.64 FL_1842 Validation 8.62 8.50 8.02 -10.19 FL_1844 Validation 9.37 8.40 7.47 -11.18 FL_1845 Training 8.33 8.84 8.30 -10.32 FL_1846 Validation 8.11 8.75 9.06 -8.89 FL_1848 Training 8.19 8.60 7.91 -10.33 FL_1851 Training 8.37 8.50 8.15 -9.84 FL_1853 Validation 8.37 8.14 7.43 -10.19 FL_1854 Validation 8.50 8.29 7.96 -9.78 FL_1855 Validation 8.63 8.34 7.54 -10.58 FL_1857 Validation 8.73 8.82 8.45 -10.26 FL_1861 Validation 8.21 8.50 7.50 -10.77 FL_1862 Validation 8.98 7.96 7.31 -10.28 FL_1863 Validation 9.30 8.22 7.86 -10.18 FL_1864 Training 8.13 8.93 8.27 -10.46 FL_1866 Training 8.62 8.78 7.91 -10.93 FL_1870 Validation 8.16 8.97 8.52 -10.18 FL_1873 Training 8.55 8.30 8.00 -9.74 FL_1874 Validation 8.43 8.20 7.59 -10.10 FL_1876 Validation 8.48 8.52 7.70 -10.64 FL_1879 Training 8.29 8.21 7.66 -9.94 FL_1880 Validation 8.56 7.76 7.34 -9.61 FL_1882 Training 8.02 8.40 7.71 -10.14 FL_1884 Validation 8.14 8.46 8.42 -9.24 FL_1885 Validation 8.88 8.57 7.78 -10.81 FL_1887 Training 8.38 8.39 7.38 -10.78 FL_1888 Training 8.14 8.74 8.07 -10.37 FL_1890 Training 8.45 8.24 8.11 -9.41 FL_1894 Training 8.38 7.97 7.82 -9.25 FL_1896 Training 8.63 8.71 7.52 -11.37 FL_1897 Training 9.01 7.91 6.93 -10.78 FL_1898 Training 8.08 7.75 7.09 -9.74 FL_1900 Validation 8.61 7.94 6.84 -10.77 FL_1903 Validation 9.63 7.96 7.30 -10.64 FL_1904 Validation 8.79 8.14 7.15 -10.82 FL_1905 Validation 8.22 8.24 7.36 -10.43 FL_1906 Training 8.40 7.40 7.24 -8.93 FL_1907 Validation 8.61 7.11 6.59 -9.40 FL_1910 Training 9.47 8.28 7.63 -10.73 FL_1912 Validation 8.32 8.45 8.52 -9.18 FL_1913 Training 8.24 8.60 7.23 -11.41 FL_1916 Validation 8.31 8.04 7.27 -10.19 FL_1918 Validation 8.30 8.49 7.78 -10.37 FL_1919 Training 8.05 8.42 8.00 -9.75 FL_735 Validation 9.03 7.83 7.41 -9.88 FL_738 Validation 9.54 8.07 7.65 -10.30 FL_739 Training 8.14 8.09 7.69 -9.57 FL_878 Validation 9.17 7.91 7.70 -9.69 FL_879 Training 8.37 7.96 7.67 -9.45 FL_886 Validation 8.59 8.38 7.67 -10.44 FL_888 Validation 7.85 7.71 7.07 -9.56 FL_1627 Training 8.26 8.17 7.36 -10.30 FL_1429 Training 9.53 8.12 7.56 -10.53 FL_1850 Validation 9.81 8.00 7.99 -9.77 FL_1735 Validation 8.46 8.10 7.62 -9.86 - In order to visualize the predictive power of the model, the FL samples were ranked according to their survival predictor scores and divided into four quartiles. Kaplan-Meier plots of overall survival showed clear differences in survival rate in the validation set (
Figure 9 ). - Gene expression data from Affymetrix U133A and U133B microarrays was obtained for 231 DLBCL samples. The follow-up time and status at follow-up for each of the subjects from whom these samples were acquired is listed in Table 13. Table 2368 also indicates which samples were used in creating the survival predictor.
Table 13 Sample ID # Length of follow-up (years) Status at follow-up Used in creating survival predictor? ABC_1000 0.69 Dead Yes ABC_1002 0.28 Dead Yes ABC_1023 5.57 Dead Yes ABC_1027 0.25 Dead Yes ABC_1031 6.64 Dead Yes ABC_1034 2.31 Dead Yes ABC_1038 0.71 Dead Yes ABC_1043 2.31 Dead Yes ABC_1045 2.26 Dead Yes ABC_1055 7.81 Alive Yes ABC_1057 2.13 Dead Yes ABC_1059 2.00 Dead Yes ABC_1061 1.04 Dead Yes ABC_1946 0.68 Dead No ABC_1994 1.21 Dead No ABC_2001 1.32 Dead No ABC_304 1.31 Dead Yes ABC_305 0.82 Alive Yes ABC_309 2.80 Alive Yes ABC_413 0.60 Dead Yes ABC_428 11.38 Alive Yes ABC_432 0.38 Dead Yes ABC_446 2.82 Dead Yes ABC_462 7.49 Dead Yes ABC_477 1.70 Dead Yes ABC_481 10.75 Alive Yes ABC_482 7.72 Alive Yes ABC_538 0.34 Dead Yes ABC_541 4.11 Alive Yes ABC_544 1.31 Dead Yes ABC 547 0.05 Dead Yes ABC_577 1.65 Alive Yes ABC_616 0.99 Dead Yes ABC_626 2.49 Dead Yes ABC_633 2.02 Alive Yes ABC_642 0.34 Dead Yes ABC_644 0.31 Dead Yes ABC_645 6.08 Dead Yes ABC_646 2.59 Dead Yes ABC_651 2.34 Alive Yes ABC_652 0.01 Dead Yes ABC_660 0.20 Dead Yes ABC_663 0.62 Dead Yes ABC_668 6.44 Alive Yes ABC_676 1.00 Dead Yes ABC_678 0.06 Dead Yes ABC_687 0.94 Dead Yes ABC 689 2.54 Dead Yes ABC_692 10.53 Alive Yes ABC_694 4.83 Alive Yes ABC_700 5.40 Dead Yes ABC_702 4.13 Dead Yes ABC_704 9.67 Alive Yes ABC_709 0.47 Dead Yes ABC_712 3.26 Dead Yes ABC_714 2.45 Dead Yes ABC_717 0.42 Dead Yes ABC_725 0.96 Dead Yes ABC_726 7.62 Alive Yes ABC_730 1.03 Dead Yes ABC_753 0.04 Dead Yes ABC_756 7.21 Alive Yes ABC_771 6.80 Dead Yes ABC_779 0.35 Dead Yes ABC_800 0.33 Dead Yes ABC_807 0.31 Dead Yes ABC_809 0.51 Dead Yes ABC_816 1.86 Dead Yes ABC_820 1.59 Dead Yes ABC_823 0.16 Dead Yes ABC_835 1.22 Dead Yes ABC_839 0.29 Dead Yes ABC_841 10.14 Alive Yes ABC_858 3.58 Dead Yes ABC_872 5.00 Alive Yes ABC_875 8.45 Alive Yes ABC_912 16.79 Alive Yes ABC_996 0.21 Dead Yes GCB_1005 5.77 Alive Yes GCB_1008 6.46 Alive Yes GCB_1009 9.68 Alive Yes GCB_1021 14.59 Alive Yes GCB_1025 2.86 Dead ' Yes GCB 1026 6.94 Dead Yes GCB_1037 0.23 Dead Yes GCB_1039 2.05 Dead Yes GCB_1049 1.33 Dead Yes GCB_1051 0.12 Dead Yes GCB_1058 0.42 Dead Yes GCB_1060 6.45 Alive Yes GCB_1990 0.06 Dead No GCB_1991 1.01 Dead No GCB_2017 0.08 Dead No GCB_2018 0.17 Dead No GCB_2095 0.97 Alive No GCB_412 12.12 Alive Yes GCB_415 5.38 Dead Yes GCB_421 1.24 Dead Yes GCB_424 10.62 Dead Yes GCB_433 0.76 Dead Yes GCB_434 10.53 Alive Yes GCB_438 8.15 Alive Yes GCB_459 9.65 Alive Yes GCB_470 11.17 Alive Yes GCB_479 7.24 Alive Yes GCB_492 11.29 Alive Yes GCB_517 3.03 Dead Yes GCB_523 8.36 Alive Yes GCB_524 5.88 Alive Yes GCB_529 1.06 Dead Yes GCB_533 0.71 Dead Yes GCB_537 4.99 Dead Yes GCB_543 3.47 Alive Yes GCB_545 1.10 Dead Yes GCB_549 2.68 Dead Yes GCB_550 21.78 Alive Yes GCB_553 0.82 Dead Yes GCB_565 9.11 Dead Yes GCB_572 14.24 Alive Yes GCB_617 5.88 Alive Yes GCB_618 5.65 Alive Yes GCB_619 8.76 Alive Yes GCB_623 2.43 Alive . Yes GCB_627 1.27 Dead Yes GCB_654 7.37 Alive Yes GCB_661 0.56 Alive Yes GCB_669 7.11 Alive Yes GCB_672 6.78 Alive Yes GCB 674 7.22 Alive Yes GCB_675 6.02 Alive Yes GCB_681 9.70 Alive Yes GCB_688 0.33 Dead Yes GCB_695 0.15 Dead Yes GCB_698 3.88 Alive Yes GCB_701 3.90 Alive Yes GCB_710 1.08 Dead Yes GCB_711 3.93 Dead Yes GCB_722 3.32 Alive Yes GCB_724 1.40 Dead Yes GCB_731 10.18 Alive Yes GCB_742 4.09 Alive Yes GCB_744 8.86 Alive Yes GCB_745 1.33 Dead Yes GCB_747 15.41 Alive Yes GCB_749 10.40 Alive Yes GCB_758 1.10 Dead Yes GCB_772 2.48 Alive Yes GCB_777 4.27 Dead Yes GCB_792 5.53 Alive Yes GCB_795 3.43 Alive Yes GCB_797 6.87 Dead Yes GCB_803 1.45 Dead Yes GCB_810 11.72 Alive Yes GCB_817 2.76 Dead Yes GCB_818 0.10 Dead Yes GCB_819 0.72 Dead Yes GCB_821 9.47 Alive Yes GCB_832 4.01 Alive Yes GCB_836 4.29 Alive Yes GCB_840 3.40 Alive Yes GCB_847 4.16 Alive Yes GCB_860 3.03 Dead Yes GCB_871 0.41 Dead Yes GCB_874 0.12 Dead Yes GCB_995 6.65 Alive Yes PMBL_1006 7.12 Alive Yes PMBL_1024 19.83 Alive Yes PMBL_1048 7.70 Alive Yes PMBL_1053 1.04 Dead Yes PMBL_1920 1.97 Alive No PMBL_1921 4.16 Alive No PMBL_1923 1.60 Alive No PMBL_1924 6.11 Alive No PMBL_1935 12.42 Alive No PMBL_1941 0.71 Alive No PMBL_1942 0.88 Alive No PMBL_1943 8.96 Alive No PMBL_1945 0.84 Dead No PMBL_1948 7.96 Alive No PMBL_1949 4.28 Alive No PMBL_1989 1.33 Dead No PMBL_1992 1.00 Dead No PMBL_1993 1.33 Dead No PMBL_2002 6.62 Alive No PMBL_2019 0.99 Dead No PMBL_2020 2.08 Alive No PMBL_2092 1.27 Alive No PMBL_484 1.40 Dead Yes PMBL_546 0.78 Dead Yes PMBL_570 14.40 Alive Yes PMBL_621 8.14 Alive Yes PMBL_638 0.70 Dead Yes PMBL_691 0.32 Dead Yes PMBL_791 1.33 Dead Yes PMBL_824 12.24 Alive Yes PMBL_906 16.80 Alive Yes PMBL_994 4.79 Alive Yes PMBL_998 9.11 Alive Yes UC_DLBCL_1001 0.33 Dead Yes UC DLBCL_1004 6.72 Alive Yes UC_DLBCL_1007 2.26 Dead Yes UC_DLBCL_1018 0.03 Dead Yes UC_DLBCL_1041 3.13 Dead Yes UC_DLBCL_1054 12.34 Alive Yes UC_DLBCL_306 2.69 Alive Yes UC_DLBCL_310 0.97 Alive Yes UC_DLBCL_449 9.16 Alive Yes UC_DLBCL_452 9.17 Alive Yes UC_DLBCL_458 1.18 Dead Yes UC_DLBCL_460 9.02 Alive Yes UC_DLBCL_491 4.47 Dead Yes UC_DLBCL_528 1.64 Alive Yes UC_DLBCL_615 4.94 Alive Yes UC_DLBCL_625 5.24 Alive Yes UC_DLBCL_664 0.62 Dead Yes UC_DLBCL_671 3.35 Alive Yes UC_DLBCL_682 0.11 Dead Yes UC_DLBCL_683 7.42 Alive Yes UC_DLBCL_684 1.92 Dead Yes UC_DLBCL_748 1.01 Dead Yes UC DLBCL_751 9.99 Alive Yes UC_DLBCL_808 0.37 Dead Yes UC_DLBCL_831 11.02 Dead Yes UC_DLBCL_834 1.64 Dead Yes UC_DLBCL_838 0.00 Dead Yes UC_DLBCL_851 0.05 Dead Yes UC_DLBCL_854 1.51 Dead Yes UC_DLBCL_855 1.67 Alive Yes UC_DLBCL_856 0.60 Dead Yes - The correlation between expression of each gene represented on the microarrays and survival was estimated using a Cox proportional hazards model. A positive Cox coefficient indicated increasing mortality with increasing expression of the gene, while a negative Cox coefficient indicated decreasing mortality with increasing expression of the gene.
- Genes that were significantly correlated with survival (p<0.001) were grouped into gene expression signatures using a hierarchical clustering algorithm. The expression level of every component gene in each of these gene expression signatures was averaged for each sample to create a gene expression signature value. A step-up procedure (Drapner 1966) was applied to determine the optimal number of gene signatures to use In the survival predictor model. First, the gene expression signature that was most significantly associated with survival was included in the model. Next, the gene expression signature with the second highest association with survival was added to the model to form a two-component model. This procedure was repeated until there was no gene expression signature to add to the model with a p-value of <0.05.
- The final prediction model Incorporated gene expression signature values from three gene expression signatures. The first gene expression signature added to the model was termed "ABC DLBCL high," because it included genes that were more highly expressed in ABC than in GCB (Rosenwald 2002). The second gene expression signature added to the model was termed "lymph node," because it reflected the response of non-tumor cells in the lymph node to the malignant lymphoma cells, The final gene expression signature added to the model was termed "MHC class II," because it included all of the genes encoding the MHC class II alpha and beta chains. Table 14 shows the genes that were averaged to form each of these signatures.
Table 14 Signature UNIQID Gene symbol Survival p-value ABC DLBCL high 1134271 POU5F1 3.09E-05 ABC DLBCL high 1121564 DRIL1 4.06E-05 ABC DLBCL high 1119889 PDCD4 7.28E-05 ABC DLBCL high 1133300 CTH 1.23E-04 ABC DLBCL high 1106030 MGC:50789 1.70E-04 ABC DLBCL high 1139301 FLJ20150 4.49E-04 ABC DLBCL high 1122131 CHST7 5.18E-04 ABC DLBCL high 1114824 LIMD1 5.20E-04 ABC DLBCL high 1100161 LOC142678 6.24E-04 ABC DLBCL high 1120129 TLE1 6.95E-04 Lymph node 1097126 TEM8 5.14E-09 Lymph node 1120880 LTBP2 9.80E-07 Lymph node 1098898 FLJ31066 1.09E-08 Lymph node 1123378 RARRES2 1.68E-06 Lymph node 1128945 SLC12A8 2.90E-06 Lymph node 1130994 DPYSL3 3.37E-06 Lymph node 1124429 SULF1 3.53E-06 Lymph node 1099358 FLJ39971 4.09E-06 Lymph node 1130509 SPARC 6.23E-06 Lymph node 1095986 TMEPAI 7.07E-06 Lymph node 1123038 ACTN1 7.90E-06 Lymph node 1133700 CDH11 8.20E-06 Lymph node 1122901 TFEC 9.66E-06 Lymph node 1124296 SDC2 9.99E-06 MHC Class II 1123127 HLA-DRA 1.21E-06 MHC Class II 1136777 HLA-DQA1 3.45E-06 MHC Class II 1137771 HLA-DRB1 3.95E-06 MHC Class II 1134281 HLA-DRB4 2.70E-05 MHC Class II 1136573 HLA-DPA1 2.92E-05 MHC Class II 1132710 HLA-DRB3 7.09E-05 - Fitting the Cox proportional hazards model to the three gene expression signature values resulted in the following model:


- A higher survival predictor score was associated with worse outcome. According to a likelihood ratio test adjusted for the number of variables included, this model was significant in predicting survival at p=2.13x10⁻¹³, In order to visualize the predictive power of the model, the 205 samples used to create the model were ranked according to their survival predictor scores and divided into four quartiles. Kaplan-Meier plots of overall survival probability show clear differences in survival rate between these four quartiles (
Figure 10 ). The five-year survival probabilities for each quartile are set forth in Table 15.Table 15 Quartile 5- year survival 1 83% 2 59% 3 33% 4 17% - A DLBCL survival model based on gene expression had been developed previously using proliferation, germinal center B-cell, lymph node, and MHC class II gene expression signatures and the expression of the single gene BMP-6 (Rosenwald 2002). BMP-6 expression was poorly measured on the Lymph Dx microarray, but genes associated with each of these four gene expression signatures exhibited associations with survival similar to those observed using Lymphochip microarrays. DLBCL samples were divided into two groups: a training set (100 samples) for developing the survival prediction model, and a validation set (100 samples) for evaluating the reproducibility of the model. Gene expressed in the training set samples were clustered, and lymph node, germinal center B-cell, MHC class II, and proliferation gene expression signatures were identified. Within each signature, expression of genes that were associated with survival (p<0,01) was averaged to generate a gene expression signature value for each signature. Table 16 lists the genes that were used to generate the gene expression signature value for each signature.
Table 16 Signature UNIQID Unigene ID Build 167 (http://www.ncbi.nlm. nih.gov/UniGene) Gene symbol Germinal center B-cell 1099686 117721 Germinal center B-cell 1099711 243596 Germinal center B-cell 1103390 271752 BPNT1 Germinal center B-cell 1106025 49500 KIAA0746 Germinal center B-cell 1128287 300063 ASB13 Germinal center B-cell 1132520 283063 LMO2 Germinal center B-cell 1138192 126608 NR3C1 Germinal center B-cell 1529318 291954 Germinal center B-cell 1529344 317970 SERPINA11 Germinal center B-cell 1529352 446195 Germinal center B-cell 1096570 409813 ANUBL1 Germinal center B-cell 1097897 266175 PAG Germinal center B-cell 1097901 266175 PAG Germinal center B-cell 1098611 433611 PDK1 Germinal center B-cell 1100581 155024 BCL6 Germinal center B-cell 1115034 387222 NEK6 Germinal center B-cell 1120090 155024 BCL6 Germinal center B-cell 1120946 25209 MAPK10 Germinal center B-cell 1121248 54089 BARD1 Germinal center B-cell 1123105 434281 PTK2 Germinal center B-cell 1125458 300592 MYBL1 Germinal center B-cell 1128694 171466 ELL3 Germinal center B-cell 1128787 114611 C7orf10 Germinal center B-cell 1132122 307734 MME Germinal center B-coll 1136269 101474 MAST2 Germinal center B-coll 1136702 155584 KIAA0121 Germinal center B-cell 1139230 29724 PLEKHF2 Germinal center B-cell 1529292 NA Germinal center B-cell 1529295 116441 Lymph node 1097126 274520 ANTXR1 Lymph node 1099028 334838 FNDC1 Lymph node 1099358 93135 Lymph node 1101478 146246 MGC46780 Lymph node 1103497 50115 Lymph node 1121029 412999 CSTA Lymph node 1124429 409602 SULF1 Lymph node 1135068 71719 PDLIM3 Lymph node 1136051 520937 CSF2RA Lymph node 1136172 38084 SULT1C1 MHC class II 1136777 387679 HLA-DQA1 MHC class II 1136877 409934 HLA-DQB1 Proliferation 1096903 437460 FLJ10385 Proliferation 1120583 153768 RNU3IP2 Proliferation 1123289 5409 POLR1C Proliferation 1131808 75447 RALBP1 Proliferation 1133102 360041 FRDA Proliferation 1136595 404814 VDAC1 - Table 17 lists p-values for the association of each signature with survival in the training set, the validation set, and overall.
Table 17 Signature Training set Validation set Overall Lymph node 4.0 x 10⁻⁵ 2.3 x 10⁻⁶ 6.8 x 10⁻¹⁰ Proliferation 8.1 x 10⁻⁵ 3.4 x 10⁻³ 2.1 x 10⁻⁶ Germinal center B-cell 6.2 x 10⁻⁶ 2.1 x 10⁻³ 5.0 x 10⁻⁸ MHC class II 2.4 x 10⁻² 2.7 x 10⁻³ 3.1 x 10⁻⁴ - The four gene expression signatures were used to generate a survival predictor score using the following equation:

- A higher survival predictor score was associated with worse outcome. For the 200 DLBCL samples used to generate the model, the survival predictor score had a mean of 5.7 and a standard deviation of 0.78, with each unit increase in the predictor score corresponding to an approximately 2.7 fold increase in the relative risk of death. Data for all 200 samples is presented in Table 18.
Tables 18 Sample ID # Set Lymph node signature value Proliferation signature value Germinal center B-cell signature value MHC class II signature value Survival predictor score ABC_1000 Validation 6.50 8.92 7.60 11.50 -5.08 ABC_1002 Validation 7.00 8.58 7.27 12.54 -5.50 ABC_1023 Validation 7.43 8.99 6.80 11.42 -5.05 ABC_1027 Training 5.68 9.00 6.87 12.31 -4.70 ABC_1031 Validation 8.02 9.00 7.17 11.68 -5.53 ABC_1034 Validation 6.06 9.61 6.72 11.83 -4.58 ABC_1038 Training 6.83 8.97 7.17 12.30 -5.23 ABC_1043 Training 6.96 9.01 6.77 12.29 -5.11 ABC_1045 Validation 8.18 8.21 6.77 12.07 -5.66 ABC_1055 Validation 5.58 9.16 7.30 13.05 -4.76 ABC_1057 Training 7.33 8.94 7.74 12.05 -5.53 ABC_1059 Validation 9.02 8.46 7.15 11.35 -6.08 ABC_1061 Training 7.13 9.18 7.09 12.28 -5.21 ABC_304 Validation 5.92 8.80 6.76 12.76 -4.84 ABC_305 Training 5.92 8.74 7.50 11.89 -4.91 ABC_309 Validation 8.86 8.39 7.62 12.53 -6.46 ABC_413 Validation 6.45 9.32 6.55 9.04 -4.16 ABC_428 Training 7.52 9.19 7.98 10.25 -5.51 ABC_432 Validation 6.48 9.33 7.45 9.56 -4.56 ABC_446 Training 7.91 9.42 7.41 10.55 -5.46 ABC_462 Validation 6.41 8.85 6.67 13.36 -5.03 ABC_477 Validation 6.26 9.02 6.69 12.46 -4.89 ABC_481 Training 8.18 8.30 7.35 11.98 -5.91 ABC_482 Training 8.59 9.01 7.66 12.35 -6.16 ABC_538 Validation 8.06 8.84 7.17 11.83 -5.69 ABC_541 Training 6.14 8.52 7.42 10.59 -4.71 ABC_544 Training 6.91 9.03 6.82 11.87 -4.89 ABC_547 Validation 5.80 8.96 7.14 11.38 -4.60 ABC_577 Validation 7.84 8.65 8.16 11.95 -5.94 ABC_616 Validation 6.03 9.05 7.36 -12.64 -4.84 ABC_626 Validation 7.48 9.22 7.25 11.11 -5.27 ABC_633 Training 7.74 8.35 7.39 12.45 -5.80 ABC_642 Training 5.71 8.82 6.41 13.80 -4.62 ABC_644 Validation 6.64 9.15 7.05 13.28 -5.20 ABC_645 Training 8.44 8.81 7.93 13.39 -6.43 ABC_646 Validation 5.94 9.11 6.71 11.60 -4.63 ABC_652 Validation 5.87 8.85 6.88 12.73 -4.77 ABC_660 Training 5.19 9.34 6.64 10.17 -3.86 ABC_663 Training 5.69 9.02 7.33 12.82 -4.91 ABC_668 Validation 7.12 9.28 7.03 10.57 -4.91 ABC_676 Training 4.95 8.90 7.09 13.32 -4.61 ABC_678 Training 5.84 9.11 7.34 11.26 -4.41 ABC_687 Validation 5.15 9.89 6.56 10.46 -3.76 ABC_689 Training 6.49 8.86 7.10 12.56 -4.88 ABC_692 Validation 7.32 8.96 7.25 11.57 -5.32 ABC_694 Validation 8.28 9.21 8.01 12.41 -6.23 ABC_700 Training 7.29 8.97 7.55 12.10 -5.48 ABC_702 Validation 7.60 8.66 6.86 12.55 -5.45 ABC_704 Training 7.07 8.92 7.03 12.83 -5.35 ABC_709 Validation 5.92 8.58 6.37 13.40 -4.66 ABC_712 Validation 5.79 9.12 6.34 12.02 -4.23 ABC_714 Training 7.49 8.88 7.49 11.97 -5.54 ABC_717 Training 7.17 9.45 7.01 11.34 -5.05 ABC_725 Training 6.71 9.01 6.52 12.76 -4.86 ABC_726 Validation 6.91 8.72 6.71 11.91 -4.90 ABC_730 Validation 6.28 9.22 7.28 12.14 -4.88 ABC_753 Training 6.84 9.64 7.05 13.00 -5.22 ABC_756 Training 7.67 8.45 7.59 12.48 -5.85 ABC_771 Training 6.98 8.76 6.91 12.20 -5.18 ABC_779 Training 6.73 9.32 6.78 9.82 -4.44 ABC_800 Validation 8.75 8.31 7.45 11.91 -6.04 ABC_807 Training 5.50 9.53 6.92 7.56 -3.79 ABC_809 Training 7.40 8.70 7.68 10.83 -5.50 ABC_816 Training 5.20 9.91 7.65 10.64 -4.14 ABC_820 Training 6.71 8.94 6.55 11.98 -4.85 ABC_823 Validation 5.58 9.26 6.44 10.09 -3.97 ABC_835 Validation 6.95 8.68 8.04 12.31 -5.59 ABC_839 Training 6.63 9.17 7.23 11.89 -5.04 ABC_841 Validation 6.35 9.51 7.52 13.19 -5.28 ABC_858 Training 7.63 8.51 7.12 11.74 -5.42 ABC_872 Training 6.78 8.73 7.41 12.47 -5.44 ABC_875 Training 7.59 8.81 7.20 11.26 -5.25 ABC_912 Validation 7.01 8.55 7.45 12.79 -5.64 ABC_996 Validation 5.00 9.53 6.70 10.02 -3.94 GCB_1005 Validation 8.28 8.67 9.11 13.27 -6.98 GCB_1008 Training 8.17 8.59 9.83 12.83 -7.06 GCB_1009 Training 6.63 9.02 10.07 12.28 -6.19 GCB_1021 Validation 6.44 8.83 9.34 13.20 -6.15 GCB_1025 Validation 7.87 8.48 9.27 12.37 -6.57 GCB_1026 Training 7.71 8.30 9.81 13.52 -6.85 GCB_1037 Training 4.95 8.83 9.35 12.57 -5.22 GCB_1039 Training 7.63 8.65 9.01 13.28 -6.47 GCB_1049 Validation 8.54 8.61 8.12 12.60 -6.41 GCB_1051 Validation 6.26 9.09 9.48 12.76 -5.97 GCB 1058 Validation 7.12 8.89 8.34 12.80 -5.85 GCB_1060 Validation 8.27 8.84 8.94 12.96 -6.75 GCB_412 Training 7.22 8.33 8.50 13.09 -6.09 GCB_415 Training 9.01 8.62 8.38 11.99 -6.47 GCB_421 Training 7.59 7.89 7.49 12.20 -5.80 GCB_424 Training 9.29 8.42 8.51 12.44 -6.79 GCB_433 Training 8.45 8.34 8.02 12.64 -6.54 GCB_434 Training 8.46 8.55 9.17 12.54 -6.98 GCB_438 Validation 8.14 8.71 9.13 12.51 -6.67 GCB_459 Validation 8.98 8.39 8.42 11.37 -6.49 GCB_470 Validation 7.72 8.57 8.67 12.23 -6.12 GCB_479 Validation 6.86 8.25 7.13 13.07 -5.35 GCB_492 Training 8.01 8.61 9.51 12.34 -6.63 GCB_517 Validation 8.57 8.73 7.99 12.76 -6.48 GCB_523 Training 5.96 8.56 8.74 12.77 -5.72 GCB_524 Training 8.51 8.09 8.76 12.51 -6.57 GCB_529 Training 5.12 9.17 8.88 10.77 -4.86 GCB_533 Training 8.88 8.81 8.36 12.44 -6.60 GCB_537 Validation 7.42 8.19 9.73 13.29 -6.68 GCB_543 Validation 8.49 8.02 8.66 12.06 -6.45 GCB_545 Training 8.65 8.28 6.90 12.90 -6.13 GCB_549 Validation 6.87 8.24 8.65 12.15 -6.00 GCB_550 Validation 8.98 8.29 8.76 12.24 -6.94 GCB_553 Validation 8.51 8.64 8.62 12.63 -6.69 GCB_565 Validation 7.97 8.79 9.79 13.42 -6.98 GCB_572 Training 7.61 8.60 9.39 12.58 -6.42 GCB_617 Validation 8.31 7.89 7.64 13.17 -6.12 GCB_618 Training 5.66 8.97 9.20 13.32 -5.54 GCB_619 Validation 7.83 8.65 9.34 12.12 -6.36 GCB_623 Training 7.16 8.88 9.26 12.35 -6.21 GCB_627 Validation 8.13 8.83 8.62 11.85 -6.31 GCB_654 Training 6.30 9.60 8.45 10.00 -4.88 GCB_661 Validation 8.46 8.51 8.18 12.66 -6.33 GCB_669 Training 7.88 8.65 8.59 12.32 -6.19 GCB_672 Training 8.29 8.61 8.14 12.41 -6.21 GCB_674 Validation 8.36 8.62 7.76 12.33 -6.14 GCB_675 Validation 6.01 9.52 8.90 10.12 -5.09 GCB_681 Training 9.25 8.72 8.72 12.59 -6.89 GCB_688 Validation 6.97 9.01 9.90 9.94 -5.99 GCB_695 Validation 8.80 8.73 9.23 12.45 -6.84 GCB_698 Validation 9.27 8.35 8.85 11.99 -6.96 GCB_701 Training 7.77 7.93 8.68 13.10 -6.33 GCB_710 Validation 6.12 8.78 7.65 13.19 -5.24 GCB_711 Training 7.57 8.80 8.43 11.44 -5.84 GCB_722 Training 7.78 8.31 8.93 12.61 -6.51 GCB_724 Training 7.88 9.08 8.74 11.53 -6.21 GCB_731 Validation 7.72 8.92 9.08 12.20 -6.46 GCB_742 Vacation 8.33 8.55 8.58 12.95 -6.70 GCB_744 Training 8.02 8.64 9.36 11.85 -6.52 GCB_745 Training 8.47 8.34 8.93 11.95 -6.67 GCB_747 Validation 7.64 8.48 8.32 13.06 -6.27 GCB_749 Training 7.57 8.61 9.40 12.55 -6.56 GCB_758 Validation 5.66 8.77 7.89 12.51 -4.63 GCB_772 Validation 8.52 7.81 7.95 12.25 -6.34 GCB_777 Validation 7.52 8.65 8.57 11.69 -6.10 GCB_792 Training 8.14 8.64 9.21 12.08 -6.65 GCB_795 Validation 9.19 8.17 8.81 11.60 -6.92 GCB_797 Validation 7.50 8.62 8.08 12.84 -6.09 GCB_803 Validation 6.19 8.65 9.49 13.18 -8.11 GCB_810 Training 8.46 8.32 8.10 13.13 -6.50 GCB_817 Training 6.93 8.59 9.49 11.09 -6.04 GCB_818 Training 7.18 8.96 8.08 12.23 -5.76 GCB_819 Validation 7.16 8.97 8.06 13.22 -5.79 GCB_821 Validation 8.13 8.59 8.90 12.41 -6.61 GCB_832 Training 7.83 8.35 8.71 12.47 -6.37 GCB_836 Validation 7.84 8.99 8.50 11.46 -5.85 GCB_840 Training 8.24 7.75 7.40 11.74 -5.77 GCB_847 Training 7.82 8.17 8.97 12.55 -6.51 GCB_860 Training 7.12 8.39 9.34 11.54 -6.10 GCB_871 Training 5.59 9.60 7.28 11.16 -4.23 GCB_874 Training 8.53 9.14 8.95 11.65 -6.47 GCB_995 Validation 6.98 8.68 8.54 12.22 -5.76 PMBL_1006 Validation 7.34 8.51 7.66 10.94 -5.33 PMBL 1024 Validation 7.62 8.48 8.56 10.89 -5.96 PMBL_1048 Validation 8.68 8.16 7.23 12.18 -6.08 PMBL_1053 Training 7.02 8.28 8.24 11.12 -5.31 PMBL_484 Training 7.15 8.45 7.01 13.62 -5.41 PMBL_546 Validation 8.19 7.88 7.66 11.73 -6.06 PMBL_570 Training 9.34 8.21 8.48 12.70 -6.86 PMBL_621 Training 8.08 8.60 9.14 12.96 -6.72 PMBL_638 Training 7.56 8.26 8.00 11.37 -5.75 PMBL_691 Validation 6.48 8.92 8.40 10.17 -5.04 PMBL_791 Validation 7.72 8.65 8.94 11.56 -6.16 PMBL_824 Validation 8.06 8.01 7.76 13.28 -6.11 PMBL_994 Training 9.15 8.36 7.46 12.43 -6.29 PMBL_998 Training 6.70 8.35 9.24 13.19 -6.20 UC_DLBCL_1001 Validation 6.74 8.43 7.10 12.76 -5.31 UC_DLBCL_1004 Validation 7.54 8.75 8.01 13.09 -6.10 UC_DLBCL_1007 Training 9.97 8.44 7.64 12.97 -6.85 UC_DLBCL_1018 Training 6.42 8.38 6.97 12.71 -5.03 UC_DLBCL_1041 Validation 5.76 8.69 6.78 13.38 -4.71 UC_DLBCL_1054 Training 8.92 8.65 8.51 11.48 -6.59 UC_DLBCL_306 Validation 7.85 8.90 8.31 12.36 -6.23 UC_DLBCL_310 Training 8.14 8.80 7.63 12.27 -6.03 UC_DLBCL_449 Validation 9.03 8.48 7.07 12.17 -6.01 UC_DLBCL_458 Training 5.92 8.53 8.28 9.60 -4.96 UC_DLBCL_460 Validation 7.92 9.08 8.30 12.29 -6.13 UC_DLBCL_491 Training 7.65 8.33 7.35 12.39 -5.53 UC_DLBCL_528 Validation 6.99 8.56 7.36 11.63 -5.35 UC_DLBCL_615 Validation 7.11 8.32 8.77 12.80 -6.10 UC_DLBCL_625 Training 8.93 7.78 7.85 12.62 -6.46 UC_DLBCL_664 Training 7.62 8.15 8.17 12.72 -6.04 UC_DLBCL_671 Training 8.09 8.48 7.61 11.53 -5.78 UC_DLBCL_682 Training 7.38 8.35 7.14 12.33 -5.43 UC_DLBCL_683 Training 7.91 8.36 7.78 12.57 -6.02 UC_DLBCL_684 Validation 8.06 8.63 8.29 12.76 -6.29 UC_DLBCL_748 Validation 5.38 8.57 7.45 9.55 -4.23 UC_DLBCL_751 Training 6.33 8.65 8.88 13.14 -5.74 UC_DLBCL_808 Training 7.42 9.01 7.44 13.09 -5.63 UC_DLBCL_831 Validation 8.33 8.30 7.46 11.58 -5.84 UC_DLBCL_834 Training 6.98 9.09 8.61 11.77 -5.66 UC_DLBCL_838 Validation 7.25 8.40 7.23 12.56 -5.36 UC_DLBCL_851 Validation 6.28 9.05 6.78 8.19 -4.10 UC_DLBCL_864 Validation 7.36 8.50 7.39 12.59 -5.53 UC_DLBCL_855 Training 8.31 7.94 7.49 12.08 -6.07 UC_DLBCL_856 Validation 5.65 9.01 8.52 9.32 -4.68 - In order to visualize the predictive power of the model, the 200 samples were ranked according to their survival predictor scores and divided into four quartiles. Kaplan-Meier plots of overall survival probability show clear differences in survival rate between these four quartiles (
Figure 11 ). - The number of genes used to generate the DLBCL survival predictor in Example 7 were reduced in order to create a survival predictor compatible with RT-PCR. The list of genes from the lymph node and germinal center B-cell gene expression signatures was narrowed to those three genes from each signature that were most closely correlated with the lymph node and germinal center B-cell gene expression signature values, respectively. The genes from the proliferation gene expression signature did not add significantly to the reduced gene survival prediction model, so they were removed entirely. The expression of the genes within each signature was averaged on the log2 scale to generate a gene expression signature value for each signature. Table 19 lists the genes that were used to generate these gene expression signature values.
Table 19 Signature UNIQID Unigene ID Build 167 http://www.ncbi.nlm .nih.gov/UniGene Gene symbol Germinal center B-cell 1099686 117721 Germinal center B-cell 1529318 291954 Germinal center B-cell 1529344 317970 SERP1NA11 Lymph node 1097126 274520 ANTXR1 Lymph node 1099358 93135 Lymph node 1121029 412999 CSTA MHC class II 1136777 387679 HLA-DQA1 MHC class II 1136877 409934 HLA-DQB1 - Table 20 lists p-values for the association of each signature with survival in the training set, the validation set, and overall.
Table 20 Signature Training set Validation set Overall Lymph node 6.1 x 10⁻⁶ 0.0021 2.1 x 10⁻¹⁷ Germinal center B-cell 3.5 x 10⁻⁴ 0.0099 2.7 x 10⁻⁵ MHC class II 0.024 0.0026 0.00031 - The three gene expression signatures were used to generate a survival predictor score using the following equation:


- A higher survival predictor score was associated with worse outcome. For the 200 DLBCL samples used to generate the model, the survival predictor score had a mean of 6.54 and a standard deviation of 0.69, with each unit increase in the predictor score corresponding to an approximately 2.7 fold increase in the relative risk of death. Data for all 200 samples is presented in Table 21.
Table 21 Sample ID # Set Lymph node signature value Germinal center B-cell signature value MHC class II signature value Survival predictor score ABC_1000 Validation 8.08 5.68 11.50 -5.96 ABC_1002 Validation 8.32 6.06 12.54 -6.31 ABC_1023 Validation 9.36 4.74 11.42 -6.18 ABC_1027 Training 7.41 4.90 12.31 -5.77 ABC_1031 Validation 9.40 5.23 11.68 -6.33 ABC_1034 Validation 7.47 4.92 11.83 -5.69 ABC_1038 Training 7.89 5.84 12.30 -6.09 ABC_1043 Training 7.84 4.66 12.29 -5.86 ABC_1045 Validation 9.31 4.66 12.07 -6.29 ABC_1055 Validation 6.46 6.38 13.05 -5.88 ABC_1057 Training 9.13 7.93 12.05 -6.80 ABC_1059 Validation 10.93 4.82 11.35 -6.68 ABC_1061 Training 8.18 5.04 12.28 -6.04 ABC_304 Validation 7.31 6.47 12.76 -6.10 ABC_305 Training 7.02 6.60 11.89 -5.86 ABC_309 Validation 10.47 7.00 12.53 -7.16 ABC_413 Validation 7.99 4.80 9.04 -5.26 ABC_428 Training 9.43 7.59 10.25 -6.47 ABC_432 Validation 7.29 8.16 9.56 -5.74 ABC_446 Training 9.49 5.46 10.55 -6.17 ABC_462 Validation 7.72 4.97 13.36 -6.10 ABC_477 Validation 7.16 3.69 12.45 -5.51 ABC_481 Training 9.75 6.89 11.98 -6.80 ABC_482 Training 10.51 7.64 12.35 -7.25 ABC_538 Validation 8.79 5.00 11.83 -6.13 ABC_541 Training 7.70 5.80 10.59 -5.67 ABC_544 Training 8.90 3.98 11.87 -5.99 ABC_547 Validation 7.05 5.18 11.38 -5.51 ABC_577 Validation 9.93 8.05 11.95 -7.06 ABC_616 Validation 7.34 4.54 12.64 -5.75 ABC_626 Validation 8.78 6.77 11.11 -6.29 ABC_633 Training 9.63 5.02 12.45 -6.53 ABC_642 Training 7.31 4.95 13.80 -6.05 ABC_644 Validation 7.72 5.36 13.28 -6.15 ABC_645 Training 9.77 6.21 13.39 -6.98 ABC_646 Validation 7.39 3.75 11.60 -5.41 ABC_652 Validation 7.51 4.53 12.73 -5.82 ABC_660 Training 5.85 3.55 10.17 -4.59 ABC_663 Training 7.04 5.06 12.82 -5.78 ABC_668 Validation 8.00 5.65 10.57 -5.73 ABC_676 Training 6.53 4.29 13.32 -5.59 ABC_678 Training 6.87 7.48 11.26 -5.83 ABC_687 Validation 6.39 3.78 10.46 -4.87 ABC_689 Training 8.29 5.07 12.56 -6.13 ABC_692 Validation 8.10 5.26 11.57 -5.90 ABC_694 Validation 9.67 8.15 12.41 -7.09 ABC_700 Training 8.37 6.75 12.10 -6.36 ABC_702 Validation 8.44 4.59 12.55 -6.09 ABC_704 Training 8.51 4.34 12.83 -6.13 ABC_709 Validation 7.47 4.54 13.40 -5.95 ABC_712 Validation 7.12 3.99 12.02 -5.46 ABC_714 Training 9.57 7.03 11.97 -6.77 ABC_717 Training 8.33 5.54 11.34 -5.98 ABC_725 Training 8.04 4.40 12.76 -5.97 ABC_726 Validation 7.79 4.18 11.91 -5.68 ABC_730 Validation 8.13 7.36 12.14 -6.40 ABC_753 Training 9.24 6.60 13.00 -6.80 ABC_756 Training 9.51 5.21 12.48 -6.53 ABC_771 Training 8.08 4.74 12.20 -5.93 ABC_779 Training 8.11 4.09 9.82 -5.34 ABC_800 Validation 10.34 4.83 11.91 -6.61 ABC_807 Training 6.58 4.44 7.56 -4.44 ABC_809 Training 9.29 5.72 10.83 -6.21 ABC_816 Training 6.36 6.36 10.64 -5.35 ABC_820 Training 8.10 4.79 11.98 -5.90 ABC_823 Validation 6.63 4.85 10.09 -5.05 ABC_835 Validation 9.17 7.78 12.31 -6.84 ABC_839 Training 8.06 4.97 11.89 -5.90 ABC_841 Validation 8.05 6.24 13.19 -6.39 ABC_858 Training 9.02 4.86 11.74 -6.16 ABC 872 Training 8.67 5.85 12.47 -6.37 ABC 875 Training 9.60 5.59 11.26 -6.37 ABC_912 Validation 7.99 7.74 12.79 -6.56 ABC_996 Validation 6.89 6.23 10.02 -5.36 GCB 1005 Validation 9.02 9.56 13.27 -7.30 GCB 1008 Training 9.27 10.49 12.83 -7.46 GCB_1009 Training 7.80 10.09 12.28 -6.80 GCB 1021 Validation 8.73 9.20 13.20 -7.13 GCB 1025 Validation 9.94 9.97 12.37 -7.49 GCB_1026 Training 9.54 10.20 13.52 -7.63 GCB_1037 Training 6.34 8.79 12.57 -6.17 GCB 1039 Training 8.71 9.94 13.28 -7.27 GCB_1049 Validation 10.53 8.18 12.60 -7.41 GCB_1051 Validation 7.63 10.18 12.76 -6.86 GCB_1058 Validation 8.61 9.04 12.80 -6.9B GCB_1060 Validation 10.23 9.38 12.96 -7.59 GCB_412 Training 8.79 7.92 13.09 -6.90 GCB_415 Training 10.72 8.57 11.99 -7.41 GCB_421 Training 9.23 5.26 12.20 -6.39 GCB_424 Training 11.14 8.46 12.44 -7.62 GCB_433 Training 9.26 8.52 12.64 -7.07 GCB_434 Training 9.73 10.13 12.54 -7.48 GCB_438 Validation 9.60 9.99 12.51 -7.41 GCB_459 Validation 10.51 7.75 11.37 -7.07 GCB_470 Validation 9.56 6.63 12.23 -6.74 GCB_479 Validation 7.77 4.71 13.07 -6.01 GCB_492 Training 8.82 9.52 12.34 -7.04 GCB_517 Validation 9.92 6.96 12.76 -7.03 GCB_523 Training 6.59 9.17 12.77 -6.35 GCB_524 Training 10.00 7.83 12.51 -7.16 GCB_529 Training 5.61 7.93 10.77 -5.41 GCB_533 Training 9.55 5.54 12.44 -6.59 GCB_537 Validation 8.25 10.25 13.29 -7.18 GCB_543 Validation 9.92 8.85 12.06 -7.21 GCB_545 Training 9.69 4.91 12.90 -6.62 GCB_549 Validation 7.86 8.88 12.15 -6.58 GCB_550 Validation 10.64 9.53 12.24 -7.60 GCB_553 Validation 10.14 9.05 12.63 -7.44 GCB_565 Validation 9.08 10.80 13.42 -7.57 GCB_572 Training 8.93 10.03 12.58 -7.21 GCB_617 Validation 9.27 7.80 13.17 -7.05 GCB_618 Training 7.23 9.11 13.32 -6.66 GCB_619 Validation 9.63 9.63 12.12 -7.27 GCB_623 Training 8.94 9.07 12.35 -7.00 GCB_627 Validation 9.72 8.33 11.85 -7.02 GCB_654 Training 7.04 5.60 10.00 -5.30 GCB_661 Validation 10.27 7.92 12.66 -7.29 GCB_669 Training 9.15 9.29 12.32 -7.10 GCB_672 Training 9.69 7.36 12.41 -6.95 GCB_674 Validation 9.93 6.23 12.33 -6.81 GCB_675 Validation 7.48 8.46 10.12 -5.97 GCB_681 Training 10.77 9.52 12.59 -7.72 GCB_688 Validation 8.01 10.17 9.94 -6.40 GCB 695 Validation 10.58 9.38 12.45 -7.60 GCB_698 Validation 10.44 9.00 11.99 -7.39 GCB_701 Training 9.38 9.27 13.10 -7.33 GCB_710 Validation 6.96 5.59 13.19 -5.93 GGB_711 Training 9.28 8.49 11.44 -6.82 GCB_722 Training 8.93 9.51 12.61 -7.13 GCB_724 Training 9.51 8.39 11.53 -6.90 GCB_731 Validation 8.82 9.19 12.20 -6.95 GCB_742 Validation 9.95 9.37 12.95 -7.50 GCB_744 Training 10.23 10.11 11.85 -7.49 GCB_745 Training 10.29 9.71 11.95 -7.46 GCB_747 Validation 9.83 9.79 13.06 -7.56 GCB_749 Training 8.57 10.27 12.55 -7.14 GCB_758 Validation 6.88 5.69 12.51 -5.78 GCB_772 Validation 9.92 7.28 12.25 -6.98 GCB_777 Validation 9.03 9.63 11.69 -6.99 GCB_792 Training 9.49 9.06 12.08 -7.12 GCB_795 Validation 11.12 9.02 11.60 -7.54 GCB_797 Validation 8.42 5.90 12.84 -6.38 GCB_803 Validation 7.33 10.11 13.18 -6.84 GCB_810 Training 10.00 8.22 13.13 -7.35 GCB_817 Training 8.60 10.16 11.09 -6.82 GCB_818 Training 9.14 7.78 12.23 -6.81 GCB_819 Validation 9.08 8.63 13.22 -7.15 GCB_821 Validation 10.05 9.81 12.41 -7.50 GCB_832 Training 8.83 6.91 12.47 -6.61 GCB_836 Validation 9.49 7.86 11.46 -6.78 GCB_840 Training 9.45 5.02 11.74 -6.33 GCB_847 Training 9.41 8.77 12.55 -7.14 GCB_860 Training 9.02 6.66 11.54 -6.43 GCB_871 Training 6.60 4.46 11.16 -5.20 GCB_874 Training 10.39 9.13 11.65 -7.33 GCB_995 Validation 8.52 9.35 12.22 -6.89 PMBL_1006 Validation 8.72 4.67 10.94 -5.86 PMBL_1024 Validation 9.30 8.47 10.89 -6.71 PMBL_1048 Validation 10.30 4.98 12.18 -6.68 PMBL_1053 Training 8.75 9.78 11.12 -6.81 PMBL_484 Training 8.25 4.96 13.62 -6.32 PMBL 546 Validation 9.66 6.07 11.73 -6.57 PMBL_570 Training 10.58 8.54 12.70 -7.50 PMBL_621 Training 9.39 9.94 12.96 -7.43 PMBL_638 Training 9.81 8.35 11.37 -6.95 PMBL_691 Validation 8.37 7.51 10.17 -6.10 PMBL_791 Validation 9.29 8.65 11.56 -6.88 PMBL_824 Validation 9.87 7.19 13.28 -7.16 PMBL_994 Training 11.27 6.73 12.43 -7.35 PMBL_998 Training 7.92 8.34 13.19 -6.72 UC_DLBCL_1001 Validation 8.25 5.63 12.76 -6.26 UC_DLBCL_1004 Validation 9.01 7.01 13.09 -6.81 UC_DLBCL_1007 Training 11.42 6.73 12.97 -7.51 UC_DLBCL_1018 Training 7.77 4.58 12.71 -5.91 UC_DLBCL 1041 Validation 7.90 4.33 13.38 -6.05 UC_DLBCL_1054 Training 10.41 8.72 11.48 -7.23 UC_DLBCL_306 Validation 9.42 6.54 12.36 -6.71 UC_DLBCL_310 Training 9.97 5.50 12.27 -6.69 UC_DLBCL_449 Validation 10.01 5.37 12.17 -6.65 UC_DLBCL_458 Training 7.50 5.79 9.60 -5.40 UC_DLBCL_460 Validation 10.26 8.27 12.29 -7.27 UC_DLBCL_491 Training 9.43 4.73 12.39 -6.40 UC_DLBCL_528 Validation 8.42 6.19 11.63 -6.18 UC_DLBCL_615 Validation 8.44 9.01 12.80 -6.92 UC_DLBCL_625 Training 10.43 8.27 12.62 -7.39 UC_DLBCL_664 Training 9.80 8.74 12.72 -7.29 UC_DLBCL_671 Training 9.42 5.26 11.53 -6.32 UC__DLBCL_682 Training 9.01 4.73 12.33 -6.26 UC_DLBCL_683 Training 8.85 8.23 12.57 -6.87 UC_DLBCL_684 Validation 9.62 8.78 12.76 -7.25 UC_DLBCL_748 Validation 7.60 5.79 9.55 -5.42 UC_DLBCL_751 Training 6.40 9.91 13.14 -6.50 UC_DLBCL_808 Training 9.44 7.01 13.09 -6.95 UC_DLBCL 831 Validation 9.45 5.81 11.58 -6.43 UC_DLBCL_834 Training 8.52 7.66 11.77 -6.50 UC_DLBCL_838 Validation 8.49 4.60 12.56 -6.11 UC_DLBCL_851 Validation 7.50 4.82 8.19 -4.94 UC_DLBCL_854 Validation 8.35 5.82 12.59 -6.29 UC_DLBCL_855 Training 9.56 5.44 12.08 -6.51 UC_DLBCL_856 Validation 6.81 7.49 9.32 -5.42 - In order to visualize the predictive power of the model, the 200 samples were ranked according to their survival predictor scores and divided into four quartiles. Kaplan-Meier plots of overall survival probability show clear differences in survival rate between these four quartiles (
Figure 12 ). - The connection between higher expression of proliferation genes and worse survival in MCL had previously been documented and validated (Rosenwald 2003). A cluster of proliferation genes had been identified in the DLBCL samples used to create the DLBCL survival predictor described in Example 7. By averaging the expression of these genes, a proliferation gene expression signature value had been developed for the DLBCL samples. The correlation of this signature with each probe set on the U133A and U133B microarrays was determined, and the 22 genes for which the correlation was greater than 0.5 were labeled proliferation genes. The correlation between expression of these proliferation genes and survival in 21 MCL samples was estimated using the Cox proportional hazards model. Table 22 lists these 21 MCL samples.
Table 22 Sample ID # Length of follow-up (years) Status at follow-up Used in creating survival predictor? MCL_1012 3.19 Alive Yes MCL_1091 3.03 Alive Yes MCL_1114 0.59 Dead Yes MCL_1128 0.43 Dead Yes MCL_1150 3.21 Dead Yes MCL_11162 0.78 Alive Yes MCL_1166 0.53 Dead Yes MCL_1194 0.55 Alive Yes MCL_885 1.19 Alive Yes MCL_918 1.95 Dead Yes MCL_924 5.48 Dead Yes MCL_925 7.23 Alive Yes MCL_926 5.18 Dead Yes MCL_936 2.80 Alive Yes MCL_939 1.07 Dead Yes MCL_953 2.31 Dead Yes MCL_956 1.40 Dead Yes MCL_964 0.75 Alive Yes MCL_966 0.21 Dead Yes MCL_968 1.59 Dead Yes MCL_970 5.02 Dead Yes - Out of the 22 proliferation genes, 11 were significant at a 0.001 level. The expression level of these 11 genes in each of the 21 MCL samples was averaged to generate a proliferation gene expression signature value. No other genes represented on the U133A or U133B microarrays correlated with MCL survival to an extent greater than would be expected by chance, so the final model included only proliferation genes. The 11 genes used to generate the model are presented in Table 23.
Table 23 Signature UNIQID Gene Symbol Proliferation 1097290 CIRH1A Proliferation 1101295 FLJ40629 Proliferation 1119729 TK1 Proliferation 1120153 LMNB1 Proliferation 1120494 CDC6 Proliferation 1124745 KIAA0056 Proliferation 1126148 DKFZp586E1120 Proliferation 1130618 TPI1 Proliferation 1134753 WHSC1 Proliferation 1139654 ECT2 Proliferation 1140632 IMAGE:52707 - A survival predictor score for MCL was generated using the following equation:

- This model was associated with survival in a statistically significant manner (p = 0.00018). To illustrate the significance of the model in predicting survival, the 21 MCL samples were divided into two equivalent groups based on their survival predictor scores. Those samples with survival predictor scores above the median were placed in the high proliferation group, while those with survival predictor scores below the median were placed in the low proliferation group.
Figure 13 illustrates the Kaplan Meier survival estimates for these two groups, Median survival for the high proliferation group was 1.07 years, while median survival for the low proliferation group was 5.18 years. - A set of 21 genes associated with proliferation and poor prognosis in MCL had been identified previously (Rosenwald 2003). Of these 21 genes, only four were represented on the Lymph Dx microarray. In order to find a larger set of genes on the Lymph Dx microarray associated with survival in MCL, Lymphochip expression data (Rosenwald 2003) was re-analyzed and another set of proliferation genes whose expression levels were correlated with poor survival in MCL were identified. Thirteen of these genes were represented on the Lymph Dx microarray (median expression >6 on log2 Scale). These 13 genes are listed in Table 24.
Table 24 Signature UNIQID Unigene ID Build 167 http://www.ncbi.nlm. nih.gov/UniGene Gene symbol Proliferation 1119294 156346 TOP2A Proliferation 1119729 164457 TK1 Proliferation 1120153 89497 LMNB1 Proliferation 1121276 24529 CHEK1 Proliferation 1123358 442658 AURKB Proliferation 1124178 446579 HSPCA Proliferation 1124563 249441 WEE1 Proliferation 1130799 233952 PSMA7 Proliferation 1131274 374378 CKS1B Proliferation 1131778 396393 UBE2S Proliferation 1132449 250822 STK6 Proliferation 1135229 367676 DUT Proliferation 1136585 80976 MKI67 - The expression levels of the 13 genes listed in Table 24 on the Lymph Dx microarray were transformed into the log2 scale and averaged to form a proliferation gene expression signature value. This was used to generate a survival predictor score using the following equation:
- Survival predictor score = 1.66*(proliferation gene expression signature value)
- For the 21 MCL samples analyzed, the survival predictor score had a mean of 14.85 and a standard deviation of 1.13. Even in this limited sample set, the survival predictor score was significantly associated with prognosis (p=0.0049), with each unit increase in the score corresponding to a 2.7 fold increase in the relative risk of death. Data for all 21 samples is shown in Table 25.
Table 25 Sample ID # Proliferation signature value Survival predictor score MCL_1012 8.83 14.658 MCL_1091 8.81 14.625 MCL_1114 10.39 17.247 MCL_1128 10.12 16.799 MCL_1150 8.33 13.828 MCL_1162 8.15 13.529 MCL_1166 9.40 15.604 MCL_1194 7.44 12.350 MCL_885 8.68 14.409 MCL_918 9.33 15.488 MCL_924 8.35 13.861 MCL_925 8.86 14.708 MCL_926 8.14 13.512 MCL_936 8.56 14.21 MCL_939 9.14 15.172 MCL_953 9.25 15.355 MCL_956 9.35 15.521 MCL_964 9.741 16.168 MCL_966 8.76 14.542 MCL_968 9.10 15.106 MCL 970 9.27 15.388 - To illustrate the significance of the model in predicting survival, the 21 MCL samples were divided into two equivalent groups based on their survival predictor scores. Those samples with survival predictor scores above the median were placed in the high proliferation group, while those with survival predictor scores below the median were placed in the low proliferation group.
Figure 14 illustrates the Kaplan Meier survival estimates for these two groups. - A statistical method based on Bayesian analysis was developed to distinguish MCL samples from samples belonging to other lymphoma types based on gene expression profiling. This method was developed using the gene expression data obtained in Example 1 for the following lymphoma types: ABC, GCB, PMBL, BL, FH, FL, MALT, MCL, PTLD, SLL, and splenic marginal zone lymphoma (splenic).
- To determine the lymphoma type of a sample, a series of predictor models are generated. Each predictor model calculates the probability that the sample belongs to a first lymphoma type rather than a second lymphoma type. A method was developed to determine whether a sample was MCL, or one of the following lymphoma types: ABC, BL, FH, FL, GCB, MALT, PMBL, PTLD, SLL, or splenic. This method required ten different predictor models, each designed to determine whether the sample belonged to MCL or one of the other ten lymphoma types (e.g., MCL vs. ABC, MCL vs. BL, etc.).
- Several of the lymphoma samples analyzed displayed a tendency towards elevated or reduced expression of genes from the lymph node and proliferation gene expression signatures. These genes are likely to be highly differentially expressed between the lymphoma types, but they do not serve as good predictor genes because they are often variably expressed within a single lymphoma type. For this reason, any gene that displayed a correlation with the proliferation or lymph node signatures was eliminated from consideration.
- For each lymphoma type pair (e.g., MCL vs, ABC, MCL vs, FL, etc.), 20 genes were identified that exhibited the greatest difference in expression between MCL and the second lymphoma type according to a Student's t-test. The choice to use 20 genes was arbitrary. For each sample X, the 20 genes were used to generate a linear predictor score (LPS) according to the following formula:

where Xj is the expression of gene j in sample X and tj is the t-statistic for the difference in expression of gene j between a first lymphoma type and a second lymphoma type. This is merely one method for generating an LPS. Others methods include linear discriminant analysis (Dudoit 2002), support vector machines (Furey 2000), or shrunken centroids (Tibshirani 2002). In addition, there is no requirement that a t-statistic be used as the scaling factor. - After an LPS had been formulated for each lymphoma sample, the mean and standard deviation of these LPS's was calculated for each lymphoma type. For a new sample X, Bayes' rule can be used to estimate the probability that the sample belongs to a first lymphoma type rather than a second lymphoma type (
Figure 15 ). in this example, Bayes' rule was used to calculate the probability q that sample X was MCL rather than a second lymphoma type using the following equation:
wheretype 1 is MCL,type 2 is one of the other nine lymphoma types, φ(x;µ,σ) is the normal density function with mean µ and standard deviation σ,µ̂1 and σ̂1 are the sample mean and variance of the LPS values forlymphoma type 1, and µ̂2 and σ̂2 are the sample mean and variance of the LPS values forlymphoma type 2. - This method was used to develop ten predictor models, one for each pairing of MCL and a second lymphoma type. A sample was classified as MCL if each of the ten predictors generated at least a 90% probability that the sample was MCL. If any of the ten predictors indicated a probability of less than 90%, the sample was classified as non-MCL.
- The 10 sets of 20 genes that were included in these models and the t-statistics for each gene are presented in Tables 26-35.
Table 26: MCL vs. ABC predictor genes UNIQID Gene name Scale Factor 1103711 Homo sapiens cDNA FLJ11833 fis, clone HEMBA1008579. 17.88496416 1133111 PDE9A - phosphodiesterase 9A 17.61579873 1137987 PLXNB1 -- plexin B1 17.47030156 1132835 SOX11 -- SRY (sex determining region Y)-box 11 16.89404131 1109505 Homo sapiens, Similar to LOC168068, clone MGC:39372 IMAGE:5089466, mRNA, complete cds 15.78111902 1139054 LOC58486 -- transposon-derived Bustar1 transposase-like protein 15.77800815 1119361 TIA1 -- TIA1 cytotoxic granule-associated RNA binding protein 15.68070962 1115226 KIAA1683 -- KIAA1683 protein 15.67954057 1101211 Homo sapiens cDNA: FLJ21960 fis, clone HEPO6517. 15.4183527 1118963 Homo sapiens cDNA FLJ35653 fls, clone SPLEN2013690. 15.36802586 1096503 GL012 -- hypothetical protein GL012 14.64776335 1127849 SNN -- stannin 14.54859775 1099204 Homo sapiens mRNA; cDNA DKFZp586K1922 (from clone DKFZp586K1922) 14.32724822 1098840 C3orf6 -- chromosome 3 open reading frame 6 14.10346944 1139444 RABL2B -- RAB, member of RAS oncogene family-like 2B 14.10016196 1106855 KIAA1909 -- KIAA1909 protein 13.9504946 1126695 KIAA0484 -- KIAA0484 protein 13.92285415 1120137 FCGBP -- Fc fragment of IgG binding protein 13.86147896 1133011 TMSNB -- thymosin, beta, identified in neuroblastoma cells 13.74377784 1133192 GRP3 -- guanine nucleotide exchange factor for Rap1 -17.09085725 Table 27: MCL vs. BL predictor genes UNIQID Gene name Scale Factor 1120900 EPHB6 -- EphB6 13.43582327 1112061 Homo sapiens cDNA FLJ90513 fis, clone NT2RP3004355. 12.73065392 1109505 Homo sapiens, Similar to LOC168058, clone MGC:39372 IMAGE:5089466, mRNA, complete cds 12.63674985 1133099 DNASE1L3 -- deoxyribonuclease I-like 3 12.43333984 1106865 KIAA1909 -- KIAA1909 protein 12.32623489 1110070 ESTs 12.05416064 1121739 ZNF135 -- zinc finger protein 135 (clone pHZ-17) 11.90460363 1098840 C3orf6 -- chromosome 3 open reading frame 6 11.90309143 1132833 SOX11 -- SRY (sex determining region Y)-box 11 11.60864812 1121693 KIAA0450 -- KIAA0450 gene product 11.33634052 1123760 ILT7 -- leukocyte Immunoglobulin-like receptor, subfamily A (without TM domain), member 4 11.18744726 1125964 KIAA0792 -- KIAA0792 gene product 11.14762675 1112306 ESTs 11.02434114 1096070 DNMT3A -- DNA (cytosine-5-)-methyltransferase 3 alpha 10.98991879 1129943 Homo sapiens, similar to Zinc finger protein 85 (Zinc finger protein HPF4) (HTF1), clone IMAGE:3352451, mRNA 10.72494956 1118749 PRKWNK1 -- protein kinase, lysine deficient 1 10.64623382 1098954 FLJ13204 -- hypothetical protein FLJ13204 10.46164401 1134749 PRKCBP1 -- protein kinase C binding protein 1 10.40948157 1131860 BIN1 -- bridging integrator 1 10.31484561 1123148 TGFBR2 -- transforming growth factor, beta receptor II (70/80kDa) 10.2956213 Table 28: MCL vs. FH predictor genes UNIQID Gene name Scale Factor 1132834 SOX11 -- SRY (sex determining region Y)-box 11 24.3531072 1100873 ESTs 16.83342764 1109603 ESTs 13.02401995 1139411 OSBPL10 -- oxysterol binding protein-like 10 12.54369577 1106855 KIAA1909 -- KIAA1909 protein 12.10316361 1125193 CNR1 -- cannabinoid receptor 1 (brain) 12.070579 1137450 ALOX5 -- arachidonate 5-lipoxygenase 11.74571823 1100258 KIAA1384 -- KIAA1384 protein 11.60998697 1133167 ZFD25 -- zinc finger protein (ZFD25) 11.52931491 1136831 PPFIBP2 -- PTPRF interacting protein, binding protein 2 (liprin beta 2) 11.50062692 1138222 NA 10.99674674 1099437 Homo sapiens mRNA; cDNA DKFZp667B1913 (from clone DKFZp667B1913) 10.90797288 1140236 SPAP1 -- SH2 domain containing phosphatase anchor protein 1 10.77082801 1114109 DCAL1 -- dendritic cell-associated lectin-1 10.65867119 1098277 PRICKLE1 -- prickle-like 1 (Drosophila) 10.55457068 1135138 CD24 -- CD24 antigen (small cell lung carcinoma cluster 4 antigen) 10.41999962 1103304 Homo sapiens clone CDABP0095 mRNA sequence -10.46625233 1128460 RDGBB -- retinal degeneration B beta -10.91106245 1121953 KIAA0125 -- KIAA0125 gene product -11.22466255 1129281 C14orf110 -- chromosome 14 open reading frame 110 -15.54465448 Table 29: MCL vs. FL predictor genes UNIQID Gene name Scale Factor 1132835 SOX11 -- SRY (sex determining region Y)-box 11 22.14208817 1096070 DNMT3A -- DNA (cytosine-5-)-methyltransferase 3 alpha 20.53740132 1103711 Homo sapiens cDNA FLJ11833 fis, clone HEMBA1006579. 20.49880004 1137987 PLXNB1 -- plexin B1 18.38081568 1109506 Homo sapiens, Similar to LOC168058, clone MGC:39372 IMAGE:5089466, mRNA, complete cds 17.17812448 1098840 C3orf6 -- chromosome 3 open reading frame 6 16.32703666 1130926 C5orf13 - chromosome 5 open reading frame 13 15.34261878 1096396 SPG3A -- spastic paraplegia 3A (autosomal dominant) 14.76437736 1132734 COL9A3 -- collagen, type IX, alpha 3 14.684583 1139393 OPN3 -- opsin 3 (encephalopsin, panopsin) 14.39118445 1115537 LOC84518 -- protein related with psoriasis 14.18446144 1102215 Homo sapiens cDNA FLJ11666 fis, clone HEMBA1004672. 14.16246426 1124585 Homo sapiens cDNA: FLJ21930 fis, clone HEP04301, highly similar to HSU90916 Human clone 23815 mRNA sequence. -14.33315955 1137561 HOXA1 -- homeo box A1 -15.38404642 1100581 Homo sapiens, mRNA; cDNA DKFZp667A1115 (from clone DKFZp667A1115) -15.91666634 1124646 KIAA0084 -- KIAA0084 protein -16.40577896 1114543 ESTs -17.60167863 1120090 BCL6 -- B-cell CLL/lymphoma 6 (zinc finger protein 51) -17.63091181 1123731 RGS13 -- regulator of G-protein signalling 13 -22.41602151 1133192 GRP3 -- guanine nucleotide exchange factor for Rap1 -27.28308723 Table 30: MCL vs. GCB predictor genes UNIQID Gene name Scale Factor 1098840 C3orf6 -- chromosome 3open reading frame 622.26488562 1132835 SOX11 -- SRY (sex determining region Y)- box 1117.76179754 1137987 PLXNB1 -- plexin B1 16.86845147 1098954 FLJ13204 -- hypothetical protein FLJ13204 16.65023669 1103711 Homo sapiens cDNA FLJ11833 fls, clone HEMBA1006579, 15.64719784 1096070 DNMT3A -- DNA (cylosine-5-)- mothyltransferase 3 alpha15.22540494 1139393 OPN3 -- opsin 3 (encephalopsin, panopsin) 14.64030565 1127849 SNN -- stannin 14.28242206 1098156 Human HeLa mRNA Isolated as a false positive in a two-hybrid-screen. 14.00049272 1128845 FLJ20174 -- hypothetical protein FLJ20174 13.96064416 1129943 Homo sapiens, similar to Zinc finger protein 85 (Zinc finger protein HPF4) (HTF1), clone IMAGE:3352451, mRNA 13.85404507 1140116 DKFZP564B116 -- hypothetical protein DKFZp564B1162 13.81464172 1106855 KIAA1909 -- KIAA1909 protein 13.74521849 1120900 EPHB6 -- EphB6 13.46567004 1127371 Homo sapiens cDNA FLJ14046 fls, clone HEMBA1006461. 13.45735668 1119361 TIA1 -- TIA1 cytotoxic granule-associated RNA binding protein 13.37376559 1120854 EDG1 -- endothelial differentiation, sphingolipid G-protein- coupled receptor, 1 13.1047657 1098277 PRICKLE1 -- prickle-like 1 (Drosophila) 13.04993076 1140127 TRIM34 -- tripartite motif-containing 34 12.66260609 1100581 Homo sapiens mRNA; cDNA DKFZp667A1115 (from clone DKFZp667A1115) -12.81251689 Table 31: MCL vs. MALT predictor genes UNIQID Gene name Scale Factor 1132834 SOX11 -- SRY (sex determining region Y)-box 11 20.7489202 1101987 KIAA1909 -- KIAA1909 protein 10.78991326 1100873 ESTs 10.11845036 1130764 HNRPA0 -- heterogeneous nuclear ribonucleoprotein A0 9.432459453 1102178 Homo sapiens, Similar to thymosin, beta, identified in neuroblastoma cells, clone MGC:39900 IMAGE:5247537, mRNA, complete cds 9.035605572 1098277 PRICKLE1 -- prickle-like 1 (Drosophila) 9.003360784 1130926 C5orf13 -- chromosome 5 open reading frame 13 8.712830747 1098694 LOC112868 -- hypothetical protein LOC112868 8.309789856 1103711 Homo sapiens cDNA FLJ11833 fis, clone HEMBA1006579. 8.248526605 1138099 NA 8.107440225 1120854 EDG1 -- endothelial differentiation, sphingolipid G-proteln- coupled receptor, 1 8.045872672 1102215 Homo sapiens cDNA FUJ11666 fis, clone HEMBA1004672. 8.032351578 1121739 ZNF135 -- zinc finger protein 135 (clone pHZ-17) 8.020919565 1096070 DNMT3A -- DNA (cytosine-5-)-methyltransferase 3 alpha 7.964477216 1101211 Homo sapiens cDNA: FLJ21960 fis, clone HEP05517. 7.738742472 1120825 CHL1 -- cell adhesion molecule with homology to L1CAM (close homolog of L1) 7.616130116 1099437 Homo sapiens mRNA; cDNA DKFZp667B1913 (from clone DKFZp667B1913) 7.209041652 1096503 GL012 -- hypothetical protein GL012 7.171540413 1135927 LILRA2 -- leukocyte immunoglobulin-like receptor, subfamily A (with TM domain), member 2 7.134470829 1120645 FADS3 -- fatty acid desaturase 3 7.039952979 Table 32: MCL vs. PMBL predictor genes UNIQID Gene name Scale Factor 1132834 SOX11 -- SRY (sex determining region Y)-box 11 28.17593839 1100873 ESTs 17.90004832 1096503 GL012 -- hypothetical protein GL012 17.43982729 1098840 C3orf6 -- chromosome 3 open reading frame 6 17.37421052 1124734 NA 16.73821457 1135102 PRKCB1 -- protein kinase C, beta 1 16.67436366 1103711 Homo sapiens cDNA FLJ11833 fis, clone HEMBA1006579, 16.67202026 1140416 TOSO -- regulator of Fas-induced apoptosis 15.64802242 3121757 ADRB2 -- adrenergic, beta-2-, receptor, surface 15.57336633 1140236 SPAP1 -- SH2 domain containing phosphatase anchor protein 1 15.20264513 1099140 ESTs, Moderately similar to hypothetical protein FLJ20378 [Homo sapiens] [H.sapiens] 15.11929571 1099549 ESTs 14.92883027 1139054 LOC58486 -- transposon-derived Buster1 transposase-like protein 14.63422275 1138818 ILF3 -- interleukin enhancer binding factor 3, 90kDa 14.50621028 1109444 ESTs, Highly similar to IL24_HUMAN Interieukin-24 precursor (Suppression of tumorigenicity 16 protein) (Melanoma differentiation associated protein 7) (MDA-7) [H.sapiens] 14.20430672 1124534 KIAA0553 -- KIAA0553 protein 14.18537487 1098277 PRICKLE1 -- prickie-like 1 (Drosophila) 13.98526258 1131687 TLK1 -- tousled-like kinase 1 13.97468703 1125112 PLCL2 -- phospholipase C-like 2 13.85714318 1125397 Homo sapiens cDNA FLJ33389 fis, clone BRACE2006871. 13.85049805 Table 33: MCL vs. PTLD predictor genes UNIQID Gene name Scale Factor 1109603 ESTs 19.95553782 1138222 NA 15.95397369 1135138 CD24 -- CD24 antigen (small cell lung carcinoma cluster 4 antigen)15.89198725 1134230 RASGRP2 -- RAS guanyl releasing protein 2 (calcium and DAG-regulated) 15.80452978 1139411 OSBPL10 -- oxysterol binding protein-like 10 14.32818885 1140416 TOSO -- regulator of Fas-induced apoptosis 13.89685188 1132834 SOX11 -- SRY (sex determining region Y)- box 1113.78424818 1121739 ZNF135 -- zinc finger protein 135 (clone pHZ-17) 13.02195529 1098156 Human HeLa mRNA isolated as a false positive in a two-hybrid-screen. 12.95032505 1099270 Homo sapiens cDNA FLJ30555 fls, clone BRAWH2003818. 12.7877735 1139012 FLJ20373 -- hypothetical protein FLJ20373 12.70176225 1120854 EDG1 -- endothelial differentiation, sphingolipid G-proteln-coupled receptor, 1 12.25264341 1120985 KIAA0053 -- KIAA0053 gene product 12.04626201 1115952 LOC146617 -- hypothetical protein LOC146517 11.96299478 1120825 CHL1 -- cell adhesion molecule with homology to L1CAM (close homolog of L1) 11.82402907 1131636 SPOCK2 -- sparc/osteonectin, cwcv and kazal-like domains proteoglycan (testican) 2 11.80417657 1136706 MYT1 -- myelin transcription factor 1 11.74962191 1113560 Homo sapiens, clone IMAGE:5725893, mRNA 11.72049882 1133851 P4HA1 - procollagen-proline, 2-oxoglutarate 4- dioxygenase (proline 4-hydroxylase), alpha polypeptide I -12.59876059 1137459 BCAT1 - branched chain aminotransferase 1, cytosolic -14.00465411 Table 34: MCL vs. SLL predictor genes UNIQID Gene name Scale Factor 1132834 SOX11 -- SRY (sex determining region Y)-box 11 23.59602107 1101987 KIAA1909 -- KIAA1909 protein 14.50254794 1103711 Homo sapiens cDNA FLJ11833 fis, clone HEMBA1006579. 13.31375894 1096070 DNMT3A -- DNA (cytosine-5-)-methyltransferase 3 alpha 12.37453972 1130926 C5orf13 -- chromosome 5 open reading frame 13 11.27840239 1120645 FADS3 -- fatty acid desaturase 3 11.14057287 1138099 NA 10.92729287 1097887 KIAA0303 -- KIAA0303 protein 10.37913127 1099941 ESTs 10.33953409 1130373 KIAA0303 -- KIAA0303 protein 10.01524528 1110957 SYNE2 -- spectrin repeat containing, nuclear envelope 2 9.865436185 1130320 ESTs 9.807091644 1124373 LPIN1 -- lipin 1 9.024985551 1128813 KREMEN2 -- kringle containing transmembrane protein 2 8.903791941 1131130 MARCKS -- myristoylated alanine-rich protein kinase C substrate 8.688979176 1120825 CHL1 -- cell adhesion molecule with homology to L1 CAM (close homolog of L1) 8.685132271 1119752 BASP1 - brain abundant, membrane attached signal protein 1 8.663402838 1131854 GCLC - glutamate-cystaine ligase, catalytic subunit -8.761521136 1105801 Homo sapiens mRNA; cDNA DKFZp686H1529 (from clone DKFZp686H1529) -8.828675125 1097824 MAP2 - microtubule-associated protein 2 -9.346688564 Table 35: MCL vs. splenic predictor genes UNIQID Gene name Scale Factor 1106855 KIM1909 -- KIAA1909 protein 14.48278638 1121739 ZNF135-zinc finger protein 135 (clone pHZ-17) 11.95918572 1111850 Homo sapiens cDNA FLJ36977 fis, clone BRACE2006344. 11.13464157 1098024 KIAA1972 -- KIAA1972 protein 10.10869886 1130764 HNRPA0 - heterogeneous nuclear ribonucleoprotein A0 10.06898534 1135342 SHOX2 - short stature homeobox 2 9.565884385 1097218 MGC45400 -- hypothetical protein MGC45400 9.187725705 1117193 RINZF - zinc finger protein RINZF 9.12522795 1139564 PSMD10 - proteasome (prosome, macropain) 26S subunit, non-ATPase, 10 9.066714773 1132834 SOX11 - SRY (sex determining region Y)-box 11 8.908574745 1131130 MARCKS -- myristoylated alanine-rich protein kinase C substrate 8.732921026 1131756 PDCD4 - programmed cell death 4 (neoplastic transformation Inhibitor) 8.441424593 1102187 DKFZp586C102 - hypothetical protein DKFZp586C1021 8.391861029 1098195 DKFZp762C111 - hypothetical protein DKFZp762C1112 8.349839204 1101211 Homo sapiens cDNA: FLJ21960 fis, clone HEP05517. 8.337208237 1136673 GNAS - GNAS complex locus 8.254076655 1139116 USP16 - ubiquitin specific protease 16 8.179384251 1098694 LOC112868 - hypothetical protein LOC112868 7.935903681 1120519 WWP2 - Nedd-4-like ubiqultin-protein ligase -7.881202253 1114916 FLJ13993 -- hypothetical protein FLJ13993 -8.33683119 - With so many candidate predictor genes being utilized, it is possible to generate a predictor model that accurately predicts every element of a training set but fails to perform on an independent sample. This occurs because the model incorporates and "learns" the individual characteristics of each sample in the training set. Leave-one-out cross-validation was used to verify that the prediction models generated above would work on independent samples that the models had not encountered previously. In this cross-validation method, a single sample is removed from the training set, and the predictor is developed again using the remaining data. The resulting model is then used to predict the sample that was removed. This method is repeated with each individual sample taken out. Since no sample is predicted from a model that includes that sample, this method provides an unbiased estimate of predictor accuracy.
- When the predictors developed above were evaluated by leave-one-out cross-validation, all but one of the 21 MCL samples were correctly identified as MCL and none of the 489 non-MCL samples were mistakenly identified as MCL,
- Lymphoma samples with morphology consistent with MCL were identified by pathological review. Since t(11;14) translocation and cyclin D1 overexpression have been consistently associated with MAL, cyclin D1 mRNA levels were measured in each sample by quantitative RT-PCR. Of the 101 samples analyzed, 92 expressed cyclin D1 mRNA. These 92 samples, which were deemed the "core group" of MCLs, were divided into a training set and a validation set. Gene expression was measured in all 101 samples using a Lymphochip microarray (Alizadeh 1999). For comparison, gene expression was measured in 20 samples identified as SLL. In addition, MCL expression data was compared to expression data obtained previously for GCB (134 cases) and ABC (83 cases) (Rosenwald 2002). Several thousand genes were differentially expressed between cyclin D1-posltive MCL and the other lymphoma types with high statistical significance (p < 0.001). A complete listing of these genes is available at http://llmpp.nih.gov/MCl.
- Three different binary predictor models were developed: MCL vs. SLL, MCL vs. GCB, and MCL vs. ABC. Each of these models was designed to calculate the probability that a sample was MCL rather than the other iymphoma type in the pair. For each pair, the genes that were most differentially expressed between MCL and the other lymphoma type in the pair were identified, and the difference in expression between the lymphoma types was quantified using a Student's t-test. An LPS was then calculated for each sample using the following formula:

where Xj is the expression of gene j in sample X and tj is the t-statistic for the difference in expression of gene j between the two lymphoma types in the pair. Cyclin D1 was excluded from the calculation of LPS so that the model could be used to identify potential MCL cases that were cyclin D1 negative. - After an LPS had been formulated for each lymphoma sample, the mean and standard deviation of these LPS's was calculated for each lymphoma type. For a new sample X, Bayes' rule can be used to estimate the probability q that the sample belongs to MCL rather than the second lymphoma type in the pair using the following equation:

where φ(x;µ,σ) is the normal density function with mean µ and standard deviation σ, µ̂ MCL and σ MCL are the sample mean and variance of the LPS values for MCL, and µ̂2 and σ̂2 are the sample mean and variance of the LPS values for the second lymphoma type of the pair. A cut-off point of 90% was selected for assigning a sample to a particular lymphoma type. Every sample in the training set were classified correctly using this model (Figure 16 ). When applied to the validation set, the model correctly classified 98% of the cyclin D1-positive MCL cases as MCL (Figure 16 ). - This diagnostic test was applied to nine lymphoma cases that were morphologically consistent with MCL, but negative for cyclin D1 expression. Seven of these samples were classified as MCL, one was classified as GCB, and one was not assigned to any lymphoma type because none of the pairs generated a probability of 90% or greater.
- A statistical method to classify DLBCL samples based on Bayesian analysis was developed using gene expression data obtained using the Lymphochip cDNA microarray ((Rosenwald 2002). This data is available at http://llmpp.nih.gov/DLBCL. The data was divided into two sets: a training set used to create and optimize the prediction model, and a validation set to evaluate the performance of the model.
- The training set consisted of 42 ABC DLBCL samples and 67 GCB DLBCL samples, while the validation set consisted of 41 ABC DLBCL samples, 67 GCB DLBCL samples, and 57
type 3 DLBCL samples (Shipp 2002). - Genes that were listed as present on >50% of the samples were identified, and the signal value for these genes on each microarray was normalized to 1,000. After normalization, all signal values under 50 were set to 50. A log2 transformation was then performed on all the signal values.
- An LPS for distinguishing between two lymphoma types was calculated for each sample X in the training set using an equation:

where Xj represents the expression level of gene j and tj is a scaling factor whose value depends on the difference in expression of gene j between the two lymphoma types. The scaling factor used in this example was the t-statistic generated by a t test of the difference in gene j expression between two lymphoma types. Only those genes with the largest t-statistics were included when calculating the LPS for each sample. The list of genes used to generate the LPS was narrowed further by including only those genes that were most variably expressed within the training set. Only genes in the top third with respect to variance were included. Genes that displayed a correlation with proliferation or lymph node signatures (Shatter 2001; Rosenwald 2002) were eliminated from consideration, because these genes are often variably expressed within samples from a single lymphoma type (Rosenwald 2002). - Since the LPS is a linear combination of gene expression values, its distribution within each lymphoma type should be approximately normal, provided that it includes a sufficient number of genes and the correlation structure of those genes is not extreme. The mean and variance of these normal distributions within a lymphoma type can then be estimated from the combined LPS's of all samples within the type. The LPS distribution of two lymphoma types can be used to estimate the probability that a new sample belongs to one of the types using Bayes' rule. The probability q that a sample Y belongs to
lymphoma type 1 can be determined by an equation:
where φ(x;µ,σ) is the normal density function with mean µ and standard deviation σ, µ̂1 and σ̂1 are the sample mean and variance of the LPS values forlymphoma type 1, and µ̂2 and σ̂2 are the sample mean and variance of the LPS values forlymphoma type 2. This calculation was used to determine the probability that each sample in the training set belonged to GCB or ABC. A sample was classified as a particular type if it had a 90% or greater probability of belonging to that type. The number of genes in the predictor model was optimized based on the accuracy with which the predictor classified samples into the ABC or GCB subtypes defined previously by hierarchical clustering (Rosenwald 2002). The final predictor incorporated 27 genes, and correctly classified 87% of the training set samples into the subtype to which they had been assigned by hierarchical clustering (Figure 17 ). The genes included in the predictor are listed in Table 36.Table 36 UNIQID Unigene ID Build 167 (http://www.ncbi.nlm.nih.gov /UniGene) Gene symbol 19375 235860 FOXP1 19346 109150 SH3BP5 19227 193857 LOC96597 16049 439852 IGHM 32529 55098 C3orf6 24729 127686 IRF4 24899 81170 PIM1 19348 NA NA 27565 444105 ENTPD1 17227 170359 IL16 26919 118722 FUT8 24321 171262 ETV6 29385 167746 BLNK 16858 376071 CCND2 31801 386140 BMF 19234 418004 PTPN1 26385 307734 MME 24361 388737 NA 24570 446198 NA 24904 18166 KIAA0870 24429 155024 BCL6 28224 387222 NEK6 27673 124922 LRMP 24376 317970 SERPINA11 17496 300592 MYBL1 17218 283063 LMO2 28338 78877 ITPKB - Since the samples used to estimate the distribution of the LPS's were the same samples used to generate the model, there was a possibility of overfitting. Overfitting would result in a model that indicates a larger separation between the LPS's of two lymphoma types than would be found in independent data. To ensure that overfitting was not taking place, the model was,tested on the validation set. The reproducibility of the predictor model was verified by its ability to correctly classify 88% of the samples in the validation set (
Figure 18 ). Interestingly, 56% of the DLBCL samples that had been placed in thetype 3 subtype by hierarchical clustering were classified as either ABC or GCB using this Bayesian model. - In previous experiments, the genes that were used to distinguish GCB and ABC were deliberately selected to include those that were preferentially expressed in normal GC B cells (
Alizadeh 2000; Rosenwald 2002). In the present analysis, the predictor model was not biased a priori to include such genes. The ABC and GCB lymphoma types as defined by the Bayesian model were analyzed for differential expression of GC B cell restricted genes. Thirty seven genes were found to be both more highly expressed in GC B cells than at other stages of differentiation (p<0.001) and differentially expressed between DLBCL subtypes (p<0.001) (Figure 19A ). These 37 genes are listed in Table 37.Table 37 UNIQID Unigene ID Build 167 (http://www.ncbi.nlm.nih.gov /UniGene) Gene symbol 28014 300592 MYBL1 24376 317970 SERPINA11 24429 155024 BCL6 16886 124922 LRMP 27374 283063 LMO2 29912 446198 24510 266175 PAG 24854 439767 TOX 32171 307734 MME 24361 388737 19365 171857 Cyorf15a 27292 272251 KLHL5 24822 283794 PCDHGC3 30923 446195 24825 88556 HDAC1 31696 91139 SLC1A1 26976 434281 PTK2 19279 49614 GCET2 17866 1765 LCK 24386 437459 MYO1E 33013 293130 VNN2 25126 30498 157441 SPI1 26512 379414 MFHAS1 26582 153260 SH3KBP1 17840 132311 MAP2K1 26000 25155 NET1 24323 149342 AICDA 30922 435904 C21orf107 30641 79299 LHFPL2 19308 179608 DHRS9 24455 405387 30034 300208 SEC23IP 24977 169939 HS2ST1 24449 206097 RRAS2 30763 446198 27987 73792 CR2 - All but two (AICDA and DHRS9) of these 37 genes were more highly expressed in GCB than in ABC. This demonstrates that the DLBCL subtypes defined by the Bayesian predictor seem to differ with respect to their cell of origin, with GCB retaining the gene expression program of normal GC B cells.
- ABC, on the other hand, displayed higher expression of genes characteristic of plasma cells (
Figure 19B ). Twenty four genes were found to be both more highly expressed in plasma cells than in B cells at earlier developmental stages (p<0.001) and differentially expressed between the DLBCL subtypes (p<0.001). These 24 genes are listed in Table 38.Table 38 UNIQID Unigene-ID Build 167 (http://www.ncbi.nlm.nih.gov /UniGene) Gene symbol 16614 127686 IRF4 26907 118722 FUT8 31104 313544 NS 19219 355724 CFLAR 26174 28707 SSR3 24566 169948 KCNA3 34500 442808 B4GALT2 26991 314828 UPP1 30191 438695 FKBP11 27402 259855 EEF2K 26096 434937 PPIB 15887 2128 DUSP5 32440 512686 C20orf59 34827 429975 PM5 29232 437638 XBP1 17763 76640 RGC32 32163 445862 RAB30 17814 5353 CASP10 31460 409223 SSR4 26693 83919 GCS1 25130 409563 PACAP 16436 267819 PPP1R2 31610 76901 PDIR 28961 212296 ITGA6 - The majority of these plasma cell-restricted genes were more highly expressed in ABC than in GCB. Eight of the 32 genes encode proteins that reside and function in the endoplasmic reticulum (ER) or Golgi apparatus, suggesting that ABCs have increased the intracellular machinery for protein secretion. These eight genes are denoted in the above list by the designation "ER" or "golgi" in parentheses. Another gene on this list, XBP-1 transcription factor, encodes a protein that is required for plasma cell differentiation (Reimold 2001) and is involved in the response to unfolded proteins in the ER (Calfon 2002). ABC have not undergone full plasmacytic differentiation, however, because other key plasma cell genes such as Blimp-1 were not more highly expressed in ABC.
- The prediction method described in Example 13 above was applied to gene expression data from 58 DLBCL samples obtained using an Affymetrix HU 6800 oligonucleotide microarray (Shipp 2002). This data is available at www.genome.wi.mit.edu/MPR/lymphoma. The first step in analyzing this data was to exclude all microarray features with a median signal value of <200 across the samples. Multiple microarray features representing the same gene were then averaged. Of the 27 genes in the DLBCL subtype predictor developed using the Lymphochip data (above), only 14 were represented on the Affymetrix array and passed this filtering process. These 14 genes are listed in Table 39.
Table 39 UNIQID Unigene ID Build 167 (http://www.ncbl.nlm.nih.gov /UniGene) Gene symbol 24729 127686 IRF4 17227 170359 IL16 26907 118722 FUT8 27565 444105 ENTPD1 16858 376071 CCND2 24899 81170 PIM1 16947 418004 PTPN1 16049 439852 IGHM 26385 307734 MME 27673 124922 LRMP 24429 155024 BCL6 17218 283063 LMO2 28338 78877 ITPKB 17496 300592 MYBL1 - These 14 genes were used to create a new DLBCL subtype predictor in which the LPS scaling coefficients were again calculated based on the DLBCL subtype distinction in the Lymphochip data set (Rosenwald 2002). To account for systematic measuring differences between the Affymetrix and Lymphochip microarrays, the expression value of each gene on the Affymetrix microarray was shifted and scaled to match the mean and variance of the corresponding expression values on the Lymphochip. The adjusted expression values for each of the 14 genes were then used to calculate LPS's for each sample. DLBCL subtype membership was again assigned on a cut-off of 90% certainty. Several observations suggested that the predictor identified ABC and GCB samples within the Affymetrix data set that were comparable to those found in the Lymphochip data set. First, the relative proportions of ABC (29%) and GCB (53%) were very similar to the corresponding proportions in the Lymphochip data set (34% and 49%, respectively). Second, 43 genes were found to be differentially expressed between the two DLBCL subtypes with high significance (p < 0.001) in the Affymetrix data. This number is substantially higher than would be expected by chance, given that the Affymetrix microarray measures the expression of approximately 5,720 genes. The symbols for these 43 genes were: IGHM; TCF4; IRF4; CCND2; SLA; BATF; KIAA0171; PRKCB1; P2RX5; GOT2; SPIB; CSNK1E; PIM2; MARCKS; PIM1; TPM2; FUT8; CXCR4; SP140; BCL2; PTPN1; KIAA0084; HLA-DMB; ACP1; HLA-DQA1; RTVP1; VCL; RPL21; ITPKB; SLAM; KRT8; DCK; PLEK; SCA1; PSIP2, FAM3C; GPR18; HMG14; CSTB; SPINK2; LRMP; MYBL1; and LMO2. Third, the 43 genes differentially expressed between the types included 22 genes that were not used in the predictor but were represented on Lymphochip arrays. Fourteen of these 22 genes were differential expressed on the Lymphochip array with high statistical significance (p < 0.001). Finally, the expression of the c-rel gene was previously found to correspond to amplification of the c-rel genomic locus in DLBCL tumor cells, and oncogenic event occurring in GCB but not ABC (Rosenwald 2002). In the Affymetrix data set, c-rel was differentially expressed between the two subtypes (p = 0.0025), and was highly expressed only in a subset of GCB's.
- 310 lymphoma biopsy samples identified as DLBCL by a panel of hematopathologists were divided into a 36 sample training set and a 274 sample validation set, with the validation set consisting of the DLBCL samples classified previously in Example 13. All patients from whom the samples were derived had been treated with anthracycline-containing multiagent chemotherapy protocols, with some patients additionally receiving radiation therapy. The training set was profiled for gene expression using Lymphochip microarrays comprising 15,133 cDNA elements as described previously (Alizadeh 2000). This data is available at http://llmpp.nih.gov/PMBL. The validation set had previously been profiled using Lymphochip microarrays comprising 12,196 cDNA elements (Rosenwald 2002).
- This data is available at http://llmpp.nih.gov/DLBCL.
- A hierarchical clustering algorithm (Eisen 1998) was used to organize the genes by their expression patterns across the 36 samples in the training set. A large group of genes that were more highly expressed in lymphomas with mediastinal involvement than in other DLBCLs was shown to be tightly clustered in the resulting dendrogram (
Figure 20A ). This cluster of genes included two genes, MAL andFIG1 , previously shown to be highly expressed in PMBL (Copie-Bergman 2002; Copie-Bergman 2003). Several of the lymphomas with mediastinal involvement did not express this set of putative PMBL signature genes, and it was suspected that these samples were more likely to be conventional DLBCL than PMBL. Hierarchical clustering was used to organize the samples according to their expression of the PMBL signature genes, resulting in two major clusters of cases (Figure 20B ). One cluster contained 21 samples designated "PMBL core" samples by virtue of their higher expression of PMBL signature genes. The other cluster contained some samples that had virtually no expression of these genes, and other samples that did express these genes but at lower levels than the PMBL core samples. - A gene expression-based method for distinguishing PMBL core cases from GCB and ABC DLBCL cases based on Bayesian analysis was developed using the methods described in Examples 13 and 14. A set of genes were selected that were differentially expressed between the PMBL core samples and both GCB and ABC (p < 0.001). This set of genes included all of the PMBL signature genes identified by hierarchical clustering (
Figure 20A ), as well as a large number of additional genes. Many of the genes in this set belonged to the lymph node gene expression signature (Alizadeh 2000; Rosenwald 2002). These genes were excluded from the final predictor because they might cause some DLBCL samples with higher expression of lymph node gene expression signature genes to be misclassified as PMBL. The list of PMBL distinction genes was refined by adding a requirement that they also be differential expressed between the PMBL core samples and a subgroup of six DLBCL samples with higher expression of lymph node gene expression signature genes (p < 0.001). The resulting set of 46 genes included 35 genes that were more highly expressed in PMBL and 11 genes that were more highly expressed in DLBCL (Figure 21A ). The 46 genes in this set were PDL2, SNFT, IL13RA1, FGFR1, FLJ10420, CCL17/TARC, TNFRSF8/CD30, E2F2, MAL, TNFSF4/OX40 ligand, IL411/Fig1 , IMAGE:686580, BST2, FLJ31131, FCER2/CD23, SAMSN1, JAK2, FLJ00066, MST1R, TRAF1, SLAM, LY75, TNFRSF6/Fas, FNBP1, TLR7, TNFRSF17/BCMA, CDKN1A/p21CIP1, RGS9, IMAGE:1340506, NFKB2, KIAA0339, ITGAM, IL23A, SPINT2, MEF2A, PFDN5, ZNF141, IMAGE:4154313, IMAGE:825382, DLEU1, ITGAE, SH3BP5, BANK, TCL1A, PRKAR1B, and CARD11. A series of linear predictor scores were generated based on the expression of this gene set. Based on the distribution of linear predictor scores within a particular lymphoma type, Bayes' rule can be used to estimate the probability that a particular sample belongs to either of the two types. An arbitrary probability cut-off of 90% or greater was used to classify a sample as a particular lymphoma type. All of the PMBL core samples were classified as PMBL using this method, as were six of the other lymphoma samples with mediastinal involvement. However, nine of the lymphoma samples with mediastinal involvement were classified as a DLBCL, as were all of the GCB and ABC samples. - In the validation set, 11 samples were identified on clinical grounds as being consistent with a diagnosis of PMBL, and the Bayesian model classified nine of these as PMBL (
Figure 21B ). Interestingly, 12 of the remaining 263 DLBCL samples were classified as PMBL by the predictor.Figure 21B shows that these cases were indistinguishable by gene expression from the nine cases diagnosed as PMBL on clinical grounds. As expected, the average expression of the PMBL predictor genes in the 249 samples classified as DLBCL was notably lower than in the 22 PMBL cases. Thus, PMBL represents a third subgroup of DLBCL than can be distinguished from ABC and GCB by gene expression profiling. - Table 40 compares the clinical parameters of patients assigned to the PMBL, ABC, and GCB subgroups of DLBCL using this prediction method.
Table 40 ABC DLBCL GCB DLBCL PMBL Training set PMBL Validation set PMBL All cases P value Median age 66 61 33 33 33 4.4E-16 Age <35 5% 10% 52% 56% 53% 7.2E-14 Age 35-60 29% 38% 44% 28% 37% Age >60 66% 52% 4% 17% 9% Gender = male 59% 53% 44% 50% 47% 0.38 Female <35 2% 3% 32% 39% 35% 1.1E-12 Male <35 2% 7% 20% 17% 19% Female 35-60 6% 18% 24% 6% 16% Male 35-60 23% 19% 20% 22% 21% Female >60 33% 25% 0% 6% 2% Male >60 34% 27% 4% 11% 7% - PMBL patients were significantly younger than other DLBCL patients, with a median age at diagnosis of 33 years compared with a median age of 66 and 61 years for ABC and GCB patients, respectively. Although there was no significant difference in gender distribution among the DLBCL subgroups, young women (< 35 years) accounted for 35% of PMBL patients, more than any other DLBCL subgroup. Young men (< 35 years) were also more frequently represented in the PMBL subgroup, accounting for 19% of the patients. Correspondingly, older men and women (age >60) were significantly underrepresented in the PMBL subgroup. These clinical characteristics were observed In both the training set and the validation set of PMBL cases, demonstrating that the PMBL predictor reproducibly identified a clinically distinct subgroup of DLBCL patients.
- The PMBL subgroup defined by the PMBL predictor had a relatively favorable overall survival rate after therapy (
Figure 22 ). PMBL patients had a five-year survival rate of 64%, superior to the 46% rate seen in DLBCL patients as a whole (p = 0.0067). The survival of the PMBL subgroup was significantly better than the 30% five-year survival rate of the ABC subgroup (Figure 22 ; p = 5.8E-5), but only marginally better than the 59% five-year survival rate of the GCB subgroup (p = 0.18). - Based on the clustering of the Lymph Dx microarray signals for the DLBCL samples, a cluster of "proliferation signature" genes and a cluster of "lymph node signature" genes were identified. The expression of these genes was averaged to form a proliferation signature and a lymph node signature. Each gene represented on the Lymph Dx microarray was placed into one of three "gene-list categories" based on its correlation with the proliferation or lymph node gene signatures. "Proliferation" genes were defined as those genes for which the correlation between their expression and the proliferation signature was greater than 0.35. Lymph node genes were defined as those genes for which the correlation between their expression and the lymph node signature was greater than 0.35. The remaining genes on the array were classified as standard genes. This classification resulted in 323 proliferation genes and 375 lymph node genes.
- Two stages of lymphoma classification were performed using the gene expression data obtained for the above samples using the Lymph Dx microarray. The general procedure used to classify the samples is presented in flow chart form in
Figure 1 . - For the first stage of expression analysis, the samples were divided into five types: FL, MCL, SLL, FH, and a class of aggressive lymphomas that included DLBCL and BL. Samples obtained from subjects with other diagnoses (e.g., MALT, LPC) were omitted from this analysis. Data from the Lymph Dx microarray was then used to compare gene expression in each possible lymphoma type pair (e.g., FH vs. FL, MCL vs. SLL, etc.). This resulted in the creation of ten "pair-wise models" (one for each possible lymphoma type pair) for predicting whether a sample fell into a particular lymphoma type.
- For each lymphoma type pair, the difference in expression between the two types for every gene on the microarray was calculated, and a t-statistic was generated to represent this difference. Within each gene-list category (proliferation, lymph node, and standard), individual genes were ordered based on the absolute value of their t-statistic. Only those genes that displayed a statistically significant difference in expression between the two types were included in the model. Those genes with largest absolute t-statistics in each gene-list category were then used to generate a linear predictor score (LPS) for each sample. For a sample X and a set of genes G, the LPS was defined as:

where Xj is the expression of gene j in the sample and tj is the t-statistic representing the difference in expression of gene j between the two lymphoma types. This formulation of LPS, known as the compound covariate predictor, has previously been used successfully (Radmacher 2002; Rosenwald 2003; Wright 2003). Other ways to formulate an LPS include Fisher linear discriminant analysis (Dudoit 2002), weighted voting (Golub 1999), linear support vector machines (Ramaswamy 2001), and nearest shrunken centroids (Tibshirani 2002). - In order to optimize the number of genes used to generate the LPS, a series of LPS's were generated for each sample using between five and 100 genes from each gene-list category. The optimal number of genes is that number which generates a maximum t-statistic when comparing the LPS of two samples from different lymphoma types (
Figure 23 ). This optimization procedure was repeated for every gene-list category in every pair-wise model, meaning that 30 optimizations were performed in all. - It was recognized that for some pair-wise models, it would be useful to calculate LPS's using different combinations of gene-list categories. LPS's were calculated for each sample using four different combinations. In the first, LPS was calculated using the standard genes only. In the second, LPS's were calculated for both the standard and proliferation genes, but not the lymph node genes. In the third, LPS's were calculated for both the standard and lymph node genes, but not the proliferation genes. In the fourth, LPS's were calculated using all three gene-list categories.
- Depending on the number of gene-list categories included, between one and three LPS's were calculated for each sample in the pair-wise models. Thus, each sample could be thought of as a vector in a space of between one and three dimensions. Since the LPSs were sums of individual expressions, it was reasonable to approximate the distributions as normal. Multivariate normal distributions are defined by two quantities: a mean vector, which indicates the average value of each of the models within a given lymphoma type, and a covariance matrix, which indicates the magnitude and orientation spread of points away from this center. Both of these quantities can be estimated empirically from the observed data.
Figure 24 shows the Standard and Proliferation LPS's for the FL vs. DLBCL/BL pair-wise model. The dotted lines indicate the standard deviations from the fitted multivariate normal distributions. - Once the multidimensional distributions have been estimated, Bayes' rule (Bayes 1763) can be used to estimate the probability that a given sample belongs to one lymphoma type or another. Bayesian analysis of an LPS has been successfully employed in the past to distinguish DLBCL subtypes (Rosenwald 2003, Wright 2003). For a sample X, the probability q of the sample belonging to a first lymphoma type rather than a second lymphoma type can be calculated using the formula:

where LPS(X) is the linear predictor score for sample X, φ(x; µ, σ) is the normal density function with mean µ and standard deviation σ, µ̂1 and σ̂1 are the mean and variance of the LPS's for the first lymphoma type, and µ̂2 and σ̂2 are the mean and variance of the LPS's for the second lymphoma type. Using this equation, a single probability q value can be developed for each sample and for each of the four LPS combinations. This q value can then be used to classify a sample as a first lymphoma type, a second lymphoma type, or unclassified. Samples with the highest q values are classified as the first lymphoma type, while samples with the lowest q values are classified as the second lymphoma type. Samples with middle range q values are deemed unclassified. Classifying the samples in this manner requires two cut-off points: a lower cut-off point between the second lymphoma type and unclassified, and an upper cut-off point between unclassified and the first lymphoma type. To develop these cut-off points, samples were ordered by their q values, and each possible cut-off point between adjacent samples was considered. To ensure that the cut-off points were reasonable, the lower cut-off point was restricted to between 0.01 and 0.5 and the upper cut-off point was restricted to between 0.5 and 0.99. - Every cut-off point and model combination was analyzed by the following equation:

- Using this equation, the cut-off point would be adjusted to allow an additional error only if this adjustment resulted in four or more unclassified samples becoming correctly classified. The final model and cut-off point for a given pair-wise analysis was that which minimized this equation. The equation utilizes percentages rather than the actual number of cases in order to account for the different number of samples in each class.
- All cut-off points between a given pair of adjacent q-values will produce the same division of data. Since cut-off point optimality is defined in terms of dividing the data into subtypes, all cut-off points between a pair of borderline cases will be equally optimal. In choosing where to place the actual cut-off point values, values were chosen that would lead to a larger unclassified region. When the lower cut-off point was being defined, a value would be chosen that was 1/5 of the way from the smallest borderline case to the largest. When the upper cut-off point was being defined, a value would be chosen that was 4/5 of the way from the smallest borderline case to the largest.
Figure 25 illustrates the q-results of optimizing the cut-point for the FL versus DLBCL/BL samples. The optimal lower cut-off point for these samples was found at q=0.49, while the optimal upper cut-off point was found at q=0.84.Figure 26 indicates how this choice of cut-off points divided the space of LPS's. - The above procedures resulted in a series of pair-wise models for comparing every lymphoma type to every other lymphoma type. If there are n types, then there will be n-1 pair-wise models for each type. Since there were five lymphoma types in the
stage 1 analysis, each type was involved in 4 pair-wise models. For instance, there were four different pair-wise models for MCL: MCL vs. FH, MCL vs. FL, MCL vs. SLL, and MCL vs. DLBCL/BL. For each sample tested, each pair-wise model will produce one of three possible results: 1) the sample belongs to the first lymphoma type of the pair-wise model, 2) the sample belongs to the second lymphoma type of the pair-wise model, or 3) the sample is unclassified. If each of the n-1 models agrees that the sample belongs to a particular lymphoma type, then the sample is designated as belonging to that type. If the n-1 models do not all agree that the sample belongs to a particular lymphoma type, the sample is designated as unclassified. - To ensure that the above methods did not result in overfitting (i.e., models that fit particular idiosyncrasies of the training set but fall when applied to independent data), the models were validated by leave-one-out cross-validation fashion (Hills 1966). Each sample was removed from the data one at a time, and a predictive model was developed as described above using the remaining data. This model was then used to predict the sample that was removed. Since the model being used to predict a given sample was generated from data that did not include that sample, this method provided an unbiased estimate of the accuracy of the model.
- The results of the leave-one-out predictions are set forth in Tables 41 and 42, below. The rows in each table correspond to different sample groups, while the columns indicate the prediction results. The standard to which the prediction results were compared in this stage was the diagnoses of a panel of eight expert hematopathologists who used histological morphology and immunohistochemistry to classify the samples. Table 41 provides classification results for the five lymphoma types tested (DLBCL/BL, FL, FH, MCL, SLL), while Table 42 provides more specific results for classification of subtypes within these five lymphoma types. The results set forth in Table 41 are also summarized in
Figure 27 .


- As seen in Table 41, perfect prediction of SLL, MCL, and FH samples was obtained. The success rate for predicting FL and the aggressive lymphomas (DLBCL/BL) was also very good, with only 3% of the samples being classified incorrectly. As seen in Table 42, perfect prediction was also obtained for ABC and PMBL samples within the DLBCL samples.
- Samples identified as DLBCL/BL in Example 16 were subdivided into four types: ABC, GCB, PMBL, and BL. These samples were then used to generate six pair-wise models using the same procedure described in Example 16. The results of the leave-one-out predictions using these pair-wise models are set forth in Table 43, below. These results are also summarized in
Figure 28 . The rows in the table correspond to different sample groups, while the columns indicate the prediction results. In this stage, the ability of the prediction method to identify BL was again measured against the diagnoses of hematopathologists. The ability of the prediction method to identify the various DLBCL subtypes, on the other hand, was measured against previous studies in which this distinction between subtypes was based on gene expression data from a Lymphochip microarray (Alizadeh 2000, Rosenwald 2002, Rosenwald 2003, Wright 2003).
- As seen in Table 43, only 1 of the 20 BL lymphoma samples was classified incorrectly. The classification of DLBCL into subtypes was also quite effective. All previously identified ABC subtype samples were again assigned to the ABC subtype, while only 5% of the GCB samples and 6% of the PMBL samples were assigned to a different subtype than they were assigned to previously.
- The above classification was implemented using S+ software and the S+ subtype predictor script contained in the file entitled "Subtype_Predictor.txt," located in the computer program listing appendix contained on CD number 22 of 22. This S+ script implements the lymphoma prediction algorithm. When this script is pasted into an S+ script window and run in a working directory containing the data set files discussed below, it will produce a text file entitled "PredictionResults.txt," which indicates the results of the predictive algorithm. The other files in the computer program listing appendix contain the required data sets, in their required format, for carrying out the lymphoma type identification described above. The file entitled "GeneData.txt" contains the gene expression values for each sample analyzed. This file is included in the working directory when the S+ subtype predictor script is run. The file entitled "GeneID.txt" contains information about the genes in the GeneData.txt file, and is also included in the working directory when the S+ subtype predictor script is run. This file indicates the UNIQID for each gene, as well as the extent to which the gene is associated with the lymph node and proliferation signatures ("LN.cor" and "pro.cor," respectively). The file entitled "SampleID.txt" contains information about the samples included in the "GeneData.txt" file, specifically the original classification of all the samples. This file is also included in the working directory when the S+ subtype predictor script is run. The file entitled "PredictionResults.txt" is an example of the productive output of the prediction algorithm.
- After the above model was validated using leave-one-out cross-validation, the model was re-fit using all of the data to generate a final predictor that could be applied to a new set of data. Tables 44-59, below, indicate for each of the pair wise models the list of genes used, the weight given to each of those genes, the signature with which each gene was associated, the mean values and covariance matrices associated with the subtypes being compared, and the q-value cut-points of the pairwise model.
Table 44: ABC vs. BL Signature Scale UNIQID Unigene ID Build 167 http://www.ncbi.nlm. nih.gov/UniGene Probe set Gene Standard -18.87 1101149 517226 229437_at BIC Standard -17.4 1121452 227817 205681_at BCL2A1 Standard -16.42 1123163 421342 208991_at STAT3 Standard -16.2 1121629 41691 205965_at BATF Standard -15 1134095 89555 208018_s_at HCK Standard -14.75 1132636 306278 204490_s_at CD44 Standard -14.33 1119939 170087 202820_at AHR Standard -14.25 1100138 278391 228234_at TIRP Standard -14.02 1128626 501452 219424_at EB13 Standard -13.89 1132883 432453 205027_s_at MAP3K8 Standard -13.88 1134991 444105 209474_s_at ENTPD1 Standard -13.37 1109913 355724 239629_at CFLAR Standard -13.25 1120389 75367 203761_at SLA Standard -12.99 1131497 114931 202295 _s_at CTSH Standard -12.71 1115071 390476 223218 _s_at MAIL Standard -12.46 1136329 132739 211675_s_at HIC Standard -12.41 1128195 115325 218699_at RAB7L1 Standard -12.37 1124381 440808 212288_at FNBP1 Standard -12.30 1100562 26608 228737_at C20orf100 Standard -12.24 1101272 179089 229584_at DKFZp434 Standard -12.18 1128536 21126 219279_at DOCK10 Standard -11.64 1098271 300670 226056_at CDGAP Standard -11.41 1119566 433506 201954_at ARPC1B Standard -11.11 1120651 80205 204269_at PIM2 Standard -10.89 1098952 62264 226841_at KIAA0937 Standard -10.80 1099939 488173 227983_at MGC7036 Standard -10.67 1134270 352119 208284_x_at GGT1 Standard -10.44 1134145 4750 208091_s_at DKFZP564 Standard -10.39 1123437 73090 209636_at NFKB2 Standard -10.17 1119884 418004 202716_at PTPM1 Standard -10.14 1129269 62919 220358_at SNFT Standard -10.13 1126293 504816 215346_at TNFRSF5 Standard -10.12 1112344 163242 242406_at Standard -10.10 1135550 221811 210550 _s_at RASGRF1 Standard -10.08 1135165 170359 209827_s_at IL16 Standard -10.05 1120808 127686 204562_at IRF4 Standard -10.01 1122087 72927 206693_at IL7 Standard -9.97 1132004 415117 203217_s_at SIAT9 Standard -9.88 1114824 193370 222762 _x_at LIMD1 Standard -9.87 1132034 410455 203271_s_at UNC119 Standard -9.87 1099680 210387 227677_at JAK3 Standard -9.86 1132830 31210 204908_s_at BCL3 Standard -9.79 1099631 367639 227624_at FLJ20032 Standard -9.78 1120267 256278 203508_at TNFRSF1B Standard -9.77 1124187 378738 211986_at MGC5395 Standard -9.73 1108970 140489 238604_at Standard -9.71 1136216 512152 211528_x_at HLA-G Standard -9.71 1120993 327 204912_at IL10RA Standard -9.68 1100847 97411 229070_at C6orf105 Standard -9.64 1123413 418291 209575_at IL10RB Standard -9.62 1115704 350268 224569_s_at IRF2BP2 Standard -9.58 1108237 126232 237753_at Standard -9.55 1121695 511759 206082_at HCP5 Standard -9.48 1101905 170843 230345_at Standard -9.42 1119243 440165 201171_at ATP6V0E Standard -9.39 1140457 210546 221658_s_at IL21R Standard -9.32 1098506 193400 226333_at IL6R Standard -9.31 1139805 414362 220230_s_at CYB5R2 Standard -9.30 1139037 173380 218223_s_at CKIP-1 Standard -9.28 1130533 76507 200706_s_at LITAF Standard -9.15 1098678 386140 226530_at BMF Standard -9.04 1133210 434374 205842_s_at JAK2 Standard 9.05 1116432 409362 229356_x_at KIAA1259 Standard 9.17 1097281 7037 224892_at PLDN Standard 9.17 1140018 438482 220917_s_at PWDMP Standard 9.30 1119997 367811 202951_at STK38 Standard 9.41 1119817 409194 202561_at TNKS Standard 9.55 1139842 133523 220367_s_at SAP130 Standard 9.64 1132122 307734 203434_s_at MME Standard 9.77 1119258 88556 201209_at HDAC1 Standard 9.80 1128248 234149 218802_at FLJ20647 Standard 10.38 1101211 287659 229513_at STRBP Standard 10.52 1123419 170195 209590_at BMP7 Standard 10.71 1133755 404501 207318_s_at CDC2L5 Standard 10.80 1128192 102506 218696_at EIF2AK3 Standard 10.85 1124786 22370 212847_at NEXN Standard 10.92 1130114 445084 221965_at MPHOSPH9 Standard 11.00 1126081 309763 215030_at GRSF1 Standard 11.17 1118736 96731 38340_at HIP1R Standard 11.26 1124613 296720 212599_at AUTS2 Standard 11.43 1125456 300592 213906_at MYBL1 Standard 11.60 1097177 9691 224761_at GNA13 Standard 12.11 1120400 152207 203787_at SSBP2 Standard 12.12 1139266 76640 218723_s_at RGC32 Standard 12.22 1100770 65578 228976_at Standard 12.73 1131246 153752 201853_s_at CDC25B Standard 13.48 1096503 21379 223522_at C9orf45 Standard 14.50 1124920 6150 213039_at ARHGEF1 Standard 15.03 1128360 445043 218988_at SLC35E3 Standard 15.24 1099444 434489 227407_at FLJ90013 Standard 21.03 1134582 78202 208794_s_at SMARCA4 Standard Mean ABC -4179.76 Cut 1 0.20 Mean BL -1894.68 Cut 2 0.80 Covariance ABC 53707.58 Covariance BL 194887.5 Table 45: ABC vs. GCB Signature Scale UNIQID Unigene ID Build 167 http://www.ncbi.nlm.nih. gov/UnIGene Probe set Gene symbol Standard -15.31 1122645 158341 207641_at TNFRSF13B Standard -14.56 1120651 80205 204269_at PIM2 Standard -14.18 1120808 127686 204662_at IRF4 Standard -13.84 1114824 193370 222762_x_at LIMD1 Standard -13.44 1136687 59943 212345_s_at CREB3L2 Standard -13.12 1139805 414362 220230_s_at CYB5R2 Standard -12.23 1104552 193857 233483_at LOC96597 Standard -12.19 1097236 235860 224837_at FOXP1 Standard -12.06 1121629 41691 205965_at BATF Standard -11.93 1128195 115325 218699_at RAB7L1 Standard -11.72 1111503 502910 241383_at KBRAS2 Standard -11.66 1134991 444105 209474_s_at ENTPD1 Standard -11.27 1098678 386140 226530_at BMF Standard -10.9 1131074 76894 201572_x_at DCTD Standard -10.82 1135165 170359 209827_s_at IL16 Standard -10.7 1132396 118722 203988_s_at FUTB Standard -10.54 1131541 310230 202369_s_at TRAM2 Standard -10.47 1105759 171262 235056_at ETV6 Standard -10.38 1121564 437783 205865_at ARID3A Standard -10.16 1130472 192374 200599_s_at TRA1 Standard -10.04 1132058 161999 203313_s_at TGIF Standard -10.03 1105684 195155 234973_at SLC38A5 Standard -9.95 1097735 26765 225436_at LOC58489 Standard -9.94 1115071 390476 223218_s_at MAIL Standard -9.85 1101149 517226 229437_at BIC Standard -9.83 1119884 418004 202716_at PTPN1 Standard -9.71 1134095 89555 208018_s_at HCK Standard -9.68 1135550 221811 210550_s_at RASGRF1 Standard -9.61 1098927 356216 226811_at FLJ20202 Standard -9.6 1120389 75367 203761_at SLA Standard -9.58 1133910 167746 207655_s_at BLNK Standard 9.56 1118736 96731 38340_at HIP1R Standard 9.58 1128860 323634 219753_at STAG3 Standard 9.68 1134582 78202 208794_s_at SMARCA4 Standard 9.7 1121853 98243 206310_at SPINK2 Standard 10.14 1119258 88556 201209_at HDAC1 Standard 10.19 1132122 307734 203434_s_at MME Standard 10.23 1120400 152207 203787_at SSBP2 Standard 10.48 1529344 317970 Lymph_Dx_065_at SERPINA11 Standard 10.64 1124613 296720 212599_at AUTS2 Standard 10.72 1132159 147868 203521_s_at ZNF318 Standard 10.98 1097901 266175 225626_at PAG Standard 11.1 1128287 300063 218862_at ASB13 Standard 12.26 1099686 117721 227684_at Standard 12.45 1112674 310320 242794_at MAML3 Standard 13.15 1120370 78877 203723_at ITPKB Standard 14.23 1125456 300592 213906_at MYBL1 Lymph Node 6.8 1097202 386779 224796_at DDEF1 Lymph Node 6.85 1131755 241257 202729_s_at LTBP1 Lymph Node 7.27 1136273 13775 211597_s_at HOP Lymph Node 7.35 1119424 75485 201599_at OAT Lymph Node 7.86 1095985 83883 222450_at TMEPAI Lymph Node 8.02 1124875 18166 212975_at KIAA0870 Lymph Node 8.32 1124655 79299 212658_at LHFPL2 Lymph Node 8.62 1115034 387222 223158_s_at NEK6 Proliferation -9.11 1120583 153768 204133_at RNU3IP2 Proliferation -7.87 1135492 408615 210448_s_at P2RX5 Proliferation -7.68 1127756 313544 217850_at NS Proliferation -7.57 1097195 149931 224785_at MGC29814 Proliferation -7.31 1127813 14317 217962_at NOLA3 Proliferation -7.24 1138944 84753 218051_s_at FLJ12442 Proliferation -6.99 1139226 266514 218633_x_at FLJ11342 Proliferation -6.7 1137486 441069 214442_s_at MIZ1 Proliferation -6.51 1133786 153591 207396_s_at ALG3 Proliferation -6.45 1131150 75514 201695_s_at NP Proliferation -6.45 1119076 268849 200681_at GLO1 Proliferation -6.38 1115679 8345 224523_s_at MGC4308 Proliferation -6.34 1110223 212709 239973_at Proliferation -6.3 1529338 284275 Lymph_Dx_058_s_at PAK2 Proliferation -6.24 1135164 458360 209825_s_at UMPK Proliferation -6.24 1128738 335550 219581_at MGC2776 Proliferation -6.01 1099088 14355 226996_at Proliferation -5.98 1123192 315177 209100_at IFRD2 Proliferation -5.83 1116073 146161 227103_s_at MGC2408 Proliferation 5.79 1097388 278839 225024_at C20orf77 Proliferation 6.13 1124563 249441 212533_at WEE1 Standard Lymph Node Proliferation Mean ABC -2226.57 476.67 -1096.34 Cut 1 0.50 Mean GCB -1352.02 547.18 -1005.72 Cut 2 0.74 Covariance ABC 33472.10 3418.91 4347.99 3418.91 1296.05 846.32 4347.99 846.32 1609.13 Covariance GCB 53751.59 466.34 751.08 466.34 777.74 249.29 751.08 249.29 1708.67 Table 46: ABC vs. PMBL Signature Scale UNIQID Unigene ID Build 167 http://www.ncbi.nlm. nih.gov/UniGene Probe set Gene Symbol Standard -14.61 1097236 235860 224837_at FOXP1 Standard -14.47 1104552 193857 233483_at LOC96597 Standard -13.62 1122645 158341 207641_at TNFRSF13B Standard -12.05 1135102 349845 209685_s_at PRKCB1 Standard -11.65 1096499 293867 223514_at CARD11 Standard -11.26 1124770 153261 212827_at IGHM Standard -11.25 1125010 43728 213170_at GPX7 Standard -11.13 1109545 63187 239231_at Standard -10.99 1109220 445977 238880_at GTF3A Standard -10.87 1131074 76894 201572_x_at DCTD Standard -10.68 1134517 75807 208690_s_at PDLIM1 Standard -10.63 1098604 32793 226444_at SLC39A10 Standard -10.56 1131219 109150 201810_s_at SH3BP5 Standard -10.52 1120651 80205 204269_at PIM2 Standard -10.39 1133910 167746 207655_s_at BLNK Standard -10.32 1099396 435949 227346_at ZNFN1A1 Standard -10.25 1529297 132335 Lymph_Dx_01 5_at Standard -10.17 1107575 424589 237033_at MGC52498 Standard -10.11 1117211 356509 233955_x_at HSPC195 Standard 10.06 1129517 -33 220712_at Standard 10.29 1139950 437385 220731_s_at FLJ10420 Standard 10.35 1097553 197071 225214_at PSMB7 Standard 10.41 1119516 6061 201834_at PRKAB1 Standard 10.47 1122772 66742 207900_at CCL17 Standard 10.55 1132762 80395 204777_s_at MAL Standard 10.77 1099265 375762 227193_at Standard 10.81 1095996 288801 222482_at SSBP3 Standard 11.14 1100770 65578 228976_at Standard 11.19 1133801 181097 207426_s_at TNFSF4 Standard 11.61 1099154 97927 227066_at MOBKL2C Standard 11.63 1120370 78877 203723_at ITPKB Standard 11.8 1112674 310320 242794_at MAML3 Standard 12.57 1105178 283961 234284_at GNG8 Standard 12.63 1124613 296720 212599_at AUTS2 Standard 13.28 1106415 169071 235774_at Standard 13.3 1121762 32970 206181_at SLAMF1 Standard 13.6 1121853 .98243 206310_at SPINK2 Lymph Node 10.91 1105838 129837 235142_at ZBTB8 Lymph Node 10.99 1136273 13775 211597_s_at HOP Lymph Node 11.02 1099418 172792 227370_at KIAA1946 Lymph Node 11.46 1124875 18166 212975_at KIAA0870 Lymph Node 11.99 1120299 79334 203574_at NFIL3 Lymph Node 12.49 1135871 104717 211031_s_at CYLN2 Lymph Node 13.33 1121767 458324 206187_at PTGIR Proliferation -13.17 1138944 84753 218051_s_at FLJ12442 Proliferation -11.61 1116122 42768 227408_s_at DKFZp76100113 Proliferation -11.16 1110223 212709 239973_at Proliferation -9.93 1120717 444159 204394_at SLC43A1 Proliferation -9.54 11100999 116665 239835_at TA-KRP Proliferation -9.49 1130942 445977 201338_x_at GTF3A Proliferation -9.28 1123192 315177 209100_at IFRD2 Proliferation -9.14 1135492 408615 210448_s_at P2RX5 Proliferation -9.03 1120011 3068 202983_at SMARCA3 Proliferation -9.01 1096738 87968 223903_at TLR9 Proliferation -8.91 1108961 292088 238593_at FLJ22531 Standard Lymph Node Proliferation Mean ABC -849.47 531.79 -1027.48 Cut 1 0.20 Mean PMBL 27.99 750.84 -872.43 Cut 2 0.80 Covariance ABC 14028.46 3705.84 3118.60 3705.84 2326.91 1083.37 3118.60 1083.37 1589.42 Covariance PMBL 19425.29 5109.98 2199.28 5109.98 2084.28 620.86 2199.28 620.86 1028.44 Table 47: BL vs. GCB Signature Scale UNIQID Unigene ID Build 167 http://www.ncbi.nlm. nih.gov/UniGene Probe set Gene Symbol Standard -12.78 1131246 153752 201853_s_at CDC25B Standard -11.35 1099444 434489 227407_at FLJ90013 Standard -10.4 1116432 409362 229356_x_at KIAA1259 Standard -10.3 1134582 78202 208794_s_at SMARCA4 Standard -10.01 1133998 76884 207826_s_at ID3 Standard -9.3 1126081 309763 215030_at GRSF1 Standard -9.19 1096503 21379 223522_at C9orf45 Standard -8.95 1529340 -99 Lymph_Dx_06 1_at Standard -8.88 1138128 390428 216199_s_at MAP3K4 Standard -8.8 1099152 351247 227064_at MGC15396 Standard -8.69 1133757 6113 207320_x_at STAU Standard -8.54 1116593 422889 230329_s_at NUDT6 Standard -8.4 1130926 508741 201310_s_at C5orf13 Standard -8.39 1135685 371282 210776_x_at TCF3 Standard -8.39 1140520 11747 221741_s_at C20orf21 Standard -8.34 1119802 7370 202522_at PITPNB Standard -8.31 1096149 410205 222824_at NUDT5 Standard -8.23 1124786 22370 212847_at NEXN Standard -8.07 1098012 355669 225756_at CSNK1E Standard -7.89 1116317 526415 228661_s_at Standard -7.86 1109195 416155 238853_at Standard -7.71 1134880 168799 209265_s_at METTL3 Standard -7.66 1529298 136707 Lymph_Dx_01 6_at Standard -7.55 1128660 413071 219471_at C13of18 Standard -7.55 1138973 11270 218097_s_at C10orf66 Standard -7.46 1127294 421986 217028_at CXCR4 Standard 7.47 1134270 352119 208284_x_at GGT1 Standard 7.48 1120743 79197 204440_at CD83 Standard 7.5 1098179 163725 225956_at LOC153222 Standard 7.55 1121400 223474 205599_at TRAF1 Standard 7.59 1114967 7905 223028_s_at SNX9 Standard 7.6 1122087 72927 206693_at IL7 Standard 7.64 1101905 170843 230345_at Standard 7.77 1120700 410745 204362_at SCAP2 Standard 7.8 1120572 84 204116_at IL2RG Standard 7.84 1098271 300670 226056_at CDGAP Standard 7.9 1115073 131315 223220_s_at BAL Standard 7.9 1133210 434374 205842_s_at JAK2 Standard 8 1129269 62919 220358_at SNFT Standard 8.01 1131940 1103 203085_s_at TGFB1 Standard 8.07 1098506 193400 226333_at IL6R Standard 8.13 1120601 441129 204166_at KIAA0963 Standard 8.21 1102540 434881 231093_at FCRH3 Standard 8.24 1121695 511759 206082_at HCP5 Standard 8.33 1136877 409934 212998_x_at HLA-DQB1 Standard 8.37 1100138 278391 228234_at TIRP Standard 8.46 1126293 504816 216346_at TNFRSF5 Standard 8.46 1127805 380627 217947_at CKLFSF6 Standard 8.59 1136573 914 211991_s_at HLA-DPA1 Standard 8.62 1119911 35052 200804_at TEGT Standard 8.7 1136329 132739 211675_s_at HIC Standard 8.74 1123690 111805 210176_at TLR1 Standard 8.81 1138677 390440 217436_x_at Standard 8.89 1113993 131811 244286_at Standard 8.89 1132651 439767 204529_s_at TOX Standard 8.91 1119566 433506 201954_at ARPC1B Standard 9.01 1128626 501452 219424_at EB13 Standard 9.17 1101272 179089 229584_at DKFZp434H2111 Standard 9.33 1136777 387679 212671_s_at HLA-DQA1 Standard 9.33 1109756 530304 239453_at Standard 9.4 1136216 512152 211528_x_at HLA-G Standard 9.4 1124381 440808 212288_at FNBP1 Standard 9.46 1099680 210387 227677_at JAK3 Standard 9.49 1109913 355724 239629_at CFLAR Standard 9.55 1132636 306278 204490_s_at CD44 Standard 9.59 1119243 440165 201171_at ATP6V0E Standard 9.72 1101149 517226 229437_at BIC Standard 9.8 1130674 381008 200905_x_at HLA-E Standard 10.34 1119939 170087 202820_at AHR Standard 10.44 1132883 432453 205027_s_at MAP3K8 Standard 10.74 1121452 227817 205681_at BCL2A1 Standard 10.84 1137360 429658 214196_s_at CLN2 Standard 12.08 1132520 283063 204249_s_at LMO2 Standard 12.33 1131497 114931 202296_s_at CTSH Standard 13.58 1123163 421342 208991_at STAT3 Lymph Node -9.1 1138136 433574 216215_s_at RBM9 Lymph Node 8.78 1130121 411958 221978_at HLA-F Lymph Node 9.22 1139830 221851 220330_s_at SAMSN1 Lymph Node 9.23 1131705 386467 202638_s at ICAM1 Lymph Node 9.62 1130168 75626 222061_at CD58 Lymph Node 9.66 1121844 83077 206295_at IL18 Lymph Node 9.68 1121000 519033 204924_at TLR2 Lymph Node 9.83 1102437 437023 230966_at IL4I1 Lymph Node 10.71 1119475 296323 201739_at SGK Lymph Node 11.09 1131786 375957 202803_s_at ITGB2 Proliferation -11.07 1133141 344524 205677_s_at DLEU1 Proliferation -10.04 1138259 89525 216484_x_at HDGF Proliferation -9.74 1131578 202453 202431_s_at MYC Proliferation -9.45 1137449 223745 214363_s_at MATR3 Proliferation -9.43 1130468 166463 200594_x_at HNRPU Proliferation -9.21 1138157 82563 216251_s_at KIAA0153 Proliferation -9.15 1127756 313544 217850_at NS Proliferation -9 1130433 246112 200058_s_at U5-200KD Proliferation -8.76 1123108 108112 208828_at POLE3 Proliferation -8.75 1128738 335550 219581_at MGC2776 Proliferation -8.74 1122400 439911 207199_at TERT Proliferation -8.66 1097948 69476 225684_at LOC348235 Proliferation -8.6 1119460 76122 201696_at SFRS4 Proliferation -8.6 1136401 27258 211761_s_at SIP Proliferation -8.58 1099088 14355 226996_at Proliferation -8.51 1134653 253536 208901_s_at TOP1 Proliferation -8.49 1140584 294083 22193_s_at C14orf87 Proliferation -8.43 1121309 23642 205449_at HSU79266 Proliferation -8.43 1120385 36708 203755_at BUB1B Proliferation -8.38 1136710 75782 212429_s_at GTF3C2 Proliferation -8.36 1136605 448398 212064_x_at MAZ Proliferation -8.24 1120697 323462 204355_at DHX30 Proliferation -8.19 1127833 382044 218001_at MRPS2 Proliferation -8.11 1096903 437460 224185_at FLJ10385 Proliferation -8.1 1120596 4854 204159_at CDKN2C Proliferation -8.1 1120779 28853 204510_at CDC7 Standard Lymph Node Proliferation Mean BL 1098,69 576.05 -2392.12 Cut 1 0.09 Mean GCB 2187.37 768.53 -2129.35 Cut 2 0.53 Covariance BL 75263.67 12684.43 15734.77 12684.43 2650.81 2358.05 15734.77 2358.05 4653.00 Covariance GCB 50548.22 9301,12 14182.83 9301.12 2602.51 3028.21 14182.83 3028,21 5983.04 Table 48: BL vs. PMBL Signature Scale UNIQID Unigene ID Build 167 http://www.ncbi.nlm. nih.gov/UniGene Probe set Gene Symbol Standard -13.54 1099444 434489 227407_at FLJ90013 Standard -13.42 1096503 21379 223522_at C9orf45 Standard -13.36 1130114 445084 221965_at MPHOSPH9 Standard -13.27 1124786 22370 212847_at NEXN Standard -13.27 1134582 78202 208794_s_at SMARCA4 Standard -12.37 1096149 410205 222824_at NUDT5 Standard -11.95 1130855 77515 201189_s_at ITPR3 Standard -11.66 1529298 136707 Lymph_Dx_016_at Standard -11.35 1131246 153752 201853_s_at CDC25B Standard -11.17 1136925 436939 213154_s_at BICD2 Standard -11.08 1124188 282346 211987_at TOP2B Standard -11.06 1133998 76884 207826_s_at ID3 Standard -10.76 1139266 76640 218723_s_at RGC32 Standard -10.74 1134880 168799 209265_s_at METTL3 Standard -10.69 1140520 11747 221741_s_at C20orf21 Standard -10.6 1109545 63187 239231_at Standard -10.55 1106043 266331 235372_at FREB Standard -10.52 1110214 144519 239964_at TCL6 Standard -10.49 1098592 283707 226431_at ALS2CR13 Standard -10.45 1109220 445977 238880_at GTF3A Standard -10.41 1131263 249955 201877_s_at PPP2R5C Standard 10.54 1122772 66742 207900_at CCL17 Standard 10.59 1109913 355724 239629_at CFLAR Standard 10.82 1119884 418004 202716_at PTPN1 Standard 10.83 1135189 137569 209863_s_at TP73L Standard 10.89 1123437 73090 209636_at NFKB2 Standard 11.15 1124381 440808 212288_at FNBP1 Standard 11.26 1108237 126232 237753_at Standard 11.34 1101149 5172256 229437_at BIC Standard 11.77 1139774 15827 220140_s_at SNX11 Standard 11.87 1123163 421342 208991_at STAT3 Standard 11.93 1129269 62919 220358_at SNFT Standard 12.03 1132636 306278 204490_s_at CD44 Standard 12.1 1138677 390440 217436_x_at Standard 12.2 1139950 437385 220731_s_at FLJ10420 Standard 12.25 1134270 352119 208284_x_at GGT1 Standard 12.27 1136216 512152 211528_x_at HLA-G Standard 12.79 1121400 223474 205599_at TRAF1 Standard 12.82 1119939 170087 202820_at AHR Standard 13.12 1126293 504816 215346_at TNFRSF5 Standard 13.44 1100138 278391 228234_at TIRP Standard 13.74 1132883 432453 205027_s_at MAP3K8 Standard 13.94 1131497 114931 202295_s_at CTSH Standard 14.15 1121762 32970 206181_at SLAMF1 Standard 14.51 1132520 283063 204249_s_at LMO2 Standard 14.68 1121452 227817 205681_at BCL2A1 Standard 15.24 1105178 283961 234284_at GNG8 Lymph Node 10.95 1121205 2488 205269_at LCP2 Lymph Node 11.22 1140845 21486 AFFX- HUMISGF3A/M 97935_3_at STAT1 Lymph Node 11.45 1131068 118400 201564_s_at FSCN1 Lymph Node 11.92 1131705 386467 202638_s_at ICAM1 Lymph Node 12.06 1131038 81328 201502_s_at NFKBIA Lymph Node 12.49 1121444 153563 205668_at LY75 Lymph Node 13.01 1123457 446304 209684_at RIN2 Lymph Node 13.19 1140404 354740 221584_s_at KCNMA1 Lymph Node 13.26 1124875 18166 212975_at KIAA0870 Lymph Node 14.06 1102437 437023 230966_at IL4I1 Lymph Node 14.11 1132766 82359 204781_s_at TNFRSF6 Lymph Node 15.31 1121767 458324 206187_at PTGIR Lymph Node 15.32 1135871 104717 211031_s_at CYLN2 Lymph Node 15.34 1138652 444471 217388_s_at KYNU Lymph Node 16.01 1139830 221851 220330_s_at SAMSN1 Standard Lymph Node Mean BL -66.97 1445.63 Cut 1 0.20 Mean PMBL 1205.38 2041.25 Cut 2 0.80 Covariance BL 35263.67 13424.88 13424.88 7458,56 Covariance PMBL 12064.38 5113.74 5113,74 3216.53 Table 49: FH vs. DLBCL-BL Signature Scale UNIQID Unigene ID Build 167 Http://www.ncbi.nlm. nih.gov/UniGene Probe set Gene symbol Standard -12.81 1104910 458262 233969_at IGL@ Standard -11.54 1102898 145519 231496_at FKSG87 Standard -11.46 1117298 449586 234366_x_at Standard -11.46 1132973 169294 205255_x_at TCF7 Standard -11.22 1133099 88646 205554_s_at DNASE1L3 Standard -10.75 1131531 153647 202350_s_at MATN2 Standard -10.59 1124283 406612 212144_at UNC84B Standard -10.35 1099847 36723 227867_at LOC129293 Standard -10.22 1136430 102950 211798_x_at IGLJ3 Standard -10.05 1117394 -13 234792_x_at Standard -9.95 1133047 528338 205434_s_at AAK1 Standard -9.95 1098865 250905 226741_at LOC51234 Standard -9.82 1108515 98132 238071_at LCN6 Standard -9.8 1131407 154248 202125_s_at ALS2CR3 Standard -9.77 1128469 390817 219173_at FLJ22686 Standard -9.7 1123875 428 210607_at FLT3LG Standard -9.69 1131875 169172 202965_s_at CAPN6 Standard -9.69 1135173 3781 209841_s_at LRRN3 Standard -9.48 1099798 411081 227811_at FGD3 Standard -9.41 1119046 349499 200606_at DSP Standard -9.36 1122449 278694 207277_at CD209 Standard -9.34 1114017 133255 244313_at Standard -9.34 1122767 652 207892_at TNFSF5 Standard -9.24 1123369 79025 209481_at SNRK Standard -9.16 1098954 128905 226844_at MOBKL2B Standard -9.14 1135513 421437 210481_s_at CD209L Standard -9.08 1100904 426296 229145_at LOC119504 Standard -8.99 1122738 81743 207840_at CD160 Standard -8.94 1120925 204891 204773_at IL11RA Standard 9.09 1123055 185726 208691_at TFRC Standard 9.62 1134858 405954 209226_s_at TNPO1 Standard 10.19 1123052 180909 208680_at PRDX1 Standard 10.81 1124178 446579 211969_at HSPCA Lymph Node -10.59 1137597 3903 214721-x_at CDC42EP4 Lymph Node -9.69 1119684 439586 202242_at TM4SF2 Lymph Node -9.25 1125593 8910 214180_at MAN1C1 Lymph Node -8.44 1124318 21858 212190-at SERPINE2 Lymph Node -8.09 1119448 212296 201656_at ITGA6 Lymph Node -8.07 1125546 125036 214081_at PLXDC1 Lymph Node -7.7 1097683 132569 225373_at PP2135 Lymph Node -7.56 1101305 112742 229623_at Lymph Node 7.45 1135240 436852 209955_s_at FAP Proliferation 6.97 1135101 20830 209680_s_at KJFC1 Proliferation 7.03 1130426 432607 200039_s_at PSMB2 Proliferation 7.04 1130501 2795 200660_s_at LDHA Proliferation 7.08 1130744 158688 201027_s_at EIF5B Proliferation 7.23 1137506 75258 214501_s_at H2AFY Proliferation 7.32 1131474 95577 202246_s_at CDK4 Proliferation 7.39 1130871 159087 201222_s_at RAD23B Proliferation 7.42 1119375 381072 201489_at PPIF Proliferation 7.47 1136595 404814 212038_s_at VDAC1 Proliferation 7.7 1135858 90093 211015_s_at HSPA4 Proliferation 7.78 1130527 184233 200692_s_at HSPA9B Proliferation 7.78 1130820 151777 201144_s_at EIF2S1 Proliferation 7.83 1115829 433213 225253_s_at METTL2 Proliferation 7.84 1134699 439683 208974_x_at KPNB1 Proliferation 7.87 1120274 31584 203517_at MTX2 Proliferation 7.92 1136786 63788 212694_s_at PCCB Proliferation 7.95 1097172 434886 224753_at CDCA5 Proliferation 8.4 1138537 -12 217140_s_at Proliferation 8.53 1119488 154672 201761_at MTHFD2 Proliferation 8.58 1130799 233952 201114_x_at PSMA7 Proliferation 8.72 1135673 82159 210759_s_at PSMA1 Proliferation 9.4 1114679 16470 222503_s_at FLJ10904 Standard Lymph Node Proliferation Mean FH -2193.59 -588.21 1571.78 Cut 1 0.50 Mean DLBCL-BL -1448.27 -441.91 1735.00 Cut 2 0,92 Covariance FH 6729.73 1223.99 2541.22 1223.99 405.22 293.72 2541.22 293,72 1797.58 Covariance DLBCL-BL 17675.23 3642.41 4158.43 3642.41 1379.81 1066.48 4158.43 1066.48 2858.21 Table 50: FH vs. FL Signature Scale UNIQID Unigene ID Build 167 http://www.nebi.nlm. nih.gov/UniGene Probe set Gene Symbol Standard -11.23 1117298 449586 234366_x_at Standard -10.62 1121953 38365 206478_at KIAA0125 Standard -10.6 1104910 458262 233969_at IGL@ Standard -10.39 1136430 102950 211798_x_at IGLJ3 Standard -9.96 1129281 395486 220377_at C14orf110 Standard -9.73 1118835 102336 47069_at ARHGAP8 Standard -9.21 1127807 7236 217950_at NOSIP Standard -9.05 1128377 371003 219014_at PLAC8 Standard -8.85 1101004 2969 229265_at SKI Standard 9.06 1139411 368238 219073_s_at OSBPL10 Standard 9.07 1120789 154729 204524_at PDPK1 Standard 9.21 1136464 159428 211833_s_at BAX Standard 9.29 1125279 445652 213575_at TRA2A Standard 9.45 1529390 79241 Lymph_Dx_12 0_at BCL2 Standard 9.52 1132022 173911 203247_s_at ZNF24 Standard 9.57 1139645 134051 2197577_s_at C14orf101 Standard 9.64 1137561 67397 214639_s_at HOXA1 Standard 9.66 1114893 314623 222891_s_at BCL11A Standard 10.38 1098095 131059 225852_at ANKRD17 Standard 10.4 1134858 405954 209226_s_at TNPO1 Standard 12.65 1101054 173328 229322_at PPP2R5E Standard 12.79 1124178 446579 211969_at HSPCA Standard 13.34 1135489 288178 210438_x_at SSA2 Standard Mean FH 136.43 Cut 10.50 Mean FL 640.38 Cut 20.99 Covariance FH 10719.40 Covariance FL 9373.11 Table 51: FH vs. MCL Signature Scale UNIQID Unigene ID Build 167 http://www.ncbi,nlm. nih.gov/UniGene Probe set Gene Symbol Standard 13.05 1100258 88442 228377_at KIAA1384 Standard 13.43 1529382 371468 Lymph_Dx_111_at CCND1 Standard 13.54 1106855 455101 236255_at KIAA1909 Standard 13.73 1529308 193014 Lymph_Dx_027_x_at Standard 14.56 1100873 445884 229103_at Standard 21.12 1132834 432638 204914_s_at SOX11 Lymph Node -8.44 1130378 234434 44783_s_at HEY1 Lymph Node -7.92 1123552 423077 209879_at SELPLG Lymph Node -7.7 1131218 76753 201809_s_at ENG Lymph Node -7.4 1097683 132569 225373_at PP2135 Lymph Node -7.15 1136273 13775 211597_s_at HOP Lymph Node 14.16 1134532 371468 208711_s_at CCND1 Standard Lymph Node Mean FH 451.68 -282.65 Cut 10.20 Mean MCFL 863.16 -156.82 Cut 20.80 Covariance FH 1617,92 222.89 222.89 271.65 Covariance MCL 3154.38 917.30 917.30 659.94 Table 52: FH vs. SLL Signature Scale UNIQID Unigene ID Build 167 http://www.ncbi.nlm. nih.gov/UniCene Probe set Gene Symbol Standard -13,14 1120765 343329 204484_at PIK3C2B Standard -12.9 1097897 266175 225622_at PAG Standard 12.72 1133195 274243 205805_s_at ROR1 Standard 12.74 1140416 58831 221601_s_at TOSO Standard 13.53 1131687 369280 202606_s_at TLK1 Standard 13.57 1107044 163426 236458_at Standard 14.43 1529389 79241 Lymph_Dx_119 at BCL2 Standard 14.51 1129026 135146 220007_at FLJ13984 Standard 14.77 1136987 21695 213370_s_at SFMBT1 Standard 14.79 1137109 469653 213689_x_at RPL5 Standard 15.37 1529308 193014 Lymph_Dx_027 _x_at Standard 15.82 1120832 57856 204604_at PFTK1 Standard 17.37 1135550 221811 210550_s_at RASGRF1 Standard 18.98 1122864 434384 208195_at TTN Lymph Node -12.89 1123038 119000 208636_at ACTN1 Lymph Node -12.8 1130378 234434 44783_s_at HEY1 Lymph Node -11.59 1124875 18166 212975_at KIAA0870 Lymph Node -11.47 1103497 50115 232231_at Lymph Node -10.31 1099358 93135 227300_at Lymph Node -10.27 1121129 285401 205159_at CSF2RB Lymph Node -10.23 1100249 388674 228367_at HAK Lymph Node -10.05 1132345 109225 203868_s_at VCAM1 Lymph Node -9.93 1123401 50130 209550_at NDN Lymph Node -9.75 1120500 82568 203979_at CYP27A1 Lymph Node -9.57 1124318 21858 212190_at SERPINE2 Lymph Node -9.48 1120288 17483 203547_at CD4 Lymph Node -9.45 1123372 195825 209487_at RBPMS Lymph Node -9.39 1123376 37682 209496_at RARRES2 Lymph Node -9.29 1123213 12956 209154_at TIP-1 Lymph Node -9.23 1098412 409515 226225_at MCC Lymph Node -9.23 1125593 8910 214180_at MAN1C1 Lymph Node -9.17 1131786 375957 202803_s_at ITGB2 Lymph Node -9.04 1097683 132569 225373_at PP2135 Lymph Node -8.91 1097255 380144 224861_at Lymph Node -8.76 1131068 118400 201564_s_at FSCN1 Lymph Node -8.7 1119074 54457 200675_at CD81 Lymph Node -8.68 1125130 35861 213338_at RIS1 Lymph Node -8.59 1139661 416456 219806_s_at FN5 Standard Lymph Node Mean FH 1144,02 -2223.71 Cut 1 0.20 Mean SLL 1592.27 -1798.11 Cut 2 0.80 Covariance FH 902.56 442.69 442.69 809.90 Covariance SLL 2426.26 2938.58 2938.58 9435.72 Table 53: FL vs. DLBCL-BL Signature Scale UNIQID Unigene ID Build 167 http://www.ncbi.nlm. nih,gov/UniGene Probe set Gene Symbol Standard -23.03 1124833 356416 212914_at CBX7 Standard -22.25 1099204 193784 227121_at Standard -22.2 1119766 93231 202423_at MYST3 Standard -22.04 1099798 411081 227811_at FGD3 Standard -22.01 1102898 145519 231496_at FKSG87 Standard -21.79 1131197 269902 201778_s_at KIAA0494 Standard -21.69 1098415 130900 226230_at K1AA1387 Standard -21.57 1120834 57907 204606_at CCL21 Standard -21.39 1130155 436657 222043_at CLU Standard -20.98 1100904 426296 229145_at LOC119504 Standard -20.8 1131531 153647 202350_s_at MATN2 Standard -20.72 1137582 433732 214683_s_at CLK1 Standard -20.66 1119782 155418 202478_at TRB2 Standard -20.59 1122767 652 207892_at TNFSF5 Standard -20.58 1125001 16193 213158_at Standard -20.56 1134921 413513 209341_s_at IKBKB Standard -20.56 1132973 169294 205255_x_at TCF7 Standard -20.53 1136984 498154 213364_s_at SNX1 Standard -20.41 1115888 35096 225629_s_at ZBTB4 Standard -20.37 1120160 436976 203288_at KIAA0355 Standard -20.36 1139054 25726 218263_s_at LOC58486 Standard -20.31 1130030 301872 221834_at LONP Standard -20.08 1133024 436987 205383_s_at ZNF288 Standard -20.05 1124666 526394 212672_at ATM Standard -19.3 1529397 406557 Lymph_Dx_127_s_at CLK4 Standard -19.16 1116056 243678 226913_s_at SOX8 Standard -19.14 1098433 202577 226250_at Standard -19.1 1123635 408614 210073_at SIAT8A Standard -18.95 1138920 24395 218002_s_at CXCL14 Standard -18.84 1133099 88646 205554_s_at DNASE1L3 Standard -18.83 1098495 443668 226318_at TBRG1 Standard -18.64 1100879 119983 229111_at MASP2 Standard -18.59 1120695 385685 204352_at TRAF5 Standard -18.55 1119983 409783 202920_at ANK2 Standard -18.5 1101276 1098 229588_at ERdj5 Standard -18.47 1099140 500350 227052_at Standard -18.46 1529331 374126 Lymph_Dx_05 1_s_at Standard -18.45 1131752 170133 202724_s_at FOXO1A Standard -18.45 1099265 375762 227193_at Standard -18.32 1098179 163725 225956_at LOC153222 Standard -18.29 1119568 269777 201957_at PPP1R12B Standard -18,19 1099900 444508 227934_at Standard -18.17 1119361 391858 201448_at TIA1 Standard -18.02 1121650 421137 206002_at GPR64 Standard -17.91 1100911 320147 229152_at C4orf7 Standard -17.86 1529285 348929 Lymph_Dx_00 2_at KIAA1219 Standard -17.47 1529357 444651 Lymph_Dx_08 1_at Standard -17.42 1131863 2316 202936_s_at SOX9 Standard -17.16 1129943 512828 221626_at ZNF506 Standard -17.12 1121301 449971 205437_at ZNF134 Standard -17.11 1131340 437457 202018_s_at LTF Standard -17.1 1124606 444324 212588_at PTPRC Standard -17.08 1131407 154248 202125_s_at ALS2CR3 Standard -16.97 1118939 198161 60528_at PLA2G4B Standard -16.91 1134738 75842 209033_s_at DYRK1A Standard -16.9 1134083 285091 207996_s_at C18orf1 Standard -16.89 1120925 204891 204773_at IL11RA Standard -16.86 1110070 -101 239803_at Standard -16.83 1100042 351413 228113_at RAB37 Standard -16.82 1120134 75545 203233_at IL4R Standard -16.75 1124283 406612 212144_at UNC84B Standard -16.72 1109603 -100 239292_at Standard -16.71 1120509 155090 204000_at GNB5 Standard -16.65 1133538 1416 206760_s_at FCER2 Standard -16.64 1130735 179526 201009_s_at TXNIP Standard -16.59 1100150 9343 228248_at MGC39830 Standard -16.54 1124237 258855 212080_at MLL Standard -16.51 1124416 283604 212331_at RBL2 Standard -16.48 1133091 73792 205544_a_at CR2 Standard -16.46 1131263 249955 201877_s_at PPP2R5C Standard -16.44 1118347 528404 243366_s_at ITGA4 Standard -16.43 1529343 521948 Lymph_Dx_06 4_at Standard -16.43 1099549 446665 227533_at Standard 17.05 1529453 372679 Lymph_Dx_08 5_at FCGR3A Standard 17.41 1097540 388087 225195_at Standard 18.47 1140473 17377 221676_8_at GORO1C Standard 18.55 1121100 301921 205098_at CCR1 Standard 20.07 1124254 301743 292110_at SLC39A14 Standard 20.2 1130771 61153 201068_s_at PSMC2 Standard 21.46 1137583 273415 214687_x_at ALDOA Standard 21.55 1098168 22151 225943_at NLN Standard 24.07 1123055 185726 208691_at TFRC Standard 24.09 1123052 180909 208680_at PRDX1 Lymph Node -20.5 1137597 3903 214721_x_at CDC42EP4 Lymph Node -18.52 1124318 21858 212190_at SERPINE2 Lymph Node -18.5 1136762 380138 212624_at CHN1 Lymph Node -18.07 1101305 112742 229623_at Lymph Node -17,75 1100249 388674 228367_at HAK Lymph Node -16.1 1098412 409515 226225_at MCC Lymph Node -15.51 1140464 111676 221667_s_at HSPB8 Lymph Node -15.43 1136832 434959 212842_x_at RANBP2L1 Lymph Node -15.37 1119684 439586 202242_at TM4SF2 Lymph Node -15.02 1097448 250607 225093_at UTRN Lymph Node -14.83 1136844 16007 212875_s_at C21orf25 Lymph Node -14.73 1135056 169946 209604_s_at GATA3 Lymph Node -14.48 1097202 386779 224796_at DDEF1 Lymph Node -14.44 1121278 21355 205399_at DCAMKL1 Lymph Node -14.22 1125009 27621 213169_at Lymph Node -13.97 1100288 26981 228411_at ALS2CR19 Lymph Node -13.51 1132462 14845 204131_s_at FOXO3A Lymph Node -13.37 1135322 450230 210095_s_at IGFBP3 Lymph Node -13.35 1097280 423523 224891_at Lymph Node -12.86 1137097 20107 213656_s_at KNS2 Lymph Node -12.85 1098809 359394 226682_at Lymph Node -12.28 1124875 18166 212975_at KIAA0870 Lymph Node -12.18 1132345 109225 203868_s_at VCAM1 Lymph Node -12 1097561 19221 225224 at DKFZP566G142 4 Lymph Node -11.71 1123401 50130 209550_at NDN Lymph Node -11.04 1136996 283749 213397_x_at RNASE4 Lymph Node -10.77 1136788 355455 212698_s_at 36778 Lymph Node -10.71 1098822 443452 226695_at PRRX1 Lymph Node -10.63 1134200 90786 208161_s_at ABCC3 Lymph Node -10.47 1136427 276506 211795_s_at FYB Lymph Node -10.46 1121186 100431 205242_at CXCL13 Lymph Node -10.39 1099332 32433 227272_at Lymph Node -10.39 1098978 124863 226869_at Lymph Node -10.22 1103303 49605 232000_at C9orf52 Lymph Node -10.16 1131325 13313 201990_s_at CREBL2 Lymph Node -10.16 1098174 274401 225949_at LOC340371 Lymph Node -9.93 1124733 66762 212771_at LOC221061 Lymph Node -9.42 1123372 195825 209487_at RBPMS Lymph Node -9.36 1132220 448805 203632_s_at GPRC5B Lymph Node -9.29 1120703 83974 204368_at SLCO2A1 Lymph Node -9.26 1132013 434961 203232_s_at SCA1 Lymph Node -9.25 1097307 379754 224929_at LOC340061 Lymph Node -9.18 1119251 433941 201194_at SEPW1 Lymph Node -9.08 1097609 6093 225283_at ARRDC4 Lymph Node -9.07 1136459 252550 211828_s_at KIAA0551 Lymph Node -8.86 1132775 1027 204803_s_at RRAD Lymph Node -8.78 1098946 135121 226834_at ASAM Lymph Node -8.68 1140589 433488 221942_s_at GUCY1A3 Lymph Node -8.44 1116966 301124 232744_x_at Lymph Node -8.39 1100130 76494 228224_at PRELP Lymph Node -8.36 1110019 -94 239744_at Lymph Node -8.3 1134647 298654 208892_s_at DUSP6 Lymph Node -8.28 1125593 8910 214180_at MAN1C1 Lymph Node 7.97 1134370 1422 208438_s_at FGR Lymph Node 8.05 1123566 155935 209906_at C3AR1 Lymph Node 8.09 1131119 349656 201647_s_at SCARB2 Lymph Node 8.11 1123586 93841 209948_at KCNMB1 Lymph Node 8.13 1128615 104800 219410_at FLJ10134 Lymph Node 8.21 1097297 166254 224917_at VMP1 Lymph Node 8.23 1120299 79334 203574_at NFIL3 Lymph Node 8.37 1128157 23918 218631_at VIP32 Lymph Node 8.4 1130054 82547 221872_at RARRES1 Lymph Node 8.41 1098152 377588 225922_at KIAA1450 Lymph Node 8.53 1101566 98558 229947_at Lymph Node 8.59 1135251 21486 209969_s_at STAT1 Lymph Node 8.84 1099167 381105 227080_at MGC45731 Lymph Node 9.01 1132920 753 205119_s_at FPR1 Lymph Node 9.26 1097253 77873 224859_at B7H3 Lymph Node 9.29 1120500 82568 203979_at CYP27A1 Lymph Node 9.36 1131507 172928 202311_s_at COL1A1 Lymph Node 9.38 1096456 82407 223454_at CXCL16 Lymph Node 9.49 1136172 38084 211470_s_at SULT1C1 Lymph Node 10.03 1138244 418138 216442_x_at FN1 Lymph Node 10.34 1134424 -17 208540_x_at S100A14 Lymph Node 10.48 1136152 458436 211434_s_at CCRL2 Lymph Node 10.51 1118708 7835 37408_at MRC2 Lymph Node 10.6 1136540 179657 211924_s_at PLAUR Lymph Node 10.63 1098278 166017 226066_art MITF Lymph Node 10.76 1119477 163867 201743_at CD14 Lymph Node 10.81 1096429 64896 223405_at NPL Lymph Node 11.58 1123672 67846 210152_at LILRB4 Lymph Node 12 1096364 29444 223276_at NID67 Lymph Node 12.16 1119070 445570 200663_at CD63 Lymph Node 12.3 1133065 77274 205479_s_at PLAU Lymph Node 12.5 1135240 436852 209955_s_at FAP Lymph Node 13.09 1116826 26204 231823_s_at KIAA1295 Lymph Node 13.32 1119068 417004 200660_at S100A11 Lymph Node 13.45 1120266 246381 203507_at CD68 Lymph Node 13.63 1133216 502577 205872_x_at PDE4DIP Lymph Node 13.67 1131815 386678 202856_s_at SLC16A3 Lymph Node 14.38 1132132 279910 203454_s_at ATOX1 Lymph Node 15.25 1134682 411701 208949_s at LGALS3 Lymph Node 15.46 1119237 389964 201141_at GPNMB Lymph Node 15.89 1137698 442669 215001_s_at GLUL Lymph Node 17.8 1137782 384944 215223_s_at SOD2 Lymph Node 20.11 1130629 135226 200839_s_at CTSB Proliferation 21.02 1119375 381072 201489_at PPIF Proliferation 21.24 1119488 154672 201761_at MTHFD2 Proliferation 21.31 1119467 21635 201714_at TUBG1 Proliferation 21.68 1130820 151777 201144_s_at EIF2S1 Proliferation 21.69 1131474 95577 202246_s_at CDK4 Proliferation 22.2 1125249 244723 213523_at CCNE1 Proliferation 22.97 1130501 2795 200650_s_at LDHA Proliferation 23.12 1136913 99962 213113_s_at SLC43A3 Proliferation 24.05 1130426 432607 200039_s_at PSMB2 Standard Lymph Node Proliferation Mean FL -11121.51 -1603.39 1890.60 Cut 1 0.34 Mean DLBCL-BL -8760.65 -460.71 2101.10 Cut 2 0.94 Covariance FL 246359.77 111505.42 28908.20 111505.42 67036.17 13130.59 28908.20 13130.59 4617.24 Covariance DLBCL-BL 413069.12 178811.32 30151.89 178811.32 106324.53 10877.26 30151.89 10877.26 5180.68 Table 54: FL vs. MCL Signature Scale UNIQID Unigene ID Build 167 http://www.ncbi.nlm. nih.gov/UniGene Probe set Gene Symbol Standard -24.56 1123731 17165 210258_at RGS13 Standard -22.56 1133192 24024 205801_s_at RASGRP3 Standard -21.12 1114543 156189 244887_at Standard -18.49 1120090 155024 203140_at BCL6 Standard -18.07 1124646 436432 212646_at RAFTLIN Standard -17.24 1132122 307734 203434_s_at MME Standard -16.63 1105986 49614 235310_at GCET2 Standard -15.09 1120134 75545 203233_at IL4R Standard -14.05 1132651 439767 204529_s_at TOX Standard 13.8 1098277 6786 226065_at PRICKLE1 Standard 13.85 1109560 207428 239246_at FARP1 Standard 13.86 1103504 142517 232239_at Standard 13.88 1132734 126248 204724_s_at COL9A3 Standard 13.91 1115905 301478 225757_s_at CLMN Standard 14.89 1098840 55098 226713_at C3orf6 Standard 14.97 1100873 445884 229103_at Standard 14.99 1139393 170129 219032_x_at OPN3 Standard 16.13 1124864 411317 212960_at KIAA0882 Standard 16.36 1106855 455101 236255_at KIAA1909 Standard 16.43 1120858 410683 204647_at HOMER3 Standard 17.38 1130926 508741 201310_s_at C5orf13 Standard 18.3 1103711 288718 232478_at Standard 18.62 1109505 8162 239186_at MGC39372 Standard 20.31 1132834 432638 204914_s_at SOX11 Standard 22.61 1096070 241565 222640_at DNMT3A Standard 28.66 1529382 371468 Lymph_Dx_111 _at CCND1 Lymph Node -10.77 1097202 386779 224796_at DDEF1 Lymph Node -10.22 1119546 433898 201921_at GNG10 Lymph Node -9.89 1132766 82359 204781_s_at TNFRSF6 Lymph Node -9.4 1138867 10706 217892_s_at EPLIN Lymph Node 9.65 1125025 301094 213196_at Lymph Node 10.44 1134797 433394 209118_s_at TUBA3 Lymph Node 22.6 1529456 371468 Lymph_Dx_113 _at CCND1 Proliferation -7.36 1097948 69476 225684_at LOC348235 Proliferation -7.31 1130747 234489 201030_x_at LDHB Proliferation -6.95 1130923 459987 201306_s_at ANP32B Proliferation -6.87 1120205 5198 203405_at DSCR2 Proliferation -6.64 1132468 79353 204147_s_at TFDP1 Proliferation -6.1 1119916 177584 202780_at OXCT Proliferation -6.08 1119873 446393 202697_at CPSF5 Proliferation -6.08 1119488 154672 201761_at MTHFD2 Proliferation -6.04 1130658 447492 200886_s_at PGAM1 Proliferation -5.82 1132825 512813 204900_x_at SAP30 Proliferation -5.53 1115607 435733 224428_s_at CDCA7 Proliferation -5.44 1120316 63335 203611_at TERF2 Proliferation -5.34 1114970 279529 223032_x_at PX19 Proliferation -5.32 1140843 169476 AFFX- HUMGAPDH/M 33197_5_at GAPD Proliferation -5.28 1131081 180610 201586_s_at SFPQ Proliferation -5.15 1121062 408658 205034_at CCNE2 Proliferation 5.15 1120986 172052 204886_at PLK4 Proliferation 5.16 1097195 149931 224785_at MGC29814 Proliferation 5.2 1120011 3068 202983_at SMARCA3 Proliferation 5.47 1100183 180582 228286_at FLJ40869 Proliferation 5.67 1121012 96055 204947_at E2F1 Proliferation 5.84 1115679 8345 224523_s_at MGC4308 Proliferation 5.88 1135285 449501 210024_s_at UBE2E3 Proliferation 5.92 1120520 35120 204023_at RFC4 Proliferation 6.16 1529361 388681 Lymph_Dx_086 _s_at HDAC3 Proliferation 6.45 1096054 21331 222606_at FLJ10036 Proliferation 6.45 1096738 87968 223903_at TLR9 Proliferation 6.51 1136781 120197 212680_x_at PPP1R14B Proliferation 6.63 1119466 179718 201710_at MYBL2 Proliferation 6.65 1136285 182490 211615_s_at LRPPRC Proliferation 6.67 1136853 66170 212922_s_at SMYD2 Proliferation 7.45 1119390 77254 201518_at CBX1 Proliferation 8.87 1116122 42768 227408_s_at DKFZp761O01 13 Proliferation 10.12 1119515 3352 201833_at HDAC2 Standard Lymph Node Proliferation Mean FL -18.82 -33.90 23.53 Cut 1 0.14 Mean MCL 1558.10 113.95 165.48 Cut 2 0.58 Covariance FL 21302.14 1098.24 678.04 1098.24 226.29 75.99 678.04 75.99 315.67 Covariance MCL 81008.29 5261.37 9185.20 5261.37 2047.34 875.56 9185.20 875.56 1447.43 Table 55: FL vs. SLL Signature Scale UNIQID Unigene ID Build 167 http://www.ncbi.nlm. nih.gov/UniGene Probe set Gene Symbol Standard -21.04 1123731 17165 210258_at RGS13 Standard, -20.91 1124646 436432 212646_at RAFTLIN Standard -18.82 1099651 120785 227646_at EBF Standard -18.12 1114543 156189 244887_at Standard -17.85 1105986 49614 235310_at GCET2 Standard -16.73 1100911 320147 229152_at C4orf7 Standard -15.77 1132122 307734 203434_s_at MME Standard -15.12 1120090 155024 203140_at BCL6 Standard -14.89 1097897 266175 225622_at PAG Standard -14.36 1529343 521948 Lymph_Dx_06 4_at Standard -14.32 1529318 291954 Lymph_Dx_03 8_at Standard -14.06 1128694 171466 219517_at ELL3 Standard -13.61 1101586 187884 229971_at GPR114 Standard -13.57 1119752 511745 202391_at BASP1 Standard -13.13 1137561 67397 214639_s_at HOXA1 Standard -12.85 1097247 388761 224851_at CDK6 Standard -12.43 1529344 317970 Lymph_Dx_06 5_at SERPINA11 Standard -12.4 1120765 343329 204484_at PIK3C2B Standard -12.33 1130155 436657 222043_at CLU Standard -12.07 1529292 -92 Lymph_Dx_01 0_at Standard -12.01 1119939 170087 202820_at AHR Standard -11.82 1119919 199263 202786_at STK39 Standard -11.77 1099686 117721 227684_at Standard -11.63 1119782 155418 202478_at TRB2 Standard 10.97 1529309 512797 Lymph_Dx_02 8_at HSH2 Standard 10.97 1139393 170129 219032_x_at OPN3 Standard 11.04 1131246 153752 201853_s_at CDC25B Standard 11.07 1140391 44865 221558_s_at LEF1 Standard 11.16 1140416 58831 221601_s_at TOSO Standard 11.35 1127807 7236 217950_at NOSIP Standard 11.67 1529317 -98 Lymph_Dx_03 7_at Standard 11.81 1117343 306812 234643_x_at BUCS1 Standard 11.82 1102081 506977 230551_at Standard 11.82 1135042 79015 209582_s_at MOX2 Standard 11.96 1132734 126248 204724_s_at COL9A3 Standard 12.09 1137109 469653 213689_x_at RPL5 Standard 12.14 1099939 488173 227983_at MGC7036 Standard 12.19 1129103 99430 220118_at TZFP Standard 12.47 1135592 758 210621_s_at RASA1 Standard 12.78 1108970 140489 238604_at Standard 12.92 1097143 74335 224716_at HSPCB Standard 13.18 1136865 412128 212959_s_at MGC4170 Standard 13.96 1098220 80720 226002_at GAB1 Standard 14.06 1100847 97411 229070_at C6orf105 Standard 14.39 1098865 250905 226741_at LOC51234 Standard 15.57 1136687 59943 212345_s_at CREB3L2 Standard 15.75 1107044 163426 236458_at Standard 16.52 1123622 8578 210051_at EPAC Standard 17.74 1136987 21695 213370_s_at SFMBT1 Standard 19.15 1129026 135146 220007_at FLJ13984 Standard 19.65 1131854 414985 202923_s_at GCLC Lymph Node -14.99 1124875 18166 212975_at KIAA0870 Lymph Node -14.33 1099358 93135 227300_at Lymph Node -13.26 1121129 285401 205159_at CSF2RB Lymph Node -12.61 1119074 54457 200675_at CD81 Lymph Node -12.52 1121029 412999 204971_at CSTA Lymph Node -11.48 1137247 234734 213975_s_at LYZ Lymph Node -10.97 1128781 79741 219648_at FLJ10116 Lymph Node 11.79 1119880 442844 202709_at FMOD Lymph Node 14.4 1134370 1422 208438_s_at FGR Standard Lymph Node Mean FL -663.95 -730.08 Cut 1 0.20 Mean SLL 1332.84 -484.93 Cut 2 0.80 Covariance FL 37097.15 1710.73 1710.73 663.78 Covariance SLL 85989.25 17661.52 17661.52 4555.06 Table 56: GCB vs, PMBL Signature Scale UNIQID Unigene ID Build 167 http://www.ncbi.nlm. nih.gov/UniGene Probe set Gene Symbol Standard -8.39 1096440 231320 223423_at GPR160 Standard -8.13 1096108 292871 222731_at ZDHHC2 Standard -8.12 1125231 446375 213489_at MAPRE2 Standard -8.02 1136759 188882 212605_s_at Standard -7.91 1096499 293867 223514_at CARD11 Standard -7.8 1099388 124024 227336_at DTX1 Standard -7.71 1139623 193736 219667_s_at BANK1 Standard -7.68 1098592 283707 226431_at ALS2CR13 Standard -7.67 1107575 424589 237033_at MGC52498 Standard -7.63 1116829 115467 231840_x_at LOC90624 Standard -7.42 1130114 445084 221965_at MPHOSPH9 Standard -7.27 1098909 446408 226789_at Standard 7.34 1138759 396404 217707_x_at SMARCA2 Standard 7.37 1120355 80420 203687_at CX3CL1 Standard 7.4 1134270 352119 208284_x_at GGT1 Standard 7.44 1115441 5470 224156_x_at IL17RB Standard 7.78 1103054 341531 231690_at Standard 7.91 1119765 81234 202421_at IGSF3 Standard 7.92 1119438 118110 201641_at BST2 Standard 8.09 1135645 31439 210715_s_at SPINT2 Standard 8.15 1106015 96885 235343_at FLJ12505 Standard 8.18 1121400 223474 205599_at TRAF1 Standard 8.38 1139950 437385 220731_s_at FLJ10420 Standard 8.73 1122112 1314 206729_at TNFRSF8 Standard 8.77 1122772 66742 207900_at CCL17 Standard 8.84 1132762 80395 204777_s_at MAL Standard 9.64 1139174 15827 220140_s_at SNX11 Standard 10.53 1133801 181097 207426_s_at TNFSF4 Standard 11.52 1106415 169071 235774_at Standard 12.09 1129269 62919 220358_at SNFT Standard Mean GCB 292.76 Cut 10.16 Mean PMBL 725.28 Cut 20.50 Covariance GCB 8538.86 Covariance PMBL 11405.23 Table 57: MCL vs. DLBCL-BL Signature Scale UNIQID Unigene ID Build 167 http://www.ncbi.nlm. nih.gov/UniGene Probe set Gene Symbol Standard -26.11 1529382 371468 Lymph_Dx_111_at CCND1 Standard -18.35 1103711 288718 232478_at Standard -17.03 1106855 455101 236255_at KIAA1909 Standard -16.49 1098840 55098 226713_at C3orf6 Standard -15.41 1109505 8162 239186_at MGC39372 Standard -15.11 1098954 128905 226844_at MOBKL2B Standard -14.96 1103504 142517 232239_at Standard -14.74 1096070 241565 222640_at DNMT3A Standard -13.81 1137663 247362 214909_s_at DDAH2 Standard -13.8 1124864 411317 212960_at KIAA0882 Standard -13.62 1140127 125300 221044_s_at TRIM34 Standard -13.62 1119361 391858 201448_at TIA1 Standard -13.37 1127849 76691 218032_at SNN Standard 13.72 1133192 24024 205801_s_at RASGRP3 Standard 13.85 1137583 273415 214687_x_at ALDOA Standard 15.02 1123052 180909 208680_at PRDX1 Standard 16.21 1097611 438993 225285_at BCAT1 Lymph Node -19.18 1529456 371468 Lymph_Dx_113_at CCND1 Lymph Node -10.71 1098978 124863 226869_at Lymph Node -9.17 1097448 250607 225093_at UTRN Lymph Node 8.84 1135240 436852 209955_s_at FAP Lymph Node 9.11 1119475 296323 201739_at SGK Lymph Node 9.22 1119237 389964 201141_at GPNMB Lymph Node 9.46 1130629 135226 200839_s_at CTSB Lymph Node 10.1 1130054 82547 221872_at RARRES1 Standard Lymph Node Mean MCL -1417.55 -25.58 Cut 10.50 Mean DLBCL-BL -756.07 202.29 Cut 20.88 Covariance MCL 15347.98 3525.48 3525.48 5420.31 Covariance DLBCL-BL 5132.06 1007.64 1007.64 991.38 Table 58: MCL vs. SLL Signature Scale UNIQID Unigene ID Build 167 http://www.ncbi.nlm. nih.gov/UniGene Probe set Gene Symbol Standard -20.18 1132834 432638 204914_s_at SOX11 Standard -15.17 1130926 508741 201310_s_at C5orf13 Standard 13.44 1116150 16229 227606_s_at AMSH-LP Standard 14.44 1120134 75545 203233_at IL4R Standard 15.18 1529437 445162 Lymph_Dx_17 5_at BTLA Standard 15.19 1529317 -98 Lymph_Dx_03 7_at Standard 16.2 1135042 79015 209582_s_at MOX2 Standard Mean MCL 181.38 Cut 10.20 Mean SLL 564.92 Cut 20.80 Covariance MCL 1734.42 Covariance SLL 910.75 Table 59: SLL vs. DLBCL-BL Signature Scale UNIQID Unigene ID Build 167 http://www.ncbi.nlm. nih.gov/UniGene Probe set Gene Symbol Standard -16.014498 1123622 8578 210051_at EPAC Standard -15.26356533 1102081 506977 230551_at Standard -14.82150028 1107044 163426 236458_at Standard -14.17813266 1098865 250905 226741_at LOC51234 Standard -12.92844719 1110740 416810 240538_at Standard -12.86520757 1129026 135146 220007_at FLJ13984 Standard -12.2702748 1135592 758 210621_s_at RASA1 Standard -11.87309449 1117343 306812 234643_x_at BUCS1 Standard -11.81789137 1136987 21695 213370_s_at SFMBT1 Standard -11.78631706 1124830 9059 212911_at KIAA0962 Standard -11.39454435 1133538 1416 206760_s_at FCER2 Standard -11.39050362 1135802 439343 210944_s_at CAPN3' Standard 11.72928644 1120770 300825 204493_at BID Lymph Node -12.21593247 1119880 442844 202709_at FMOD Lymph Node 9.514704847 1135240 436852 209955_s_at FAP Lymph Node 9.739298877 1096429 64896 223405_at NPL Lymph Node 10.05087645 1119475 296323 201739_at SGK Lymph Node 13.11985922 1119237 389964 201141_at GPNMB Proliferation 10.47525875 1128106 14559 218542_at C10orf3 Proliferation 10.53295782 1132825 512813 204900_x_at SAP30 Proliferation 11.93918891 1130501 2795 200650_s_at LDHA Proliferation 11.98738778 1123439 287472 209642_at BUB1 Proliferation 11.99741644 1115607 435733 224428_s_at CDCA7 Standard Lymph Node Proliferation Mean SLL -1383.640809 177.4452398 467.2463569 Cut 10.201266305 Mean DLBCL-BL -926.7275468 329.6795845 582.9070266 Cut 20.799816116 Covariance SLL 3591.384775 1789.7516 856.0703202 1789.7516 1421.869535 663.4782048 856.0703202 663.4782048 965.6470151 Covariance DLBCL-BL 2922.643347 473.543487 634.3258773 473.543487 931.9845277 -53.85584619 634.3258773 -53.85584619 767.3545404 - As stated above, the foregoing is merely intended to illustrate various embodiments of the present invention. The specific modifications discussed above are not to be construed as limitations on the scope of the invention. It will be apparent to one skilled in the art that various equivalents, changes, and modifications may be made without departing from the scope of the invention, and it is understood that such equivalent embodiments are to be included herein. All references cited herein are incorporated by reference as if fully set forth herein.
- Abbreviations used herein: ABC, activated B-cell-like diffuse large B cell lymphoma; BL, Burkitt lymphoma; CHOP, cyclophosphamide, doxorubicine, vincristine, and prednisone; Cl, confidence interval; CNS, central nervous system; DLBCL, diffuse large B-cell lymphoma; ECOG, Eastern Cooperative Oncology Group; EST, expressed sequence tag; FACS, fluorescence-activated cell sorting; FH, follicular hyperplasia; FL, follicular lymphoma; GCB, germinal center B-cell-like diffuse large B cell lymphoma; IPI, International Prognostic Index; LPC, lymphoplasmacytic lymphoma; LPS, linear predictor score; MALT, mucosa-associated lymphoid tissue lymphomas; MCL, mantle cell lymphoma; MHC, major histocompatibility complex; NA, not available; NK, natural killer; NMZ, nodal marginal zone lymphoma; PCR, polymerase chain reaction; PMBL, primary mediastinal B-cell lymphoma; PTLD, post-transplant lymphoproliferative disorder; REAL, Revised European-American Lymphoma; RPA, RNase protection assay; RR, relative risk of death; RT-PCR, reverse transcriptase polymerase chain reaction; SAGE, serial analysis of gene expression; SLL, small lymphocytic lymphoma; WHO, World Health Organization.
Table 2 UNIQID Probe Set Unigene ID Build 167 (http://www.ncbi. nlm.nih.gov/UhiG ene) Gene Symbol 1119003 200004 at 183684 EIF4G2 1119007 200009 at 56845 GDI2 1119015 200024_at 378103 RPS5 1130426 200039_s_at 432607 PSMB2 1130429 200048_s_at 6396 JTB 1130430 200052 s at 75117 ILF2 1130433 200058 s_at 246112 U5-200KD 1130446 200076_s_at 369785 MGC2749 1130447 200077_s_at 446427 OAZ1 1119039 200084_at 447513 SMAP 1130465 200098_s_at 7101 ANAPC5 1130468 200594_x_at 166463 HNRPU 1130472 200599_s_at 192374 TRA1 1119046 200606_at 349499 DSP 1130482 200616_s_at 181418 KIAA0152 1130483 200622_x_at 334330 CALM3 1119056 200633_at 356190 UBB 1119061 200644_at 75061 MLP 1130501 200650_s_at 2795 LDHA 1119068 200660_at 417004 S100A11 1119070 200663_at 445570 CD63 1130509 200665_s_at 111779 SPARC 1119071 200667_at 411826 UBE2D3 1119072 200670_at 437638 XBP1 1119074 200675_at 54457 CD81 1130518 200679_x_at 434102 HMGB1 1119076 200681_at 268849 GLO1 1130527 200692_s_at 184233 HSPA9B 1130533 200706_s_at 76507 LITAF 1119090 200709_at 374638 FKBP1A 1130588 200775_s_at 307544 HNRPK 1130603 200797_s_at 86386 MCL1 1119111 200804_at 35052 TEGT 1130618 200822 x_at 83848 GRCC9 1130622 200829_x_at 97128 ZNF207 1130624 200832_s_at 119597 SCD 1130629 200839_s_at 135226 CTSB 1130631 200842_s_at 171292 EPRS 1130645 200860_s_at 279949 KIAA1007 1130653 200875_s_at 376064 NOL5A 1119139 200880_at 388392 DNAJA1 1130658 200886_s_at 447492 PGAM1 1130668 200897_s_at 194431 KIAA0992 1130674 200905_x_at 381008 HLA-E 1130676 200907_s_at 194431 KIAA0992 1130680 200912_s_at 511904 EIF4A2 1130687 200924_s_at 79748 SLC3A2 1119155 200934_at 110713 DEK 1130704 200951_s_at 376071 CCND2 1130707 200956_s_at 79162 SSRP1 1130712 200965_s_at 442540 ABUM1 1119171 200974_at 208641 ACTA2 1119173 200978_at 75375 MDH1 1119183 200997_at 211203 RBM4 1130732 201002_s_at 381025 UBE2V1 1119186 201005_at 387579 CD9 1130735 201009_s_at 179526 TXNIP 1130744 201027_s_at 158688 EIF5B 1130746 201029_s_at 283477 CD99 1130747 201030 x_at 234489 LDHB 1119202 201042_at 512708 TGM2 1130755 201043_s_at 356089 ANP32A 1119209 201063_at 167791 RCN1 1130771 201068_s_at 61153 PSMC2 1119212 201069_at 367877 MMP2 1130799 201114_x_at 233952 PSMA7 1130812 201131 s_at 194657 CDH1 1119237 201141_at 389964 GPNMB 1130820 201144 s at 151777 EIF2S1 1119239 201145_at 199625 HAX1 1130835 201163_s_at 435795 IGFBP7 1130839 201167_x_at 159161 ARHGDIA 1119243 201171_at 440165 ATP6V0E 1119245 201178_at 5912 FBXO7 1130852 201184_s_at 74441 CHD4 1130855 201189_s_at 77515 ITPR3 1119251 201194_at 433941 SEPW1 1119258 201209_at 88556 HDAC1 1119260 201212_at 18069 LGMN 1119263 201216_at 511762 C12orf8 1130871 201222_s_at 159087 RAD23B 1130879 201231_s_at 433455 ENO1 1119268 201234_at 6196 ILK 1130882 201236_s_at 75462 BTG2 1130888 201244_s_at 257266 RAF1 1130898 201260_s_at 80919 SYPL 1130900 201262_s_at 821 BGN 1130906 201277_s_at 81361 HNRPAB 1130910 201284_s_at 221589 APEH 1130911 201287_s_at 82109 SDC1 1119294 201292_at 156346 TOP2A 1130914 201294_s_at 315379 WSB1 1130922 201305_x_at 459987 ANP32B 1130923 201306_s_at 459987 ANP32B 1130926 201310_s_at 508741 C5orf13 1119300 201314_at 155206 STK25 1130936 201331_s_at 437475 STAT6 1130942 201338_x_at 445977 GTF3A 1119311 201341_at 104925 ENC1 1119317 201349_at 396783 SLC9A3R1 1119325 201365_at 74563 OAZ2 1119334 201389 at 149609 ITGA5 1130972 201393_s_at 76473 IGF2R 1130977 201401_s_at 83636 ADRBK1 1119350 201425_at 331141 ALDH2 1130994 201431_s_at 150358 DPYSL3 1119361 201448_at 391858 TIA1 1119365 201460_at 75074 MAPKAPK2 1131012 201464_x_at 78465 JUN 1119369 201473_at 25292 JUNB 1131019 201474_s_at 265829 ITGA3 1119375 201489_at 381072 PPIF 1131038 201502_s_at 81328 NFKBIA 1119383 201508 at 1516 IGFBP4 1119390 201518 at 77254 CBX1 1119400 201536_at 181046 DUSP3 1119401 201540 at 421383 FHL1 1131068 201564_s at 118400 FSCN1 1131069 201565_s_at 180919 ID2 1131074 201572_x_at 76894 DCTD 1119417 201579_at 166994 FAT 1131081 201586_s_at 180610 SFPQ 1131082 201587_s_at 182018 IRAK1 1119424 201599_at 75485 OAT 1131107 201628_s_at 432330 RRAGA 1131110 201631_s_at 76095 IER3 1119438 201641_at 118110 BST2 1131119 201647_s_at 349656 SCARB2 1119443 201648_at 436004 JAK1 1119445 201650 at 309517 KRT19 1119448 201656_at 212296 ITGA6 1131140 201684_s_at 194035 C14orf92 1131149 201694_s_at 326035 EGR1 1131150 201695_s_at 75514 NP 1119460 201696_at 76122 SFRS4 1119462 201700_at 83173 CCND3 1119466 201710_at 179718 MYBL2 1119467 201714_at 21635 TUBG1 1119475 201739_at 296323 SGK 1119477 201743_at 163867 CD14 1131181 201744_s_at 406475 LUM 1119479 201746_at 408312 TP53 1119488 201761_at 154672 MTHFD2 1131197 201778_s_at 269902 KIAA0494 11119503 201803_at 149353 POLR2B 1131218 201809_s_at 76753 ENG 1131219 201810_s_at 109150 SH3BP5 1119510 201820 at 433845 KRT5 1119515 201833_at 3352 HDAC2 1119516 201834_at 6061 PRKAB1 1119519 201849_at 79428 BNIP3 1131246 201853 _s_at 153752 CDC25B 1131260 201872_s_at 12013 ABCE1 1131263 201877_s_at 249955 PPP2R5C 1119533 201886_at 283976 WDR23 1131268 201888_s_at 285115 IL13RA1 1119537 201895_at 446641 TIMP1 1131274 201897_s_at 374378 CKS1B 1119541 201910_at 207428 FARP1 1119546 201921_at 433898 GNG10 1131290 201925_s_at 408864 DAF 1119557 201939_at 398157 PLK2 1119559 201941_at 5057 CPD 1119561 201945_at 59242 FURIN 1119564 201952_at 10247 ALCAM 1199565 201953_at 135471 CIB1 1119566 201954_at 433506 ARPC1B 1119568 201957 at 269777 PPP1R12B 1131321 201983_s_at 77432 EGFR 1131325 201990_s_at 13313 CREBL2 1119582 201998_at 2554 SIAT1 1131336 202010_s_at 405945 ZNF410 1131340 202018_s_at 437457 LTF 1131342 202020_s_at 13351 LANCL1 1131379 202075_s_at 439312 PLTP 1119611 202076_at 289107 BIRC2 1131395 202102_s_at 278675 BRD4 1131401 202119_s_at 14158 CPNE3 1131405 202123 _s_at 446504 ABL1 1131407 202125_s_at 154248 ALS2CR3 1119633 202126_at 198891 PRPF4B 1119636 202130_at 209061 RIOK3 1131411 202135_s_at 2477 ACTR1B 1119639 202136_at 145894 BS69 1131414 202140_s_at 511790 CLK3 1119647 202161_at 2499 PRKCL1 1119652 202175_at 458374 CHPF 1119655 202178_at 407181 1131450 202200_s_at 369358 SRPK1 1119667 202206_at 111554 ARL7 1119680 202237_at 364345 NNMT 1119683 202241_at 444947 C8FW 1119684 202242_at 439586 TM4SF2 1131473 202243_s_at 89545 PSMB4 1131474 202246_s_at 95577 CDK4 1119694 202265_at 380403 COMMD3 1119699 202273_at 307783 PDGFRB 1119706 202281_at 153227 GAK 1119708 202283_at 173594 SERPINF1 1131490 202284_s_at 370771 CDKN1A 1119709 202288_at 338207 FRAP1 1131497 202295_s_at 114931 CTSH 1131503 202303_x_at 135705 SMARCA5 1131507 202311_s_at 172928 COL1A1 1119725 202329_at 77793 CSK 1119729 202338_at 164457 TK1 1131531 202350_s_at 153647 MATN2 1119734 202351_at 436873 ITGAV 1131541 202369_s_at 310230 TRAM2 1119752 202391_at 511745 BASP1 1131561 202403_s_at 232115 COL1A2 1119765 202421_at 81234 IGSF3 1119766 202423_at 93231 MYST3 1131578 202431_s_at 202453 MYC 1131584 202439_s_at 303154 IDS 1131592 202450_s_at 83942 CTSK 1131594 202454_s_at 306251 ERBB3 1119775 202455_at 9028 HDAC5 1119780 202472_at 75694 MPI 1119782 202478_at 155418 TRB2 1131614 202483_s_at 24763 RANBP1 1119799 202518 at 408219 BCL7B 1119802 202522_at 7370 PITPNB 1131636 202524_s_at 436193 SPOCK2 1131637 202527 s_at 75862 MADH4 1119807 202530 at 79107 MAPK14 1119808 202531_at 80645 IRF1 1131640 202534_x_at 83765 DHFR 1131645 202542_s_at 105656 SCYE1 1119813 202545_at 155342 PRKCD 1131654 202555_s_at 386078 MYLK 1119817 202561_at 409194 TNKS 1131663 202568_s_at 437625 MARK3 1119820 202573_at 181390 CSNK1G2 1119826 202589_at 87491 TYMS 1131687 202606_s_at 369280 TLK1 1119838 202615_at 469951 GNAQ 1119841 202625_at 80887 LYN 1119846 202634_at 351475 POLR2K 1131705 202638_s_at 386467 ICAM1 1131710 202644_s_at 211600 TNFAIP3 1119860 202670_at 132311 MAP2K1 1131733 202686_s_at 83341 AXL 1119868 202688_at 387871 TNFSF10 1131737 202693_s_at 9075 STK17A 1119872 202696_at 95220 OSR1 1119873 202697_at 446393 CPSF5 1119876 202703_at 14611 DUSP11 1119878 202705_at 194698 CCNB2 1119880 202709_at 442844 FMOD 1119884 202716_at 418004 PTPN1 1131752 202724_s_at 170133 FOXO1A 1131753 202727_s_at 180866 IFNGR1 1131755 202729_s_at 241257 LTBP1 1119889 202731_at 257697 PDCD4 1131757 202736_s_at 76719 LSM4 1119894 202740_at 334707 ACY1 1119895 202741 at 156324 PRKACB 1119903 202753_at 350939 p44S10 1131767 202758_s_at 296776 RFXANK 1119906 202762_at 58617 ROCK2 1119907 202763_at 141125 CASP3 1131778 202779_s_at 396393 UBE2S 1119916 202780_at 177584 OXCT 1119919 202786_at 199263 STK39 1119920 202788_at 234521 MAPKAPK3 1119924 202794_at 32309 INPP1 1119928 202799_at 317335 CLPP 1131786 202803_s_at 375957 ITGB2 1119936 202811_at 407994 STAMBP 1119939 202820_at 170087 AHR 1119946 202834_at 19383 AGT 1119950 202840_at 402752 TAF15 1131806 202842_s_at 6790 DNAJB9 1131808 202845_s_at 75447 RALBP1 1131813 202853 s_at 285346 RYK 1131815 202856_s_at 386678 SLC16A3 1131816 202859_x_at 624 IL8 1131827 202880_s_at 1050 PSCD1 1131835 202888 s_at 1239 ANPEP 1119972 202894_at 437008 EPHB4 1131839 202899_s_at 405144 SFRS3 1131845 202906_s_at 25812 NBS1 1131847 202910_s_at 3107 CD97 1119979 202911_at 445052 MSH6 1119983 202920_at 409783 ANK2 1131854 202923_s_at 414985 GCLC 1131861 202933_s_at 194148 YES1 1131863 202936_s_at 2316 SOX9 1131868 202947_s_at 81994 GYPC 1119995 202948_at 82112 IL1R1 1119997 202951_at 367811 STK38 1131870 202952 s_at 8850 ADAM12 1119998 202953_at 8986 CIQB 1131875 202965_s_at 169172 CAPN6 1120008 202989_at 173135 DYRK2 1120011 202983 at 3068 SMARCA3 1120016 202991_at 77628 STARD3 1120023 203005_at 1116 LTBR 1120024 203006 at 408063 INPP5A 1120026 203010_at 437058 STAT5A 1131916 203035_s_at 435761 PIAS3 1131918 203037_s_at 77694 MTSS1 1120038 203044_at 110488 CHSY1 1120044 203053_at 22960 BCAS2 1131925 203054 s_at 250894 TCTA 1120053 203073_at 82399 COG2 1120055 203075_at 110741 MADH2 1120059 203083_at 458354 THBS2 1131940 203085 s_at 1103 TGFB1 1120063 203090_at 118684 SDF2 1120069 203104_at 174142 CSF1R 1120072 203110_at 405474 PTK2B 1131955 203112 s_at 21771 WHSC2 1120079 203126_at 5753 IMPA2 1131964 203130_s_at 6641 KIF5C 1120081 203131_at 74615 PDGFRA 1120082 203132_at 408528 RB1 1120088 203138_at 13340 HAT1 1120089 203139_at 244318 DAPK1 1120090 203140_at 155024 BCL6 1131972 203154_s_at 20447 PAK4 1131975 203160_s_at 24439 RNF8 1120108 203175_at 75082 ARHG 1120120 203196_at 307915 ABCC4 1120121 203198_at 150423 CDK9 1131998 203210_s_at 443227 RFC5 1120127 203213_at 334562 CDC2 1132004 203217_s_at 415117 SIAT9 1120128 203218 at 348446 MAPK9 1120129 203221_at 406491 TLE1 1132011 203229_s_at 73986 CLK2 1132013 203232_s_at 434961 SCA1 1120134 203233_at 75545 IL4R 1132016 203238_s_at 8546 NOTCH3 1120137 203240_at 111732 FCGBP 1132022 203247_s_at 173911 ZNF24 1120145 203256_at 191842 CDH3 1132031 203266_s_at 134106 MAP2K4 1132034 203271_s_at 410455 UNC119 1132035 203272_s_at 8186 TUSC2 1120152 203275_at 83795 IRF2 1120153 203276_at 89497 LMNB1 1120160 203288_at 436976 KIAA0355 1120163 203302_at 709 DCK 1132058 203313_s_at 161999 TGIF 1120191 203373_at 405946 SOCS2 1120194 203379_at 149957 RPS6KA1 1120196 203386_at 173802 TBC1D4 1132104 203387_s_at 173802 TBC1D4 1120205 203405_at 5198 DSCR2 1120214 203416_at 443057 CD53 1120216 203418_at 85137 CCNA2 1132122 203434_s_at 307734 MME 1132132 203454_s_at 279910 ATOX1 1120254 203485_at 99947 RTN1 1120261 203499_at 171596 EPHA2 1120266 203507_at 246381 CD68 1120267 203508_at 256278 TNFRSF1B 1120269 203510_at 419124 MET 1120272 203514_at 29282 MAP3K3 1120274 203517_at 31584 MTX2 1132159 203521 s_at 147868 ZNF318 1120278 203528_at 511748 SEMA4D 1120288 203547_at 17483 CD4 1120289 203552_at 246970 MAP4KS 1132178 203554_x_at 350966 PTTG1 1120299 203574_at 79334 NFIL3 1120300 203575_at 82201 CSNK2A2 1132196 203591_s_at 381027 CSF3R 1120316 203611_at 63335 TERF2 1120317 203612_at 106880 BYSL 1120324 203627_at 239176 IGF1R 1132220 203632_s_at 448805 GPRC5B 1132223 203638_s_at 404081 FGFR2 1132230 203649_s_at 76422 PLA2G2A 1120335 203652_at 432787 MAP3K11 1132236 203661_s at 374849 TMOD1 1120350 203679_at 446686 IL1RL1LG 1120353 203685_at 79241 BCL2 1120355 203687_at 80420 CX3CL1 1120356 203688_at 458291 PKD2 1120359 203697_at 128453 FRZB 1132256 203702_s_at 169910 KIAA0173 1132260 203706_s_at 173859 FZD7 1120361 203708_at 188 PDE4B 1120362 203709_at 196177 PHKG2 1120366 203717_at 44926 DPP4 1120370 203723_at 78877 ITPKB 1120373 203728_at 93213 BAK1 1120378 203738_at 151046 FLJ11193 1120385 203755_at 36708 BUB1B 1120387 203758_at 75262 CTSO 1120389 203761_at 75367 SLA 1132288 20376_s_at 79876 STS 1132292 203771_s_at 435726 BLVRA 1132294 203777_s_at 32156 RPS6KB2 1120400 203787 at 152207 SSBP2 1120402 203794_at 18586 CDC42BPA 1132306 203795_s_at 371758 BCL7A 1120417 203827_at 9398 FLJ10055 1120419 203830_at 9800 NJMU-R1 1120422 203835_at 151641 GARP 1120423 203837_at 151988 MAP3K5 1132329 203839_s_at 528296 ACK1 1120425 203843_at 188361 RPS6KA3 1132336 203853_s_at 30687 GAB2 1120433 203856_at 422662 VRK1 1132345 203868_s_at 109225 VCAM1 1120438 203870_at 109268 USP46 1132349 203881_s_at 169470 DMD 1132353 203887_s_at 2030 THBD 1132354 203890_s_at 153908 DAPK3 1120465 203915_at 77367 CXCL9 1120477 203934_at 12337 KDR 1120478 203935 at 150402 ACVR1 1132375 203942_s_at 157199 MARK2 1132376 203944_x_at 169963 BTN2A1 1120483 203947 at 180034 CSTF3 1120484 203949_at 458272 MPO 1120494 203967_at 405958 CDC6 1120500 203979_at 82568 CYP27A1 1132396 203988_s_at 118722 FUT8 1120509 204000_at 155090 GNB5 1132407 204005_s_at 406074 PAWR 1120520 204023_at 35120 RFC4 1120524 204033_at 436187 TRIP13 1120529 204039_at 76171 CEBPA 1132426 204049_s_at 102471 C6orf56 1132428 204051_s_at 105700 SFRP4 1120538 204057 at 14453 ICSBP1 1132433 204059_s_at 14732 ME1 1132434 204060_s_at 147996 PRKX 1132435 204062_s_at 168762 ULK2 1120544 204068_at 166684 STK3 1120553 204086_at 30743 PRAM 1120555 204090_at 444 STK19 1132449 204092_s_at 250822 STK6 1120562 204103_at 75703 CCL4 1120564 204106_at 79358 TESK1 1120572 204116_at 84 IL2RG 1120574 204118_at 901 CD48 1132460 204126_s_at 114311 CDC45L 1120580 204127_at 115474 RFC3 1120581 204129_at 415209 BCL9 1132462 204131_s_at 14845 FOXO3A 1120583 204133_at 153768 RNU3IP2 1120588 204140_at 421194 TPST1 1132468 204147_s_at 79353 TFDP1 1120593 204150_at 301989 STAB1 1120594 204154_at 442378 CDO1 1120595 204156_at 444909 KIAA0999 1120596 204159_at 4854 CDKN2C 1120601 204166_at 441129 KIAA0963 1132479 204170_s_at 83758 CKS2 1120605 204171_at 86858 RPS6KB1 1132485 204183_s_at 445563 ADRBK2 1120615 204191_at 181315 IFNAR1 1120616 204192_at 166556 CD37 1120617 204193_at 439777 CPT1B 1120625 204208_at 27345 RNGTT 1132498 204211_x_at 439523 PRKR 1120630 204218_at 38044 DKFZP564M 082 1132504 204222_s_at 511765 GUPR1 1120633 204225_at 222874 HDAC4 1120637 204232_at 433300 FCER1G 1132519 204247_s_at 166071 CDK5 1132520 204249_s_at 283063 LMO2 1120643 204252_at 19192 CDK2 1132525 204255_s_at 2062 VDR 1120645 204257_at 21765 FADS3 1132529 204265_s_at 288316 GPSM3 1132531 204267_x_at 77783 PKMYT1 1120651 204269_at 80205 PIM2 1132536 204285_s_at 96 PMAIP1 1120673 204301_at 5333 KIAA0711 1132545 204306_s_at 512857 CD151 1132547 204310 s_at 78518 NPR2 1120695 204352_at 385685 TRAF5 1120697 204355_at 323462 DHX30 1132572 204357_s_at 36566 LIMK1 1120700 204362_at 410745 SCAP2 1120703 204368_at 83974 SLCO2A1 1132584 204379_s_at 1420 FGFR3 1120716 204392_at 512804 CAMK1 1120717 204394_at 444159 SLC43A1 1132592 204396_s_at 211569 GRK5 1120720 204401_at 10082 KCNN4 1120730 204415_at 287721 G1P3 1120743 204440_at 79197 CD83 1132614 204446 s at 89499 ALOX5 1120750 204454 at 45231 LDOC1 1132628 204468_s_at 78824 TIE 1120755 204470_at 789 CXCL1 1120765 204484_at 343329 PIK3C2B 1132636 204490_s_at 306278 CD44 1120770 204493_at 300825 BID 1120779 204510_at 28853 CDC7 1120780 204511_at 301283 FARP2 1120785 204517_at 110364 PPIC 1120789 204524_at 154729 PDPK1 1132651 204529_s_at 439767 TOX 1120792 204533_at 413924 CXCL10 1120803 204549_at 321045 IKBKE 1120808 204562_at 127686 IRF4 1120809 204563_at 82848 SELL 1120813 204668_at 414809 KIAA0831 1120814 204569_at 417022 ICK 1120818 204579_at 165950 FGFR4 1120824 204689_at 200598 ARK5 1120825 204591_at 388344 CHL1 1120828 204600_at 2913 EPHB3 1120832 204604_at 57856 PFTK1 1120834 204606_at 67907 CCL21 1120838 204612_at 433700 PKIA 1120839 204613_at 512298 PLCG2 1120846 204632_at 105584 RPS6KA4 1132700 204633_s_at 109058 RPS6KA5 1120847 204634_at 433008 NEK4 1120853 204641_at 153704 NEK2 1120854 204642_at 154210 EDG1 1120858 204647_at 410683 HOMER3 1120863 204655_at 489044 CCL5 1120875 204674_at 124922 LRMP 1120880 204682_at 105689 LTBP2 1120881 204683_at 433303 ICAM2 1132726 204707_s_at 433728 MAPK4 1120900 204718_at 380089 EPHB6 1132734 204724_s at 126248 COL9A3 1120918 204754_at 250692 HLF 1120923 204765_at 334 ARHGEF5 1120925 204773 at 204891 IL11RA 1132762 204777_s_at 80395 MAL 1132766 204781_s_at 82359 TNFRSF6 1132768 204785_x_at 512211 IFNAR2 1132775 204803_s_at 1027 RRAD 1132780 204811_s_at 389415 CACNA2D2 1120946 204813 at 25209 MAPK10 1120952 204822_at 169840 TTK 1120955 204825_at 184339 MELK 1120958 204831_at 397734 CDK8 1132787 204832_s_at 2534 BMPR1A 1132799 204859_s_at 373575 APAF1 1120976 204867_at 245644 GCHFR 1120980 204872 at 494269 TLE4 1132809 204878_s_at 291623 PSK 1120986 204886_at 172052 PLK4 1132818 204891_s_at 1765 LCK 1132825 204900_x_at 512813 SAP30 1132830 204908_s_at 31210 BCL3 1120993 204912_at 327 IL10RA 1132834 204914_s_at 432638 SOX11 1121000 204924_at 519033 TLR2 1121005 204932_at 81791 TNFRSF11B 1121007 204936_at 440835 SF1 1121012 204947_at 96055 E2F1 1121013 204949_at 353214 ICAM3 1132850 204954_s_at 130988 DYRK1B 1121021 204958_at 153640 PLK3 1132851 204961_s_at 1583 1132852 204962_s_at 1594 CENPA 1121028 204968_at 247323 APOM 1121029 204971_at 412999 CSTA 1121033 204975_at 356835 EMP2 1132860 204986 s at 291623 PSK 1132862 204990_s_at 85266 ITGB4 1132866 204998_s_at 9754 ATF5 1132874 205013_s_at 197029 ADORA2A 1121054 205016_at 170009 TGFA 1121057 205026_at 434992 STAT5B 1132883 205027_s_at 432453 MAP3K8 1121061 205032_at 387725 ITGA2 1121062 205034_at 408658 CCNE2 1132890 205049_s_at 79630 CD79A 1132892 205051_s_at 81665 KIT 1121073 205052_at 81886 AUH 1121076 205055_at 389133 ITGAE 1121082 205067_at ' 126256 IL1B 1121100 205098_at 301921 CCR1 1121102 205101_at 126714 MHC2TA 1132918 205114_s at 73817 CCL3 1132920 205119_s_at 753 FPR1 1121115 205124_at 78881 MEF2B 1121117 205126_at 82771 VRK2 1121120 205130_at 104119 RAGE 121129 205159_at 285401 CSF2RB 1121136 205168_at 440905 DDR2 1132953 205180_s_at 86947 ADAM8 1121143 205184_at 447973 GNG4 1121149 205192_at 440315 MAP3K14 1132959 205198_s_at 606 ATP7A 1121159 205205 at 307905 RELB 1121161 205207_at 512234 IL6 1132961 205212_s_at 337242 CENTB1 1121166 205214_at 88297 STK17B 1121170 205220_at 458425 HM74 1121186 205242_at 100431 CXCL13 1121190 205247_at 436100 NOTCH4 1121195 205253 at 408222 PBX1 1132973 205255_x_at 169294 TCF7 1121201 205263_at 193516 BCL10 1121203 205266_at 2250 LIF 1121205 205269_at 2488 LCP2 1132979 205271_s_at 26322 CCRK 1121217 205291_at 75596 IL2RB 1121220 205296_at 87 RBL1 1132990 205297_s_at 89575 CD79B 1132994 205301_s_at 380271 OGG1 1132996 205306_x_at 409081 KMO 1121228 205312_at 167441 SPI1 1133004 205327 s_at 389846 ACVR2 1121248 205345_at 54089 BARD1 1133011 205347_s_at 56145 TMSNB 1121265 205372 at 14968 PLAG1 1133021 205377_s_at 164495 ACHE 1133024 206383_s_at 436987 ZNF288 1133030 205392 s_at 272493 CCL15 1121276 205394_at 24529 CHEK1 1121278 205399_at 21355 DCAMKL1 1121281 205403_at 25333 IL1R2 1121287 205411_at 35140 STK4 1121290 205418_at 7636 FES 1121291 205419_at 784 EBI2 1133042 205422_s_at 311054 ITGBL1 1133047 205434_s_at 528338 AAK1 1133049 205436_s_at 147097 H2AFX 1121301 205437_at 449971 ZNF134 1121306 205443_at 179312 SNAPC1 1121309 205449_at 23642 HSU79266 1121315 205455_at 2942 MST1R 1121316 205456_at 3003 CD3E 1121322 205467_at 5353 CASP10 1121326 205476_at 75498 CCL20 1133065 205479_s_at 77274 PLAU 1133068 205483_s_at 458485 G1P2 1121329 205484_at 88012 SIT 1121331 205486_at 8980 TESK2 1121343 205504_at 159494 BTK 1133076 205512_s_at 18720 PDCD8 1133080 205626_s_at 440341 KATNA1 1133091 205544_s_at 73792 CR2 1133093 205546_s_at 75516 TYK2 1121368 205551_at 8071 SV2B 1133099 206564_s_at 88646 DNASE1L3 1121371 205558_at 444172 TRAF6 1133102 205565_s_at 360041 FRDA 1121380 205569 at 10887 LAMP3 1121383 205572 at 115181 ANGPT2 1121387 205578_at 208080 ROR2 1133111 205593_s_at 389777 PDE9A 1121400 205599 at 223474 TRAF1 1133117 205607_s_at 435560 PACE-1 1121404 205609 at 2463 ANGPT1 1121406 205611_at TNFSF12 1121408 205613_at 258326 LOC51760 1133119 205614_x_at 512587 MST1 1121414 205621_at 94542 ALKBH 1121436 205659_at 487662 HDAC9 1121444 205668_at 153563 LY75 1133138 205671_s_at 1802 HLA-DOB 1133141 205677_s_at 344524 DLEU1 1121452 205681_at 227817 BCL2A1 1133148 205692_s_at 174944 CD38 1133150 205698_s_at 256924 MAP2K6 1121468 205707_at 129751 IL17R 1133156 205713_s_at 1584 COMP 1121473 205718 at 1741 ITGB7 1121482 205729_at 238648 OSMR 1121497 205758_at 85258 CD8A 1121511 205780_at 155419 BIK 1133184 205786_s_at 172631 ITGAM 1121516 205789_at 1799 CD1D 1121518 205792_at 194679 WISP2 1133192 205801_s_at 24024 RASGRP3 1933195 205805_s_at 274243 ROR1 1121533 205821_at 387787 KLRK1 1121542 205831_at 89476 CD2 1133210 205842_s_at 434374 JAK2 1121546 205844_at 12114 VNN1 1121554 205854_at 437046 TULP3 1121558 205858_at 415768 NGFR 1121559 205859_at 184018 LY86 1121560 205861_at 437905 SPIB 1121564 205865_at 437783 ARID3A 1133216 205872_x_at 502577 PDE4DIP 1121572 205876_at 446501 LIFR 1121573 205878_at 2815 POU6F1 1133219 205879_x_at 350321 RET 1121574 205880_at 2891 PRKCM 1133227 205895_s_at 75337 NOLC1 1121584 205898_at 78913 CX3CR1 1121585 205899_at 417050 CCNA1 1121587 205901_at 371809 PNOC 1121589 205904_at 90598 MICA 1133232 205910_s_at 406160 CEL 1121629 205985_at 41691 BATF 1133252 205977_s_at 89839 EPHA1 1121643 205986_at 514575 AATK 1121645 205988_at 398093 CD84 1133260 205992_s_at 528402 IL15 1121650 206002_at 421137 GPR64 1121655 206009_at 222 ITGA9 1133272 206028_s_at 306178 MERTK 1133275 206036_s_at 44313 REL 1121680 206049_at 73800 SFLP 1133296 206070_s_at 123642 EPHA3 1133299 206075_s_at 446484 CSNK2A1 1121689 206076_at 155586 B7 1121693 206080_at 170156 KIAA0450 1121695 206082_at 511759 HCP5 1133300 206085_s_at 19904 CTH 1121711 206106_at 432642 MAPK12 1121717 206114_at 73964 EPHA4 1121720 206118_at 80642 STAT4 1121722 206120_at 83731 CD33 1121726 206126_at 113916 BLR1 1121739 206142_at 85863 ZNF135 1121743 206148_at 460433 IL3RA 1121745 206150_at 355307 TNFRSF7 1121757 206170_at 2551 ADRB2 1121759 206172_at 336046 IL13RA2 1121760 206176_at 285671 BMP6 1121762 206181_at 32970 SLAMF1 1121767 206187_at 458324 PTGIR 1121780 206206_at 87205 LY64 1121783 206211_at 89546 SELE 1121788 206216_at 104865 STK23 1121792 206222_at 119684 TNFRSF10C 1121793 206223_at 122708 LMTK2 1121809 206247_at 211580 MICB 1121814 206255_at 389900 BLK 1133355 206267_s_at 437808 MATK 1121828 206271_at 29499 TLR3 1121834 206279_at 183165 PRKY 1133358 206283_s_at 73828 TAL1 1121841 206291_at 80962 NTS 1121844 206295_at 83077 IL18 1121848 206301_at 278005 TEC 1121853 206310_at 98243 SPINK2 1121854 206312_at 171470 GUCY2C 1121857 206315_at 114948 CRLF1 1133376 206324_s_at 129208 DAPK2 1121869 206336_at 164021 CXCL6 1121870 206337_at 1652 CCR7 1121874 206341_at 130058 IL2RA 1133388 206362_x_at 435014 MAP3K10 1121887 206363_at 134859 MAF 1133389 206366_x_at 174228 XCL1 1133392 206380_s_at 53165 PFC 1133397 206390_x_at 81564 PF4 1133400 206398_s_at 96023 CD19 1133405 206407_s_at 414629 CCL13 1133406 206411_s_at 159472 ABL2 1121918 206412_at 121558 FER 1133407 206413_s_at 144519 TCL6 1133408 206414_s_at 12802 DDEF2 1121947 206464_at 27372 BMX 1133430 206467_x_at 348183 TNFRSF6B 1121953 206478_at 38365 KIAA0125 1121956 206482_at 51133 PTK6 1121959 206486 at 409523 LAG3 1121963 206493 at 411312 ITGA2B 1121966 206498_at 82027 OCA2 1133445 206499_s_at 196769 CHC1 1121970 206508_at 99899 TNFSF7 1133453 206518_s_at 117149 RGS9 1121996 206545_at 1987 CD28 1122007 206569_at 411311 IL24 1133476 206571_s_at 3628 MAP4K4 1122009 206575_at 60905 CDKL5 1122021 206591_at 73958 RAG1 1122036 206618_at 159301 IL18R1 1122051 206637_at 2465 GPR105 1122053 206641_at 2556 TNFRSF17 1122065 206660_at 348935 IGLL1 1122075 206674_at 385 FLT3 1133515 206687_s_at 63489 PTPN6 1122087 206693_at 72927 IL7 1122091 206702_at 89640 TEK 1122104 206718 at 1149 LMO1 1122112 206729_at 1314 TNFRSF8 1122131 206756_at 138155 CHST7 1133538 206760_s_at 1416 FCER2 1122139 206766_at 158237 ITGA10 1122156 206794_at 1939 ERBB4 1122165 206804_at 2259 CD3G 1122181 206828_at 29877 TXK 1133565 206846_s_at 6764 HDAC6 1133568 206854_s_at 290346 MAP3K7 1133569 206855_s_at 76873 HYAL2 1133576 206864_s_at 87247 HRK 1133577 208874_s_at 105751 SLK 1133580 206881_s_at 113277 LILRA3 1122215 206887_at 528317 CCBP2 1122217 206890_at 223894 IL12RB1 1122219 206892_at 437877 AMHR2 1122230 206907_at 1524 TNFSF9 1122241 206923_at 349611 PRKCA 1133595 206926_s_at 1721 IL11 1122253 206943_at 28005 TGFBR1 1122274 206974_at 34526 CXCR6 1122275 206975_at 36 LTA 1122277 206978_at 511794 CCR2 1122281 206983_at 46468 CCR6 1122284 206988_at 310511 CCL25 1133618 206991_s_al 511796 CCR5 1122288 206999_at 413608 IL12RB2 1122292 207008_at 846 IL8RB 1133629 207011_s_at 90572 PTK7 1122304 207029_at 1048 KITLG 1122327 207061 at 137575 ERN1 1122335 207073_at 143241 CDKL2 1133652 207076_s_at 160786 ASS 1122344 207094_at 194778 IL8RA 1122353 207111 at 2375 EMR1 1133672 207113_s_at 241570 TNF 1133676 207121_s_at 271980 MAPK6 1122380 207160_at 673 IL12A 1133694 207163_s_at 368861 AKT1 1122382 207165_at 72550 HMMR 1133700 207173_x_at 443435 CDH11 1133701 207176_s_at 838 CD80 1133702 207178_s_at 89426 FRK 1122388 207179_at 89583 TLX1 1133704 207181_s_at 9216 CASP7 1122394 207188_at 100009 CDK3 1133708 207194_s_at 512159 ICAM4 1122400 207199_at 439911 TERT 1122412 207216_at 177136 TNFSF8 1122420 207228_at 158029 PRKACG 1133724 207239_s_at 171834 PCTK1 1122428 207245_at 183596 UGT2B17 1133731 207253_s_at 21479 UBN1 1122449 207277_at 278694 CD209 1122471 207312_at 512612 PHKG1 1133753 207314_x_at 380156 KIR3DL1 1133755 207318_s_at 404501 CDC2L5 1133757 207320_x_at 6113 STAU 1133766 207339_s_at 376208 LTB 1122491 207354_at 10458 CCL16 1133778 207375_s_at 12503 IL15RA 1133786 207396_s_st 153591 ALG3 1133801 207426_s_at 181097 TNFSF4 1133802 207428_x_at 454861 CDC2L2 1122537 207433_at 193717 IL10 1122541 207442_at 2233 CSF3 1133810 207445_s_at 225946 CCR9 1122544 207446_at 366986 TLR6 1133829 207497_s_at 386748 MS4A2 1122581 207505_at 41749 PRKG2 1133834 207509_s_at 43803 LAIR2 1122596 207533_at 72918 CCL1 1133846 207536_s_at 528403 TNFRSF9 1122599 207538_at 73917 IL4 1133848 207540_s_at 192182 SYK 1122602 207550_at 82906 CDC20 1122609 207568_at 103128 CHRNA6 1122610 207669_at 1041 ROS1 1133867 207571_x_at 10649 C1orf38 1133869 207574_s_at 110571 GADD45B 1133901 207633T_s_at 156465 MUSK 1122640 207634_at 158297 PDCD1 1122645 207641_at 158341 TNFRSF13B 1133904 207643_s_at 159 TNFRSF1A 1133910 207655_s_at 167746 BLNK 1122664 207681_at 198252 CXCR3 1133931 207697_x_at 306230 LILRB2 1122680 207709_at 256067 PRKAA2 1122710 207766_at 380788 CDKL1 133998 207826_s_at 76884 ID3 1122738 207840 at 81743 CD160 1122740 207844_at 845 IL13 1122743 207849_at 89679 IL2 1122744 207850_at 89690 CXCL3 1122749 207861_at 80420 CX3CL1 1122763 207884_at 309958 GUCY2D 1122767 207892_at 652 TNFSF5 1122772 207900_at 66742 CCL17 1122773 207901_at 674 IL12B 1122774 207902_at 68876 IL5RA 1122775 207906_at 694 IL3 1122776 207907 at 129708 TNFSF14 1122796 207952_at 2247 IL5 1134069 207979_s_at 405667 CD8B1 1134076 207988_s_at 83583 ARPC2 1134083 207996_s_at 285091 C18orf1 1134095 208018_s_at 89555 HCK 1134109 208037_s_at 102598 MADCAM1 1122824 208038_at 416814 IL1RL2 1122834 208059_at 113222 CCR8 1134133 208075_s_at 251526 CCL7 1134145 208091_s_at 4750 DKFZP564K 0822 1134200 208161_s_at 90786 ABCC3 1134212 208178_x_at 367689 TRIO 1134220 208189_s_at 370421 MYO7A 1122863 208193_at 960 IL9 1122864 208195_at 434384 TTN 1122865 208200_at 1722 IL1A 1134230 208206_s_at 99491 RASGRP2 1134233 208212_s_at 410680 ALK 1134270 208284_x at 352119 GGT1 1134271 208286_x_at 249184 POU5F1 1134280 208303_s_at 287729 CRLF2 1122914 208304_at 506190 CCR3 1134296 208335_s_at 183 FY 1134316 208385_s_at 32959 GRK4 1122939 208376 at 184926 CCR4 1134361 208426_x_at 515605 KIR2DL4 1134370 208438_s_at 1422 FGR 1122956 208450_at 113987 LGALS2 1134379 208451_s_at 150833 C4A 1122983 208495_at 249125 TLX3 1122994 208524_at 159900 GPR15 1134422 208536_s_at 84063 BCL2L11 1134424 208540_x_at S100A14 1123026 208578_at 250443 SCN10A 1134457 208605_s_at 406293 NTRK1 1134480 208634_s_at 372463 MACF1 1123038 208636_at 119000 ACTN1 1123039 208638_at 212102 P5 1134494 208657_s_at 288094 MSF 1123052 208680_at 180909 PRDX1 1123053 208683_at 350899 CAPN2 1134517 208690_s_at 75807 PDLIM1 1123055 208691_at 185726 TFRC 1134523 208700_s_at 89643 TKT 1134532 208711_s_at 371468 CCND1 1134533 208716_s_at 93832 LOC54499 1134542 208729_x_at 77961 HLA-B 1123086 208774 at 378918 CSNK1D 1134582 208794_s_at 78202 SMARCA4 1134593 208812_x_at 274485 HLA-C 1123105 208820_at 434281 PTK2 1123108 208828_at 108112 POLE3 1134615 208851_s_at 134643 THY1 1134618 208854_s_at 168913 STK24 1134647 208892_s_at 298654 DUSP6 1123127 208894_at 409805 HLA-DRA 1134653 208901_s_at 253536 TOP1 1134665 208921_s_at 422340 SRI 1134674 208937_s_at 410900 ID1 1134676 208942_s_at 168193 TLOC1 1123148 208944_at 82028 TGFBR2 11134679 208946_s_at 12272 BECN1 1134682 208949_s_at 411701 LGALS3 1134687 208959_s_at 164023 TXNDC4 1134699 208974_x_at 439683 KPNB1 1123160 208982_at 78146 PECAM1 1134706 208987_s_at 219614 FBXL11 1123163 208991_at 421342 STAT3 1134710 208993_s_at 77965 PPIG 1134727 209018_s_at 439600 PINK1 1134738 209033_s_at 75842 DYRK1A 1134753 209053_s_at 110457 WHSC1 1134778 209085_x_at 166563 RFC1 1123188 209089_at 73957 RAB5A 1123192 209100_at 315177 IFRD2 1123193 209101_at 410037 CTGF 1123198 209112_at 238990 CDKN1B 1134797 209118_s_at 433394 TUBA3 1123213 209154 at 12956 TIP-1 1123223 209173_at 226391 AGR2 1134837 209185_s_at 143648 IRS2 1123231 209189_at 25647 FOS 1123233 209193_at 81170 PIM1 1123235 209196_at 436930 C6orf11 1134843 209199_s_at 368950 MEF2C 1134850 209210_s_at 270411 PLEKHC1 1134852 209214_s_at 374477 EWSR1 1134858 209226_s_at 405954 TNPO1 1123250 209233_at 135643 C2F 1123255 209239_at 160557 NFKB1 1134865 209241_x_at 112028 MINK 1134880 209265_s_at 168799 METTL3 1134888 209278_s_at 438231 TFPI2 1123278 209295_at 51233 TNFRSF10B 1134903 209306_s_at 153026 SWAP70 1123286 209311_at 410026 BCL2L2 1123289 209317_at 5409 POLR1C 1123293 209333_at 47061 ULK1 1123298 209339_at 20191 SIAH2 1134921 209341_s_at 413513 IKBKB 1134928 209352_s_at 13999 SIN3B 1123304 209354_at_ 279899 TNFRSF14 1134933 209360_s_at 410774 RUNX1 1123308 209364 at 76366 BAD 1123310 209368_at 212088 EPHX2 1134945 209379_s_at 81897 KIAA1128 1123317 209386_at 351316 TM4SF1 1123321 209392_at 23719 ENPP2 1123331 209409_at 512118 GRB10 1134961 209417_s_at 50842 IF135 1123346 209443_at 76353 SERPINA3 1123358 209464_at 442658 AURKB 1134988 209467_s_at 79516 MKNK1 1134991 209474_s_at 444105 ENTPD1 1123369 209481_at 79025 SNRK 1123372 209487_at 195825 RBPMS 1123376 209496_at 37682 RARRES2 1135002 209500_x_at 54673 TNFSF13 1123399 209541_at 308053 IGF1 1135023 209543_s_at 374990 CD34 1135024 209545_s_at 103755 RIPK2 1123401 209550_at 50130 NDN 1135028 209555_s_at 443120 CD36 1123413 209675_at 418291 IL10RB 1135042 209582_s_at 79015 MOX2 1135047 209589_s_at 125124 EPHB2 1123419 209590_at 170195 BMP7 1135056 209604_s_at 169946 GATA3 1123429 209619_at 446471 CD74 1135068 209621_s_at 71719 PDLIM3 1123430 209622_at 153003 STK16 1123437 209636_at 73090 NFKB2 1123439 209642_at 287472 BUB1 1135080 209649_x_at 421349 CDKN2A 1135085 209650_s_at 505862 C22orf4 1135088 209656_s_at 8769 TM4SF10 1135093 209666_s_at 198998 CHUK 1135101 209680_s_at 20830 KIFC1 1123455 209682_at 436986 CBLB 1123457 209584_at 446304 RIN2 1135102 209685_s_at 349845 PRKCB1 1123459 209687_at 436042 CXCL12 1123470 209704_at 31016 M96 1123476 209711_at 82635 SLC35D1 1123479 209716_at 173894 CSF1 1123490 209732_at 85201 CLECSF2 1123497 209747_at 2025 TGFB3 1135130 209757_s_at 26960 MYCN 1123502 209760_at 511944 KIAA0922 1123507 209770_at 284283 BTN3A1 1135138 209771_x_at 375108 CD24 1135141 209774_x_at 75765 CXCL2 1135151 209790_s_at 3280 CASP6 1123529 209815_at 159526 PTCH 1135164 209825_s_at 458360 UMPK 1135165 209827_s_at 170359 IL16 1123535 209829_at 389488 C6orf32 1135168 209831_x_at 118243 DNASE2 1135173 209841_s_at 3781 LRRN3 1135186 209860_s_at 386741 ANXA7 1135189 209863_s_at 137569 TP73L 1123552 209879_at 423077 SELPLG 1135209 209899_s_at 74562 SIAHBP1 1123566 209906_at 155935 C3AR1 1135214 209908_s_at 169300 TGFB2 1123573 209924_at 16530 CCL18 1135226 209929_s_at 43506 IKBKG 1135227 209930_s_at 75643 NFE2 1135229 209932_s_at 367676 DUT 1123581 209941_at 390758 RIPK1 1135234 209945_s_at 282359 GSK3B 1123584 209946_at 79141 VEGFC 1123586 209948_at 93841 KCNMB1 1123587 209949_at 949 NCF2 1135240 209955_s_at 436852 FAP 1135251 209969_s_at 21486 STAT1 1135253 209971_x_at 301613 JTV1 1135267 209995_s_at 2484 TCL1A 1135270 209999_x_at 50640 SOCS1 1123608 210017_at 180566 MALT1 1135285 210024_s_at 449501 UBE2E3 1123611 210029_at 840 INDO 1123613 210031_at 97087 CD3Z 1123614 210038_at 408049 PRKCQ 1135299 210044_s_at 46446 LYL1 1123622 210051_at 8578 EPAC 1123628 210058_at 178695 MAPK13 1123634 210072_at 50002 CCL19 1123635 210073_at 408614 SIAT8A 1123643 210092_at 421576 MAGOH 1135322 210095_s_at 450230 IGFBP3 1135328 210105_s_at 390567 FYN 1123663 210133_at 54460 COL11 1123671 210148_at 30148 HIPK3 1135350 210151_s_at 164267 DYRK3 1123672 210152_at 67846 LILRB4 1123679 210163_at 103982 CXCL11 1123680 210164_at 1051 GZMB 1123682 210166_at 114408 TLR5 1123690 210176_at 111805 TLR1 1123694 210184_at 385521 ITGAX 1135374 210214_s_at 53250 BMPR2 1135379 210225_x_at 511766 LILRB3 1135380 210229_s_at 1349 CSF2 1135383 210240_s_at 435051 CDKN2D 1123731 210258_at 17165 RGS13 1135395 210260_s_at 17839 TNFAIP8 1135399 210275_s_at 406096 ZNF216 1123744 210279_at 88269 GPR18 1123760 210313_at 406708 ILT7 1123762 210316_at 415048 FLT4 1123778 210349_at 440638 CAMK4 1123780 210354_at 856 IFNG 1135467 210404_x_at 321572 CAMK2B 1135475 210416_s_at 146329 CHEK2 1135487 210432_s_at 300717 SCN3A 1135489 210438_x_at 288178 SSA2 1123814 210439_at 56247 ICOS 1123816 210442_at 66 IL1RL1 1135492 210448_s_at 408615 P2RX5 1135513 210481_s_at 421437 CD209L 1123833 210487_at 397294 DNTT 1123842 210505_at 457 FUT7 1135526 210512_s_at 73793 VEGF 1135529 210517_s_at 197081 AKAP12 1123847 210523_at 87223 BMPR1B 1135541 210538_s_at 127799 BIRC3 1135549 210549_s_at 169191 CCL23 1135550 210550_s_at 221811 RASGRF1 1135571 210582_s_at 278027 LIMK2 1135583 210606_x_at 41682 KLRD1 1123875 210607_at 428 FLT3LG 1135592 210621_s_at 758 RASA1 1135593 210622_x_at 77313 CDK10 1123889 210643_at 333791 TNFSF11 1135606 210644_s_at 407964 LAlR1 1123890 210654_at 129844 TNFRSF10D 1123892 210659_at 159553 CMKLR1 1135622 210671_x_at 445864 MAPK8 1135645 210715_s_at 31439 SPINT2 1135665 210749_x_at 423573 DDR1 1135673 210759_s_at 82159 PSMA1 1123938 210772_at 99855 FPRL1 1135684 210775_x_at 329502 CASP9 1135685 210776_x_at 371282 TCF3 1135735 210838_8_at 410104 ACVRL1 1135743 210847_x_at 299558 TNFRSF25 1123954 210865_at 2007 TNFSF6 1135755 210869 _s_at 511397 MCAM 1135773 210889 _s_at 126384 FCGR2B 1135778 210896_s_at 27954 CD86 1135795 210933 _s_at 55923 Lin10 1135801 210943_s_at 130188 CHS1 1135802 210944 _s_at 439343 CAPN3 1135826 210976_s_at 75160 PFKM 1135830 210981_s_at 235116 GRK6 1135835 210986_s_at 133892 TPM1 1123988 211005_at 498997 LAT 1135852 211008_s_at 302903 UBE2I 1135858 211015_s_at 90093 HSPA4 1135866 211026_s_at 409826 MGLL 1136871 211031_s_at 104717 CYLN2 1135899 211070_x_at 78888 DBI 1135925 211100_x_at 149924 LILRB1 1135929 211105_s_at 96149 NFATC1 1135930 211107_s_at 98338 AURKC 1135966 211155_s_at 1166 THPO 1135968 211160_x_at 119000 ACTN1 1135974 211168_s_at 388125 RENT1 1135982 211178_s_at 129758 PSTPIP1 1135994 211197_s_at 14155 ICOSL 1136002 211208_s_at 288196 CASK 1124049 211276_at 401835 my048 1136048 211282_x_at 299558 TNFRSF25 1136051 211286_x_at 520937 CSF2RA 1136065 211296_x_at 183704 UBC 1136056 211297_s_at 184298 CDK7 1136087 211339_s_at 211576 ITK 1136109 211370_s_at 436145 MAP2K5 1136150 211432_s_at 381282 TYRO3 1136152 211434_s_at 458436 CCRL2 1136162 211453_s_at 326445 AKT2 1136172 211470_s_at 38084 SULT1C1 1136185 211488_s_at 355722 ITGB8 1136193 211499_s_at 57732 MAPK11 1136216 211528_x_at 512152 HLA-G 1136269 211593_s_at 101474 MAST2 1136273 211597_s_at 13775 HOP 1136285 211615_s_at 182490 LRPPRC 1124132 211658_at 432121 PRDX2 1136329 211675_s_at 132739 HIC 1136337 211685_s_at 90063 NCALD 1136343 211692_s_at 87246 BBC3 1924137 211693_at 366 MGC27165 1136357 211709_s_at 512680 SCGF 1136362 211714_x_at 356729 OK/SW-cl.56 1136369 211724_x_at 387140 FLJ20323 1136371 211726_s_at 361155 FMO2 1136379 211734_s_at 897 FCER1A 1136391 211748_x_at 446429 PTGDS 1136393 211750_x_at 406578 TUBA6 1136401 211761_s_at 27258 SIP 1136408 211771_s_at 1101 POU2F2 1136427 211795_s_at 276506 FYB 1136430 211798_x_at 102950 IGLJ3 1136459 211828_s_at 252550 KIAA0551 1133464 211833_s_at 159428 BAX 1136540 211924_s_at 179657 PLAUR 1124176 211966_at 407912 COL4A2 1124177 211967_at 172089 PORIMIN 1124178 211969_at 446579 HSPCA 1124187 211986_at 378738 MGC5395 1124188 211987_at 282346 TOP2B 1136573 211991_s_at 914 HLA-DPA1 1124192 211992_at 275999 PRKWNK1 1124195 211998_at 180877 H3F3B 1136585 212022_s_at 80976 MKI67 1124215 212037_at 409965 PNN 1136595 212038_s_at 404814 VDAC1 1136599 212046_x_at 861 MAPK3 1136601 212048_s_at 322735 YARS 1136605 212064_x_at 448398 MAZ 1124237 212080_at 258855 MLL 1136620 212091_s_at 415997 COL6A1 1124254 212110_at 301743 SLC39A14 1124266 212123_at 438991 DKFZP564D 116 1124283 212144_at 406612 UNC84B 1124296 212158_at 1501 SDC2 1124304 212168_at 166887 CPNE1 1124316 212186_at 449863 ACACA 1124318 212190_at 21858 SERPINE2 1124321 212196_at 629772 1136655 212218_s_at 388387 FBXO9 1124342 212230_at 432840 PPAP2B 1136662 212240_s_at 6241 PIK3R1 1124357 212247_at 413636 NUP205 1124362 212252_at 297343 CAMKK2 1124365 212261_at 334871 TNRC15 1124377 212282_at 199695 MAC30 1124381 212288_at 440808 FNBP1 1124384 212291_at 12259 HIPK1 1124391 212296_at 7200 NEK9 1136681 212303_x_at 91142 KHSRP 1124400 212312_at 305890 BCL2L1 1124411 212326_at 194737 VPS13D 1124416 212331_at 283604 RBL2 1124429 212344_at 409602 SULF1 1136687 212345_s_at 59943 CREB3L2 1124438 212358_at 7357 CLIPR-59 1136692 212359_s_at 65135 KIAA0913 1124456 212382_at 359289 TCF4 1136702 212399_s_at 155584 KIAA0121 1136710 212429_s_at 75782 GTF3C2 1136712 212442_s_at 603941 LOC253782 1136718 212459_x_at 446476 SUCLG2 1136722 212481_s_at 250641 TPM4 1136724 212491_s_at 433540 DNAJC8 1124539 212494_at 6147 TENC1 1124543 212500_at 99821 C10orf22 1124549 212508_at 24719 MOAP1 1124561 212530_at 24119 NEK7 1124563 212633_at 249441 WEE1 1124577 212552_at 3618 HPCAL1 1124583 212558_at 20977 GDAP1L1 1124594 212572_at 184523 STK38L 1124606 212588_at 444324 PTPRC 1124610 212592_at 381568 IGJ 1124613 212599_at 296720 AUTS2 1124616 212603_at 154655 MRPS31 1136759 212605_s_at 188882 1124620 212610_at 83572 PTPN11 1136762 212624_s_at 380138 CHN1 1136765 212629_s_at 69171 PRKCL2 1124646 212646_at 436432 RAFTLIN 1136774 212657_s_at 81134 IL1RN 1124655 212658_at 79299 LHFPL2 1124658 212663_at 522351 KIAA0674 1136777 212671_s_at 387679 HLA-DQA1 1124666 212672_at 526394 ATM 1136781 212680_x_at 120197 PPP1R14B 1136784 212889_s_at 321707 JMJD1 1136786 212694_s_at 63788 PCCB 1136788 212698_s_at 355455 09/10/2004 1124692 212713_at 296049 MFAP4 1124705 212730_at 381347 DMN 1124712 212738_at 80305 ARHGAP19 1124713 212740_at 306747 PIK3R4 1124723 212753 at 435065 RNF3 1124733 212771_at 66762 LOC221061 1124734 212774_at 446677 ZNF238 1124745 212789_at 438550 KIAA0056 1136819 212798_s_at 112605 DKFZP664O 043 1124753 212801_at 528307 CIT 1124755 212805_at 23311 KIAA0367 1124760 212813_at 419149 JAM3 1124768 212824_at 98751 FUBP3 1124770 212827_at 153261 IGHM 1136831 212841_s_at 12953 PPFIBP2 1136832 212842_x_at 434959 RANBP2L1 1124782 212843_at 78792 NCAM1 1124786 212847_at 22370 NEXN 1124798 212867_at 446678 NCOA2 1124800 212871_at 413901 MAPKAPK5 1136844 212875_s_at 16007 C21orf25 1124806 212881_at 105779 PIASY 1124820 212899_at 129836 CDK11 1124830 212911_at 9059 KIAA0962 1124831 212912_at 301664 RPS6KA2 1124833 2129147_at 356416 CBX7 1136B53 212922_s_at 66170 SMYD2 1136859 212942_s_at 212584 KIAA1199 1124862 212954_at 439530 DYRK4 1136865 212959_s_at 412128 MGC4170 1124864 212960_at 411317 KIAA0882 1124875 212975_at 18166 KIAA0870 1124889 212993_at 244847 BTBD14A 1136876 212997_s_at 445078 TLK2 1136877 212998_x_at 409934 HLA-DQB1 1124893 213002_at 318603 MARCKS 1124913 213027_at 288178 SSA2 1124920 213039_at 6150 ARHGEF18 1124921 213044_at 306307 ROCK1 1124922 213046_at 173864 MAST3 1124941 213068_at 80552 DPT 1124942 213069_at 433452 HEG 1124948 213075_at 357004 LOC169611 1124953 213083_at 386278 SLC35D2 1136902 213086_s_at 442592 1136903 213087_s_at 334798 EEF1D 1124967 213108_at 143535 CAMK2A 1136913 213113_s_at 99962 SLC43A3 1124972 213116_at 2236 NEK3 1136925 213154_s_at 436939 BICD2 1125001 213158_at 16193 1125009 213169_at 27621 1125010 213170_at 43728 GPX7 1125013 213174_at 79170 TTC9 1136938 213188_s_at 23294 MINA53 1136939 213193 x_at 419777 1125025 213196_at 301094 1125027 213198_at 371974 ACVR1B 1125058 213238_at 437241 ATP10D 1125079 213264_at 211601 MAP3K12 1125122 213324_at 436015 SRC 1125124 213326_at 20021 VAMP1 1136971 213330_s_at 257827 STIP1 1136972 213331_s_at 414410 NEK1 1125130 213338_at 35861 RIS1 1125132 213341_at 47367 FEM1C 1125136 213348_at 106070 CDKN1G 1136983 213360_s_at 450237 LOC340318 1136984 213364_s_at 498154 SNX1 1136987 213370_s_at 21695 SFMBT1 1136988 213373_s_at 243491 CASP8 1136996 213397_x_at 283749 RNASE4 1125181 213418_at 3268 HSPA6 1125195 213438_at 7309 1137022 213475_s_at 174103 ITGAL 1125231 213489_at 446375 MAPRE2 1137026 213490_s_at 366546 MAP2K2 1125245 213517_at 132977 PCBP2 1125246 213518_at 496511 PRKCI 1125249 213523_at 244723 CCNE1 1137042 213524_s_at 432132 GOS2 1125278 213575_at 445652 TRA2A 1125305 213627_at 376719 MAGED2 1137097 213656_s_at 20107 KNS2 1137109 213689_x_at 469653 RPL5 1137112 213693_s_at 89603 MUC1 1137137 213746_s_at 195464 FLNA 1125377 213748_at 196966 KIAA0298 1125397 213784_at 415172 RABL4 1137158 213794_s_at 9043 C14orf120 1137201 213877_x_at 433343 SRRM2 1137202 213881_x_at 380973 SMT3H2 1125456 213906_at 300592 MYBL1 1125459 213909_at 288467 LRRC15 1125462 213915_at 10306 NKG7 1125485 213958_at 436949 CD6 1137247 213975_s_at 234734 LYZ 1137273 214020_x_at 149846 ITGB5 1125516 214032_at 234569 ZAP70 1125520 214038_at 271387 CCL8 1137289 214049_x_at 36972 CD7 1125527 214051_at 422848 MGC39900 1137291 214055_x_at 446197 XTP2 1125532 214058_at 437922 MYCL1 1125546 214081_at 125036 PLXDC1 1137308 214093_s_at 118962 FUBP1 1137328 214130_s_at 502577 PDE4DIP 1137332 214146_8_at 2164 PPBP 1137343 214170_x_at 391168 FH 1125593 214180_at 8910 MAN1C1 1137360 214196_s_at 429658 CLN2 1137378 214228_x_at 129780 TNFRSF4 1125634 214265_at 171025 ITGA8 1126658 214322_at 12436 CAMK2G 1137439 214339_s_at 95424 MAP4K1 1137447 214359_s_at 74335 HSPCB 1137449 214363_s_at 223745 MATR3 1125685 214371_at 103978 STK22B 1137481 214428_x_at 150833 C4A 1137486 214442_s_at 441069 MIZ1 1137488 214448_x_at 9731 NFKBIB 1137492 214459_x_at 274485 HLA-C 1125742 214470_at 169824 KLRB1 1137506 . 214501_s_at 75258 H2AFY 1137512 214512_s_at 229641 PC4 1137534 214551_s_at 36972 CD7 1125789 214560_at 511953 FPRL2 1137539 214567_s_art 458346 XCL2 1125818 214607_at 152663 PAK3 1125826 214617_at 2200 PRF1 1137561 214639_s at 67397 HOXA1 1125852 214660 at 439320 ITGA1 1125854 214663_at 6874 DustyPK 1137582 214683_s_at 433732 CLK1 1137583 214687_x_at 273415 ALDOA 1125872 214696_at 417157 MGC14376 1137594 214710_s_at 23960 CONB1 1137597 214721_x_at 3903 CDC42EP4 1137601 214730_s_at 78979 GLG1 1125901 214745_at 193143 KIAA1069 1125916 214764_at 497770 1125917 214769_at 417091 CLCN4 1125919 214772_at 432369 G2 1125921 214777_at 512003 1125927 214787_at 511742 IRLB 1125928 214790_at 435628 SUSP1 1137626 214797_s_at 445402 PCTK3 1137643 214864_s_at 155742 GRHPR 1137663 214909_s_at 247362 DDAH2 1126047 214969_at 437214 MAP3K9 1137687 214974_x_at 89714 CXCL5 1137698 215001_s_at 442669 GLUL 1126081 215030_at 309763 GRSF1 1137742 215111_s_at 114360 TSC22 1126131 215117_at 159376 RAG2 1137751 215127_s_at 241567 RBMS1 1126148 215143_at 408264 FLJ36166 1137760 215158_s_at 169681 DEDD 1137771 215193_x_at 308026 HLA-DRB3 1137782 215223_s_at 384944 SOD2 1137806 215313_x_at 181244 HLA-A 1137809 215332_s_at 405667 CD8B1 1126293 215346_at 504816 TNFRSF5 1137838 215411_s_at 437508 C6orf4 1137868 215493_x_at 169963 BTN2A1 1126387 215499_at 180533 MAP2K3 1126408 215528_at 22689 1137908 215603_x_at 454906 1137955 215722_s_at 434901 SNRPA1 1126540 215750_at 474916 KIAA1659 1126554 215767_at 159528 LOC91752 1126559 215776_at 248138 INSRR 1138030 215925_s at 116481 CD72 1138048 215967_s_at 403857 LY9 1138120 216178_x_at 287797 ITGB1 1138128 216199_s_at 390428 MAP3K4 1138132 216207_x_at 390427 IGKV1D-13 1138136 216215_s_at 433574 RBM9 1138147 216234_s_at 194350 PRKACA 1138150 216237_s_at 77171 MCM5 1138157 216261_s_at 82563 KIAA0153 1126858 216261_at 87149 ITGB3 1138192 216321_s_at 126608 NR3C1 1126892 215331_at 74369 ITGA7 1138244 216442_x_at 418138 FN1 1138259 216484_x_at 89525 HDGF 1138279 216520_s_at 374596 TPT1 1138312 216598_s_at 303649 CCL2 1138331 216640_s at 212102 P5 1138355 216705_s_at 407135 ADA 1138379 216836 s at 446352 ERBB2 1127214 216837_at 201920 EPHA5 1138392 216862_s_at 3548 MTCP1 1138400 216876_s_at 41724 IL17 1138417 216905_s_at 56937 ST14 1138421 216913_s_at 434251 KIAA0690 1138441 216945_x_at 397891 PASK 1138443 216960_s_at 77424 FCGR1A 1127290 217019 at 447032 1127294 217028_at 421986 CXCR4 1138507 217066_s_at 898 DMPK 1138515 217080_s_at 93564 HOMER2 1138532 217128_s_at 199068 CAMK1G 1138537 217140_s_at 1138538 217143_s_at 2014 TRD@ 1138541 217149_x_at 203420 TNK1 1127371 217164_at 391858 TIA1 1138555 217184_s_at 434481 LTK 1138567 217200_x_at 355264 CYB561 1138645 217373_x_at 212217 MDM2 1138647 217377_x_at 171262 ETV6 1138652 217388_s_at 444471 KYNU 1138670 217422_s_at 262150 CD22 1138671 217427_s_at 415735 HIRA 1138677 217436_x_at 390440 1127567 217529_at 440667 FLJ20013 1127576 217544_at 529751 1138721 217552_x_at 334019 CR1 1138759 217707_x_at 396404 SMARCA2 1138765 217716_s_at 306079 SEC61A1 1138778 217736_s_at 434986 HRI 1138780 217739_s_at 293464 PBEF1 1138783 217742_s_at 370152 WAC 1138789 217750_s_at 369120 FLJ13855 1127720 217765_at 272736 NRBP 1138801 217774_s_at 333579 HSPC152 1127742 217814_at 8207 GK001 1127744 217817_at 323342 ARPC4 1138832 217829_s_at 12820 USP39 1138845 217849_s_at 436985 CDC42BPB 1127756 217850_at 313544 NS 1127761 217863_at 75251 PIAS1 1138858 217871_s_at 407995 MIF 1127775 217886_at 79095 EPS15 1138867 217892_s_at 10706 EPLIN 1138874 217910_x_at 383019 TCFL4 1138878 217917_s_at 100002 DNCL2A 1138887 217937_s_at 200063 HDAC7A 1127805 217947_at 380627 CKLFSF6 1127807 217950_at 7236 NOSIP 1127813 217962_at 14317 NOLA3 1138905 217970_s_at 437844 KIAA1194 1127822 217977 at 279623 SEPX1 1138910 217982_s_at 374503 MORF4L1 1127833 218001_at 382044 MRPS2 1138920 218002_s_at 24395 CXCL14 1127838 218012_at 136164 SE20-4 1127849 218032_at 76691 SNN 1138944 218051_s_at 84753 FLJ12442 1127864 218066_at 172613 SLC12A7 1138959 218076_s_at 203605 RICH1 1127873 218089_at 11314 C20orf4 1138973 218097_s_at 11270 C10orf66 1127885 218113_at 160417 TMEM2 1138994 218143_s_at 238030 SCAMP2 1138995 218144_s_at 24956 FLJ22056 1127901 218145_at 344378 C20orf97 1139005 218168_s_at 273186 CABC1 1139017 218189_s_at 274424 NANS 1139026 218205_s_at 512094 MKNK2 1127931 218208_at 288284 PQLC1 1139037 218223_s_at 173380 CKIP-1 1127940 218227 at 256549 NUBP2 1139039 218228_s_at 280776 TNKS2 1127943 218232_at 9641 C1QA 1139048 218250_s_at 170553 CNOT7 1139054 218263_s_at 25726 LOC58486 1139076 218306_s_at 133411 HERC1 1139100 218350_s_at 234896 GMNN 1139105 218367_x_at 8015 USP21 1139106 218368_s_at 355899 TNFRSF12A 1139127 218409_s_at 13015 DNAJC1 1128042 218436_at 297875 SIL1 1128066 218475_at 63609 HTF9C 1128070 218481_at 283741 RRP46 1128079 218499 at 23643 MST4 1128095 218520_at 432466 TBK1 1128099 218529_at 333427 8D6A 1128100 218530_at 95231 FHOD1 1139185 218535_s_at 27021 RIOK2 1128106 218542_at 14559 C10orf3 1128111 218552_at 170915 FLJ10948 1139196 218559_s_at 169487 MAFB 1139202 218569_s_at 440695 KBTBD4 1128125 218581_at 445665 ABHD4 1139215 218597_s_at 43549 C10orf70 1128144 218613_at 236438 DKFZp761K 1423 1128151 218625_at 103291 NRN1 1128157 218631_at 23918 VIP32 1139226 218633_x_at 266514 FLJ11342 1139230 218640_s_at 29724 PLEKHF2 1128164 218646_at 44344 FLJ20534 1139235 218651_s_at 416755 FLJ11196 1128167 218653_at 78457 SLC25A15 1128174 218665_at 19545 FZD4 1128192 218696_at 102506 EIF2AK3 1128195 . 218699_at 115325 RAB7L1 1139265 218722_s_at 187657 FLJ12436 1139266 218723_s_at 76640 RGC32 1128214 218734 at 408443 FLJ13848 1139274 218740_s_at 20157 CDK5RAP3 1139277 218747 s at 267993 TAPBP-R 1139280 218751_s_at 312503 FBXW7 1128223 218753_at 55024 FLJ10307 1128231 218764_at 315366 PRKCH 1139301 218792_s_at 108502 BSPRY 1139303 218794_s_at 134406 FLJ2051 1128248 218802_at 234149 FLJ20647 1139314 218831_s_at 111903 FCGRT 1128283 218856_at 159651 TNFRSF21 1128287 218862_at 300063 ASB13 1128298 218887_at 55041 MRPL2 1128311 218909_at 30352 RPS6KC1 1128321 218921_at 433036 SIGIRR 1139360 218947_s_at 173946 FLJ10486 1128341 218955_at 274136 BRF2 1128356 218983 at 415792 C1RL 1128360 218988_at 445043 SLC35E3 1128377 219014_at 371003 PLAC8 1128386 219025_at 195727 CD164L1 1128387 219028_at 397465 HIPK2 1139393 219032_x_at 170129 OPN3 1128395 219039_at 7188 SEMA4C 1128401 219049_at 341073 ChGn 1139411 219073_s_at 368238 OSBPL10 1128418 219082_at 433499 CGI-14 1128435 219109_at 6783 PF20 1128439 219118_at 438695 FKBP11 1128447 219130 at 40337 FLJ10287 1128457 219148 at 104741 TOPK 1139444 219151_s_at 355874 RABL2B 1128469 219173_at 390817 FLJ22686 1128471 219176_at 3592 FLJ22555 1139461 219191_s_at 14770 BIN2 1128494 219209_at 389539 MDA5 1139466 219210_s_at 365655 RAB8B 1128506 219226 at 416108 CRK7 1139483 219249_s_at 3849 FKBP10 1128535 219278_at 194694 MAP3K6 1128536 219279_at 21126 DOCK10 1139526 219356_s_at 415534 C9orF83 1139528 219360_s_at 31608 TRPM4 1139531 219365_s_at 145156 MGC8407 1128585 219366_at 63168 AVEN 1139542 219396_s_at 512732 NEIL1 1128615 219410_at 104800 FLJ10134 1128626 219424_at 501452 EBI3 1139552 219441_s_at 413386 LRRK1 1128648 219452 at 499331 DPEP2 1139556 219457_s_at 413374 RIN3 1128653 219461 at 21420 PAK6 1128655 219463_at 22920 C20orf103 1128660 219471_at 413071 C13orf18 1128681 219500_at 191548 CLC 1128688 219509_at 238756 MYOZ1 1139572 219511_s at 24948 SNCAIP 1128694 219517_at 171466 SELL3 1139575 219519_s_at 31869 SN 1139579 219528_s_at 57987 BCL11B 1128705 219535_at 109437 HUNK 1128710 219542_at 159146 NEK11 1128713 219545_at 17296 KCTD14 1128733 219572_at 489847 CADPS2 1128738 219581_at 335550 MGC2776 1139603 219603_s_at 145956 ZNF226 1128757 219618_at 142295 IRAK4 1128781 219648_at 79741 FLJ10116 1128786 219654_at 114062 PTPLA 1128787 219655_at 114611 C7orf10 1139623 219667_s_at 193736 BANK1 1128801 219676_at 288539 ZNF435 1128807 219686_at 58241 HSA250839 1128845 219734_at 272416 FLJ20174 1128860 219753_at 323634 STAG3 1139645 219757_s_at 134051 C14orf101 1139654 219787_s_at 293257 ECT2 1139661 219806_s_at 416456 FN5 1128900 219812 at 323634 STAG3 1128901 219813_at 487239 LATS1 1139663 219816_s_at 4997 RNPC4 1128915 219831_at 105818 CDKL3 1139669 219837_s_at 13872 C17 1128965 219901_at 170623 FGD6 1128969 219906_at 446590 FLJ10213 1129024 220005_at 13040 GPR86 1129026 220007_at 135146 FLJ13984 1129043 220028_at 23994 ACVR2B 1129049 220034_at 268552 IRAK3 1129059 220054_at 98309 IL23A 1129061 220056_at 110915 IL22RA1 1129064 220059_at 121128 BRDG1 1129071 220068_at 136713 VPREB3 1129085 220088_at 2161 C5R1 1129103 220118_at 99430 TZFP 1139767 220127_s_at 12439 FBXL12 1139774 220140_s_at 15827 SNX11 1129120 220146_at 179152 TLR7 1129151 220196_at 432676 MUC16 1139805 220230_s_at 414362 CYB5R2 1129203 220273_at 110040 IL17B 1129223 220296_at 13785 GALNT10 1129228 220302_at 148496 MAK 1129232 220307_at 157872 CD244 1129245 220322_at 211238 IL1F9 1139830 220330_s_at 221851 SAMSN1 1139831 220335_x_at 268700 FLJ21736 1129265 220351_at 310512 CCRL1 1139839 220357_s_at 62863 SGK2 1129269 220358_at 62919 SNFT 1139842 220367_s_at 133523 SAP130 1129281 220377_at 395486 C14orf110 1129310 220415_at 414091 TNNI3K 1129336 220448 at 252617 KCNK12 1129419 220565_at 278446 GPR2 1139925 220643_s_at 173438 FAIM 1129495 220684_at 272409 TBX21 1129517 220712_at 1139949 220725_x_at 528684 FLJ23558 1139950 220731_s_at 437385 FLJ10420 1129535 220737_at 368153 RPS6KA6 1139955 220740_s_at 4876 SLC12A6 1139957 220742_s_at 63657 NGLY1 1129537 220745_at 71979 IL19 1139962 220751_s_at 10235 C5orf4 1139969 220761_s_at 12040 JIK 1139971 220765_s_at 127273 LIMS2 1140007 220865_s_at 279865 TPRT 1140018 220917_s_at 438482 PWDMP 1140027 220933_s_at 12742 ZCCHC6 1140031 220937_s_at 3972 SIAT7D 1129661 220971_at 302036 IL17E 1140072 220984_s_at 199750 SLCO5A1 1140075 220987_s_at 172012 SNARK 1140088 221002_s_at 509050 DC-TM4F2 1140127 221044_s_at 125300 TRIM34 1140151 221080_s_at 236449 FAM31C 1129681 221085_at 241382 TNFSF15 1129694 221111_at 272350 IL26 1129743 221191_at 429531 DKFZP434A 0131 1140214 221215_s_at 55565 ANKRD3 1140236 221239_s_at 194976 SPAP1 1140238 221241_s_at 11962 BCL2L14 1129754 221271_at 302014 IL21 1129760 221287_at 404277 RNASEL 1129812 221355_at 248101 CHRNG 1129821 221367_at 248146 MOS 1129825 221371_at 248197 TNFSF18 1129874 221463_at 247838 CCL24 1129879 221468_at 248116 XCR1 1140344 221479_s_at 132955 BNIP3L 1129887 221485_at 107526 B4GALT5 1140370 221520_s_at 48855 CDCA8 1140378 221530_s_at 437282 BHLHB3 1129907 221539_at 406408 EIF4EBP1 1129911 221549_at 400625 GRWD1 1140391 221558_s_at 44865 LEF1 1129917 221560_at 118843 MARK4 1129923 221571_at 297660 TRAF3 1140399 221577_x_at 296638 GDF15 1140404 221584_s_at 354740 KCNMA1 1140416 221601_s_at 58831 TOSO 1129943 221626_at 512828 ZNF506 1140457 221658_s_at 210546 IL21R 1140464 221667_s_at 111676 HSPB8 1140473 221676_s_at 17377 GORO1C 1140491 221696_s_at 24979 DKFZp761P 1010 1140497 221704_s_at 77870 FLJ12750 1129967 221739_at 10927 C19orf10 1140520 221741_s_at 11747 C20orf21 1129978 221753_at 60377 SSH1 1140524 221766_s_at 10784 C6orf37 1129993 221777_at . 412981 FLJ14827 1140534 221790_s_at 184482 ARH 1130007 221796_at 439109 NTRK2 1130030 221834_at 301872 LONP 1130040 221855_at 356460 1130054 221872_at 82547 RARRES1 1140565 221875_x_at 411958 HLA-F 1140567 221881_s_at 25035 CLIC4 1140570 221891_x_at 180414 HSPA8 1140571 221893_s_at 210397 ADCK2 1130072 221898_at 468675 T1A-2 1130078 221905_at 386952 CYLD 1140574 221912_s_at 17987 MGC1203 1130088 221918_at 258536 PCTK2 1130090 221922_at 278338 GPSM2 1140584 221932_s_at 294083 C14orf87 1140589 221942_s_at 433488 CUCY1A3 1130114 221965_at 445084 MPHOSPH9 1130117 221969_at 22030 PAX5 1130121 221978_at 411958 HLA-F 1140613 221998_s_at 443330 VRK3 1140630 222033_s_at 347713 FLT1 1140632 222036_s_at 460184 MCM4 1130155 222043 at 436657 CLU 1130168 222061_at 75626 CD58 1130169 222062_at 132781 IL27RA 1130201 222126_at 278502 HRBL 1140729 222223_s_at 207224 IL1F5 1140745 222245_s_at 72222 FER1L4 1130293 222315_at 292853 1130337 222368_at 491069 1095985 222450_at 83883 TMEPAI 1095996 222482_at 288801 SSBP3 1114679 222503_s_at 16470 FLJ10904 1096028 222557_at 285753 STMN3 1114715 222565_s_at 434387 PRKCN 1096035 222569_at 105794 UGCGL1 1096038 222572_at 22265 PPM2C 1114726 222590_s_at 3532 NLK 1096054 222606 at 21331 FLJ10036 1096070 222640_at 241565 DNMT3A 1096077 222659_at 441043 IPO11 1096078 222601_at 284216 HSU84971 1114766 222666_s_at 113052 RCL1 1096085 222674 at 224137 HSPC109 1096108 222731_at 292871 ZDHHC2 1114824 222762_x_at 193370 LIMD1 1114853 222812_s_at 512618 ARHF 1096149 222824_at 410205 NUDT5 1096152 222828_at 288240 IL20RA 1096158 222838_at 132906 SLAMF7 1096163 222848_at 164018 FKSG14 1114877 222862_s_at 18268 AK5 1096172 222880_at 300642 AKT3 1096180 222890_at 11614 HSPCA065 1114893 222891 s_at 314623 BCL11A 1096182 222899_at 256297 ITCA11 1114913 222920_s_at 33187 KIAA0748 1096220 222974_at 287369 IL22 1114967 223028_s_at 7905 SNX9 1114970 223032_x_at 279529 PX19 1096248 223040_at 109253 NAT5 1096251 223044_at 409875 SLC40A1 1114977 223052_x_at 30026 HSPC182 1114981 223057_s_at 203206 XPO5 1114988 223075_s_at 4944 C9orf58 1115008 223117_s_at 441028 USP47 1115012 223122_s_at 31386 SFRP2 1096297 223141_at 9597 UCK1 1096300 223151_at 74284 MGC2714 1115034 ' 223158_s_at 387222 NEK6 1115052 223190_s_at 380021 MLL5 1115071 223218_s_at 390476 MAIL 1115073 223220_s_at 131315 BAL 1096341 223241_at 12169 SNX8 1096356 223266_at 259230 ALS2CR2 1096357 223267 at 57898 FLJ20432 1096362 223274_at 512706 TCF19 1096364 223276_at 29444 NID67 1096369 223286_at 417029 DERP6 1096378 223303_at 180535 URP2 1096379 223304_at 439590 SLC37A3 1115128 223349 _s_at 293753 BOK 1096406 223361_at 238205 C6orf115 1096429 223405_at 64896 NPL 1115160 223413_s_at 425427 LYAR 1096440 223423_at 231320 GPR160 1096442 223430_at 306864 SIK2 1096446 223434_at 92287 GBP3 1115176 223451_s_at 15159 CKLF 1096456 223454_at 82407 CXCL16 1096460 223460_at 8417 CAMKK1 1096466 223467_at 25829 RASD1 1096469 223471_at 103267 RAB3IP 1115186 223480_s_at 283734 MRPL47 1115194 223502_s_at 270737 TNFSF13B 1096499 223514_at 293867 CARD11 1096503 223522_at 21379 C9ort45 1115203 223534_s_at 414481 RPS6KL1 1096530 223565_at 409563 PACAP 1115226 223600_s_at 279718 KIAA1683 1096570 223624_at 409813 ANUBL1 1096579 223640_at 117339 HCST 1115263 223664_x_at 310922 BCL2L13 1096609 223696_at 528631 ARSD 1115271 223705_s_at 71252 DKFZp761C 169 1096615 223707_at 356342 RPL27A 1096616 223708_at 119302 C1QTNF4 1096617 223710_at 131342 CCL26 1096621 223715_at 170819 STK29 1115286 223750_s_at 120551 TLR10 1115290 223759_s_at 193666 GSG2 1115303 223787_s_at 236257 LOC51244 1115309 223804_s_at 443081 DKFZP434F 091 1096690 223827_at 334174 TNFRSF19 1096693 223834_at 443271 PDCD1LG1 1115329 223852_s_at 439658 MGC4796 1096719 223874_at 250153 ARP3BETA 1115338 223883_s_at 224355 STK31 1096738 223903_at 87968 TLR9 1115347 223909_s_at 112272 HDAC8 1096742 223910_at 114905 ERN2 1115360 223940_x_at 187199 PRO1073 1096805 224027_at 334633 CCL28 1096829 224071_at 272373 IL20 1096834 224079_at 278911 IL17C 1096877 224132_at 326732 MGC13008 1115441 224156_x_at 5470 IL17RB 1096903 224185_at 437460 FLJ10385 1096936 224262_at 306974 IL1F10 1115519 224302_s_at 408914 MRPS36 1096965 224346_at 433466 PRO1853 1115566 224369_s_at 163825 SP329 1096981 224399_at 61929 PDCD1LG2 1115587 224402_s_at 120260 IRTA1 1115589 224406_s_at 415950 IRTA2 1115591 224409_s_at 367871 SSTK 1115607 224428_s_at 435733 CDCA7 1115621 224450_s_at 437474 RIOK1 1115646 2244811_s_at 210850 HECTD1 1115668 224509_s_at 155839 RTN4IP1 1115673 224514_x_at 129959 IL17RC 1115679 224523_s_at 8345 MGC4308 1115695 224553_s_at 212680 TNFRSF18 1115696 224555_x_at 166371 IL1F7 1115704 224569_s_at 350268 IRF2BP2 1097030 224574_at 511801 1097065 224621_at 324473 MAPK1 1097096 224659_at 8518 SEPN1 1097107 224673_at 502378 LENG8 1097109 224675_at 78871 MESDC2 1097126 224694_at 274520 ANTXR1 1097143 224716_at 74335 HSPCB 1097156 224733_at 298198 CKLFSF3 1097161 224740_at 5064 1097172 224753_at 434886 CDCA5 1097177 224761_at 9691 GNA13 1097195 224785_at 149931 MGC29814 1097202 224796_at 386779 DDEF1 1097229 224830_at 446393 CPSF5 1097236 224837_at 235860 FOXP1 1115763 224839_s_at 355862 GPT2 1097247 224851 at 388761 CDK6 1097253 224859_at 77873 B7H3 1097255 224861_at 380144 1097271 224880_at 6906 RALA 1097280 224891_at 423523 1097281 224892_at 7037 PLDN 1097282 224893_at 356719 LOC283241 1097290 224903_at 151001 CIRH1A 1097297 224917_at 166254 VMP1 1097307 224929_at 379754 LOC340061 1097310 224934_at 5672 SMAP-5 1097325 224961_at 458450 LASS5 1097329 224955_at 528675 TEAD1 1097334 224960_at 71573 FLJ10074 1097359 224990_at 518723 1097365 224998_at 325825 CKLFSF4 1097371 225005_at 7299 PHF13 1097383 225019_at 111460 CAMK2D 1097388 225024_at 278839 C20orf77 1097395 225032_at 299883 FAD104 1115800 225040_s_at 282260 RPE 1097424 225067_at 7978 DKFZP434C 131 1097441 225086_at 6799 FLJ38426 1097448 225093_at 250607 UTRN 1115812 225164 at 412102 EIF2AK4 1115813 225175_s_at 105509 CTL2 1097540 225195_at 388087 1097553 225214_at 197071 PSMB7 1097561 225224_at 19221 DKFZP566G 1424 1097563 225226_at 169577 FLJ14743 1097564 225227_at 272108 SKIL 115829 225253_s_at 433213 METTL2 1097600 225272_at 10846 SAT2 1097609 225283_at 6093 ARRDC4 1097610 225284_at 6019 DNAJC3 1097611 225285_at 438993 BCAT1 1097614 225289_at . 410491 MGC16063 1115840 225308_s_at 437362 KIAA1728 1097637 225317_at 63220 ACBD6 1097665 225351_at 434241 HT011 1097676 225366 at 23363 PGM2 1097683 225373_at 132569 PP2135 1097684 225374_at 368878 MGC45714 1097704 225399_at 440663 C1orf19 1097707 225402_at 440263 C20ort64 1097717 225412_at 23317 FLJ14681 1097735 225436_at 26765 LOC58489 1097804 225519 at 446590 FLJ10213 1097814 225529_at 21446 CENTB5 1115876 225535_s_at 11866 TIMM23 1097824 225540_at 167 MAP2 1115877 225552_x_at 76239 MGC3047 1097887 225611_at 212787 KIAA0303 1097897 225622_at 266175 PAG 1097899 225624_at 145047 LOC92017 1097901 225626_at 266175 PAG 1115888 225629_s_at 35096 ZBTB4 1097902 225630_at 412318 K1AA1706 1115892 225649_s_at 100057 STK35 1097918 225650_at 140309 LOC90378 1097928 225660_at 443012 SEMA6A 1097930 225662_at 115175 ZAK 1097940 225673_at 380906 MYADM 1115895 225682_s_at 202505 RPC8 1097948 225684_at 69476 LOC348235 1097961 225699_at 25892 1097966 225704_at 127270 KIAA1545 1097976 225715_at 218017 raptor 1098012 225756 at 355669 CSNK1E 1115905 225757_s_at 301478 CLMN 1098023 225773_at 181161 KIAA1972 1098065 225817_at 10119 FLJ14957 1098069 225823_at 356626 1115916 225836_s_at 157148 MGC13204 1115917 225849_5_at 284265 C6orf83 1098095 225852_at 131059 ANKRD17 1098103 226864_at 124951 NSE2 1098145 225913_at 9587 KIAA2002 1098152 225922_at 377588 KIAA1450 1098156 225927_at 170610 MAP3K1 1098168 225943_at 22151 NLN 1098174 225949_at 274401 LOC340371 1098179 225956_at 163725 LOC153222 1098186 225964_at 288697 MGC11349 1098195 225974_at 88594 DKFZp762C 1912 1098204 225984_at 43322 PRKAA1 1098220 226002_at 80720 GAB1 1098234 226016_at 446414 CD47 1098235 226017 at 440494 CKLFSF7 1098242 22002Cat 273104 KIAA0379 1098252 226035_at 16953 USP31 1098256 226041 at 431871 SVH 1098258 226043_at 239370 GPSM1 1098268 226053 _at 110299 MAP2K7 1098271 226056 at 300670 CDGAP 1098277 226065_at 6786 PRICKLE1 1098278 226066_at 166017 MITF 1098303 226096_at 15463 FNDC5 1115953 226111_s_at 278422 ZNF385 1115955 226132 s_at 7988 FLJ31434 1098338 226136 at 269857 HRB2 1115960 226145_s_at 15420 FRAS1 1115965 226166_x_at 26996 STK36 1098405 226218 at 362807 IL7R 1098412 226225_at 409515 MCC 1098415 226230_at 130900 KIAA1387 1098433 226250_at 202577 1098447 226267_at 154095 JDP2 1098459 226279_at 25338 SPUVE 1098461 226281 at 234074 DNER 1098476 226299_at 300485 pknbeta 1098495 226318_at 443668 TBRG1 1098506 226333_at 193400 IL6R 1098521 226350_at 170129 OPN3 1098548 226377_at 436639 NFIC 1098550 226381_at 355655 1098553 226384_at 437179 HTPAP 1098574 226410_at 79077 KIAA0233 1098592 226431_at 283707 ALS2CR13 1098604 226444_at 32793 SLC39A10 1098607 226448_at 38516 MGC15887 1098611 226452_at 433611 PDK1 1098613 226454_at 388125 RENT1 1098618 226459_at 374836 PIK3AP1 1116001 226465_s_at 430541 SON 1098629 226473_at 103305 1116006 226491_x_at 172550 PTBP1 1098658 226507_at 64056 PAK1 1098668 226517_at 438993 BCAT1 1098669 226518_at 302746 KCTD10 1098678 226530_at 386140 BMF 1098683 226535_at 57664 ITGB6 1098694 226548_at 97837 1098718 226574_at 16364 PSPC1 1116022 226611_s at 433422 p30 1098771 226638_at 374446 KIAA1501 1098784 226653_at 12808 MARK1 1098809 226682_at 359394 1098821 226694_at 42322 PALM2 1098822 226695_at 443452 PRRX1 1098832 226705_at 748 FGFR1 1098840 226713_at 55098 C3orf6 1098862 226737_at 303669 MGC26694 1098865 226741_at 250905 LOC51234 1098883 226760_at 412014 MBTPS2 1098893 226771_at 43577 ATP8B2 1098898 226777_at 8850 ADAM12 1098909 226789_at 446408 1098918 226799_at 170623 FGD6 1098927 226811_at 356216 FLJ20202 1116045 226828_s_at 23823 HEYL 1098946 226834_at 135121 ASAM 1098951 226840_at 75258 H2AFY 1098952 226841_at 62264 KIAA0937 1098954 226844_at 128905 MOBKL2B 1098962 226853_at 20137 BMP2K 1098978 226869_at 124863 1098987 226879_at 412559 FLJ21127 1098991 226884_at 126085 LRRN1 1116056 226913_s_at 243678 SOX8 1099028 226930_at 334838 FNDC1 1099032 226936_at 35962 1099040 226944_at 390421 HTRA3 1116063 226957_x_at 75447 RALBP1- 1099053 226959_at 376041 1099058 226964_at 425116 1099072 226979_at 28827 MAP3K2 1099088 226996_at 14355 1099105 227013_at 78960 LATS2 1099112 227020_at 368672 1099120 227030_at 371680 1099124 227034_at 355455 09/10/2004 1099128 227039_at 350631 AKAP13 1099135 227046_at 3402 SLC39A11 1099140 227052_at 500350 1099148 227060_at 434975 TNFRSF19L 1099150 227062_at 240443 1099152 227064_at 351247 MGC15396 1099154 227066_at 97927 MOBKL2C 1116071 227067_x_at 502564 FLJ20719 1099167 227080_at 381105 MGC45731 1116073 227103_s_at 146161 MGC2408 1099204 227121_at 193784 1116085 227173_s_at 88414 BACH2 1099265 227193_at 375762 1099291 227222_at 130774 FBXO10 1099292 227223_at 282901 RNPC2 1099299 227232_at 241471 EVL 1099318 227255_at 29911 LOC149420 1099328 227267_at 432726 FLJ35779 1099332 227272_at 32433 1099358 227300_at 93135 1116103 227308_x_at 289019 LTBP3 1099377 227324_at 130712 ADCK4 1099388 227336_at 124024 DTX1 1099396 227346 at 435949 ZNFN1A1 1099403 227354 at 266175 PAG 1099418 227370_at 172792 KIAA1946 1099444 227407_at 434489 FLJ90013 1116122 227408_s_at 42768 DKFZp761O 0113 1116126 227432 s at 438669 INSR 1099510 227482_at 15251 ADCK1 1099526 227502_at 521240 LCHN 1099539 227520_at 201624 CXorf15 1099549 227533_at 446665 1099563 227550_at 388347 1099598 227590_at 511859 1116150 227606_s_at 16229 AMSH-LP 1099631 227624_at 367639 FLJ20032 1099633 227627_at 380877 SGKL 1099651 227646_at 120785 EBF 1099669 227666_at 45057 MGC45428 1099680 227677_at 210387 JAK3 1099686 227684_at 117721 1099699 227697_at 436943 SOCS3 1099711 227713_at 243596 1099734 227740_at 127310 KIS 1099743 227750_at 162189 TRAD 1099748 227755_at 356481 1099760 227767_at 129206 CSNK1G3 1099798 227811_at 411081 FGD3 1099826 227842_at 445862 RAB30 1099830 227847_at 28020 EPM2AIP1 1099847 227867_at 36723 LOC129293 1099857 227877_at 119768 1116181 227891_s_at 402752 TAF15 1099886 227917 at 511708 1099900 227934_at 444508 1099939 227983_at 488173 MGC7036 1099951 227999_at 157728 LOC170394 1099953 228001_at 433668 C21orf4 1099960 228008_at 144583 1099965 228014_at 71962 LOC138428 1099978 228035_at 148135 STK33 1116219 228056_s_at 322854 NAP1L 1099995 228057 at 107515 DDIT4L 1100005 228069_at 121536 DUFD1 1100027 228094_at 16291 AMICA 1100040 228109_at 410953 RASGRF2 1100042 228113_at 351413 RAB37 1116233 228128_x at 440769 PAPPA 1100054 228130_at 125353 1100060 228139_at 268551 RIPK3 1100071 228153_at 432653 IBRDC2 1100130 228224_at 76494 PRELP 1100136 228231_at 413078 NUDT1 1100138 228234_at 278391 TIRP 1100144 228240_at 436379 1100150 228248_at 9343 MGC39830 1100159 228258_at 32156 RPS6KB2 1100161 228261_at 135805 LOC142678 1100171 228273_at 528654 FLJ11029 1100183 228286_at 180582 FLJ40869 1100249 228367_at 388674 HAK 1100258 228377_at 88442 KIAA1384 1100263 228382_at 406335 LOC90268 1116277 228384_s_at 118210 C10orf33 1100288 228411_at 26981 ALS2CR19 1100290 228414_at 4241 1100301 228426_at 356250 LLT1. 1100311 228437_at 445890 HSPC163 1100335 228464_at 268474 1100339 228468_at 276905 MASTL 1100384 228524_at 283374 ADCK5 1100405 228549_at 119387 KIAA0792 1100420 228565_at 50883 KIAA1804 1100423 228568_at 50841 FLJ30973 1100433 228580_at 390421 HTRA3 1100443 228592_at 438040 MS4A1 1100496 228654_at 111496 LOC139886 1116317 228661_s_at 526415 1100538 228709_at 432458 PRG4 1100561 228736_at 194109 HEL308 1100562 228737_at 26608 C20orf100 1100581 228758_at 155024 BCL6 1100585 228762_at 159142 LFNG 1100591 228769_at 388162 HKR2 1100598 228776_at 531058 1100609 228788_at 447045 PPIL2 1100625 228806_at 232803 1100721 228918_at 18713 1100750 228955_at 280387 1100753 228958_at 512717 ZNF19 1100770 228976_at 65578 1100847 229070_at 97411 C6orf105 1100849 2290T2_at 184430 1100851 229074_at 55058 EHD4 1100871 229101_at 48353 1100873 229103_at 445884 1100879 229111_at 119983 MASP2 1100904 229145_at 426296 LOC119504 1100911 229152_at 320147 C4orf7 1100916 229158_at 105448 PRKWNK4 1100977 229233_at 444783 NRG3 1100995 229256_at 26612 PGM2L1 1101004 229265_at 2969 SKI 1101023 229288_at 73962 EPHA7 1101054 229322_at 173328 PPP2R5E 1116432 229356_x_at 409362 KIAA1259 1101096 229373_at 527236 1101119 229401_at 390823 IL17RE 1101128 229411 at 436667 MGC45419 1116445 229436_x_at 301927 C6.1A 1101149 229437_at 517226 BIC 1101211 229513_at 287659 STROP 1101272 229584_at 179089 DKFZp434H 2111 1101276 229588_at 1098 ERdj5 1101291 229606_at 272458 PPP3CA 1101295 229610_at 99807 FLJ40629 1101305 229623_at 112742 1101322 229645_at 227699 1101354 229686_at 111377 P2RY8 1101416 229764_at 338851 FLJ41238 1101430 229779_at 418040 1101439 229790_at 63335 TERF2 1101477 229838_at 423095 NUCB2 1101478 229839_at 146246 MGC45780 1101514 229886_at 88801 FLJ32363 1101566 229947_at 98558 1101582 229967_at 195685 CKLFSF2 1101586 229971_at 187884 GPR114 1101628 230021 at 441708 MGC45866 1101634 230028_at 510588 1101687 230086_at 440808 FNBP1 1101708 230110_at 459526 MCOLN2 1101758 230170_at 248156 OSM 1101775 230191_at 343820 TTBK1 1101777 230193_at 359981 MGC33630 1101829 230252_at 155538 GPR92 1101892 230327_at 225948 1116593 230329_s_at 422889 NUDT6 1101905 230345_at 170843 1101944 230391_at 439064 1101948 230395_at 14411 1101974 230425_at 272311 EPHB1 1102027 230489_at 58685 CD5 1102030 230494_at 110855 SLC20A1 1102081 230551_at 506977 1102165 230650_at 152460 1102193 230680_at 22668 1102282 230788_at 934 GCNT2 1116666 230803_s_at 442801 DKFZP564B 1162 1102350 230864_at 25845 MGC42105 1116676 230894_s_at 185084 MSI2 1102408 230934 at 306327 RAB3GAP 1102415 230942_at 99272 CKLFSF5 1102437 230966_at 437023 IL4I1 1102470 231007_at 292915 1102471 231008 at 158357 UNC5CL 1102479 231017_at 301772 STK11 1102537 231087_at 202151 1102540 231093_at 434881 FCRH3 1116715 231149_s_at 123427 FLJ20574 1102633 231198_at 511124 1102652 231219_at 343717 CKLFSF1 1102654 231221_at 380599 KIAA0350 1102725 231303_at 234016 C21orf42 1102744 231324_at 198671 1102821 231412_at 202024 1102859 231455_at 446195 1102885 231481_at 130310 CCNB3 1102898 231496 at 145519 FKSG87 1102912 231514_at 194610 MGC15882. 1103054 231690_at 341531 1103107 231759_at 247978 TAL2 1103111 231763_at 436896 RPC155 1103120 231775_at 401745 TNFRSF10A 1103124 231779_at 424542 IRAK2 1103134 231792_at 86092 MYLK2 1103137 231796_at 283613 EPHA8 1103139 231798_at 248201 NOG 1116826 231823_s_at 26204 KIAA1295 1116829 231840_x_at 115467 LOC90624 1103224 231906_at 301963 HOXD8 1116844 231920_s_at 405789 CSNK1G1 1103264 231954_at 142307 DKFZP43410 714 1103272 231964_at 137206 1103284 231978_at 186655 TPCN2 1116854 231992_x_at 438623 1103303 232000 at 49605 C9orf52 1103304 232001_at 46919 1116863 232068_s_at 174312 TLR4 1103390 232103_at 271752 BPNT1 1103398 232112_at 220745 FLJ10244 1103420 232138_at 372571 MBNL2 1116879 232160_s_at 325630 TNIP2 1103475 232204_at 120785 EBF 1103497 232231_at 50115 1103504 232239_at 142517 1103540 232282_at 92423 PRKWNK3 1103639 232399_at 388304 KIAA1765 1103711 232478_at 288718 1103766 232546_at 192132 TP73 1103855 232645_at 259625 LOC153684 1103858 232648_at 246240 PSMA3 1116958 232693_s_at 27410 PBF 1103921 232724_at 371612 MS4A6A 1103932 232741_at 31330 1116966 232744_x_at 301124 1103982 23279_at 142926 MGC26226 1104072 232906_at 287429 1104175 233029_at 287383 KIAA1639 1104195 233052_at 172101 DNAH8 1117023 233110_s_at 289052 BCL2L12 1104254 233121_at 492700 1104373 233271 at 1104545 233476_at 254477 1104552 233483_at 193857 LOC96597 1104840 233867_at 482250 1104870 233916_at 210958 KIAA1486 1117211 233955_x_at 356509 HSPC195 1104905 233964_at 13453 FLJ14753 1104910 233969_at 458262 IGL@ 1105001 234088 at 527386 1117245 234107_s_at 527974 HARS2 1105178 234284_at 283961 GNG8 1117278 234312_s_at 14779 ACAS2 1117298 234366_x_at 449586 1105248 234403_at 1117343 234643_x_at 306812 BUCS1 1117350 234672_s_at 435982 FLJ10407 1117373 234725_s_at 416077 SEMA4B 1117394 234792_x_at 1117403 234863_x_at 272027 FBXO5 1105668 234954_at 1105684 234973 at 195155 SLC38A5 1105728 235022_at 13034 MGC24180 1105732 235026_at 396626 FLJ32549 1105751 235046_at 176376 1105759 235056_at 171262 ETV6 1105798 235099_at 154986 CKLFSF8 1105814 235117_at 105223 1105832 235136_at 306777 GSDML 1105838 235142_at 129837 ZBTB8 1105842 235146_at 173392 KIAA1145 1105854 235158_at 267245 FLJ14803 1105866 235170_at 9521 ZNF92 1105900 235211_at 525015 1105915 235229_at 332649 1105935 235251_at 444290 1105936 235252 at 276238 KSR 1105959 235278_at 399982 1105986 235310 at 49614 GCET2 1106013 235341_at 6019 DNAJC3 1106015 235343_at 96885 FLJ12505 1106025 235353_at 49500 KIAA0746 1106030 235359_at 162185 UNQ3030 1106043 235372_at 266331 FREB 1106053 235383_at 154578 MYO7B 1106088 235421 at 499235 1106110 235444_at 235860 FOXP1 1106124 235458_at 155111 HAVCR2 1106126 235460_at 434937 PPIB 1106159 235496 at 208081 1106196 235536_at 142074 1106204 235545_at 445098 SDP35 1106230 235572_at 381225 Spc24 1106279 235626_at 130065 CAMK1D 1106306 235657 at 14204 1106317 235668_at 381140 PRDM1 1106323 235674_at 442690 1106394 235750_at 126932 1106401 235758_at 11849 MGC15827 1106415 235774_at 169071 1117517 235816_s_at 148656 Rgr 1106478 235843_at 119898 1106522 235890_at 31903 1106589 235965_at 22627 MIST1 1106722 236109_at 150458 FLJ14494 1106781 236172_at 445013 LTB4R 110685 236255_at 455101 KIAA1909 1117555 236295_s_at 128357 NOD3 1106908 236313 at 72901 CDKN2B 1106935 236341_at 247824 CTLA4 1106990 236401_at 369561 1107044 236458_at 163426 1107076 236491_at 283672 BCL2L10 1107124 236543_at 130203 1107190 236614_at 50601 MGC10986 1107197 236621_at 40838 1107329 236761_at 439124 LHFPL3 1107348 236782_at 440508 SAMD3 1107369 236805_at 512466 1107457 236901at 120330 ADAMTS2 1117599 236918_s_at 120277 MGC27085 1107527 236981_at 14706 1107575 237033_at 424589 MGC52498 1107637 237104_at 1107762 237244_at 58597 1107838 237322_at 355618 1117644 237451_x_at 34174 1107997 237493_at 126891 IL22RA2 1108088 237591_at 441601 1108200 237710_at 156135 1108237 237753_at 126232 1108323 237849_at 526982 1108347 237880_at 121476 1108467 238018_at 346333 LOC285016 1108473 238025_at 119878 FLJ34389 1108515 238071_at 98132 LCN6 1108745 238323_at 528776 TEAD2 1117747 238365_s_at 158272 1108776 238376_at 513346 1108910 238536_at 351848 1108925 238552_at 136102 KIAA0853 1108961 238593_at 292088 FLJ22531 1108970 238604_at 140489 1108988 238624 at 3532 NLK 1117800 238701_x_at 125166 1109058 238706_at 220277 FLJ38499 1109107 238759_at 292925 KIAA1212 1109188 238846_at 204044 TNFRSF11A 1109195 238853_at 416155 1109210 238870_at 117010 KCNK9 1109220 238880_at 445977 GTF3A 1109505 239186_at 8162 MGC39372 1109519 239201_at 348711 ALS2CR7 1117835 239205_s_at 89688 CR1L 1109630 239214 at 1232444 1109545 239231_at 63187 1109557 239243_at 444548 NP220 1109560 239246_at 207428 FARP1 1109603 239292_at 1109732 239427_at 374124 1109756 239453_at 530304 1117853 239479_x_at 268724 1109827 239533 _at 127196 GPR155 1109913 239629_at 355724 CFLAR 1110019 239744_at 1110070 239803_at 1110099 239835_at 116665 TA-KRP 1110198 239946_at 189046 1110214 239964_at 144519 TCL6 1110223 239973_at 212709 1110284 240038_at 192221 ELL2 1110309 240066_at 105623 1110313 240070_at 421750 FLJ39873 1110486 240260_at 445054 1110608 240392_at 306227 CARD14 1110610 240394_at 436906 1110740 240538_at 416810 1110852 240661_at 196026 1110871 240681_at 431753 1117977 240854_x_at 1111070 240899_at 202201 1111478 241357_at 133017 ERK8 1111486 241365_at 33024 1111494 241373_at 75432 IMPDH2 1111503 241383_at 502910 KBRAS2 1111694 241592_at 157302 1111807 241751_at 6483 OFD1 1111946 241928_at 280881 1112019 242013_at 196484 1118148 242020_s_at 302123 ZBP1 1112052 242052_at 525361 1112061 242064_at 43410 1112256 242293 at 143198 ING3 1112344 242406_at 163242 1118228 242520_s_at 173679 1112510 242595_at 314432 C14orf20 1112521 242611_at 244818 1112552 242650_at 89029 1112674 242794_at 310320 MAML3 1112689 242814_at 104879 SERPINB9 1118286 242866_x_at 147381 1112762 242901_at 208179 1112764 242903 at 180866 IFNGR1 1112837 242994_at 4099 NRD1 1112849 243006_at 208965 1112871 243030_at 269493 1112935 243099_at 436677 NFAM1 1112981 243154_at 86650 1113020 243198_at 373484 LOC161577 1118347 243366_s at 528404 ITGA4 1113263 243467_at 435736 1113435 243659_at 100636 1113488 243717_at 129435 1113500 243729_at 165900 1113545 243780_at 435736 1113555 243791_at 291993 1113589 243829_at 162967 BRAF 1118414 243968_x_at 415473 FCRH1 1113730 243993_at 293771 1113769 244035_at 46996 1113783 244052_at 71616 FLJ14431 1113930 244214_at 24725 MGC35521 1113972 244261_at 386334 IL28RA 1113993 244286_at 131811 1114017 244313_at 133255 1114064 244364_at 148228 MYO3A 1114109 244413_at 203041 DCAL1 1114162 244467_at 526942 1114351 244677_at 445534 PER1 1114503 244845_at 170577 1114543 244887_at 156189 1118612 32625_at 438864 1118621 33307_at 239934 1130354 33323_r_at 184510 SFN 1118659 35617_at 150136 1118681 36711_at 460889 1118684 36830_at 68583 MIPEP 1118708 37408 at 7835 MRC2 1118736 38340_at 96731 HIP1R 1118772 40420_at 16134 STK10 1130378 44783_s_at 234434 HEY1 1118835 47069_at 102336 ARHGAP8 1118861 49878 at 100915 PEX16 1130387 50314_i_at 274422 C20orf27 1130393 58780_s_at 22451 FLJ10357 1118939 60528_at 198161 PLA2G4B 1118573 632_at 435970 GSK3A 1118949 64064_at 412331 IAN4L1 1118963 65472 at 370214 1130400 74694 s_at 170253 FRA 1140788 AFFX-DapX-3_at 1140834 AFFX-HSAC07/X00351_3_at 426930 ACTB 1140835 AFFX-HSA007/X00351_5_at 426930 ACTB 1140836 AFFX-HSAC07/X00361_M_at 426930 ACTB 1140842 AFFX- HUMGAPDH/M33197_3_at 169476 GAPD 1140843 AFFX- HUMGAPDH/M33197_5_at 169476 GAPD 1140844 AFFX-HUMGAPDH/M33197_M_at 169476 GAPD 1140845 AFFX- HUMISGF3A/M97935_3_at 21486 STAT1 1140848 AFFX- HUMISGF3A/M97935_5_at 21486 STAT1 1140847 AFFX- HUMISGF3A/M97935_MA_at 21486 STAT1 1140848 AFFX- HUMISGF3AlM97935_MB_at 21486 STAT1 1140837 AFFX-HUMRGE/M10098_3_at 1140838 AFFX-HUMRGE/M10098_5_at 1140839 AFFX-HUMRGE/M10098_M_at 1140791 AFFX-LysX-3_at 1140792 AFFX-LysX-5_at 1140793 AFFX-LysX-M_at 1140806 AFFX-M27830_3_at 1140807 AFFX-M278305_at 1140808 AFFX-M27830 M_at 1140794 AFFX-PheX-3_at 1140795 AFFX-PheX-5_at 1140796 AFFX-PheX-M_at 1140797 AFFX-ThrX-3_at 1140798 AFFX-ThrX-5_at 1140799 AFFX-ThrX-M_at 1140802 AFFX-TrpnX-3_at 1140803 AFFX-TrpnX-5_at 1140804 AFFX-TrpnX-M_at 1140805 AFFX-hum alu_at 1140809 AFFX-r2-Bs-dap-3_at 1140810 AFFX-r2-Bs-dap-5_at 1140811 AFFX-r2-Bs-dap-M_at 1140812 AFFX-r2-Bs-lys-3_at 1140813 AFFX-r2-Bs-lys-5_at 1140814 AFFX-r2-Bs-lys-M_at 1140815 AFFX-r2-Bs-phe-3_at 1140816 AFFX-r2-Bs-phe-5_at 1140817 AFFX-r2-Bs-phe-M_at 1140827 AFFX-r2-Bs-thr-3-s_at 1140828 AFFX-r2-Bs-thr-5_s_at 1140829 AFFX-r2-Bs-thr-M_s_at 1140820 AFFX-r2-Ec-bloB-3_at 1140821 AFFX-r2-Ec-bloB-5_at 1140822 AFFX-r2-Ec-bloB-M at 1140823 AFFX-r2-Ec-bloC-3_at 1140824 AFFX-r2-Ec-bloC-5 at 1140825 AFFX-r2-Ec-bloD-3_at 1140826 AFFX-r2-Ec-bloD-5_at 1140818 AFFX-r2-P1-cre-3_at 1140819 AFFX-r2-P1-cre-5_at 1529284 Lymph_Dx_001_at 409515 MCC 1529285 Lymph_Dx_002_at 348929 KIAA1219 1529286 Lymph Dx_003_at 167700 MADH5 1529287 Lymph_Dx_004_s_at 212787 KIAA0303 1529288 Lymph_Dx_005 at 13291 CCNG2 1529443 Lymph_Dx_006_at 88886 1529289 Lymph_Dx 007_at 96557 1529290 Lymph_Dx_008_at 101761 N4BP3 1529291 Lymph_Dx 009_at 104450 1529292 Lymph_Dx_010 at 1529293 Lymph_Dx 011_at 113117 1529294 Lymph_Dx_011_s_at 113117 1529295 Lymph Dx_012_at 116441 1529296 Lymph_Dx__013_at 122428 1529444 Lymph_Dx_14_at 126905 1529297 Lymph_Dx_015_at 132335 1529298 Lymph_Dx_016_at 136707 1529299 Lymph_Dx_017_at 444290 1529300 Lymph_Dx_018_at 449608 1529301 Lymph_Dx_019_at 1529445 Lymph_Dx_020_at 1529302 Lymph_Dx_021_at 67928 ELF3 1529303 LymphDx_022_at 1529304 Lymph_Dx_022_s_at 1529305 Lymph_Dx_023_at 173957 1529306 Lymph_Dx_024_at 190043 MGC26706 1529446 Lymph_Dx_025_at 190626 1529307 Lymph_Dx_026_at 435736 1529308 Lymph_Dx_027_x_at 193014 1529309 Lymph_Dx_028_at 512797 HSH2 1529310 Lymph Dx_529_x_at 3136 PRKAG1 1529311 Lymph_Dx_030_at 251214 1529312 Lymph_Dx_031_s_at 255809 1529313 Lymph_Dx 032_at 271998 1529314 Lymph_Dx_033_at 1529315 Lymph_Dx_034_at 530912 1529316 Lymph Dx_035_at 315241 ZNF198 1529447 Lymph_Dx_036_at 291886 1529317 Lymph_Dx_037_at 1529318 Lymph_Dx_038_at 291954 1529319 Lymph_Dx_039_at 103329 KIAA0970 1529320 Lymph_Dx_040_at 309149 1529321 Lymph_Dx_041_s_at 411311 IL24 1529322 Lymph_Dx_042_x_at 514291 1529323 Lym_ph_Dx_043_at 1529324 Lymph_Dx_044_at 348264 GZMH 1529325 Lymph_Dx_045_at 1529326 Lymph_Dx_046_s_at 200063 HDAC7A 1529327 Lymph_Dx_047_s_at 288986 SMN2 1529328 Lymph_Dx_048_s_at 369056 1529448 Lymph_Dx_049_at 369101 1529329 Lymph_Dx_049_s_at 369101 1529330 Lymph D_050_at 259625 LOC153684 1529331 Lymph_Dx_051_s_at 374126 1529332 Lymph_Dx_052_at 140443 LOC134492 1529333 Lymph_Dx_053_at 378849 1529334 Lymph_Dx_054_at 529494 1529335 1ymph_Dx_055_s at 400872 1529336 Lymph_Dx_056_at 406474 PTK2B 1529337 Lymph_Dx_057_at 201864 C6orf166 1529338 Lymph Dx 058_s_at 284275 PAK2 1529339 Lymph_Dx_059_s_at 1529449 Lymph_Dx_060_s_at 1529340 Lymph_Dx_061_at 1529341 Lymph_Dx_062_at 153563 LY75 1529342 Lymph Dx_063_at 1529343 Lymph Dx 064 at 521948 1529344 Lymph_Dx_065_at 317970 SERPINA1 1529450 Lymph_Dx_066_at 1529345 Lymph_Dx_067_s_at 443475 1529346 Lymph_Dx_068_at 443935 1529347 Lymph_Dx_06a_at 444019 1529348 Lymph_Dx 070_s_at 326392 SOS1 1529349 Lymph_Dx_071_at 445500 1529451 Lymph_Dx_072_at 396853 JMY 1529350 Lymph_Dx_073_at 445884 1529351 Lymph_Dx_074_s_at 445898 1529352 Lymph_Dx_075_at 446195 1529353 Lymph_Dx_076_at 446198 1529354 Lymph_Dx_077_at 314623 BCL11A 1529452 Lymph_Dx_078_at 422550 AIM1 1529355 Lymph_Dx_079 at 370675 1529356 Lymph_Dx_080_at 303775 C14orf170 1529357 Lymph_Dx_081_at 444651 1529358 Lymph_Dx_082_at 127178 1529359 Lymph_Dx_083_at 1529360 Lymph_Dx_084_at 443036 1529453 Lymph_Dx_085_at 372679 FCGR3A 1529361 Lymph_Dx_086_s_at 388681 HDAC3 1529362 Lymph_Dx_087_at 329989 PLK1 1529363 Lymph_Dx_088_at 311559 NOTCH1 1529364 Lymph_Dx_089_at 526394 ATM 1529365 Lymph_Dx_090_at 344088 TNFRSF13C 1529366 Lymph_Dx_091_at 1529367 Lymph_Dx_092_at 1529368 Lymph_Dx_093_at 1529369 Lymph_Dx_095_at 1529370 Lymph_Dx_096_at 1529371 Lymph_Dx_097_at 1529372 Lymph_Dx_098_at 1529373 Lymph_Dx_099_at 1529374 Lymph_Dx_100_at 1529454 Lymph_Dx_101_at 1529375 Lymph Dx_102_at 1529376 Lymph_Dx_103_at 1529377 Lymph_Dx_104_at 1529378 Lymph_Dx_105_at 1529455 Lymph_Dx_107_at 1529379 Lymph Dx_108_at 1529380 Lymph_Dx_109_at 1529381 Lymph Dx_110_at 1529382 Lymph_Dx_111_at 371468 CCND1 1529383 Lymph_Dx_112_at 371468 CCND1 1529456 Lymph_Dx_113_at 371468 CCND1 1529384 Lymph Dx_114_at 371468 CCND1 1529385 Lymph_Dx_115_at 371468 CCND1 1529386 Lymph_Dx_116_at 371468 CCND1 1529387 Lymph_Dx_117_at 79241 BCL2 1529388 Lymph_Dx_118_at 79241 BCL2 1529389 Lymph_Dx_119_at 79241 BCL2 1529390 Lymph Dx 120 at 79241 BCL2 1529391 Lymph_Dx_121_at 79241 BCL2 1529392 Lymph_Dx_122_at 352338 ACVR1C 1529393 Lymph_Dx_123_s_at 182081 KIAA1811 1529394 Lymph_Dx_124_s_at 339846 LOC91807 1529395 Lymph_Dx_125_at 403201 1529396 Lymph_Dx_126_at 512897 MGC33182 1529397 Lymph_Dx_127_s_at 406557 CLK4 1529398 Lymph_Dx_128_at 293590 HSMDPKIN 1529399 Lymph_Dx_129_at 256916 LOC203806 1529457 Lymph_Dx_130_at 351818 GRK7 1529400 Lymph_Dx_131_s_at 210697 HIPK4 1529401 Lymph_Dx_132_at 399752 MAP4K3 1529402 Lymp_Dx_133_at 375836 KSR2 1529403 Lymph_Dx_134_s_at 511780 LMTK3 1529404 Lymph_Dx_135_at 170610 MAP3K1 1529405 Lymph_Dx_136_s_at 227489 SAST 1529406 Lymph_Dx_137_s_at 409066 MYO3B 1529458 Lymph_Dx_138_at 448468 NEW8 1529407 Lymph_Dx_139_s_at 284275 PAK2 1529408 Lymph_Dx_141_at 336929 PSKH2 1529409 Lymph_Dx_142_s_at 351173 FLJ25006 1529410 Lymph_Dx_143_s_at 380991 SNF1LK 1529411 Lymph_Dx_144_at 80181 APEG1 1529459 Lymph_Dx_145_at 411061 SRMS 1529412 Lymph_Dx_146_at 512763 STK22C 1529413 Lymph_Dx_147_at 232116 PRKWNK2 1529414 Lymph_Dx_148_s_at 352370 MGC22688 1529415 Lymph_Dx_149_at 369523 DKFZp686A 17109 1529416 Lymph_Dx_150_s_at 421349 CDKN2A 1529417 Lymph_Dx_151_at 421349 CDKN2A 1529418 Lymph_Dx_152_at 421349 CDKN2A 1529419 Lymph_Dx_153_s_at 104182 1529420 Lymph_Dx_154_at 272295 IL17F 1529421 Lymph_Dx_156_at 375043 IL27 1529422 Lymph_Dx_157_s_at 375184 IL23R 1529423 Lymph_Dx_158_at 381264 ITGAD 1529424 Lymph_Dx_159_s_at 512683 CCL3L1 1529425 Lymph_Dx_160 at 406228 IL9R 1529426 Lymph_Dx_162_at 406744 IL28B 1529427 Lymph Dx_163_at 406745 IL29 1529428 Lymph_Dx_164_at 415768 NGFR 1529429 Lymph_Dx_165_at 434103 IL17D 1529430 Lymph_Dx_166_at 444484 SPHK2 1529431 Lymph_Dx_167_at 1529432 Lymph_Dx_168_at 1529433 Lymph_Dx_168_x_at 1529434 Lymph_Dx_171 at 103995 FLJ27099 1529435 Lymph_Dx_172_s_at 1529436 Lymph_Dx_174_at 1529437 Lymph_Dx_175_at 445162 BTLA - 1. Alizadeh, A.A., et al. 1998. Probing lymphocyte biology by genomic-scale gene expression analysis. J Clin Immunol 18:373-79.
- 2. Alizadeh, A.A., et al. 1999. The Lymphochip: a specialized cDNA microarray for the genomic-scale analysis of gene expression in normal and malignant lymphocytes. Cold Spring Harbor Symp Quant Biol 64:71-78.
- 3. Alizadeh, A.A., et al. 2000. Distinct types of diffuse large B-cell lymphoma identified by gene expression profiling. Nature 403:503-511.
- 4.1 Alon, U., et al. 1999. Broad patterns of gene expression revealed by clustering analysis of tumor and normal colon tissues probed by oligonucleotide arrays. Proc Natl Acad Sci USA 96:6745-6750.
- 5. Bayes, T. 1763. An essay towards solving a problem in the doctrine of chances. Phil Trans Roy Soc London 53:370.
- 6. Chee, M., et al. 1996. Accessing genetic information with high density DNA arrays. Science 274:610-14.
- 7. Cho, R.J., et al. 1998. A genome-wide transcriptional analysis of the mitotic cell cycle. Mol Cell 2:65-73.
- 8. Chu, S., et al. 1998. The transcriptional program of sporulation in budding yeast. Science 282:699-705.
- 9. Copie-Bergman, C., et al. 2002. MAL expression in lymphoid cells: further evidence for MAL as a distinct molecular marker of primary mediastinal large B-coll lymphomas. Mod Pathol 15:1172-1180.
- 10. Copie-Bergman, C., et al. 2003. Interleukin 4-induced .
- 11. DeRisi, J., et al. 1996. Use of a cDNA microarray to analyze gene expression patterns in human cancer, Nat Genet 14:457-60.
- 12. DeRisi, J.L, lyer, V.R., Brown, P.O. 1997, Exploring the metabolic and genetic control of gene expression on a genomic scale. Science 278:680-86.
- 13. Drapner, H. 1966. Applied regression. Wiley, New York.
- 14. Dudolt, S., Fridlyand, J., Speed, T.P. 2002. Comparison of discrimination methods for the classification of tumors using gene expression data. J Am Stat Assoc 97:77-87.
- 15. Eisen, M.B., Spellman, P.T., Brown, P.O., Botstein, D, 1998. Cluster analysis and display of genome-wide expression patterns. Proc Natl Acad Sci USA 95:14863-14868.
- 16. Fisher, R.I., et al. 1993. Comparison of a standard regimen (CHOP) with three intensive chemotherapy regimens for advanced non-Hodgkin's lymphoma. N Engl J Med 328:1002-1006.
- 17. Furey, T.S., et al. 2000. Support vector machine classification and validation of cancer tissue samples using microarray expression data. Bioinformatics 16:906-914.
- 18. Golub, T.R., et al. 1999. Molecular classification of cancer: class discovery and class prediction by gene expression monitoring, Science 286:531-537.
- 19. Gress, T.M., et al, 1996. A pancreatic cancer-specific expression profile. Oncogene 13:1819-30.
- 20. Harris, N.L., et al. 1994. A revised European-American classification of lymphoid neoplasms: a proposal from the International Lymphoma Study Group. Blood 84:1361-1392.
- 21. Heller, R.A., et al. 1997. Discovery and analysis of inflammatory disease-related genes using cDNA microarrays. Proc Natl Acad Sci USA 94:2150-55.
- 22. Holstege, F.C., et al. 1998. Dissecting the regulatory circuitry of a eukaryotic genome. Cell 95:717-728.
- 23.Irizarry, R.A., et al. 2003. Exploration, normalization, and summaries of high density oligonucleotide array probe level data. Biostatistics 4:249-264.
- 24. Hills, M. 1966. Allocation rules and error rates. J Royal Statis Soc Series B 28:1-31.
- 25. Jaffe, E.S., Harris, N.L., Stein, H., Vardiman, J.W. 2001. Tumors of hematopoietic and lymphoid tissues. IARC Press, Lyon.
- 26. Khouri, I.F., et al. 1998. Hyper-CVAD and high-dose methotrexate/cytarabine followed by stem-cell transplantation: an active regimen for aggressive mantle-cell lymphoma. J Clin Oncol 12:3803-3809.
- 27. Kohonen, T. 1997. Self-organizing maps. Springer Press, Berlin.
- 28. Lashkari, D.A., et al. 1997. Yeast microarrays for genome wide parallel genetic and gene expression analysis. Proc Natl Acad Sci USA 94:13057-62.
- 29. Li, C., Wong, W.H. 2001. Model-based analysis of oligonucleotide arrays: expression index computation and outlier detection. Proc Natl Acad Sci USA 98:31-36.
- 30. Lipshutz, R.J., et al. 1995. Using oligonucleotide probe arrays to access genetic diversity. Biotechniques 19:442-47.
- 31. Lockhart, D.J., et al. 1996. Expression monitoring by hybridization to high-density oligonucleotide arrays, Nat Biotechnol 14:1675-80.
- 32. Pease, A.C., et al. 1994, Light generated oligonucleotide arrays for rapid DNA sequence analysis. Proc Natl Acad Sci USA 91:5022-26.
- 33. Pietu, G., et al. 1996. Novel gene transcripts preferentially expressed in human muscles revealed by quantitative hybridization of a high density cDNA array. Genome Res 6:492-503.
- 34. Radmacher, M.D., McShane, L.M., Simon, R. 2002. A paradigm for class prediction using gene expression profiles. J Comput Biol 9:505-511.
- 35. Ramaswamy, S., et al. 2001, Multiclass cancer diagnosis using tumor gene expression signatures. Proc Natl Acad Sci USA 98:15149-15154.
- 36. Ransohoff, D.F. 2004. Rules of evidence for cancer molecular-marker discovery and validation, Nat Rev Cancer 4:309-314.
- 37. Rosenwald, A., et al. 2002. The use of molecular profiling to predict survival after chemotherapy for diffuse large-B-cell lymphoma. New Engl J Med 346:1937-1947,
- 38. Rosenwald, A., et al. 2003. The proliferation gene expression signature is a quantitative integrator of oncogenic events that predicts survival in mantle cell lymphoma. Cancer Cell 3:185-197.
- 39. Schena, M., Shalon, D., Davis, R.W., Brown, P.O. 1995. Quantitative monitoring of gene expression patterns with a complementary DNA microarray. Science 270:467-70.
- 40. Schena, M., et al. 1996. Parallel human genome analysis: microarray based expression monitoring of 1000 genes. Proc Natl Acad Sci USA 93:10614-19.
- 41. Shaffer, A.L., et al. 2001. Signatures of the Immune response. Immunity 15:375-385.
- 42. Shalon, D., Smith, S.J., Brown, P.O. 1996. A DNA microarray system for analyzing complex DNA samples using two-color fluorescent probe hybridization. Genome Res 6:639-45.
- 43. Shipp, M.A., et al. 2002. Diffuse large B-cell lymphoma outcome prediction by gene-expression profiling and supervised machine learning. Nat Med 8: 68-74.
- 44. Southern, E.M., Maskos, U., Elder, J.K. 1992. Analyzing and comparing nucleic acid sequences by hybridization to arrays of oligonucleotides: evaluation using experimental models. Genomics 13:1008-17.
- 45. Southern, E.M., et al. 1994. Arrays of complementary oligonucleotides for analysing the hybridisation behaviour of nucleic acids. Nucl Acids Res 22:1368-73.
- 46. Spellman, P.T., et al. 1998. Comprehensive identification of cell cycle regulated genes of the yeast Saccharomyces cerevisiae by microarray hybridization. Mol Biol Cell 9:3273-3297.
- 47. Tamayo, P., et al. 1999. Interpreting patterns of gene expression with self-organizing maps: methods and application to hematopoietic differentiation. Proc Natl Acad Sci USA 96:2907-2912.
- 48. Tavazoie, S., et al. 1999. Systematic determination of genetic network architecture. Nat Genet 22:281-285.
- 49. Tibshirani, R., Hastie, T., Narasimhan, B., Chu, G. 2002. Diagnosis of multiple cancer types by shrunken centroids of gene expression. Proc Natl Acad Sci USA 99:6567-6572.
- 50. Velculescu, V.E., Zhang, L., Vogelstein, B., Kinzler, K.W. 1995. Serial analysis of gene expression. Science 270:484-87.
- 51. Wodicka, L., et al. 1997. Genome-wide expression monitoring in Saccharomyces cerevisiae. Nat Biotechnol 15:1359-6714.
- 52. Wright, G., et al. 2003. A gene expression-based method to diagnose clinically distinct subgroups of diffuse large B cell lymphoma. Proc Natl Acad Sci USA 100:9991-9996.
- The following section of the description consists of numbered paragraphs simply providing statements of the invention already described herein. The numbered paragraphs in this section are not claims. The claims are set forth below in the later section headed "claims".
- 1. A composition comprising the probes listed in Table 2.
- 2. The composition of 1 wherein said probes comprise a microarray.
- 3. A method for generating a survival prediction model for a lymphoma comprising the steps of:
- a) obtaining one or more biopsy samples of said lymphoma, wherein said biopsy samples are obtained from subjects with known survival data;
- b) obtaining gene expression data for a set of genes in said one or more biopsy samples;
- c) identifying genes with expression patterns associated with longer survival;
- d) identifying genes with expression patterns associated with shorter survival;
- e) applying hierarchical clustering to those genes identified in step (c) to identify one or more gene expression signatures;
- f) applying hierarchical clustering to those genes identified in step (d) to identify one or more gene expression signatures;
- g) for each gene expression signature identified in steps (e) and (f), averaging the expression level of each gene within the gene expression signature to obtain a gene expression signature value; and
- h) generating a multivariate survival prediction model using the gene expression signature values obtained in step (g).
- 4. A method for predicting survival in a follicular lymphoma (FL) subject comprising the steps of:
- a) obtaining a biopsy sample from said subject;
- b) obtaining gene expression data for a set of genes in said biopsy sample;
- c) averaging the gene expression level of genes from an immune response-1 gene expression signature to obtain an immune response-1 gene expression signature value;
- d) averaging the gene expression level of genes from an immune response-2 gene expression signature to obtain an immune response-2 gene expression signature value;
- f) calculating a survival predictor score using an equation: [2.71*(immune response-2 gene expression signature value)] - [2.36*(immune response-1 gene expression signature value)];wherein a higher survival predictor score is associated with worse survival.
- 5. The method of 4 wherein the step of obtaining gene expression data further comprises use of a microarray.
- 6. The method of 4 wherein the immune response-1 gene expression signature comprises at least one gene selected from the group consisting of (listed by UNIQID): 1095985, 1096579, 1097255, 1097307, 1097329, 1097561, 1098152, 1098405, 1098548, 1098893, 1099053, 1100871, 1101004, 1103303, 1107713, 1115194, 1119251, 1119838, 1119924, 1120196, 1120267, 1121313, 1121406, 1121720, 1122956, 1123038, 1123092, 1123875, 1124760, 1128356, 1128395, 1132104, 1133408, 1134069, 1134751, 1134948, 1135743, 1135968, 1136048, 1136087, 1137137, 1137289, 1137534, 1139339, 1139461, 11400391, 1140524, and 1140759.
- 7. The method of 4 wherein the immune response-2 gene expression signature comprises at least one gene selected from the group consisting of (listed by UNIQID): 1118705, 1118966, 1121063, 1121267, 1121331, 1121766, 1121852, 1122624, 1122679, 1122770, 1123767, 1123841, 1126097, 1126380, 1126628, 1126836, 1127277, 1127519, 1127648, 1128483, 1128898, 1129412, 1129582, 1129658, 1129705, 1129867, 1130003, 1130388, 1131837, 1133843, 1133949, 1134447, 1135117, 1136017, 1137478, 1137745, 1137768, 1138476, 1138529, 1138601, 1139862, 1140189, and 1140389.
- 8. A method for predicting survival in a follicular lymphoma (FL) subject comprising the steps of:
- a) obtaining a biopsy sample from said subject;
- b) obtaining gene expression data for a set of genes in said biopsy sample;
- c) averaging the gene expression level of genes from a B-cell differentiation gene expression signature to obtain a B-cell differentiation gene expression signature value;
- d) averaging the gene expression level of genes from a T-cell gene expression signature to obtain a T-cell gene expression signature value;
- e) averaging the gene expression level of genes from a macrophage gene expression signature to obtain a macrophage gene expression signature value;
- f) calculating a survival predictor score using an equation:

- 9. The method of 8 wherein the step of obtaining gene expression data further comprises use of a microarray.
- 10. The method of 8 wherein the B-cell differentiation gene expression signature comprises at least one gene selected from the group consisting of (listed by UNIQID): 1102859, 1098862, 1099291, 1101439, 1120316, 1139017, 1130922, 1130923, 1119350, 1097897, 1097901, 1120976, 1119813, 1105935, 1111070, 1114726, 1108988, 1096035, and 1123298.
- 11. The method of 8 wherein the T-cell gene expression signature comprises at least one gene selected from the group consisting of (listed by UNIQID): 1134945, 1134069, 1137809,1119251, 1096579, 1101004, 1137137, 1100871, 1139461, 1128395, 1119880, 1130676, 1130668, 1135968, 1097329, 1098548, 1123038, 1128356, 1133408, 1140524, 1119838, 1097255, 1098152, 1115194, 1124760, 1120267, 1137289, 1137534, 1097307, 1123613, 1121720, 1120196, 1136087, 1132104, 1140391, 1098405, 1135743, 11136048, 11123875, 1098893, 1097561, 1122956, 1121406, 1125532, 1138538, 11033013, and 1119924,
- 12. The method of 8 wherein the macrophage gene expression signature comprises at least one gene selected from the group consisting of (listed by UNIQID): 1123682, 1099124, 1123401, 1134379, 1136481, 1132220, 1119400, 1131119, 1123566, 1138443, 1127943, 1119998, 1132433, 1119260, and 1098278.
- 13. A method for predicting survival in a follicular lymphoma (FL) subject comprising the steps of:
- a) obtaining a biopsy sample from said subject;
- b) obtaining gene expression data for a set of genes in said biopsy sample;
- c) averaging the gene expression level of genes from a B-cell differentiation gene expression signature to obtain a B-cell differentiation gene expression signature value;
- d) averaging the gene expression level of genes from a T-cell gene expression signature to obtain a T-cell gene expression signature value;
- e) averaging the gene expression level of genes from a macrophage gene expression signature to obtain a macrophage gene expression signature value;
- f) calculating a survival predictor score using an equation: [1.51*(macrophage gene expression signature value)] - [2.11*(T-cell gene expression signature value)] - [0.505*(B-cell differentiation gene expression signature value)];
- 14. The method of 13 wherein the step of obtaining gene expression data further comprises use of a microarray.
- 15. The method of 13 wherein the B-cell differentiation gene expression signature comprises at least one gene selected from the group consisting of (listed by UNIQID): 1102859, 1098862, 1099291, 1101439, 1120316, 1139017, 1130922, 1130923, 1119350, 1097897, 1097901, 1120976, 1119813, 15935, 111170, 1114726, 1108988, 1096035, and 1123298.
- 16. The method of 13 wherein the T-cell gene expression signature comprises at least one gene selected from the group consisting of (listed by UNIQID): 1134945, 134069, 1137809, 1119251, 1096579, 1101004, 1137137, 1100871, 1139461, 1128395, 1119880, 1130676, 1130668, 1135968, 1097329, 1098548, 1123038, 1128356, 1133408, 1140524, 1119838, 1097255, 1098152, 1115194, 1124760, 1120267, 1137289, 1137534, 1097307, 1123613, 1121720, 1120196, 1136087, 1132104, 1140391, 1098405, 1135743, 1136048, 1123875, 1098893, 1097561, 1122956, 1121406, 1125532, 1138538, 1103303, and 1119924.
- 17. The method of 13 wherein the macrophage gene expression signature comprises at least one gene selected from the group consisting of (listed by UNIQID): 1123682, 1099124, 1123401, 1134379, 1137481, 1132220, 1119400, 1131119, 1123566, 1138443, 1127943, 1119998, 1132433, 1119260, and 1098278.
- 18. A method for predicting survival in a diffuse large B cell lymphoma (DLBCL) subject comprising the steps of:
- a) obtaining a biopsy sample from said subject;
- b) obtaining gene expression data for a set of genes in said biopsy sample;
- c) averaging the gene expression level of genes from an ABC DLBCL high gene expression signature to obtain an ABC DLBCL high gene expression signature value;
- d) averaging the gene expression level of genes from a lymph node gene expression signature to obtain a lymph node gene expression signature value;
- e) averaging the gene expression level of genes from an MHC class II gene expression signature to obtain an MHC class II gene expression signature value;
- f) calculating a survival predictor score using an equation: [0.586*(ABC DLBCL high gene expression signature value)].- [0.468*(lymph node gene expression signature value)] - [0.336*(MHC class II gene expression signature value)];wherein a higher survival predictor score is associated with worse survival.
- 19. The method of 18 wherein the step of obtaining gene expression data comprises use of a microarray.
- 20. The method of 18 wherein the ABC DLBCL high gene expression signature comprises at least one gene selected from the group consisting of (listed by UNIQID): 1134271, 1121564, 1119889, 1133300, 1106030, 1139301, 1122131, 1114824, 1100161, and 1120129.
- 21. The method of 18 wherein the lymph node gene expression signature comprises at least one gene selected from the group consisting of (listed by UNIQID): 1097126, 1120880, 1098898, 1123376, 1128945, 1130994, 1124429, 1099358, 1130509, 1095985, 1123038, 1133700, 1122101, and 1124296.
- 22. The method of 18 wherein the MHC class II gene expression signature comprises at least one gene selected from the group consisting of (listed by UNIQID): 1123127, 1136777, 1137771, 1134281, 1136573, and 1132710.
- 23. A method for predicting survival in a diffuse large B cell lymphoma (DLBCL) subject comprising the steps of:
- a) obtaining a biopsy sample from said subject;
- b) obtaining gene expression data for a set of genes in said biopsy sample;
- c) averaging the gene expression level of genes from a lymph node gene expression signature to obtain a lymph node gene expression signature value;
- d) averaging the gene expression level of genes from a germinal B cell gene expression signature to obtain a germinal B cell gene expression signature value;
- e) averaging the gene expression level of genes from a proliferation gene expression signature to obtain a proliferation gene expression signature value;
- f) averaging the gene expression level of genes from an MHC class II gene expression signature to obtain a proliferation gene expression signature value;
- g) calculating a survival predictor score using an equation: [-0.4337*(lymph node gene expression signature)] + [0.09*(proliferation gene expression signature)] - [0.4144*(germinal center B-cell gene expression signature)] - [0.2006*(MHC class II gene expression signature)];
- 24. The method of 23 wherein the step of obtaining gene expression data comprises use of a microarray.
- 25. The method of 23 wherein the lymph node gene expression signature comprises at least one gene selected from the group consisting of (listed by UNIQID): 1097126, 1099028, 1099358, 1101478, 1103497, 1121029, 1124429, 1135068, 1136051, and 1136172.
- 26. The method of 23 wherein the proliferation gene expression signature comprises at least one gene selected from the group consisting of (listed by UNIQID): 1096903, 1120583, 1123289, 1131808, 1133102, and 1136595.
- 27. The method of 23 wherein the germinal center B-cell gene expression signature comprises at least one gene selected from the group consisting of (listed by UNIQID): 1099686, 1099711, 1103390, 1106025, 1128287, 1132520, 1138192, 1529318, 1529344, 1529352, 1096570, 1097897, 1097901, 1098611, 1100581, 1115034, 1120090, 1120946, 1121248, 1123105, 1125455, 1128694, 1128787, 1132122, 1136269, 1136702, 1139230, 1529292, and 1529295.
- 28. The method of 23 wherein the MHC class II gene expression signature comprises at least one gene selected from the group consisting of (listed by UNIQID): 1136777 and 1136877.
- 29. A method for predicting survival in a diffuse large B cell lymphoma (DLBCL) subject comprising the steps of:
- a) obtaining a biopsy sample from said subject;
- b) obtaining gene expression data for a set of genes in said biopsy sample;
- c) averaging the gene expression level of genes from a lymph node gene expression signature to obtain a lymph node gene expression signature value;
- d) averaging the gene expression level of genes from a germinal B cell gene expression signature to obtain a germinal B cell gene expression signature value;
- e) averaging the gene expression level of genes from an MHC class II gene expression signature to obtain a proliferation gene expression signature value;
- f) calculating a survival predictor score using an equation: [-0.32*(lymph node gene expression signature)] - [0.176*(germinal B cell gene expression signature)] - [0.206*(MHC class II gene expression signature)];
- 30. The method of 29 wherein the step of obtaining gene expression data further comprises use of a microarray.
- 31. The method of 29 wherein the step of obtaining gene expression data further comprises RT-PCR.
- 32. The method of 29 wherein the lymph node gene expression signature comprises at least one gene selected from the group consisting of (listed by UNIQID): 1097126, 1099358, and 1121029.
- 33. The method of 29 wherein the germinal center B-cell gene expression signature comprises at least one gene selected from the group consisting of (listed by UNIQID): 1099686, 1529318, and 1529344.
- 34. The method of 29 wherein the MHC class II gene expression signature comprises at least one gene selected from the group consisting of (listed by UNIQID): 1136777 and 1136877.
- 35. A method for predicting survival in a mantle cell lymphoma (MCL) subject comprising the steps of:
- a) obtaining a biopsy sample from said subject;
- b) obtaining gene expression data for a set of genes in said biopsy sample;
- c) averaging the gene expression level of genes from a proliferation gene expression signature to obtain a proliferation gene expression signature value;
- f) calculating a survival predictor score using an equation: [1.66*(proliferation gene expression signature value)];
- 36. The method of 35 wherein the step of obtaining gene expression data further comprises use of a microarray.
- 37. The method of 35 wherein the proliferation gene expression signature comprises at least one gene selected from the group consisting of (listed by UNIQID): 1097290, 1101295, 1119729, 1120153, 1120494, 1124745, 1126148, 1130618, 1134753, 1139654, and 1140632.
- 38. The method of 35 wherein the proliferation gene expression signature comprises at least one gene selected from the group consisting of (listed by UNIQID): 1119294, 1119729, 1120153, 1121276, 1123358, 1124178, 1124563, 1130799, 1131274, 1131778, 1132449, 1135229, and 1136585.
- 39. A method for determining the probability that a sample X belongs to a first lymphoma type or a second lymphoma type comprising the steps of:
- a) identifying a set of genes G that are differentially expressed between a first lymphoma type and a second lymphoma type;
- b) calculating a series of scale factors, wherein each scale factor represents a difference in gene expression between said first lymphoma type and said second lymphoma type for one of the genes identified in step (a);
- c) generating a series of linear predictor scores for a set of known samples belonging to said first lymphoma type and a set of known samples belonging to said second lymphoma type based on the expression of the genes identified in step (a);
- d) obtaining gene expression data for the genes identified in step (a) for sample X;
- e) generating a linear predictor score for sample X based on the expression of the genes identified in step (a);
- f) calculating a probability q that sample X belongs to said first lymphoma type by:

- 40. The method of 39 wherein the linear predictor scores are calculated by:

wherein Sj is the expression of gene j in a sample S and tj is the scale factor representing the difference in expression of gene j between said first lymphoma type and said second lymphoma type. - 41. The method of 39 wherein said scale factors are t-statistics.
- 42. The method of 39 wherein said first lymphoma type is selected from the group consisting of: follicular lymphoma (FL), Burkitt lymphoma (BL.), mantle cell lymphoma (MCL), follicular hyperplasia (FH), small cell lymphocytic lymphoma (SLL), mucosa-associated lymphoid tissue lymphoma (MALT), splenic lymphoma, multiple myeloma, lymphoplasmacytic lymphoma, post-transplant lymphoproliferative disorder (PTLD), lymphoblastic lymphoma, nodal marginal zone lymphoma (NMZ), germinal center B cell-like diffuse large B cell lymphoma (GCB DLBCL), activated B cell-like diffuse large B cell lymphoma (ABC DLBCL) and primary mediastinal B cell lymphoma (PMBL).
- 43. The method of 39 wherein said second lymphoma type is selected from the group consisting of: follicular lymphoma (FL), Burkitt lymphoma (BL), mantle cell lymphoma (MCL), follicular hyperplasia (FH), small cell lymphocytic lymphoma (SLL), mucosa-associated lymphoid tissue lymphoma (MALT), splenic lymphoma, multiple myeloma, lymphoplasmacytic lymphoma, post-transplant lymphoproliferative disorder (PTLD), lymphoblastic lymphoma, nodal marginal zone lymphoma (NMZ), germinal center B cell-like diffuse large B cell lymphoma (GCB DLBCL), activated B cell-like diffuse large B cell lymphoma (ABC DLBCL) and primary mediastinal B cell lymphoma (PMBL).
- 44. The method of 39 wherein said sample is classified as said first lymphoma type if said probability q is greater than 90%.
- 45. The method of 39 wherein said set of genes G excludes genes belonging to a proliferation gene expression signature and genes belonging to a lymph node gene expression signature.
- 46. The method of 39 wherein step (d) further comprises use of a microarray.
- 47. A method for determining the lymphoma type of a sample X comprising the steps of:
- a) identifying a set of genes G that are differentially expressed between a first lymphoma type and a second lymphoma type;
- b) calculating a series of scale factors, wherein each scale factor represents a difference in gene expression between said first lymphoma type and said second lymphoma type for one of the genes identified in step (a);
- c) generating a series of linear predictor scores for a set of known samples belonging to said first lymphoma type and a set of known samples belonging to said second lymphoma type based on the expression of the genes identified in step (a);
- d) obtaining gene expression data for the genes identified in step (a) for sample X;
- e) generating a linear predictor score for sample X based on the expression of the genes identified in step (a);
- f) calculating a probability q that sample X belongs to said first lymphoma type by:

wherein LPS(X) is the linear predictor score for sample X, φ(x; µ, σ) is the normal density function with mean µ and standard deviation σ, µ̂1 and σ̂1 are the mean and variance of the linear predictor scores for said known samples belonging to the first lymphoma type, and µ̂2 and σ̂2 are the mean and variance of the linear predictor scores for said known samples belonging to the second lymphoma type; - g) repeating steps (a)-(f) with other lymphoma types replacing the second lymphoma type;
- h) repeating steps (a)-(g) with other lymphoma types replacing the first lymphoma type.
- 48. The method of 47 wherein the linear predictor scores are calculated by:

wherein Sj is the expression of gene j in a sample S and tj is the scale factor representing the difference in expression of gene j between said first lymphoma type and said second lymphoma type. - 49. The method of 47 wherein the scale factors are t-statistics.
- 50. The method of 47 wherein the first lymphoma type is selected from the group consisting of: follicular lymphoma (FL), Burkitt lymphoma (BL), mantle cell lymphoma (MCL), follicular hyperplasia (FH), small cell lymphocytic lymphoma (SLL), mucosa-associated lymphoid tissue lymphoma (MALT), splenic lymphoma, multiple myeloma, lymphoplasmacytic lymphoma, post-transplant lymphoproliferative disorder (PTLD), lymphoblastic lymphoma, nodal marginal zone lymphoma (NMZ), germinal center B cell-like diffuse large B cell lymphoma (GCB DLBCL), activated B cell-like diffuse large B cell lymphoma (ABC DLBCL) and primary mediastinal B cell lymphoma (PMBL).
- 51. The method of 47 wherein the second lymphoma type is selected from the group consisting of: follicular lymphoma (FL), Burkitt lymphoma (BL), mantle cell lymphoma (MCL), follicular hyperplasia (FH), small cell lymphocytic lymphoma (SLL), mucosa-associated lymphoid tissue lymphoma (MALT), splenic lymphoma, multiple myeloma, lymphoplasmacytic lymphoma, post-transplant lymphoproliferative disorder (PTLD), lymphoblastic lymphoma, nodal marginal zone lymphoma (NMZ), germinal center B cell-like diffuse large B cell lymphoma (GCB DLBCL), activated B cell-like diffuse large B cell lymphoma (ABC DLBCL) and primary mediastinal B cell lymphoma (PMBL).
- 52. The method of 47 wherein the first lymphoma type is mantle cell lymphoma (MCL).
- 53. The method of 52 wherein the second lymphoma type is activated B cell-like diffuse large B cell lymphoma (ABC DLBCL).
- 54. The method of 53 wherein the differentially expressed genes are selected from the group consisting of (listed by UNIQID): 1103711, 1133111, 1137987, 1132835, 1109505, 1139054, 1119361, 1115226, 1101211, 1118963, 1096503, 1127849, 1099204, 1098840, 1139444, 1106855, 1126695, 1120137, 1133011, and 1133192.
- 55. The method of 52 wherein the second lymphoma type is Burkitt lymphoma (BL).
- 56. The method of 55 wherein the differentially expressed genes are selected from the group consisting of (listed by UNIQID): 1120900, 1112061, 1109505, 1133099, 1106855, 1110070, 1121739, 1098840, 1132833, 1121693, 1123760, 1125964, 1112306, 1096070, 1129943, 1118749, 1098954, 1134749, 1131860, and 1123148.
- 57. The method of 52 wherein the second lymphoma type is follicular hyperplasia (FH).
- 58. The method of 57 wherein the differentially expressed genes are selected from the group consisting of (listed by UNIQID): 1132834, 1100873, 1109603, 1139411, 1106855, 1125193, 1137450, 1100258, 13167, 1136831, 1138222, 1099437, 1144236, 1114109, 1098277, 1135138, 1103304, 1128460, 1121953, and 1129281.
- 59. The method of 52 wherein the second lymphoma type is follicular lymphoma (FL).
- 60. The method of 59 wherein the differentially expressed genes are selected from the group consisting of (listed by UNIQID): 1132835, 1096070, 1103711, 1137987, 1109505, 1098840, 1130926, 1096396, 1132734, 1139393, 1115537, 1102215, 1124585, 1137561, 1100581, 1124645, 1114543, 1120090, 1123731, and 1133192.
- 61. The method of 52 wherein the second lymphoma type is germinal center B cell-like diffuse large B cell lymphoma (GCB DLBCL).
- 62. The method of 61 wherein the differentially expressed genes are selected from the group consisting of (listed by UNIQID): 1098840, 1132835, 1137987, 1098954, 1103711, 1096070, 1139393, 1127849, 1098156, 1128845, 1129943, 1140116, 1106855, 1120900, 1127371, 1119361, 1120854, 1098277, 1140127, and 1100581.
- 63. The method of 52 wherein the second lymphoma type is mucosa-associated lymphoid tissue lymphoma (MAT).
- 64. The method of 63 wherein the differentially expressed genes are selected from the group consisting of (listed by UNIQID): 1132834, 1101987, 1100873, 1130764, 1102178, 1098277, 1130926, 1098694, 103711, 1138099, 1120854, 1102215, 1121739, 1096070, 1101211, 1120825, 1099437, 1096503, 1135927, and 1120645.
- 65. The method of 52 wherein the second lymphoma type is primary mediastinal B cell lymphoma (PMBL).
- 66. The method of 65 wherein the differentially expressed genes are selected from the group consisting of (listed by UNIQID): 1132834, 1100873, 1096503, 1098840, 1124734, 1135102, 1103711, 1140416, 1121757, 1140236, 1099140, 1099549, 1139054, 1138818, 1109444, 1124534, 1098277, 1131687, 1125112, and 1125397.
- 67. The method of 52 wherein the second lymphoma type is post-transplant lymphoproliferative disorder (PTLD).
- 68. The method of 67 wherein the differentially expressed genes are selected from the group consisting of (listed by UNIQID): 1109603, 1138222, 1135138, 1134230, 1139411, 1140416, 1132834, 1121739, 1098156, 1099270, 1139012, 1120854, 1120985, 1115952, 1120825, 1131636, 1136706, 1113560, 1133851, and 1137459.
- 69. The method of 52 wherein the second lymphoma type is small cell lymphocytic lymphoma (SLL).
- 70. The method of 69 wherein the differentially expressed genes are selected from the group consisting of (listed by UNIQID): 1132834, 1101987, 1103711, 1096070, 1130926, 1120645, 1138099, 1097887, 1099941, 1130373, 1110957, 1130320, 1124373, 1128813, 1131130, 1120825, 119752, 131854, 1105801, and 1097824.
- 71. The method of 52 wherein the second lymphoma type is splenic lymphoma.
- 72. The method of 71 wherein the differentially expressed genes are selected from the group consisting of (listed by UNIQID): 1106855, 1121739, 1111850, 1098024, 1130764, 1135342, 1097218, 117193, 1139564, 132834, 1131130, 1131756, 1102187, 1098195, 1101211, 1136673, 1139116, 1098694, 1120519, and 1114916.
- 73. The method of 47 wherein the first lymphoma type is activated B cell-like diffuse large B cell lymphoma (ABC DLBCL).
- 74. The method of 73 wherein the second lymphoma type is germinal center B cell-like diffuse large B cell lymphoma (GCB DLBCL).
- 75. The method of 74 wherein the differentially expressed genes are selected from the group consisting of (listed by UNIQID): 19375, 19346, 19227; 16049, 32529, 24729, 24899, 19348, 27565, 17227, 26919, 24321, 29385, 16858, 31801, 19234, 26385, 24361, 24570, 24904, 24429, 28224, 27673, 24376, 17496, 17218, and 28338.
- 76. The method of 74 wherein the differentially expressed genes are selected from the group consisting of (listed by UNIQID): 24729, 17227, 26907, 27565, 16858, 24899, 16947, 16049, 26385, 27673, 24429, 17218, 28338, and 17496.
- 77. The method of 47 wherein said set of genes G excludes genes belonging to a proliferation gene expression signature and genes belonging to a lymph node gene expression signature.
- 78. The method of 47 wherein step (d) further comprises use of a microarray.
- 79. A method for determining the lymphoma type of a sample X comprising the steps of:
- a) creating a series of lymphoma type pairs, wherein each lymphoma type pair represents a combination of a first lymphoma type and a second lymphoma type;
- b) for each lymphoma type pair, obtaining gene expression data for a set of genes G in said first lymphoma type and said second lymphoma type;
- c) calculating a series of scale factors, wherein each scale factor represents a difference in gene expression between said first lymphoma type and said second lymphoma type for one of the genes identified in step (b);
- d) identifying z genes from said set of genes G with the largest scale factors;
- e) generating a series of linear predictor scores for a set of known samples belonging to said first lymphoma type and a set of known samples belonging to said second lymphoma type based on the expression of the genes identified in step (d),
wherein said series of linear predictor scores is generated using between 1 and z of the genes identified in step (d); - f) selecting a set of genes between 1 and z from step (e) that generates the largest difference in linear predictor score between said first lymphoma type and said second lymphoma type;
- g) obtaining gene expression data for the genes identified in step (f) for sample X;
- h) generating a linear predictor score for sample X based on the expression of the genes selected in step (f);
- i) calculating a probability q that sample X belongs to said first lymphoma type by:

- 80. The method of 62 wherein the linear predictor scores are calculated by:

wherein Sj is the expression of gene j in a sample S and tj is the scale factor representing the difference in expression of gene j between said first lymphoma type and said second lymphoma type. - 81. The method of 79 wherein said scale factors are t-statistics.
- 82. The method of 79 wherein said first lymphoma type is selected from the group consisting of: follicular lymphoma (FL), Burkitt lymphoma (BL), mantle cell lymphoma (MCL), follicular hyperplasia (FH), small cell lymphocytic lymphoma (SLL), mucosa-associated lymphoid tissue lymphoma (MALT), splenic lymphoma, multiple myeloma, lymphoplasmacytic lymphoma, post-transplant lymphoproliferative disorder (PTLD), lymphoblastic lymphoma, nodal marginal zone lymphoma (NMZ), germinal center B cell-like diffuse large B cell lymphoma (GCB DLBCL), activated B cell-like diffuse large B cell lymphoma (ABC DLBCL) and primary mediastinal B cell lymphoma (PMBL).
- 83. The method of 79 wherein said second lymphoma type is selected from the group consisting of: follicular lymphoma (FL), Burkitt lymphoma (BL), mantle cell lymphoma (MCL), follicular hyperplasia (FH), small cell lymphocytic lymphoma (SLL.), mucosa-associated lymphoid tissue lymphoma (MALT), splenic lymphoma, multiple myeloma, lymphoplasmacytic lymphoma, post-transplant lymphoproliferative disorder (PTLD), lymphoblastic lymphoma, nodal marginal zone lymphoma (NMZ), germinal center B cell-like diffuse large B cell lymphoma (GCB DLBCL), activated B cell-like diffuse large B cell lymphoma (ABC DLBCL) and primary mediastinal B cell lymphoma (PMBL).
- 84. The method of 79 wherein a cut-off point between said high probability q and said middle probability q and a cut-off point between said middle probability q and said low probability q is determined by the following steps:
- i) ranking one or more samples of known lymphoma type according to their probability q;
- ii) analyzing each cut-off point between adjacent samples by: 3.99 * [(% of said first lymphoma type misidentified as said second lymphoma type) + (% of said second lymphoma type misidentified as said first lymphoma type)] + [(% of said first lymphoma type classified as belonging to neither lymphoma type) + (% of said second lymphoma type classified as belonging to neither lymphoma type)],
- 85. The method of 79 wherein z = 100.
- 86. The method of 79 wherein step (g) further comprises use of a microarray.
- 87. A method for determining the lymphoma type of a sample X comprising the steps of:
- a) creating a series of lymphoma type pairs, wherein each lymphoma type pair represents a combination of a first lymphoma type and a second lymphoma type;
- b) for each lymphoma type pair, obtaining gene expression data for a set of genes G in said first lymphoma type and said second lymphoma type;
- c) calculating a series of scale factors, wherein each scale factor represents a difference in gene expression between said first lymphoma type and said second lymphoma type for one of the genes identified in step (b);
- d) placing each gene in said set of genes G into one of n gene-list categories,
wherein placement in a gene-list category indicates correlation between expression of said gene and expression of a gene expression signature; - e) within each gene-list category, identifying z genes with the largest scale factors;
- f) generating a series of linear predictor scores for a set of known samples belonging to said first lymphoma type and a set of known samples belonging to said second lymphoma type based on the expression of the genes identified in step (e),
wherein said series of linear predictor scores is generated using between 1 and z of the genes identified in step (e); - g) selecting a set of genes between 1 and z from step (f) that generates the largest difference in linear predictor scores between said first lymphoma type and said second lymphoma type;
- h) measuring expression of the set of genes selected in step (g) in sample X;
- i) generating a linear predictor score for sample X based on the expression of the genes selected in step (f);
- j) calculating a probability q that sample X belongs to said first lymphoma type by:

- i) ranking one or more samples of known lymphoma type according to their probability q;
- ii) analyzing each cut-off point between adjacent samples by: 3.99 * [(% of said first lymphoma type misidentified as said second lymphoma type) + (% of said second lymphoma type misidentified as said first lymphoma type)] + [(% of said first lymphoma type classified as belonging to neither lymphoma type) + (% of said second lymphoma type classified as belonging to neither lymphoma type)],
- 88. The method of 87 wherein the linear predictor scores are calculated by:

wherein sj is the expression of gene j in a sample S and tj is the scale factor representing the difference in expression of gene j between said first lymphoma type and said second lymphoma type. - 89. The method of 87 wherein said scale factors are t-statistics.
- 90. The method of 87 wherein said first lymphoma type is selected from the group consisting of: follicular lymphoma (FL), Burkitt lymphoma (BL), mantle cell lymphoma (MCL), follicular hyperplasia (FH), small cell lymphocytic lymphoma (SLL), mucosa-associated lymphoid tissue lymphoma (MALT), splenic lymphoma, multiple myeloma, lymphoplasmacytic lymphoma, post-transplant lymphoproliferative disorder (PTLD), lymphoblastic lymphoma, nodal marginal zone lymphoma (NMZ), germinal center B cell-like diffuse large B cell lymphoma (GCB DLBCL), activated B cell-like diffuse large B cell lymphoma (ABC DLBCL) and primary mediastinal B cell lymphoma (PMBL).
- 91. The method of 87 wherein said second lymphoma type is selected from the group consisting of: follicular lymphoma (FL), Burkitt lymphoma (BL), mantle cell lymphoma (MCL), follicular hyperplasia (FH), small cell lymphocytic lymphoma (SLL), mucosa-associated lymphoid tissue lymphoma (MALT), splenic lymphoma, multiple myeloma, lymphoplasmacytic lymphoma, post-transplant lymphoproliferative disorder (PTLD), lymphoblastic lymphoma, nodal marginal zone lymphoma (NMZ), germinal center B cell-like diffuse large B cell lymphoma (GCB DLBCL), activated B cell-like diffuse large B cell lymphoma (ABC DLBCL) and primary mediastinal B cell lymphoma (PMBL).
- 92. The method of 87 wherein n = 3.
- 93. The method of 92, wherein said gene-list categories are a lymph node gene expression signature, a proliferation gene expression signature, and a standard gene expression signature, wherein said standard gene expression signature includes those genes not included in said lymph node and proliferation gene expression signatures.
- 94. The method of 93, wherein step (g) further comprises generating four linear predictor scores using the set of genes selected therein, wherein:
- a) the first linear predictor score is generated using genes from the lymph node, proliferation, and standard gene expression signatures;
- b) the second linear predictor score is generated using genes from the standard gene expression signature only;
- c) the third linear predictor score is generated using genes from the standard and proliferation gene expression signatures only; and
- d) the fourth linear predictor score is generated using genes from the standard and lymph node gene expression signatures only.
- 95. The method of 87 wherein step (h) further comprises use of a microarray.
Claims (15)
- A method for determining the lymphoma type of a sample X comprising the steps of:a) isolating gene expression product from lymphoma sample X;b) creating one or more lymphoma type pairs, wherein each lymphoma type pair represents a combination of a first lymphoma type and a second lymphoma type;c) for each lymphoma type pair, obtaining gene expression data for a set of genes G in said first lymphoma type and said second lymphoma type;d) calculating a series of scale factors, wherein each scale factor represents a difference in gene expression between said first lymphoma type and said second lymphoma type for one of the genes belonging to said set of genes G, preferably wherein said scale factors are t-statistics;e) identifying a subset of genes g that are differentially expressed between said first lymphoma type and said second lymphoma type;f) generating a series of linear predictor scores for a set of known samples belonging to said first lymphoma type and a set of known samples belonging to said second lymphoma type based on the expression of said subset of genes g identified in step (e);g) contacting the gene expression product from sample X to a plurality of probes to thereby obtain gene expression data for said subset of genes g for sample X;h) generating a linear predictor score for sample X based on the expression of said subset of genes g;i) calculating a probability q that sample X belongs to said first lymphoma type by:

wherein LPS(X) is the linear predictor score for sample X, φ (x; µ, σ) is the normal density function with mean µ and standard deviation σ, µ̂1 and σ̂1 are the mean and variance of the linear predictor scores for said set of known samples belonging to said first lymphoma type, and µ2 and σ̂2 are the mean and variance of the linear predictor scores for said known samples belonging to said second lymphoma type; andj) determining whether probability q is a high probability, middle probability, or low probability value, wherein the high probability and the middle probability have an upper cut-offpoint between 0.5 and 0.99, and the middle probability and the low probability have a lower cut-off point between 0.01 and 0.5, wherein a high probability q indicates that sample X belongs to said first lymphoma type, a low probability q indicates that sample X belongs to said second lymphoma type, and a middle probability q indicates that sample X belongs to neither lymphoma type. - The method of claim 1, wherein said subset of genes g contains z genes from said set of genes G with the largest scale factors, wherein z is from 5 to 100, preferably wherein z=100.
- The method of claim 2, wherein said series of linear predictor scores in step (f) comprises one or more linear predictor scores generated using from 1 to z of the genes from said subset of genes g.
- The method of claim 2, further comprising the additional step of selecting a number of genes from 1 to z that generates the largest difference in linear predictor score between said first lymphoma type and said second lymphoma type, wherein the gene expression data obtained for sample X in step (g) is obtained only for said selected number of genes.
- The method of claim 1, wherein step (c) further comprises placing each gene in said set of genes G into one of n gene-list categories, wherein placement in a gene-list category indicates correlation between expression of said gene and expression of a gene expression signature.
- The method of claim 5, wherein said subset of genes g excludes genes belonging to a proliferation gene expression signature and genes belonging to a lymph node gene expression signature.
- The method of claim 5, wherein n=3, preferably wherein said gene-list categories are a lymph node gene expression signature, a proliferation gene expression signature, and a standard gene expression signature, wherein said standard gene expression signature includes those genes not included in said lymph node and proliferation gene expression signatures.
- The method of claim 7, wherein said series of linear predictor scores in step (f) comprises four linear predictor scores for each gene in said subset of genes g, wherein:a) the first linear predictor score is generated using genes from the lymph node, proliferation, and standard gene expression signatures;b) the second linear predictor score is generated using genes from the standard gene expression signature only;c) the third linear predictor score is generated using genes from the standard and proliferation gene expression signatures only; andd) the fourth linear predictor score is generated using genes from the standard and lymph node gene expression signatures only.
- The method of claim 1 wherein the upper cut-off point between said high probability q and said middle probability q and the lower cut-off point between said middle probability q and said low probability q are determined by the following steps:i) ranking samples of known lymphoma type according to their probability q, wherein the samples of known lymphoma type include samples of the first lymphoma type and samples of the second lymphoma type;ii) analyzing each potential upper and lower cut-off point between adjacent samples in the ranking by: 3.99 * [(% of said first lymphoma type misidentified as said second lymphoma type) + (% of said second lymphoma type misidentified as said first lymphoma type)] + [(% of said first lymphoma type classified as belonging to neither lymphoma type) + (% of said second lymphoma type classified as belonging to neither lymphoma type)]; andiii) selecting the upper cut-off point and the lower cutoff point,wherein the upper and the lower cut-off points are those that minimize the equation of ii).
- The method of claim 1 wherein the linear predictor scores are calculated by:

wherein Sj is the expression of gene j in a sample S and tj is the scale factor representing the difference in expression of gene j between said first lymphoma type and said second lymphoma type. - The method of claim 1, wherein steps (c) and/or (g) further comprise the use of a microarray, preferably wherein said microarray is selected from the group consisting of an Affymetrix U133A microarray and an Affymetrix U133B microarray.
- The method of claim 1, wherein said sample X is classified as said first lymphoma type if said probability q is greater than 90%.
- The method of claim 1, wherein said first lymphoma type and said second lymphoma type are independently selected from the group consisting of: follicular lymphoma (FL), Burkitt lymphoma (BL), mantle cell lymphoma (MCL), follicular hyperplasia (FH), small cell lymphocytic lymphoma (SLL), mucosa-associated lymphoid tissue lymphoma (MALT), splenic lymphoma, multiple myeloma, lymphoplasmacytic lymphoma, post-transplant lymphoproliferative disorder (PTLD), lymphoblastic lymphoma, nodal marginal zone lymphoma (NMZ), germinal center B cell-like diffuse large B cell lymphoma (GCB DLBCL), activated B cell-like diffuse large B cell lymphoma (ABC DLBCL) and primary mediastinal B cell lymphoma (PMBL).
- The method of claim 1, wherein said first lymphoma type is mantle cell lymphoma (MCL) and said second lymphoma type is activated B cell-like diffuse large B cell lymphoma (ABC DLBCL), and wherein said subset of genes g includes one or more genes selected from the group consisting of genes corresponding to (listed by UNIQID): 1103711, 1133111, 1137987, 1132835, 1109505, 1139054, 1119361, 1115226, 1101211, 1118963, 1096503, 1127849, 1099204, 1098840, 1139444, 1106855, 1126695, 1120137, 1133011, and 1133192; or
wherein said first lymphoma type is mantle cell lymphoma (MCL) and said second lymphoma type is Burkitt lymphoma (BL), and wherein said subset of genes g includes one or more genes selected from the group consisting of genes corresponding to (listed by UNIQID): 1120900, 1112061, 1109505, 1133099, 1106855, 1110070, 1121739, 1098840, 1132833,1121693, 1123760, 1125964, 1112306, 1096070, 1129943, 1118749, 1098954, 1134749, 1131860, and 1123148; or
wherein said first lymphoma type is mantle cell lymphoma (MCL) and said second lymphoma type is follicular hyperplasia (FH), and wherein said subset of genes g includes one or more genes selected from the group consisting of genes corresponding to (listed by UNIQID): 1132834, 1100873, 1109603, 1139411, 1106855, 1125193, 1137450, 1100258, 1133167, 1136831, 1138222, 1099437, 1140236, 1114109, 1098277, 1135138, 1103304, 1128460, 1121953, and 1129281; or
wherein said first lymphoma type is mantle cell lymphoma (MCL) and said second lymphoma type is follicular lymphoma (FL), and wherein said subset of genes g includes one or more genes selected from the group consisting of genes corresponding to (listed by UNIQID): 1132835, 1096070, 1103711, 1137987, 1109505, 1098840, 1130926, 1096396, 1132734,1139393,1115537,1102215,1124585,1137561,1100581,1124646,1114543,1120090, 1123731, and 1133192; or
wherein said first lymphoma type is mantle cell lymphoma (MCL) and said second lymphoma type is germinal center B cell-like diffuse large B cell lymphoma (GCB DLBCL), and wherein said subset of genes g includes one or more genes selected from the group consisting of genes corresponding to (listed by UNIQID): 1098840, 1132835, 1137987, 1098954, 1103711, 1096070, 1139393, 1127849, 1098156, 1128845, 1129943, 1140116, 1106855, 1120900, 1127371, 1119361, 1120854, 1098277, 1140127, and 1100581; or
wherein said first lymphomas type is mantle cell lymphoma (MCL) and said second lymphoma type is mucosa-associated lymphoid tissue lymphoma (MALT), and wherein said subset of genes g includes one or more genes selected from the group consisting of genes corresponding to (listed by UNIQID): 1132834, 1101987, 1100873, 1130764, 1102178, 1098277, 1130926, 1098694, 1103711, 1138099, 1120854, 1102215, 1121739, 1096070, 1101211, 1120825, 1099437, 1096503, 1135927, and 1120645; or
wherein said first lymphoma type is mantle cell lymphoma (MCL) and said second lymphoma type is primary mediastinal B cell lymphoma (PMBL), and wherein said subset of genes g includes one or more genes selected from the group consisting of genes corresponding to (listed by UNIQID): 1132834, 1100873, 1096503, 1098840, 1124734, 135102, 1103711, 1140416, 1121757, 1140236, 1099140, 099549, 1139054, 1138818, 1109444, 1124534, 1098277, 1131687, 1125112, and 1125397; or
wherein said first lymphoma type is mantle cell lymphoma (MCL) and said second lymphoma type is post-transplant lymphoproliferative disorder (PTLD), and wherein said subset of genes g includes one or more genes selected from the group consisting of genes corresponding to (listed by UNIQID): 1109603, 1138222, 1135138, 1134230, 1139411, 1140416, 1132834, 1121739, 1098156, 1099270, 1139012, 1120854, 1120985, 1115952, 1120825, 1131636, 1136706, 1113560, 1133851, and 1137459; or
wherein said first lymphoma type is mantle cell lymphoma (MCL) and said second lymphoma type is small cell lymphocytic lymphoma (SLL), and wherein said subset of genes g includes one or more genes selected from the group consisting of genes corresponding to (listed by UNIQID): 1096070, 1097824, 1097887, 1099941, 1101987, 1103711, 1105801, 1110957,1119752,1120645,1120825,1124373,1128813,1130320,1130373,1130926,1131130, 1131854, 1132834, and 1138099; or
wherein said first lymphoma type is mantle cell lymphoma (MCL) and said second lymphoma type is splenic lymphoma, and wherein said subset of genes g includes one or more genes selected from the group consisting of genes corresponding to (listed by UNIQID): 1097218, 1098024, 1098195, 1098694, 1101211, 1102187, 1106855, 1111850, 1114916, 1117193, 1120519, 1121739, 1130764, 1131130, 1131756, 1132834, 1135342, 1136673, 1139116, and 1139564; or
wherein said first lymphoma type is activated B cell-like diffuse large B cell lymphoma (ABC DLBCL) and said second lymphoma type is germinal center B cell-like diffuse large B cell lymphoma (GCB DLBCL), and wherein said subset of genes g includes one or more genes selected from the group consisting of genes corresponding to (listed by UNIQID): 16049, 16858, 16947, 17218, 17227, 17496, 19227, 19234, 19346, 19348, 19375, 24321, 24361, 24376, 24429, 24570, 24729, 24899, 24904, 26385, 26907, 26919, 27565, 27673, 28224, 28338, 29385, 31801, and 32529. - The method of claim 1, wherein the method further comprises providing a therapy or course of treatment based on whether sample X belongs to said first lymphoma type, said second lymphoma type, or neither said first lymphoma type nor said second lymphoma type.
Applications Claiming Priority (2)
| Application Number | Priority Date | Filing Date | Title |
|---|---|---|---|
| US50037703P | 2003-09-03 | 2003-09-03 | |
| EP04783330A EP1664762A4 (en) | 2003-09-03 | 2004-09-03 | Methods for identifying, diagnosing, and predicting survival of lymphomas |
Related Parent Applications (1)
| Application Number | Title | Priority Date | Filing Date |
|---|---|---|---|
| EP04783330.6 Division | 2004-09-03 |
Publications (2)
| Publication Number | Publication Date |
|---|---|
| EP2157524A2 true EP2157524A2 (en) | 2010-02-24 |
| EP2157524A3 EP2157524A3 (en) | 2010-12-08 |
Family
ID=34272947
Family Applications (2)
| Application Number | Title | Priority Date | Filing Date |
|---|---|---|---|
| EP09170243A Withdrawn EP2157524A3 (en) | 2003-09-03 | 2004-09-03 | Methods for identifying, diagnosing, and predicting survival of lymphomas |
| EP04783330A Withdrawn EP1664762A4 (en) | 2003-09-03 | 2004-09-03 | Methods for identifying, diagnosing, and predicting survival of lymphomas |
Family Applications After (1)
| Application Number | Title | Priority Date | Filing Date |
|---|---|---|---|
| EP04783330A Withdrawn EP1664762A4 (en) | 2003-09-03 | 2004-09-03 | Methods for identifying, diagnosing, and predicting survival of lymphomas |
Country Status (5)
| Country | Link |
|---|---|
| US (1) | US7711492B2 (en) |
| EP (2) | EP2157524A3 (en) |
| AU (1) | AU2004271192B2 (en) |
| CA (1) | CA2537254A1 (en) |
| WO (1) | WO2005024043A2 (en) |
Cited By (1)
| Publication number | Priority date | Publication date | Assignee | Title |
|---|---|---|---|---|
| WO2021064230A1 (en) * | 2019-10-02 | 2021-04-08 | Ophiomics - Investigação E Desenvolvimento Em Biotecnologia, Sa | Clinical and molecular prognostic markers for liver transplantation |
Families Citing this family (48)
| Publication number | Priority date | Publication date | Assignee | Title |
|---|---|---|---|---|
| EP1766086A4 (en) | 2004-05-21 | 2009-10-28 | Univ Arkansas | Use of gene expression profiling to predict survival in cancer patient |
| US7741035B2 (en) * | 2004-05-21 | 2010-06-22 | Board Of Trustees Of The University Of Arkansas | Use of gene expression profiling to predict survival in cancer patient |
| CA2568886A1 (en) * | 2004-07-02 | 2006-02-09 | Genentech, Inc. | Compositions and methods for treatment of non-hodgkin's lymphoma |
| US8293716B2 (en) * | 2005-05-26 | 2012-10-23 | Ramot At Tel Aviv University Ltd. | Method of treating cancer by modulation of mortalin |
| WO2007011856A2 (en) * | 2005-07-15 | 2007-01-25 | The Trustees Of Columbia University In The City Of New York | Compositions and methods for differential diagnosis of chronic lymphocytic leukemia |
| ES2324435B1 (en) | 2005-10-27 | 2010-05-31 | Fundacion Para El Estudio De La Hematologia Y Hemoterapia De Aragon (Fehha) | PROCEDURE AND DEVICE OF IN VITRO MRNA ANALYSIS OF GENES INVOLVED IN HEMATOLOGICAL NEOPLASIAS. |
| SI2913343T1 (en) | 2005-12-20 | 2019-01-31 | Sbi Biotech Co., Ltd. | Anti-ILT7 antibody |
| WO2007071829A2 (en) * | 2005-12-22 | 2007-06-28 | Dermagene Oy | Methods and means related to diseases |
| US20070243561A1 (en) * | 2006-02-16 | 2007-10-18 | Ben Geeraerts | Prognostic markers in chronic lymphocytic leukemia |
| GB2435882A (en) * | 2006-03-09 | 2007-09-12 | Bioinvent Int Ab | Detection and treatment of mantle cell lymphoma |
| WO2008032324A2 (en) * | 2006-09-14 | 2008-03-20 | Ramot At Tel Aviv University Ltd. | Combination therapy for tumoral disease treatment |
| WO2008043104A2 (en) * | 2006-10-06 | 2008-04-10 | Applied Genomics Inc. | Reagents and methods for use in cancer diagnosis, classification and therapy |
| AU2007221966A1 (en) * | 2006-12-08 | 2008-06-26 | Centenary Institute Of Cancer Medicine And Cell Biology | Assay for response to proteasome inhibitors |
| US20080233106A1 (en) * | 2007-03-22 | 2008-09-25 | National University Of Ireland | Markers for labour |
| US20100234292A1 (en) * | 2007-04-16 | 2010-09-16 | Ipsogen | Methods of assessing a propensity of clinical outcome for a female mammal suffering from breast cancer |
| GB0709092D0 (en) * | 2007-05-11 | 2007-06-20 | Borrebaeck Carl | Diagnosis and method of disease |
| KR100936286B1 (en) * | 2007-07-26 | 2010-01-14 | 한국과학기술연구원 | Marker genes based on Amiodarone treatment for screening of drug inducing pulmonary toxicity and screening method using thereof |
| WO2009040819A2 (en) * | 2007-09-25 | 2009-04-02 | Ramot At Tel Aviv University Ltd. | DOWN-REGULATION OF MORTALIN BY siRNA |
| ES2685678T3 (en) * | 2007-10-23 | 2018-10-10 | Clinical Genomics Pty Ltd | A method for the diagnosis of neoplasms - II |
| MX2010005080A (en) * | 2007-11-07 | 2010-07-28 | Genentech Inc | Methods and compositions for assessing responsiveness of b-cell lymphoma to treatment with anti-cd40 antibodies. |
| US8042073B1 (en) | 2007-11-28 | 2011-10-18 | Marvell International Ltd. | Sorted data outlier identification |
| US20110195064A1 (en) | 2008-06-06 | 2011-08-11 | The United States Of America, As Represented By The Secretary, Department Of Health And Human Serv | Survival predictor for diffuse large b cell lymphoma |
| EP2419531B1 (en) | 2009-04-18 | 2016-09-07 | Genentech, Inc. | Methods for assessing responsiveness of b-cell lymphoma to treatment with anti-cd40 antibodies |
| EP2430579A2 (en) * | 2009-05-11 | 2012-03-21 | Koninklijke Philips Electronics N.V. | Device and method for comparing molecular signatures |
| US20130143747A1 (en) * | 2011-12-05 | 2013-06-06 | Myriad Genetics, Incorporated | Methods of detecting cancer |
| US20130058863A1 (en) * | 2010-02-04 | 2013-03-07 | Jake Yue Chen | 4-Protein Biomarker Panel for the Diagnosis of Lymphoma from Biospecimen |
| CA2800913C (en) | 2010-06-03 | 2019-07-23 | Pharmacyclics, Inc. | The use of inhibitors of bruton's tyrosine kinase (btk) |
| WO2013010136A2 (en) | 2011-07-13 | 2013-01-17 | Pharmacyclics, Inc. | Inhibitors of bruton's tyrosine kinase |
| US9589099B2 (en) * | 2011-07-21 | 2017-03-07 | The Chinese University Of Hong Kong | Determination of gene expression levels of a cell type |
| WO2013082105A1 (en) * | 2011-11-29 | 2013-06-06 | Albert Einstein College Of Medicine Of Yeshiva University | Stat3 activation as a marker for classification and prognosis of dlbcl patients |
| CN110354132A (en) | 2012-06-04 | 2019-10-22 | 药品循环有限责任公司 | The crystalline form of bruton's tyrosine kinase inhibitor |
| SG11201500922RA (en) * | 2012-08-06 | 2015-04-29 | Inserm Inst Nat De La Santé Et De La Rech Médicale | Methods and kits for screening patients with a cancer |
| EP2953544B1 (en) * | 2013-02-06 | 2019-05-08 | Intervet Inc. | System for determining antibiotic effectiveness in respiratory diseased using auscultation analysis |
| EP2999796B1 (en) | 2013-05-20 | 2017-10-25 | BioVentures, LLC | Gep5 model for multiple myeloma |
| CN106232831B (en) | 2013-11-06 | 2021-02-26 | 美国卫生和人力服务部 | Method for subtype classification of lymphoma types by expression profiling |
| EP3117009B1 (en) * | 2014-03-11 | 2020-04-08 | Institut National de la Sante et de la Recherche Medicale (INSERM) | Methods and kits for classifying diffuse large b-cell lymphoma (dlbcl) into gcb-dlbcl or into abc-dlbcl |
| US20170029904A1 (en) * | 2014-04-07 | 2017-02-02 | The Brigham And Women's Hospital, Inc. | Classification of myc-driven b-cell lymphomas |
| EP2995689B1 (en) * | 2014-09-11 | 2017-09-13 | Warszawski Uniwersytet Medyczny | Stratification of B-cell lymphoma cases using a gene expression signature |
| AU2016226279B2 (en) | 2015-03-03 | 2021-11-11 | Pharmacyclics Llc | Pharmaceutical formulations of Bruton's tyrosine kinase inhibtor |
| MA41828A (en) | 2015-03-27 | 2018-01-30 | Pharmacyclics Llc | CO-CRYSTALS OF A TYROSINE KINASE INHIBITOR FROM BRUTON |
| MA41827A (en) | 2015-03-27 | 2018-01-30 | Pharmacyclics Llc | SOLVATED FORMS OF A BRUTON TYROSINE KINASE INHIBITOR |
| AU2016326499A1 (en) * | 2015-09-25 | 2018-04-12 | Celgene Corporation | Methods for treating diffuse large B-cell lymphoma and the use of biomarkers as a predictor of responsiveness to drugs |
| MA43649A (en) | 2016-01-19 | 2018-11-28 | Janssen Pharmaceutica Nv | FORMULATIONS / COMPOSITIONS INCLUDING A BTK INHIBITOR |
| WO2017125424A1 (en) | 2016-01-19 | 2017-07-27 | Janssen Pharmaceutica Nv | Formulations/compositions comprising a btk inhibitor |
| CA3021569A1 (en) | 2016-04-20 | 2017-10-26 | The United States Of America, As Represented By The Secretary, Department Of Health And Human Services | Evaluation of mantle cell lymphoma and methods related thereto |
| US9963748B2 (en) * | 2016-05-13 | 2018-05-08 | Roche Molecular Systems, Inc. | Methods and compositions for classifying DLBCL |
| WO2018231589A1 (en) * | 2017-06-14 | 2018-12-20 | The United States Of America, As Represented By The Secretary, Department Of Health And Human Services | Method for determining lymphoma type |
| CN111621565B (en) * | 2020-05-07 | 2023-12-15 | 杭州可帮基因科技有限公司 | Diffuse large B cell lymphoma molecular typing kit and typing device |
Citations (30)
| Publication number | Priority date | Publication date | Assignee | Title |
|---|---|---|---|---|
| US5143854A (en) | 1989-06-07 | 1992-09-01 | Affymax Technologies N.V. | Large scale photolithographic solid phase synthesis of polypeptides and receptor binding screening thereof |
| US5242974A (en) | 1991-11-22 | 1993-09-07 | Affymax Technologies N.V. | Polymer reversal on solid surfaces |
| US5252743A (en) | 1989-11-13 | 1993-10-12 | Affymax Technologies N.V. | Spatially-addressable immobilization of anti-ligands on surfaces |
| US5324633A (en) | 1991-11-22 | 1994-06-28 | Affymax Technologies N.V. | Method and apparatus for measuring binding affinity |
| US5384261A (en) | 1991-11-22 | 1995-01-24 | Affymax Technologies N.V. | Very large scale immobilized polymer synthesis using mechanically directed flow paths |
| US5424186A (en) | 1989-06-07 | 1995-06-13 | Affymax Technologies N.V. | Very large scale immobilized polymer synthesis |
| US5491074A (en) | 1993-04-01 | 1996-02-13 | Affymax Technologies Nv | Association peptides |
| US5527681A (en) | 1989-06-07 | 1996-06-18 | Affymax Technologies N.V. | Immobilized molecular synthesis of systematically substituted compounds |
| US5550215A (en) | 1991-11-22 | 1996-08-27 | Holmes; Christopher P. | Polymer reversal on solid surfaces |
| US5571639A (en) | 1994-05-24 | 1996-11-05 | Affymax Technologies N.V. | Computer-aided engineering system for design of sequence arrays and lithographic masks |
| US5578832A (en) | 1994-09-02 | 1996-11-26 | Affymetrix, Inc. | Method and apparatus for imaging a sample on a device |
| US5599695A (en) | 1995-02-27 | 1997-02-04 | Affymetrix, Inc. | Printing molecular library arrays using deprotection agents solely in the vapor phase |
| US5624711A (en) | 1995-04-27 | 1997-04-29 | Affymax Technologies, N.V. | Derivatization of solid supports and methods for oligomer synthesis |
| US5631734A (en) | 1994-02-10 | 1997-05-20 | Affymetrix, Inc. | Method and apparatus for detection of fluorescently labeled materials |
| US5677195A (en) | 1991-11-22 | 1997-10-14 | Affymax Technologies N.V. | Combinatorial strategies for polymer synthesis |
| US5708153A (en) | 1991-09-18 | 1998-01-13 | Affymax Technologies N.V. | Method of synthesizing diverse collections of tagged compounds |
| US5744305A (en) | 1989-06-07 | 1998-04-28 | Affymetrix, Inc. | Arrays of materials attached to a substrate |
| US5795716A (en) | 1994-10-21 | 1998-08-18 | Chee; Mark S. | Computer-aided visualization and analysis system for sequence evaluation |
| US5800992A (en) | 1989-06-07 | 1998-09-01 | Fodor; Stephen P.A. | Method of detecting nucleic acids |
| US5837832A (en) | 1993-06-25 | 1998-11-17 | Affymetrix, Inc. | Arrays of nucleic acid probes on biological chips |
| US5856174A (en) | 1995-06-29 | 1999-01-05 | Affymetrix, Inc. | Integrated nucleic acid diagnostic device |
| US5858659A (en) | 1995-11-29 | 1999-01-12 | Affymetrix, Inc. | Polymorphism detection |
| US5936324A (en) | 1998-03-30 | 1999-08-10 | Genetic Microsystems Inc. | Moving magnet scanner |
| US5968740A (en) | 1995-07-24 | 1999-10-19 | Affymetrix, Inc. | Method of Identifying a Base in a Nucleic Acid |
| US5981185A (en) | 1994-05-05 | 1999-11-09 | Beckman Coulter, Inc. | Oligonucleotide repeat arrays |
| US5981956A (en) | 1996-05-16 | 1999-11-09 | Affymetrix, Inc. | Systems and methods for detection of labeled materials |
| US6033860A (en) | 1997-10-31 | 2000-03-07 | Affymetrix, Inc. | Expression profiles in adult and fetal organs |
| US6090555A (en) | 1997-12-11 | 2000-07-18 | Affymetrix, Inc. | Scanned image alignment systems and methods |
| US6410229B1 (en) | 1995-09-15 | 2002-06-25 | Affymetrix, Inc. | Expression monitoring by hybridization to high density nucleic acid arrays |
| US20030104411A1 (en) | 1990-12-06 | 2003-06-05 | Affymetrix, Inc. | Arrays for detecting nucleic acids |
Family Cites Families (2)
| Publication number | Priority date | Publication date | Assignee | Title |
|---|---|---|---|---|
| WO2002024956A2 (en) * | 2000-09-19 | 2002-03-28 | Whitehead Institute For Biomedical Research | Genetic markers for tumors |
| WO2003021229A2 (en) | 2001-09-05 | 2003-03-13 | The Brigham And Women's Hospital, Inc. | Diagnostic and prognostic tests |
-
2004
- 2004-09-03 WO PCT/US2004/029041 patent/WO2005024043A2/en active Search and Examination
- 2004-09-03 US US10/934,930 patent/US7711492B2/en active Active
- 2004-09-03 EP EP09170243A patent/EP2157524A3/en not_active Withdrawn
- 2004-09-03 CA CA002537254A patent/CA2537254A1/en not_active Abandoned
- 2004-09-03 EP EP04783330A patent/EP1664762A4/en not_active Withdrawn
- 2004-09-03 AU AU2004271192A patent/AU2004271192B2/en active Active
Patent Citations (42)
| Publication number | Priority date | Publication date | Assignee | Title |
|---|---|---|---|---|
| US5744305A (en) | 1989-06-07 | 1998-04-28 | Affymetrix, Inc. | Arrays of materials attached to a substrate |
| US5800992A (en) | 1989-06-07 | 1998-09-01 | Fodor; Stephen P.A. | Method of detecting nucleic acids |
| US5424186A (en) | 1989-06-07 | 1995-06-13 | Affymax Technologies N.V. | Very large scale immobilized polymer synthesis |
| US5445934A (en) | 1989-06-07 | 1995-08-29 | Affymax Technologies N.V. | Array of oligonucleotides on a solid substrate |
| US5527681A (en) | 1989-06-07 | 1996-06-18 | Affymax Technologies N.V. | Immobilized molecular synthesis of systematically substituted compounds |
| US5143854A (en) | 1989-06-07 | 1992-09-01 | Affymax Technologies N.V. | Large scale photolithographic solid phase synthesis of polypeptides and receptor binding screening thereof |
| US5482867A (en) | 1989-11-13 | 1996-01-09 | Affymax Technologies N.V. | Spatially-addressable immobilization of anti-ligands on surfaces |
| US5252743A (en) | 1989-11-13 | 1993-10-12 | Affymax Technologies N.V. | Spatially-addressable immobilization of anti-ligands on surfaces |
| US5451683A (en) | 1989-11-13 | 1995-09-19 | Affymax Technologies N.V. | Spatially-addressable immobilization of anti-ligands on surfaces |
| US20030104411A1 (en) | 1990-12-06 | 2003-06-05 | Affymetrix, Inc. | Arrays for detecting nucleic acids |
| US5708153A (en) | 1991-09-18 | 1998-01-13 | Affymax Technologies N.V. | Method of synthesizing diverse collections of tagged compounds |
| US5789162A (en) | 1991-09-18 | 1998-08-04 | Affymax Technologies N.V. | Methods of synthesizing diverse collections of oligomers |
| US5770358A (en) | 1991-09-18 | 1998-06-23 | Affymax Technologies N.V. | Tagged synthetic oligomer libraries |
| US5550215A (en) | 1991-11-22 | 1996-08-27 | Holmes; Christopher P. | Polymer reversal on solid surfaces |
| US5384261A (en) | 1991-11-22 | 1995-01-24 | Affymax Technologies N.V. | Very large scale immobilized polymer synthesis using mechanically directed flow paths |
| US5324633A (en) | 1991-11-22 | 1994-06-28 | Affymax Technologies N.V. | Method and apparatus for measuring binding affinity |
| US6040193A (en) | 1991-11-22 | 2000-03-21 | Affymetrix, Inc. | Combinatorial strategies for polymer synthesis |
| US5677195A (en) | 1991-11-22 | 1997-10-14 | Affymax Technologies N.V. | Combinatorial strategies for polymer synthesis |
| US5242974A (en) | 1991-11-22 | 1993-09-07 | Affymax Technologies N.V. | Polymer reversal on solid surfaces |
| US5491074A (en) | 1993-04-01 | 1996-02-13 | Affymax Technologies Nv | Association peptides |
| US5837832A (en) | 1993-06-25 | 1998-11-17 | Affymetrix, Inc. | Arrays of nucleic acid probes on biological chips |
| US5631734A (en) | 1994-02-10 | 1997-05-20 | Affymetrix, Inc. | Method and apparatus for detection of fluorescently labeled materials |
| US5981185A (en) | 1994-05-05 | 1999-11-09 | Beckman Coulter, Inc. | Oligonucleotide repeat arrays |
| US5856101A (en) | 1994-05-24 | 1999-01-05 | Affymetrix, Inc. | Computer-aided engineering system for design of sequence arrays and lithographic masks |
| US5571639A (en) | 1994-05-24 | 1996-11-05 | Affymax Technologies N.V. | Computer-aided engineering system for design of sequence arrays and lithographic masks |
| US5593839A (en) | 1994-05-24 | 1997-01-14 | Affymetrix, Inc. | Computer-aided engineering system for design of sequence arrays and lithographic masks |
| US6025601A (en) | 1994-09-02 | 2000-02-15 | Affymetrix, Inc. | Method and apparatus for imaging a sample on a device |
| US5578832A (en) | 1994-09-02 | 1996-11-26 | Affymetrix, Inc. | Method and apparatus for imaging a sample on a device |
| US5795716A (en) | 1994-10-21 | 1998-08-18 | Chee; Mark S. | Computer-aided visualization and analysis system for sequence evaluation |
| US5974164A (en) | 1994-10-21 | 1999-10-26 | Affymetrix, Inc. | Computer-aided visualization and analysis system for sequence evaluation |
| US5599695A (en) | 1995-02-27 | 1997-02-04 | Affymetrix, Inc. | Printing molecular library arrays using deprotection agents solely in the vapor phase |
| US5831070A (en) | 1995-02-27 | 1998-11-03 | Affymetrix, Inc. | Printing oligonucleotide arrays using deprotection agents solely in the vapor phase |
| US5624711A (en) | 1995-04-27 | 1997-04-29 | Affymax Technologies, N.V. | Derivatization of solid supports and methods for oligomer synthesis |
| US5856174A (en) | 1995-06-29 | 1999-01-05 | Affymetrix, Inc. | Integrated nucleic acid diagnostic device |
| US5922591A (en) | 1995-06-29 | 1999-07-13 | Affymetrix, Inc. | Integrated nucleic acid diagnostic device |
| US5968740A (en) | 1995-07-24 | 1999-10-19 | Affymetrix, Inc. | Method of Identifying a Base in a Nucleic Acid |
| US6410229B1 (en) | 1995-09-15 | 2002-06-25 | Affymetrix, Inc. | Expression monitoring by hybridization to high density nucleic acid arrays |
| US5858659A (en) | 1995-11-29 | 1999-01-12 | Affymetrix, Inc. | Polymorphism detection |
| US5981956A (en) | 1996-05-16 | 1999-11-09 | Affymetrix, Inc. | Systems and methods for detection of labeled materials |
| US6033860A (en) | 1997-10-31 | 2000-03-07 | Affymetrix, Inc. | Expression profiles in adult and fetal organs |
| US6090555A (en) | 1997-12-11 | 2000-07-18 | Affymetrix, Inc. | Scanned image alignment systems and methods |
| US5936324A (en) | 1998-03-30 | 1999-08-10 | Genetic Microsystems Inc. | Moving magnet scanner |
Non-Patent Citations (52)
Cited By (1)
| Publication number | Priority date | Publication date | Assignee | Title |
|---|---|---|---|---|
| WO2021064230A1 (en) * | 2019-10-02 | 2021-04-08 | Ophiomics - Investigação E Desenvolvimento Em Biotecnologia, Sa | Clinical and molecular prognostic markers for liver transplantation |
Also Published As
| Publication number | Publication date |
|---|---|
| AU2004271192B2 (en) | 2011-11-17 |
| US20050164231A1 (en) | 2005-07-28 |
| EP2157524A3 (en) | 2010-12-08 |
| EP1664762A4 (en) | 2008-08-13 |
| AU2004271192A1 (en) | 2005-03-17 |
| CA2537254A1 (en) | 2005-03-17 |
| EP1664762A2 (en) | 2006-06-07 |
| US7711492B2 (en) | 2010-05-04 |
| WO2005024043A2 (en) | 2005-03-17 |
| WO2005024043A3 (en) | 2005-12-01 |
Similar Documents
| Publication | Publication Date | Title |
|---|---|---|
| AU2004271192B2 (en) | Methods for identifying, diagnosing, and predicting survival of lymphomas | |
| US10697975B2 (en) | Methods for identifying, diagnosing, and predicting survival of lymphomas | |
| US10370715B2 (en) | Methods for identifying, diagnosing, and predicting survival of lymphomas | |
| US20220325348A1 (en) | Biomarker signature method, and apparatus and kits therefor | |
| EP1723257B1 (en) | Classification, diagnosis and prognosis of acute myeloid leukemia by gene expression profiling | |
| US7640114B2 (en) | Method of diagnosis of cancer based on gene expression profiles in cells | |
| Dunphy | Gene expression profiling data in lymphoma and leukemia: review of the literature and extrapolation of pertinent clinical applications | |
| AU2012200939B2 (en) | Methods for identifying, diagnosing, and predicting survival of lymphomas | |
| EP1683862B1 (en) | Microarray for assessing neuroblastoma prognosis and method of assessing neuroblastoma prognosis | |
| AU2014200767A1 (en) | Methods for identifying, diagnosing, and predicting survival of lymphomas | |
| US20220399116A1 (en) | Systems and methods for assessing a bacterial or viral status of a sample | |
| Kennedy et al. | Single Nucleotide Polymorphism (SNP) and Antibody-based Cell Sorting (SNACS): A tool for demultiplexing single-cell DNA sequencing data | |
| AU2007277142B2 (en) | Methods for identifying, diagnosing, and predicting survival of lymphomas | |
| Robinson | Detecting changes in alternative mRNA processing from microarray expression data | |
| Boerma | Molecular definition of Burkitt Lymphoma | |
| Class et al. | Patent application title: Classification, Diagnosis and Prognosis of Acute Myeloid Leukemia by Gene Expression Profiling Inventors: Michael John Moorhouse (Rotterdam, NL) Petrus Jaobus Maria Valk (Rotterdam, NL) Hendrik Rudolf Delwell (Westmaas, NL) Bob Lowenberg (Rotterdam, NL) Petrus Johannes Van Der Spek (Lille, BE) Assignees: Erasmus Universiteit Rotterdam |
Legal Events
| Date | Code | Title | Description |
|---|---|---|---|
| PUAI | Public reference made under article 153(3) epc to a published international application that has entered the european phase |
Free format text: ORIGINAL CODE: 0009012 |
|
| 17P | Request for examination filed |
Effective date: 20090914 |
|
| AC | Divisional application: reference to earlier application |
Ref document number: 1664762 Country of ref document: EP Kind code of ref document: P |
|
| AK | Designated contracting states |
Kind code of ref document: A2 Designated state(s): AT BE BG CH CY CZ DE DK EE ES FI FR GB GR HU IE IT LI LU MC NL PL PT RO SE SI SK TR |
|
| AX | Request for extension of the european patent |
Extension state: AL HR LT LV MK |
|
| RIC1 | Information provided on ipc code assigned before grant |
Ipc: C12Q 1/68 20060101ALN20100618BHEP Ipc: G06F 19/00 20060101AFI20091218BHEP |
|
| PUAL | Search report despatched |
Free format text: ORIGINAL CODE: 0009013 |
|
| AK | Designated contracting states |
Kind code of ref document: A3 Designated state(s): AT BE BG CH CY CZ DE DK EE ES FI FR GB GR HU IE IT LI LU MC NL PL PT RO SE SI SK TR |
|
| AX | Request for extension of the european patent |
Extension state: AL HR LT LV MK |
|
| 17Q | First examination report despatched |
Effective date: 20110819 |
|
| STAA | Information on the status of an ep patent application or granted ep patent |
Free format text: STATUS: THE APPLICATION IS DEEMED TO BE WITHDRAWN |
|
| 18D | Application deemed to be withdrawn |
Effective date: 20120301 |