EP2275578A2 - Identification of markers in esophageal cancer, colon cancer, head and neck cancer and melanoma - Google Patents
Identification of markers in esophageal cancer, colon cancer, head and neck cancer and melanoma Download PDFInfo
- Publication number
- EP2275578A2 EP2275578A2 EP10183750A EP10183750A EP2275578A2 EP 2275578 A2 EP2275578 A2 EP 2275578A2 EP 10183750 A EP10183750 A EP 10183750A EP 10183750 A EP10183750 A EP 10183750A EP 2275578 A2 EP2275578 A2 EP 2275578A2
- Authority
- EP
- European Patent Office
- Prior art keywords
- seq
- pcr
- mrna
- nucleic acid
- lymph node
- Prior art date
- Legal status (The legal status is an assumption and is not a legal conclusion. Google has not performed a legal analysis and makes no representation as to the accuracy of the status listed.)
- Withdrawn
Links
Images


Classifications
-
- C—CHEMISTRY; METALLURGY
- C12—BIOCHEMISTRY; BEER; SPIRITS; WINE; VINEGAR; MICROBIOLOGY; ENZYMOLOGY; MUTATION OR GENETIC ENGINEERING
- C12Q—MEASURING OR TESTING PROCESSES INVOLVING ENZYMES, NUCLEIC ACIDS OR MICROORGANISMS; COMPOSITIONS OR TEST PAPERS THEREFOR; PROCESSES OF PREPARING SUCH COMPOSITIONS; CONDITION-RESPONSIVE CONTROL IN MICROBIOLOGICAL OR ENZYMOLOGICAL PROCESSES
- C12Q1/00—Measuring or testing processes involving enzymes, nucleic acids or microorganisms; Compositions therefor; Processes of preparing such compositions
- C12Q1/68—Measuring or testing processes involving enzymes, nucleic acids or microorganisms; Compositions therefor; Processes of preparing such compositions involving nucleic acids
- C12Q1/6876—Nucleic acid products used in the analysis of nucleic acids, e.g. primers or probes
- C12Q1/6883—Nucleic acid products used in the analysis of nucleic acids, e.g. primers or probes for diseases caused by alterations of genetic material
- C12Q1/6886—Nucleic acid products used in the analysis of nucleic acids, e.g. primers or probes for diseases caused by alterations of genetic material for cancer
-
- C—CHEMISTRY; METALLURGY
- C12—BIOCHEMISTRY; BEER; SPIRITS; WINE; VINEGAR; MICROBIOLOGY; ENZYMOLOGY; MUTATION OR GENETIC ENGINEERING
- C12Q—MEASURING OR TESTING PROCESSES INVOLVING ENZYMES, NUCLEIC ACIDS OR MICROORGANISMS; COMPOSITIONS OR TEST PAPERS THEREFOR; PROCESSES OF PREPARING SUCH COMPOSITIONS; CONDITION-RESPONSIVE CONTROL IN MICROBIOLOGICAL OR ENZYMOLOGICAL PROCESSES
- C12Q2600/00—Oligonucleotides characterized by their use
- C12Q2600/112—Disease subtyping, staging or classification
-
- C—CHEMISTRY; METALLURGY
- C12—BIOCHEMISTRY; BEER; SPIRITS; WINE; VINEGAR; MICROBIOLOGY; ENZYMOLOGY; MUTATION OR GENETIC ENGINEERING
- C12Q—MEASURING OR TESTING PROCESSES INVOLVING ENZYMES, NUCLEIC ACIDS OR MICROORGANISMS; COMPOSITIONS OR TEST PAPERS THEREFOR; PROCESSES OF PREPARING SUCH COMPOSITIONS; CONDITION-RESPONSIVE CONTROL IN MICROBIOLOGICAL OR ENZYMOLOGICAL PROCESSES
- C12Q2600/00—Oligonucleotides characterized by their use
- C12Q2600/158—Expression markers
-
- C—CHEMISTRY; METALLURGY
- C12—BIOCHEMISTRY; BEER; SPIRITS; WINE; VINEGAR; MICROBIOLOGY; ENZYMOLOGY; MUTATION OR GENETIC ENGINEERING
- C12Q—MEASURING OR TESTING PROCESSES INVOLVING ENZYMES, NUCLEIC ACIDS OR MICROORGANISMS; COMPOSITIONS OR TEST PAPERS THEREFOR; PROCESSES OF PREPARING SUCH COMPOSITIONS; CONDITION-RESPONSIVE CONTROL IN MICROBIOLOGICAL OR ENZYMOLOGICAL PROCESSES
- C12Q2600/00—Oligonucleotides characterized by their use
- C12Q2600/16—Primer sets for multiplex assays
Definitions
- Metastatic lesions commonly are detected by histological techniques, including immunohistochemical techniques. Metastasized cells typically infiltrate the lymph nodes, and, thus in most instances, certain sentinel lymph nodes, lymph nodes where metastasized cells typically first infiltrate, are recognized for each cancer type and are analyzed for the presence of lesions, including micrometastases. Trained histologists often can detect metastatic lesions visually after tissue from a sentinel lymph node is sectioned and stained. Highly trained histologists often can visualize micrometasteses, but the ability to visualize such lesions varies from histologist-to-histologist.
- the present invention relates to a diagnostic method for detecting the presence of cancer cells in a patient by identifying the expression of certain markers indicative of the presence of cancer cell.
- the present invention relates to a method of identifying the expression of markers indicative of the presence of esophageal cancer cells in a lymph node of a patient.
- the method comprises determining if an mRNA species specific to one or more of CEA, CK7, CK19, CK20, VIL1, TACSTD1, and PVA is overabundant in an RNA sample prepared from the lymph node.
- the overabundance of the mRNA species is indicative of the presence of displaced cells of the esophagus in the lymph node.
- the present invention relates to a method of identifying the expression of markers indicative of the presence of cells of squamous cell carcinoma of the head and neck in a lymph node of a patient.
- the method comprises determining if an mRNA species specific to one or more of CEA, CK19, PTHrP, PVA, TACSTD1 and SGCA1.2 (SCCA1 + SCCA2) is overabundant in an RNA sample prepared from the lymph node.
- the overabundance of the mRNA species is indicative of the presence of displaced cells of a squamous cell carcinoma of the head and neck in the lymph node.
- the present invention relates to a method for identifying the expression or markers indicative of the presence of cells of a squamous cell carcinoma in a lymph node of a patient.
- the method comprises determining if an mRNA species specific to PVA is overabundant in an RNA sample prepared from the lymph node.
- the overabundance of the mRNA species is indicative of the presence of displaced cells of a squamous cell carcinoma in the lymph node.
- the present invention relates to a method for identifying the expression of markers indicative of the presence of colon cancer cells in a lymph node of a patient.
- the method comprises determining if an mRNA species specific to one or more of CDX1, TACSTD1 and VIL1 is overabundant in an RNA sample prepared from the lymph node.
- the overabundance of the mRNA species is indicative of the presence of displaced colon cells in the lymph node.
- the present invention relates to a method for identifying the expression of markers indicative of the presence of melanoma cells in a lymph node of a patient.
- the method comprises determining if an mRNA species specific to one or more ofMAGEA136-plex, MART1, and TYR is overabundant in an RNA sample prepared from the lymph node.
- the overabundance of the mRNA species is indicative of the presence of melanoma cells in the lymph node.
- the present invention relates to an article of manufacture comprising packaging material and one or more nucleic acids specific to one or more of CEA, CK7, CK19, CK20, VIL1, TACSTD1, and PVA.
- the packaging material comprises an indicia, for example and without limitation, a writing, illustration, label, tag, book, booklet and/or package insert, indicating that the one or more nucleic acids can be used in a method of identifying expression of markers indicative of the presence of esophageal cancer cells in a lymph node of a patient.
- the present invention relates to an article of manufacture comprising packaging material and one or more nucleic acids specific to one or more of CEA, CK19, PTHrP, PVA, TACSTD1 and SCCA1.2.
- the packaging material comprises an indicia indicating that the one or more nucleic acids can be used in a method of identifying expression of markers indicative of the presence of cells of a squamous cell carcinoma of the head and neck in a lymph node of a patient.
- the present invention relates to an article of manufacture comprising packaging material and one or more nucleic acids specific to one or more of CDX1, TACSTD1 and VIL1.
- the packaging material comprises an indicia indicating that the one or more nucleic acids can be used in a method of identifying expression of markers indicative of the presence of colon cancer cells in a lymph node of a patient.
- the present invention relates to an article of manufacture comprising packaging material and one or more nucleic acids specific to one or more of MAGEA136-plex, MART1 and TYR.
- the packaging material comprises an indicia indicating that the one or more nucleic acids can be used in a method of identifying expression of markers indicative of the presence of melanoma cells in a lymph node of a patient.
- the present invention relates to an article of manufacture comprising packaging material and one or more nucleic acids specific to PVA.
- the packaging material comprises an indicia indicating that the one or more nucleic acids can be used in a method of identifying expression of markers indicative of the presence of cells of a squamous cell carcinoma in a lymph node of a patient.
- the present invention relates to a composition
- a composition comprising one or more primers or probes specific to one or more of CEA, CK7, CK19, CK20, VIL1, TACSTD1, and PVA and RNA extracted from the lymph node of a patient diagnosed with or suspected of having esophageal cancer, or a nucleic acid, or analog thereof, derived from the RNA.
- the present invention relates to a composition
- a composition comprising one or more primers or probes specific to one or more of CEA, CK19, PTHrP, PVA, TACSTD1 and SCCA1.2 and RNA extracted from the lymph node of a patient diagnosed with or suspected of having squamous cell carcinoma of the head and neck, or a nucleic acid, or analog thereof, derived from the RNA.
- the present invention relates to a composition
- a composition comprising one or more primers or probes specific to one or more of CDX1, TACSTD1 and VIL1 and RNA extracted from the lymph node of a patient diagnosed with or suspected of having colon cancer, or a nucleic acid, or an analog thereof, derived from the RNA.
- the present invention relates to a composition
- a composition comprising one or more primers or probes specific to one or more of MAGEA136-plex, MART1 and TYR and RNA extracted from a lymph node of a patient diagnosed with or suspected of having melanoma, or a nucleic acid, or analog thereof, derived from the RNA.
- the present invention relates to a composition
- a composition comprising one or more primers or probes specific to PVA and RNA extracted from a sentinel lymph node of a patient diagnosed with or suspected of having a squamous cell carcinoma, or a nucleic acid, or analog thereof, derived from the RNA.
- compositions useful in identifying esophageal cancer, colon cancer, head and neck cancer and melanoma cells, including micrometastases, in lymph nodes Early detection of metastases typically is related to patient survival. Very small metastases often go undetected in histological study of lymph node biopsies, resulting in false negative results that result in decreased chances of patient survival.
- the nucleic acid detection assays described herein are much more discriminating than are histological studies in most instances (a few, excellent histologists are capable of identifying micrometastases in lymph node sections), and are robust and repeatable in the hands of any minimally-trained technician.
- the methods and compositions described herein are necessarily presented comprising expression of specific mRNA markers, this should be understood that it shall not be deemed to exclude methods and compositions comprising combinations of the specific markers and other markers known in the art.
- markers that are expressed in certain cancer types, including esophageal cancer, colon cancer, head and neck cancer and melanoma. These markers are markers specific to the tissue from which the particular cancer type arises and typically are not expressed, at least to the same levels, in lymphoid tissue. The presence and/or elevated expression of one or more of these markers in sentinel lymph node tissue is indicative of displaced cells in the lymphoid tissue, which correlates strongly with a cancer diagnosis.
- squamous cell carcinoma is a cancer arising, at least in part, from a squamous cell population and/or containing, at least in part, a squamous cell population including, without limitation, cancers of the cervix; penis; head and neck, including, without limitation cancers of the oral cavity, salivary glands, paranasal sinuses and nasal cavity, pharynx and larynx; lung; esophageal; skin other than melanoma; vulva and bladder.
- the terms “expression” and “expressed” mean production of a gene-specific mRNA by a cell.
- a “marker” is a gene that is expressed abnormally in a lymphatic biopsy.
- the markers described herein are mRNA species that are expressed in cells of a specific tumor source at a significantly higher level as compared to expression in lymphoid cells.
- Expression levels of mRNA can be quantifyd by a number of methods. Traditional methods include Northern blot analysis. More recently, nucleic acid detection methods have been devised that facilitate quantification of transcripts. Examples of PCR methods are described in United States Patent Application No. 10/090,326 ( US 10/090,326 ), incorporated herein by reference in its entirety. Other methods for determining expression levels of a given mRNA include isothermic amplification or detection assays and array technologies, as are known in the art, such as, without limitation, those described below.
- a typical PCR reaction includes multiple amplification steps, or cycles that selectively amplify a target nucleic acid species. Because detection of transcripts is necessary, the PCR reaction is coupled with a reverse transcription step (reverse transcription PCR, or RT-PCR).
- a typical PCR reaction includes three steps: a denaturing step in which a target nucleic acid is denatured; an annealing step in which a set of PCR primers (forward and backward primers) anneal to complementary DNA strands; and an elongation step in which a thermostable DNA polymerase elongates the primers. By repeating this step multiple times, a DNA fragment is amplified to produce an amplicon, corresponding to the target DNA sequence.
- Typical PCR reactions include 30 or more cycles of denaturation, annealing and elongation. In many cases, the annealing and elongation steps can be performed concurrently, that is at the same temperature, in which case the cycle contains only two steps.
- the lengths of the denaturation, annealing and elongation stages may be any desirable length of time. However, in attempting to shorten the PCR amplification reaction to a time suitable for intraoperative diagnosis, the lengths of these steps can be in the seconds range, rather than the minutes range.
- the denaturation step may be conducted for times of one second or less.
- the annealing and elongation steps optimally are less than 10 seconds each, and when conducted at the same temperature, the combination annealing/elongation step may be less than 10 seconds.
- each cycle may be shortened considerably without substantial deterioration of production of amplicons.
- Use of high concentrations of primers is helpful in shortening the PCR cycle time.
- High concentrations typically are greater than about 400nM, and often greater than about 800nM, though the optimal concentration of primers will vary somewhat from assay-to-assay.
- Sensitivity of RT-PCR assays may be enhanced by the use of a sensitive reverse transcriptase enzyme (described below) and/or high concentrations of reverse transcriptase primer to produce the initial target PCR template.
- PCR primer sets are pairs of forward and reverse oligonucleotide primers that anneal to a target DNA sequence to permit amplification of the target sequence, thereby producing a target sequence-specific amplicon.
- PCR primer sets can include two primers internal to the target sequence, or one primer internal to the target sequence and one specific to a target sequence that is ligated to the DNA or cDNA target, using a technique known as "ligation-anchored PCR" ( Troutt, A.B., et al. (1992), "Ligation-anchored PCR: A Simple Amplification Technique with Single-sided Specificity," Proc. Natl. Acad. Sci. USA, 89:9823-9825 ).
- a "derivative" of a specified oligonucleotide is an oligonucleotide that binds to the same target sequence as the specified oligonucleotide and amplifies the same target sequence to produce essentially the same amplicon as the specified oligonucleotide but for differences between the specified oligonucleotide and its derivative.
- the derivative may differ from the specified oligonucleotide by insertion, deletion and/or substitution of any residue of the specified sequence so long as the derivative substantially retains the characteristics of the specified sequence in its use for the same purpose as the specified sequence.
- reaction mixtures for any assay or reaction, such as a reverse transcription and PCR, are any compound or composition that is added to the reaction mixture including, without limitation, enzyme(s), nucleotides or analogs thereof, primers and primer sets, probes, antibodies or other binding reagents, detectable labels or tags, buffers, salts and co-factors.
- reaction mixture for a given assay or reaction includes all necessary compounds and/or compositions necessary to perform that assay or reaction, even if those compounds or compositions are not expressly indicated.
- Reagents for many common assays or reactions, such as enzymatic reaction are known in the art and typically are provided and/or suggested when the assay or reaction kit is sold.
- multiplexed PCR assays may be optimized, or balanced, by time-shifting the production of amplicons, rather than by manipulating primer concentrations. This may be achieved by using two primer sets, each primer set having a different Tm so that a two-stage PCR assay can be performed, with different annealing and/or elongation temperatures for each stage to favor the production of one amplicon over another.
- This time and temperature shifting method permits optimal balancing of the multiplex reaction without the difficulties faced when manipulation of primer concentrations is used to balance the reaction. This technique is especially useful in a multiplex reaction where it is desirable to amplify a rare cDNA along with a control cDNA.
- a quantitative reverse transcriptase polymerase chain reaction for rapidly and accurately detecting low abundance RNA species in a population of RNA molecules (for example, and without limitation, total RNA or mRNA), includes the steps of: a) incubating an RNA sample with a reverse transcriptase and a high concentration of a target sequence-specific reverse transcriptase primer under conditions suitable to generate cDNA; b) subsequently adding suitable polymerase chain reaction (PCR) reagents to the reverse transcriptase reaction, including a high concentration of a PCR primer set specific to the cDNA and a thermostable DNA polymerase to the reverse transcriptase reaction, and c) cycling the PCR reaction for a desired number of cycles and under suitable conditions to generate PCR product ("amplicons") specific to the cDNA,
- PCR polymerase chain reaction
- the reaction may be conducted in a single tube (all tubes, containers, vials, cells and the like in which a reaction is performed may be referred to herein, from time to time, generically, as a "reaction vessel"), removing a source of contamination typically found in two-tube reactions.
- reaction vessel all tubes, containers, vials, cells and the like in which a reaction is performed may be referred to herein, from time to time, generically, as a "reaction vessel"
- the reaction c) may be performed in the same tube as the reverse transcriptase reaction by adding sufficient reagents to the reverse transcriptase (RT) reaction to create good, or even optimal conditions for the PCR reaction to proceed.
- a single tube may be loaded, prior to the running of the reverse transcriptase reaction, with: 1) the reverse transcriptase reaction mixture, and 2) the PCR reaction mixture to be mixed with the cDNA mixture after the reverse transcriptase reaction is completed.
- the separation of the reverse transcriptase and the PCR reactions may be achieved by adding the PCR reagents, including the PCR primer set and thermostable DNA polymerase, after the reverse transcriptase reaction is completed.
- the PCR reagents are added mechanically by a robotic or fluidic means to make sample contamination less likely and to remove human error.
- the products of the QRT-PCR process may be compared after a fixed number of PCR cycles to determine the relative quantity of the RNA species as compared to a given reporter gene.
- One method of comparing the relative quantities of the products of the QRT-PCR process is by gel electrophoresis, for instance, by running the samples on a gel and detecting those samples by one of a number of known methods including, without limitation, Southern blotting and subsequent detection with a labeled probe, staining with ethidium bromide and incorporating fluorescent or radioactive tags in the amplicons.
- the progress of the quantitative PCR reactions typically is monitored by determining the relative rates of amplicon production for each PCR primer set.
- Monitoring amplicon production may be achieved by a number of processes, including without limitation, fluorescent primers, fluorogenic probes and fluorescent dyes that bind double-stranded DNA.
- a common method is the fluorescent 5' nuclease assay. This method exploits the 5' nuclease activity of certain thermostable DNA polymerases (such as Taq or Tfl DNA polymerases) to cleave an oligomeric probe during the PCR process. The oligomer is selected to anneal to the amplified target sequence under elongation conditions.
- the probe typically has a fluorescent reporter on its 5' end and a fluorescent quencher of the reporter at the 3' end. So long as the oligomer is intact, the fluorescent signal from the reporter is quenched. However, when the oligomer is digested during the elongation process, the fluorescent reporter no longer is in proximity to the quencher.
- the relative accumulation of free fluorescent reporter for a given amplicon may be compared to the accumulation of the same amplicons for a control sample and/or to that of a control gene, such as ⁇ -actin or 18S rRNA to determine the relative abundance of a given cDNA product of a given RNA in a RNA population.
- Products and reagents for the fluorescent 5' nuclease assay are readily available commercially, for instance from Applied Biosystems.
- Equipment and software also are readily available for monitoring amplicon accumulation in PCR and QRT-PCR according to the fluorescent 5' nuclease assay and other QPCR/QRT-PCR procedures, including the Smart Cycler, commercially available from Cepheid of Sunnyvale, California, the ABI Prism 7700 Sequence Detection System (TaqMan), commercially available from Applied Biosystems.
- a cartridge-based sample preparation system (GenXpert) combines a thermal cycler and fluorescent detection device having the capabilities of the Smart Cycler product with fluid circuits and processing elements capable of automatically extracting specific nucleic acids from a tissue sample and performing QPCR or QRT-PCR on the nucleic acid.
- the system uses disposable cartridges that can be configured and pre-loaded with a broad variety of reagents. Such a system can be configured to disrupt tissue and extract total RNA or mRNA from the sample.
- the reverse transcriptase reaction components can be added automatically to the RNA and the QPCR reaction components can be added automatically upon completion of the reverse transcriptase reaction.
- the PCR reaction may be monitored of production (or loss) of a particular fluorochrome from the reaction.
- the automated system will automatically alter the PCR conditions. In one example, this is particularly useful in the multiplexed embodiment described above, where a more-abundant (control) target species is amplified by the first, lower Tm, primer set at a lower temperature than the less abundant species amplified by the second, higher Tm, primer set.
- the annealing temperature is lower than the effective Tm of the first primer set.
- the annealing temperature then is automatically raised above the effective Tm of the first primer set when production of the first amplicon by the first primer set is detected.
- a first PCR reaction may be conducted at the first Tm and, when the first PCR reaction proceeds past a threshold level, a second primer with a different Tm is added, resulting in a sequential multiplexed reaction.
- the amounts of certain reverse transcriptase and the PCR reaction components typically are atypical in order to take advantage of the faster ramp times of some thermal cyclers.
- the primer concentrations are very high. Typical gene-specific primer concentrations for reverse transcriptase reactions are less than about 20 nM.
- the reverse transcriptase primer concentration was raised to greater than 20 nM, preferably at least about 50 nM, and typically about 100 nM.
- Standard PCR primer concentrations range from 100 nM to 300 nM. Higher concentrations may be used in standard PCR reactions to compensate for Tm variations. However, the referenced primer concentrations are for circumstances where no Tm compensation is needed.
- Proportionately higher concentrations of primers may be empirically determined and used if Tm compensation is necessary or desired.
- the PCR primer concentrations typically are greater than 200 nM, preferably greater than about 500 nM and typically about 800 nM.
- the ratio of reverse transcriptase primer to PCR primer is about 1 to 8 or more. The increase in primer concentrations permitted PCR experiments of 40 cycles to be conducted in less than 20 minutes.
- a sensitive reverse transcriptase may be preferred in certain circumstances where either low amounts of RNA are present or a target RNA is a low abundance RNA.
- sensitive reverse transcriptase it is meant a reverse transcriptase capable of producing suitable PCR templates from low copy number transcripts for use as PCR templates.
- the sensitivity of the sensitive reverse transcriptase may derive from the physical nature of the enzyme, or from specific reaction conditions of the reverse transcriptase reaction mixture that produces the enhanced sensitivity.
- SensiScript RT reverse transcriptase commercially available from Qiagen, Inc. of Valencia, California.
- This reverse transcriptase is optimized for the production of cDNA from RNA samples of ⁇ 50ng, but also has the ability to produce PCR templates from low copy number transcripts. In practice, in the assays described herein, adequate results were obtained for samples of up to, and even in excess of, about 400 ng RNA. Other sensitive reverse transcriptases having substantially similar ability to reverse transcribe low copy number transcripts would be equivalent sensitive reverse transcriptase for the purposes described herein. Notwithstanding the above, the ability of the sensitive reverse transcriptase to produce cDNA from low quantities of RNA is secondary to the ability of the enzyme, or enzyme reaction system to produce PCR templates from low copy number sequences.
- a multiplex PCR process involves production of two or more amplicons in the same reaction vessel. Multiplex amplicons may be analyzed by gel electrophoresis and detection of the amplicons by one of a variety of methods, such as, without limitation ethidium bromide staining, Southern blotting and hybridization to probes, or by incorporating fluorescent or radioactive moieties into the amplicons and subsequently viewing the product on a gel. However, real-time monitoring of the production of two or more amplicons is preferred. The fluorescent 5' nuclease assay is the most common monitoring method.
- Equipment for example, the above-described Smart Cycler and TaqMan products that permits the real-time monitoring of accumulation of two or more fluorescent reporters in the same tube.
- oligomers are provided corresponding to each amplicon species to be detected.
- the oligomer probe for each amplicon species has a fluorescent reporter with a different peak emission wavelength than the oligomer probe(s) for each other amplicons species.
- the accumulation of each unquenched fluorescent reporter can be monitored to determine the relative amounts of the target sequence corresponding to each amplicon.
- PCR primer sets having similar annealing and elongation kinetics and similar sized amplicons are desirable.
- the design and selection of appropriate PCR primer sets is a process that is well known to a person skilled in the art.
- the process for identifying optimal PCR primer sets, and respective ratios thereof to achieve a balanced multiplex reaction also is known.
- balanced it is meant that certain amplicon(s) do not out-compete the other amplicon(s) for resources, such as dNTPs or enzyme. For instance, by limiting the abundance of the PCR primers for the more abundant RNA species in an RT-PCR experiment will allow the detection of less abundant species.
- Equalization of the Tm (melting temperature) for all PCR primer sets also is encouraged. See, for instance, ABI PRISM 7700 Sequence Detection System User Bulletin #5, " Multiplex PCR with TaqMan VIC Probes", Applied Biosystems (1998/2001 ).
- a method has been described in WO 02/070751 for performing a multiplex PCR process, including QRT-PCR and QPCR, capable of detecting low copy number nucleic acid species along with one or more higher copy number species.
- the difference between low copy number and high copy number nucleic acid species is relative, but is referred to herein as a difference in the prevalence of a low (lower) copy number species and a high (higher) copy number species of at least about 30-fold, but more typically at least about 100-fold.
- the relative prevalence of two nucleic acid species to be amplified is more salient than the relative prevalence of the two nucleic acid species in relation to other nucleic acid species in a given nucleic acid sample because other nucleic acid species in the nucleic acid sample do not directly compete with the species to be amplified for PCR resources.
- the prevalence of any given nucleic acid species in a given nucleic acid sample, prior to testing, is unknown.
- the "expected" number of copies of a given nucleic acid species in an nucleic acid sample often is used herein and is based on historical data on the prevalence of that species in nucleic acid samples. For any given pair of nucleic acid species, one would expect, based on previous determinations of the relative prevalence of the two species in a sample, the prevalence of each species to fall within a range. By determining these ranges one would determine the difference in the expected number of target sequences for each species.
- mRNA species is identified as "overabundant” if it is present in statistically significant amounts over normal prevalence of the mRNA species in a sample from a normal patient or lymph node. As is abundantly illustrated in the examples and plots provided herein, a person of skill in the art would be able to ascertain statistically significant ranges or cutoffs for determining the precise definition of "overabundance" for any one or more mRNA species.
- the multiplex method involves performing a two- (or more) stage PCR amplification, permitting modulation of the relative rate of production of a first amplicon by a first primer set and a second amplicon by a second primer set during the respective amplification stages.
- PCR amplifications to produce amplicons directed to a lower abundance nucleic acid species are effectively "balanced" with PCR amplifications to produce amplicons directed to a higher abundance nucleic acid species.
- Separating the reaction into two or more temporal stages may be achieved by omitting the PCR primer set for any amplicons that are not to be produced in the first amplification stage. This is best achieved through use of automated processes, such as the GenXpert prototype system described above.
- Two or more separate amplification stages may be used to tailor and balance multiplex assays, along with, or to the exclusion of tailoring the concentration of the respective primer sets.
- a second method for temporally separating the PCR amplification process into two or more stages is to select PCR primer sets with variation in their respective Tm.
- primers for a lower copy number nucleic acid species would have a higher Tm (Tm 1 ) than primers for a higher abundance species (Tm 2 ).
- Tm 1 primers for a lower copy number nucleic acid species
- Tm 2 primers for a higher abundance species
- the first stage of PCR amplification is conducted for a predetermined number of cycles at a temperature sufficiently higher than Tm 2 so that there is substantially no amplification of the higher abundance species.
- the annealing and elongation steps of the PCR reaction are conducted at a lower temperature, typically about Tm 2 , so that both the lower abundance and the higher abundance amplimers are amplified.
- Tm refers to "effective Tm,” which is the Tm for any given primer in a given reaction mix, which depends on factors, including, without limitation, the nucleic acid sequence of the primer and the primer concentration in the reaction mixture.
- PCR amplification is a dynamic process.
- the higher temperature annealing stage may be carried out at any temperature typically ranging from just above the lower Tm to just below the higher Tm, so long as the reaction favors production of the amplicon by the higher Tm primer set.
- the annealing for the lower temperature reaction typically is at any temperature below the Tm of the low temperature primer set.
- the amplicon for the low abundance RNA is amplified at a rate faster than that the amplicon for the higher abundance RNA (and preferably to the substantial exclusion of production of the second amplicon), so that, prior to the second amplification stage, where it is desirable that amplification of all amplicons proceeds in a substantially balanced manner, the amplicon for the lower abundance RNA is of sufficient abundance that the amplification of the higher abundance RNA does not interfere with the amplification of the amplicon for the lower abundance RNA.
- the annealing and elongation steps may be performed above Tm 1 to gain specificity over efficiency (during the second stage of the amplification, since there is a relatively large number of low abundance nucleic acid amplicons, selectivity no longer is a significant issue, and efficiency of amplicon production is preferred). It, therefore, should be noted that although favorable in many instances, the temperature variations may not necessarily result in the complete shutdown of one amplification reaction over another.
- a first primer set with a first Tm may target a more-abundant template sequence (for instance, the control template sequence) and a second primer set with a higher Tm may target a less-abundant template sequence.
- the more-abundant template and the less-abundant template may both be amplified in a first stage at a temperature below the (lower) Tm of the first primer set.
- the annealing and/or elongation temperature of the reaction is raised above the Tm of the first primer set, but below the higher Tm of the second primer set to effectively shut down amplification of the more abundant template.
- Selection of three or more sets of PCR primer sets having three or more different Tms can be used to amplify sequences of varying abundance in a stepwise manner, so long as the differences in the Tms are sufficiently large to permit preferential amplification of desired sequences to the substantial exclusion of undesired sequences for a desired number of cycles.
- the lowest abundance sequences are amplified in a first stage for a predetermined number of cycles.
- the lowest abundance and the lesser abundance sequences are amplified in a second stage for a predetermined number of cycles.
- all sequences are amplified in a third stage.
- the minimum temperature for each stage may vary, depending on the relative efficiencies of each single amplification reaction of the multiplex reaction. It should be recognized that two or more amplimers may have substantially the same Tm, to permit amplification of more than one species of similar abundance at any stage of the amplification process.
- the three-stage reaction may also proceed stepwise from amplification of the most abundant nucleic acid species at the lowest annealing temperature to amplification of the least abundant species at the highest annealing temperature.
- an additional tool is provided for the "balancing" of multiplex PCR reactions besides the matching of Tms and using limiting amounts of one or more PCR primer sets.
- the exploitation of PCR primer sets with different Tms as a method for sequentially amplifying different amplicons may be preferred in certain circumstances to the sequential addition of additional primer sets.
- the use of temperature-dependent sequencing of multiplex PCR reactions may be coupled with the sequential physical addition of primer sets to a single reaction mixture.
- the internal positive controls are DNA oligonucleotides that have the same primer sequences as the target gene (CEA or tyrosinase) but have a different internal probe sequence. Selected sites in the IPC's optionally may be synthesized with uracil instead of thymine so that contamination with the highly concentrated mimic could be controlled using uracil DNA glycosylase, if required.
- the IPCs maybe added to any PCR reaction mastermix in amounts that are determined empirically to give Ct values typically greater than the Ct values of the endogenous target of the primer set.
- the PCR assays are then performed according to standard protocols, and even when there is no endogenous target for the primer set, the IPC would be amplified, thereby verifying that the failure to amplify the target endogenous DNA is not a failure of the PCR reagents in the mastermix.
- the IPC probe fluoresces differently than the probe for the endogenous sequences.
- a variation of this for use in RT-PCR reactions is where the IPC is an RNA and the RNA includes an RT primer sequence.
- the IPC verifies function of both the RT and PCR reactions. Both RNA and DNA IPCs (with different corresponding probes) may also be employed to differentiate difficulties in the RT and PCR reactions.
- the rapid QRT-PCR protocols described herein may be run in about 20 minutes. This short time period permits the assay to be run intraoperatively so that a surgeon can decide on a surgical course during a single operation (typically the patient will remain anesthetized and/or otherwise sedated in a single "operation", though there may be a waiting period between when the sample to be tested is obtained and the time the interoperative assay is complete), rather than requiring a second operation, or requiring the surgeon to perform unneeded or overly broad prophylactic procedures. For instance, in the surgical evaluation of certain cancers, including breast cancer, melanoma, lung cancer, esophageal cancer and colon cancer, tumors and sentinel lymph nodes are removed in a first operation.
- the sentinel nodes are later evaluated for micrometastases, and, when micrometastases are detected in a patient's sentinel lymph node, the patient will need a second operation, thereby increasing the patient's surgical risks and patient discomfort associated with multiple operations.
- a physician can make an immediate decision on how to proceed without requiring the patient to leave the operating room or associated facilities.
- the rapid test also is applicable to needle biopsies taken in a physician's office. A patient need not wait for days to get the results of a biopsy (such as a needle biopsy of a tumor or lymph node), but can now get more accurate results in a very short time.
- a probe in the context of gene expression analysis, is "specific to" a gene or transcript if under reaction conditions it can hybrizide specifically to transcripts of that gene within a sample, or sequences complementary thereto, and not to other transcripts.
- a probe in a diagnostic assay, is specific to a gene if it can bind to a specific transcript or desired family of transcripts in mRNA extracted from a specimen, to the practical exclusion (does not interfere substantially with the detection assay) of other transcripts.
- primers are specific to a gene if they specifically amplify a sequence of that gene, to the practical exclusion of other sequences in a sample.
- Table B provides primer and probe sequences for the mRNA quantification assays described and depicted in the Examples and Figures.
- Figures 1-16 provide non-limiting examples of cDNA sequences of the various mRNA species detected in the Examples. Although the sequences provided in Table B were found effective in the assays described in the examples, other primers and probes would likely be equally suited for use in the QRT-PCR and other mRNA detection and quantification assays, either described herein or as are known in the art. Design of alternate primer and probe sets for PCR assays, as well as for other mRNA detection assays is well within the abilities of one of average skill in the art.
- a number of computer software programs will generate primers and primer sets for PCR assays from cDNA sequences according to specified parameters.
- Non limiting examples of such software include, NetPrimer and Primer Premier 5, commercially available from PREMIER Biosoft International of Palo Alto, California, which also provides primer and probe design software for molecular beacon and array assays.
- Primers and/or probes for two or more different mRNAs can be identified, for example and without limitation, by aligning the two or more target sequences according to standard methods, determining common sequences between the two or more mRNAs and entering the common sequences into a suitable primer design computer program.
- a "primer or probe” for detecting a specific mRNA species is any primer, primer set and/or probe that can be utilized to detect and/or quantify the specific mRNA species.
- An "mRNA species” can be a single mRNA species, corresponding to a single mRNA expression product of a single gene, or can be multiple mRNAs that are detected by a single common primer and/or probe combination, such as the SCCA1.2 and MAGEA136-plex pecies described below.
- kits for detection of specific nucleic acids will be particularly useful.
- a kit typically comprises one or more reagents, such as, without limitation, nucleic acid primers or probes, packaged in a container, such as, without limitation, a vial, tube or bottle, in a package suitable for commercial distribution, such as, without limitation, a box, a sealed pouch, a blister pack and a carton.
- the package typically contains an indicia, for example and without limitation, a writing, illustration, label, book, booklet, tag and/or packaging insert, indicating that the packaged reagents can be used in a method for identifying expression of markers indicative of the presence of cancer cells in a lymph node of a patient.
- packaging materials includes any article used in the packaging, for distribution of reagents in a kit, including, without limitation, containers, vials, tubes, bottles, pouches, blister packaging, labels, tags, instruction sheets, and package inserts.
- kits would include reagents necessary for the one-tube QRT-PCR process described above.
- the kit would include the above-described reagents, including reverse transcriptase, a reverse transcriptase primer, a corresponding PCR primer set, a thermostable DNA polymerase, such as Taq polymerase, and a suitable fluorescent reporter, such as, without limitation, a probe for a fluorescent 5' nuclease assay, a molecular beacon probe, a single dye primer or a fluorescent dye specific to double-stranded DNA, such as ethidium bromide.
- the primers may be present in quantities that would yield the high concentrations described above.
- Thermostable DNA polymerases are commonly and commercially available from a variety of manufacturers. Additional materials in the kit may include: suitable reaction tubes or vials, a barrier composition, typically a wax bead, optionally including magnesium; reaction mixtures (typically 10X) for the reverse transcriptase and the PCR stages, including necessary buffers and reagents such as dNTPs; nuclease- or RNase- free water; RNase inhibitor; control nucleic acid(s) and/or any additional buffers, compounds, co-factors, ionic constituents, proteins and enzymes, polymers, and the like that may be used in reverse transcriptase and/or PCR stages of QRT-PCR reactions.
- suitable reaction tubes or vials typically a wax bead, optionally including magnesium
- reaction mixtures typically 10X
- nuclease- or RNase- free water including RNase inhibitor
- PCR primers and reverse transcriptase may be packaged individually to facilitate flexibility in configuring the assay, or together to increase ease of use and to reduce contamination.
- buffers, salts and co-factors can be packaged separately or together.
- kits also may include reagents and mechanical components suitable for the manual or automated extraction of nucleic acid from a tissue sample.
- reagents are known to those skilled in the art and typically are a matter of design choice.
- tissue is disrupted ultrasonically in a suitable lysis solution provided in the kit.
- the resultant lysate solution is then filtered and RNA is bound to RNA-binding magnetic beads also provided in the kit or cartridge.
- the bead-bound RNA is washed, and the RNA is eluted from the beads and placed into a suitable reverse transcriptase reaction mixture prior to the reverse transcriptase reaction.
- reagents and their mode of packaging typically are dictated by the physical configuration of the robotics and fluidics of the specific RNA extraction system, for example and without limitation, the GenXpert system.
- International Patent Publication Nos. WO 04/48931 , WO 03/77055 , WO 03/72253 , WO 03/55973 , WO 02/52030 , WO 02/18902 , WO 01/84463 , WO 01/57253 , WO 01/45845 , WO 00/73413 , WO 00/73412 and WO 00/72970 provide non-limiting examples of cartridge-based systems and related technology useful in the methods described herein.
- kits may be packaged together or separately, and each constituent may be presented in one or more tubes or vials, or in cartridge form, as is appropriate.
- the constituents, independently or together, may be packaged in any useful state, including without limitation, in a dehydrated, a lyophilized, a glassified or an aqueous state.
- the kits may take the physical form of a cartridge for use in automated processes, having two or more compartments including the above-described reagents. Suitable cartridges are disclosed for example in United States Patent Nos. 6,440,725 , 6,431,476 , 6,403,037 and 6,374,684 .
- Array technologies also can facilitate determining the expression level of two or more genes by facilitating performance of the desired reactions and their analysis by running multiple parallel reactions at the same time.
- One example of an array is the GeneChip® gene expression array, commercially available from Affymetrix, Inc. of Santa Clara, California.
- Patents illustrating array technology and uses therefor include, without limitation, United States Patent Nos. 6,040,138 , 6,245,517 , 6,251,601 , 6,261,776 , 6,306,643 , 6,309,823 , 6,346,413 , 6,406,844 and 6,416,952 .
- An “array”, such as a “microarray” can be a substrate containing one or more binding reagents, typically in discrete physical locations, permitting high throughput analysis of the binding of a sample to the array.
- an array contains probes specific to transcripts of one or more of the genes described herein affixed to a substrate.
- the probes can be nucleic acids or analogs thereof, as are known in the art.
- An array also can refer to a plurality of discrete reaction chambers, permitting multiple parallel reactions and detection events on a miniaturized scale.
- the nucleic acid quantification method is a rolling circle amplification method.
- rolling circle amplification methods are described in U.S. Patents Nos. 5,854,003 ; 6,183,960 ; 6,344,329 ; and 6,210,884 , each of which are incorporated herein by reference to the extent they teach methods for detecting and quantifying RNA species.
- a padlock probe is employed to facilitate the rolling circle amplification process.
- a padlock probe is a linear oligonucleotide or polynucleotide designed to include one target-complementary sequence at each end, and which is designed such that the two ends are brought immediately next to each other upon hybridization to the target sequence.
- the probe also includes a spacer between the target-complementary sequences that includes a polymerase primer site and a site for binding to a probe, such as a molecular beacon probe, for detecting the padlock probe spacer sequence.
- the probe ends can then be joined by enzymatic DNA ligation to form a circular template that can be amplified by polymerase extension of a complementary primer.
- Thousands of concatemerized copies of the template can be generated by each primer, permitting detection and quantification of the original RNA template.
- Quantification can be automated by use, for example and without limitation, of a molecular beacon probe or other probe capable of detecting accumulation of a target sequence.
- Padlock probe sequences target unique portions of the target RNA in order to ensure specific binding with limited or no cross-reactivity.
- RCA is an isothermic method in that the amplification is performed at one temperature.
- NASBA nucleic acid sequence-based amplification
- a typical NASBA reaction is initiated by the annealing of a first oligonucleotide primer to an RNA target in an RNA sample.
- the 3' end of the first primer is complementary to the target analyte; the 5' end encodes the T7 RNA polymerase promoter.
- AMV-RT reverse transcription
- RNA is digested with RNase H, permitting a second primer (sense) to anneal to the cDNA strand, permitting the DNA polymerase activity of the reverse transcriptase to be engaged, producing a double-stranded cDNA copy of the original RNA template, with a functional T7 RNA polymerase promoter at one end. T7 polymerase is then used to produce an additional RNA template, which is further amplified, though in reverse order, according to the same procedure.
- T7 polymerase is then used to produce an additional RNA template, which is further amplified, though in reverse order, according to the same procedure.
- a variety of other nucleic acid detection and/or amplification methods are known to those of skill in the art, including variations on the isothermic strand displacement, PCR and RCA methods described herein.
- Tissues and Pathological Evaluation Tissue specimens were obtained from tissue banks at the University of Pittsburgh Medical Center through IRB approved protocols. All specimens were snap frozen in liquid nitrogen and later embedded in OCT for frozen sectioning. Twenty 5-micron sections were cut from each tissue for RNA isolation. In addition, sections were cut and placed on slides for H&E and IHC analysis at the beginning, middle (between the tenth and eleventh sections for RNA), and end of the sections for RNA isolation. All three H&E slides from each specimen underwent pathological review to confirm presence of tumor, percentage of tumor, and to identify the presence of any contaminating tissues. All of the unstained slides were stored at -20°C.
- Immunohistochemistry evaluation was performed using the AE1/AE3 antibody cocktail (DAKO, Carpinteria, CA), and Vector Elite ABC kit and Vector AEC Chromagen (Vecta Laboratories, Burlingame, CA). THC was used as needed as needed to confirm the H&E histology.
- the screening was conducted in two phases. All potential markers entered the primary screening phase and expression was analyzed in 6 primary tumors and 10 benign lymph nodes obtained from patients without cancer (5 RNA pools with 2 lymph node RNA's per pool). Markers that showed good characteristics for lymph node metastasis detection passed into the secondary screening phase.
- the secondary screen consisted of expression analysis on 20-25 primary tumors, 20-25 histologically positive lymph nodes and 21 benign lymph nodes without cancer.
- RNA Isolation and cDNA Synthesis RNA was isolated using the RNeasy minikit (Qiagen, Valencia, CA) essentially as described by the manufacturer. The only modification was that we doubled the volume of lysis reagent and loaded the column in two steps. This was found to provide better RNA yield and purity, probably as a result of diluting out the OCT in the tissue sections. Reverse transcription was performed in 100- ⁇ l reaction volumes either with random hexamer priming or sequence-specific priming using a probe indicated in Table C and Superscript II (Invitrogen, Carlsbad, CA) reverse transcriptase. For the primary screen, three reverse transcription reactions were performed, each with 500ng of RNA.
- RNA input for primary tumors and positive nodes was also 500ng.
- the RNA input was 2000ng resulting in the equivalent of 80ng RNA per QPCR reaction.
- Quantitative PCR All quantitative PCR was performed on the ABI Prism 7700 Sequence Detection Instrument (Applied Biosystems, Foster City, CA). Relative expression of the marker genes was calculated using the delta-C T methods previously described and with ⁇ -glucuronidase as the endogenous control gene. All assays were designed for use with 5' nuclease hybridization probes although the primary screening was performed using SYBER Green quantification in order to save cost. Assays were designed using the ABI Primer Express Version 2.0 software and where possible, amplicons spanned exon junctions in order to provide cDNA specificity. All primer pairs were tested for amplification specificity (generation of a single band on gels) at 60, 62 and 64°C annealing temperature. In addition, PCR efficiency was estimated using SYBER green quantification prior to use in the primary screen. Further optimization and more precise estimates of efficiency were performed with 5'nuclease probes for all assays used in the secondary screen.
- RNAs from human placenta, thyroid, heart, colon, PCI13 cell line and SKBR3 cell line served as a universal positive expression control for all the genes in the marker screening process.
- each 50 ⁇ l reaction contained 1 ⁇ TaqMan buffer A (Applied Biosystems), 300nM each dNTP, 3.5mM MgCl 2 , 0.06 units/ ⁇ l Amplitaq Gold (Applied Biosystems), 0.25X SYBR Green I (Molecular Probes, Eugene, OR) and 200nM each primer.
- the amplification program comprised 2-stages with an initial 95°C Taq activation stage for 12 min followed by 40 cycles of 95°C denaturation for 15 s, 60 or 62 or 64°C anneal/extend for 60 s and a 10 second data collection step at a temperature 2-4°C below the T m of the specific PCR product being amplified (Tom B. Morrison, et al, 1998).
- a melting curve analysis was performed by collecting fluorescence data while increasing the temperature from 60°C-95°C over 20 minutes.
- Probe-based QPCR was performed as described previously ( Godfrey et al., Clinical Cancer Res. 2001 Dec., 7(12):4041-8 ). Briefly, reactions were performed with a probe concentration of 200nM and a 60 second anneal/extend phase at 60°C, or 62°C, or 64°C.
- the sequences of primers and probes purchased from IDT, Coralville, IA for genes evaluated in the secondary screen are listed in Table B, below.
- Table A identifies genes used in the following studies.
- Table B provides PCR primer and TAQMAN probe sequences used in the quantitative PCR and RT-PCR amplifications described herein.
- Table C provides RT primer sequences as used instead of random hexamer primers. All PCR and RT-PCR reactions were conducted using standard methods.
- T primary tumor
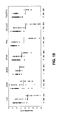
- FIG. 17 is a scatter plot showing the expression levels of CEA, CK7, CK19, CK20, TACSTD1 and VIL1 in primary tumor, tumor-positive lymph nodes and benign lymph nodes.
- Figures 18A-O provide scatter plots illustrating the ability of two-marker systems to distinguish between benign and malignant cells in a lymph node. Tables D and E provide the raw data from which the graphs of Figures 17 and 18A-O were generated.
- This data illustrates the strong correlation of expression of CEA, CK7, CK19, CK20, TACSTD1 and VIL1 markers, alone or in combination, in sentinel lymph nodes with the presence of malignant cells arising from an esophageal cancer in the sentinel lymph nodes.
- the bootstrap estimates are the average prediction properties from classifying the original 41 lymph nodes 1000 times.
- Table E Two Marker Prediction Characteristics for Esophageal Cancer Observed Data Parametric Bootstrap Estimates* Sensitivity Specificity Classification Accuracy Sensitivity Specificity Classification Accuracy
- CEA + CK7 .95 1.0 .98 .93 .99 .96 CEA + CK19 .95 1.0 .98 .97 .99 .98 CEA + CK20 .95 1.0 .98 .97 .99 .97 CEA + TACSTD1 1.0 1.0 1.0 1.0 .99 1.0 .99 CEA + Villin1 .95 1.0 .98 .95 1.0 .98 CK7 + CK19 1.0 1.0 1.0 .99 .99 CK7 + CK20 .95 1.0 .98 .93 .99 .97 CK7+TACSTD1 1.0 1.0 1.0 .99 1.0.
- Figure 19 is a scatter plot showing the expression levels of CEA, CK19, PTHrP, PVA, SCCA1.2 and TACSTD1 in primary tumor, tumor-positive lymph nodes and benign lymph nodes.
- Figures 20A-F provides scatter plots illustrating the ability of two-marker systems to distinguish between benign and malignant cells in a lymph node. Tables F and G provide the raw data from which the graphs of Figures 19 and 20A-F were generated. This data illustrates the strong correlation between expression of CEA, CK19, PTHrP, PVA, SCCA1.2 and TACSTD1 markers, alone or in combination, in sentinel lymph nodes and the presence of malignant cells arising from a squamous cell carcinoma of the head and neck in the sentinel lymph nodes.
- 500 bootstrap samples of lymph node expression levels were generated and a new decision rule based on the most accurate cutoff was formulated each time (total of 500 decision rules).
- the optimism in for each bootstrap sample is calculated as the difference between the classification statistic applied to the original data and applied to the bootstrap data.
- the average over all bootstrap samples is computed and reported as the bias in the values derived from the observed data (Efron's enhanced bootstrap prediction error estimate, see Efron and Tibshirani, An Introduction to the Bootstrap, Chapman and Hall/CRC Press Boca Raton, 1993 ).
- ** bias enhanced bootstrap estimate of optimism, or the amount that classification accuracy is overestimated when tested on the original data.
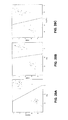
- Figure 21 is a scatter plot showing the expression levels of MART1, TYR and MAGEA136-plex in primary tumor, tumor-positive lymph nodes and benign lymph nodes.
- Figures 22A and 22B provide scatter plots illustrating the ability of two-marker systems to distinguish between benign and malignant cells in a lymph node. This data illustrates the strong correlation between expression ofMARTI, TYR and MAGEA136-plex markers, alone or in combination, in sentinel lymph nodes and the presence of malignant cells arising from melanoma in the sentinel lymph nodes.
- Figure 23 is a scatter plot showing the expression levels of CDX1, CEA, CK19, CK20, TACSTD1 and VIL1 in primary tumor, tumor-positive lymph nodes and benign lymph nodes. This data illustrates the strong correlation between expression of CDX1, CEA, CK19, CK20, TACSTD1 and VIL1 markers, in sentinel lymph nodes and the presence of malignant cells arising from colon cancer in the sentinel lymph nodes.
Abstract
Description
- This application claims the benefit under 35 U.S.C. §119(e) to priority United States Provisional Patent Application Nos.
60/586,599 60/587,019, both filed on July 9, 2004 - Provided are improved cancer diagnostic methods, along with compositions and apparatus useful in conducting those methods.
- Early detection of cancer typically leads to increased survival rates. Metastatic lesions commonly are detected by histological techniques, including immunohistochemical techniques. Metastasized cells typically infiltrate the lymph nodes, and, thus in most instances, certain sentinel lymph nodes, lymph nodes where metastasized cells typically first infiltrate, are recognized for each cancer type and are analyzed for the presence of lesions, including micrometastases. Trained histologists often can detect metastatic lesions visually after tissue from a sentinel lymph node is sectioned and stained. Highly trained histologists often can visualize micrometasteses, but the ability to visualize such lesions varies from histologist-to-histologist.
- In many surgical procedures to remove tumors, biopsies of sentinel lymph nodes are taken. The surgical procedure is then halted and the excised lymphatic tissue is then analyzed. Once it is determined that the tumor has metastasized, a second, more radical surgical procedure is performed, removing regional lymphatics. A rapid method for identifying tumors is therefore warranted, not only because more assays can be performed in a given time period, thereby increasing laboratory turnaround, but permitting accurate, intraoperative decisions to be made, rather than conducting a second surgical procedure. It is therefore desirable to identify useful diagnostics for malignancies, especially that permit rapid and/or intraoperative detection of lymphatic micrometastases.
- The present invention relates to a diagnostic method for detecting the presence of cancer cells in a patient by identifying the expression of certain markers indicative of the presence of cancer cell.
- In one embodiment, the present invention relates to a method of identifying the expression of markers indicative of the presence of esophageal cancer cells in a lymph node of a patient. The method comprises determining if an mRNA species specific to one or more of CEA, CK7, CK19, CK20, VIL1, TACSTD1, and PVA is overabundant in an RNA sample prepared from the lymph node. The overabundance of the mRNA species is indicative of the presence of displaced cells of the esophagus in the lymph node.
- In another embodiment, the present invention relates to a method of identifying the expression of markers indicative of the presence of cells of squamous cell carcinoma of the head and neck in a lymph node of a patient. The method comprises determining if an mRNA species specific to one or more of CEA, CK19, PTHrP, PVA, TACSTD1 and SGCA1.2 (SCCA1 + SCCA2) is overabundant in an RNA sample prepared from the lymph node. The overabundance of the mRNA species is indicative of the presence of displaced cells of a squamous cell carcinoma of the head and neck in the lymph node.
- In still another embodiment, the present invention relates to a method for identifying the expression or markers indicative of the presence of cells of a squamous cell carcinoma in a lymph node of a patient. The method comprises determining if an mRNA species specific to PVA is overabundant in an RNA sample prepared from the lymph node. The overabundance of the mRNA species is indicative of the presence of displaced cells of a squamous cell carcinoma in the lymph node.
- In yet another embodiment, the present invention relates to a method for identifying the expression of markers indicative of the presence of colon cancer cells in a lymph node of a patient. The method comprises determining if an mRNA species specific to one or more of CDX1, TACSTD1 and VIL1 is overabundant in an RNA sample prepared from the lymph node. The overabundance of the mRNA species is indicative of the presence of displaced colon cells in the lymph node.
- In still another embodiment, the present invention relates to a method for identifying the expression of markers indicative of the presence of melanoma cells in a lymph node of a patient. The method comprises determining if an mRNA species specific to one or more ofMAGEA136-plex, MART1, and TYR is overabundant in an RNA sample prepared from the lymph node. The overabundance of the mRNA species is indicative of the presence of melanoma cells in the lymph node.
- In yet a further embodiment, the present invention relates to an article of manufacture comprising packaging material and one or more nucleic acids specific to one or more of CEA, CK7, CK19, CK20, VIL1, TACSTD1, and PVA. The packaging material comprises an indicia, for example and without limitation, a writing, illustration, label, tag, book, booklet and/or package insert, indicating that the one or more nucleic acids can be used in a method of identifying expression of markers indicative of the presence of esophageal cancer cells in a lymph node of a patient.
- In a still further embodiment, the present invention relates to an article of manufacture comprising packaging material and one or more nucleic acids specific to one or more of CEA, CK19, PTHrP, PVA, TACSTD1 and SCCA1.2. The packaging material comprises an indicia indicating that the one or more nucleic acids can be used in a method of identifying expression of markers indicative of the presence of cells of a squamous cell carcinoma of the head and neck in a lymph node of a patient.
- In another embodiment, the present invention relates to an article of manufacture comprising packaging material and one or more nucleic acids specific to one or more of CDX1, TACSTD1 and VIL1. The packaging material comprises an indicia indicating that the one or more nucleic acids can be used in a method of identifying expression of markers indicative of the presence of colon cancer cells in a lymph node of a patient.
- In still another embodiment, the present invention relates to an article of manufacture comprising packaging material and one or more nucleic acids specific to one or more of MAGEA136-plex, MART1 and TYR. The packaging material comprises an indicia indicating that the one or more nucleic acids can be used in a method of identifying expression of markers indicative of the presence of melanoma cells in a lymph node of a patient.
- In still another embodiment, the present invention relates to an article of manufacture comprising packaging material and one or more nucleic acids specific to PVA. The packaging material comprises an indicia indicating that the one or more nucleic acids can be used in a method of identifying expression of markers indicative of the presence of cells of a squamous cell carcinoma in a lymph node of a patient.
- In yet another embodiment, the present invention relates to a composition comprising one or more primers or probes specific to one or more of CEA, CK7, CK19, CK20, VIL1, TACSTD1, and PVA and RNA extracted from the lymph node of a patient diagnosed with or suspected of having esophageal cancer, or a nucleic acid, or analog thereof, derived from the RNA.
- In a further embodiment, the present invention relates to a composition comprising one or more primers or probes specific to one or more of CEA, CK19, PTHrP, PVA, TACSTD1 and SCCA1.2 and RNA extracted from the lymph node of a patient diagnosed with or suspected of having squamous cell carcinoma of the head and neck, or a nucleic acid, or analog thereof, derived from the RNA.
- In still a further embodiment, the present invention relates to a composition comprising one or more primers or probes specific to one or more of CDX1, TACSTD1 and VIL1 and RNA extracted from the lymph node of a patient diagnosed with or suspected of having colon cancer, or a nucleic acid, or an analog thereof, derived from the RNA.
- In yet a further embodiment, the present invention relates to a composition comprising one or more primers or probes specific to one or more of MAGEA136-plex, MART1 and TYR and RNA extracted from a lymph node of a patient diagnosed with or suspected of having melanoma, or a nucleic acid, or analog thereof, derived from the RNA.
- In another embodiment, the present invention relates to a composition comprising one or more primers or probes specific to PVA and RNA extracted from a sentinel lymph node of a patient diagnosed with or suspected of having a squamous cell carcinoma, or a nucleic acid, or analog thereof, derived from the RNA.
-
-
Figure 1 is a listing af a cDNA sequence of the caudal-type homeo box transcription factor 1 (CDX1) marker (SEQ ID NO: 1). -
Figure 2 is a listing of a cDNA sequence for the carcinoembryonic antigen-related cell adhesion molecule 5 (CEA) marker (SEQ ID NO: 2). -
Figure 3 is a listing of a cDNA sequence for the cytokeratin 7 (CK7) marker (SEQ ID NO: 3). -
Figure 4 is a listing of a cDNA sequence for the cytokeratin 19 (CK19) marker (SEQ ID NO: 4). -
Figure 5 is a listing of a cDNA sequence for the cytokeratin 20 (CK20) marker (SEQ ID NO: 5). -
Figure 6 is a listing of a cDNA sequence for the melanoma antigen gene family A1 (MAGEA1) marker (SEQ ID NO: 6). -
Figure 7 is a listing of a cDNA sequence for the melanoma antigen gene family A3 (MAGEA3) marker (SEQ ID NO: 7). -
Figure 8 is a listing of a cDNA sequence for the melanoma antigen gene family A6 (MAGEA6) marker (SEQ ID NO: 8). -
Figure 9 is a listing of a cDNA sequence for the melanoma antigen recognized by T cells 1 (MART1) marker (SEQ ID NO: 9). -
Figure 10 is a listing of a cDNA sequence for the parathyroid hormone-related protein (PTHrP) marker (SEQ ID NO: 10). -
Figure 11 is a listing of a cDNA sequence for the pemphigu vulgatis antigen (PVA) marker (SEQ ID NO: 11). -
Figure 12 is a listing of a cDNA sequence for the squamous cell carcinoma antigen 1 (SCCA1) marker (SEQ ID NO: 12). -
Figure 13 is a listing of a cDNA sequence for the squamous cell carcinoma antigen 2 (SCCA2) marker (SEQ ID NO: 13). -
Figure 14 is a listing of a cDNA sequence for the tumor-associated calcium signal transducer 1 (TACSTD1) marker (SEQ ID NO: 14). -
Figure 15 is a listing of a cDNA sequence for the tyrosinase (TYR) marker (SEQ ID NO: 15). -
Figure 16 is a listing of a cDNA sequence for the villin 1 (VIL1) marker (SEQ ID NO: 16). -
Figure 17 is a scatter plot showing the expression levels of CEA, CK7, SCCA 1.2, CK20, TACSTD1, VIL and CK19 in primary tumor, tumor-positive lymph nodes and benign lymph nodes of an esophageal cancer patient. -
Figure 18A-O provide scatter plots illustrating the ability of two-marker systems to distinguish between benign and malignant cells in a lymph node of an esophageal cancer patient (negative - gray circle; positive - black circle). -
Figures 19 is a scatter plot showing the expression levels of CEA, CK19, PThRP, PVA, SCCA1.2 and TACSTD1 in primary tumor, tumor-positive lymph nodes and benign lymph nodes of a head & neck cancer patient. -
Figure 20A-F provides scatter plots illustrating the ability of two-marker systems to distinguish between benign and malignant cells in a lymph node of a head & neck cancer patient (negative - circle; positive - "+"). -
Figures 21 is a scatter plot showing the expression levels of MART1, TYR and MAGEA136-plex in primary tumor, tumor-positive lymph nodes and benign lymph nodes of a melanoma patient. -
Figures 22A and 22B provide scatter plots illustrating the ability of two-marker systems to distinguish between benign and malignant cells in a lymph node of a melanoma patient (negative - circle; positive - "+"). -
Figures 23 is a scatter plot showing the expression levels of CDX1, CEA, CK19, CK20, TACSTD1 and VIL1 in primary tumor, tumor-positive lymph nodes and benign lymph nodes of a colon cancer patient. - Provided are methods and compositions useful in identifying esophageal cancer, colon cancer, head and neck cancer and melanoma cells, including micrometastases, in lymph nodes. Early detection of metastases typically is related to patient survival. Very small metastases often go undetected in histological study of lymph node biopsies, resulting in false negative results that result in decreased chances of patient survival. The nucleic acid detection assays described herein are much more discriminating than are histological studies in most instances (a few, excellent histologists are capable of identifying micrometastases in lymph node sections), and are robust and repeatable in the hands of any minimally-trained technician. Although the methods and compositions described herein are necessarily presented comprising expression of specific mRNA markers, this should be understood that it shall not be deemed to exclude methods and compositions comprising combinations of the specific markers and other markers known in the art.
- To this end, a number of molecular markers are identified, that are expressed in certain cancer types, including esophageal cancer, colon cancer, head and neck cancer and melanoma. These markers are markers specific to the tissue from which the particular cancer type arises and typically are not expressed, at least to the same levels, in lymphoid tissue. The presence and/or elevated expression of one or more of these markers in sentinel lymph node tissue is indicative of displaced cells in the lymphoid tissue, which correlates strongly with a cancer diagnosis. As used herein a "squamous cell carcinoma" is a cancer arising, at least in part, from a squamous cell population and/or containing, at least in part, a squamous cell population including, without limitation, cancers of the cervix; penis; head and neck, including, without limitation cancers of the oral cavity, salivary glands, paranasal sinuses and nasal cavity, pharynx and larynx; lung; esophageal; skin other than melanoma; vulva and bladder.
- As used herein, the terms "expression" and "expressed" mean production of a gene-specific mRNA by a cell. In the context of the present disclosure, a "marker" is a gene that is expressed abnormally in a lymphatic biopsy. In one embodiment, the markers described herein are mRNA species that are expressed in cells of a specific tumor source at a significantly higher level as compared to expression in lymphoid cells.
- Expression levels of mRNA can be quantifyd by a number of methods. Traditional methods include Northern blot analysis. More recently, nucleic acid detection methods have been devised that facilitate quantification of transcripts. Examples of PCR methods are described in United States Patent Application No.
10/090,326 US 10/090,326 - The improved PCR methods described herein as well as in
US 10/090,326 - A typical PCR reaction includes multiple amplification steps, or cycles that selectively amplify a target nucleic acid species. Because detection of transcripts is necessary, the PCR reaction is coupled with a reverse transcription step (reverse transcription PCR, or RT-PCR). A typical PCR reaction includes three steps: a denaturing step in which a target nucleic acid is denatured; an annealing step in which a set of PCR primers (forward and backward primers) anneal to complementary DNA strands; and an elongation step in which a thermostable DNA polymerase elongates the primers. By repeating this step multiple times, a DNA fragment is amplified to produce an amplicon, corresponding to the target DNA sequence. Typical PCR reactions include 30 or more cycles of denaturation, annealing and elongation. In many cases, the annealing and elongation steps can be performed concurrently, that is at the same temperature, in which case the cycle contains only two steps.
- The lengths of the denaturation, annealing and elongation stages may be any desirable length of time. However, in attempting to shorten the PCR amplification reaction to a time suitable for intraoperative diagnosis, the lengths of these steps can be in the seconds range, rather than the minutes range. The denaturation step may be conducted for times of one second or less. The annealing and elongation steps optimally are less than 10 seconds each, and when conducted at the same temperature, the combination annealing/elongation step may be less than 10 seconds. Use of recently developed amplification techniques, such as conducting the PCR reaction in a Rayleigh-Bénard convection cell, also can dramatically shorten the PCR reaction time beyond these time limits (see, Krishnan, My et al., "PCR in a Rayleigh-Bénard convection cell." Science 298:793 (2002), and Braun, D. et al., "Exponential DNA Replication by Lominar Convection," Physical Review Letters, 91:158103).
- As described in
US 10/090,326 - The specificity of any given PCR reaction relies heavily, but not exclusively, on the identity of the primer sets. The primer sets are pairs of forward and reverse oligonucleotide primers that anneal to a target DNA sequence to permit amplification of the target sequence, thereby producing a target sequence-specific amplicon. PCR primer sets can include two primers internal to the target sequence, or one primer internal to the target sequence and one specific to a target sequence that is ligated to the DNA or cDNA target, using a technique known as "ligation-anchored PCR" (Troutt, A.B., et al. (1992), "Ligation-anchored PCR: A Simple Amplification Technique with Single-sided Specificity," Proc. Natl. Acad. Sci. USA, 89:9823-9825).
- As used herein, a "derivative" of a specified oligonucleotide is an oligonucleotide that binds to the same target sequence as the specified oligonucleotide and amplifies the same target sequence to produce essentially the same amplicon as the specified oligonucleotide but for differences between the specified oligonucleotide and its derivative. The derivative may differ from the specified oligonucleotide by insertion, deletion and/or substitution of any residue of the specified sequence so long as the derivative substantially retains the characteristics of the specified sequence in its use for the same purpose as the specified sequence.
- As used herein, "reagents" for any assay or reaction, such as a reverse transcription and PCR, are any compound or composition that is added to the reaction mixture including, without limitation, enzyme(s), nucleotides or analogs thereof, primers and primer sets, probes, antibodies or other binding reagents, detectable labels or tags, buffers, salts and co-factors. As used herein, unless expressed otherwise, a "reaction mixture" for a given assay or reaction includes all necessary compounds and/or compositions necessary to perform that assay or reaction, even if those compounds or compositions are not expressly indicated. Reagents for many common assays or reactions, such as enzymatic reaction, are known in the art and typically are provided and/or suggested when the assay or reaction kit is sold.
- As also described in
US 10/090,326 - A quantitative reverse transcriptase polymerase chain reaction (QRT-PCR) for rapidly and accurately detecting low abundance RNA species in a population of RNA molecules (for example, and without limitation, total RNA or mRNA), includes the steps of: a) incubating an RNA sample with a reverse transcriptase and a high concentration of a target sequence-specific reverse transcriptase primer under conditions suitable to generate cDNA; b) subsequently adding suitable polymerase chain reaction (PCR) reagents to the reverse transcriptase reaction, including a high concentration of a PCR primer set specific to the cDNA and a thermostable DNA polymerase to the reverse transcriptase reaction, and c) cycling the PCR reaction for a desired number of cycles and under suitable conditions to generate PCR product ("amplicons") specific to the cDNA, By temporally separating the reverse transcriptase and the PCR reactions, and by using reverse transcriptase-optimized and PCR-optimized primers, excellent specificity is obtained. The reaction may be conducted in a single tube (all tubes, containers, vials, cells and the like in which a reaction is performed may be referred to herein, from time to time, generically, as a "reaction vessel"), removing a source of contamination typically found in two-tube reactions. These reaction conditions permit very rapid QRT-PCR reactions, typically on the order of 20 minutes from the beginning of the reverse transcriptase reaction to the end of a 40 cycle PCR reaction.
- The reaction c) may be performed in the same tube as the reverse transcriptase reaction by adding sufficient reagents to the reverse transcriptase (RT) reaction to create good, or even optimal conditions for the PCR reaction to proceed. A single tube may be loaded, prior to the running of the reverse transcriptase reaction, with: 1) the reverse transcriptase reaction mixture, and 2) the PCR reaction mixture to be mixed with the cDNA mixture after the reverse transcriptase reaction is completed. The reverse transcriptase reaction mixture and the PCR reaction mixture may be physically separated by a solid, or semi-solid (including amorphous, glassy substances and waxy) barrier of a composition that melts at a temperature greater than the incubation temperature of the reverse transcriptase reaction, but below the denaturing temperature of the PCR reaction. The barrier composition may be hydrophobic in nature and forms a second phase with the RT and PCR reaction mixtures when in liquid form. One example of such a barrier composition is wax beads, commonly used in PCR reactions, such as the AMPLIWAX PCR GEM products commercially available from Applied Biosystems of Foster City, California.
- Alternatively, the separation of the reverse transcriptase and the PCR reactions may be achieved by adding the PCR reagents, including the PCR primer set and thermostable DNA polymerase, after the reverse transcriptase reaction is completed. Preferably the PCR reagents, are added mechanically by a robotic or fluidic means to make sample contamination less likely and to remove human error.
- The products of the QRT-PCR process may be compared after a fixed number of PCR cycles to determine the relative quantity of the RNA species as compared to a given reporter gene. One method of comparing the relative quantities of the products of the QRT-PCR process is by gel electrophoresis, for instance, by running the samples on a gel and detecting those samples by one of a number of known methods including, without limitation, Southern blotting and subsequent detection with a labeled probe, staining with ethidium bromide and incorporating fluorescent or radioactive tags in the amplicons.
- However, the progress of the quantitative PCR reactions typically is monitored by determining the relative rates of amplicon production for each PCR primer set. Monitoring amplicon production may be achieved by a number of processes, including without limitation, fluorescent primers, fluorogenic probes and fluorescent dyes that bind double-stranded DNA. A common method is the fluorescent 5' nuclease assay. This method exploits the 5' nuclease activity of certain thermostable DNA polymerases (such as Taq or Tfl DNA polymerases) to cleave an oligomeric probe during the PCR process. The oligomer is selected to anneal to the amplified target sequence under elongation conditions. The probe typically has a fluorescent reporter on its 5' end and a fluorescent quencher of the reporter at the 3' end. So long as the oligomer is intact, the fluorescent signal from the reporter is quenched. However, when the oligomer is digested during the elongation process, the fluorescent reporter no longer is in proximity to the quencher. The relative accumulation of free fluorescent reporter for a given amplicon may be compared to the accumulation of the same amplicons for a control sample and/or to that of a control gene, such as β-actin or 18S rRNA to determine the relative abundance of a given cDNA product of a given RNA in a RNA population. Products and reagents for the fluorescent 5' nuclease assay are readily available commercially, for instance from Applied Biosystems.
- Equipment and software also are readily available for monitoring amplicon accumulation in PCR and QRT-PCR according to the fluorescent 5' nuclease assay and other QPCR/QRT-PCR procedures, including the Smart Cycler, commercially available from Cepheid of Sunnyvale, California, the ABI Prism 7700 Sequence Detection System (TaqMan), commercially available from Applied Biosystems. A cartridge-based sample preparation system (GenXpert) combines a thermal cycler and fluorescent detection device having the capabilities of the Smart Cycler product with fluid circuits and processing elements capable of automatically extracting specific nucleic acids from a tissue sample and performing QPCR or QRT-PCR on the nucleic acid. The system uses disposable cartridges that can be configured and pre-loaded with a broad variety of reagents. Such a system can be configured to disrupt tissue and extract total RNA or mRNA from the sample. The reverse transcriptase reaction components can be added automatically to the RNA and the QPCR reaction components can be added automatically upon completion of the reverse transcriptase reaction.
- Further, the PCR reaction may be monitored of production (or loss) of a particular fluorochrome from the reaction. When the fluorochrome levels reach (or fall to) a desired level, the automated system will automatically alter the PCR conditions. In one example, this is particularly useful in the multiplexed embodiment described above, where a more-abundant (control) target species is amplified by the first, lower Tm, primer set at a lower temperature than the less abundant species amplified by the second, higher Tm, primer set. In the first stage of the PCR amplification, the annealing temperature is lower than the effective Tm of the first primer set. The annealing temperature then is automatically raised above the effective Tm of the first primer set when production of the first amplicon by the first primer set is detected. In a system that automatically dispenses multiple reagents from a cartridge, such as the GeneXpert system, a first PCR reaction may be conducted at the first Tm and, when the first PCR reaction proceeds past a threshold level, a second primer with a different Tm is added, resulting in a sequential multiplexed reaction.
- In the above-described reactions, the amounts of certain reverse transcriptase and the PCR reaction components typically are atypical in order to take advantage of the faster ramp times of some thermal cyclers. Specifically, the primer concentrations are very high. Typical gene-specific primer concentrations for reverse transcriptase reactions are less than about 20 nM. To achieve a rapid reverse transcriptase reaction on the order of one to two minutes, the reverse transcriptase primer concentration was raised to greater than 20 nM, preferably at least about 50 nM, and typically about 100 nM. Standard PCR primer concentrations range from 100 nM to 300 nM. Higher concentrations may be used in standard PCR reactions to compensate for Tm variations. However, the referenced primer concentrations are for circumstances where no Tm compensation is needed. Proportionately higher concentrations of primers may be empirically determined and used if Tm compensation is necessary or desired. To achieve rapid PCR reactions, the PCR primer concentrations typically are greater than 200 nM, preferably greater than about 500 nM and typically about 800 nM. Typically, the ratio of reverse transcriptase primer to PCR primer is about 1 to 8 or more. The increase in primer concentrations permitted PCR experiments of 40 cycles to be conducted in less than 20 minutes.
- A sensitive reverse transcriptase may be preferred in certain circumstances where either low amounts of RNA are present or a target RNA is a low abundance RNA. By the term "sensitive reverse transcriptase," it is meant a reverse transcriptase capable of producing suitable PCR templates from low copy number transcripts for use as PCR templates. The sensitivity of the sensitive reverse transcriptase may derive from the physical nature of the enzyme, or from specific reaction conditions of the reverse transcriptase reaction mixture that produces the enhanced sensitivity. One example of a sensitive reverse transcriptase is SensiScript RT reverse transcriptase, commercially available from Qiagen, Inc. of Valencia, California. This reverse transcriptase is optimized for the production of cDNA from RNA samples of <50ng, but also has the ability to produce PCR templates from low copy number transcripts. In practice, in the assays described herein, adequate results were obtained for samples of up to, and even in excess of, about 400 ng RNA. Other sensitive reverse transcriptases having substantially similar ability to reverse transcribe low copy number transcripts would be equivalent sensitive reverse transcriptase for the purposes described herein. Notwithstanding the above, the ability of the sensitive reverse transcriptase to produce cDNA from low quantities of RNA is secondary to the ability of the enzyme, or enzyme reaction system to produce PCR templates from low copy number sequences.
- As discussed above, the procedures described herein also may be used in multiplex QRT-PCR processes. In its broadest sense, a multiplex PCR process involves production of two or more amplicons in the same reaction vessel. Multiplex amplicons may be analyzed by gel electrophoresis and detection of the amplicons by one of a variety of methods, such as, without limitation ethidium bromide staining, Southern blotting and hybridization to probes, or by incorporating fluorescent or radioactive moieties into the amplicons and subsequently viewing the product on a gel. However, real-time monitoring of the production of two or more amplicons is preferred. The fluorescent 5' nuclease assay is the most common monitoring method. Equipment is now available (for example, the above-described Smart Cycler and TaqMan products) that permits the real-time monitoring of accumulation of two or more fluorescent reporters in the same tube. For multiplex monitoring of the fluorescent 5' nuclease assay, oligomers are provided corresponding to each amplicon species to be detected. The oligomer probe for each amplicon species has a fluorescent reporter with a different peak emission wavelength than the oligomer probe(s) for each other amplicons species. The accumulation of each unquenched fluorescent reporter can be monitored to determine the relative amounts of the target sequence corresponding to each amplicon.
- In traditional multiplex QPCR and QRT-PCR procedures, the selection of PCR primer sets having similar annealing and elongation kinetics and similar sized amplicons are desirable. The design and selection of appropriate PCR primer sets is a process that is well known to a person skilled in the art. The process for identifying optimal PCR primer sets, and respective ratios thereof to achieve a balanced multiplex reaction also is known. By "balanced," it is meant that certain amplicon(s) do not out-compete the other amplicon(s) for resources, such as dNTPs or enzyme. For instance, by limiting the abundance of the PCR primers for the more abundant RNA species in an RT-PCR experiment will allow the detection of less abundant species. Equalization of the Tm (melting temperature) for all PCR primer sets also is encouraged. See, for instance, ABI PRISM 7700 Sequence Detection System
User Bulletin # 5, "Multiplex PCR with TaqMan VIC Probes", Applied Biosystems (1998/2001). - Despite the above, for very low copy number transcripts, it is difficult to design accurate multiplex PCR experiments, even by limiting the PCR primer sets for the more abundant control species. One solution to this problem is to run the PCR reaction for the low abundance RNA in a separate tube than the PCR reaction for the more abundant species. However, that strategy does not take advantage of the benefits of running a multiplex PCR experiment. A two-tube process has several drawbacks, including cost, the addition of more room for experimental error and the increased chance of sample contamination, which is critical in PCR assays.
- A method has been described in
WO 02/070751 - As used herein, the prevalence of any given nucleic acid species in a given nucleic acid sample, prior to testing, is unknown. Thus, the "expected" number of copies of a given nucleic acid species in an nucleic acid sample often is used herein and is based on historical data on the prevalence of that species in nucleic acid samples. For any given pair of nucleic acid species, one would expect, based on previous determinations of the relative prevalence of the two species in a sample, the prevalence of each species to fall within a range. By determining these ranges one would determine the difference in the expected number of target sequences for each species. An mRNA species is identified as "overabundant" if it is present in statistically significant amounts over normal prevalence of the mRNA species in a sample from a normal patient or lymph node. As is abundantly illustrated in the examples and plots provided herein, a person of skill in the art would be able to ascertain statistically significant ranges or cutoffs for determining the precise definition of "overabundance" for any one or more mRNA species.
- The multiplex method involves performing a two- (or more) stage PCR amplification, permitting modulation of the relative rate of production of a first amplicon by a first primer set and a second amplicon by a second primer set during the respective amplification stages. By this method, PCR amplifications to produce amplicons directed to a lower abundance nucleic acid species are effectively "balanced" with PCR amplifications to produce amplicons directed to a higher abundance nucleic acid species. Separating the reaction into two or more temporal stages may be achieved by omitting the PCR primer set for any amplicons that are not to be produced in the first amplification stage. This is best achieved through use of automated processes, such as the GenXpert prototype system described above. Two or more separate amplification stages may be used to tailor and balance multiplex assays, along with, or to the exclusion of tailoring the concentration of the respective primer sets.
- A second method for temporally separating the PCR amplification process into two or more stages is to select PCR primer sets with variation in their respective Tm. In one example, primers for a lower copy number nucleic acid species would have a higher Tm (Tm1) than primers for a higher abundance species (Tm2). In this process, the first stage of PCR amplification is conducted for a predetermined number of cycles at a temperature sufficiently higher than Tm2 so that there is substantially no amplification of the higher abundance species. After the first stage of amplification, the annealing and elongation steps of the PCR reaction are conducted at a lower temperature, typically about Tm2, so that both the lower abundance and the higher abundance amplimers are amplified. It should be noted that Tm, as used herein and unless otherwise noted, refers to "effective Tm," which is the Tm for any given primer in a given reaction mix, which depends on factors, including, without limitation, the nucleic acid sequence of the primer and the primer concentration in the reaction mixture.
- It should be noted that PCR amplification is a dynamic process. When using temperature to modulate the respective PCR reactions in a multiplex PCR reaction, the higher temperature annealing stage may be carried out at any temperature typically ranging from just above the lower Tm to just below the higher Tm, so long as the reaction favors production of the amplicon by the higher Tm primer set. Similarly, the annealing for the lower temperature reaction typically is at any temperature below the Tm of the low temperature primer set.
- In the example provided above, in the higher temperature stage the amplicon for the low abundance RNA is amplified at a rate faster than that the amplicon for the higher abundance RNA (and preferably to the substantial exclusion of production of the second amplicon), so that, prior to the second amplification stage, where it is desirable that amplification of all amplicons proceeds in a substantially balanced manner, the amplicon for the lower abundance RNA is of sufficient abundance that the amplification of the higher abundance RNA does not interfere with the amplification of the amplicon for the lower abundance RNA. In the first stage of amplification, when the amplicon for the low abundance nucleic acid is preferentially amplified, the annealing and elongation steps may be performed above Tm1 to gain specificity over efficiency (during the second stage of the amplification, since there is a relatively large number of low abundance nucleic acid amplicons, selectivity no longer is a significant issue, and efficiency of amplicon production is preferred). It, therefore, should be noted that although favorable in many instances, the temperature variations may not necessarily result in the complete shutdown of one amplification reaction over another.
- In another variation of the above-described amplification reaction, a first primer set with a first Tm may target a more-abundant template sequence (for instance, the control template sequence) and a second primer set with a higher Tm may target a less-abundant template sequence. In this case, the more-abundant template and the less-abundant template may both be amplified in a first stage at a temperature below the (lower) Tm of the first primer set. When a threshold amount of amplicon corresponding to the more abundant template is reached, the annealing and/or elongation temperature of the reaction is raised above the Tm of the first primer set, but below the higher Tm of the second primer set to effectively shut down amplification of the more abundant template.
- Selection of three or more sets of PCR primer sets having three or more different Tms (for instance, Tm1 > Tm2 > Tm3) can be used to amplify sequences of varying abundance in a stepwise manner, so long as the differences in the Tms are sufficiently large to permit preferential amplification of desired sequences to the substantial exclusion of undesired sequences for a desired number of cycles. In that process, the lowest abundance sequences are amplified in a first stage for a predetermined number of cycles. Next, the lowest abundance and the lesser abundance sequences are amplified in a second stage for a predetermined number of cycles. Lastly, all sequences are amplified in a third stage. As with the two-stage reaction described above, the minimum temperature for each stage may vary, depending on the relative efficiencies of each single amplification reaction of the multiplex reaction. It should be recognized that two or more amplimers may have substantially the same Tm, to permit amplification of more than one species of similar abundance at any stage of the amplification process. As with the two-stage reaction, the three-stage reaction may also proceed stepwise from amplification of the most abundant nucleic acid species at the lowest annealing temperature to amplification of the least abundant species at the highest annealing temperature.
- By this sequential amplification method, an additional tool is provided for the "balancing" of multiplex PCR reactions besides the matching of Tms and using limiting amounts of one or more PCR primer sets. The exploitation of PCR primer sets with different Tms as a method for sequentially amplifying different amplicons may be preferred in certain circumstances to the sequential addition of additional primer sets. However, the use of temperature-dependent sequencing of multiplex PCR reactions may be coupled with the sequential physical addition of primer sets to a single reaction mixture.
- An internal positive control that confirms the operation of a particular amplification reaction for a negative result also may be used. The internal positive controls (IPC) are DNA oligonucleotides that have the same primer sequences as the target gene (CEA or tyrosinase) but have a different internal probe sequence. Selected sites in the IPC's optionally may be synthesized with uracil instead of thymine so that contamination with the highly concentrated mimic could be controlled using uracil DNA glycosylase, if required. The IPCs maybe added to any PCR reaction mastermix in amounts that are determined empirically to give Ct values typically greater than the Ct values of the endogenous target of the primer set. The PCR assays are then performed according to standard protocols, and even when there is no endogenous target for the primer set, the IPC would be amplified, thereby verifying that the failure to amplify the target endogenous DNA is not a failure of the PCR reagents in the mastermix. In this embodiment, the IPC probe fluoresces differently than the probe for the endogenous sequences. A variation of this for use in RT-PCR reactions is where the IPC is an RNA and the RNA includes an RT primer sequence. In this embodiment, the IPC verifies function of both the RT and PCR reactions. Both RNA and DNA IPCs (with different corresponding probes) may also be employed to differentiate difficulties in the RT and PCR reactions.
- The rapid QRT-PCR protocols described herein may be run in about 20 minutes. This short time period permits the assay to be run intraoperatively so that a surgeon can decide on a surgical course during a single operation (typically the patient will remain anesthetized and/or otherwise sedated in a single "operation", though there may be a waiting period between when the sample to be tested is obtained and the time the interoperative assay is complete), rather than requiring a second operation, or requiring the surgeon to perform unneeded or overly broad prophylactic procedures. For instance, in the surgical evaluation of certain cancers, including breast cancer, melanoma, lung cancer, esophageal cancer and colon cancer, tumors and sentinel lymph nodes are removed in a first operation. The sentinel nodes are later evaluated for micrometastases, and, when micrometastases are detected in a patient's sentinel lymph node, the patient will need a second operation, thereby increasing the patient's surgical risks and patient discomfort associated with multiple operations. With the ability to determine the expression levels of certain tumor-specific markers described herein in less than 30 minutes with increased accuracy, a physician can make an immediate decision on how to proceed without requiring the patient to leave the operating room or associated facilities. The rapid test also is applicable to needle biopsies taken in a physician's office. A patient need not wait for days to get the results of a biopsy (such as a needle biopsy of a tumor or lymph node), but can now get more accurate results in a very short time.
- As used herein, in the context of gene expression analysis, a probe is "specific to" a gene or transcript if under reaction conditions it can hybrizide specifically to transcripts of that gene within a sample, or sequences complementary thereto, and not to other transcripts. Thus, in a diagnostic assay, a probe is specific to a gene if it can bind to a specific transcript or desired family of transcripts in mRNA extracted from a specimen, to the practical exclusion (does not interfere substantially with the detection assay) of other transcripts. In a PCR assay, primers are specific to a gene if they specifically amplify a sequence of that gene, to the practical exclusion of other sequences in a sample.
- Table B provides primer and probe sequences for the mRNA quantification assays described and depicted in the Examples and Figures.
Figures 1-16 provide non-limiting examples of cDNA sequences of the various mRNA species detected in the Examples. Although the sequences provided in Table B were found effective in the assays described in the examples, other primers and probes would likely be equally suited for use in the QRT-PCR and other mRNA detection and quantification assays, either described herein or as are known in the art. Design of alternate primer and probe sets for PCR assays, as well as for other mRNA detection assays is well within the abilities of one of average skill in the art. For example and without limitation, a number of computer software programs will generate primers and primer sets for PCR assays from cDNA sequences according to specified parameters. Non limiting examples of such software include, NetPrimer andPrimer Premier 5, commercially available from PREMIER Biosoft International of Palo Alto, California, which also provides primer and probe design software for molecular beacon and array assays. Primers and/or probes for two or more different mRNAs can be identified, for example and without limitation, by aligning the two or more target sequences according to standard methods, determining common sequences between the two or more mRNAs and entering the common sequences into a suitable primer design computer program. - As used herein, a "primer or probe" for detecting a specific mRNA species is any primer, primer set and/or probe that can be utilized to detect and/or quantify the specific mRNA species. An "mRNA species" can be a single mRNA species, corresponding to a single mRNA expression product of a single gene, or can be multiple mRNAs that are detected by a single common primer and/or probe combination, such as the SCCA1.2 and MAGEA136-plex pecies described below.
- In the commercialization of the methods described herein, certain kits for detection of specific nucleic acids will be particularly useful. A kit typically comprises one or more reagents, such as, without limitation, nucleic acid primers or probes, packaged in a container, such as, without limitation, a vial, tube or bottle, in a package suitable for commercial distribution, such as, without limitation, a box, a sealed pouch, a blister pack and a carton. The package typically contains an indicia, for example and without limitation, a writing, illustration, label, book, booklet, tag and/or packaging insert, indicating that the packaged reagents can be used in a method for identifying expression of markers indicative of the presence of cancer cells in a lymph node of a patient. As used herein, "packaging materials" includes any article used in the packaging, for distribution of reagents in a kit, including, without limitation, containers, vials, tubes, bottles, pouches, blister packaging, labels, tags, instruction sheets, and package inserts.
- One example of such a kit would include reagents necessary for the one-tube QRT-PCR process described above. In one example, the kit would include the above-described reagents, including reverse transcriptase, a reverse transcriptase primer, a corresponding PCR primer set, a thermostable DNA polymerase, such as Taq polymerase, and a suitable fluorescent reporter, such as, without limitation, a probe for a fluorescent 5' nuclease assay, a molecular beacon probe, a single dye primer or a fluorescent dye specific to double-stranded DNA, such as ethidium bromide. The primers may be present in quantities that would yield the high concentrations described above. Thermostable DNA polymerases are commonly and commercially available from a variety of manufacturers. Additional materials in the kit may include: suitable reaction tubes or vials, a barrier composition, typically a wax bead, optionally including magnesium; reaction mixtures (typically 10X) for the reverse transcriptase and the PCR stages, including necessary buffers and reagents such as dNTPs; nuclease- or RNase- free water; RNase inhibitor; control nucleic acid(s) and/or any additional buffers, compounds, co-factors, ionic constituents, proteins and enzymes, polymers, and the like that may be used in reverse transcriptase and/or PCR stages of QRT-PCR reactions.
- Components of a kit are packaged in any manner that is commercially practicable. For example, PCR primers and reverse transcriptase may be packaged individually to facilitate flexibility in configuring the assay, or together to increase ease of use and to reduce contamination. Similarly, buffers, salts and co-factors can be packaged separately or together.
- The kits also may include reagents and mechanical components suitable for the manual or automated extraction of nucleic acid from a tissue sample. These reagents are known to those skilled in the art and typically are a matter of design choice. For instance, in one embodiment of an automated process, tissue is disrupted ultrasonically in a suitable lysis solution provided in the kit. The resultant lysate solution is then filtered and RNA is bound to RNA-binding magnetic beads also provided in the kit or cartridge. The bead-bound RNA is washed, and the RNA is eluted from the beads and placed into a suitable reverse transcriptase reaction mixture prior to the reverse transcriptase reaction. In automated processes, the choice of reagents and their mode of packaging (for instance in disposable single-use cartridges) typically are dictated by the physical configuration of the robotics and fluidics of the specific RNA extraction system, for example and without limitation, the GenXpert system. International Patent Publication Nos.
WO 04/48931 WO 03/77055 WO 03/72253 WO 03/55973 WO 02/52030 WO 02/18902 WO 01/84463 WO 01/57253 WO 01/45845 WO 00/73413 WO 00/73412 WO 00/72970 - The constituents of the kits may be packaged together or separately, and each constituent may be presented in one or more tubes or vials, or in cartridge form, as is appropriate. The constituents, independently or together, may be packaged in any useful state, including without limitation, in a dehydrated, a lyophilized, a glassified or an aqueous state. The kits may take the physical form of a cartridge for use in automated processes, having two or more compartments including the above-described reagents. Suitable cartridges are disclosed for example in United States Patent Nos.
6,440,725 ,6,431,476 ,6,403,037 and6,374,684 . - Array technologies also can facilitate determining the expression level of two or more genes by facilitating performance of the desired reactions and their analysis by running multiple parallel reactions at the same time. One example of an array is the GeneChip® gene expression array, commercially available from Affymetrix, Inc. of Santa Clara, California. Patents illustrating array technology and uses therefor include, without limitation, United States Patent Nos.
6,040,138 ,6,245,517 ,6,251,601 ,6,261,776 ,6,306,643 ,6,309,823 ,6,346,413 ,6,406,844 and6,416,952 . A plethora of other "array" patents exist, illustrating the multitude of physical forms a useful array can take. An "array", such as a "microarray" can be a substrate containing one or more binding reagents, typically in discrete physical locations, permitting high throughput analysis of the binding of a sample to the array. In the context of the methods described herein, an array contains probes specific to transcripts of one or more of the genes described herein affixed to a substrate. The probes can be nucleic acids or analogs thereof, as are known in the art. An array also can refer to a plurality of discrete reaction chambers, permitting multiple parallel reactions and detection events on a miniaturized scale. - As mentioned above, PCR-based technologies may be used to quantify mRNA levels in a given tissue sample. Other sequence-specific nucleic acid quantification methods may be more or less suited. In one embodiment, the nucleic acid quantification method is a rolling circle amplification method. Non-limiting examples of rolling circle amplification methods are described in
U.S. Patents Nos. 5,854,003 ;6,183,960 ;6,344,329 ; and6,210,884 , each of which are incorporated herein by reference to the extent they teach methods for detecting and quantifying RNA species. In one embodiment, a padlock probe is employed to facilitate the rolling circle amplification process. (See Nilsson, M. et al. (2002), "Making Ends Meet in Genetic Analysis Using Padlock Probes," Human Mutation 19:410-415 and Schweitzer, B. et al (2001), "Combining Nucleic Acid Amplification and Detection," Current Opinion in Biotechnology, 12:21-27). A padlock probe is a linear oligonucleotide or polynucleotide designed to include one target-complementary sequence at each end, and which is designed such that the two ends are brought immediately next to each other upon hybridization to the target sequence. The probe also includes a spacer between the target-complementary sequences that includes a polymerase primer site and a site for binding to a probe, such as a molecular beacon probe, for detecting the padlock probe spacer sequence. If properly hybridized to an RNA template, the probe ends can then be joined by enzymatic DNA ligation to form a circular template that can be amplified by polymerase extension of a complementary primer. Thousands of concatemerized copies of the template can be generated by each primer, permitting detection and quantification of the original RNA template. Quantification can be automated by use, for example and without limitation, of a molecular beacon probe or other probe capable of detecting accumulation of a target sequence. By using padlock probes with different spacers to bind different molecular beacons that fluoresce a different color on binding to the amplified spacer, this automated reaction can be multiplexed. Padlock probe sequences target unique portions of the target RNA in order to ensure specific binding with limited or no cross-reactivity. RCA is an isothermic method in that the amplification is performed at one temperature. - Another isothermic method, for example and without limitation, is nucleic acid sequence-based amplification (NASBA). A typical NASBA reaction is initiated by the annealing of a first oligonucleotide primer to an RNA target in an RNA sample. The 3' end of the first primer is complementary to the target analyte; the 5' end encodes the T7 RNA polymerase promoter. After annealing, the primer is extended by reverse transcription (AMV-RT, for example) to produce a cDNA. The RNA is digested with RNase H, permitting a second primer (sense) to anneal to the cDNA strand, permitting the DNA polymerase activity of the reverse transcriptase to be engaged, producing a double-stranded cDNA copy of the original RNA template, with a functional T7 RNA polymerase promoter at one end. T7 polymerase is then used to produce an additional RNA template, which is further amplified, though in reverse order, according to the same procedure. A variety of other nucleic acid detection and/or amplification methods are known to those of skill in the art, including variations on the isothermic strand displacement, PCR and RCA methods described herein.
- Identification of Potential Markers. An extensive literature and public database survey was conducted to identify any potential markers. Resources for this survey included PubMed, OMIM, UniGene (http://www.ncbi.nlm.nih.gov/), GeneCards (http://bioinfo.weizmann.ac.il/cards), and CGAP (http://cgap.nci.nih.gov). Survey criteria were somewhat flexible but the goal was to identify genes with moderate to high expression in tumors and low expression in normal lymph nodes. In addition, genes reported to be upregulated in tumors and genes with restricted tissue distribution were considered potentially useful. Finally, genes reported to be cancer-specific, such as the cancer testis antigens and hTERT, were evaluated.
- Tissues and Pathological Evaluation. Tissue specimens were obtained from tissue banks at the University of Pittsburgh Medical Center through IRB approved protocols. All specimens were snap frozen in liquid nitrogen and later embedded in OCT for frozen sectioning. Twenty 5-micron sections were cut from each tissue for RNA isolation. In addition, sections were cut and placed on slides for H&E and IHC analysis at the beginning, middle (between the tenth and eleventh sections for RNA), and end of the sections for RNA isolation. All three H&E slides from each specimen underwent pathological review to confirm presence of tumor, percentage of tumor, and to identify the presence of any contaminating tissues. All of the unstained slides were stored at -20°C. Immunohistochemistry evaluation was performed using the AE1/AE3 antibody cocktail (DAKO, Carpinteria, CA), and Vector Elite ABC kit and Vector AEC Chromagen (Vecta Laboratories, Burlingame, CA). THC was used as needed as needed to confirm the H&E histology.
- Screening Approach. The screening was conducted in two phases. All potential markers entered the primary screening phase and expression was analyzed in 6 primary tumors and 10 benign lymph nodes obtained from patients without cancer (5 RNA pools with 2 lymph node RNA's per pool). Markers that showed good characteristics for lymph node metastasis detection passed into the secondary screening phase. The secondary screen consisted of expression analysis on 20-25 primary tumors, 20-25 histologically positive lymph nodes and 21 benign lymph nodes without cancer.
- RNA Isolation and cDNA Synthesis. RNA was isolated using the RNeasy minikit (Qiagen, Valencia, CA) essentially as described by the manufacturer. The only modification was that we doubled the volume of lysis reagent and loaded the column in two steps. This was found to provide better RNA yield and purity, probably as a result of diluting out the OCT in the tissue sections. Reverse transcription was performed in 100-µl reaction volumes either with random hexamer priming or sequence-specific priming using a probe indicated in Table C and Superscript II (Invitrogen, Carlsbad, CA) reverse transcriptase. For the primary screen, three reverse transcription reactions were performed, each with 500ng of RNA. The cDNA's were combined and QPCR was performed using the equivalent of 20ng RNA per reaction. For the secondary screen, the RNA input for primary tumors and positive nodes was also 500ng. For benign nodes however, the RNA input was 2000ng resulting in the equivalent of 80ng RNA per QPCR reaction.
- Quantitative PCR. All quantitative PCR was performed on the ABI Prism 7700 Sequence Detection Instrument (Applied Biosystems, Foster City, CA). Relative expression of the marker genes was calculated using the delta-CT methods previously described and with □-glucuronidase as the endogenous control gene. All assays were designed for use with 5' nuclease hybridization probes although the primary screening was performed using SYBER Green quantification in order to save cost. Assays were designed using the ABI Primer Express Version 2.0 software and where possible, amplicons spanned exon junctions in order to provide cDNA specificity. All primer pairs were tested for amplification specificity (generation of a single band on gels) at 60, 62 and 64°C annealing temperature. In addition, PCR efficiency was estimated using SYBER green quantification prior to use in the primary screen. Further optimization and more precise estimates of efficiency were performed with 5'nuclease probes for all assays used in the secondary screen.
- A mixture of the Universal Human Reference RNA (Stratagene, La Jolla, CA) and RNAs from human placenta, thyroid, heart, colon, PCI13 cell line and SKBR3 cell line served as a universal positive expression control for all the genes in the marker screening process.
- Quantification with SYBER Green (Primary Screen). For SYBR Green I-based QPCR, each 50µl reaction contained 1× TaqMan buffer A (Applied Biosystems), 300nM each dNTP, 3.5mM MgCl2, 0.06 units/µl Amplitaq Gold (Applied Biosystems), 0.25X SYBR Green I (Molecular Probes, Eugene, OR) and 200nM each primer. The amplification program comprised 2-stages with an initial 95°C Taq activation stage for 12 min followed by 40 cycles of 95°C denaturation for 15 s, 60 or 62 or 64°C anneal/extend for 60 s and a 10 second data collection step at a temperature 2-4°C below the Tm of the specific PCR product being amplified (Tom B. Morrison, et al, 1998). After amplification, a melting curve analysis was performed by collecting fluorescence data while increasing the temperature from 60°C-95°C over 20 minutes.
- Quantification with 5' Nuclease Probes (Secondary Screen). Probe-based QPCR was performed as described previously (Godfrey et al., Clinical Cancer Res. 2001 Dec., 7(12):4041-8). Briefly, reactions were performed with a probe concentration of 200nM and a 60 second anneal/extend phase at 60°C, or 62°C, or 64°C. The sequences of primers and probes (purchased from IDT, Coralville, IA) for genes evaluated in the secondary screen are listed in Table B, below.
- Data Analysis. In the primary screen, data from the melt curve was analyzed using the ABI Prism 7700 Dissociation Curve Analysis 1.0 software (Applied Biosystems). The first derivative of the melting cure was used to determine the product Tm as well as to establish the presence of the specific product in each sample. In general, samples were analyzed in duplicate PCR reactions and the average Ct value was used in the expression analysis. However, in the secondary screen triplicate reactions were performed for each individual benign node and the lowest Ct value was used in the calculation of relative expression in order to obtain the highest value of background expression for the sample.
- Cancer tissue-specific studies have been conducted, as described in the Examples below, in which a variety of molecular markers were identified as correlating with pathological states in cancers including esophageal cancer, colon cancer, head and neck cancer and in melanoma. Table A identifies genes used in the following studies. Table B provides PCR primer and TAQMAN probe sequences used in the quantitative PCR and RT-PCR amplifications described herein. Table C provides RT primer sequences as used instead of random hexamer primers. All PCR and RT-PCR reactions were conducted using standard methods. For all figures, T=primary tumor; PN=tumor-positive lymph nodes (by histological screening, that is, by review of H&E stained tissue and, when needed, by IHC, as described above); and BN=benign lymph nodes (by histological screening)
TABLE A Marker Accession No./ OMIN No.* Official Gene Symbol Official Gene Name Alternative Gene Symbol Alias CDX1 NM_001804/ 600746 CDX1 caudal type homeo box transcription factor 1 NA NA CEA NM_004363/ 114890 CEACAM5 carcinoembryonic antigen-related cell adhesion molecule 5 CEA, CD66e NA CK19 NM_002276/ 148020 KRT19 keratin 19 K19, CK19, K1CS, MGC15366 cytokeratin 19; keratin, type I, 40-kd; keratin, type I cytoskeletal 19; 40-kDa keratin intermediate filament precursor gene CK20 NM_019010/ 608218 KRT20 keratin 20 K20, CK20, MGC35423 cytokeratin 20; keratin, type I; cytoskeletal 20 TACSTD1 NM_002354/ 185535 TACSTD1 tumor-associated calcium signal transducer 1 EGP, KSA, M4S1, MK-1, KS1/4, EGP40, MIC18, TROP1, Ep-CAM, CO17-1A, GA733-2 MK-1 antigen; antigen identified by monoclonal antibody AUA1; membrane component, chromosome 4, surface marker (35kD glycoprotein) VIL1 NM_007127/ 193040 VIL1 villin 1 VIL, D2S1471 villin-1 CK7 NM_005556/ 148059 KRT7 keratin 7 K7, CK7, SCL, K2C7, MGC3625 Sarcolectin; cytokeratin 7; type II mesothelial keratin K7; keratin, type II cytoskeletal 7; keratin, 55K type II cytoskeletal; keratin, simple epithelial type I, K7 SCCA1 NM_006919/ 600517 SERPINB3 serine (or cysteine) proteinase inhibitor, clade B (ovalbumin), member 3carcinoma antigen 1&2 SCC, T4-A, SCCA1, SCCA-PD squamous cell carcinoma antigen 1 SCCA2 NM_002974/ 600518 SERPINB4 serine (or cysteine) proteinase inhibitor, clade B (ovalbumin), member 4 PI11, SCCA2, LEUPIN leupin; squamous cell carcinoma antigen 2; protease inhibitor (leucine-serpin) PTHrP NM_002820/ 168470 PTHLH parathyroid hormone-like hormone PTHRP, PTHR, HHM, parathyroid hormone-related protein; pth-related protein; formerly humoral hypercalcemia of malignancy, included; PVA NM_001944/ 169615 DSG3 desmoglein 3 (pemphigus vulgaris antigen) PVA, CDHF6 pemphigus vulgaris antigen; 130-kD pemphigus vulgaris antigen MAGEA1 NM_004988/ 300016 MAGEA1 melanoma antigen, family A, 1 (directs expression of antigen MZ2-E) MAGE1, MGC9326 melanoma antigen MAGE-1; melanoma-associated antigen 1; melanoma-associated antigen MZ2-E MAGEA3 NM_005362/ 300174 MAGEA3 melanoma antigen, family A, 3 HIP8, HYPD, MAGE3, MGC14613 antigen MZ2-D; MAGE-3 antigen; melanoma-associated antigen 3 MAGEA6 NM_005363/ 300176 MAGEA6 melanoma antigen, family A, 6 MAGE6, MAGE3B, MAGE-3b, MGC52297 MAGE-6 antigen; melanoma-associated antigen 6 MART1 NM_005511/ 605513 MLANA melan-A MART1,MART-1 melanoma antigen recognized by t cells 1 TYR NM_000372/ 606933 TYR tyrosinase (oculocutaneous albinism IA) OCA1A, OCAIA Tyrosinase * Online Mendelian Inheritance in Man (www.ncbi.nlm.nih.gov). Table B Gene Oligonucleotide Sequence (5' → 3') Sequence Listing Reference CDX1 Forward primer CGGTGGCAGCGGTAAGAC SEQ ID NO: 1, bases 516 to 533 Reverse primer GATTGTGATGTAACGGCTGTAATG SEQ ID NO: 17 Probe ACCAAGGACAAGTACCGCGTGGTCTACA SEQ ID NO: 1, bases 538 to 565 CEA Forward primer AGACAATCACAGTCTCTGCGGA SEQ ID NO: 2, bases 1589 to 1610 Reverse primer ATCCTTGTCCTCCACGGGTT SEQ ID NO: 18 Probe CAAGCCCTCCATCTCCAGCAACAACT SEQ ID NO: 2, bases 1617 to 1642 CK19 Forward primer AGATCGACAAGGGCCGT SEQ ID NO: 19 Reverse primer AGAGCCTGTTCCGTCTCAAA SEQ ID NO: 20 Probe TGGCTGCAGATGACTTCCGAACCA SEQ ID NO: 4, bases 614 to 637 CK20 Forward primer GACCTCCGAGAGCCTTGAGAT SEQ ID NO: 5, bases 915 to 935 Reverse primer GGGCCTTGGTCTCCTCTAGAG SEQ ID NO: 21 Probe CCATCTCAGCATGAAAGAGTCTTTGGAGCA SEQ ID NO: 5, bases 948 to 977 CK7 Forward primer CCCTCAATGAGACGGAGTTGA SEQ ID NO: 3, bases 807 to 827 Reverse primer CCAGGGAGCGACTGTTGTC SEQ ID NO: 22 Probe AGCTGCAGTCCCAGATCTCCGACACATC SEQ ID NO: 3, bases 831 to 858 MAGEA136_plexA Forward primer GTGAGGAGGCAAGGTTYTSAG SEQ ID NO: 23 Reverse primer AGACCCACWGGCAGATCTTCTC SEQ ID NO: 24 Probe1 AGGATTCCCTGGAGGCCACAGAGG SEQ ID NO: 6, bases 80 to 103 Probe2 ACAGGCTGACCTGGAGGACCAGAGG SEQ ID NO: 7, bases 90 to 104 MART1 Forward primer GATGCTCACTTCATCTATGGTTACC SEQ ID NO: 9, bases 66 to 90 Reverse primer ACTGTCAGGATGCCGATCC SEQ ID NO: 25 Probe AGCGGCCTCTTCAGCCGTGGTGT SEQ ID NO: 26 PTHrP Forward primer GCGGTGTTCCTGCTGAGCTA SEQ ID NO: 10, bases 356 to 375 Reverse primer TCATGGAGGAGCTGATGTTCAGA SEQ ID NO: 27 Probe TCTCAGCCGCCGCCTCAAAAGA SEQ ID NO: 10, bases 409 to 430 PVA Forward primer AAAGAAACCCAATTGCCAAGATTAC SEQ ID NO: 11, bases 280 to 304 Reverse primer CAAAAGGCGGCTGATCGAT SEQ ID NO: 28 Probe CCAAGCAACCCAGAAAATCACCTACCG SEQ ID NO: 11, bases 314 to 340 SCCA1.2B Forward primer AAGCTGCAACATATCATGTTGATAGG SEQ ID NO: 12, bases 267 to 292 Reverse primer GGCGATCTTCAGCTCATATGC SEQ ID NO: 29 Probe TGTTCATCACCAGTTTCAAAAGCTTCTGACT SEQ ID NO: 12, bases 301 to 331 TACSTD1 Forward primer TCATTTGCTCAAAGCTGGCTG SEQ ID NO: 14, bases 348 to 368 Reverse primer GGTTTTGCTCTTCTCCCAAGTTT SEQ ID NO: 30 Probe AAATGTTTGGTGATGAAGGCAGAAATGAATGG SEQ ID NO: 14, bases 371 to 402 TYR Forward primer ACTTACTCAGCCCAGCATCATTC SEQ ID NO: 15, bases 1284 to 1306 Reverse primer ACTGATGGCTGTTGTACTCCTCC SEQ ID NO: 31 Probe TCTCCTCTTGGCAGATTGTCTGTAGCCGA SEQ ID NO: 15, bases 1308 to 1336 Villin 1 Forward primer TGGTTCCTGGCTTGGGATC SEQ ID NO: 16, bases 2152 to 2170 Reverse primer TTGCCAGACTCCGCCTTC SEQ ID NO: 32 Probe TCAAGTGGAGTAACACCAAATCCTATGAGGACC SEQ ID NO: 16, bases 2174 to 2206 A A universal primer set designed to recognize transcripts of MAGEA1, MAGEA3 and MAGEA6.
B A universal primer set designed to recognize transcripts of both SCCA1 AND SCCA2.Table C Gene Marker RT Specific Primer ( 5' → 3' ) Sequence Listing Reference CEA GTGAAGGCCACAGCAT SEQ ID NO: 33 CK20 AACTGGCTGCTGTAACG SEQ ID NO: 34 MART1 GCCGATGAGCAGTAAGACT SEQ ID NO: 35 PVA TGTCAACAACAAAGATTCCA SEQ ID NO: 36 SCCA1.2 TCTCCGAAGAGCTTGTTG SEQ ID NO: 37 TACSTD1 AGCCCATCATTGTTCTG SEQ ID NO: 38 TYR CGTTCCATTGCATAAAG SEQ ID NO: 40 VIL1 GCTCCAGTCCCTAAGG SEQ ID NO: 41 - Expression levels ofCEA, CK7, CK19, CK20, TACSTD1 and VIL1 were determined by the methods described in Example 1.
Figure 17 is a scatter plot showing the expression levels of CEA, CK7, CK19, CK20, TACSTD1 and VIL1 in primary tumor, tumor-positive lymph nodes and benign lymph nodes.Figures 18A-O provide scatter plots illustrating the ability of two-marker systems to distinguish between benign and malignant cells in a lymph node. Tables D and E provide the raw data from which the graphs ofFigures 17 and18A-O were generated. This data illustrates the strong correlation of expression of CEA, CK7, CK19, CK20, TACSTD1 and VIL1 markers, alone or in combination, in sentinel lymph nodes with the presence of malignant cells arising from an esophageal cancer in the sentinel lymph nodes.Table D -Single Marker Prediction Characteristics for Esophageal Cancer Observed Data Parametric Bootstrap Estimates* Sensitivity Specificity AUC Classification Accuracy Sensitivity Specificity Classification Accuracy CEA .95 .95 .98 .95 .93 .93 .93 CK7 .95 .86 .94 .90 .82 .89 .85 CK19 1.0 1.0 1.0 1.0 .99 .94 97 CK20 1.0 .95 .995 .98 .98 .92 .95 TACSTD1 1.0 1.0 1.0 1.0 .96 .99 .98 Villin1 .95 .95 .98 .95 .92 .93 .92 optimism = .02 - .05
1000 parametric bootstrap samples of lymph node expression levels were generated and a new decision rule based on the most accurate cutoff was formulated each time (total of 1000 decision rules). The bootstrap estimates are the average prediction properties from classifying the original 41 lymph nodes 1000 times.Table E - Two Marker Prediction Characteristics for Esophageal Cancer Observed Data Parametric Bootstrap Estimates* Sensitivity Specificity Classification Accuracy Sensitivity Specificity Classification Accuracy CEA + CK7 .95 1.0 .98 .93 .99 .96 CEA + CK19 .95 1.0 .98 .97 .99 .98 CEA + CK20 .95 1.0 .98 .97 .99 .97 CEA + TACSTD1 1.0 1.0 1.0 .99 1.0 .99 CEA + Villin1 .95 1.0 .98 .95 1.0 .98 CK7 + CK19 1.0 1.0 1.0 .99 .99 .99 CK7 + CK20 .95 1.0 .98 .93 .99 .97 CK7+TACSTD1 1.0 1.0 1.0 .99 1.0. .99 CK7 + Villin1 .95 1.0 .98 .95 .99 .98 CK19 + CK20 .95 1.0 .98 .97 .99 .98 CK19 + TACSTD1 1.0 1.0 1.0 .99 1.0 .99 CK19 + Villin1 1.0 1.0 1.0 .99 .99 .99 CK20 + TACSTD1 1.0 1.0 1.0 .99 1.0 .99 CK20 + Villin1 .95 1.0 .98 .94 1.0 .97 TACSTD1 + Villin1 1.0 1.0 1.0 .99 1.0 .99 1000 parametric bootstrap samples of 41 lymph node marker pair expression levels were generated. For each new sample a new decision rule was devised to split the region into 2 zones equal prediction probability (see methods) (total of 1000 decision rules). The bootstrap estimates are the average prediction properties from classifying the original 41 lymph nodes 1000 times. -
Figure 19 is a scatter plot showing the expression levels of CEA, CK19, PTHrP, PVA, SCCA1.2 and TACSTD1 in primary tumor, tumor-positive lymph nodes and benign lymph nodes.Figures 20A-F provides scatter plots illustrating the ability of two-marker systems to distinguish between benign and malignant cells in a lymph node. Tables F and G provide the raw data from which the graphs ofFigures 19 and20A-F were generated. This data illustrates the strong correlation between expression of CEA, CK19, PTHrP, PVA, SCCA1.2 and TACSTD1 markers, alone or in combination, in sentinel lymph nodes and the presence of malignant cells arising from a squamous cell carcinoma of the head and neck in the sentinel lymph nodes.Table F - Single Marker Prediction Characteristics -Head and Neck Cancer Observed Data Non Parametric Bootstrap Estimates* Sensitivity Specificity AUC Classification Accuracy Sensitivity Specificity Classification Accuracy bias** CEA 1.0 .905 .990 .950 .974 .880 .872 .078 CK19 .895 .905 .917 .900 .867 .880 .872 .028 EGFR .895 1.0 .945 .947 .873 .979 .925 .022 PTHrP .947 1.0 .990 .975 .938 .988 .963 .012 PVA 1.0 1.0 1.0 1.0 1.0 1.0 1.0 .000 SCCA1.2 1.0 1.0 1.0 1.0 .998 .985 .991 .009 TACSTD1 1.0 .952 .997 .975 .983 .944 .962 .013 * 500 bootstrap samples of lymph node expression levels were generated and a new decision rule based on the most accurate cutoff was formulated each time (total of 500 decision rules). 500 bootstrap samples of lymph node expression levels were generated and a new decision rule based on the most accurate cutoff was formulated each time (total of 500 decision rules).The optimism in for each bootstrap sample is calculated as the difference between the classification statistic applied to the original data and applied to the bootstrap data. The average over all bootstrap samples is computed and reported as the bias in the values derived from the observed data (Efron's enhanced bootstrap prediction error estimate, see Efron and Tibshirani, An Introduction to the Bootstrap, Chapman and Hall/CRC Press Boca Raton, 1993).
** bias = enhanced bootstrap estimate of optimism, or the amount that classification accuracy is overestimated when tested on the original data.Table G - Two Marker Prediction Characteristics for Head & Neck Cancer Observed Data Non Parametric Bootstrap Estimates Sensitivity Specificity Classification Accuracy Sensitivity Specificity Classification Accuracy Bias** PVA+ TACSTD1 1.0 1.0 1.0 .993 1.0 .997 .003 PVA+ PTHrP 1.0 1.0 1.0 1.0 1.0 1.0 .000 PVA+ SCCA1.2 1.0 1.0 1.0 1.0 1.0 1.0 .000 TACSTD1 + PTHrP .947 1.0 .975 .944 1.0 .974 .001 TACSTD1 + SCCA1.2 1.0 1.0 1.0 .984 1.0 .992 .008 PTHrP + SCCA1.2 1.0 1.0 1.0 1.0 1.0 1.0 .000 * 500 bootstrap samples of lymph node expression levels were generated and a new decision rule based on the most accurate cutoff was formulated each time (total of 500 decision rules). 500 bootstrap samples of lymph node expression levels were generated and a new decision rule based on the most accurate cutoff was formulated each time (total of 500 decision rules). The optimism in for each bootstrap sample is calculated as the difference between the classification statistic applied to the original data and applied to the bootstrap data. The average over all bootstrap samples is computed and reported as the bias in the values derived from the observed data (Efron's enhanced bootstrap prediction error estimate, see Efron and Tibshirani, An Introduction to the Bootstrap, Chapman and Hall/CRC Press Boca Raton, 1993).
** bias = enhanced bootstrap estimate of optimism, or the amount that classification accuracy is overestimated when tested on the original data. -
Figure 21 is a scatter plot showing the expression levels of MART1, TYR and MAGEA136-plex in primary tumor, tumor-positive lymph nodes and benign lymph nodes.Figures 22A and 22B provide scatter plots illustrating the ability of two-marker systems to distinguish between benign and malignant cells in a lymph node. This data illustrates the strong correlation between expression ofMARTI, TYR and MAGEA136-plex markers, alone or in combination, in sentinel lymph nodes and the presence of malignant cells arising from melanoma in the sentinel lymph nodes. -
Figure 23 is a scatter plot showing the expression levels of CDX1, CEA, CK19, CK20, TACSTD1 and VIL1 in primary tumor, tumor-positive lymph nodes and benign lymph nodes. This data illustrates the strong correlation between expression of CDX1, CEA, CK19, CK20, TACSTD1 and VIL1 markers, in sentinel lymph nodes and the presence of malignant cells arising from colon cancer in the sentinel lymph nodes.


Claims (15)
- A method of identifying expression of markers indicative of the presence of melanoma cells in a lymph node of a patient, the method comprising determining if a first mRNA species specific to a MAGEA136-plex is overabundant in an RNA sample prepared from the lymph node, and
optionally, determining if a second mRNA species selected from the group consisting of MART-1 and TYR, is overabundant in the RNA sample from the lymph node,
the overabundance of the first, and optionally, the second mRNA species being indicative of the presence of displaced melanoma cells in the lymph node. - The method of claim 1, comprising determining if MAGEA136-plex mRNA and MART-1 mRNA are overabundant in the RNA sample, wherein an overabundance of MAGEA136-plex and MART-1 mRNA is indicative of melanoma cells in the lymph node.
- The method of claim 1, comprising determining if MAGEA136-plex mRNA and TYR mRNA are overabundant in the sample, wherein an overabundance of MAGEA136-plex and TYR mRNA is indicative of the presence of melanoma cells in the lymph node.
- The method of claim 1, comprising determining if MAGEA136-plex, MART-1 and TYR mRNA are overabundant in the sample, wherein an overabundance of MAGEA136-plex, MART-1 and TYR mRNA is indicative of the presence of melanoma cells in the lymph node.
- The method of any one of claims 1-4, comprising quantifying the levels of the one or more mRNA species in the RNA sample.
- The method according to any of the preceding claims, wherein a nucleic acid amplification assay selected from the group consisting of a PCR assay, and an isothermic amplification assay is used to determine if the one or more mRNA species is overabundant in the RNA sample.
- The method of claim 6, wherein the nucleic acid amplification assay is a reverse transcriptase-polymerase chain reaction (RT-PCR), or a quantitative reverse transcriptase-polymerase chain reaction (QRT-PCR) assay.
- The method of claim 6, wherein the nucleic acid amplification assay is an isothermic assay.
- The method of claim 8, wherein the nucleic acid amplification assay is selected from the group consisting of rolling circle amplification (RCA) assay, and nucleic acid sequence based amplification (NASBA).
- An article of manufacture for use in a method according to claim 1, comprising packaging material and a first nucleic acid specific to MAGEA136-plex mRNA, and a second nucleic acid specific to one of MART-1 and TYR, wherein the packaging material comprises an indicia indicating that the first or second nucleic acids can be used in a method of identifying expression of markers indicative of the presence of displaced melanoma cells in a lymph node of a patient.
- The article of manufacture of claim 10, wherein the nucleic acids comprise primers for use in a sequence specific nucleic acid detection or amplification assay.
- The article of manufacture of claim 11, comprising a detectable probe for use in detecting accumulation of a product of the sequence-specific nucleic acid detection or amplification assay utilizing the one or more primers.
- A composition comprising one or more primers or probes specific to MAGEA136-plex, and one or more primers or probes specific to one of a group consisting of MART-1 and TYR, and RNA from a lymph node of a patient diagnosed with or suspected of having melanoma.
- The composition of claim 13, comprising one or more primers selected from the group consisting of: SEQ ID NO 23, SEQ ID NO 24, SEQ ID NO 9, SEQ ID NO 25, SEQ ID NO 15, SEQ ID NO 31, SEQ ID NO 35 and SEQ ID NO 40.
- The composition of claim 16 wherein the one or more probes are selected from the group consisting of: SEQ ID NO 6, SEQ ID NO 7, SEQ ID NO 15, and SEQ ID NO 26.
Applications Claiming Priority (3)
| Application Number | Priority Date | Filing Date | Title |
|---|---|---|---|
| US58659904P | 2004-07-09 | 2004-07-09 | |
| US58701904P | 2004-07-09 | 2004-07-09 | |
| EP05770149A EP1774030A4 (en) | 2004-07-09 | 2005-07-08 | Identification of makers in esophageal cancer, colon cancer, head and neck cancer and melanoma |
Related Parent Applications (1)
| Application Number | Title | Priority Date | Filing Date |
|---|---|---|---|
| EP05770149.2 Division | 2005-07-08 |
Publications (2)
| Publication Number | Publication Date |
|---|---|
| EP2275578A2 true EP2275578A2 (en) | 2011-01-19 |
| EP2275578A3 EP2275578A3 (en) | 2011-11-30 |
Family
ID=35839738
Family Applications (6)
| Application Number | Title | Priority Date | Filing Date |
|---|---|---|---|
| EP10183722A Withdrawn EP2287329A3 (en) | 2004-07-09 | 2005-07-08 | Identification of markers in esophageal cancer |
| EP12151990A Withdrawn EP2468889A3 (en) | 2004-07-09 | 2005-07-08 | Identification of markers in lung and breast cancer |
| EP05764654A Ceased EP1774025A4 (en) | 2004-07-09 | 2005-07-08 | Identification of markers in lung and breast cancer |
| EP10183644A Withdrawn EP2272987A3 (en) | 2004-07-09 | 2005-07-08 | Identification of markers in esophageal cancer, colon cancer, head and neck cancer and melanoma |
| EP10183750A Withdrawn EP2275578A3 (en) | 2004-07-09 | 2005-07-08 | Identification of markers in esophageal cancer, colon cancer, head and neck cancer and melanoma |
| EP05770149A Withdrawn EP1774030A4 (en) | 2004-07-09 | 2005-07-08 | Identification of makers in esophageal cancer, colon cancer, head and neck cancer and melanoma |
Family Applications Before (4)
| Application Number | Title | Priority Date | Filing Date |
|---|---|---|---|
| EP10183722A Withdrawn EP2287329A3 (en) | 2004-07-09 | 2005-07-08 | Identification of markers in esophageal cancer |
| EP12151990A Withdrawn EP2468889A3 (en) | 2004-07-09 | 2005-07-08 | Identification of markers in lung and breast cancer |
| EP05764654A Ceased EP1774025A4 (en) | 2004-07-09 | 2005-07-08 | Identification of markers in lung and breast cancer |
| EP10183644A Withdrawn EP2272987A3 (en) | 2004-07-09 | 2005-07-08 | Identification of markers in esophageal cancer, colon cancer, head and neck cancer and melanoma |
Family Applications After (1)
| Application Number | Title | Priority Date | Filing Date |
|---|---|---|---|
| EP05770149A Withdrawn EP1774030A4 (en) | 2004-07-09 | 2005-07-08 | Identification of makers in esophageal cancer, colon cancer, head and neck cancer and melanoma |
Country Status (6)
| Country | Link |
|---|---|
| US (4) | US7662561B2 (en) |
| EP (6) | EP2287329A3 (en) |
| JP (3) | JP2008505644A (en) |
| AU (2) | AU2005271960B2 (en) |
| CA (2) | CA2571642A1 (en) |
| WO (2) | WO2006017150A2 (en) |
Cited By (1)
| Publication number | Priority date | Publication date | Assignee | Title |
|---|---|---|---|---|
| WO2023281061A1 (en) * | 2021-07-08 | 2023-01-12 | Universidad De Granada | In vitro method for the diagnosis and/or prognosis of malignant melanoma |
Families Citing this family (22)
| Publication number | Priority date | Publication date | Assignee | Title |
|---|---|---|---|---|
| US20060003391A1 (en) * | 2003-08-11 | 2006-01-05 | Ring Brian Z | Reagents and methods for use in cancer diagnosis, classification and therapy |
| US20050112622A1 (en) | 2003-08-11 | 2005-05-26 | Ring Brian Z. | Reagents and methods for use in cancer diagnosis, classification and therapy |
| WO2006017150A2 (en) * | 2004-07-09 | 2006-02-16 | University Of Pittsburgh - Of The Commonwealth System Of Higher Educatiion | Identification of markers in lung and breast cancer |
| US20080131916A1 (en) * | 2004-08-10 | 2008-06-05 | Ring Brian Z | Reagents and Methods For Use In Cancer Diagnosis, Classification and Therapy |
| CN101068937A (en) * | 2004-09-20 | 2007-11-07 | 匹兹堡大学 | Multiple mode multiplex reaction quenching method |
| JP4968577B2 (en) * | 2006-04-11 | 2012-07-04 | エフ.ホフマン−ラ ロシュ アーゲー | Rapid measurement method of cytokeratin 19 (CK19) mRNA, and primer and probe therefor |
| US8119352B2 (en) * | 2006-06-20 | 2012-02-21 | Cepheld | Multi-stage amplification reactions by control of sequence replication times |
| JP4943074B2 (en) * | 2006-07-03 | 2012-05-30 | シスメックス株式会社 | Method and apparatus for determining cancer metastasis |
| US7622456B2 (en) * | 2006-11-06 | 2009-11-24 | Non-Profit Organization Chang Gung Memorial Hospital | Method on clinical applications in head neck cancer by using DSG3 molecule for predicting malignant degree of cancer, serving as a molecular target and using RNA jamming sequence on inhibition-specific of DSG3 expression |
| WO2008063413A2 (en) * | 2006-11-13 | 2008-05-29 | Source Precision Medicine, Inc. | Gene expression profiling for identification, monitoring, and treatment of lung cancer |
| WO2010144808A2 (en) | 2009-06-12 | 2010-12-16 | The United States Of America, As Represented By The Secretary, Department Of Health And Human Services | Identification of dsg-3 as a biomarker for the detection of metastasis in lymph nodes |
| MX368365B (en) | 2009-12-22 | 2019-09-30 | Avon Prod Inc | Paxillin stimulating compositions and cosmetic uses thereof. |
| US8715931B2 (en) | 2009-12-24 | 2014-05-06 | National University Corporation Ehime University | Method for analyzing cervical lymph node metastasis, and tumor marker for head and neck cancer |
| JP6249777B2 (en) | 2010-12-30 | 2017-12-20 | エイボン プロダクツ インコーポレーテッド | Regulation of dynein in the skin |
| WO2013003350A2 (en) | 2011-06-27 | 2013-01-03 | Eisai R&D Management Co., Ltd. | Microrna biomarkers indicative of alzheimer's disease |
| US10195136B2 (en) | 2011-08-24 | 2019-02-05 | Avon Products, Inc. | Collagen and elastin stimulating compositions and uses thereof |
| CA2854979C (en) | 2011-12-13 | 2020-05-26 | Avon Products, Inc. | Maesa japonica extracts and methods of use |
| US8632827B2 (en) | 2011-12-13 | 2014-01-21 | Avon Products, Inc | Modulation of thymosin beta-4 in skin |
| JP2013208420A (en) * | 2012-03-02 | 2013-10-10 | Nippon Koden Corp | Electrocardiogram analysis report, electrocardiogram analysis apparatus and electrocardiogram analysis program |
| CN108949992B (en) * | 2018-08-14 | 2021-11-05 | 高鑫 | Biomarker related to esophageal squamous carcinoma and grading thereof |
| CN109913552B (en) * | 2019-03-27 | 2020-08-04 | 河北医科大学第四医院 | Esophageal squamous carcinoma diagnosis and treatment target and application |
| WO2023081988A1 (en) * | 2021-11-09 | 2023-05-19 | Coelho Guilherme Portela | Breast cancer treatment efficacy prediction method |
Citations (26)
| Publication number | Priority date | Publication date | Assignee | Title |
|---|---|---|---|---|
| US5854003A (en) | 1997-07-03 | 1998-12-29 | Tularik Inc. | Screening method for agents that modulate human NIK activity |
| US6040138A (en) | 1995-09-15 | 2000-03-21 | Affymetrix, Inc. | Expression monitoring by hybridization to high density oligonucleotide arrays |
| WO2000073413A2 (en) | 1999-05-28 | 2000-12-07 | Cepheid | Apparatus and method for cell disruption |
| WO2000072970A1 (en) | 1999-05-28 | 2000-12-07 | Cepheid | Cartridge for conducting a chemical reaction |
| US6183960B1 (en) | 1995-11-21 | 2001-02-06 | Yale University | Rolling circle replication reporter systems |
| US6245517B1 (en) | 1998-09-29 | 2001-06-12 | The United States Of America As Represented By The Department Of Health And Human Services | Ratio-based decisions and the quantitative analysis of cDNA micro-array images |
| US6251601B1 (en) | 1999-02-02 | 2001-06-26 | Vysis, Inc. | Simultaneous measurement of gene expression and genomic abnormalities using nucleic acid microarrays |
| WO2001045845A1 (en) | 1999-12-21 | 2001-06-28 | Cepheid | Apparatus for performing heat-exchanging, chemical reactions |
| US6261776B1 (en) | 1989-06-07 | 2001-07-17 | Affymetrix, Inc. | Nucleic acid arrays |
| WO2001057253A1 (en) | 2000-02-04 | 2001-08-09 | Cepheid | Reaction vessel and temperature control system |
| US6306643B1 (en) | 1998-08-24 | 2001-10-23 | Affymetrix, Inc. | Methods of using an array of pooled probes in genetic analysis |
| US6309823B1 (en) | 1993-10-26 | 2001-10-30 | Affymetrix, Inc. | Arrays of nucleic acid probes for analyzing biotransformation genes and methods of using the same |
| WO2001084463A2 (en) | 2000-05-01 | 2001-11-08 | Cepheid | Apparatus, method, and computer program product for quantitative analysis of a nucleic acid amplification reaction |
| US6346413B1 (en) | 1989-06-07 | 2002-02-12 | Affymetrix, Inc. | Polymer arrays |
| WO2002018902A1 (en) | 2000-08-25 | 2002-03-07 | Cepheid | Fluid control and processing system |
| US6406844B1 (en) | 1989-06-07 | 2002-06-18 | Affymetrix, Inc. | Very large scale immobilized polymer synthesis |
| WO2002052030A2 (en) | 2000-12-22 | 2002-07-04 | Cepheid | Compositions and methods enabling a totally internally controlled amplification reaction |
| US6416952B1 (en) | 1989-06-07 | 2002-07-09 | Affymetrix, Inc. | Photolithographic and other means for manufacturing arrays |
| US6431476B1 (en) | 1999-12-21 | 2002-08-13 | Cepheid | Apparatus and method for rapid ultrasonic disruption of cells or viruses |
| US6440725B1 (en) | 1997-12-24 | 2002-08-27 | Cepheid | Integrated fluid manipulation cartridge |
| WO2002070751A1 (en) | 2001-03-02 | 2002-09-12 | University Of Pittsburgh Of The Commonwealth System Of Higher Education | Pcr method |
| WO2003055973A1 (en) | 2001-12-26 | 2003-07-10 | Olympus Corporation | Reaction container and reaction container holding mechanism |
| WO2003072253A1 (en) | 2002-02-25 | 2003-09-04 | Cepheid | Fluid processing and control |
| WO2003077055A2 (en) | 2002-03-04 | 2003-09-18 | Cepheid | Method and apparatus for controlling ultrasonic transducer |
| WO2004048931A2 (en) | 2002-11-25 | 2004-06-10 | Cepheid | Compositions, methods and kits for polynucleotide amplification reactions and microfluidic devices |
| US9032602B2 (en) | 2011-07-15 | 2015-05-19 | The Boeing Company | Methods and systems for in-process quality control during drill-fill assembly |
Family Cites Families (27)
| Publication number | Priority date | Publication date | Assignee | Title |
|---|---|---|---|---|
| US5274087A (en) | 1986-08-13 | 1993-12-28 | Molecular Diagnostics, Inc. | cDNA coding for carcinoembryonic antigen (CEA) |
| EP0519338B1 (en) * | 1991-06-20 | 1996-08-28 | F. Hoffmann-La Roche Ag | Improved methods for nucleic acid amplification |
| DE69435100D1 (en) | 1993-10-29 | 2008-06-26 | Brigham & Womens Hospital | THERAPEUTIC USE OF CIS ELEMENT CASE IN VIVO |
| US7625697B2 (en) * | 1994-06-17 | 2009-12-01 | The Board Of Trustees Of The Leland Stanford Junior University | Methods for constructing subarrays and subarrays made thereby |
| EP1505159B1 (en) * | 1995-03-17 | 2008-05-28 | John Wayne Cancer Institute | Detection of breast metastases with a multiple marker assay |
| EP0873419B1 (en) * | 1995-06-06 | 2001-11-21 | Beth Israel Deaconess Medical Center | Method of and apparatus for diagnostic dna testing |
| US5882856A (en) | 1995-06-07 | 1999-03-16 | Genzyme Corporation | Universal primer sequence for multiplex DNA amplification |
| US6031129A (en) * | 1995-10-03 | 2000-02-29 | Quantum Chemical Corporation | Use of pentavalent group VA oxides in acetic acid processing |
| US5837442A (en) | 1995-11-29 | 1998-11-17 | Roche Molecular Systems, Inc. | Oligonucleotide primers for amplifying HCV nucleic acid |
| AUPO188396A0 (en) | 1996-08-26 | 1996-09-19 | Insearch Limited | Detection of protozoan parasites |
| US5958349A (en) | 1997-02-28 | 1999-09-28 | Cepheid | Reaction vessel for heat-exchanging chemical processes |
| GB9719044D0 (en) | 1997-09-08 | 1997-11-12 | Inst Of Ophthalmology | Assay |
| US6037129A (en) * | 1998-05-28 | 2000-03-14 | Medical University Of South Carolina | Multi-marker RT-PCR panel for detecting metastatic breast cancer |
| JP2003525862A (en) | 1999-01-27 | 2003-09-02 | ザ ユニヴァーシティー オブ サウス フロリダ | Inhibition of STAT3 signaling for treatment of human cancer |
| US6300069B1 (en) | 1999-05-03 | 2001-10-09 | Qiagen Gmbh | Generation and amplification of nucleic acids from ribonucleic acids |
| SE9902410D0 (en) | 1999-06-24 | 1999-06-24 | Cavidi Tech Ab | Reverse transcriptase assay kit, use thereof and method for analysis of RT activity in biological samples |
| WO2001002603A1 (en) * | 1999-06-30 | 2001-01-11 | Jakob Stenman | Diagnostic method for squamous cell carcinoma |
| DE60142228D1 (en) * | 2000-03-27 | 2010-07-08 | Univ Jefferson | COMPOSITIONS AND METHODS FOR IDENTIFYING AND TARGETING CANCER CELLS FROM THE DIGESTIVE CHANNEL |
| WO2002012329A2 (en) * | 2000-08-03 | 2002-02-14 | Corixa Corporation | Compositions and methods for the therapy and diagnosis of head and neck cancer |
| WO2002037113A2 (en) * | 2000-11-03 | 2002-05-10 | Michael Giesing | Clinical and functional validation of targets from disseminated cancer cells |
| EP2258872B1 (en) * | 2002-03-13 | 2013-08-14 | Genomic Health, Inc. | Gene expression profiling in biopsied tumor tissues |
| WO2003087766A2 (en) * | 2002-04-05 | 2003-10-23 | The Government Of The United States Of America, As Represented By The Secretary Of The Department Of Health And Human Services | Methods of diagnosing potential for metastasis or developing hepatocellular carcinoma and of identifying therapeutic targets |
| CA2498783A1 (en) * | 2002-09-12 | 2004-03-25 | Yissum Research Development Company Of The Hebrew University Of Jerusale M | Method for detection of micro-metastasis |
| WO2004045521A2 (en) * | 2002-11-14 | 2004-06-03 | John Wayne Cancer Institute | Detection of micro metastasis of melanoma and breast cancer in paraffin-embedded tumor draining lymph nodes by multimaker quantitative rt-pcr |
| WO2005055804A2 (en) * | 2003-12-02 | 2005-06-23 | Musc Foundation For Research Development | Methods and compositions for diagnosing epithelial cell cancer |
| WO2006017150A2 (en) * | 2004-07-09 | 2006-02-16 | University Of Pittsburgh - Of The Commonwealth System Of Higher Educatiion | Identification of markers in lung and breast cancer |
| CN101068937A (en) * | 2004-09-20 | 2007-11-07 | 匹兹堡大学 | Multiple mode multiplex reaction quenching method |
-
2005
- 2005-07-08 WO PCT/US2005/024193 patent/WO2006017150A2/en not_active Application Discontinuation
- 2005-07-08 JP JP2007520520A patent/JP2008505644A/en active Pending
- 2005-07-08 EP EP10183722A patent/EP2287329A3/en not_active Withdrawn
- 2005-07-08 US US11/178,134 patent/US7662561B2/en not_active Expired - Fee Related
- 2005-07-08 EP EP12151990A patent/EP2468889A3/en not_active Withdrawn
- 2005-07-08 CA CA002571642A patent/CA2571642A1/en not_active Abandoned
- 2005-07-08 CA CA002571650A patent/CA2571650A1/en not_active Abandoned
- 2005-07-08 EP EP05764654A patent/EP1774025A4/en not_active Ceased
- 2005-07-08 JP JP2007520519A patent/JP2008510454A/en active Pending
- 2005-07-08 WO PCT/US2005/024194 patent/WO2006017151A2/en active Application Filing
- 2005-07-08 EP EP10183644A patent/EP2272987A3/en not_active Withdrawn
- 2005-07-08 AU AU2005271960A patent/AU2005271960B2/en not_active Ceased
- 2005-07-08 EP EP10183750A patent/EP2275578A3/en not_active Withdrawn
- 2005-07-08 AU AU2005271961A patent/AU2005271961B8/en not_active Ceased
- 2005-07-08 EP EP05770149A patent/EP1774030A4/en not_active Withdrawn
- 2005-07-08 US US11/178,109 patent/US20060068418A1/en not_active Abandoned
-
2009
- 2009-12-15 US US12/637,862 patent/US20100240037A1/en not_active Abandoned
-
2011
- 2011-02-17 US US13/030,003 patent/US20110312515A1/en not_active Abandoned
- 2011-09-01 JP JP2011190962A patent/JP2012005500A/en not_active Withdrawn
Patent Citations (31)
| Publication number | Priority date | Publication date | Assignee | Title |
|---|---|---|---|---|
| US6261776B1 (en) | 1989-06-07 | 2001-07-17 | Affymetrix, Inc. | Nucleic acid arrays |
| US6406844B1 (en) | 1989-06-07 | 2002-06-18 | Affymetrix, Inc. | Very large scale immobilized polymer synthesis |
| US6346413B1 (en) | 1989-06-07 | 2002-02-12 | Affymetrix, Inc. | Polymer arrays |
| US6416952B1 (en) | 1989-06-07 | 2002-07-09 | Affymetrix, Inc. | Photolithographic and other means for manufacturing arrays |
| US6309823B1 (en) | 1993-10-26 | 2001-10-30 | Affymetrix, Inc. | Arrays of nucleic acid probes for analyzing biotransformation genes and methods of using the same |
| US6040138A (en) | 1995-09-15 | 2000-03-21 | Affymetrix, Inc. | Expression monitoring by hybridization to high density oligonucleotide arrays |
| US6183960B1 (en) | 1995-11-21 | 2001-02-06 | Yale University | Rolling circle replication reporter systems |
| US6210884B1 (en) | 1995-11-21 | 2001-04-03 | Yale University | Rolling circle replication reporter systems |
| US6344329B1 (en) | 1995-11-21 | 2002-02-05 | Yale University | Rolling circle replication reporter systems |
| US5854003A (en) | 1997-07-03 | 1998-12-29 | Tularik Inc. | Screening method for agents that modulate human NIK activity |
| US6440725B1 (en) | 1997-12-24 | 2002-08-27 | Cepheid | Integrated fluid manipulation cartridge |
| US6306643B1 (en) | 1998-08-24 | 2001-10-23 | Affymetrix, Inc. | Methods of using an array of pooled probes in genetic analysis |
| US6245517B1 (en) | 1998-09-29 | 2001-06-12 | The United States Of America As Represented By The Department Of Health And Human Services | Ratio-based decisions and the quantitative analysis of cDNA micro-array images |
| US6251601B1 (en) | 1999-02-02 | 2001-06-26 | Vysis, Inc. | Simultaneous measurement of gene expression and genomic abnormalities using nucleic acid microarrays |
| WO2000073412A2 (en) | 1999-05-28 | 2000-12-07 | Cepheid | Apparatus and method for analyzing a fluid sample |
| WO2000072970A1 (en) | 1999-05-28 | 2000-12-07 | Cepheid | Cartridge for conducting a chemical reaction |
| WO2000073413A2 (en) | 1999-05-28 | 2000-12-07 | Cepheid | Apparatus and method for cell disruption |
| WO2001045845A1 (en) | 1999-12-21 | 2001-06-28 | Cepheid | Apparatus for performing heat-exchanging, chemical reactions |
| US6431476B1 (en) | 1999-12-21 | 2002-08-13 | Cepheid | Apparatus and method for rapid ultrasonic disruption of cells or viruses |
| WO2001057253A1 (en) | 2000-02-04 | 2001-08-09 | Cepheid | Reaction vessel and temperature control system |
| US6403037B1 (en) | 2000-02-04 | 2002-06-11 | Cepheid | Reaction vessel and temperature control system |
| WO2001084463A2 (en) | 2000-05-01 | 2001-11-08 | Cepheid | Apparatus, method, and computer program product for quantitative analysis of a nucleic acid amplification reaction |
| US6374684B1 (en) | 2000-08-25 | 2002-04-23 | Cepheid | Fluid control and processing system |
| WO2002018902A1 (en) | 2000-08-25 | 2002-03-07 | Cepheid | Fluid control and processing system |
| WO2002052030A2 (en) | 2000-12-22 | 2002-07-04 | Cepheid | Compositions and methods enabling a totally internally controlled amplification reaction |
| WO2002070751A1 (en) | 2001-03-02 | 2002-09-12 | University Of Pittsburgh Of The Commonwealth System Of Higher Education | Pcr method |
| WO2003055973A1 (en) | 2001-12-26 | 2003-07-10 | Olympus Corporation | Reaction container and reaction container holding mechanism |
| WO2003072253A1 (en) | 2002-02-25 | 2003-09-04 | Cepheid | Fluid processing and control |
| WO2003077055A2 (en) | 2002-03-04 | 2003-09-18 | Cepheid | Method and apparatus for controlling ultrasonic transducer |
| WO2004048931A2 (en) | 2002-11-25 | 2004-06-10 | Cepheid | Compositions, methods and kits for polynucleotide amplification reactions and microfluidic devices |
| US9032602B2 (en) | 2011-07-15 | 2015-05-19 | The Boeing Company | Methods and systems for in-process quality control during drill-fill assembly |
Non-Patent Citations (6)
| Title |
|---|
| BRAUN, D. ET AL.: "Exponential DNA Replication by Lominar Convection", PHYSICAL REVIEW LETTERS, vol. 91, no. 15, pages 8103 |
| GODFREY ET AL., CLINICAL CANCER RES., vol. 7, no. 12, December 2001 (2001-12-01), pages 4041 - 8 |
| KRISHNAN, MY ET AL.: "PCR in a Rayleigh-Benard convection cell", SCIENCE, vol. 298, 2002, pages 793 |
| NILSSON, M. ET AL.: "Making Ends Meet in Genetic Analysis Using Padlock Probes", HUMAN MUTATION, vol. 19, 2002, pages 410 - 415 |
| SCHWEITZER, B. ET AL.: "Combining Nucleic Acid Amplification and Detection", CURRENT OPINION IN BIOTECHNOLOGY, vol. 12, 2001, pages 21 - 27 |
| TROUTT, A.B. ET AL.: "Ligation-anchored PCR: A Simple Amplification Technique with Single-sided Specificity", PROC. NATL. ACAD. SCI. USA, vol. 89, 1992, pages 9823 - 9825 |
Cited By (1)
| Publication number | Priority date | Publication date | Assignee | Title |
|---|---|---|---|---|
| WO2023281061A1 (en) * | 2021-07-08 | 2023-01-12 | Universidad De Granada | In vitro method for the diagnosis and/or prognosis of malignant melanoma |
Also Published As
| Publication number | Publication date |
|---|---|
| CA2571642A1 (en) | 2006-02-16 |
| EP1774025A2 (en) | 2007-04-18 |
| CA2571650A1 (en) | 2006-02-16 |
| US20100240037A1 (en) | 2010-09-23 |
| AU2005271960A1 (en) | 2006-02-16 |
| AU2005271961B8 (en) | 2011-11-24 |
| AU2005271961A1 (en) | 2006-02-16 |
| US7662561B2 (en) | 2010-02-16 |
| EP2287329A3 (en) | 2011-08-03 |
| EP1774030A2 (en) | 2007-04-18 |
| US20110312515A1 (en) | 2011-12-22 |
| EP2272987A2 (en) | 2011-01-12 |
| EP1774030A4 (en) | 2008-07-09 |
| JP2012005500A (en) | 2012-01-12 |
| US20060068418A1 (en) | 2006-03-30 |
| WO2006017151A2 (en) | 2006-02-16 |
| AU2005271960B2 (en) | 2011-12-08 |
| JP2008505644A (en) | 2008-02-28 |
| AU2005271961B2 (en) | 2011-10-13 |
| EP2287329A2 (en) | 2011-02-23 |
| EP2272987A3 (en) | 2012-04-11 |
| US20060019290A1 (en) | 2006-01-26 |
| EP2468889A3 (en) | 2012-07-11 |
| WO2006017151A3 (en) | 2007-01-11 |
| EP2275578A3 (en) | 2011-11-30 |
| WO2006017150A3 (en) | 2009-04-09 |
| EP1774025A4 (en) | 2009-09-16 |
| WO2006017150A2 (en) | 2006-02-16 |
| JP2008510454A (en) | 2008-04-10 |
| EP2468889A2 (en) | 2012-06-27 |
Similar Documents
| Publication | Publication Date | Title |
|---|---|---|
| US7662561B2 (en) | Identification of markers in esophageal cancer, colon cancer, head and neck cancer, and melanoma | |
| US20090226881A1 (en) | Multiple mode multiplex reaction quenching method | |
| US7101663B2 (en) | PCR method | |
| EP1272668B1 (en) | Methods, compositions and kits for the detection and monitoring of breast cancer | |
| US7732141B2 (en) | Methods for evaluating drug-resistance gene expression in the cancer patient | |
| AU2005250479B2 (en) | Diagnosing or predicting the course of breast cancer | |
| WO2007098444A2 (en) | Methods for analysis of extracellular rna species | |
| CA3026809A1 (en) | Compositions and methods for diagnosing lung cancers using gene expression profiles | |
| AU2011253566A1 (en) | Identification of markers in esophageal cancer, colon cancer, head and neck cancer and melanoma | |
| CA2709106C (en) | Methods and reagents for the early detection of melanoma | |
| AU2007221860A1 (en) | PCR method |
Legal Events
| Date | Code | Title | Description |
|---|---|---|---|
| PUAI | Public reference made under article 153(3) epc to a published international application that has entered the european phase |
Free format text: ORIGINAL CODE: 0009012 |
|
| AC | Divisional application: reference to earlier application |
Ref document number: 1774030 Country of ref document: EP Kind code of ref document: P |
|
| AK | Designated contracting states |
Kind code of ref document: A2 Designated state(s): AT BE BG CH CY CZ DE DK EE ES FI FR GB GR HU IE IS IT LI LT LU LV MC NL PL PT RO SE SI SK TR |
|
| RIN1 | Information on inventor provided before grant (corrected) |
Inventor name: GOODING, WILLIAM E. Inventor name: RAJA, SIVA Inventor name: XI, LIQIANG Inventor name: HUGHES, STEVEN J. Inventor name: GODFREY, TONY E. |
|
| PUAL | Search report despatched |
Free format text: ORIGINAL CODE: 0009013 |
|
| AK | Designated contracting states |
Kind code of ref document: A3 Designated state(s): AT BE BG CH CY CZ DE DK EE ES FI FR GB GR HU IE IS IT LI LT LU LV MC NL PL PT RO SE SI SK TR |
|
| RIC1 | Information provided on ipc code assigned before grant |
Ipc: C12Q 1/68 20060101AFI20111021BHEP Ipc: C07H 21/02 20060101ALI20111021BHEP Ipc: C12P 19/34 20060101ALI20111021BHEP Ipc: C07H 21/04 20060101ALI20111021BHEP |
|
| 17P | Request for examination filed |
Effective date: 20120530 |
|
| STAA | Information on the status of an ep patent application or granted ep patent |
Free format text: STATUS: THE APPLICATION IS DEEMED TO BE WITHDRAWN |
|
| 18D | Application deemed to be withdrawn |
Effective date: 20130201 |