EP2634699A1 - Application monitoring - Google Patents
Application monitoring Download PDFInfo
- Publication number
- EP2634699A1 EP2634699A1 EP13156871.9A EP13156871A EP2634699A1 EP 2634699 A1 EP2634699 A1 EP 2634699A1 EP 13156871 A EP13156871 A EP 13156871A EP 2634699 A1 EP2634699 A1 EP 2634699A1
- Authority
- EP
- European Patent Office
- Prior art keywords
- monitoring
- data
- application
- database
- buffer
- Prior art date
- Legal status (The legal status is an assumption and is not a legal conclusion. Google has not performed a legal analysis and makes no representation as to the accuracy of the status listed.)
- Granted
Links
Images

Classifications
-
- G—PHYSICS
- G06—COMPUTING; CALCULATING OR COUNTING
- G06F—ELECTRIC DIGITAL DATA PROCESSING
- G06F11/00—Error detection; Error correction; Monitoring
- G06F11/30—Monitoring
- G06F11/3003—Monitoring arrangements specially adapted to the computing system or computing system component being monitored
- G06F11/302—Monitoring arrangements specially adapted to the computing system or computing system component being monitored where the computing system component is a software system
-
- G—PHYSICS
- G06—COMPUTING; CALCULATING OR COUNTING
- G06F—ELECTRIC DIGITAL DATA PROCESSING
- G06F11/00—Error detection; Error correction; Monitoring
- G06F11/30—Monitoring
- G06F11/3065—Monitoring arrangements determined by the means or processing involved in reporting the monitored data
Definitions
- the present subject matter relates, in general, to software applications and, in particular, monitoring of software applications.
- An application also referred to as a software application, is executable software that performs specific tasks. At a certain instant, there may be multiple users executing a particular application. Further, usage of an application by number of users may hamper performance of the application.
- An application may be monitored to obtain details pertaining to performance of an application. For example, an application may be monitored to check scalability, responsiveness, quality of service (QoS) requirements of an application.
- QoS quality of service
- the application monitoring may assist an administrator to detect bottleneck points and respond to anomalies before the performance of the application degrades further. This results in the reduction of server downtime for maintenance of the application, which further leads to a better performance of the application.
- monitoring data pertaining to one or more components of a software application is obtained.
- the monitoring data is obtained based on user preferences.
- the monitoring data may be transferred to a monitoring buffer after a first predetermined time interval.
- the monitoring data is further transferred from the monitoring buffer to a database after second predetermined time interval.
- the transfer of monitoring data from the monitoring buffer to the database is asynchronous of application execution process.
- Fig. 1 illustrates a network environment implementing an application monitoring system, according to an implementation of the present subject matter.
- Fig. 2 illustrates a method for monitoring an application, according to an implementation of the present subject matter.
- the present subject matter relates to monitoring of software applications, also referred to as an application.
- the present subject matter relates to performance monitoring of a Java TM application.
- An application may include several modules and each module may perform a predefined task. At a particular instant, there may be multiple modules that may be invoked by one or more users. For example, number of times a module is invoked, i.e., invocation counts may be based on popularity or importance of a module. Simultaneous execution of the modules often leads to a complex operational structure of the application. In order to gather details pertaining to efficiency, performance, and other information application monitoring may be performed. For example, application monitoring may provide help in identifying bottleneck modules and anomalies associated with the execution of such modules. Further, timely identification of such bottlenecks may provide lesser maintenance downtime and improved availability of the application, since anomalies associated with the application can be addressed before they start impacting the performance of the application.
- data collected while monitoring the application may be transferred to a permanent storage device, such as a database.
- a permanent storage device such as a database.
- the direct communication of monitoring function calls along with application execution function calls with the database may increase database network traffic.
- time taken by monitoring process may get added up in the response time of the application. Thereby resulting in an undesirable increase in response time for the application execution process.
- updation to the database may unnecessarily increase the network traffic resulting in poor performance of the application.
- monitoring data may not be stored and may be provided directly to an administrator for the monitoring purposes. Thus in such cases, the monitoring data may not be available for the future references.
- monitoring process may be integrated with the application process, which may lead to poor performance of the application as the monitoring process may hamper the application execution process.
- an application may be executed as various application servers in a cluster environment.
- an application may include multiple components, which may be defined at any granular level.
- a component may be defined at a module level, where each module performs a separate business process.
- an application may include enrollment and project management as its two modules.
- Each module may further comprise multiple sub-modules or business methods, where each such business method may perform a dedicated task within that module.
- enrollment may further define its submodule as household enrollment and loan enrollment.
- the loan enrollment may further include may define personal loan, education loan, car loan, etc., as further sub- modules.
- the present subject matter provides data pertaining to performance and execution of the application occurring at the component level.
- data pertaining to performance and execution details of an application may be obtained.
- Such data may be hereinafter referred to as monitoring data.
- the monitoring data may include details pertaining to slow access of the application, response time, invocation counts, queries, etc.
- the obtained monitoring data may correspond to target components of the application. The selection of the target components may be done based on predefined user preferences.
- the monitoring data may be transferred to a monitoring buffer for the temporary storage on a periodic basis. Further, the monitoring data may be further transferred to the database after a predetermined time interval. In an implementation, the predetermined time interval is configurable.
- the transfer process from the monitoring buffer to the database may be asynchronous with respect to application execution process.
- Asynchronous transfer ensures that the monitoring process does not hamper the application performance.
- the monitoring buffer may be flushed to receive monitoring data for corresponding to next monitoring cycle.
- the monitoring data collected in the database stays in the database and may be fetched by users as when required. Further, monitoring the data may help a user in identifying bottleneck points of the application and anomalies in the functioning of the application. Further, the monitoring of the application is performed in a manner that it does not interfere with the execution of the application, which not only results in better performance of the application but also ensures that substantially accurate data pertaining to the performance of the application is received.
- the monitoring process may be configurable at runtime. Further, the initiation and termination of the monitoring process may be possible during the application execution without restarting an application server hosting the software application. In one implementation, the initiation and termination may be controlled through a property flag (True/False) defined in monitoring properties file configured in the application server. In an example, the 'True' value of the property flag may signify that the monitoring process is enabled and 'False' value may signify that the monitoring process is disabled. Therefore, depending on the value (True/False) defined for the property flag, the monitoring process may be started, continued or discontinued. Further, the application may be monitored at an application level, database level, or both. While monitoring at the application level, performance parameters, such as invocation count and response time for a user request may be gathered. While monitoring at the database level, a database query fired in response to a transaction corresponding to the user request may be gathered.
- Fig. 1 illustrates a network environment 100 implementing an application monitoring system 102, according to an embodiment of the present subject matter.
- the application monitoring system 102 may be provided as an application server in cluster environment. Although, a single application server has been illustrated in Fig. 1 , it will be understood that multiple application servers may also be provided.
- the application monitoring system 102 may be connected to one or more user devices 104-1, 104-2, ..., 104-N via a network 106.
- the user devices 104-1, 104-2... 104-N are hereinafter collectively referred to as user devices 104 and individually referred to as user device 104.
- the network 106 may be a wireless network, a wired network, or a combination thereof.
- the network 106 can also be an individual network or a collection of many such individual networks, interconnected with each other and functioning as a single large network, e.g., the Internet or an intranet.
- the network 106 can be implemented as one of the different types of networks, such as intranet, local area network (LAN), wide area network (WAN), the internet, and the like.
- the network 106 may either be a dedicated network or a shared network, which represents an association of the different types of networks that use a variety of protocols, for example, Hypertext Transfer Protocol (HTTP), Transmission Control Protocol/Internet Protocol (TCP/IP), etc., to communicate with each other.
- HTTP Hypertext Transfer Protocol
- TCP/IP Transmission Control Protocol/Internet Protocol
- the network 106 may include network devices, such as network switches, hubs, and routers for providing a link between the application monitoring system 102 and the user devices 104.
- the network devices within the network 106 may interact with the application monitoring system 102 and the user device 104 through the communication links.
- the application monitoring system 102 and the user devices 104 can be implemented as any of a variety of conventional computing devices including, for example, servers, a desktop PC, a notebook or a portable computer, a workstation, a mainframe computer, and an Internet appliance.
- the application monitoring system 102 includes one or more processor(s) 108, one or more interface(s) 110 and a memory, such as a memory 112, coupled to the processor(s) 108.
- the interfaces 110 may include a variety of software and hardware interfaces, for example, interfaces for peripheral device(s), such as a keyboard, a mouse, an external memory, and a printer. Further, the interfaces 110 may enable the application monitoring system 102 to communicate with different computing systems, such as the user devices 104.
- the interfaces 110 can facilitate multiple communications within a wide variety of networks and protocol types, including wired networks, for example, local area network (LAN), cable, etc., and wireless networks, such as Wireless LAN (WLAN), cellular, or satellite.
- the interfaces 110 may include one or more ports for connecting the user devices 104 to each other or to another computing system or a database, such as a database 114.
- the processor 108 can be a single processing unit or a number of units, all of which could include multiple computing units.
- the processor 108 may be implemented as one or more microprocessors, microcomputers, microcontrollers, digital signal processors, central processing units, state machines, logic circuitries, and/or any devices that manipulate signals based on operational instructions.
- the processor 108 is configured to fetch and execute computer-readable instructions and data stored in the memory 112.
- processors may be provided through the use of dedicated hardware as well as hardware capable of executing software in association with appropriate software.
- the functions may be provided by a single dedicated processor, by a single shared processor, or by a plurality of individual processors, some of which may be shared.
- explicit use of the term "processor” should not be construed to refer exclusively to hardware capable of executing software, and may implicitly include, without limitation, digital signal processor (DSP) hardware, network processor, application specific integrated circuit (ASIC), field programmable gate array (FPGA), read only memory (ROM) for storing software, random access memory (RAM), and non volatile storage.
- DSP digital signal processor
- ASIC application specific integrated circuit
- FPGA field programmable gate array
- ROM read only memory
- RAM random access memory
- the memory 112 may include any computer-readable medium known in the art including, for example, volatile memory, such as static random access memory (SRAM) and dynamic random access memory (DRAM), and/or non-volatile memory, such as read only memory (ROM), erasable programmable ROM, flash memories, hard disks, optical disks, and magnetic tapes.
- volatile memory such as static random access memory (SRAM) and dynamic random access memory (DRAM)
- non-volatile memory such as read only memory (ROM), erasable programmable ROM, flash memories, hard disks, optical disks, and magnetic tapes.
- the memory 112 includes module(s) 116 and data 118.
- the modules 116 include routines, programs, objects, components, data structures, etc., which perform particular tasks or implement particular abstract data types.
- the modules 116 further include a monitoring module 120, an asynchronous data transfer module 122, and other modules 124.
- the data 118 serves, amongst other things, as a repository for storing data processed, received and generated by one or more of the modules 116.
- the data 118 includes monitoring data 126, application(s) 127 may also be referred to as software application(s) 127, and other data 128.
- application 127 has been shown as being stored in data 118. It will however be understood that the application 127 may alternatively be a part of modules 116 or may be hosted on an external storage device or another computing device.
- the other data 128 includes data generated as a result of the execution of one or more modules 116.
- the memory 112 includes one or more applications 127.
- the application 127 may include multiple components, which may be invoked by various users.
- the components may be defined at any level of granularity. In an example, the components may be categorized at a module level.
- a component may further comprise multiple business methods. Some of these components may be considered of a particular importance in application execution process. A user may wish to monitor such components having a particular importance comparable to other components. Such components may be referred to as target components.
- the monitoring module 120 of the application 127 may be configured to monitor and provide details pertaining to the performance of the application 127.
- the monitoring module 120 may identify the target components of the application 127, based on user preferences. In an example, users who wish to monitor the application 127 may define their preferences at run time. Further, the monitoring module 120 may define the execution points in the application 127. The execution points may be considered as a group of point cuts and their execution. The execution points may be the target components which need to be monitored. In an example, the monitoring module 120 may be defined using aspect oriented programming. Thus, the monitoring module 120 may determine performance parameters corresponding to each of the target components of the application 127 and store in the monitoring data 126. In an example, the performance parameters may be invocation counts, response time, database query, etc.
- a request for invoking one or more components of an application 127 may be referred to as business request. It will be understood that each business request may invoke multiple components and hence there may be multiple transactions. For each transaction corresponding to a business request, the performance parameters may be obtained.
- An invocation count for a component may be understood as a number of times that component is invoked.
- a counter may keep the record of invocation counts corresponding to a component. The counter may be raised whenever there is a hit for the particular component.
- the invocation count may also define popularity of that particular component among users, i.e., the more the invocation count of a component, the higher is the popularity. Often times, such popular components become the bottleneck components of an application 127 and improving the performance of such components may improve the overall performance of the application 127.
- the application 127 may take some time in generating a response or required output in response to such invocation. Time taken by the application 127 to generate the output corresponding to a user request is referred to as the response time for the user request. Based on the user request or input, a particular component is invoked. Further, the application monitoring system 102 may fire at least one query in response to the transaction to obtain the required output.
- the monitoring module 120 may provide the monitoring data 126 associated with the target components to a temporary storage device, such as a monitoring buffer 130. It will be understood that the monitoring data 126 will correspond to a previous monitoring cycle, where each cycle is of the first predetermined time interval.
- structure of data that is to be stored in the monitoring buffer 130 may be predefined by a user.
- the monitoring buffer may be fast memory, such as cache. Thus, the monitoring data 126 may be efficiently provided to the monitoring buffer 130, thereby saving on computational time and resources.
- the monitoring buffer 130 may store the monitoring data 126 for a second predetermined time interval. From the monitoring buffer 130, the asynchronous data transfer module 122 may transfer the monitoring data 126 to the database 114 after every second predetermined time interval. The monitoring data 126 from the monitoring buffer 130 is transferred to the database 114 such that the execution of the application 127 is independent of the monitoring process. Thus, the monitoring process does not hinder with the execution of the application 127. The independent working may be ensured since the network for transferring monitoring data 126 from the monitoring buffer 130 to the database 114 is separate from the one in which the application 127 is executing.
- the asynchronous data transfer module 122 may flush the stored monitoring data 126 from the monitoring buffer 130 once a database updation criteria is met.
- the database updation criteria may be at least one of successful completion of previous transfer cycle from the monitoring buffer 130 to the database 114 and the expiration of a third predetermined time interval. This results in efficient usage of buffer memory and lossless data transfer. Flushing of the monitoring data 126 from the monitoring buffer 130 following the successful data transfer to the database 114 minimizes the possibilities of data loss during transfer and avoids memory leaks.
- the monitoring module 120 may be in sync with the asynchronous data transfer module 122 so that the monitoring buffer 130 is accordingly updated and flushed.
- the first, second, and third predetermined time intervals may be predefined by a user and may be reset based on the requirements and data volumes.
- the first, second, and third predetermined time intervals may be same or different depending on the user preference.
- the duration of the predetermined time intervals may be changed at runtime allowing the user to control memory usage by the monitoring buffer 130.
- the time intervals may be defined optimally to provide efficient monitoring process.
- the asynchronous data transfer module 122 may further be configured to periodically check the value defined for a property flag (True/False) in monitoring properties files, and control the initiation and termination of the monitoring process based on the status. For example, if the value of the property flag changes from 'False' to 'True', the asynchronous data transfer module 122 may flush the monitoring data 126 corresponding to the previous data transfer cycle from the monitoring buffer 130, upload the property file to initiate the monitoring process, and the monitoring process may then proceed as mentioned above. Alternatively, when the value of the property flag changes from 'True' to 'False', the asynchronous data transfer module 122 may similarly terminate the ongoing monitoring process. Thus the monitoring process may be initiated and terminated without restarting a server hosting the application 127.
- a property flag True/False
- the database 114 stores the monitoring data 126 received from the asynchronous data transfer module 122.
- the database 114 may be a permanent storage device and may be archived, if required.
- the database 114 makes available data pertaining to performance of the application 127 for future references.
- the monitoring buffer 130 is a fast memory, therefore time taken to transfer data is substantially reduced thereby not hindering the performance of the application 127. This may provide for faster response time, thereby enhancing the performance of the application 127 and also not hindering with the execution of the application 127. Further, such a provision provides for reduction in network traffic as the database 114 is not overloaded with large number of updates simultaneously.
- the user device 104 may fetch the monitoring data 126 from the database 114 as per the requirement using a graphical monitoring tool, such as JConsole TM . Further, the graphical monitoring tool may also facilitate fetching of data in a required format.
- the user may send a query via corresponding user device 104 to obtain monitoring data over a given interval for a particular application 127.
- the graphical monitoring tool may obtain required data from the database 114 and display it on the user device.
- the monitoring data 126 may be provided as Mbean TM objects.
- the application monitoring system 102 may be configured to analyze the monitoring data based on predefined analysis rules and provide a response based on the analysis.
- the predefined analysis rules may define a threshold response time. In said example, if it is determined the response time for a user request is greater than a threshold response time; an alert may be provided to a concerned user.
- predefined analysis rules may describe rules to identify red flag components, say, based on invocation counts or response time. In said example, the application monitoring system 102 may highlight the red flag components or the most popular component.
- a user may analyze the fetched monitoring data and take corrective measures for improving the performance of various components of the application 127.
- This further provides for enhancement of the performance of the application 127 by incorporating the appropriate changes in the application 127. For example, popular components may be tweaked to improve the performance of the application 127. Additionally, identification of popular components may help in taking business related decisions as well, for example, area of further growth.
- the present subject matter further provides application monitoring for the client server applications as well as for the desktop applications.
- the monitoring data 126 may be viewed by integrating a server, implementing described monitoring process, with the desktop application.
- Fig. 2 illustrates a method 200 for application monitoring, according to an implementation of the present subject matter.
- the method 200 may be implemented in a variety of computing systems in several different ways.
- the method 200, described herein, may be implemented using the application monitoring system 102.
- the method 200 may be described in the general context of computer executable instructions.
- computer executable instructions can include routines, programs, objects, components, data structures, procedures, modules, functions, etc., that perform particular functions or implement particular abstract data types.
- steps of the method can be performed by programmed computers.
- program storage devices e.g., digital data storage media, which are machine or computer readable and encode machine-executable or computer-executable programs of instructions, wherein said instructions perform some or all of the steps of the described method 200.
- one or more requests invoking the target components corresponding to an application is received from one or more user devices, such as the user devices 104.
- the requests may invoke one or more target components of the application 127.
- a target component may be a component that needs to be monitored and such target components may be selected by a user at runtime or prior to execution of the application 127.
- the method 200 branches to block 204.
- monitoring data corresponding to invoked target components is obtained.
- the monitoring data 126 may include performance parameters associated with each of the target components.
- the performance parameters may be response time corresponding to a user request associated with a target component, invocation count of a target component, queries fired in response to a transaction, etc.
- obtained monitoring data 126 is transferred to a monitoring buffer, such as monitoring buffer 130 after a first predetermined time interval.
- the monitoring data 126 is transferred to the monitoring buffer 130 periodically.
- the monitoring module 120 transfers the monitoring data 126 to the monitoring buffer 130.
- the asynchronous data transfer module 122 determines whether the second predetermined time interval is over. If it is determined that the second predetermined time interval is over, ("Yes" branch from block 208), the method 200 branches to block 210.
- the monitoring data 126 from the monitoring buffer 130 is transferred from the monitoring buffer 130 to a database, such as the database 114. Thus, the database 114 is updated with the latest monitoring data periodically.
- the method 200 branches back to block 208.
- a database updation criteria it is determined whether a database updation criteria is met. If it is determined that the database updation criteria are met, ("Yes branch from block 212), the method 200 moves to block 214. In an implementation, the asynchronous data transfer module 122 determines if the data updation criteria is met.
- the monitoring data 126 may be flushed from the monitoring buffer 130, when the database updation criteria.
- the asynchronous data transfer module 122 may flush the monitoring buffer 130 after successful transfer of monitoring data 126, to ensure lossless data transmission.
- the asynchronous data transfer module 122 may flush the monitoring buffer 130 upon lapse of a third predetermined time interval and successful data transfer.
- the method 200 branches back to block 212 and the transfer of monitoring data 126 from the monitoring buffer 130 is continued.
Abstract
Description
- The present subject matter relates, in general, to software applications and, in particular, monitoring of software applications.
- An application, also referred to as a software application, is executable software that performs specific tasks. At a certain instant, there may be multiple users executing a particular application. Further, usage of an application by number of users may hamper performance of the application. An application may be monitored to obtain details pertaining to performance of an application. For example, an application may be monitored to check scalability, responsiveness, quality of service (QoS) requirements of an application.
- The application monitoring may assist an administrator to detect bottleneck points and respond to anomalies before the performance of the application degrades further. This results in the reduction of server downtime for maintenance of the application, which further leads to a better performance of the application.
- Often times, during application monitoring, due to multiple users accessing the application concurrently, response time of the application may increase. It may be possible that transfer of huge volume of data directly from application to a database may lead to memory leaks. Further, monitoring process may hinder the performance of the application.
- This summary is provided to introduce concepts related to a method for application monitoring and the concepts are further described below in the detailed description. This summary is neither intended to identify essential features of the claimed subject matter nor is it intended for use in determining or limiting the scope of the claimed subject matter.
- In an embodiment of the present subject matter, method(s) and system(s) for performance monitoring of a software application is described. In one implementation, monitoring data pertaining to one or more components of a software application is obtained. The monitoring data is obtained based on user preferences. The monitoring data may be transferred to a monitoring buffer after a first predetermined time interval. The monitoring data is further transferred from the monitoring buffer to a database after second predetermined time interval. The transfer of monitoring data from the monitoring buffer to the database is asynchronous of application execution process.
- The detailed description is provided with reference to the accompanying figures. In the figures, the left-most digit(s) of a reference number identifies the figure in which the reference number first appears. The same numbers are used throughout the drawings to reference like features and components.
-
Fig. 1 illustrates a network environment implementing an application monitoring system, according to an implementation of the present subject matter. -
Fig. 2 illustrates a method for monitoring an application, according to an implementation of the present subject matter. - The present subject matter relates to monitoring of software applications, also referred to as an application. In an embodiment, the present subject matter relates to performance monitoring of a Java™ application. An application may include several modules and each module may perform a predefined task. At a particular instant, there may be multiple modules that may be invoked by one or more users. For example, number of times a module is invoked, i.e., invocation counts may be based on popularity or importance of a module. Simultaneous execution of the modules often leads to a complex operational structure of the application. In order to gather details pertaining to efficiency, performance, and other information application monitoring may be performed. For example, application monitoring may provide help in identifying bottleneck modules and anomalies associated with the execution of such modules. Further, timely identification of such bottlenecks may provide lesser maintenance downtime and improved availability of the application, since anomalies associated with the application can be addressed before they start impacting the performance of the application.
- Typically, data collected while monitoring the application may be transferred to a permanent storage device, such as a database. The direct communication of monitoring function calls along with application execution function calls with the database may increase database network traffic. Generally, during execution of the application, time taken by monitoring process may get added up in the response time of the application. Thereby resulting in an undesirable increase in response time for the application execution process. Further in certain cases, updation to the database may unnecessarily increase the network traffic resulting in poor performance of the application. Further, in certain techniques, monitoring data may not be stored and may be provided directly to an administrator for the monitoring purposes. Thus in such cases, the monitoring data may not be available for the future references. Additionally, often times, monitoring process may be integrated with the application process, which may lead to poor performance of the application as the monitoring process may hamper the application execution process.
- According to an embodiment of the present subject matter, system(s) and method(s) for monitoring of an application are described herein. Further, the applications may be executed as various application servers in a cluster environment. In an embodiment, an application may include multiple components, which may be defined at any granular level. For example, a component may be defined at a module level, where each module performs a separate business process. For instance, an application may include enrollment and project management as its two modules.
- Each module may further comprise multiple sub-modules or business methods, where each such business method may perform a dedicated task within that module. Considering the above mentioned example, enrollment may further define its submodule as household enrollment and loan enrollment. The loan enrollment may further include may define personal loan, education loan, car loan, etc., as further sub- modules.
- The present subject matter provides data pertaining to performance and execution of the application occurring at the component level. In one implementation, data pertaining to performance and execution details of an application may be obtained. Such data may be hereinafter referred to as monitoring data. The monitoring data may include details pertaining to slow access of the application, response time, invocation counts, queries, etc. Further, the obtained monitoring data may correspond to target components of the application. The selection of the target components may be done based on predefined user preferences. Upon obtaining, the monitoring data may be transferred to a monitoring buffer for the temporary storage on a periodic basis. Further, the monitoring data may be further transferred to the database after a predetermined time interval. In an implementation, the predetermined time interval is configurable. Furthermore, the transfer process from the monitoring buffer to the database may be asynchronous with respect to application execution process. Asynchronous transfer ensures that the monitoring process does not hamper the application performance. Upon successful transfer of data from monitoring buffer to the database, the monitoring buffer may be flushed to receive monitoring data for corresponding to next monitoring cycle.
- In addition, the monitoring data collected in the database stays in the database and may be fetched by users as when required. Further, monitoring the data may help a user in identifying bottleneck points of the application and anomalies in the functioning of the application. Further, the monitoring of the application is performed in a manner that it does not interfere with the execution of the application, which not only results in better performance of the application but also ensures that substantially accurate data pertaining to the performance of the application is received.
- In an embodiment of the present subject matter, the monitoring process may be configurable at runtime. Further, the initiation and termination of the monitoring process may be possible during the application execution without restarting an application server hosting the software application. In one implementation, the initiation and termination may be controlled through a property flag (True/False) defined in monitoring properties file configured in the application server. In an example, the 'True' value of the property flag may signify that the monitoring process is enabled and 'False' value may signify that the monitoring process is disabled. Therefore, depending on the value (True/False) defined for the property flag, the monitoring process may be started, continued or discontinued. Further, the application may be monitored at an application level, database level, or both. While monitoring at the application level, performance parameters, such as invocation count and response time for a user request may be gathered. While monitoring at the database level, a database query fired in response to a transaction corresponding to the user request may be gathered.
- The above methods and systems are further described in conjunction with the following figures. It should be noted that the description and figures merely illustrate the principles of the present subject matter. It will thus be appreciated that those skilled in the art will be able to devise various arrangements that, although not explicitly described or shown herein, embody the principles of the present subject matter and are included within its spirit and scope. Furthermore, all examples recited herein are principally intended expressly to be only for pedagogical purposes to aid the reader in understanding the principles of the present subject matter and the concepts contributed by the inventor(s) to furthering the art, and are to be construed as being without limitation to such specifically recited examples and conditions. Moreover, all statements herein reciting principles, aspects, and embodiments of the present subject matter, as well as specific examples thereof, are intended to encompass equivalents thereof.
- While aspects of described systems and methods for application monitoring can be implemented in any number of different systems, environments, and/or configurations, the embodiments are described in the context of the following system architecture(s).
-
Fig. 1 illustrates anetwork environment 100 implementing anapplication monitoring system 102, according to an embodiment of the present subject matter. Theapplication monitoring system 102 may be provided as an application server in cluster environment. Although, a single application server has been illustrated inFig. 1 , it will be understood that multiple application servers may also be provided. Theapplication monitoring system 102 may be connected to one or more user devices 104-1, 104-2, ..., 104-N via anetwork 106. For the purpose of explanation and clarity, the user devices 104-1, 104-2... 104-N, are hereinafter collectively referred to asuser devices 104 and individually referred to asuser device 104. - The
network 106 may be a wireless network, a wired network, or a combination thereof. Thenetwork 106 can also be an individual network or a collection of many such individual networks, interconnected with each other and functioning as a single large network, e.g., the Internet or an intranet. Thenetwork 106 can be implemented as one of the different types of networks, such as intranet, local area network (LAN), wide area network (WAN), the internet, and the like. Thenetwork 106 may either be a dedicated network or a shared network, which represents an association of the different types of networks that use a variety of protocols, for example, Hypertext Transfer Protocol (HTTP), Transmission Control Protocol/Internet Protocol (TCP/IP), etc., to communicate with each other. Further, thenetwork 106 may include network devices, such as network switches, hubs, and routers for providing a link between theapplication monitoring system 102 and theuser devices 104. The network devices within thenetwork 106 may interact with theapplication monitoring system 102 and theuser device 104 through the communication links. - The
application monitoring system 102 and theuser devices 104 can be implemented as any of a variety of conventional computing devices including, for example, servers, a desktop PC, a notebook or a portable computer, a workstation, a mainframe computer, and an Internet appliance. - As illustrated, the
application monitoring system 102 includes one or more processor(s) 108, one or more interface(s) 110 and a memory, such as amemory 112, coupled to the processor(s) 108. Theinterfaces 110 may include a variety of software and hardware interfaces, for example, interfaces for peripheral device(s), such as a keyboard, a mouse, an external memory, and a printer. Further, theinterfaces 110 may enable theapplication monitoring system 102 to communicate with different computing systems, such as theuser devices 104. Theinterfaces 110 can facilitate multiple communications within a wide variety of networks and protocol types, including wired networks, for example, local area network (LAN), cable, etc., and wireless networks, such as Wireless LAN (WLAN), cellular, or satellite. For the purpose, theinterfaces 110 may include one or more ports for connecting theuser devices 104 to each other or to another computing system or a database, such as adatabase 114. - The
processor 108 can be a single processing unit or a number of units, all of which could include multiple computing units. Theprocessor 108 may be implemented as one or more microprocessors, microcomputers, microcontrollers, digital signal processors, central processing units, state machines, logic circuitries, and/or any devices that manipulate signals based on operational instructions. Among other capabilities, theprocessor 108 is configured to fetch and execute computer-readable instructions and data stored in thememory 112. - The functions of the various elements shown in the figures, including any functional blocks labeled as "processor(s)", may be provided through the use of dedicated hardware as well as hardware capable of executing software in association with appropriate software. When provided by a processor, the functions may be provided by a single dedicated processor, by a single shared processor, or by a plurality of individual processors, some of which may be shared. Moreover, explicit use of the term "processor" should not be construed to refer exclusively to hardware capable of executing software, and may implicitly include, without limitation, digital signal processor (DSP) hardware, network processor, application specific integrated circuit (ASIC), field programmable gate array (FPGA), read only memory (ROM) for storing software, random access memory (RAM), and non volatile storage.
- The
memory 112 may include any computer-readable medium known in the art including, for example, volatile memory, such as static random access memory (SRAM) and dynamic random access memory (DRAM), and/or non-volatile memory, such as read only memory (ROM), erasable programmable ROM, flash memories, hard disks, optical disks, and magnetic tapes. Thememory 112 includes module(s) 116 anddata 118. Themodules 116, amongst other things, include routines, programs, objects, components, data structures, etc., which perform particular tasks or implement particular abstract data types. Themodules 116 further include amonitoring module 120, an asynchronous data transfer module 122, andother modules 124. - The
data 118 serves, amongst other things, as a repository for storing data processed, received and generated by one or more of themodules 116. Thedata 118 includesmonitoring data 126, application(s) 127 may also be referred to as software application(s) 127, andother data 128. For the purposes of illustration, theapplication 127 has been shown as being stored indata 118. It will however be understood that theapplication 127 may alternatively be a part ofmodules 116 or may be hosted on an external storage device or another computing device. Theother data 128 includes data generated as a result of the execution of one ormore modules 116. - Further, the
memory 112 includes one ormore applications 127. Further, theapplication 127 may include multiple components, which may be invoked by various users. The components may be defined at any level of granularity. In an example, the components may be categorized at a module level. A component may further comprise multiple business methods. Some of these components may be considered of a particular importance in application execution process. A user may wish to monitor such components having a particular importance comparable to other components. Such components may be referred to as target components. - In implementation, the
monitoring module 120 of theapplication 127 may be configured to monitor and provide details pertaining to the performance of theapplication 127. Themonitoring module 120 may identify the target components of theapplication 127, based on user preferences. In an example, users who wish to monitor theapplication 127 may define their preferences at run time. Further, themonitoring module 120 may define the execution points in theapplication 127. The execution points may be considered as a group of point cuts and their execution. The execution points may be the target components which need to be monitored. In an example, themonitoring module 120 may be defined using aspect oriented programming. Thus, themonitoring module 120 may determine performance parameters corresponding to each of the target components of theapplication 127 and store in themonitoring data 126. In an example, the performance parameters may be invocation counts, response time, database query, etc. A request for invoking one or more components of anapplication 127 may be referred to as business request. It will be understood that each business request may invoke multiple components and hence there may be multiple transactions. For each transaction corresponding to a business request, the performance parameters may be obtained. - An invocation count for a component may be understood as a number of times that component is invoked. A counter may keep the record of invocation counts corresponding to a component. The counter may be raised whenever there is a hit for the particular component. The invocation count may also define popularity of that particular component among users, i.e., the more the invocation count of a component, the higher is the popularity. Often times, such popular components become the bottleneck components of an
application 127 and improving the performance of such components may improve the overall performance of theapplication 127. - Once a particular component is invoked by a user, the
application 127 may take some time in generating a response or required output in response to such invocation. Time taken by theapplication 127 to generate the output corresponding to a user request is referred to as the response time for the user request. Based on the user request or input, a particular component is invoked. Further, theapplication monitoring system 102 may fire at least one query in response to the transaction to obtain the required output. - The
monitoring module 120 may provide themonitoring data 126 associated with the target components to a temporary storage device, such as amonitoring buffer 130. It will be understood that themonitoring data 126 will correspond to a previous monitoring cycle, where each cycle is of the first predetermined time interval. In an example, structure of data that is to be stored in themonitoring buffer 130 may be predefined by a user. Further, in an example, the monitoring buffer may be fast memory, such as cache. Thus, themonitoring data 126 may be efficiently provided to themonitoring buffer 130, thereby saving on computational time and resources. - The
monitoring buffer 130 may store themonitoring data 126 for a second predetermined time interval. From themonitoring buffer 130, the asynchronous data transfer module 122 may transfer themonitoring data 126 to thedatabase 114 after every second predetermined time interval. Themonitoring data 126 from themonitoring buffer 130 is transferred to thedatabase 114 such that the execution of theapplication 127 is independent of the monitoring process. Thus, the monitoring process does not hinder with the execution of theapplication 127. The independent working may be ensured since the network for transferringmonitoring data 126 from themonitoring buffer 130 to thedatabase 114 is separate from the one in which theapplication 127 is executing. - Further, the asynchronous data transfer module 122 may flush the stored
monitoring data 126 from themonitoring buffer 130 once a database updation criteria is met. The database updation criteria may be at least one of successful completion of previous transfer cycle from themonitoring buffer 130 to thedatabase 114 and the expiration of a third predetermined time interval. This results in efficient usage of buffer memory and lossless data transfer. Flushing of themonitoring data 126 from themonitoring buffer 130 following the successful data transfer to thedatabase 114 minimizes the possibilities of data loss during transfer and avoids memory leaks. Further, it will be understood that themonitoring module 120 may be in sync with the asynchronous data transfer module 122 so that themonitoring buffer 130 is accordingly updated and flushed. - In an embodiment, the first, second, and third predetermined time intervals may be predefined by a user and may be reset based on the requirements and data volumes. The first, second, and third predetermined time intervals may be same or different depending on the user preference. The duration of the predetermined time intervals may be changed at runtime allowing the user to control memory usage by the
monitoring buffer 130. The time intervals may be defined optimally to provide efficient monitoring process. - In an embodiment, the asynchronous data transfer module 122 may further be configured to periodically check the value defined for a property flag (True/False) in monitoring properties files, and control the initiation and termination of the monitoring process based on the status. For example, if the value of the property flag changes from 'False' to 'True', the asynchronous data transfer module 122 may flush the
monitoring data 126 corresponding to the previous data transfer cycle from themonitoring buffer 130, upload the property file to initiate the monitoring process, and the monitoring process may then proceed as mentioned above. Alternatively, when the value of the property flag changes from 'True' to 'False', the asynchronous data transfer module 122 may similarly terminate the ongoing monitoring process. Thus the monitoring process may be initiated and terminated without restarting a server hosting theapplication 127. - The
database 114 stores themonitoring data 126 received from the asynchronous data transfer module 122. Thedatabase 114 may be a permanent storage device and may be archived, if required. Thus, thedatabase 114 makes available data pertaining to performance of theapplication 127 for future references. Thus, instead of transferringmonitoring data 126 directly to thedatabase 114, it is first transferred to themonitoring buffer 130. Since, themonitoring buffer 130 is a fast memory, therefore time taken to transfer data is substantially reduced thereby not hindering the performance of theapplication 127. This may provide for faster response time, thereby enhancing the performance of theapplication 127 and also not hindering with the execution of theapplication 127. Further, such a provision provides for reduction in network traffic as thedatabase 114 is not overloaded with large number of updates simultaneously. - The
user device 104 may fetch themonitoring data 126 from thedatabase 114 as per the requirement using a graphical monitoring tool, such as JConsole™. Further, the graphical monitoring tool may also facilitate fetching of data in a required format. The user may send a query via correspondinguser device 104 to obtain monitoring data over a given interval for aparticular application 127. The graphical monitoring tool may obtain required data from thedatabase 114 and display it on the user device. For example, themonitoring data 126 may be provided as Mbean™ objects. - In an embodiment, the
application monitoring system 102 may be configured to analyze the monitoring data based on predefined analysis rules and provide a response based on the analysis. For example, the predefined analysis rules may define a threshold response time. In said example, if it is determined the response time for a user request is greater than a threshold response time; an alert may be provided to a concerned user. In another example, predefined analysis rules may describe rules to identify red flag components, say, based on invocation counts or response time. In said example, theapplication monitoring system 102 may highlight the red flag components or the most popular component. - In another embodiment, upon fetching data from the
database 114, a user may analyze the fetched monitoring data and take corrective measures for improving the performance of various components of theapplication 127. This further provides for enhancement of the performance of theapplication 127 by incorporating the appropriate changes in theapplication 127. For example, popular components may be tweaked to improve the performance of theapplication 127. Additionally, identification of popular components may help in taking business related decisions as well, for example, area of further growth. - The present subject matter further provides application monitoring for the client server applications as well as for the desktop applications. In desktop applications, the
monitoring data 126 may be viewed by integrating a server, implementing described monitoring process, with the desktop application. -
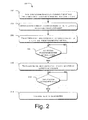
Fig. 2 illustrates amethod 200 for application monitoring, according to an implementation of the present subject matter. Themethod 200 may be implemented in a variety of computing systems in several different ways. For example, themethod 200, described herein, may be implemented using theapplication monitoring system 102. - The
method 200, completely or partially, may be described in the general context of computer executable instructions. Generally, computer executable instructions can include routines, programs, objects, components, data structures, procedures, modules, functions, etc., that perform particular functions or implement particular abstract data types. A person skilled in the art will readily recognize that steps of the method can be performed by programmed computers. Herein, some embodiments are also intended to cover program storage devices, e.g., digital data storage media, which are machine or computer readable and encode machine-executable or computer-executable programs of instructions, wherein said instructions perform some or all of the steps of the describedmethod 200. - The order in which the
method 200 is described is not intended to be construed as a limitation, and any number of the described method blocks can be combined in any order to implement the method, or an alternative method. Additionally, individual blocks may be deleted from the method without departing from the spirit and scope of the subject matter described herein. Furthermore, the methods can be implemented in any suitable hardware, software, firmware, or combination thereof. It will be understood that even though the method 300 is described with reference to theapplication monitoring system 102, the description may be extended to other systems as well. - Referring to
Fig. 2 , at theblock 202, one or more requests invoking the target components corresponding to an application, such as theapplication 127, is received from one or more user devices, such as theuser devices 104. The requests may invoke one or more target components of theapplication 127. A target component may be a component that needs to be monitored and such target components may be selected by a user at runtime or prior to execution of theapplication 127. Following the invocation of at least one of the target components, themethod 200 branches to block 204. - At
block 204, monitoring data corresponding to invoked target components is obtained. Themonitoring data 126 may include performance parameters associated with each of the target components. The performance parameters may be response time corresponding to a user request associated with a target component, invocation count of a target component, queries fired in response to a transaction, etc. - At
block 206, obtainedmonitoring data 126 is transferred to a monitoring buffer, such asmonitoring buffer 130 after a first predetermined time interval. Thus, themonitoring data 126 is transferred to themonitoring buffer 130 periodically. In an implementation, themonitoring module 120 transfers themonitoring data 126 to themonitoring buffer 130. - At
block 208, it is determined if a second predetermined time interval is over. In an implementation, the asynchronous data transfer module 122 determines whether the second predetermined time interval is over. If it is determined that the second predetermined time interval is over, ("Yes" branch from block 208), themethod 200 branches to block 210. Atblock 210, themonitoring data 126 from themonitoring buffer 130 is transferred from themonitoring buffer 130 to a database, such as thedatabase 114. Thus, thedatabase 114 is updated with the latest monitoring data periodically. However, if it is determined that the second predetermined time interval is not over, ("No" branch from block 208), themethod 200 branches back to block 208. - At
block 212, it is determined whether a database updation criteria is met. If it is determined that the database updation criteria are met, ("Yes branch from block 212), themethod 200 moves to block 214. In an implementation, the asynchronous data transfer module 122 determines if the data updation criteria is met. - At
block 214, themonitoring data 126 may be flushed from themonitoring buffer 130, when the database updation criteria. In an example, the asynchronous data transfer module 122 may flush themonitoring buffer 130 after successful transfer ofmonitoring data 126, to ensure lossless data transmission. In another example, the asynchronous data transfer module 122 may flush themonitoring buffer 130 upon lapse of a third predetermined time interval and successful data transfer. - Referring back to block 212, if it is determined that the database updation criteria is not met ("No" branch from block 212), the
method 200 branches back to block 212 and the transfer ofmonitoring data 126 from themonitoring buffer 130 is continued. - Although embodiments for methods and systems for application monitoring have been described in a language specific to structural features and/or methods, it is to be understood that the invention is not necessarily limited to the specific features or methods described. Rather, the specific features and methods are disclosed as exemplary embodiments for application performance monitoring.
Claims (12)
- A computer implemented method for monitoring a software application (127), the method comprising:obtaining monitoring data (126) pertaining to one or more target components of the software application (127), based on preferences of a user, wherein the monitoring data (126) comprises data pertaining to the software application (127) at least one of an application level and a database level;providing the monitoring data (126) to a monitoring buffer (130) after a first predetermined time interval; andtransferring the monitoring data (126) from the monitoring buffer (130) to a database (114) after a second predetermined time interval, wherein transfer of the monitoring data (126) from the monitoring buffer (130) to the database (114) is independent of execution of the software application (127).
- The computer implemented method as claimed in claim 1, wherein the monitoring data (126) includes at least one of a response time, a query, and an invocation count corresponding to each of the one or more target components.
- The computer implemented method as claimed in claim 1, wherein the method further comprises:ascertaining whether a data updation criteria is met; andflushing the monitoring data (126) from the monitoring buffer (130) when the data updation criteria is met.
- The computer implemented method as claimed in claim 3, wherein the method further comprises continuing transferring the monitoring data (126) from the monitoring buffer (130) to the database (114), when data updation criteria is not met.
- The computer implemented method as claimed in claim 3, wherein the data updation criteria includes at least one of:successful completion of a previous transfer cycle from the monitoring buffer (130) to the database (114); andexpiration of a third predetermined time interval.
- An application monitoring system (102) comprising:a processor(s) (108); anda memory (112) coupled to the processor (108), the memory (112) comprising:a monitoring module (120) configured to provide monitoring data (126) corresponding to one or more target components of a software application (127) to a monitoring buffer (130) after a first predetermined time interval; andan asynchronous data transfer module (122) configured to transfer the monitoring data (126) from the monitoring buffer (130) to a database (114) after a second predetermined time interval, wherein transfer of the monitoring data (126) from the monitoring buffer (130) to the database (114) is independent of execution of the software application (127).
- The application monitoring system (102) as claimed in claim 6, wherein the monitoring module (120) is further configured to identify the one or more target components based on preferences of a user.
- The application monitoring system (102) as claimed in claim 6, wherein the asynchronous data transfer module (122) is further configured to:ascertain whether a data updation criteria is met; andflush the monitoring data (126) from the monitoring buffer (130) when the data updation criteria is met, wherein the data updation criteria is at least one of successful completion of a previous transfer cycle from the monitoring buffer (130) to the database (114) and expiration of a third predetermined time interval.
- The application monitoring system (102) as claimed in claim 6, wherein the asynchronous data transfer module (122) is further configured to:periodically check a status of a property flag corresponding to the software application (127); andcontrol an initiation and a termination of a monitoring process for the software application (127) based on the status.
- The application monitoring system (102) as claimed in claim 6, wherein application monitoring system (102) is configured to analyze the monitoring data (126) based on predefined analysis rules and provide a response based on the analysis.
- The application monitoring system (102) as claimed in claim 6, wherein the monitoring buffer (130) is a temporary storage device.
- A computer-readable medium having embodied thereon a computer program for executing a method comprising:obtaining monitoring data (126) pertaining to one or more target components of the software application (127), based on preferences of a user, wherein the monitoring data (126) comprises data pertaining to the software application (127) at least one of an application level and a database level;providing the monitoring data (126) to a monitoring buffer (130) after a first predetermined time interval; and
transferring the monitoring data (126) from the monitoring buffer (130) to a database (114) after a second predetermined time interval, wherein transfer of the monitoring data (126) from the monitoring buffer (130) to the database (114) is independent of execution of the software application (127).
Applications Claiming Priority (1)
| Application Number | Priority Date | Filing Date | Title |
|---|---|---|---|
| IN537MU2012 | 2012-02-28 |
Publications (2)
| Publication Number | Publication Date |
|---|---|
| EP2634699A1 true EP2634699A1 (en) | 2013-09-04 |
| EP2634699B1 EP2634699B1 (en) | 2018-09-05 |
Family
ID=47877790
Family Applications (1)
| Application Number | Title | Priority Date | Filing Date |
|---|---|---|---|
| EP13156871.9A Active EP2634699B1 (en) | 2012-02-28 | 2013-02-27 | Application monitoring |
Country Status (5)
| Country | Link |
|---|---|
| US (1) | US9367418B2 (en) |
| EP (1) | EP2634699B1 (en) |
| CA (1) | CA2807759C (en) |
| ES (1) | ES2699997T3 (en) |
| MX (1) | MX341218B (en) |
Cited By (1)
| Publication number | Priority date | Publication date | Assignee | Title |
|---|---|---|---|---|
| CN104809060A (en) * | 2015-04-01 | 2015-07-29 | 百度在线网络技术(北京)有限公司 | Application online index detection method and device |
Families Citing this family (5)
| Publication number | Priority date | Publication date | Assignee | Title |
|---|---|---|---|---|
| US10311413B2 (en) | 2015-07-01 | 2019-06-04 | Mastercard International Incorporated | By-item bill payments |
| US10535067B2 (en) | 2015-07-01 | 2020-01-14 | Mastercard International Incorporated | Electronic incremental payments |
| US10621567B2 (en) | 2015-07-01 | 2020-04-14 | Mastercard International Incorporation | Electronic grace period billing |
| CN111444172A (en) * | 2019-01-17 | 2020-07-24 | 北京京东尚科信息技术有限公司 | Data monitoring method, device, medium and equipment |
| US11163633B2 (en) | 2019-04-24 | 2021-11-02 | Bank Of America Corporation | Application fault detection and forecasting |
Citations (8)
| Publication number | Priority date | Publication date | Assignee | Title |
|---|---|---|---|---|
| US6202199B1 (en) * | 1997-07-31 | 2001-03-13 | Mutek Solutions, Ltd. | System and method for remotely analyzing the execution of computer programs |
| US6658416B1 (en) * | 2000-07-10 | 2003-12-02 | International Business Machines Corporation | Apparatus and method for creating an indexed database of symbolic data for use with trace data of a computer program |
| US20040205723A1 (en) * | 2001-09-11 | 2004-10-14 | International Business Machines Corporation | Time interval based monitor function for dynamic insertion into and removal from a running application |
| US20040250164A1 (en) * | 2003-05-22 | 2004-12-09 | Infineon Technologies North America Corp. | Configurable real-time trace port for embedded processors |
| US20050144521A1 (en) * | 2003-12-10 | 2005-06-30 | International Business Machines Corporation | For PPRC backup systems |
| US20050149601A1 (en) * | 2003-12-17 | 2005-07-07 | International Business Machines Corporation | Method, system and computer program product for real-time data integrity verification |
| US20060230390A1 (en) * | 2005-04-12 | 2006-10-12 | International Business Machines Corporation | Instruction profiling using multiple metrics |
| US20070006154A1 (en) * | 2005-06-15 | 2007-01-04 | Research In Motion Limited | Controlling collection of debugging data |
Family Cites Families (25)
| Publication number | Priority date | Publication date | Assignee | Title |
|---|---|---|---|---|
| US5224212A (en) | 1989-05-01 | 1993-06-29 | Motorola, Inc. | Asynchronous operation in a database management system |
| US6970924B1 (en) * | 1999-02-23 | 2005-11-29 | Visual Networks, Inc. | Methods and apparatus for monitoring end-user experience in a distributed network |
| US6915466B2 (en) * | 1999-04-19 | 2005-07-05 | I-Tech Corp. | Method and system for multi-user channel allocation for a multi-channel analyzer |
| US6732307B1 (en) * | 1999-10-01 | 2004-05-04 | Hitachi, Ltd. | Apparatus and method for storing trace information |
| US7203732B2 (en) * | 1999-11-11 | 2007-04-10 | Miralink Corporation | Flexible remote data mirroring |
| JP2001325124A (en) * | 2000-05-17 | 2001-11-22 | Fujitsu Ltd | Computer, system management aiding device and management method |
| US7058927B2 (en) * | 2000-12-21 | 2006-06-06 | Veritas Operating Corporation | Computer software run-time analysis systems and methods |
| US6813731B2 (en) * | 2001-02-26 | 2004-11-02 | Emc Corporation | Methods and apparatus for accessing trace data |
| US7996517B2 (en) * | 2002-01-23 | 2011-08-09 | Novell, Inc. | Transparent network connection takeover |
| US7596373B2 (en) * | 2002-03-21 | 2009-09-29 | Mcgregor Christopher M | Method and system for quality of service (QoS) monitoring for wireless devices |
| CA2433750A1 (en) * | 2003-06-27 | 2004-12-27 | Ibm Canada Limited - Ibm Canada Limitee | Automatic collection of trace detail and history data |
| US7805629B2 (en) * | 2005-03-04 | 2010-09-28 | Netapp, Inc. | Protecting data transactions on an integrated circuit bus |
| US7346476B2 (en) * | 2005-03-17 | 2008-03-18 | International Business Machines Corporation | Event tracing with time stamp compression |
| US7934202B2 (en) * | 2005-04-28 | 2011-04-26 | Microsoft Corporation | Active execution tracing |
| US8001427B2 (en) * | 2005-05-16 | 2011-08-16 | Texas Instruments Incorporated | Method and system of indexing into trace data based on entries in a log buffer |
| US7593351B1 (en) * | 2005-06-30 | 2009-09-22 | Opnet Technologies, Inc. | Method and system for collecting and consolidating network traffic information |
| US7689558B2 (en) | 2005-09-09 | 2010-03-30 | Sap Ag | Application monitoring using profile points |
| US8005943B2 (en) | 2005-10-12 | 2011-08-23 | Computer Associates Think, Inc. | Performance monitoring of network applications |
| US8028200B2 (en) * | 2006-09-29 | 2011-09-27 | Sap Ag | Tracing operations in multiple computer systems |
| US8060076B2 (en) * | 2007-01-04 | 2011-11-15 | Harris Stratex Networks, Inc. | Real-time RSL monitoring in a web-based application |
| JP4717923B2 (en) * | 2008-12-17 | 2011-07-06 | 株式会社日立製作所 | Storage system, method for calculating estimated data recovery time, and management computer |
| JP5593792B2 (en) * | 2010-03-31 | 2014-09-24 | 富士通株式会社 | RAID device, storage control method, and storage control program |
| US9268664B2 (en) | 2010-04-06 | 2016-02-23 | Paypal, Inc. | Method and system for synchronous and asynchronous monitoring |
| US8464103B2 (en) * | 2010-10-24 | 2013-06-11 | International Business Machines Corporation | Generating a functional coverage model from a trace |
| US8918764B2 (en) * | 2011-09-21 | 2014-12-23 | International Business Machines Corporation | Selective trace facility |
-
2013
- 2013-02-27 US US13/779,639 patent/US9367418B2/en active Active
- 2013-02-27 MX MX2013002348A patent/MX341218B/en active IP Right Grant
- 2013-02-27 EP EP13156871.9A patent/EP2634699B1/en active Active
- 2013-02-27 CA CA2807759A patent/CA2807759C/en active Active
- 2013-02-27 ES ES13156871T patent/ES2699997T3/en active Active
Patent Citations (8)
| Publication number | Priority date | Publication date | Assignee | Title |
|---|---|---|---|---|
| US6202199B1 (en) * | 1997-07-31 | 2001-03-13 | Mutek Solutions, Ltd. | System and method for remotely analyzing the execution of computer programs |
| US6658416B1 (en) * | 2000-07-10 | 2003-12-02 | International Business Machines Corporation | Apparatus and method for creating an indexed database of symbolic data for use with trace data of a computer program |
| US20040205723A1 (en) * | 2001-09-11 | 2004-10-14 | International Business Machines Corporation | Time interval based monitor function for dynamic insertion into and removal from a running application |
| US20040250164A1 (en) * | 2003-05-22 | 2004-12-09 | Infineon Technologies North America Corp. | Configurable real-time trace port for embedded processors |
| US20050144521A1 (en) * | 2003-12-10 | 2005-06-30 | International Business Machines Corporation | For PPRC backup systems |
| US20050149601A1 (en) * | 2003-12-17 | 2005-07-07 | International Business Machines Corporation | Method, system and computer program product for real-time data integrity verification |
| US20060230390A1 (en) * | 2005-04-12 | 2006-10-12 | International Business Machines Corporation | Instruction profiling using multiple metrics |
| US20070006154A1 (en) * | 2005-06-15 | 2007-01-04 | Research In Motion Limited | Controlling collection of debugging data |
Cited By (2)
| Publication number | Priority date | Publication date | Assignee | Title |
|---|---|---|---|---|
| CN104809060A (en) * | 2015-04-01 | 2015-07-29 | 百度在线网络技术(北京)有限公司 | Application online index detection method and device |
| CN104809060B (en) * | 2015-04-01 | 2018-02-02 | 百度在线网络技术(北京)有限公司 | Using the detection method and device for index of reaching the standard grade |
Also Published As
| Publication number | Publication date |
|---|---|
| CA2807759C (en) | 2018-12-18 |
| MX341218B (en) | 2016-08-10 |
| EP2634699B1 (en) | 2018-09-05 |
| MX2013002348A (en) | 2013-08-27 |
| ES2699997T3 (en) | 2019-02-13 |
| CA2807759A1 (en) | 2013-08-28 |
| US20130227353A1 (en) | 2013-08-29 |
| US9367418B2 (en) | 2016-06-14 |
Similar Documents
| Publication | Publication Date | Title |
|---|---|---|
| US11392416B2 (en) | Automated reconfiguration of real time data stream processing | |
| Han et al. | Evaluating blockchains for IoT | |
| US10268755B2 (en) | Systems and methods for providing dynamic indexer discovery | |
| US10924398B2 (en) | Time-series data monitoring with sharded server | |
| CA2807759C (en) | Application monitoring | |
| US10904112B2 (en) | Automatic capture of detailed analysis information based on remote server analysis | |
| US9389936B2 (en) | Monitoring the responsiveness of a user interface | |
| US9811356B2 (en) | Automated software configuration management | |
| US10452463B2 (en) | Predictive analytics on database wait events | |
| Qian et al. | Benchmarking modern distributed streaming platforms | |
| US9515901B2 (en) | Automatic asynchronous handoff identification | |
| US8949290B2 (en) | Real time performance monitoring | |
| CN111124819A (en) | Method and device for monitoring full link | |
| US11030046B1 (en) | Cluster diagnostics data for distributed job execution | |
| US20170126580A1 (en) | Tracking Contention in a Distributed Business Transaction | |
| CN112130996A (en) | Data monitoring control system, method and device, electronic equipment and storage medium | |
| US9191285B1 (en) | Automatic web service monitoring | |
| US10223407B2 (en) | Asynchronous processing time metrics | |
| US10180914B2 (en) | Dynamic domain name service caching | |
| EP3010194B1 (en) | Method of tracing a transaction in a network | |
| US20220182290A1 (en) | Status sharing in a resilience framework | |
| US10949232B2 (en) | Managing virtualized computing resources in a cloud computing environment | |
| US20240007537A1 (en) | System and method for a web scraping tool | |
| WO2016175877A1 (en) | Failure of network devices in cloud managed networks |
Legal Events
| Date | Code | Title | Description |
|---|---|---|---|
| PUAI | Public reference made under article 153(3) epc to a published international application that has entered the european phase |
Free format text: ORIGINAL CODE: 0009012 |
|
| 17P | Request for examination filed |
Effective date: 20130227 |
|
| AK | Designated contracting states |
Kind code of ref document: A1 Designated state(s): AL AT BE BG CH CY CZ DE DK EE ES FI FR GB GR HR HU IE IS IT LI LT LU LV MC MK MT NL NO PL PT RO RS SE SI SK SM TR |
|
| AX | Request for extension of the european patent |
Extension state: BA ME |
|
| STAA | Information on the status of an ep patent application or granted ep patent |
Free format text: STATUS: EXAMINATION IS IN PROGRESS |
|
| 17Q | First examination report despatched |
Effective date: 20170306 |
|
| GRAP | Despatch of communication of intention to grant a patent |
Free format text: ORIGINAL CODE: EPIDOSNIGR1 |
|
| STAA | Information on the status of an ep patent application or granted ep patent |
Free format text: STATUS: GRANT OF PATENT IS INTENDED |
|
| INTG | Intention to grant announced |
Effective date: 20180329 |
|
| GRAS | Grant fee paid |
Free format text: ORIGINAL CODE: EPIDOSNIGR3 |
|
| GRAA | (expected) grant |
Free format text: ORIGINAL CODE: 0009210 |
|
| STAA | Information on the status of an ep patent application or granted ep patent |
Free format text: STATUS: THE PATENT HAS BEEN GRANTED |
|
| AK | Designated contracting states |
Kind code of ref document: B1 Designated state(s): AL AT BE BG CH CY CZ DE DK EE ES FI FR GB GR HR HU IE IS IT LI LT LU LV MC MK MT NL NO PL PT RO RS SE SI SK SM TR |
|
| REG | Reference to a national code |
Ref country code: GB Ref legal event code: FG4D |
|
| REG | Reference to a national code |
Ref country code: CH Ref legal event code: EP |
|
| REG | Reference to a national code |
Ref country code: AT Ref legal event code: REF Ref document number: 1038631 Country of ref document: AT Kind code of ref document: T Effective date: 20180915 |
|
| REG | Reference to a national code |
Ref country code: IE Ref legal event code: FG4D |
|
| REG | Reference to a national code |
Ref country code: DE Ref legal event code: R096 Ref document number: 602013042981 Country of ref document: DE |
|
| REG | Reference to a national code |
Ref country code: NL Ref legal event code: MP Effective date: 20180905 |
|
| REG | Reference to a national code |
Ref country code: LT Ref legal event code: MG4D |
|
| PG25 | Lapsed in a contracting state [announced via postgrant information from national office to epo] |
Ref country code: FI Free format text: LAPSE BECAUSE OF FAILURE TO SUBMIT A TRANSLATION OF THE DESCRIPTION OR TO PAY THE FEE WITHIN THE PRESCRIBED TIME-LIMIT Effective date: 20180905 Ref country code: RS Free format text: LAPSE BECAUSE OF FAILURE TO SUBMIT A TRANSLATION OF THE DESCRIPTION OR TO PAY THE FEE WITHIN THE PRESCRIBED TIME-LIMIT Effective date: 20180905 Ref country code: NO Free format text: LAPSE BECAUSE OF FAILURE TO SUBMIT A TRANSLATION OF THE DESCRIPTION OR TO PAY THE FEE WITHIN THE PRESCRIBED TIME-LIMIT Effective date: 20181205 Ref country code: GR Free format text: LAPSE BECAUSE OF FAILURE TO SUBMIT A TRANSLATION OF THE DESCRIPTION OR TO PAY THE FEE WITHIN THE PRESCRIBED TIME-LIMIT Effective date: 20181206 Ref country code: BG Free format text: LAPSE BECAUSE OF FAILURE TO SUBMIT A TRANSLATION OF THE DESCRIPTION OR TO PAY THE FEE WITHIN THE PRESCRIBED TIME-LIMIT Effective date: 20181205 Ref country code: SE Free format text: LAPSE BECAUSE OF FAILURE TO SUBMIT A TRANSLATION OF THE DESCRIPTION OR TO PAY THE FEE WITHIN THE PRESCRIBED TIME-LIMIT Effective date: 20180905 Ref country code: LT Free format text: LAPSE BECAUSE OF FAILURE TO SUBMIT A TRANSLATION OF THE DESCRIPTION OR TO PAY THE FEE WITHIN THE PRESCRIBED TIME-LIMIT Effective date: 20180905 |
|
| REG | Reference to a national code |
Ref country code: CH Ref legal event code: NV Representative=s name: REUTELER AND CIE S.A., CH |
|
| REG | Reference to a national code |
Ref country code: ES Ref legal event code: FG2A Ref document number: 2699997 Country of ref document: ES Kind code of ref document: T3 Effective date: 20190213 |
|
| REG | Reference to a national code |
Ref country code: AT Ref legal event code: MK05 Ref document number: 1038631 Country of ref document: AT Kind code of ref document: T Effective date: 20180905 |
|
| PG25 | Lapsed in a contracting state [announced via postgrant information from national office to epo] |
Ref country code: HR Free format text: LAPSE BECAUSE OF FAILURE TO SUBMIT A TRANSLATION OF THE DESCRIPTION OR TO PAY THE FEE WITHIN THE PRESCRIBED TIME-LIMIT Effective date: 20180905 Ref country code: AL Free format text: LAPSE BECAUSE OF FAILURE TO SUBMIT A TRANSLATION OF THE DESCRIPTION OR TO PAY THE FEE WITHIN THE PRESCRIBED TIME-LIMIT Effective date: 20180905 Ref country code: LV Free format text: LAPSE BECAUSE OF FAILURE TO SUBMIT A TRANSLATION OF THE DESCRIPTION OR TO PAY THE FEE WITHIN THE PRESCRIBED TIME-LIMIT Effective date: 20180905 |
|
| PG25 | Lapsed in a contracting state [announced via postgrant information from national office to epo] |
Ref country code: NL Free format text: LAPSE BECAUSE OF FAILURE TO SUBMIT A TRANSLATION OF THE DESCRIPTION OR TO PAY THE FEE WITHIN THE PRESCRIBED TIME-LIMIT Effective date: 20180905 Ref country code: CZ Free format text: LAPSE BECAUSE OF FAILURE TO SUBMIT A TRANSLATION OF THE DESCRIPTION OR TO PAY THE FEE WITHIN THE PRESCRIBED TIME-LIMIT Effective date: 20180905 Ref country code: IS Free format text: LAPSE BECAUSE OF FAILURE TO SUBMIT A TRANSLATION OF THE DESCRIPTION OR TO PAY THE FEE WITHIN THE PRESCRIBED TIME-LIMIT Effective date: 20190105 Ref country code: PL Free format text: LAPSE BECAUSE OF FAILURE TO SUBMIT A TRANSLATION OF THE DESCRIPTION OR TO PAY THE FEE WITHIN THE PRESCRIBED TIME-LIMIT Effective date: 20180905 Ref country code: RO Free format text: LAPSE BECAUSE OF FAILURE TO SUBMIT A TRANSLATION OF THE DESCRIPTION OR TO PAY THE FEE WITHIN THE PRESCRIBED TIME-LIMIT Effective date: 20180905 Ref country code: AT Free format text: LAPSE BECAUSE OF FAILURE TO SUBMIT A TRANSLATION OF THE DESCRIPTION OR TO PAY THE FEE WITHIN THE PRESCRIBED TIME-LIMIT Effective date: 20180905 Ref country code: EE Free format text: LAPSE BECAUSE OF FAILURE TO SUBMIT A TRANSLATION OF THE DESCRIPTION OR TO PAY THE FEE WITHIN THE PRESCRIBED TIME-LIMIT Effective date: 20180905 Ref country code: IT Free format text: LAPSE BECAUSE OF FAILURE TO SUBMIT A TRANSLATION OF THE DESCRIPTION OR TO PAY THE FEE WITHIN THE PRESCRIBED TIME-LIMIT Effective date: 20180905 |
|
| PG25 | Lapsed in a contracting state [announced via postgrant information from national office to epo] |
Ref country code: SM Free format text: LAPSE BECAUSE OF FAILURE TO SUBMIT A TRANSLATION OF THE DESCRIPTION OR TO PAY THE FEE WITHIN THE PRESCRIBED TIME-LIMIT Effective date: 20180905 Ref country code: SK Free format text: LAPSE BECAUSE OF FAILURE TO SUBMIT A TRANSLATION OF THE DESCRIPTION OR TO PAY THE FEE WITHIN THE PRESCRIBED TIME-LIMIT Effective date: 20180905 Ref country code: PT Free format text: LAPSE BECAUSE OF FAILURE TO SUBMIT A TRANSLATION OF THE DESCRIPTION OR TO PAY THE FEE WITHIN THE PRESCRIBED TIME-LIMIT Effective date: 20190105 |
|
| REG | Reference to a national code |
Ref country code: DE Ref legal event code: R097 Ref document number: 602013042981 Country of ref document: DE |
|
| PLBE | No opposition filed within time limit |
Free format text: ORIGINAL CODE: 0009261 |
|
| STAA | Information on the status of an ep patent application or granted ep patent |
Free format text: STATUS: NO OPPOSITION FILED WITHIN TIME LIMIT |
|
| PG25 | Lapsed in a contracting state [announced via postgrant information from national office to epo] |
Ref country code: DK Free format text: LAPSE BECAUSE OF FAILURE TO SUBMIT A TRANSLATION OF THE DESCRIPTION OR TO PAY THE FEE WITHIN THE PRESCRIBED TIME-LIMIT Effective date: 20180905 |
|
| 26N | No opposition filed |
Effective date: 20190606 |
|
| PG25 | Lapsed in a contracting state [announced via postgrant information from national office to epo] |
Ref country code: SI Free format text: LAPSE BECAUSE OF FAILURE TO SUBMIT A TRANSLATION OF THE DESCRIPTION OR TO PAY THE FEE WITHIN THE PRESCRIBED TIME-LIMIT Effective date: 20180905 |
|
| PG25 | Lapsed in a contracting state [announced via postgrant information from national office to epo] |
Ref country code: LU Free format text: LAPSE BECAUSE OF NON-PAYMENT OF DUE FEES Effective date: 20190227 Ref country code: MC Free format text: LAPSE BECAUSE OF FAILURE TO SUBMIT A TRANSLATION OF THE DESCRIPTION OR TO PAY THE FEE WITHIN THE PRESCRIBED TIME-LIMIT Effective date: 20180905 |
|
| REG | Reference to a national code |
Ref country code: BE Ref legal event code: MM Effective date: 20190228 |
|
| REG | Reference to a national code |
Ref country code: IE Ref legal event code: MM4A |
|
| PG25 | Lapsed in a contracting state [announced via postgrant information from national office to epo] |
Ref country code: IE Free format text: LAPSE BECAUSE OF NON-PAYMENT OF DUE FEES Effective date: 20190227 |
|
| PG25 | Lapsed in a contracting state [announced via postgrant information from national office to epo] |
Ref country code: BE Free format text: LAPSE BECAUSE OF NON-PAYMENT OF DUE FEES Effective date: 20190228 |
|
| PG25 | Lapsed in a contracting state [announced via postgrant information from national office to epo] |
Ref country code: TR Free format text: LAPSE BECAUSE OF FAILURE TO SUBMIT A TRANSLATION OF THE DESCRIPTION OR TO PAY THE FEE WITHIN THE PRESCRIBED TIME-LIMIT Effective date: 20180905 |
|
| PG25 | Lapsed in a contracting state [announced via postgrant information from national office to epo] |
Ref country code: MT Free format text: LAPSE BECAUSE OF NON-PAYMENT OF DUE FEES Effective date: 20190227 |
|
| PG25 | Lapsed in a contracting state [announced via postgrant information from national office to epo] |
Ref country code: CY Free format text: LAPSE BECAUSE OF FAILURE TO SUBMIT A TRANSLATION OF THE DESCRIPTION OR TO PAY THE FEE WITHIN THE PRESCRIBED TIME-LIMIT Effective date: 20180905 |
|
| PG25 | Lapsed in a contracting state [announced via postgrant information from national office to epo] |
Ref country code: HU Free format text: LAPSE BECAUSE OF FAILURE TO SUBMIT A TRANSLATION OF THE DESCRIPTION OR TO PAY THE FEE WITHIN THE PRESCRIBED TIME-LIMIT; INVALID AB INITIO Effective date: 20130227 |
|
| PG25 | Lapsed in a contracting state [announced via postgrant information from national office to epo] |
Ref country code: MK Free format text: LAPSE BECAUSE OF FAILURE TO SUBMIT A TRANSLATION OF THE DESCRIPTION OR TO PAY THE FEE WITHIN THE PRESCRIBED TIME-LIMIT Effective date: 20180905 |
|
| PGFP | Annual fee paid to national office [announced via postgrant information from national office to epo] |
Ref country code: FR Payment date: 20230123 Year of fee payment: 11 Ref country code: ES Payment date: 20230314 Year of fee payment: 11 Ref country code: CH Payment date: 20230307 Year of fee payment: 11 |
|
| PGFP | Annual fee paid to national office [announced via postgrant information from national office to epo] |
Ref country code: GB Payment date: 20230119 Year of fee payment: 11 Ref country code: DE Payment date: 20230125 Year of fee payment: 11 |
|
| P01 | Opt-out of the competence of the unified patent court (upc) registered |
Effective date: 20230526 |