EP2803987A1 - Accurate analyte measurements for electrochemical test strip based on multiple calibration parameters - Google Patents
Accurate analyte measurements for electrochemical test strip based on multiple calibration parameters Download PDFInfo
- Publication number
- EP2803987A1 EP2803987A1 EP14168696.4A EP14168696A EP2803987A1 EP 2803987 A1 EP2803987 A1 EP 2803987A1 EP 14168696 A EP14168696 A EP 14168696A EP 2803987 A1 EP2803987 A1 EP 2803987A1
- Authority
- EP
- European Patent Office
- Prior art keywords
- biosensor
- calibration
- calibration code
- glucose
- test
- Prior art date
- Legal status (The legal status is an assumption and is not a legal conclusion. Google has not performed a legal analysis and makes no representation as to the accuracy of the status listed.)
- Withdrawn
Links
Images


Classifications
-
- G—PHYSICS
- G01—MEASURING; TESTING
- G01N—INVESTIGATING OR ANALYSING MATERIALS BY DETERMINING THEIR CHEMICAL OR PHYSICAL PROPERTIES
- G01N27/00—Investigating or analysing materials by the use of electric, electrochemical, or magnetic means
- G01N27/26—Investigating or analysing materials by the use of electric, electrochemical, or magnetic means by investigating electrochemical variables; by using electrolysis or electrophoresis
- G01N27/28—Electrolytic cell components
- G01N27/30—Electrodes, e.g. test electrodes; Half-cells
- G01N27/327—Biochemical electrodes, e.g. electrical or mechanical details for in vitro measurements
- G01N27/3275—Sensing specific biomolecules, e.g. nucleic acid strands, based on an electrode surface reaction
-
- G—PHYSICS
- G01—MEASURING; TESTING
- G01N—INVESTIGATING OR ANALYSING MATERIALS BY DETERMINING THEIR CHEMICAL OR PHYSICAL PROPERTIES
- G01N27/00—Investigating or analysing materials by the use of electric, electrochemical, or magnetic means
- G01N27/26—Investigating or analysing materials by the use of electric, electrochemical, or magnetic means by investigating electrochemical variables; by using electrolysis or electrophoresis
- G01N27/28—Electrolytic cell components
- G01N27/30—Electrodes, e.g. test electrodes; Half-cells
- G01N27/327—Biochemical electrodes, e.g. electrical or mechanical details for in vitro measurements
- G01N27/3271—Amperometric enzyme electrodes for analytes in body fluids, e.g. glucose in blood
- G01N27/3274—Corrective measures, e.g. error detection, compensation for temperature or hematocrit, calibration
-
- G—PHYSICS
- G01—MEASURING; TESTING
- G01N—INVESTIGATING OR ANALYSING MATERIALS BY DETERMINING THEIR CHEMICAL OR PHYSICAL PROPERTIES
- G01N33/00—Investigating or analysing materials by specific methods not covered by groups G01N1/00 - G01N31/00
- G01N33/48—Biological material, e.g. blood, urine; Haemocytometers
- G01N33/483—Physical analysis of biological material
- G01N33/487—Physical analysis of biological material of liquid biological material
- G01N33/4875—Details of handling test elements, e.g. dispensing or storage, not specific to a particular test method
- G01N33/48771—Coding of information, e.g. calibration data, lot number
Abstract
Description
- This application claims the benefits of priority to prior filed United States patent applications
S.N. 13/896,986 filed on May 17, 2013 S.N. 61/824549 filed on May 17, 2013 - Electrochemical glucose test strips, such as those used in the OneTouch® Ultra® whole blood testing kit, which is available from LifeScan, Inc., are designed to measure the concentration of glucose in a physiological fluid sample from patients with diabetes. The measurement of glucose can be based on the selective oxidation of glucose by the enzyme glucose oxidase (GO). The reactions that can occur in a glucose test strip are summarized below in
Equations 1 and 2.
Eq. 1 Glucose + GO(ox) → Gluconic Acid + GO(red)
Eq. 2 GO(red) + 2 Fe(CN)6 3- → GO(ox) + 2 Fe(CN)64-
- As illustrated in
Equation 1, glucose is oxidized to gluconic acid by the oxidized form of glucose oxidase (GO(ox)). It should be noted that GO(ox) may also be referred to as an "oxidized enzyme." During the reaction inEquation 1, the oxidized enzyme GO(ox) is converted to its reduced state, which is denoted as GO(red) (i.e., "reduced enzyme"). Next, the reduced enzyme GO(red) is re-oxidized back to GO(ox) by reaction with Fe(CN)6 3- (referred to as either the oxidized mediator or ferricyanide) as illustrated in Equation 2. During the re-generation of GO(red) back to its oxidized state GO(ox), Fe(CN)6 3- is reduced to Fe(CN)6 4- (referred to as either reduced mediator or ferrocyanide). - When the reactions set forth above are conducted with a test signal in the form of potential applied between two electrodes, a test signal in the form of a current can be created by the electrochemical re-oxidation of the reduced mediator at the electrode surface. Thus, since, in an ideal environment, the amount of ferrocyanide created during the chemical reaction described above is directly proportional to the amount of glucose in the sample positioned between the electrodes, the test output signal generated would be proportional to the glucose content of the sample. A mediator, such as ferricyanide, is a compound that accepts electrons from an enzyme such as glucose oxidase and then donates the electrons to an electrode. As the concentration of glucose in the sample increases, the amount of reduced mediator formed also increases; hence, there is a direct relationship between the test output signal, resulting from the re-oxidation of reduced mediator, and glucose concentration. In particular, the transfer of electrons across the electrical interface results in the flow of a test output signal (2 moles of electrons for every mole of glucose that is oxidized). The test output signal resulting from the introduction of glucose can, therefore, be referred to as a glucose output signal.
- The electrochemical biosensor noted above can be produced in enormous quantities, on the order of hundreds of millions and even billions of such biosensor per year. Production of a great number of batches of the same product lead inevitably to increased variation in the resulting product. This is driven by variation, among other factors of: manufacturing setting (production line); materials used; and volume throughput (stressing manufacturing ability). Generally, the task of good manufacturing practice is to limit the encountered variability by controlling all process and material parameters (settings, critical-to-quality, etc.) in line with the knowledge gained through a thorough characterization of the product and its manufacturability. However, no matter how good the operation side of the manufacture process is, a perfectly reproducible production line is never achievable. A balance is usually struck between the effort it takes to manufacture the product, yield achieved, the volume of product produced and the regulatory performance targets the product needs to satisfy. The finer the amount of control is exercised during manufacturing, the more expensive the overall product usually is.
- One technique that others have used to deal with the variations in manufacturing is to accept a lower yield. For example, if there are wide variations on a yield of 90% of manufactured biosensors, the manufacturer could simply discard a large percentage (50% or more) of the biosensors that are outside acceptable manufacturing variations. This, however, results in waste and added cost due to the large number of discard biosensors.
- Another technique is to use calibration parameters, known as calibration slope and calibration intercept to those skilled in this field. Briefly, calibration curves can be generated by plotting measured glucose concentration against actual glucose concentration (or measured current versus YSI current), and a formula y=m*mx+c least squares fitted to the graph to give a value for batch slope m and batch intercept c for the remaining strips from the lot or batch. The graph can be divided into discrete areas and a code assigned to each area within the graph. The code itself is indexed to both the intercept and slope for a particular batch on which the calibration was performed thereon.
- With the recent invention of more accurate test measurement systems and methods described, shown and claimed in
PCT/GB2012/053279 PCT/GB2012/053277 PCT/GB2012/053276 US Provisional Patent Application Serial Nos. 61/581,087 61/581,089 61/581,099 61/581,100 61/654,013 - In a first aspect, applicant has devised a system for determining analyte concentration in a fluid. The system includes a biosensor and a processor. The biosensor has at least one electrode configured to receive an input signal that initiates an electrochemical reaction between a fluid sample and enzyme disposed on the at least one electrode. The processor is connected to a memory and a power supply to drive at least one input signal to the at least one electrode of the biosensor. In this system, the processor is configured to obtain a batch calibration code and a timing calibration code so that the processor determines, based on the timing calibration code, a particular time from a start of test measurement sequence at which to measure output signals from the sample and ascertains an analyte amount in the fluid sample from the output signals measured at the particular time and the batch calibration code.
- In a second aspect, applicant has devised a system for determining analyte concentration in a fluid. The system includes a biosensor and a processor. The biosensor has at least one electrode configured to receive an input signal that initiates an electrochemical reaction between a fluid sample and enzyme disposed on the at least one electrode; the processor is connected to a memory and a power supply to drive at least one input signal to the at least one electrode of the biosensor, the processor configured to measure output signals proximate a particular time dictated by the timing calibration code and a nominal time from a start of the test measurement so that a glucose concentration in the fluid is calculated with the measured signal output proximate the particular time and the calibration code and the glucose concentration annunciated.
- Further, applicants have devised a third aspect in analyte measurement technology to obtain glucose concentration from a biosensor having at least one electrode configured for connection with a glucose meter, the method can be achieved by: contacting a fluid sample with the at least one electrode to start a test measurement; obtaining a timing calibration code; calculating a particular time point (tc) from the start of the test measurement for sampling a signal output of the sample based on the timing calibration code; applying a signal input to the sample; measuring a signal output from the sample from the start of a test measurement; determining at least one particular signal output proximate at least the particular time point after the start of the test measurement; obtaining a calibration code; calculating a glucose concentration from the at least one particular signal output and the calibration code.
- In yet a fourth aspect, applicant has devised a method to determine a glucose concentration from a biosensor. The biosensor has at least one electrode configured to be connected to a signal source of a glucose meter. The method can be achieved by:
- obtaining a calibration code and a timing calibration code; applying an input signal to the sample to cause a physical transformation of the glucose in the sample and start a test measurement; measuring a signal output from the sample proximate a particular time dictated by the timing calibration code and a nominal time from a start of the test measurement; calculating a glucose concentration in the fluid with the signal output from the measuring step and the calibration code from the obtaining step; and annunciating the glucose concentration from the calculating step.
- In a fifth aspect, applicant has devised a method to determine a glucose concentration from a biosensor. The biosensor has at least one electrode configured to be connected to a signal source of a glucose meter. The method can be achieved by:
- initiating a start of a test measurement sequence upon contact of a fluid sample to the at least one electrode; obtaining a timing multiplier coefficient (y1) and a timing additive coefficient (y2) for the biosensor; deriving a particular time point for measurement of signal output from the sample with the calibration multiplier coefficient and the calibration additive coefficient; obtaining a slope calibration (x1) and an intercept calibration (x2) for the biosensor; measuring a signal output from the sample from the start of the test measurement; determining at least one particular signal output proximate at least the particular time point after the start of the test measurement; calculating a glucose concentration from the at least one particular signal output, the slope calibration and the intercept calibration; and annunciating the glucose concentration from the calculating step.
- In a sixth aspect, applicant has invented a method of determining an analyte concentration in a fluid with a biosensor. The biosensor is configured for measurement with an analyte meter. The method can be achieved by: driving a signal into the biosensor; starting a test sequence when an output signal is above a predetermined threshold; obtaining a batch calibration code specific to the biosensor and a timing calibration code specific to the biosensor; determining a particular time from the start of the test sequence to measure output signals from the biosensor based on information from the timing calibration code; measuring the output signals at the particular time; ascertaining the analyte amount in the fluid from the output signals measured at the particular time and the batch calibration code.
- In a seventh aspect, applicant has provided for a system to determine analyte concentration in a fluid sample having an analyte to be determined. The system includes a biosensor and a meter. The biosensor has a batch calibration code and a timing calibration code stored in the biosensor. The meter is configured to obtain the calibration code and timing calibration code so that a measurement time for measuring output signals from the biosensor is obtained from the timing calibration code and a representation of the analyte in the sample is obtained from the batch calibration code and the output signals at the measurement.
- And for these various aspects, the following features may also be utilized in various combinations with these previously disclosed aspects: the timing calibration code is correlated to a time multiplier value and an additive value; the calibration code is correlated to a slope of a particular batch of the biosensor and an intercept of a particular batch of the biosensor; the obtaining of the batch calibration code may include transmitting the batch calibration code from one of a storage container for the biosensor or the biosensor itself to a receiver of the glucose meter; the transmitting may include powering a RFID tag disposed in the biosensor for transmission of the batch calibration code to an RFID reader disposed in the glucose meter; the obtaining of the timing calibration code may include transmitting the timing calibration code from one of a storage container for the biosensor or the biosensor itself to the glucose meter; the transmitting may include powering an RFID tag disposed in the biosensor for transmission of the timing calibration code to an RFID reader disposed in the glucose meter; the obtaining may include transmitting the calibration multiplier coefficient and the calibration additive coefficient from one of a storage container for the biosensor or the biosensor itself to the glucose meter; the obtaining may include transmitting the slope calibration and intercept calibration from one of a storage container for the biosensor or the biosensor itself to the glucose meter.
- In the aforementioned aspects of the disclosure, the steps of determining, estimating, calculating, computing, deriving and/or utilizing (possibly in conjunction with an equation) may be performed be an electronic circuit or a processor. These steps may also be implemented as executable instructions stored on a computer readable medium; the instructions, when executed by a computer may perform the steps of any one of the aforementioned methods.
- In additional aspects of the disclosure, there are computer readable media, each medium comprising executable instructions, which, when executed by a computer, perform the steps of any one of the aforementioned methods.
- In additional aspects of the disclosure, there are devices, such as test meters or analyte testing devices, each device or meter comprising an electronic circuit or processor configured to perform the steps of any one of the aforementioned methods.
- These and other embodiments, features and advantages will become apparent to those skilled in the art when taken with reference to the following more detailed description of the exemplary embodiments of the invention in conjunction with the accompanying drawings that are first briefly described.
- The accompanying drawings, which are incorporated herein and constitute part of this specification, illustrate presently preferred embodiments of the invention, and, together with the general description given above and the detailed description given below, serve to explain features of the invention (wherein like numerals represent like elements), in which:
-
Figure 1 illustrates an analyte measurement system withstrip 100 andmeter 200. -
Figure 2A illustrates in simplified schematic form the components of themeter 200. -
Figure 2B illustrates in simplified schematic a preferred implementation of a variation ofmeter 200. -
Figure 3A illustrates thetest strip 100 of the system ofFigure 1 in which there are two physical characteristic sensing electrodes upstream of the measurement electrodes. -
Figure 3B illustrates a variation of the test strip ofFigure 3A in which a shielding or grounding electrode is provided for proximate the entrance of the test chamber; -
Figure 3C illustrates a variation of the test strip ofFigure 3B in which a reagent area has been extended upstream to cover at least one of the physical characteristic sensing electrodes; -
Figure 3D illustrates a variation oftest strip 100 ofFigures 3A ,3B and3C in which certain components of the test strip have been integrated together into a single unit; -
Figure 3B illustrates a variation of the test strip ofFigure 3A in which one physical characteristic sensing electrode is disposed proximate the entrance and the other physical characteristic sensing electrode is at the terminal end of the test cell with the measurement electrodes disposed between the pair of physical characteristic sensing electrodes. -
Figures 3C and3D illustrate variations ofFigure 3A or3B in which the physical characteristic sensing electrodes are disposed next to each other at the terminal end of the test chamber with the measurement electrodes upstream of the physical characteristic sensing electrodes. -
Figure 4A illustrates a graph of time over applied potential to the test strip ofFigure 1 . -
Figure 4B illustrates a graph of time over output signal from the test strip ofFigure 1 . -
Figure 5 illustrates a logic diagram representative of one of many techniques that can be gleaned from this disclosure. -
Figure 6 demonstrates the variation of ideal calibration settings (slope & intercept) with produced lots (i.e., global slope & intercept position is marked as "all"). -
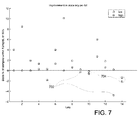
Figure 7 demonstrates the difference in achieved accuracy per lot (i.e., positive shift equates to improvement and negative shift indicates detrimental effect). - The following detailed description should be read with reference to the drawings, in which like elements in different drawings are identically numbered. The drawings, which are not necessarily to scale, depict selected embodiments and are not intended to limit the scope of the invention. The detailed description illustrates by way of example, not by way of limitation, the principles of the invention. This description will clearly enable one skilled in the art to make and use the invention, and describes several embodiments, adaptations, variations, alternatives and uses of the invention, including what is presently believed to be the best mode of carrying out the invention.
- As used herein, the terms "about" or "approximately" for any numerical values or ranges indicate a suitable dimensional tolerance that allows the part or collection of components to function for its intended purpose as described herein. More specifically, "about" or "approximately" may refer to the range of values ±10% of the recited value, e.g., "about 90%" may refer to the range of values from 81% to 99%. In addition, as used herein, the terms "patient," "host," "user," and "subject" refer to any human or animal subject and are not intended to limit the systems or methods to human use, although use of the subject invention in a human patient represents a preferred embodiment. As used herein, "oscillating signal" includes voltage signal(s) or current signal(s) that, respectively, change polarity or alternate direction of the current or are multi-directional. Also used herein, the phrase "electrical signal" or "signal" is intended to include direct current signal, alternating signal or any signal within the electromagnetic spectrum. The terms "processor"; "microprocessor"; or "microcontroller" are intended to have the same meaning and are intended to be used interchangeably. As used herein, the term "annunciated" and variations on its root term indicate that an announcement may be provided via text, audio, visual or a combination of all modes or mediums of communication to a user. To inform the user of the qualitative aspect of the result, an indicia can be provided to indicate whether the result is outside of the desired range via a red indicia (or flashing message) or in-range by way of a green indicia or the like.
-
Figure 1 illustrates atest meter 200, for testing analyte (e.g., glucose) levels in the blood of an individual with a test strip produced by the methods and techniques illustrated and described herein.Test meter 200 may include user interface inputs (206, 210, 214), which can be in the form of buttons, for entry of data, navigation of menus, and execution of commands. Data can include values representative of analyte concentration, and/or information that are related to the everyday lifestyle of an individual. Information, which is related to the everyday lifestyle, can include food intake, medication use, the occurrence of health check-ups, general health condition and exercise levels of an individual.Test meter 200 can also include adisplay 204 that can be used to report measured glucose levels, and to facilitate entry of lifestyle related information. -
Test meter 200 may include a firstuser interface input 206, a seconduser interface input 210, and a third user interface input 214.User interface inputs display 204.User interface inputs first marking 208, asecond marking 212, and athird marking 216, which help in correlating user interface inputs to characters ondisplay 204. -
Test meter 200 can be turned on by inserting a test strip 100 (or its variants in the Related Applications) into astrip port connector 220, by pressing and briefly holding firstuser interface input 206, or by the detection of data traffic across adata port 218.Test meter 200 can be switched off by removing test strip 100 (or its variants in the Related Applications), pressing and briefly holding firstuser interface input 206, navigating to and selecting a meter off option from a main menu screen, or by not pressing any buttons for a predetermined time.Display 204 can optionally include a backlight. - In one embodiment,
test meter 200 can be configured to receive a calibration input for example, from any external source, when switching from a first test strip batch to a second test strip batch. Thus, in one exemplary embodiment, the meter is configured to receive a calibration input from external sources, such as a user interface (such asinputs data port 218. The calibration input can be a set of values ascribed to a particular test strip batch. For example, the calibration input can include a batch slope and a batch intercept value for a particular test strip batch. The calibrations input, such as batch slope and batch intercept values, may be preset within the meter as will be described below. - Referring to
Figure 2A , an exemplary internal layout oftest meter 200 is shown.Test meter 200 may include aprocessor 300, which in some embodiments described and illustrated herein is a 32-bit RISC microcontroller. In the preferred embodiments described and illustrated herein,processor 300 is preferably selected from the MSP 430 family of ultra-low power microcontrollers manufactured by Texas Instruments of Dallas, Texas. The processor can be bi-directionally connected via I/O ports 314 to amemory 302, which in some embodiments described and illustrated herein is an EEPROM. Also connected toprocessor 300 via I/O ports 314 are thedata port 218, theuser interface inputs display driver 320.Data port 218 can be connected toprocessor 300, thereby enabling transfer of data betweenmemory 302 and an external device, such as a personal computer. Asuitable wireless transceiver 322 is provided in the meter to enable the meter to read calibration code and timing code stored in readable memory tag affixed to the biosensor or vial such as, for example, a radio-frequency-identification tag or RFID tag 101 (Fig. 1 ). Examples of RFID are known in the field such as, for example,EP1825806 ;US8390455 ;US8358210 ; orUS8410939 , all of which are incorporated by reference in their entireties herein this application. - In one embodiment, the
user interface inputs processor 300.Processor 300 controls display 204 viadisplay driver 320.Memory 302 may be pre-loaded with calibration information, such as batch slope and batch intercept values correlated to calibration code, during production oftest meter 200. This pre-loaded calibration information can be accessed and used byprocessor 300 upon receiving a suitable signal (such as current) from the strip viastrip port connector 220 so as to calculate a corresponding analyte level (such as blood glucose concentration) using the signal and the calibration information without receiving calibration input from any external source. - In embodiments described and illustrated herein,
test meter 200 may include an Application Specific Integrated Circuit (ASIC) 304, so as to provide electronic circuitry used in measurements of glucose level in blood that has been applied to a test strip 100 (or its variants in the Related Applications) inserted intostrip port connector 220. Analog voltages can pass to and fromASIC 304 by way of ananalog interface 306. Analog signals fromanalog interface 306 can be converted to digital signals by an A/D converter 316.Processor 300 further includes acore 308, a ROM 310 (containing computer code), aRAM 312, and aclock 318. In one embodiment, theprocessor 300 is configured (or programmed) to disable all of the user interface inputs except for a single input upon a display of an analyte value by the display unit such as, for example, during a time period after an analyte measurement. In an alternative embodiment, theprocessor 300 is configured (or programmed) to ignore any input from all of the user interface inputs except for a single input upon a display of an analyte value by the display unit. Detailed descriptions and illustrations of themeter 200 are shown and described in International Patent Application Publication No.WO2006040200 , which is hereby incorporated by reference into this application as if fully set forth herein. -
Figure 3A is an exemplary exploded perspective view of atest strip 100, which may include seven layers disposed on asubstrate 5. The seven layers disposed onsubstrate 5 can be a first conductive layer 50 (which can also be referred to as electrode layer 50), aninsulation layer 16, two overlappingreagent layers adhesive layer 60 which includesadhesive portions hydrophilic layer 70, and atop layer 80 which forms acover 94 for thetest strip 100.Test strip 100 may be manufactured in a series of steps where theconductive layer 50,insulation layer 16, reagent layers 22, andadhesive layer 60 are sequentially deposited onsubstrate 5 using, for example, a screen-printing process. Note that theelectrodes reagent layer characteristic sensing electrodes reagent layer 22.Hydrophilic layer 70 andtop layer 80 can be disposed from a roll stock and laminated ontosubstrate 5 as either an integrated laminate or as separate layers.Test strip 100 has a distal portion 3 and aproximal portion 4 as shown inFigure 3A . -
Test strip 100 may include a sample-receivingchamber 92 through which aphysiological fluid sample 95 may be drawn through or deposited (Fig. 3B ). The physiological fluid sample discussed herein may be blood. Sample-receivingchamber 92 can include an inlet at a proximal end and an outlet at the side edges oftest strip 100, as illustrated inFigure 3A . Afluid sample 95 can be applied to the inlet along axis L-L (Fig. 3B ) to fill a sample-receivingchamber 92 so that glucose can be measured. The side edges of a firstadhesive pad 24 and a secondadhesive pad 26 located adjacent toreagent layer 22 each define a wall of sample-receivingchamber 92, as illustrated inFigure 3A . A bottom portion or "floor" of sample-receivingchamber 92 may include a portion ofsubstrate 5,conductive layer 50, andinsulation layer 16, as illustrated inFigure 3A . A top portion or "roof" of sample-receivingchamber 92 may include distalhydrophilic portion 32, as illustrated inFigure 3A . Fortest strip 100, as illustrated inFigure 3A ,substrate 5 can be used as a foundation for helping support subsequently applied layers.Substrate 5 can be in the form of a polyester sheet such as a polyethylene tetraphthalate (PET) material (Hostaphan PET supplied by Mitsubishi).Substrate 5 can be in a roll format, nominally 350 microns thick by 370 millimeters wide and approximately 60 meters in length. - A conductive layer is required for forming electrodes that can be used for the electrochemical measurement of glucose. First
conductive layer 50 can be made from a carbon ink that is screen-printed ontosubstrate 5. In a screen-printing process, carbon ink is loaded onto a screen and then transferred through the screen using a squeegee. The printed carbon ink can be dried using hot air at about 140°C. The carbon ink can include VAGH resin, carbon black, graphite (KS15), and one or more solvents for the resin, carbon and graphite mixture. More particularly, the carbon ink may incorporate a ratio of carbon black: VAGH resin of about 2.90:1 and a ratio of graphite: carbon black of about 2.62:1 in the carbon ink. - For
test strip 100, as illustrated inFigure 3A , firstconductive layer 50 may include areference electrode 10, a first workingelectrode 12, a second workingelectrode 14, third and fourth physicalcharacteristic sensing electrodes 19a and 19b, afirst contact pad 13, asecond contact pad 15, areference contact pad 11, a first working electrode track 8, a secondworking electrode track 9, areference electrode track 7, and astrip detection bar 17. The physicalcharacteristic sensing electrodes First contact pad 13,second contact pad 15, andreference contact pad 11 may be adapted to electrically connect to a test meter. First working electrode track 8 provides an electrically continuous pathway from first workingelectrode 12 tofirst contact pad 13. Similarly, second workingelectrode track 9 provides an electrically continuous pathway from second workingelectrode 14 tosecond contact pad 15. Similarly,reference electrode track 7 provides an electrically continuous pathway fromreference electrode 10 toreference contact pad 11.Strip detection bar 17 is electrically connected to referencecontact pad 11. Third and fourth electrode tracks 19b and 20b connect to therespective electrodes test strip 100 has been properly inserted by measuring a continuity betweenreference contact pad 11 andstrip detection bar 17, as illustrated inFigure 3A . - Variations of the
test strip 100 are shown in applicant's related applications Serial Numbers61/581,087 61/581,089 61/581,099 61/581,100, all filed on the same day of December 29, 2011 US Provisional Patent Application Serial No. 61/654,013, filed on May 31, 2012 PCT/GB2012/053279 PCT/GB2012/053277 PCT/GB2012/053276, filed December 28, 2012 - In the embodiment of
Figure 3B which is a variation of the test strip ofFigure 3A , anadditional electrode 10a is provided as an extension of any of the plurality ofelectrodes grounding electrode 10a is used to reduce or eliminate any capacitance coupling between the finger or body of the user and thecharacteristic measurement electrodes grounding electrode 10a allows for any capacitance to be directed away from thesensing electrodes grounding electrode 10a can be connected any one of the other five electrodes or to its own separate contact pad (and track) for connection to ground on the meter instead of one or more ofcontact pads respective tracks grounding electrode 10a is connected to one of the three electrodes that hasreagent 22 disposed thereon. In a most preferred embodiment, thegrounding electrode 10a is connected toelectrode 10. Being the grounding electrode, it is advantageous to connect the grounding electrode to the reference electrode (10) so as not to contribute any additional current to the working electrode measurements which may come from background interfering compounds in the sample. Further by connecting the shield orgrounding electrode 10a to electrode 10 this is believed to effectively increase the size of thecounter electrode 10 which can become limiting especially at high signals. In the embodiment ofFigure 3B , the reagent is arranged so that they are not in contact with themeasurement electrodes Figure 3C , thereagent 22 is arranged so that thereagent 22 contacts at least one of thesensing electrodes - In an alternate version of
test strip 100, shown here inFigure 3D , thetop layer 38,hydrophilic film layer 34 andspacer 29 have been combined together to form an integrated assembly for mounting to thesubstrate 5 with reagent layer 22' disposed proximate insulation layer 16'. - In the embodiment of
Figure 3B , theanalyte measurement electrodes Fig. 3A ,3C , orelectrodes Figure 3D . Alternatively, the electrodes to sense physical characteristic (e.g., hematocrit) level, can be disposed in a spaced apart configuration in which oneelectrode 19a is proximate anentrance 92a to thetest chamber 92 and anotherelectrode 20a is at the opposite end of the test chamber 92 (shown inFig. 3B of the Related Applications) or both sensing electrodes being distal from theentrance 92a (shown inFigs. 3C and3D of the Related Applications). At least one of the electrodes on the biosensor is disposed to be in contact with areagent layer 22. - In
Figures 3C and3D , the physical characteristic (e.g., hematocrit)sensing electrodes entrance 92a to thetest chamber 92 adjacent and downstream ofelectrode 14 along axis L-L or adjacent theentrance 92a (Figs. 3A-3D ). In all of these embodiments, the physical characteristic sensing electrodes are spaced apart from thereagent layer 22 so that these physical characteristic sensing electrodes are not impacted by the electrochemical reaction of the reagent in the presence of a fluid sample (e.g., blood or interstitial fluid) containing glucose. - As is known, conventional electrochemical-based analyte test strips employ a working electrode along with an associated counter/reference electrode and enzymatic reagent layer to facilitate an electrochemical reaction with an analyte of interest and, thereby, determine the presence and/or concentration of that analyte. For example, an electrochemical-based analyte test strip for the determination of glucose concentration in a fluid sample can employ an enzymatic reagent that includes the enzyme glucose oxidase and the mediator ferricyanide (which is reduced to the mediator ferrocyanide during the electrochemical reaction). Such conventional analyte test strips and enzymatic reagent layers are described in, for example,
U.S. Patents 5,708,247 ;5,951,836 ;6,241,862 ; and6,284,125 ; each of which is hereby incorporated by reference herein to this application. In this regard, the reagent layer employed in various embodiments provided herein can include any suitable sample-soluble enzymatic reagents, with the selection of enzymatic reagents being dependent on the analyte to be determined and the bodily fluid sample. For example, if glucose is to be determined in a fluid sample,enzymatic reagent layer 22 can include glucose oxidase or glucose dehydrogenase along with other components necessary for functional operation. - In general,
enzymatic reagent layer 22 includes at least an enzyme and a mediator. Examples of suitable mediators include, for example, ruthenium, Hexaammine Ruthenium (III) Chloride, ferricyanide, ferrocene, ferrocene derivatives, osmium bipyridyl complexes, and quinone derivatives. Examples of suitable enzymes include glucose oxidase, glucose dehydrogenase (GDH) using a pyrroloquinoline quinone (PQQ) co-factor, GDH using a nicotinamide adenine dinucleotide (NAD) co-factor, and GDH using a flavin adenine dinucleotide (FAD) co-factor.Enzymatic reagent layer 22 can be applied during manufacturing using any suitable technique including, for example, screen printing. - Applicant note that enzymatic reagent layer may also contain suitable buffers (such as, for example, Tris HCl, Citraconate, Citrate and Phosphate), hydroxyethylcelulose [HEC], carboxymethylcellulose, ethycellulose and alginate, enzyme stabilizers and other additives as are known in the field.
- Further details regarding the use of electrodes and enzymatic reagent layers for the determination of the concentrations of analytes in a bodily fluid sample, albeit in the absence of the phase-shift measurement electrodes, analytical test strips and related methods described herein, are in
U.S. Patent No. 6,733,655 , which is hereby fully incorporated by reference herein to this application. - In the various embodiments of the test strip, there are two measurements that are made to a fluid sample deposited on the test strip. One measurement is that of the concentration of the analyte (e.g. glucose) in the fluid sample while the other is that of physical characteristic (e.g., hematocrit) in the same sample. The measurement of the physical characteristic (e.g., hematocrit) is used to modify or correct the glucose measurement so as to remove or reduce the effect of red blood cells on the glucose measurements. Both measurements (glucose and hematocrit) can be performed in sequence, simultaneously or overlapping in duration. For example, the glucose measurement can be performed first then the physical characteristic (e.g., hematocrit); the physical characteristic (e.g., hematocrit) measurement first then the glucose measurement; both measurements at the same time; or a duration of one measurement may overlap a duration of the other measurement. Each measurement is discussed in detail as follows with respect to
Figures 4A and 4B . -
Figure 4A is an exemplary chart of a test signal applied totest strip 100 and its variations shown here inFigures 3A-3D . Before a fluid sample is applied to test strip 100 (or its variants in the Related Applications),test meter 200 is in a fluid detection mode in which a first test signal of about 400 millivolts is applied between second working electrode and reference electrode. Asecond test signal 401 of about 400 millivolts is preferably applied simultaneously between first working electrode (e.g.,electrode 12 of strip 100) and reference electrode (e.g.,electrode 10 of strip 100). Alternatively, the second test signal may also be applied contemporaneously such that a time interval of the application of the first test signal overlaps with a time interval in the application of the second test voltage. The test meter may be in a fluid detection mode during fluid detection time interval TFD prior to the detection of physiological fluid at starting time at zero. In the fluid detection mode,test meter 200 determines when a fluid is applied to test strip 100 (or its variants in the Related Applications) such that the fluid wets either first workingelectrode 12 or second workingelectrode 14 andreference electrode 10. Oncetest meter 200 recognizes that the physiological fluid has been applied because of, for example, a sufficient increase in the measured test current at either the first workingelectrode 12 or second working electrode 14 (or both electrodes) with respect to thereference electrode 10,test meter 200 assigns a zero second marker at zero time "0" and starts the test sequence time interval TS. Test meter 200 may sample the current transient output at a suitable sampling rate, such as, for example, every 1 milliseconds to every 100 milliseconds. Upon the completion of the test time interval TS, the test signal is removed. For simplicity,Figure 4A only shows thefirst test signal 401 applied to test strip 100 (or its variants in the Related Applications). - Hereafter, a description of how glucose concentration is determined from the known current transients (e.g., the measured electrical current response in nanoamperes as a function of time) that are measured when the test voltages of
Figure 4A are applied to the test strip 100 (or its variants in the Related Applications). - In
Figure 4A , the first and second test voltages applied to test strip 100 (or its variants in the Related Applications) are generally from about +100 millivolts to about +600 millivolts. In one embodiment in which the electrodes include carbon ink and the mediator includes ferricyanide, the test signal is about +400 millivolts. Other mediator and electrode material combinations will require different test voltages, as is known to those skilled in the art. The duration of the test voltages is generally from about 1 to about 5 seconds after a reaction period and is typically about 3 seconds after a reaction period. Typically, test sequence time TS is measured relative to time to. As thevoltage 401 is maintained inFigure 4A for the duration of TS , output signals are generated, shown here inFigure 4B with thecurrent transient 402 for the first workingelectrode 12 being generated starting at zero time and likewise thecurrent transient 404 for the second workingelectrode 14 is also generated with respect to the zero time. It is noted that while thesignal transients electrodes Figure 4B , the current transients build up to a peak proximate peak time Tp at which time, the current slowly drops off until approximately one of 2.5 seconds or 5 seconds after zero time. At thepoint 406, approximately at 5 seconds, the output signal for each of the workingelectrodes electrodes particular test strip 100 and its variations, the analyte (e.g., glucose) concentration can be calculated.Output transient - It is noted that "batch intercept" (or "z2") and "batch slope" (or "z1") are the parametric values of the biosensor obtained by measuring calibration data from a lot or batch of test strips. Batch slope as a calibration parameter is well understood by those skilled in the art as referring to an amount of electrical signal produced by a predetermined amount (unit) of the measured analyte. Similarly, batch intercept is also well understood by those skilled in the art as a value determined from a linear regression of a plot of biosensor output signal versus a reference glucose concentration. To determine the batch slope and intercepts, around 1500 strips are typically selected at random from the lot or batch. Physiological fluid (e.g., blood) from donors is spiked to various analyte levels, typically six different glucose concentrations. Typically, blood from 12 different donors is spiked to each of the six levels. Eight strips are given blood from identical donors and levels so that a total of 12 x 6 x 8 = 576 tests are conducted for that lot. These are benchmarked against actual analyte level (e.g., blood glucose concentration) by measuring these using a standard laboratory analyzer such as Yellow Springs Instrument (YSI). A graph of measured glucose concentration is plotted against actual glucose concentration (or measured current versus YSI current) and a formula y = mx+c least squares fitted to the graph to give a value for batch slope of "m" and batch intercept "c" for the remaining strips from the lot or batch. The applicant has also provided methods and systems in which the batch slope is derived during the determination of an analyte concentration. The "batch slope" (or "z1"), may therefore be defined as the measured or derived gradient of the line of best fit for a graph of measured glucose concentration plotted against actual glucose concentration (or measured current versus YSI current). The "batch intercept" (or "z2"), may therefore be defined as the point at which the line of best fit for a graph of measured glucose concentration plotted against actual glucose concentration (or measured current versus YSI current) meets the y axis.
- It is worthwhile here to note that the various components, systems and procedures described earlier allow for applicant to provide an analyte measurement system that heretofore was not available in the art. In particular, this system includes a test strip that has a substrate and a plurality of electrodes connected to respective electrode connectors. The system further includes an
analyte meter 200 that has a housing, a test strip port connector configured to connect to the respective electrode connectors of the test strip, and amicrocontroller 300, shown here inFigure 2B . Themicroprocessor 300 is in electrical communication with the teststrip port connector 220 to apply electrical signals or sense electrical signals from the plurality of electrodes. - Referring back to
Figure 2B , details of a preferred implementation ofmeter 200 where the same numerals inFigures 2A and2B have a common description. InFigure 2B , astrip port connector 220 is connected to theanalogue interface 306 by five lines including an impedance sensing line EIC to receive signals from physical characteristic sensing electrode(s), alternating signal line AC driving signals to the physical characteristic sensing electrode(s), reference line for a reference electrode, and current sensing lines from respective workingelectrode 1 and working electrode 2. Astrip detection line 221 can also be provided for theconnector 220 to indicate insertion of a test strip. Theanalog interface 306 provides four inputs to the processor 300: (1) real impedance Z'; (2) imaginary impedance Z"; (3) output signal sampled or measured from workingelectrode 1 of the biosensor or I we1 ; (4) output signal sampled or measured from working electrode 2 of the biosensor or I we2 . There is one output from theprocessor 300 to theinterface 306 to drive an oscillating signal AC of any value from 25kHz to about 250kHz or higher to the physical characteristic sensing electrodes. A phase differential P (in degrees) can be determined from the real impedance Z' and imaginary impedance Z". Details of the impedance sensing technique to derive the physical characteristic of the fluid sample can be gleaned fromPCT/GB2012/053279 PCT/GB2012/053277 PCT/GB2012/053276 US Provisional Patent Application Serial Nos. 61/581,087 61/581,089 61/581,099 61/581,100 61/654,013 - Glucose concentration Go can be thereafter be determined from Equation 3 as follows:

where - IE is a signal (e.g., current proportional to analyte concentration) which could be the total current from all of the electrodes in the biosensor (e.g., from all five electrodes in
sensor 100, both workingelectrodes 12 and 14 (where IE =I we1 + I we2 or IE =2* ((I we1 + I we2 )/2)) or alternatively from one of the working electrodes where IE =2* I we1 , or IE =2* I we2; - I we1 is the signal (e.g., current) measured for the first working electrode at the set sampling time;
- I we2 is the signal (e.g., current) measured for the second working electrode at the set sampling time;
- z1 is the value obtained from calibration testing of a batch of test strips of which this particular strip comes from;
- z2 is the value obtained from calibration testing of a batch of test strips of which this particular strip comes from.
- The variables z1 and z2 can be correlated together during calibration post-manufacturing such that a single code can be used to represent the relevant slope (i.e., z1) and intercept (i.e., z2). That is, a single code can be used to correlate the two calibration parameters and multiple codes can be used to represent corresponding pairs of calibration parameters. For example, Table 1 illustrates that each of the 36 codes correlates to the relevant slope and intercept parameters to ensure that a batch of biosensors are calibrated to standardized biosensor glucose measurement response. Although the codes (1-36) are numeric, they can also be represented as alphabetized codes or even alphanumeric. At the point of batch release testing information is gathered about the appropriate setting for z1 and z2 values and a batch calibration code is assigned (see Table 1). This information is locked in the biosensor or
vial 102 with a suitable means such as, for example RFID, bar coding, or NFC, before packaging and batch release.

- In Equation 3, the output signal(s) Iwe1 or Iwe2 is measured at a particular time (or at a particular interval) tc during the test measurement sequence. The particular time tc can be obtained from
Equation 4 as follow:
- where tc is the particular time (in seconds);
- tu includes a specified sampling time (in seconds);
- t n includes a nominal sampling time (in seconds);
- y1 includes a dimensionless time multiplier factor derived from Table 2; and
- y2 includes a time additive component (in seconds) derived from Table 2.
- The nominal sampling time tn may be 2.5 seconds or 5 seconds in certain embodiments. In such embodiments, the specified sampling time tu can be determined as shown and described in
PCT/GB2012/053276 PCT/GB2012/053276 Equation 7 of the same application) by knowing a physical characteristic of the fluid sample, which preferably is defined as an impedance characteristic IC or H. Once the impedance characteristic IC or H of the fluid has been determined (as described in the same application), the "specified sampling time" or tu can be set as being equal to x 1 H x2 + x 3 where x1 is about 4.3e5; x2 is about -3.9; and x3 is about 4.8 (all described in this related application). - The dimensionless time multiplier factor y1 and time additive factor can be obtained from a timing calibration code from 1 to 30, shown here in Table 2. In Table 2, the time multiplier y1 and the time additive factor y2 can be correlated by a single code stored on the biosensor or
storage vial 102 and transmitted to the meter, which also has the same array as Table 2 stored in memory so that, for example, if the biosensor has code "8", the meter knows to extract y1∼1.05 and y2∼ (-0.05).
- Alternatively Equation 3 may be expressed in relative terms for the batch slope and batch intercept as Equation 5:

where: - G is glucose concentration reading [mg/dL]
- IE is the current at final assay time [nA]
- z1 is the slope [nA/ (mg/dL)] - hardcoded in meter and not changeable
- z2 is the intercept [nA] - hardcoded in meter and not changeable
- z3 is the slope multiplier [dimensionless] - (see Table 3)
- z4 is the intercept multiplier [dimensionless] - (see Table 3)
- Where
Equation 5 is used for relative calibration correction, Table 3 may be utilized by determining the relative correction while keeping in mind that the batch slope and batch intercept are fixed to a single value in the meter. Consequently, Table 3 provides for the same number of calibration codes (as Table 1) that are linked to the slope multiplier and intercept multiplier except that fixed slope and intercept are stored in the meter and the respective multipliers allow for adjusting the fixed slope and intercepts.
- An explanation of applicant's inventive technique will now be described with reference to
Figures 4A, 4B and5 . InFigure 5 , a logic diagram 500 is shown for use of the system illustrated inFigures 1 ,2A ,2B ,3A-3D .Logic 500 starts atstep 502 in which an input signal (e.g., electrical voltage of about 400 mV inFigure 4A ) is applied to at least one of theelectrodes Fluid sample 95 can be deposited onto one of the electrodes atstep 504. The fluid sample may start an electrochemical reaction which would provide an output signal that can be detected. Atstep 506, once the signal output from one of the electrodes is above a preset threshold (e.g., above about 0 nA), the process designates this as a start of the test sequence TS and initiates a timer for the test interval (Fig. 4B at start time "0.0"). The processor can also measure or sample the output signals I we1 or I we2 from at least one of the working electrodes (12 and 14) at any one of a plurality of time points or positions T1, T2, T3, .... TN. As can be seen inFig. 4B , the time positions can be any time point or interval in the test sequence TS. - For example, the time position at which the output signal is measured can be a single time position (in
Fig. 4B ) T1.5 at 1.5 seconds or an interval 408 (e.g., interval∼10 milliseconds or more depending on the sampling rate of the system) overlapping the time position T2.8 proximate 2.8 seconds. Atstep 508 ofFig. 5 , the processor obtains a timing calibration code (e.g., Table 2) from the biosensor or thevial 102 containing the biosensor so that a measurement of the output signal could be made proximate a particular sampling time fromEquation 4. Atstep 510, the system determines the particular time tc based on the "specified sampling time" tu during the test sequence TS to measure the output signals from the electrodes. To calculate this "specified sampling time" tu , the processor may measure the impedance characteristic "IC" of the fluid sample, as shown and described in international patent applicationPCT/GB2012/053276 Equation 7 of the same application) in order to obtain the "specified sampling time" in the related application and this disclosure. The nominal time tn may be designated as about 2.5 seconds. - Of course, while the
steps step 512 can be done at the same time, earlier or later thansteps Fig. 4B ) are sampled or measured for the entire test sequence, it is usually the case that the signal outputs proximate the particular time tc will be utilized to calculate the glucose concentration. Atstep 514, the system may extract the output signals at the particular time tc (or over an interval overlapping the particular time) from the at least one electrode. Atstep 516, the system may obtain a batch calibration code from the biosensor or thevial 102 containing the biosensor(s). With the batch calibration code obtained instep 516, the system can look up its memory to determine the corresponding batch slope z1 and batch intercept z2 correlated to the particular calibration code. Atstep 518, the system utilizes both of these values (z1 and z2) along with the measured output signal IE at the particular time tc to calculate or determine the glucose concentration in the fluid sample (which fluid sample may be physiological fluid such as blood, tears, sweat or synthetic fluid such as control solution). - To recap, the method describes and shown in
flow chart 500 allow for applicant to obtain an accurate glucose concentration by: contacting a fluid sample with the at least one electrode to start a test measurement instep 504; obtaining a timing calibration code atstep 508; calculating a particular time point (tC) from the start of the test measurement for sampling a signal output of the sample based on the timing calibration code atstep 510; applying a signal input to the sample atstep 502; measuring a signal output from the sample from the start of a test measurement atstep 512; determining at least one particular signal output proximate at least the particular time point after the start of the test measurement atstep 514; obtaining a calibration code atstep 516; and calculating a glucose concentration from the at least one particular signal output and the calibration code atstep 518. In short, applicant has devised a technique that utilizes two calibration codes: one for time calibration and one for batch calibration. - As an example of an analyte calculation (e.g., glucose) for strip 100 (
Fig. 3A-3F and its variants in the Related Applications), it is assumed, for this example only, that thebiosensor 100 has anRFID tag 101 embedded into the biosensor such that both the calibration code and timing assay calibration code are stored in theRFID tag 101 for later retrieval by the meter and its associatedreader 322. Examples of such RFID systems are well known and described at, for example,US Patent Application Publication Nos. 20100148972 andUS20120305419 . Alternatively, a micro bar-code can be imprinted on the biosensor or the vial for later reading and retrieval by the meter. In this example, it is assumed that the batch calibration code is "15" and the timing calibration code is "23". For calibration code "15", the meter via its processor can determine from its memory that the batch slope z1 is therefore 9.5 nA/ (mg/dL) and the batch intercept z2 is therefore 450 nA (Table 1). For timing calibration code "23", the meter can determine from its memory that the time multiplier factor y1 inEquation 4 is about 1.05 and the time additive component y2 inEquation 4 is about 0.1 second. For this example, it is also assumed that the nominal time is about 5 seconds and the specified sampling time based on the sensed impedance of the fluid is about 5.5 seconds. FromEquation 4, the particular time tc for the system to sample the fluid is as follows:
- and tu =2 seconds;
- tn =2.5 seconds ;
- y1 =1.05; and
- y2 =0.1 second
- tc = 2.1seconds
- Using the particular sampling time tc of about 2.1 seconds, the system extracts the measured output signal at
step 514, which in this example for the first workingelectrode 12 is about 1600 nanoamperes (measured at about 2.1 seconds from the start of test sequence) whereas the output signal at 406 for the second workingelectrode 14 is about 1300 nanoamperes and the calibration code of the test strip indicates that the batch intercept z2 is about 450 nanoamperes (also measured at about 2.1 seconds from the start) and the batch slope z1 is about 9.5 nanoamperes/mg/dL.
From Equation 3; Go = [(1600+1300)-450]/9.5 and therefore, G0 ∼ 258 mg/dL. - It is noted here that the examples have been given in relation to a
biosensor 100 which has two working electrodes (12 and 14 inFigs. 3A-3D (and its variants in the Related Applications) such that the measured signals from respective working electrodes have been added together to provide for a total measured current IE , the signal resulting from only one of the two working electrodes can be multiplied by two in a variation oftest strip 100 where there is only one working electrode (eitherelectrode 12 or 14). Instead of a total measured signal, an average of the signal from each working electrode can be used as the total measured signal I E for Equation 3, described herein, and of course, with appropriate modification to the operational coefficients (as known to those skilled in the art) to account for a lower total measured signal I E than as compared to an embodiment where the measured signals are added together. Alternatively, the average of the measured signals can be multiplied by two and used as I E in Equations 3.3, without the necessity of deriving the operational coefficients as in the prior example. It is noted that the analyte (e.g., glucose) concentration here is not corrected for any physical characteristic (e.g., hematocrit value) and that certain offsets may be provided to the signal values Iwe1 and Iwe2 to account for errors or delay time in the electrical circuit of themeter 200. Temperature compensation can also be utilized to ensure that the results are calibrated to a referential temperature such as for example room temperature of about 20 degrees Celsius. - Principles of applicant's invention have been proven with respect to the following non-limiting example.
- In this example, 14 lots of the
test strip 100 were obtained and divided into two categories, the first category labeled as "no calibration code use" and the second category labeled as "calibration-code used". For the second category of the strips that utilized calibration parameters, the calibration parameters were determined for "slope" or z1; "intercept" or z2; "multiplier" or y1; and "additive time" or y2. These calibration parameters for each lot are summarized in Table 4.

- Glucose test measurements were made using test strips from these lots and the results from each lot for each of the two categories were collated in Table 5. Table 5 shows the two categories ("no calibration coding" and "calibration coding used") in the two main columns indexed by the lot sequences 1-14 in the first column. For each row of the table, the numbers in each of the second through fifth represent the percentage of samples that meet the thresholds in the first row, i.e., within "15mg/dL" as compared to referential YSI for glucose results less than 100 mg/dL or within ± "15%" as compared to referential YSI for glucose results greater than or equal to 100 mg/dL for each of the two categories.


- A review of the results from Table 5 confirms the advantages of applicant's dual coding technique for both batch and time. In particular, for glucose concentration less than 100 mg/dL, out of 14 lots, 9 lots that utilized calibration coding described generally herein (i.e., lots 4-9,11-13) had higher percentages of results within ±15 mg/dL of referential YSI; and only two lots that did not use calibration coding (
lots 10 and 14) exceeded their counterparts that use calibration coding but even so these were not by much (99.8% versus 99.6% forlot 10 and 97.8% versus 96.4% for lot 14). - For glucose results at 100 mg/dL or greater, the calibration coded lots showed greater number of lots that have higher percentages (lots 1-4, 6-8, 11, and 12) to the non-coded lots. It is noted that the non-coded lots do have four lots (
lots -
Figure 7 illustrates graphically the improvements for lots 1-14. InFigure 7 , the dashed line at 0% signifies no improvement and any points above the dashed line indicates percent improvements and any points below the dashed line indicates detriment. Specifically, it is noted that there were three lots that experienced a detrimental effects at glucose results greater than or equal to 100 mg/dL at 702. There were two lots that experienced detrimental effects at both low values (below 100 mg/dL) and high values (100 mg/dL or greater), indicated at 704. On the whole, however, at least half of the lots showed clear improvements by use of the dual batch and time calibration codlings of applicant. - In summary, it can be seen in
Figure 5 that there are wide variations in the calibration parameters (slopes and intercepts) in the produced lots of biosensors. In contrast, embodiments of this invention, as shown and described in relation toFigures 1-5 , Tables 1-3 ensures a more reproducible product being utilized by patients in the field. This is achieved not by complex and costly process and material control at point of manufacture but by establishing the deviation from a gold standard product setting and passing this information to the point of testing for the patients or users. Overall batch-to-batch variability is addressed and minimized (shown by Table 5 andFig. 7 ) by virtue of the dual-calibration coding exemplarily described in relation toFigures 1-5 and Tables 1-3. - While the invention has been described in terms of particular variations and illustrative figures, those of ordinary skill in the art will recognize that the invention is not limited to the variations or figures described. In addition, where methods and steps described above indicate certain events occurring in a certain order, it is intended that certain steps do not have to be performed in the order described but in any order as long as the steps allow the embodiments to function for their intended purposes. Therefore, to the extent there are variations of the invention, which are within the spirit of the disclosure or equivalent to the inventions found in the claims, it is the intent that this patent will cover those variations as well.
Claims (17)
- A glucose measurement system comprising:a biosensor having at least one electrode configured to receive an input signal that initiates an electrochemical reaction between a fluid sample and enzyme disposed on the at least one electrode; anda processor connected to a memory and a power supply to drive at least one input signal to the at least one electrode of the biosensor, the processor configured to obtain a batch calibration code and a timing calibration code so that the processor determines, based on the timing calibration code, a particular time from a start of test measurement sequence at which to measure output signals from the sample and ascertains an analyte amount in the fluid sample from the output signals measured at the particular time and the batch calibration code.
- A glucose measurement system comprising:a biosensor having at least one electrode configured to receive an input signal that initiates an electrochemical reaction between a fluid sample and enzyme disposed on the at least one electrode; anda processor connected to a memory and a power supply to drive at least one input signal to the at least one electrode of the biosensor, the processor configured to measure output signals proximate a particular time dictated by the timing calibration code and a nominal time from a start of the test measurement so that a glucose concentration in the fluid is calculated with the measured signal output proximate the particular time and the calibration code and the glucose concentration annunciated.
- A method to obtain glucose concentration from a biosensor having at least one electrode configured for connection with a glucose meter, the method comprising the steps of:contacting a fluid sample with the at least one electrode to start a test measurement;obtaining a timing calibration code;calculating a particular time point from the start of the test measurement for sampling a signal output of the sample based on the timing calibration code;applying a signal input to the sample;measuring a signal output from the sample from the start of a test measurement;determining at least one particular signal output proximate at least the particular time point after the start of the test measurement;obtaining a calibration code;calculating a glucose concentration from the at least one particular signal output and the calibration code.
- A method to determine a glucose concentration from a biosensor having at least one electrode configured to be connected to a signal source of a glucose meter, the method comprising the steps of:obtaining a calibration code and a timing calibration code;applying an input signal to the sample to cause a physical transformation of the glucose in the sample and start a test measurement;measuring a signal output from the sample proximate a particular time dictated by the timing calibration code and a nominal time from a start of the test measurement;calculating a glucose concentration in the fluid with the signal output from the measuring step and the calibration code from the obtaining step; andannunciating the glucose concentration from the calculating step.
- The system of claim 1 or claim 2, in which the timing calibration code is correlated to a time multiplier value and an additive value.
- The method of claim 3 or claim 4, in which the timing calibration code is correlated to a time multiplier value and an additive value.
- The system of claim 1 or claim 2, in which the calibration code is correlated to a slope of a particular batch of the biosensor and an intercept of a particular batch of the biosensor.
- The method of claim 3 or claim 4, in which the calibration code is correlated to a slope of a particular batch of the biosensor and an intercept of a particular batch of the biosensor.
- The method according to claim 3, in which the obtaining of the batch calibration code comprises transmitting the batch calibration code from one of a storage container for the biosensor or the biosensor itself to a receiver the glucose meter.
- A method to determine a glucose concentration from a biosensor having at least one electrode configured to be connected to a signal source of a glucose meter, the method comprising the steps of:initiating a start of a test measurement sequence upon contact of a fluid sample to the at least one electrode;obtaining a timing multiplier coefficient (y1) and a timing additive coefficient (y2) for the biosensor;deriving a particular time point for measurement of signal output from the sample with the calibration multiplier coefficient and the calibration additive coefficient;obtaining a slope calibration (x1) and an intercept calibration (x2) for the biosensor;measuring a signal output from the sample from the start of the test measurement;determining at least one particular signal output proximate at least the particular time point after the start of the test measurement;calculating a glucose concentration from the at least one particular signal output, the slope calibration and the intercept calibration; andannunciating the glucose concentration from the calculating step.
- The method according to claim 10, in which the transmitting comprises powering an RFID tag disposed in the biosensor for transmission of the batch calibration code to an RFID reader disposed in the glucose meter.
- The method according to claim 3, in which the obtaining of the timing calibration code comprises transmitting the timing calibration code from one of a storage container for the biosensor or the biosensor itself to the glucose meter.
- The method according to claim 12, in which the transmitting comprises powering an RFID tag disposed in the biosensor for transmission of the timing calibration code to an RFID reader disposed in the glucose meter.
- The method according to claim 10, in which the obtaining comprises transmitting the calibration multiplier coefficient and the calibration additive coefficient from one of a storage container for the biosensor or the biosensor itself to the glucose meter.
- The method according to claim 10, in which the obtaining comprises transmitting the slope calibration and intercept calibration from one of a storage container for the biosensor or the biosensor itself to the glucose meter.
- A method of determining an analyte concentration in a fluid with a biosensor configured for measurement with an analyte meter, the method comprising:driving a signal into the biosensor;starting a test sequence when an output signal is above a predetermined threshold;obtaining a batch calibration code specific to the biosensor and a timing calibration code specific to the biosensor;determining a particular time from the start of the test sequence to measure output signals from the biosensor based on information from the timing calibration code;measuring the output signals at the particular time;ascertaining the analyte amount in the fluid from the output signals measured at the particular time and the batch calibration code.
- A glucose measurement system comprising:a generally planar electrochemical test strip having at least one electrode configured to receive an input signal that initiates an electrochemical reaction between a fluid sample and enzyme disposed on the at least one electrode; anda processor connected to a memory and a power supply to drive at least one input signal to the at least one electrode of the test strip, the processor configured to initiate a start of a test measurement sequence upon contact of a fluid sample to the at least one electrode, obtain a timing multiplier coefficient and a timing additive coefficient for the test strip to derive a slope calibration multiplier and a calibration additive coefficient, derive a particular time point for measurement of signal output from the sample with the calibration multiplier coefficient and the calibration additive coefficient, obtain a slope calibration and intercept calibration for the test strip, determine at least one signal output proximate at least the particular time point after the start of the test measurement so that a glucose concentration is calculated by the processor from the at least one particular signal output, the slope calibration and the intercept calibration and the glucose concentration stored for annunciation.
Applications Claiming Priority (2)
| Application Number | Priority Date | Filing Date | Title |
|---|---|---|---|
| US201361824549P | 2013-05-17 | 2013-05-17 | |
| US13/896,986 US10371660B2 (en) | 2013-05-17 | 2013-05-17 | Accurate analyte measurements for electrochemical test strip based on multiple calibration parameters |
Publications (1)
| Publication Number | Publication Date |
|---|---|
| EP2803987A1 true EP2803987A1 (en) | 2014-11-19 |
Family
ID=50729397
Family Applications (1)
| Application Number | Title | Priority Date | Filing Date |
|---|---|---|---|
| EP14168696.4A Withdrawn EP2803987A1 (en) | 2013-05-17 | 2014-05-16 | Accurate analyte measurements for electrochemical test strip based on multiple calibration parameters |
Country Status (4)
| Country | Link |
|---|---|
| US (1) | US10371660B2 (en) |
| EP (1) | EP2803987A1 (en) |
| HK (1) | HK1204050A1 (en) |
| TW (1) | TWI632365B (en) |
Cited By (1)
| Publication number | Priority date | Publication date | Assignee | Title |
|---|---|---|---|---|
| CN110208352A (en) * | 2019-06-24 | 2019-09-06 | 深圳硅基传感科技有限公司 | The factory calibration method of glucose sensor |
Families Citing this family (6)
| Publication number | Priority date | Publication date | Assignee | Title |
|---|---|---|---|---|
| US10739296B2 (en) * | 2017-05-24 | 2020-08-11 | Philosys Co., Ltd. | Test strip providing code sequence to be automatically recognized, and biological analyte monitoring device |
| CN109709324B (en) * | 2017-10-26 | 2022-05-13 | 台达电子工业股份有限公司 | Detection method and detection device with compensation function |
| CN112438704B (en) * | 2019-08-31 | 2024-02-23 | 深圳硅基传感科技有限公司 | Calibration system of physiological parameter monitor |
| US11448674B2 (en) * | 2019-10-04 | 2022-09-20 | Roche Diabetes Care, Inc. | System and method for detection of contact with a test strip using capacitive sensing |
| WO2022104748A1 (en) * | 2020-11-20 | 2022-05-27 | 微泰医疗器械(杭州)股份有限公司 | Implanted-type monitoring apparatus calibration method, sensor assembly, and blood glucose monitoring system |
| CN113588736B (en) * | 2021-07-28 | 2024-02-20 | 三诺生物传感股份有限公司 | Method and system for correcting current signal |
Citations (12)
| Publication number | Priority date | Publication date | Assignee | Title |
|---|---|---|---|---|
| US5708247A (en) | 1996-02-14 | 1998-01-13 | Selfcare, Inc. | Disposable glucose test strips, and methods and compositions for making same |
| US6241862B1 (en) | 1996-02-14 | 2001-06-05 | Inverness Medical Technology, Inc. | Disposable test strips with integrated reagent/blood separation layer |
| US6284125B1 (en) | 1995-06-19 | 2001-09-04 | Usf Filtration And Separations Group, Inc. | Electrochemical cell |
| US6733655B1 (en) | 2000-03-08 | 2004-05-11 | Oliver W. H. Davies | Measurement of substances in liquids |
| US20060003462A1 (en) * | 2004-07-02 | 2006-01-05 | Qiong Wang | Dual-slot biological test meter test procedure |
| WO2006040200A1 (en) | 2004-10-13 | 2006-04-20 | Siemens Aktiengesellschaft | Device and method for light and shade simulation in an augmented-reality system |
| WO2006086423A2 (en) * | 2005-02-08 | 2006-08-17 | Therasense, Inc. | Rf tag on test strips, test strip vials and boxes |
| EP1825806A2 (en) | 2006-02-24 | 2007-08-29 | Lifescan Scotland Ltd | Usability methods of wirelessly calibrating an analyte measurement meter and corresponding system |
| US20120305419A1 (en) | 2011-05-31 | 2012-12-06 | Tara Chand Singhal | Integrated blood glucose measuring device with a test strip packaging system |
| WO2012164271A1 (en) * | 2011-05-27 | 2012-12-06 | Lifescan Scotland Limited | Peak offset correction for analyte test strip |
| WO2013030375A1 (en) * | 2011-09-02 | 2013-03-07 | Lifescan Scotland Limited | Hematocrit Corrected Glucose Measurements for Electrochemical Test Strip Using Time Differential of the Signals |
| WO2013098563A1 (en) * | 2011-12-29 | 2013-07-04 | Lifescan Scotland Limited | Accurate analyte measurements for electrochemical test strip based on sensed physical characteristic(s) of the sample containing the analyte |
-
2013
- 2013-05-17 US US13/896,986 patent/US10371660B2/en not_active Expired - Fee Related
-
2014
- 2014-05-15 TW TW103117084A patent/TWI632365B/en not_active IP Right Cessation
- 2014-05-16 EP EP14168696.4A patent/EP2803987A1/en not_active Withdrawn
-
2015
- 2015-05-06 HK HK15104297.5A patent/HK1204050A1/en unknown
Patent Citations (17)
| Publication number | Priority date | Publication date | Assignee | Title |
|---|---|---|---|---|
| US6284125B1 (en) | 1995-06-19 | 2001-09-04 | Usf Filtration And Separations Group, Inc. | Electrochemical cell |
| US5708247A (en) | 1996-02-14 | 1998-01-13 | Selfcare, Inc. | Disposable glucose test strips, and methods and compositions for making same |
| US5951836A (en) | 1996-02-14 | 1999-09-14 | Selfcare, Inc. | Disposable glucose test strip and method and compositions for making same |
| US6241862B1 (en) | 1996-02-14 | 2001-06-05 | Inverness Medical Technology, Inc. | Disposable test strips with integrated reagent/blood separation layer |
| US6733655B1 (en) | 2000-03-08 | 2004-05-11 | Oliver W. H. Davies | Measurement of substances in liquids |
| US20060003462A1 (en) * | 2004-07-02 | 2006-01-05 | Qiong Wang | Dual-slot biological test meter test procedure |
| WO2006040200A1 (en) | 2004-10-13 | 2006-04-20 | Siemens Aktiengesellschaft | Device and method for light and shade simulation in an augmented-reality system |
| US8358210B2 (en) | 2005-02-08 | 2013-01-22 | Abbott Diabetes Care Inc. | RF tag on test strips, test strip vials and boxes |
| US20100148972A1 (en) | 2005-02-08 | 2010-06-17 | Abbott Diabetes Care Inc. | RF Tag on Test Strips, Test Strip Vials and Boxes |
| WO2006086423A2 (en) * | 2005-02-08 | 2006-08-17 | Therasense, Inc. | Rf tag on test strips, test strip vials and boxes |
| US8390455B2 (en) | 2005-02-08 | 2013-03-05 | Abbott Diabetes Care Inc. | RF tag on test strips, test strip vials and boxes |
| US8410939B2 (en) | 2005-02-08 | 2013-04-02 | Abbott Diabetes Care Inc. | Analyte meter including an RFID reader |
| EP1825806A2 (en) | 2006-02-24 | 2007-08-29 | Lifescan Scotland Ltd | Usability methods of wirelessly calibrating an analyte measurement meter and corresponding system |
| WO2012164271A1 (en) * | 2011-05-27 | 2012-12-06 | Lifescan Scotland Limited | Peak offset correction for analyte test strip |
| US20120305419A1 (en) | 2011-05-31 | 2012-12-06 | Tara Chand Singhal | Integrated blood glucose measuring device with a test strip packaging system |
| WO2013030375A1 (en) * | 2011-09-02 | 2013-03-07 | Lifescan Scotland Limited | Hematocrit Corrected Glucose Measurements for Electrochemical Test Strip Using Time Differential of the Signals |
| WO2013098563A1 (en) * | 2011-12-29 | 2013-07-04 | Lifescan Scotland Limited | Accurate analyte measurements for electrochemical test strip based on sensed physical characteristic(s) of the sample containing the analyte |
Cited By (1)
| Publication number | Priority date | Publication date | Assignee | Title |
|---|---|---|---|---|
| CN110208352A (en) * | 2019-06-24 | 2019-09-06 | 深圳硅基传感科技有限公司 | The factory calibration method of glucose sensor |
Also Published As
| Publication number | Publication date |
|---|---|
| TW201514489A (en) | 2015-04-16 |
| US10371660B2 (en) | 2019-08-06 |
| HK1204050A1 (en) | 2015-11-06 |
| TWI632365B (en) | 2018-08-11 |
| US20140339100A1 (en) | 2014-11-20 |
Similar Documents
| Publication | Publication Date | Title |
|---|---|---|
| US20180188200A1 (en) | Accurate analyte measurements for electrochemical test strip based on sensed physical characteristic(s) of the sample containing the analyte and derived biosensor parameters | |
| EP3014257B1 (en) | Temperature compensation for an analyte measurement | |
| EP2803987A1 (en) | Accurate analyte measurements for electrochemical test strip based on multiple calibration parameters | |
| EP2751553B1 (en) | Hematocrit corrected glucose measurements using phase angles and impedance for electrochemical test strip | |
| EP2751554B1 (en) | Hematocrit corrected glucose measurements for electrochemical test strip using time differential of the signals | |
| EP2715330B1 (en) | Peak offset correction for analyte test strip | |
| AU2015323722A1 (en) | Accurate analyte measurements for electrochemical test strip to determine analyte measurement time based on measured temperature, physical characteristic and estimated analyte value and their temperature compensated values | |
| US9435764B2 (en) | Transient signal error trap for an analyte measurement determined from a specified sampling time derived from a sensed physical characteristic of the sample containing the analyte | |
| AU2014301074B2 (en) | Fill error trap for an analyte measurement determined from a specified sampling time derived from a sensed physical characteristic of the sample containing the analyte | |
| EP3042188B1 (en) | Method and system to determine erroneous measurement signals during a test measurement sequence | |
| US20160091451A1 (en) | Accurate analyte measurements for electrochemical test strip to determine analyte measurement time based on measured temperature, physical characteristic and estimated analyte value |
Legal Events
| Date | Code | Title | Description |
|---|---|---|---|
| PUAI | Public reference made under article 153(3) epc to a published international application that has entered the european phase |
Free format text: ORIGINAL CODE: 0009012 |
|
| 17P | Request for examination filed |
Effective date: 20140516 |
|
| AK | Designated contracting states |
Kind code of ref document: A1 Designated state(s): AL AT BE BG CH CY CZ DE DK EE ES FI FR GB GR HR HU IE IS IT LI LT LU LV MC MK MT NL NO PL PT RO RS SE SI SK SM TR |
|
| AX | Request for extension of the european patent |
Extension state: BA ME |
|
| R17P | Request for examination filed (corrected) |
Effective date: 20150519 |
|
| RBV | Designated contracting states (corrected) |
Designated state(s): AL AT BE BG CH CY CZ DE DK EE ES FI FR GB GR HR HU IE IS IT LI LT LU LV MC MK MT NL NO PL PT RO RS SE SI SK SM TR |
|
| REG | Reference to a national code |
Ref country code: HK Ref legal event code: DE Ref document number: 1204050 Country of ref document: HK |
|
| STAA | Information on the status of an ep patent application or granted ep patent |
Free format text: STATUS: EXAMINATION IS IN PROGRESS |
|
| 17Q | First examination report despatched |
Effective date: 20180717 |
|
| STAA | Information on the status of an ep patent application or granted ep patent |
Free format text: STATUS: EXAMINATION IS IN PROGRESS |
|
| STAA | Information on the status of an ep patent application or granted ep patent |
Free format text: STATUS: EXAMINATION IS IN PROGRESS |
|
| REG | Reference to a national code |
Ref country code: HK Ref legal event code: WD Ref document number: 1204050 Country of ref document: HK |
|
| STAA | Information on the status of an ep patent application or granted ep patent |
Free format text: STATUS: THE APPLICATION IS DEEMED TO BE WITHDRAWN |
|
| 18D | Application deemed to be withdrawn |
Effective date: 20221201 |