US20030191683A1 - Market determination system - Google Patents
Market determination system Download PDFInfo
- Publication number
- US20030191683A1 US20030191683A1 US10/410,554 US41055403A US2003191683A1 US 20030191683 A1 US20030191683 A1 US 20030191683A1 US 41055403 A US41055403 A US 41055403A US 2003191683 A1 US2003191683 A1 US 2003191683A1
- Authority
- US
- United States
- Prior art keywords
- geographical
- travel time
- database
- primary
- information
- Prior art date
- Legal status (The legal status is an assumption and is not a legal conclusion. Google has not performed a legal analysis and makes no representation as to the accuracy of the status listed.)
- Granted
Links
Images


Classifications
-
- G—PHYSICS
- G06—COMPUTING; CALCULATING OR COUNTING
- G06T—IMAGE DATA PROCESSING OR GENERATION, IN GENERAL
- G06T17/00—Three dimensional [3D] modelling, e.g. data description of 3D objects
- G06T17/05—Geographic models
-
- G—PHYSICS
- G06—COMPUTING; CALCULATING OR COUNTING
- G06Q—INFORMATION AND COMMUNICATION TECHNOLOGY [ICT] SPECIALLY ADAPTED FOR ADMINISTRATIVE, COMMERCIAL, FINANCIAL, MANAGERIAL OR SUPERVISORY PURPOSES; SYSTEMS OR METHODS SPECIALLY ADAPTED FOR ADMINISTRATIVE, COMMERCIAL, FINANCIAL, MANAGERIAL OR SUPERVISORY PURPOSES, NOT OTHERWISE PROVIDED FOR
- G06Q10/00—Administration; Management
- G06Q10/06—Resources, workflows, human or project management; Enterprise or organisation planning; Enterprise or organisation modelling
- G06Q10/063—Operations research, analysis or management
- G06Q10/0631—Resource planning, allocation, distributing or scheduling for enterprises or organisations
- G06Q10/06315—Needs-based resource requirements planning or analysis
-
- G—PHYSICS
- G06—COMPUTING; CALCULATING OR COUNTING
- G06Q—INFORMATION AND COMMUNICATION TECHNOLOGY [ICT] SPECIALLY ADAPTED FOR ADMINISTRATIVE, COMMERCIAL, FINANCIAL, MANAGERIAL OR SUPERVISORY PURPOSES; SYSTEMS OR METHODS SPECIALLY ADAPTED FOR ADMINISTRATIVE, COMMERCIAL, FINANCIAL, MANAGERIAL OR SUPERVISORY PURPOSES, NOT OTHERWISE PROVIDED FOR
- G06Q30/00—Commerce
- G06Q30/02—Marketing; Price estimation or determination; Fundraising
- G06Q30/0201—Market modelling; Market analysis; Collecting market data
- G06Q30/0202—Market predictions or forecasting for commercial activities
-
- G—PHYSICS
- G06—COMPUTING; CALCULATING OR COUNTING
- G06Q—INFORMATION AND COMMUNICATION TECHNOLOGY [ICT] SPECIALLY ADAPTED FOR ADMINISTRATIVE, COMMERCIAL, FINANCIAL, MANAGERIAL OR SUPERVISORY PURPOSES; SYSTEMS OR METHODS SPECIALLY ADAPTED FOR ADMINISTRATIVE, COMMERCIAL, FINANCIAL, MANAGERIAL OR SUPERVISORY PURPOSES, NOT OTHERWISE PROVIDED FOR
- G06Q30/00—Commerce
- G06Q30/02—Marketing; Price estimation or determination; Fundraising
- G06Q30/0201—Market modelling; Market analysis; Collecting market data
- G06Q30/0204—Market segmentation
- G06Q30/0205—Location or geographical consideration
-
- G—PHYSICS
- G06—COMPUTING; CALCULATING OR COUNTING
- G06Q—INFORMATION AND COMMUNICATION TECHNOLOGY [ICT] SPECIALLY ADAPTED FOR ADMINISTRATIVE, COMMERCIAL, FINANCIAL, MANAGERIAL OR SUPERVISORY PURPOSES; SYSTEMS OR METHODS SPECIALLY ADAPTED FOR ADMINISTRATIVE, COMMERCIAL, FINANCIAL, MANAGERIAL OR SUPERVISORY PURPOSES, NOT OTHERWISE PROVIDED FOR
- G06Q40/00—Finance; Insurance; Tax strategies; Processing of corporate or income taxes
Definitions
- This invention generally relates to a system for use in market analysis. More particularly, the system relates to using geographical map databases and geographical travel time information to determine a demand and supply for a market area.
- Market studies are performed in order to identify the supply and demand for a site in an area. This process may be carried out in many different ways because of differing definitions of the market area of interest.
- the market area of interest is the area in which customers reside and the area in which competitors are likely to be located.
- Market analysts determine supply information by researching an area and finding out information such as the number-and types of competitor sites. Generally, market analysts look at many different demographic components to determine demand. For example, one component of demographic demand for an assisted living home may be that a certain percentage of those aged 65 to 75 in the area who have incomes over $25,000 will enter the proposed assisted living home. Based on the number of people in the age group 65-75, one may estimate the number of people and dollars that will be spent at the assisted living home by this age group. An accumulation of these data for each age group estimates gross revenue for the assisted living home.
- Geographic information systems exist that include typical map data such as geographical features, roads, and landmarks as well as the boundaries for block groups.
- the geographical linear features, such as roads or geographic boundaries are stored as polylines.
- the geographical area features, such as block groups, census tracts, and counties, are stored as polygons enclosed by polylines. The two are stored in a table together with census identifying data, which allows the geographical areas to be tied to demographic characteristics in the census databases.
- a point study is performed when an investor wishes to know the demand for a business at a particular site.
- an analyst To calculate demand for a business at a geographical point, an analyst must define a market area surrounding that point for the given business. Typically an analyst will define more than one market area, such as a primary and secondary market area.
- One simple method an analyst may use is to plot the site on a map and draw a circle around of the site of a given radius. The first radius selection of, for example, ten miles could be the primary market area, and a second selection of, for example, the next ten miles could be the secondary market area.
- a market analyst would select some section of the map and assume that this is the market area. Often, a junior member of the analyst's firm goes out into a community and talks to the people of interest and uses the gathered information to define a market area. Then, to determine demand, a market analyst would calculate the number of potential purchasers in that area and the amount that these potential purchasers are expected to spend using the census information, to determine supply, the analyst would look at other suppliers in the market area. Using both the supply and demand information, a net demand can be determined. There are no set standards of how the initial market area is selected or which census tracts or block groups are included in that market area. The results may be easily manipulated by simply redefining the market area, thus greatly reducing the legitimacy of such studies because the results are not replicable by another analyst with the same skills and background.
- a system is needed that standardizes the selection of a market area and allows for reproducible studies.
- a system and method consistent with the principles of the present invention selects a primary and a secondary market area based on travel time. More than two market areas may also be selected. In addition block groups are accepted as being within the market area based on certain rules, thereby standardizing their selection.
- Systems and methods consistent with the present invention generate a map using stored geographical information.
- a geographical point or area is selected from the map for analysis.
- a travel time around the geographical point is selected.
- the geographical area around the geographical point within the travel time is defined using data holding travel time information.
- Market information stored in a database is gathered for the defined geographical area from a memory location.
- Demand is computed from the demographic groups in each travel-time-defined area and weighted according to the model used by the analyst.
- Supply of competition is computed by surveying the competition and plotting each on the map, weighing the results by travel time and other factors according to the model used by the analyst.
- the final result, net demand is the difference between demand and supply.
- FIG. 1 is an overall diagram of a system for implementing the present invention
- FIG. 2 is a flow chart showing the steps for selecting a type of market analysis
- FIG. 3 is a flow chart showing the steps for performing market analysis
- FIGS. 4 a - 4 c are example display screens showing information related to a market demand model
- FIGS. 5 a - 5 e are example display screens showing a map and associate travel time traces
- FIG. 6 is a flowchart showing additional steps for performing market analysis by using demographic data
- FIG. 7 is a sample screen display of a map with block groups
- FIG. 8 is a flowchart showing additional steps for performing market analysis including summing demographic data
- FIG. 9 is a flowchart showing additional steps for performing market analysis including calculating supply and demand.
- FIG. 10 is a flowchart showing the steps for an area feasibility study.
- the present invention provides a way of defining the market area that may be repeated by another analyst which allows for a standard in the industry. Instead of using miles around a point which ignores barriers like a river or using psychological boundaries, which are not replicable, the present invention uses travel time.
- a database contains the travel time traces from the proposed site in the geographical area under study.
- the analyst selects travel times based on empirical research that relates travel time to use of the proposed facility. Where existing empirical research is inadequate or not available then the travel time is selected using a reasonable estimate of an experienced analyst. Travel time is objective unlike other methods used such as basing market area on psychological characteristics of the population. This latter method has no rules about where the market will begin and end.
- Using travel time to define a market area is most reliable when the business or service draws local patronage. For example, assisted living facilities are typically selected that are either close to the disabled's home if the spouse remains active or close to the home of a relative.
- FIG. 1 shows a block diagram of a processor configured in a manner consistent with the present invention.
- a processor 100 receives input from an input device 105 and displays information on a display 110 .
- Memory 120 includes a module with geographic information system program (GIS) 122 , a module with travel time program 126 , a processing module 127 , a module with demand model program 128 , and a module with supply model program 129 .
- the module with demand model program 128 includes, for the area under consideration, empirical relationships or assumptions concerning the relationships between demographic demand and travel time, such as the decay of demand with increased travel time from the site.
- the module with supply model program 129 includes, if available for the area under consideration, empirical relationships or assumptions concerning the relationships between supply of competition and travel time.
- Data in the geographical information database 124 includes political boundaries, census unit boundaries, natural topographical boundaries including rivers and roads.
- the database of demographic information 130 includes supply data 132 , demand data 134 , and a census database 136 .
- Supply data 132 is data related to competition such as other stores in an area.
- Demand data are demographic information providing information on the population in an area.
- Census database 136 includes information relating the census units to demand data 134 and supply data 132 .
- FIG. 2 is a flowchart showing the initial steps 200 taken by an analyst to a market analysis.
- a market analyst using input device 105 , must select a type of market study (step 210 ).
- a market analyst may select one of two types of market analysis—a point feasibility study or an area feasibility study (step 220 ).
- the point feasibility study determines the market analysis for a site in a specific location.
- An area analysis study is used to try to determine the best site locations in a general area.
- An analyst performs an area study when an investor wishes to find what point within a geographical area is best for business.
- An area study using the present invention involves analyzing every possible point in an area using the point analysis. In one implementation some points on the map, such as those where bodies of water lay or a large factory exists, will not be analyzed.
- an area analysis allows the analyst to select a geographical area and to iterate a point analysis for almost every point within that area equal to the number of demographic units (e.g. block groups, census tracts), covering the area completely.
- demographic units e.g. block groups, census tracts
- a point feasibility is selected, the analyst must select a specific geographical point (step 230 ). For an area analysis the analyst must select a geographical area and processing continues at B in FIG. 9 (step 240 ). The point feasibility study determines the market analysis for a site in a specific location.
- step 310 the analyst traces an area around the geographical point that encompasses any potential market area using knowledge known to the analysts such as type of neighborhoods around the point.
- the analyst also has access to many other sources of data including information obtained from the Bureau of the Census and other sources.
- GIS programs such as that in GIS module 122 , create a map for the traced area around the geographical point (step 320 ).
- the analyst may specify the different attributes of the displayed map, for example, the units that the map uses in terms of scale (centimeters per mile) or what natural formations the user wishes to have included.
- the user may select to display streets, landmarks, county boundaries, towns, Census boundaries, and many different types of units.
- the GIS program 122 generates the map by reading data from geographic database 124 that holds map information.
- the analyst selects constraints to define the supply model module 129 and demand model module 128 (step 330 ).
- the analyst uses a model that defines the weight that will be given to different information. For example, based on available empirical evidence for a certain service, the customer base may exclude anyone under 20 and give no weight to data on those under 20.
- the most likely customers for a certain business may be aged 30 to 40, in which case the demand model will weigh more highly people in that age group and a greater percentage of those in the age group of 30 to 40 will be presumed to be customers. Similarly, a smaller percentage of those in the age group 40 to 50 will be presumed to be customers.
- Another constraint in the models may be assigning different percentages for each travel time trace around the site based on the closeness of the trace to the site.
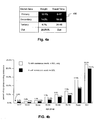
- FIG. 4 a shows an example display 400 of different weights assigned to different travel traces.
- the demand is determined by adding up the number of people, the demand model defines to be of interest.
- the supply is determined by using gathered information about other suppliers in the area.
- the net demand is the projected demand in the area minus-the supply in that area. If the net demand is positive, with the demand greater than supply, the project may be desirable. If the demand is negative, with demand less than the current supply, then the project is not desirable.
- FIG. 4 b shows a chart listing various age groups and the percentage of people in those groups requiring two different levels of care.
- Another criterion for the demand model may be related to housing values.
- Population groups may be weighted differently based on the median home values in the block group.
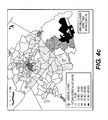
- FIG. 4 c shows an example of a map of census block groups with different shadings provided based on the median house value.
- the model may weight more highly the population in higher priced home value block groups. Therefore, this example model has age constraints, disability constraints and housing value constraints.
- the calculation of demand will adjust the weight given to a population group based on age, disability and housing values.
- Processing module 127 prompts the analyst to select a maximum travel time that encompasses the traced area (step 340 ).
- FIG. 5 a shows a display of a map 500 with the selected geographical point A at the center and a time travel trace 510 around the point.
- the selected maximum travel time is usually in minutes, for example, a trace representing a 20 minute trip from the point may be a likely market area depending on the business.
- Travel time program module 126 maps the maximum travel time trace from the site and maps decreasing intervals until the site is reached (step 350 ). The result is concentric traces around the site. Another example of an interval trace would contain a trace for every few minutes of additional travel time.
- FIG. 5 a shows a display of a map 500 with the selected geographical point A at the center and a time travel trace 510 around the point.
- the selected maximum travel time is usually in minutes, for example, a trace representing a 20 minute trip from the point may be a likely market area depending on the business.
- Travel time program module 126 maps the
- FIG. 5 b shows a map 500 with three travel time traces 510 , 520 , and 530 at different intervals from the site.
- FIG. 5 c shows the first travel trace closest to the site representing a 17 minute travel time around the site.
- FIG. 5 d shows a second travel trace representing travel times between 17 and 30 minutes around the site.
- FIG. 5 e shows a third travel trace representing travel times between 30 and 45 minutes around the site.
- the travel time program module 128 uses available travel time databases and generally operates as follows.
- a database of street networks such as the Bureau of the Census' Tiger Street Files, has information on travel rates on different roads.
- the street file is converted into a network of nodes (intersections) and connections between the nodes (streets).
- Each line segment (street) has associated data about the class of road and other information such as one-way street or no left turns.
- the class of road determines the average speed or rate (R) to be used and the length of the line segment defines a distance (D).
- the time to travel over a line segment is found by dividing distance (D) by the rate (R).
- the program 128 solves the network by following every possible path front the geographical point selected and sums the travel times for each segment until the travel time selected is reached at a point on the map. The resulting points around the selected point form an irregular trace of the market area.
- Travel time program module 126 displays a map having typical map information such as rivers and roads using data in the geographic database 125 for the traced area (step 610 ).
- the map also shows the concentric travel time traces.
- the analyst must-now select a type of census boundary to be used in the market analysis such as a block group, census tract, or county lines (step 620 ). For simplicity the specific example used throughout this application will assume that the analyst selects block groups as the unit of interest.
- Next GIS module 122 loads and displays the census boundary type on the map area within the maximum travel time (step 630 ).
- FIG. 7 shows a map display 700 with block groups inserted.
- Processing module 127 creates a market area table with an entry for each census unit displayed (step 640 ). Columns are included for each variable in the supply and demand models and data corresponding to the variables is copied from the demographic information database 130 .
- FIG. 8 shows a flowchart 800 with additional steps for analyzing a market consistent with the present invention.
- the analyst must now select which block groups to include in the market study. For example, some block groups may only be partially within the maximum travel time, therefore the analyst must decide how to select which groups to include in the analysis and the weight to be provided to each group.
- block group 710 is a group only partially within the travel time trace 510 .
- the analyst may select a rule to choose block groups (step 810 ).
- One example rule is to determine the centroid of a block group and if the centroid is within the travel time trace include the entire block group in the analysis, otherwise do not.
- Processing module 127 uses the identified rule to select the appropriate census units to be counted (step 820 ).
- the market area table created by the processing module 127 is sorted to separate the selected and non-selected block groups (step 830 ).
- block group 710 has a center that is not within the travel trace 510 , this block group is not selected using the example rule.
- Processing module 127 sums the column data for each of the rows selected (step 840 ) and stores the same (step 850 ). Each column corresponds to a variable in the demand or supply model. The summed results for a column is the total value for the associated variable.
- Entry point G shown above step 830 is where processing begins for additional traces of market area to be studied. Each travel time area trace may be successively processed. Therefore, after summing the columns for a particular market area, if results for shorter travel time traces exist, the current summed results are added to the previously obtained summed results (step 860 ).
- the demand or supply model may require that before summing results from different iterations, each iteration's trace be provided a different weighted value, the weights being empirically based when possible. Therefore, the summed value of the supply or demand components for a trace may first be multiplied by a weighting factor reflecting that trace's closeness to the business site.
- FIG. 9 shows a flowchart 900 for further processing market analysis according to the present invention.
- Processing module 127 determines whether the demand and supply models require additional iterations for processing additional traces of travel time (step 920 ). If so, processing repeats starting at step 830 in FIG. 8. Otherwise, the final summed results are displayed (step 930 ).
- the market estimate of supply and demand is determined (step 940 ). This estimate may be based on calculations of the market and demand supply models or may be input by an analyst reviewing the displayed summed column data. The estimated supply is subtracted from the demand to obtain the net demand (step 950 ). The point feasibility study is complete (step 960 ).
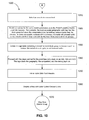
- FIG. 10 shows a flowchart 1000 that includes the steps for an area feasibility study.
- an area feasibility study is performed by selecting rule that defines one point within each of the census or administrative boundaries such as block group.
- the analyst selects a geographical area to be researched (step 1010 ).
- the analyst must select a unit such as a block group or some other boundary to use in the analysis (step 1020 ).
- each unit within the selected area is given a row in a newly created storage table containing a record for each unit, such as a block group (step 1030 ).
- the point feasibility study is repeated for all possible points within the area (step 1040 ).
- Processing module 127 fills in the table with the results of the point studies for each census unit as the point studies are performed (step 1050 ). Processing module 127 uses display 110 to display a map with color coded filling to show the different demand levels calculated for each census unit (step 1060 ). The market area analysis is the complete (step 1070 ).
Abstract
A market analysis system uses travel time to define a relevant market area. A map is generated using stored geographical map information around a selected geographical point or area, and a travel time around the geographical point or area is selected. A trace is formed on the map around the geographical point within the travel time using travel time data, and market information is gathered from a database for the defined geographical area.
Description
- This application is based on a U.S. provisional application Serial No. 60/049,448 filed Jun. 12, 1997.
- 1. Field of the Invention
- This invention generally relates to a system for use in market analysis. More particularly, the system relates to using geographical map databases and geographical travel time information to determine a demand and supply for a market area.
- 2. Description of the Related Art
- Before setting up a new business or buying an existing business, an entrepreneur wants to know the potential profitability of the business. To determine profitability, the net demand for the product or service must be determined. One important factor in determining net demand is the location of the business and the defined market area. Using the defined market area a supply and demand are determined. The net demand is found by subtracting existing supply from demand in the defined market area.
- Market studies are performed in order to identify the supply and demand for a site in an area. This process may be carried out in many different ways because of differing definitions of the market area of interest. The market area of interest is the area in which customers reside and the area in which competitors are likely to be located.
- Market analysts determine supply information by researching an area and finding out information such as the number-and types of competitor sites. Generally, market analysts look at many different demographic components to determine demand. For example, one component of demographic demand for an assisted living home may be that a certain percentage of those aged 65 to 75 in the area who have incomes over $25,000 will enter the proposed assisted living home. Based on the number of people in the age group 65-75, one may estimate the number of people and dollars that will be spent at the assisted living home by this age group. An accumulation of these data for each age group estimates gross revenue for the assisted living home.
- One source of information about the characteristics of people in an area is the U.S. Bureau of Census, which counts people and keeps record of the number of people living in a defined area along with other identification data. The Census Bureau accumulates this information by house and by individual but for privacy reasons only releases information in groups. The smallest group normally released is a block group. A block group is about 200 households. A group of four to six block groups is called a census tract. A census tract tends to be smaller than a zipcode and is commonly used to aggregate information about an area. The census bureau maintains this information in databases that may be purchased or accessed by the public. These databases include lists of block groups and demographic information associated with the block groups.
- Another source of information needed is geographical information that links an area to the census information. Geographic information systems exist that include typical map data such as geographical features, roads, and landmarks as well as the boundaries for block groups. The geographical linear features, such as roads or geographic boundaries, are stored as polylines. The geographical area features, such as block groups, census tracts, and counties, are stored as polygons enclosed by polylines. The two are stored in a table together with census identifying data, which allows the geographical areas to be tied to demographic characteristics in the census databases.
- One type of study performed by a market analyst is a point study. A point study is performed when an investor wishes to know the demand for a business at a particular site. To calculate demand for a business at a geographical point, an analyst must define a market area surrounding that point for the given business. Typically an analyst will define more than one market area, such as a primary and secondary market area. One simple method an analyst may use is to plot the site on a map and draw a circle around of the site of a given radius. The first radius selection of, for example, ten miles could be the primary market area, and a second selection of, for example, the next ten miles could be the secondary market area.
- Previously, a market analyst would select some section of the map and assume that this is the market area. Often, a junior member of the analyst's firm goes out into a community and talks to the people of interest and uses the gathered information to define a market area. Then, to determine demand, a market analyst would calculate the number of potential purchasers in that area and the amount that these potential purchasers are expected to spend using the census information, to determine supply, the analyst would look at other suppliers in the market area. Using both the supply and demand information, a net demand can be determined. There are no set standards of how the initial market area is selected or which census tracts or block groups are included in that market area. The results may be easily manipulated by simply redefining the market area, thus greatly reducing the legitimacy of such studies because the results are not replicable by another analyst with the same skills and background.
- A system is needed that standardizes the selection of a market area and allows for reproducible studies.
- Systems and methods consistent with the principles of the present invention address the need for standardization of market selection by defining a market area based on travel time from the site.
- A system and method consistent with the principles of the present invention selects a primary and a secondary market area based on travel time. More than two market areas may also be selected. In addition block groups are accepted as being within the market area based on certain rules, thereby standardizing their selection.
- Systems and methods consistent with the present invention generate a map using stored geographical information. A geographical point or area is selected from the map for analysis. A travel time around the geographical point is selected. The geographical area around the geographical point within the travel time is defined using data holding travel time information. Market information stored in a database is gathered for the defined geographical area from a memory location. Demand is computed from the demographic groups in each travel-time-defined area and weighted according to the model used by the analyst. Supply of competition is computed by surveying the competition and plotting each on the map, weighing the results by travel time and other factors according to the model used by the analyst. The final result, net demand, is the difference between demand and supply.
- The accompanying drawings, which are incorporated in and constitute a part of this specification, illustrate an embodiment of the invention and, together with the description, explain the objects, advantages, and principles of the invention. In the drawings:
- FIG. 1 is an overall diagram of a system for implementing the present invention;
- FIG. 2 is a flow chart showing the steps for selecting a type of market analysis;
- FIG. 3 is a flow chart showing the steps for performing market analysis;
- FIGS. 4 a-4 c are example display screens showing information related to a market demand model;
- FIGS. 5 a-5 e are example display screens showing a map and associate travel time traces;
- FIG. 6 is a flowchart showing additional steps for performing market analysis by using demographic data;
- FIG. 7 is a sample screen display of a map with block groups;
- FIG. 8 is a flowchart showing additional steps for performing market analysis including summing demographic data;
- FIG. 9 is a flowchart showing additional steps for performing market analysis including calculating supply and demand; and
- FIG. 10 is a flowchart showing the steps for an area feasibility study.
- The following detailed description refers to the accompanying drawings in which the same reference numbers in different drawings identify the same or similar elements. However, the following description does not limit the invention. Instead, the scope of the invention is defined by the appended claims and equivalents.
- The present invention provides a way of defining the market area that may be repeated by another analyst which allows for a standard in the industry. Instead of using miles around a point which ignores barriers like a river or using psychological boundaries, which are not replicable, the present invention uses travel time. A database contains the travel time traces from the proposed site in the geographical area under study.
- The analyst selects travel times based on empirical research that relates travel time to use of the proposed facility. Where existing empirical research is inadequate or not available then the travel time is selected using a reasonable estimate of an experienced analyst. Travel time is objective unlike other methods used such as basing market area on psychological characteristics of the population. This latter method has no rules about where the market will begin and end.
- Using travel time to define a market area is most reliable when the business or service draws local patronage. For example, assisted living facilities are typically selected that are either close to the disabled's home if the spouse remains active or close to the home of a relative.
- FIG. 1 shows a block diagram of a processor configured in a manner consistent with the present invention. A
processor 100 receives input from aninput device 105 and displays information on adisplay 110.Memory 120 includes a module with geographic information system program (GIS) 122, a module withtravel time program 126, aprocessing module 127, a module withdemand model program 128, and a module withsupply model program 129. The module withdemand model program 128 includes, for the area under consideration, empirical relationships or assumptions concerning the relationships between demographic demand and travel time, such as the decay of demand with increased travel time from the site. The module withsupply model program 129 includes, if available for the area under consideration, empirical relationships or assumptions concerning the relationships between supply of competition and travel time. - Data in the
geographical information database 124, includes political boundaries, census unit boundaries, natural topographical boundaries including rivers and roads. The database ofdemographic information 130 includessupply data 132,demand data 134, and acensus database 136.Supply data 132 is data related to competition such as other stores in an area. Demand data are demographic information providing information on the population in an area.Census database 136 includes information relating the census units to demanddata 134 andsupply data 132. - FIG. 2 is a flowchart showing the
initial steps 200 taken by an analyst to a market analysis. First, a market analyst, usinginput device 105, must select a type of market study (step 210). Generally, a market analyst may select one of two types of market analysis—a point feasibility study or an area feasibility study (step 220). The point feasibility study determines the market analysis for a site in a specific location. - An area analysis study is used to try to determine the best site locations in a general area. An analyst performs an area study when an investor wishes to find what point within a geographical area is best for business. In the prior art, only a few points were processed as it was time consuming to analyze each point. An area study using the present invention, involves analyzing every possible point in an area using the point analysis. In one implementation some points on the map, such as those where bodies of water lay or a large factory exists, will not be analyzed. Generally, in the present invention, an area analysis allows the analyst to select a geographical area and to iterate a point analysis for almost every point within that area equal to the number of demographic units (e.g. block groups, census tracts), covering the area completely.
- If a point feasibility is selected, the analyst must select a specific geographical point (step 230). For an area analysis the analyst must select a geographical area and processing continues at B in FIG. 9 (step 240). The point feasibility study determines the market analysis for a site in a specific location.
- If point analysis is selected processing continues as shown in
steps 300 in FIG. 3. First, the analyst traces an area around the geographical point that encompasses any potential market area using knowledge known to the analysts such as type of neighborhoods around the point (step 310). The analyst also has access to many other sources of data including information obtained from the Bureau of the Census and other sources. GIS programs, such as that inGIS module 122, create a map for the traced area around the geographical point (step 320). The analyst may specify the different attributes of the displayed map, for example, the units that the map uses in terms of scale (centimeters per mile) or what natural formations the user wishes to have included. The user may select to display streets, landmarks, county boundaries, towns, Census boundaries, and many different types of units. TheGIS program 122 generates the map by reading data fromgeographic database 124 that holds map information. - The analyst selects constraints to define the
supply model module 129 and demand model module 128 (step 330). The analyst uses a model that defines the weight that will be given to different information. For example, based on available empirical evidence for a certain service, the customer base may exclude anyone under 20 and give no weight to data on those under 20. On the other hand, the most likely customers for a certain business may be aged 30 to 40, in which case the demand model will weigh more highly people in that age group and a greater percentage of those in the age group of 30 to 40 will be presumed to be customers. Similarly, a smaller percentage of those in the age group 40 to 50 will be presumed to be customers. Another constraint in the models may be assigning different percentages for each travel time trace around the site based on the closeness of the trace to the site. - FIG. 4 a shows an
example display 400 of different weights assigned to different travel traces. The closer to the site a census unit is, the more likely customers will come from that census unit. The demand is determined by adding up the number of people, the demand model defines to be of interest. The supply is determined by using gathered information about other suppliers in the area. The net demand is the projected demand in the area minus-the supply in that area. If the net demand is positive, with the demand greater than supply, the project may be desirable. If the demand is negative, with demand less than the current supply, then the project is not desirable. - One example of a demand model is for assisted living homes. One component of the demand model is the percentage of people in given age groups that require care. FIG. 4 b shows a chart listing various age groups and the percentage of people in those groups requiring two different levels of care.
- Another criterion for the demand model may be related to housing values. Population groups may be weighted differently based on the median home values in the block group. FIG. 4 c shows an example of a map of census block groups with different shadings provided based on the median house value. The model may weight more highly the population in higher priced home value block groups. Therefore, this example model has age constraints, disability constraints and housing value constraints. The calculation of demand will adjust the weight given to a population group based on age, disability and housing values.
-
Processing module 127 prompts the analyst to select a maximum travel time that encompasses the traced area (step 340). FIG. 5a shows a display of amap 500 with the selected geographical point A at the center and atime travel trace 510 around the point. The selected maximum travel time is usually in minutes, for example, a trace representing a 20 minute trip from the point may be a likely market area depending on the business. Traveltime program module 126 maps the maximum travel time trace from the site and maps decreasing intervals until the site is reached (step 350). The result is concentric traces around the site. Another example of an interval trace would contain a trace for every few minutes of additional travel time. FIG. 5b shows amap 500 with three travel time traces 510, 520, and 530 at different intervals from the site. FIG. 5c shows the first travel trace closest to the site representing a 17 minute travel time around the site. FIG. 5d shows a second travel trace representing travel times between 17 and 30 minutes around the site. FIG. 5e shows a third travel trace representing travel times between 30 and 45 minutes around the site. - The travel
time program module 128 uses available travel time databases and generally operates as follows. A database of street networks, such as the Bureau of the Census' Tiger Street Files, has information on travel rates on different roads. The street file is converted into a network of nodes (intersections) and connections between the nodes (streets). Each line segment (street) has associated data about the class of road and other information such as one-way street or no left turns. The class of road determines the average speed or rate (R) to be used and the length of the line segment defines a distance (D). The time to travel over a line segment is found by dividing distance (D) by the rate (R). Theprogram 128 solves the network by following every possible path front the geographical point selected and sums the travel times for each segment until the travel time selected is reached at a point on the map. The resulting points around the selected point form an irregular trace of the market area. - Processing continues in FIG. 6 which shows
flowchart 600 with additional processing steps. Traveltime program module 126 displays a map having typical map information such as rivers and roads using data in the geographic database 125 for the traced area (step 610). The map also shows the concentric travel time traces. The analyst must-now select a type of census boundary to be used in the market analysis such as a block group, census tract, or county lines (step 620). For simplicity the specific example used throughout this application will assume that the analyst selects block groups as the unit of interest.Next GIS module 122 loads and displays the census boundary type on the map area within the maximum travel time (step 630). FIG. 7 shows amap display 700 with block groups inserted. -
Processing module 127 creates a market area table with an entry for each census unit displayed (step 640). Columns are included for each variable in the supply and demand models and data corresponding to the variables is copied from thedemographic information database 130. - FIG. 8 shows a
flowchart 800 with additional steps for analyzing a market consistent with the present invention. The analyst must now select which block groups to include in the market study. For example, some block groups may only be partially within the maximum travel time, therefore the analyst must decide how to select which groups to include in the analysis and the weight to be provided to each group. For example in FIG. 7,block group 710 is a group only partially within thetravel time trace 510. The analyst may select a rule to choose block groups (step 810). One example rule is to determine the centroid of a block group and if the centroid is within the travel time trace include the entire block group in the analysis, otherwise do not.Processing module 127 uses the identified rule to select the appropriate census units to be counted (step 820). The market area table created by theprocessing module 127 is sorted to separate the selected and non-selected block groups (step 830). In FIG. 7,block group 710 has a center that is not within thetravel trace 510, this block group is not selected using the example rule.Processing module 127 sums the column data for each of the rows selected (step 840) and stores the same (step 850). Each column corresponds to a variable in the demand or supply model. The summed results for a column is the total value for the associated variable. - Entry point G shown above
step 830 is where processing begins for additional traces of market area to be studied. Each travel time area trace may be successively processed. Therefore, after summing the columns for a particular market area, if results for shorter travel time traces exist, the current summed results are added to the previously obtained summed results (step 860). The demand or supply model may require that before summing results from different iterations, each iteration's trace be provided a different weighted value, the weights being empirically based when possible. Therefore, the summed value of the supply or demand components for a trace may first be multiplied by a weighting factor reflecting that trace's closeness to the business site. - FIG. 9 shows a
flowchart 900 for further processing market analysis according to the present invention.Processing module 127 determines whether the demand and supply models require additional iterations for processing additional traces of travel time (step 920). If so, processing repeats starting atstep 830 in FIG. 8. Otherwise, the final summed results are displayed (step 930). The market estimate of supply and demand is determined (step 940). This estimate may be based on calculations of the market and demand supply models or may be input by an analyst reviewing the displayed summed column data. The estimated supply is subtracted from the demand to obtain the net demand (step 950). The point feasibility study is complete (step 960). - FIG. 10 shows a
flowchart 1000 that includes the steps for an area feasibility study. As previously discussed, an area feasibility study is performed by selecting rule that defines one point within each of the census or administrative boundaries such as block group. First, the analyst selects a geographical area to be researched (step 1010). The analyst must select a unit such as a block group or some other boundary to use in the analysis (step 1020). Then, each unit within the selected area is given a row in a newly created storage table containing a record for each unit, such as a block group (step 1030). The point feasibility study is repeated for all possible points within the area (step 1040).Processing module 127 fills in the table with the results of the point studies for each census unit as the point studies are performed (step 1050).Processing module 127 usesdisplay 110 to display a map with color coded filling to show the different demand levels calculated for each census unit (step 1060). The market area analysis is the complete (step 1070). - The foregoing description of preferred embodiments of the present invention provides illustration and description, but is not intended to be exhaustive or to limit the invention to the precise form disclosed. Modifications and variations are possible in light of the above teachings or may be acquired from practice of the invention. The scope of the invention is defined by the claims and their equivalents.
- For example, although systems and methods consistent with the present invention are described as using block groups as the defined unit of measurement, one skilled in the art will appreciate that the present invention can be practiced using other units of measurement or definitions of map areas. Also, although systems and methods consistent with the present invention are described as using a primary and secondary market travel trace time, one skilled in the art will appreciate that the present invention can be practiced using fewer or greater numbers of travel time traces.
Claims (24)
1. A system for preparing-a market analysis, comprising:
means for storing geographical map information;
means for receiving a selection of a geographical point from the map information;
means for receiving a selection of a travel time;
means for defining a geographical area around the geographical point within the travel time; and
means for gathering market information about the defined geographical area from a memory.
2. The system according to claim 1 , wherein the means for receiving a travel time includes:
means for receiving a primary and a secondary travel time as boundaries of an area of interest.
3. The system according to claim 2 , wherein the means for defining includes:
means for defining a secondary geographical area around the geographical point within the secondary travel time and outside of the primary travel time; and
means for defining a primary geographical area around the geographical point within the primary travel time.
4. The system according to claim 3 , wherein the means for gathering includes:
means for gathering marketing information about the secondary geographical area; and
means for gathering marketing information about the primary geographical area.
5. A system for gathering market analysis information, comprising:
a geographical database for storing geographical map information divided into units;
a database for storing empirical information related to the units;
means for receiving a selection of a geographical point in the geographical database;
means for receiving a selection of a travel time;
means for defining a geographical area around the selected geographical point within the designated travel time using the geographical database;
means for comparing the defined geographical area to the units;
means for selecting units based on the comparison; and
means for reading out empirical data stored in the database of empirical information for each selected unit for use in market analysis.
6. The system according to claim 5 further including:
means for calculating a centroid of each one of the units; and
means for selecting units that have centroids within the defined geographical area.
7. The system according to claim 5 , wherein the empirical database includes supplier information, and wherein the system further comprises
means for determining which suppliers are within the defined geographical area using the empirical database;
means for processing supply data for each unit in the geographical area based on the suppliers; and
means for comparing supply data and demand data to determine market feasibility of a new supplier at the geographical point.
8. The system according to claim 5 , wherein the means for receiving a selection of a geographical point includes
means for selecting a geographical area to evaluate;
means for determining a centroid of the geographical area; and
means for selecting the centroid as the geographical point.
9. A system for preparing a market analysis, comprising:
a geographical database for storing geographical map information divided into units;
a database for storing empirical information related to the units;
means for receiving a selection of a geographical point from the geographical database;
means for selecting a primary travel time;
means for selecting a secondary travel time;
means for defining a first geographical area around the selected geographical point within the designated primary travel time using the geographical database;
means for defining a second geographical area around the selected geographical point within the designated secondary travel time using the geographical database;
means for comparing the defined first and second geographical areas to the units in the database of empirical information;
means for calculating a centroid of each one of the units that is entirely or partially within one of the defined first and second geographical areas;
means for selecting a unit as a primary unit when a centroid of the unit is within the defined first geographical area;
means for selecting a unit as a secondary bock unit when the centroid of the unit is within the defined secondary geographical area; and
means for reading out empirical data stored in the database of empirical information for each selected primary and secondary unit for use in the market analysis.
10. The system according to claim 9 , wherein the empirical database includes demand data, and wherein the system further comprises
means for accumulating the demand data for each primary unit and fractional shares of the demand data for secondary units.
11. The system according to claim 9 , wherein the empirical database further includes supplier information, and wherein the system further comprises:
means for determining from the empirical database which suppliers are within the defined primary and secondary geographical areas;
means for inserting any additional suppliers that are known to be in the geographical areas; and
means for processing supply data for each unit within the primary and secondary geographical areas based on the suppliers within the primary and secondary geographical areas.
12. The system according to claim 11 , wherein the means for processing supply data includes:
means for accumulating supply data for each supplier in the primary geographical area;
means for accumulating a fractional share of the supply data for each supplier in the secondary geographical area;
means for comparing the supply data and demand data to determine the market feasibility of a new supplier at the geographical point.
13. The system according to claim 9 , wherein the means for selecting a geographical point includes
means for selecting a geographical area to evaluate;
means for determining a centroid of the geographical area; and
means for selecting the centroid as the geographical point.
14. A method for automatically preparing a market analysis, comprising the steps, performed by a data processor, of:
storing geographical map information in a database;
receiving a selection of a geographical point from the map information from a user input;
receiving a selection of a travel time from a user input;
defining a geographical area around the geographical point within the travel time; and
gathering market information about the defined geographical area.
15. The method according to claim 14 , wherein the step of selecting a travel time includes the step of
selecting a primary and a secondary travel time as boundaries of an area of interest.
16. The method according to claim 15 , wherein the step of defining includes the substep of:
defining the geographical area within the secondary and not within the primary travel time; and
defining the geographical area within the primary travel time.
17. The method according to claim 16 , wherein the step of gathering marketing information includes the substep of
gathering marketing information about the primary geographical area; and
gathering marketing information about the secondary geographical area.
18. A method for automatically preparing a market analysis, comprising the steps, performed by a data processor, of:
storing geographical map information in a geographical database;
storing empirical information for units in a empirical database;
receiving a selection of a geographical point from the geographical database;
receiving a selection of a primary travel time from a user input;
receiving a selection of a secondary travel time;
defining a first geographical area around the selected geographical point within the designated primary travel time using the geographical database;
defining a second geographical area around the selected geographical point within the designated secondary travel time using the geographical database;
comparing the defined first and second geographical areas to the units in the empirical database;
calculating a centroid of each one of the units that is entirely or partially within one of the defined first and second geographical areas;
selecting those units having centroids within the defined first and second geographical areas;
selecting a unit as a secondary bock unit when the centroid of the unit is within the defined secondary geographical area; and
reading out empirical data stored in the database of empirical information for each selected primary and secondary unit for use in the market analysis.
19. The method according to claim 18 , wherein the empirical database includes demand data, and wherein the method further comprises the step of
accumulating the demand data for each primary unit and fractional shares of the demand data for secondary units.
20. The method according to claim 18 , wherein the empirical database further includes supplier information, and wherein the method further comprises the steps of:
determining from the empirical database which suppliers are within the defined primary and secondary geographical areas; and
processing supply data for each unit within the primary and secondary geographical areas based on the suppliers within the primary and secondary geographical areas.
21. The method according to claim 20 , wherein the step of processing supply data includes the steps of
accumulating supply data for each supplier in the primary geographical area and for accumulating a fractional share of the supply data for each supplier in the secondary geographical area; and
comparing the supply data and demand data to determine the market feasibility of a new supplier at the geographical point.
22. A system for preparing a market analysis, comprising:
means for storing geographical map information;
means for receiving a selection of a geographical area from the map information;
means for receiving a selection of a travel time;
means for defining a market area around points within the geographical area; and
means for gathering market information about the defined geographical areas.
23. A method for preparing a market analysis, comprising:
storing geographical map information;
receiving a selection of a geographical area from the map information;
receiving a selection of a travel time;
defining a market area around points within the geographical area; and
gathering market information about the defined geographical areas.
24. A data processing system comprising:
a memory including program instructions; and
a processor configured to use the program instructions for:
storing geographical map information;
receiving a selection of a geographical area from the map information;
receiving a selection of a travel time; and
defining a market area around points within the geographical area; and
gathering market information about the defined geographical areas.
Priority Applications (3)
| Application Number | Priority Date | Filing Date | Title |
|---|---|---|---|
| US10/410,554 US7043445B2 (en) | 1997-06-12 | 2003-04-10 | Market determination system |
| US11/110,884 US7516085B2 (en) | 1997-06-12 | 2005-04-21 | Market determination system |
| US12/222,904 US20080313022A1 (en) | 1997-06-12 | 2008-08-19 | Market determination system |
Applications Claiming Priority (3)
| Application Number | Priority Date | Filing Date | Title |
|---|---|---|---|
| US4944897P | 1997-06-12 | 1997-06-12 | |
| US09/095,802 US6604083B1 (en) | 1997-06-12 | 1998-06-11 | Market determination based on travel time bands |
| US10/410,554 US7043445B2 (en) | 1997-06-12 | 2003-04-10 | Market determination system |
Related Parent Applications (1)
| Application Number | Title | Priority Date | Filing Date |
|---|---|---|---|
| US09/095,802 Continuation US6604083B1 (en) | 1997-06-12 | 1998-06-11 | Market determination based on travel time bands |
Related Child Applications (1)
| Application Number | Title | Priority Date | Filing Date |
|---|---|---|---|
| US11/110,884 Continuation US7516085B2 (en) | 1997-06-12 | 2005-04-21 | Market determination system |
Publications (2)
| Publication Number | Publication Date |
|---|---|
| US20030191683A1 true US20030191683A1 (en) | 2003-10-09 |
| US7043445B2 US7043445B2 (en) | 2006-05-09 |
Family
ID=27624711
Family Applications (4)
| Application Number | Title | Priority Date | Filing Date |
|---|---|---|---|
| US09/095,802 Expired - Lifetime US6604083B1 (en) | 1997-06-12 | 1998-06-11 | Market determination based on travel time bands |
| US10/410,554 Expired - Lifetime US7043445B2 (en) | 1997-06-12 | 2003-04-10 | Market determination system |
| US11/110,884 Expired - Fee Related US7516085B2 (en) | 1997-06-12 | 2005-04-21 | Market determination system |
| US12/222,904 Abandoned US20080313022A1 (en) | 1997-06-12 | 2008-08-19 | Market determination system |
Family Applications Before (1)
| Application Number | Title | Priority Date | Filing Date |
|---|---|---|---|
| US09/095,802 Expired - Lifetime US6604083B1 (en) | 1997-06-12 | 1998-06-11 | Market determination based on travel time bands |
Family Applications After (2)
| Application Number | Title | Priority Date | Filing Date |
|---|---|---|---|
| US11/110,884 Expired - Fee Related US7516085B2 (en) | 1997-06-12 | 2005-04-21 | Market determination system |
| US12/222,904 Abandoned US20080313022A1 (en) | 1997-06-12 | 2008-08-19 | Market determination system |
Country Status (1)
| Country | Link |
|---|---|
| US (4) | US6604083B1 (en) |
Cited By (14)
| Publication number | Priority date | Publication date | Assignee | Title |
|---|---|---|---|---|
| US20020046070A1 (en) * | 2000-10-06 | 2002-04-18 | Kuniyoshi Konishi | Management system for barber and beauty shops |
| US20080306985A1 (en) * | 2007-06-11 | 2008-12-11 | Lucid Design Group, Llc | Collecting, sharing, comparing, and displaying resource usage data |
| US20090070196A1 (en) * | 2007-09-12 | 2009-03-12 | Targus Information Corporation | System and method for developing small geographic area population, household, and demographic count estimates and projections using a master address file |
| US20090164294A1 (en) * | 2007-12-20 | 2009-06-25 | Ebay Inc. | Geographic demand distribution and forecast |
| US20100070342A1 (en) * | 2007-12-20 | 2010-03-18 | Ebay Inc. | Regional demand and supply comparison |
| US8332247B1 (en) * | 1997-06-12 | 2012-12-11 | G. William Bailey | Methods and systems for optimizing network travel costs |
| US8375068B1 (en) * | 2007-10-04 | 2013-02-12 | Lucid Design Group, Llc | Extensible framework and graphical user interface for sharing, comparing, and displaying resource usage data |
| WO2013115758A1 (en) * | 2012-02-01 | 2013-08-08 | Mapas Inteligentes, Llc | Geocoding points of interest and service route delivery and audit field performance and sales method and apparatus |
| US20140033120A1 (en) * | 2012-07-26 | 2014-01-30 | David BENTAL | System and methods for presenting market analyses using intuitive information presentation |
| JP2016076084A (en) * | 2014-10-06 | 2016-05-12 | 株式会社リンクコーポレーション | Living area designation assist system, program, and storage medium |
| US9958291B1 (en) | 2014-08-11 | 2018-05-01 | Abl Ip Holding Llc | Self-service connection, data collection, and automation of metering and building systems, controls, and devices |
| CN109657883A (en) * | 2019-01-28 | 2019-04-19 | 重庆邮电大学 | A kind of bank branches recommended method based on multi-source data driving |
| US10373099B1 (en) * | 2015-12-18 | 2019-08-06 | Palantir Technologies Inc. | Misalignment detection system for efficiently processing database-stored data and automatically generating misalignment information for display in interactive user interfaces |
| US10718632B1 (en) | 2014-08-11 | 2020-07-21 | Abl Ip Holding Llc | Self-service discovery, refinement, and execution of automated multi-system insights |
Families Citing this family (67)
| Publication number | Priority date | Publication date | Assignee | Title |
|---|---|---|---|---|
| US6604083B1 (en) * | 1997-06-12 | 2003-08-05 | G. William Bailey | Market determination based on travel time bands |
| US7412398B1 (en) * | 1997-06-12 | 2008-08-12 | Bailey G William | Method for analyzing net demand for a market area utilizing weighted bands |
| JPH1153378A (en) * | 1997-07-31 | 1999-02-26 | Honda Motor Co Ltd | Information retrieval device |
| US20020054082A1 (en) * | 1999-01-02 | 2002-05-09 | Karpf Ronald S. | System and method for providing accurate geocoding of responses to location questions in a computer assisted self interview |
| US8543456B2 (en) * | 2003-12-15 | 2013-09-24 | Ip Mining Corporation | Media targeting system and method |
| US20020116287A1 (en) * | 2000-10-23 | 2002-08-22 | Schubert Timothy D. | Multi-faceted, tier driven electronic commerce facilitator |
| US20020198760A1 (en) * | 2001-06-05 | 2002-12-26 | Carpenter John E. | Demographic data development and processing |
| US7089264B1 (en) | 2001-06-22 | 2006-08-08 | Navteq North America, Llc | Geographic database organization that facilitates location-based advertising |
| US7092964B1 (en) | 2001-06-22 | 2006-08-15 | Navteq North America, Llc | Method of collecting market research information |
| US6975999B2 (en) * | 2002-01-14 | 2005-12-13 | First Data Corporation | Methods and systems for managing business representative distributions |
| US8229766B2 (en) | 2004-07-30 | 2012-07-24 | Risk Management Solutions, Inc. | System and method for producing a flexible geographical grid |
| US7707050B2 (en) | 2004-03-11 | 2010-04-27 | Risk Management Solutions, Inc. | Systems and methods for determining concentrations of exposure |
| US7451041B2 (en) | 2005-05-06 | 2008-11-11 | Facet Technology Corporation | Network-based navigation system having virtual drive-thru advertisements integrated with actual imagery from along a physical route |
| US8892112B2 (en) | 2011-07-21 | 2014-11-18 | At&T Mobility Ii Llc | Selection of a radio access bearer resource based on radio access bearer resource historical information |
| US20090307263A1 (en) | 2008-06-06 | 2009-12-10 | Sense Networks, Inc. | System And Method Of Performing Location Analytics |
| EP2342662A4 (en) | 2008-09-09 | 2012-03-21 | Truecar Inc | System and method for calculating and displaying price distributions based on analysis of transactions |
| US20100121680A1 (en) * | 2008-09-09 | 2010-05-13 | Propel Biofuels, Inc. | Method and system for identifying installation sites of alternative fuel stations |
| US8612314B2 (en) | 2008-09-09 | 2013-12-17 | Truecar, Inc. | System and method for the utilization of pricing models in the aggregation, analysis, presentation and monetization of pricing data for vehicles and other commodities |
| US8655708B2 (en) * | 2008-12-19 | 2014-02-18 | The Toronto Dominion Bank | Systems and methods for generating and using trade areas associated with business branches based on correlated demographics |
| US8326319B2 (en) | 2009-01-23 | 2012-12-04 | At&T Mobility Ii Llc | Compensation of propagation delays of wireless signals |
| US20100217650A1 (en) * | 2009-02-24 | 2010-08-26 | Edwin Geoffrey Hartnell | System and method for providing market simulation/optimization |
| US8996307B2 (en) * | 2009-09-15 | 2015-03-31 | HERE Global B. V. | Navigation system and methods regarding disputed territories |
| US8341192B2 (en) * | 2009-09-15 | 2012-12-25 | Navteq B.V. | Navigation system and methods regarding disputed territories |
| US8224349B2 (en) | 2010-02-25 | 2012-07-17 | At&T Mobility Ii Llc | Timed fingerprint locating in wireless networks |
| US9053513B2 (en) | 2010-02-25 | 2015-06-09 | At&T Mobility Ii Llc | Fraud analysis for a location aware transaction |
| US9196157B2 (en) | 2010-02-25 | 2015-11-24 | AT&T Mobolity II LLC | Transportation analytics employing timed fingerprint location information |
| US9008684B2 (en) | 2010-02-25 | 2015-04-14 | At&T Mobility Ii Llc | Sharing timed fingerprint location information |
| US8254959B2 (en) | 2010-02-25 | 2012-08-28 | At&T Mobility Ii Llc | Timed fingerprint locating for idle-state user equipment in wireless networks |
| US8447328B2 (en) | 2010-08-27 | 2013-05-21 | At&T Mobility Ii Llc | Location estimation of a mobile device in a UMTS network |
| US9009629B2 (en) | 2010-12-01 | 2015-04-14 | At&T Mobility Ii Llc | Motion-based user interface feature subsets |
| US10296929B2 (en) | 2011-06-30 | 2019-05-21 | Truecar, Inc. | System, method and computer program product for geo-specific vehicle pricing |
| US8612410B2 (en) | 2011-06-30 | 2013-12-17 | At&T Mobility Ii Llc | Dynamic content selection through timed fingerprint location data |
| US9462497B2 (en) | 2011-07-01 | 2016-10-04 | At&T Mobility Ii Llc | Subscriber data analysis and graphical rendering |
| US8761799B2 (en) | 2011-07-21 | 2014-06-24 | At&T Mobility Ii Llc | Location analytics employing timed fingerprint location information |
| US8897802B2 (en) | 2011-07-21 | 2014-11-25 | At&T Mobility Ii Llc | Selection of a radio access technology resource based on radio access technology resource historical information |
| US9519043B2 (en) | 2011-07-21 | 2016-12-13 | At&T Mobility Ii Llc | Estimating network based locating error in wireless networks |
| US8860587B2 (en) | 2011-07-25 | 2014-10-14 | Christopher Andrew Nordstrom | Interfacing customers with mobile vendors |
| EP2710539A4 (en) | 2011-07-28 | 2015-01-14 | Truecar Inc | System and method for analysis and presentation of used vehicle pricing data |
| US8923134B2 (en) | 2011-08-29 | 2014-12-30 | At&T Mobility Ii Llc | Prioritizing network failure tickets using mobile location data |
| US8666390B2 (en) | 2011-08-29 | 2014-03-04 | At&T Mobility Ii Llc | Ticketing mobile call failures based on geolocated event data |
| US8762048B2 (en) * | 2011-10-28 | 2014-06-24 | At&T Mobility Ii Llc | Automatic travel time and routing determinations in a wireless network |
| US8909247B2 (en) | 2011-11-08 | 2014-12-09 | At&T Mobility Ii Llc | Location based sharing of a network access credential |
| US9026133B2 (en) | 2011-11-28 | 2015-05-05 | At&T Mobility Ii Llc | Handset agent calibration for timing based locating systems |
| US8970432B2 (en) | 2011-11-28 | 2015-03-03 | At&T Mobility Ii Llc | Femtocell calibration for timing based locating systems |
| US8745081B2 (en) * | 2012-03-13 | 2014-06-03 | Yahoo! Inc. | Personalization of news articles based on news sources |
| US8925104B2 (en) | 2012-04-13 | 2014-12-30 | At&T Mobility Ii Llc | Event driven permissive sharing of information |
| US8929827B2 (en) | 2012-06-04 | 2015-01-06 | At&T Mobility Ii Llc | Adaptive calibration of measurements for a wireless radio network |
| US9094929B2 (en) | 2012-06-12 | 2015-07-28 | At&T Mobility Ii Llc | Event tagging for mobile networks |
| US9046592B2 (en) | 2012-06-13 | 2015-06-02 | At&T Mobility Ii Llc | Timed fingerprint locating at user equipment |
| US9326263B2 (en) | 2012-06-13 | 2016-04-26 | At&T Mobility Ii Llc | Site location determination using crowd sourced propagation delay and location data |
| US8938258B2 (en) | 2012-06-14 | 2015-01-20 | At&T Mobility Ii Llc | Reference based location information for a wireless network |
| US8897805B2 (en) | 2012-06-15 | 2014-11-25 | At&T Intellectual Property I, L.P. | Geographic redundancy determination for time based location information in a wireless radio network |
| US9408174B2 (en) | 2012-06-19 | 2016-08-02 | At&T Mobility Ii Llc | Facilitation of timed fingerprint mobile device locating |
| US8892054B2 (en) | 2012-07-17 | 2014-11-18 | At&T Mobility Ii Llc | Facilitation of delay error correction in timing-based location systems |
| US9351223B2 (en) | 2012-07-25 | 2016-05-24 | At&T Mobility Ii Llc | Assignment of hierarchical cell structures employing geolocation techniques |
| US20140074553A1 (en) * | 2012-09-13 | 2014-03-13 | Truecar, Inc. | System and method for constructing spatially constrained industry-specific market areas |
| US10504159B2 (en) | 2013-01-29 | 2019-12-10 | Truecar, Inc. | Wholesale/trade-in pricing system, method and computer program product therefor |
| WO2015157584A1 (en) * | 2014-04-10 | 2015-10-15 | Fract, Inc. | Systems and methods for identifying a region of interest on a map |
| TWI557665B (en) * | 2014-11-11 | 2016-11-11 | Commerce Dev Res Inst | Target Business Area Strength Evaluation System and Method |
| US9351111B1 (en) | 2015-03-06 | 2016-05-24 | At&T Mobility Ii Llc | Access to mobile location related information |
| EP3322149B1 (en) * | 2016-11-10 | 2023-09-13 | Tata Consultancy Services Limited | Customized map generation with real time messages and locations from concurrent users |
| US11392971B1 (en) * | 2017-12-29 | 2022-07-19 | Groupon, Inc. | Methods and systems for generating a supply index indicative of a quality of available supply of merchant promotions |
| US10516972B1 (en) | 2018-06-01 | 2019-12-24 | At&T Intellectual Property I, L.P. | Employing an alternate identifier for subscription access to mobile location information |
| WO2021055812A1 (en) * | 2019-09-18 | 2021-03-25 | Divert, Inc. | Systems and methods for tracking product environment throughout a supply chain |
| US11341438B2 (en) | 2019-11-22 | 2022-05-24 | The Procter & Gamble Company | Provisioning and recommender systems and methods for generating product-based recommendations for geographically distributed physical stores based on mobile device movement |
| JP7361409B2 (en) | 2021-09-28 | 2023-10-16 | マップソリューション株式会社 | Analysis information provision system using the cloud |
| US11854025B1 (en) | 2023-03-10 | 2023-12-26 | Market Planning Areas, LLC | System and methods for generating market planning areas |
Citations (2)
| Publication number | Priority date | Publication date | Assignee | Title |
|---|---|---|---|---|
| US5521813A (en) * | 1993-01-15 | 1996-05-28 | Strategic Weather Services | System and method for the advanced prediction of weather impact on managerial planning applications |
| US5933100A (en) * | 1995-12-27 | 1999-08-03 | Mitsubishi Electric Information Technology Center America, Inc. | Automobile navigation system with dynamic traffic data |
Family Cites Families (6)
| Publication number | Priority date | Publication date | Assignee | Title |
|---|---|---|---|---|
| JPS5934918A (en) * | 1982-08-23 | 1984-02-25 | Nissan Motor Co Ltd | Processing structure of terminal of pillar finisher |
| US5285494A (en) * | 1992-07-31 | 1994-02-08 | Pactel Corporation | Network management system |
| US5809145A (en) * | 1996-06-28 | 1998-09-15 | Paradata Systems Inc. | System for distributing digital information |
| US5884312A (en) * | 1997-02-28 | 1999-03-16 | Electronic Data Systems Corporation | System and method for securely accessing information from disparate data sources through a network |
| US6604083B1 (en) | 1997-06-12 | 2003-08-05 | G. William Bailey | Market determination based on travel time bands |
| US6047234A (en) * | 1997-10-16 | 2000-04-04 | Navigation Technologies Corporation | System and method for updating, enhancing or refining a geographic database using feedback |
-
1998
- 1998-06-11 US US09/095,802 patent/US6604083B1/en not_active Expired - Lifetime
-
2003
- 2003-04-10 US US10/410,554 patent/US7043445B2/en not_active Expired - Lifetime
-
2005
- 2005-04-21 US US11/110,884 patent/US7516085B2/en not_active Expired - Fee Related
-
2008
- 2008-08-19 US US12/222,904 patent/US20080313022A1/en not_active Abandoned
Patent Citations (2)
| Publication number | Priority date | Publication date | Assignee | Title |
|---|---|---|---|---|
| US5521813A (en) * | 1993-01-15 | 1996-05-28 | Strategic Weather Services | System and method for the advanced prediction of weather impact on managerial planning applications |
| US5933100A (en) * | 1995-12-27 | 1999-08-03 | Mitsubishi Electric Information Technology Center America, Inc. | Automobile navigation system with dynamic traffic data |
Cited By (16)
| Publication number | Priority date | Publication date | Assignee | Title |
|---|---|---|---|---|
| US8332247B1 (en) * | 1997-06-12 | 2012-12-11 | G. William Bailey | Methods and systems for optimizing network travel costs |
| US20020046070A1 (en) * | 2000-10-06 | 2002-04-18 | Kuniyoshi Konishi | Management system for barber and beauty shops |
| US8176095B2 (en) | 2007-06-11 | 2012-05-08 | Lucid Design Group, Llc | Collecting, sharing, comparing, and displaying resource usage data |
| US20080306985A1 (en) * | 2007-06-11 | 2008-12-11 | Lucid Design Group, Llc | Collecting, sharing, comparing, and displaying resource usage data |
| US20090070196A1 (en) * | 2007-09-12 | 2009-03-12 | Targus Information Corporation | System and method for developing small geographic area population, household, and demographic count estimates and projections using a master address file |
| US8375068B1 (en) * | 2007-10-04 | 2013-02-12 | Lucid Design Group, Llc | Extensible framework and graphical user interface for sharing, comparing, and displaying resource usage data |
| US20100070342A1 (en) * | 2007-12-20 | 2010-03-18 | Ebay Inc. | Regional demand and supply comparison |
| US8117060B2 (en) * | 2007-12-20 | 2012-02-14 | Ebay Inc. | Geographic demand distribution and forecast |
| US20090164294A1 (en) * | 2007-12-20 | 2009-06-25 | Ebay Inc. | Geographic demand distribution and forecast |
| WO2013115758A1 (en) * | 2012-02-01 | 2013-08-08 | Mapas Inteligentes, Llc | Geocoding points of interest and service route delivery and audit field performance and sales method and apparatus |
| US20140033120A1 (en) * | 2012-07-26 | 2014-01-30 | David BENTAL | System and methods for presenting market analyses using intuitive information presentation |
| US9958291B1 (en) | 2014-08-11 | 2018-05-01 | Abl Ip Holding Llc | Self-service connection, data collection, and automation of metering and building systems, controls, and devices |
| US10718632B1 (en) | 2014-08-11 | 2020-07-21 | Abl Ip Holding Llc | Self-service discovery, refinement, and execution of automated multi-system insights |
| JP2016076084A (en) * | 2014-10-06 | 2016-05-12 | 株式会社リンクコーポレーション | Living area designation assist system, program, and storage medium |
| US10373099B1 (en) * | 2015-12-18 | 2019-08-06 | Palantir Technologies Inc. | Misalignment detection system for efficiently processing database-stored data and automatically generating misalignment information for display in interactive user interfaces |
| CN109657883A (en) * | 2019-01-28 | 2019-04-19 | 重庆邮电大学 | A kind of bank branches recommended method based on multi-source data driving |
Also Published As
| Publication number | Publication date |
|---|---|
| US6604083B1 (en) | 2003-08-05 |
| US20080313022A1 (en) | 2008-12-18 |
| US7043445B2 (en) | 2006-05-09 |
| US7516085B2 (en) | 2009-04-07 |
| US20050246222A1 (en) | 2005-11-03 |
Similar Documents
| Publication | Publication Date | Title |
|---|---|---|
| US6604083B1 (en) | Market determination based on travel time bands | |
| US7877287B1 (en) | System and method for selecting multiple sites using weighted bands | |
| Liu et al. | Automated identification and characterization of parcels with OpenStreetMap and points of interest | |
| Nicholls | Measuring the accessibility and equity of public parks: A case study using GIS | |
| US7921118B2 (en) | Methods and systems for developing market intelligence | |
| Munneke | Redevelopment decisions for commercial and industrial properties | |
| US20010039506A1 (en) | Process for automated real estate valuation | |
| US8332247B1 (en) | Methods and systems for optimizing network travel costs | |
| US20020007336A1 (en) | Process for automated owner-occupied residental real estate valuation | |
| Oketch et al. | Calibration and validation of a micro-simulation model in network analysis | |
| KR101167653B1 (en) | Real estate development business destination positioning system using web-gis and control method thereof | |
| Gross | Estimating willingness to pay for housing characteristics: an application of the Ellickson bid-rent model | |
| Zhang et al. | Robust geographical detector | |
| JP2003281348A (en) | Market area analyzing system, method, program and recording medium | |
| CA2668892C (en) | Tools and methods for range management | |
| Sudharshan et al. | DIFFSTRAT: An analytical procedure for generating optimal new product concepts for a differentiated-type strategy | |
| Bhat | Random utility-based discrete choice models for travel demand analysis | |
| CN111626777A (en) | Site selection method, site selection decision system, storage medium and electronic equipment | |
| Nader et al. | Smart out-of-home advertising using artificial intelligence and GIS data | |
| Ready et al. | Methods for valuing cultural heritage | |
| JP2003141325A (en) | Market analyzing method and program for market analysis | |
| CN113487341B (en) | Urban business strategy data processing method | |
| Kroeger | Open space property value premium analysis | |
| CN115860810B (en) | Dynamic monitoring method and system for industry brand city shop opening strategy | |
| Yoo | Measuring environmental amenity values from urban open space using a spatial hedonic approach |
Legal Events
| Date | Code | Title | Description |
|---|---|---|---|
| STCF | Information on status: patent grant |
Free format text: PATENTED CASE |
|
| FPAY | Fee payment |
Year of fee payment: 4 |
|
| FEPP | Fee payment procedure |
Free format text: PAYOR NUMBER ASSIGNED (ORIGINAL EVENT CODE: ASPN); ENTITY STATUS OF PATENT OWNER: SMALL ENTITY Free format text: PAYER NUMBER DE-ASSIGNED (ORIGINAL EVENT CODE: RMPN); ENTITY STATUS OF PATENT OWNER: SMALL ENTITY |
|
| FPAY | Fee payment |
Year of fee payment: 8 |
|
| MAFP | Maintenance fee payment |
Free format text: PAYMENT OF MAINTENANCE FEE, 12TH YR, SMALL ENTITY (ORIGINAL EVENT CODE: M2553) Year of fee payment: 12 |