The application is a continuation-in-part of copending U.S. Application Ser. No. 330,681, filed Dec. 14. 1981, for "PITCH ANALYZER".
FIELD OF THE INVENTION
The present invention relates generally to signal analysis and more specifically to pitch analysis for musicians.
BACKGROUND OF THE INVENTION
The analysis and display of musical pitch information can provide invaluable feedback for musicians, singers, and the like. To better understand the present invention, it is necessary to define clearly what is meant by musical pitch. All musical sounds which have a perceivable pitch consist of a sound pressure waveform that is periodic in time. The simplest periodic waveform is the sine wave. Any number of harmonics (sine waves with frequencies which are integer multiples of the fundamental frequency) may be added to the basic sine wave to give a very complex waveform in the time domain. Even though these harmonics are present, we still perceive the pitch of the sound as the fundamental frequency of the waveform. In fact, if the fundamental frequency of a musical sound is weak or missing altogether, the human mechanism of pitch detection is able to infer the fundamental pitch from the harmonics that are present. Simple pitch measuring devices which are based in the frequency domain respond to all the frequencies present in the waveform and often yield ambiguous results. Even if a method is used to display the lowest frequency present, this frequency may not be the perceived pitch of the sound if the energy of the component at the fundamental frequency is much weaker than several of the harmonics.
A much better method of extracting the preceived pitch is to measure the period of time over which the waveform is periodic. This technique seems to more closely model the human mechanism of pitch detection. There are, however, pitfalls in this method. First, in naturally occurring acoustic sounds the frequency of the overtones or partials are often not exact multiples of the fundamental frequency, and therefore cannot accurately be called harmonics. This inexactness results in such waveforms having a dynamically changing structure in the time domain with the phase of the overtones constantly changing with respect to the phase of the fundamental frequency. Thus the shape of the waveform may be completely altered over a span of several cycles, while the shape of adjacent cycles remains quite similar. In addition, the overtone structure of musical sounds often changes dramatically over a relatively short period of time, especially in the case of human voice. This again causes the shape of the waveform to change over a span of several cycles.
Further complicating the measurement problem is the fact that naturally occurring acoustic waveforms tend to be modulated by random fluctuations in amplitude. Periodic amplitude and frequency fluctuations may also be present; i.e., tremolo and vibrato. The human singing voice usually has all three of these effects present to some degree.
No previous pitch measurement method has addressed all of these problems successfully. Many have realized the shortcomings of operating in the frequency domain and have chosen to attempt to measure the period of the waveform in the time domain. Most methods, such as Merrit in U.S. Pat. No. 4,028,985, and Slepian and Weldon in U.S. Pat. No. 4,217,808 rely on detecting amplitude peaks of the periodic waveform. There are several weaknesses to peak detection approaches. First, acoustic waveforms rich in overtones may have several peaks in one cycle, with the shape and amplitude of these peaks constantly changing as indicated in the above paragraphs. Thus, the peak that is detected in one cycle may not correspond to the peak in an adjacent cycle and gross measurement errors will result. Similarly, rapid random or periodic amplitude fluctuations may cause a peak to be missed or cause minor peaks to be mistaken for the major peak. Even if peaks are not missed, small amplitude variations may translate into substantial time measurement errors, since a waveform typically has a gentle slope near its peak.
In addition, most techniques that use the amplitude of the waveform require an Automatic Gain Control (AGC) circuit to accommodate changes in input signal level. To avoid distortion of the waveform, AGC circuits are designed to have a fast attack time and slow decay time. This prevents the circuits from tracking small rapid changes in amplitude present in naturally occurring acoustic waveforms. In normal audio applications this is not a problem, since the sound is judged only by the human ear which is not sensitive to moderate amplitude changes. However, small amplitude changes can cause peak detectors to make gross errors. Reducing the AGC decay time allows the circuit to track more rapid amplitude fluctuations, but causes level-dependent distortion of low frequency waveforms. To minimize these difficulties either the range of pitches that can be measured must be limited, or some means must be provided for adjusting the time constant of the AGC in concert with the incoming pitch.
It is a known technique to analyze frequency by measuring the times at which the waveform crosses zero. The zero-crossings of a waveform are completely unaffected by the waveform amplitude. While this technique is suitable for relatively pure tones, it presents problems for a waveform which may cross zero several times during a cycle. While some sort of filtering scheme can be used to remove the overtones so that only two zero crossings occur in one cycle, this requires either operator intervention or an automatic filtering scheme which would have all the undesireable characteristics of an AGC circuit. Thus, while the known zero-crossing technique avoids the problems presented by the peak amplitude technique, it is itself subject to other problems.
SUMMARY OF THE INVENTION
The present invention provides a device and method for measuring the pitch of a musical sound and displaying the pitch and the pitch error in a complete and intuitively clear way with sufficient accuracy and speed that a musician or a singer can learn pitch discrimination by using the device for immediate feedback of pitch information.
A device according to the present invention consists of two distinct sections: the analog signal processing circuitry and the digital computing and display circuitry. The analog signal processing circuitry accepts a signal from an appropriate signal source, amplifies the signal if necessary, removes those frequency bands which are outside the area of interest, and generates a digital reference signal which represents zero-crossings of the analog signal. The digital computing circuitry performs an analysis using the zero-crossing time data and determines the fundamental pitch of the input signal. This is accomplished by, in effect, delaying the digital reference signal by successive amounts corresponding to the intervals between zero crossings, and correlating the effectively delayed signals with the digital reference signal. A high correlation corresponds to a delay which is near an integer number of periods. Additionally, the digital computing circuitry converts the pitch information into appropriate display driving signals which are buffered if necessary before they are applied to the display device itself.
This invention measures the pitch of an audio frequency signal and displays the said pitch accurately and rapidly on a display that is easily read and interpreted by an untrained operator. The measurement and display of pitch are fully automatic and require no operator adjustment or intervention during use. The pitch may be measured over a range of at least seven octaves, with the display precision remaining consistent with respect to an equally tempered musical scale. By way of contrast, in techniques which use beat notes, a given pitch error yields a beat frequency which is proportional to the pitch of the note. The pitch is preferably displayed as an illuminated note on a musical staff with separate indicators for octave displacement and error. This display of pitch is easy to interpret and is intuitively natural to a musician. The display is updated frequently enough to give the operator the impression of immediate response to pitch change. The apparatus recognizes a musical sound having a perceived pitch and blanks the display for all other inputs. Thus, transient noise or otherwise erroneous data only cause the display to blank momentarily and do not adversely affect succeeding measurement. The apparatus accurately measures the perceived pitch of a large variety of acoustically generated sounds. The sound may contain any number of overtones. The frequency of the overtones may depart from exact integer multiples of the fundamental frequency and the fundamental frequency may be weak or absent altogether. The sound may also cover a wide range of amplitudes and the amplitude may vary randomly or periodically at a rapid rate without affecting the accuracy of the pitch measurement.
For a further understanding of the nature and advantages of the present invention, reference should be made to the remaining portions of the specifications and to the attached drawings.
BRIEF DESCRIPTION OF THE DRAWINGS
FIG. 1 is a drawing showing the external appearance of the preferred embodiment of the pitch analyzer;
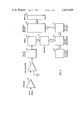
FIG. 2 is a functional block diagram which illustrates the functional elements necessary to perform the pitch analysis;
FIG. 3 illustrates the computation technique used to extract pitch information from the input waveform;
FIG. 4 is a detailed diagram of the preferred embodiment of the Preamp;
FIG. 5 is a functional diagram of the preferred embodiment of the Pulse Circuit;
FIG. 6 is a complete schematic diagram of the analog portion of the circuitry;
FIG. 7 is a complete schematic diagram of the digital portion of the prototype apparatus.
DETAILED DESCRIPTION OF THE INVENTION
FIG. 1 is an oblique view illustrating the external appearance of a Pitch Analyzer 1. Broadly, Analyzer 1 includes system electronics (to be described below) which are housed within a cabinet 2 and has as its purpose the analysis and display of musical pitch information. A musical tone is sensed by a built-in Microphone 4 and converted to an electrical signal. Alternately, Microphone 4 may be overridden by plugging an external microphone or electric instrument into an Input Jack 5. The display includes a first array of LED indicators 6, a second array of LED indicators 7, and a third array of LED indicators 8. Digital averaging may be selectively incorporated by manipulating a Selector Switch 9.
LED indicators 6 correspond to the notes within the musical scale. They are horizontally registered to a graphic representation of a piano keyboard while they are vertically registered relative to a graphic representation of a musical staff. LED indicators 7 correspond to the octave displacement from the octave beginning at middle C. In the preferred embodiment, notes up to three octaves below middle C, or three octaves above the B above middle C may be displayed. LED indicators 8 provide an indication of the degree to which the input note varies from the nearest standard equally tempered note.
FIG. 2 shows the essential blocks that comprise the system circuitry of analyzer 1. The input signal from a microphone, instrument pickup, or other appropriate signal source is processed by the Preamp 10, Comparator 11, and Pulse Circuit 12 which produces a pulse every time the input signal crosses zero. The Timer 13 measures the times of the zero-crossings of the input signal as represented by pulses from the Pulse Circuit 12, and stores these time values in the Memory 14. The actual pitch determination is made by the Microprocessor 15 which analyzes the time values stored in the Memory 14. The Microprocessor 15 performs this analysis by executing the Stored Program 16. The results of the analysis, in the form of a number or numbers representing the value of the pitch, are stored in the Output Latches 17. The Decoder/Driver 18 and Display 19 (which includes LED indicators 6, 7, and 8) convert the pitch data into information understandable by the operator.
The first block, the Preamp 10, has as its input an electrical signal which may be periodic and have a pitch in the range of interest. The signal source can be a microphone, transducer, or any other generator of an appropriate electrical signal. The Preamp 10 amplifies the signal and removes any frequencies outside the pitch range of interest.
FIG. 4 shows in detail the preferred embodiment of the Preamp 10 block. The input signal is from the Microphone 30 and is amplified by the Microphone Amplifier 31. The signal is then sent to a High-Pass Filter 32 and Low-Pass Filter 33, one of which is selected by the Microprocessor 15 by means of the Switch 34. Which filter is chosen is based on which yields the best pitch data. The Low-Pass Filter 33 is used to remove the higher frequencies from spectrally rich bass notes. The High-Pass Filter 32 is used to remove low frequency power line interference and random low frequency fluctuations superimposed on middle and high frequency notes. The Buffer 35 further amplifies the signal and completes the Preamp function.
The output of the Preamp 10 is connected to the Comparator 11, which generates a digital reference signal which is high when the input signal is above zero and low when below zero. In the preferred embodiment a very small amount of hysteresis is used in the Comparator to ensure sharp, non-oscillating transistions.
The output of the Comparator 11 is connected to a Pulse Circuit 12 which generates a pulse at each zero-crossing. The exact nature of the pulse will be determined by the implementation chosen for the Timer 13 which measures the zero-crossing times. For a timer implemented in hardware, a mono-stable multivibrator triggered by both the negative and positive going transistions of the signal would be an appropriate Pulse Circuit. FIG. 5 shows the preferred form for the preferred embodiment where the Timer 13 is implemented as part of the Stored Program 16 used by the Microprocessor 15. The output of the Comparator 11 is tied to one input of an exclusive OR gate 40 while the output is tied to the Microprocessor Interrupt Input. Upon reception of the interrupt the Microprocessor 15 acknowledges it by changing the state of the second input of the exclusive OR gate via a Microprocessor Output Latch, causing the pulse to be terminated, making the Pulse Circuit ready for the next zero-crossing.
The Timer 13, is used to measure the time of each zero-crossing of the signal and takes the form of a counter which outputs the value of its count to the Memory 14 whenever a pulse arrives from the Pulse Circuit 12. A means must also be provided to stop the acquisition of data when the desired number of zero-crossing times have been recorded in the Memory 13. The number of zero-crossing times must be large enough so at least two cycles of the input waveform are represented but not so large that the waveform at the beginning of the sample period is substantially different from the waveform at the end.
In the preferred embodiment, which implements the timer by means of the Microprocessor 15 executing a section of the Stored Program 16, a number stored in the Memory 14 is incremented at a precise rate related to the Microprocessor 15 clock frequency. When an interrupt occurs due to a zero-crossing, the value of this number, which represents the time of the zero-crossing, is stored in a list in another section of the Memory 14. Each time an interrupt occurs the counter stops and the counts lost during the servicing of the interrupt must be accounted for. The total of the number of counts lost is therefore kept and added to each time value before it is saved in the Memory.
Once the zero-crossing time data has been stored in a list in the Memory 14, the Microprocessor 15 performs an analysis of the data using the Stored Program 16, and arrives at a value for the pitch of the input signal. The output of the pitch information is stored in the Output Latches 17 while a new sample of the waveform is being processed. The output may take any appropriate form such as: data to be sent to some other device via a communication link; an alphanumeric display of frequency, period, or pitch; a graphic display such as notes on a staff or keys on a keyboard; a thermometer-like linear display; or any other means of conveying pitch information to the end user. As indicated earlier, in the preferred embodiment the pitch information is reduced to seven values for the octave of the pitch, twelve values for the value of the note, and eight values for the error of the pitch as expressed in a number of cents (percent of the distance to the next semitone).
In the preferred embodiment the Decoder/Driver 18 converts the binary number stored in the Output Latches 17 into a signal that drives the Diaplay 18. Light Emitting Diode lamps are used as the display in the preferred embodiment but other choices of display devices are not excluded.
The invention as described by this block diagram does not imply the actual physical division of the components of the apparatus, but merely illustrates the functions which must be performed to achieve the objects of the invention. An example of one possible physical embodiment of the invention is shown in FIGS. 6 and 7, which uses a discrete transistor amplifier for the Preamp 10 and monolithic integrated circuit for the Comparator 11 and the Pulse Circuit 12. The Microprocessor 15 is a MOS silicon integrated circuit of the 6502 family. The stored program 16 appears on an Eraseable Read Only Memory of the type 2716. The Timer 13 is implemented as part of the Stored Program 16 which is executed by the Microprocessor 15. The Memory 14 and Output Latches 17 are on a single peripheral integrated circuit of the 6532 type, designed for use with the Microprocessor 15. The Decoder/Driver 18 is a TTL integrated circuit and drives the Display 19 which is an array of Light Emitting Diodes. An embodiment suited for high volume production could use one monolithic integrated circuit for the necessary analog functions and another for the digital functions.
SUMMARY OF THE CALCULATION TECHNIQUE
The fundamental concept employed by the Stored Program in this: if a segment of a periodic waveform containing several cycles is delayed by exactly one cycle time and compared with the original waveform, there will be a very good match or correlation between the original and delayed waveforms at all points along the segment. This is also true if the delay is an exact integer multiple of one cycle time. Any other delay times will show a weak correlation.
An additional key assumption which must be made is that the zero-crossings of naturally occurring acoustic waveforms contain sufficient information above the waveform that the true period of the waveform can be found by using the correlation technique described above on a two-state waveform having zero-crossings at the same points as the input waveform. This assumption has been found to be justified.
FIG. 3 is a pictorial representation of the technique used to calculate correlations and determine pitch. The Input Waveform is shown on a arbitrary time scale with each tic mark representing a unit of time. A zero-crossing of the Input Waveform is represented by a change in state of the Reference Waveform. The Reference Waveform is that which would appear at the output of the Comparator 11 shown in FIG. 2.
The true period of the Input Waveform is found by delaying the Reference waveform by various amounts and calculating the correlation corresponding to each delay. Those delays with the highest correlation are assumed to be times which are near integer multiples of one cycle period.
The first correlative calculation is performed by delaying the Reference Waveform so that the first positive going zero-crossing of the delayed waveform corresponds to the second positive-going zero-crossing of the Reference Waveform at T3. The correlation between this First Delay waveform and the original Reference Waveform is calculated by comparing the two waveforms at all points between the start of the First Delay waveform at T3 and the end of the Reference Waveform at T14. In this span of 28 time units, the waveforms have the same polarity for 16 units of time, as indicated by the plus signs in the First Delay waveform, and opposite polarity for 12 units of time, as indicated by the minus signs. The correlation is therefore given the value of (16-12)/28 which is 4/28 or 14%. This would be considered a poor correlation.
The next calculation is based on the Second Delay which results from delaying the Reference Waveform to the next positive-going zero-crossing so that it begins at T5. The Second Delay waveform and the Reference waveform have the same polarity for the entire 25 units of time from T5 to T14. This would yield a correlation of 25/25 or 100%, a perfect correlation. It should be noted that this delay time corresponds to exactly one cycle of the original waveform.
From T7 to T14 the Third Delay waveform has 10 units of time with the waveforms having the same polarity and 8 where they are opposite. This yields a correlation of (10-8)/18 which equals 2/18 or 11%, again a poor correlation.
The Fourth Delay waveform results from a delay equal to exactly two cycles and therefore has a perfect correlation over the time span T9 to T14.
Naturally occurring acoustic waveforms are not perfect and rarely have perfect correlations, yet there is usually a clear difference between the correlations that result from delays of a full cycle and delays that don't. To illustrate, let use assume there was an imperfection in the waveform such that it failed to go above zero from T7 to T8. When the correlation for the Second Delay was calculated there would be 24 units of time in which the waveforms were of the same polarity, and one where they were opposite. This would yield a correlation of (24-1)/25 which equals 92%, which is clearly much better than the correlations not corresponding to full cycle delays.
After this first family of correlations is calculated, the same Reference Waveform can be further analyzed by calculating a second family of correlations using T2 as the starting point rather than T1. A third family can then be started at T3 and so on until insufficient data remains to perform useful calculation.
As the correlation calculations are being performed, only those delays resulting in reasonably good correlations are retained in a list. This list can be ranked by correlation, and those delay times with the highest correlations retained. Alternatively, a list of valid delay times can be compiled by saving only those delay times corresponding to a correlation above a given threshold. To save the amount of memory allocated for the list, those delay times corresponding to one correlation threshold can be stored starting at one end of a list and those corresponding to a higher threshold entered at the opposite end of the list. When the list is filled, then those delays corresponding to the higher threshold are allowed to overwrite those corresponding to the lower threshold, resulting in a continual improvement in the quality of data in the list.
When the list is complete, the smallest delay time with a good correlation is then compared with all the others. If this smallest time is very much less than the largest, it can be assumed that it was not the result of a delay of a full cycle, but only a very small fraction of a cycle. Such a delay is declared invalid and the remainder of the data is examined to find a delay which is believed to correspond to a full cycle of the waveform. Those delay times that are close to integer multiples of the smallest valide time are normalized by dividing the time by the exact integer value. Those times that are not near integer multiples are discarded. The pitch of the note is then calculated by taking the average of all these normalized times.
To make the pitch analyzer more useful as a tool when used with the human voice or other complex sounds, additional calculations can be performed on the pitch data. The display of pitch can be inhibited until at least two consecutive similar pitch values have been obtained and their average taken. Subsequent similar pitch data can then be averaged so that the displayed pitch equals the present pitch value plus the difference between the newly acquired pitch and the present pitch divided by some number, N. The larger the value of N the less the new pitch will affect the displayed pitch. In the preferred embodiment N=4. The advantages gained by using this averaging technique are several. First, meaningless pitch readings due to transient onset phenomena in acoustic sounds are suppressed. Second, acoustic waveforms with superimposed noise or naturally imprecise pitch definition are displayed more stably. Finally, the wide pitch swings of a sound with a substantial vibrator are averaged to yield a more easily interpreted display.
To accommodate various pitch and tuning standards the clock frequency used to measure the time of the zero-crossings can be varied without requiring any change in the constants used by the program. Conversely a vareity of reference pitches or tuning systems can be selected by changing the constants used in the computing program.
DETAILED COMPUTER PROGRAM OUTLINE
The program has four major sections which perform four distinct tasks. The first section records the time of occurrence of zero-crossings of the input waveform. The second compiles a list of time delays for which high correlations have been calculated. The third operates upon these delay times to calculate a pitch. The fourth, which is optional, performs an averaging of successive calculated pitch values. The following is a detailed description of each of these functions. The complete program listing written in 6502 assembly language can be found in Appendix I.
A. RECORD THE TIME OF ZERO-CROSSING TRANSITIONS OF THE INPUT WAVEFORM
1. Create a counter in either hardware or software with a clock frequency such that the counter will not overflow for the largest time interval expected.
2. Using the above counter, record the time of each zero-crossing transition of the waveform in a Transition Time Table which resides in the Memory 14 which is accessible by the Microprocessor performing the correlation analysis.
3. When the desired number of zero-crossings transition times have been recorded in the Transition Time Table or a predetermined time limit has been reached, stop recording transition times.
4. To reduce round-off errors in the succeeding correlation calculations, every entry in the Transition Time Table can be repeatedly shifted left (multiplied by two) until the largest number overflows, recording the number of shifts in a variable named Octave.
B. COMPILE A LIST OF DELAY TIMES CORRESPONDING TO GOOD CORRELATIONS
1. Set a pointer called the Reference pointer to the first entry in the Transition Time Table and a pointer called the Delay pointer to the third entry, corresponding to the frst and second zero-crossings of the same polarity.
2. Calculate the correlation between the two waveforms which are represented by the data in the Transition Time Table, starting at the time value of the Delay pointer.
a. Set a variable called Delay equal to the difference between the times pointed to by the two pointers.
b. Find whether the time difference between the present zero-crossing and the next zero-crossing is less for the data pointed to by the Reference pointer or the Delay Pointer. (Subtract Delay for all times relating to the Delay pointer so that times from the Transition Time Table can be easily compared.)
c. Add the time difference to this nearest zero-crossing to the variable called Correlation Total since it is known that the two waveforms start with the same polarity.
d. Advance in time until the next nearest transition is found in either waveform and subtract the time difference between this transition and the previous one from the Correlation Total, since the waveforms must now be of opposite polarity.
e. Continue advancing in time, subtracting each time difference between transition from the Correlation Total if one pointer is at an odd numbered position in the Transition Time Table and the other is at an even numbered position in the table. Add the time difference to the Correlation Total if both pointers are at odd numbered positions or both are at even numbered positions.
f. When the end of the Transition Time Table is reached calculate the correlation of the two waveforms by dividing the Correlation Total by the total time from the Delay pointer starting time to the end of the Transition Time Table.
3. If the correlation is above a given threshold save the Delay time in the Delay Time List, if not, then discard.
4. Set the Reference and Delay pointers to the first and fifth entries in the Transition Time Table and perform steps 2 and 3.
5. Continue setting the Delay pointer on successive odd numbered entries in the Transition Time Table and performing steps 2 and 3 until either a given number of entries have been entered in the Delay Time List or there is not more valid data in the Transition Time Table.
6. Set the Reference pointer to the second entry and Delay pointer to the fourth entry in the Transition Time Table and perform operations similar to those in steps 2 through 5, except that only even numbered transitions are used.
7. Perform several groups of calculations similar to steps 2 through 6, advancing the Reference pointer to successive entries in the Transition Time Table until either a sufficient number of entries have been accumulated in the Delay Time List or there is no more valid data in the Transition Time Table.
C. DETERMINE THE PITCH FROM THE CORRELATION DATA
1. Find the longest and shortest Delay in the Delay Time List.
2. If the ratio of these numbers is not too large (less than 8 in the preferred embodiment) assume that the smaller one represents one cycle of the waveform.
3. If the above ratio is too large assume that the small Delay is not valid and discard this entry from the Delay Time List.
4. Repeat steps 2 and 3 until a valid smallest Delay is found.
5. Examine each Delay Time and mark as invalid those that are not close to integer multiples of the shortest valid Delay Time found in the previous step.
6. If there is an insufficient number of entries remaining in the Delay Time Lst then assume that there was no valid pitch present in the present sound sample, terminate this pitch calculation attempt, and start from the beginning at step A.
7. If there is a sufficient number of entries in the Delay Time List then divide each valid Delay Time by the nearest exact integer to normalize all of the Delay Times to represent one cycle time of the waveform.
8. Calculate the pitch of the note by taking the average of all the valid normalized Delay Times.
D. PERFORM AVERAGING OF SUCCESSIVE PITCH VALUES (OPTIONAL)
1. If the new pitch value is not close to the last value then turn off the display and get new zero-crossing data.
2. If the new pitch value is close to the previous pitch value then average it with the previous value and display this calculated Pitch value.
3. If the new pitch value is the third or greater consecutive close pitch value then calculate the new averaged pitch value by the formula:
AVERAGE PITCH=LAST PITCH+(NEW PITCH-LAST PITCH)/N
where N may be fixed or adjusted dynamically based on the number of consecutive close pitch values that have occurred.
In summary, it can be seen that the present invention provides a Pitch Analyzer which extracts the relevant features from the input waveform and displays these features in a manner meaningful to musicians. While the above provides a full and complete disclosure of the preferred embodiment of the present invention, it will be immediately recognized that various modifications, alternate constructions, and equivalents may be employed without departing from the true spirit and scope of the invention. For example, while an instrument directed to musicians has been disclosed, the basic instrument can also be used for speech therapy and the like. Therefore, the above description and illustrations should not be construed as limiting the scope of the invention which is defined by the appended claims. ##SPC1## ##SPC2## ##SPC3## ##SPC4##