BACKGROUND OF THE INVENTION
This invention relates to seismic exploration and more particularly to a method and apparatus for removing sinusoidal noise from seismic data. This invention further relates to method and apparatus for providing an improved notch filter which utilizes an exact mathematical description of sinusoidal noise for application to a noisy seismic trace.
In seismic exploration, it is common practice to deploy a large array of geophones on the surface of the earth and to record the vibrations of the earth at each geophone location to obtain a collection of seismic traces. The traces are sampled and recorded for further processing. When the vibrations so recorded are caused by a seismic source activated at a known time and location, the recorded data can be processed by a computer in known ways to produce an image of the subsurface. The image thus produced is commonly interpreted by geophysicists to detect the possible presence of valuable hydrocarbons.
Seismograms are commonly recorded as digital samples representing the amplitude of a received signal as a function of time. Since seismograms are usually obtained along a line of exploration on the surface of the earth, the digital samples can be formed into x-t arrays with each sample in the array representing the amplitude of the seismic signal as a function of horizontal distance and time. When such arrays are visually reproduced, by plotting or the like, seismic sections are produced. A seismic section depicts the subsurface layering of a section of the earth. Before an array of seismic samples or traces can be converted into a seismic section for interpretations by geophysicists, the array must be extensively processed to remove noise and to make reflection events discernible.
In the course of seismic exploration, a significant amount of noise is introduced into the seismic data by the influence of man. Such introduced noise, generally referred to as "cultural noise", may include noise from power lines, electrical machinery or other sources. As a result, sinusoidal noise is often a serious problem in analyzing seismic records. However, geophysicists usually ignore the sinusoidal noise or rely upon deconvolving and/or stacking of the seismic data to reduce sinusoidal noise. Unfortunately, sinusoidal noise left on a seismic record degrades subsequent processing techniques such as determining amplitude recovery parameters, source-receiver coupling corrections, source-receiver static corrections, trace editing, deconvolution, multiple removal, and wavelet estimates. However, using deconvolution to simultaneously remove sinusoidal noise and whiten the data leads to relatively poor signal to noise ratios and to signal distortion.
Another method for removing such types of sinusoidal noise contamination is to pass the seismic data through a notch filter. Unfortunately, poor results were often obtained when the removal of contaminating sinusoidal noise was attempted utilizing notch filters. First, the notch may not be centered exactly at the frequency of the contaminating noise, thereby making it more likely that not all of the contaminating noise will be removed by the notch. Second, the notch may remove a considerable amount of valid data along with the noise if the valid data has a frequency within the notch and the notch is wide. Finally, in some cases, the notch filter will induce phase distortion in the data.
Much of the seismic data collected today is contaminated by power-line interference or sinusoidal interference from nearby power generators. Noise from high-voltage transmission lines is considered very stationary and therefore can be effectively removed by notch filtering, provided that a filter with a narrow and deep notch can be utilized. In the past, to construct a notch filter having both a deep and narrow notch required the use of very long filter operators. However, such a practice has been discouraged as the amount of computer time required to apply the long filter operators having a deep and narrow notch is very high, thus adding substantially to the cost of notch filtering the seismic data.
SUMMARY OF THE INVENTION
It is an object of this invention to provide an improved low cost notch filter for higher resolution sinusoidal noise rejection.
It is another object of this invention to provide an improved notch filter which requires only one-fourth as many digital filter points as prior notch filters for construction.
It is still another object of this invention to provide a notch filter which is constructed using an exact mathematical description of the contaminating noise to be removed.
It is still yet another object of this invention to provide a least square, optimal filter for removing sinusoidal noise at specified frequencies while minimizing distortion at other frequencies.
It is a feature of this invention to provide a minimum phase Wiener-Levinson predictive deconvolution filter designed to precisely remove sinusoidal noise of specified frequencies utilizing an autocorrelation matrix constructed using an exact mathematical description of the sinusoidal noise to be removed.
It is another feature of this invention to provide a method for processing seismic data without deconvolving at an early stage by applying an improved notch filter early in the processing sequence to remove sinusoidal noise.
Seismic data comprised of a plurality of seismic traces is transformed from the time domain into the frequency domain by applying the Fast Fourier Transform to the traces, thereby producing a frequency domain amplitude spectrum of the data. The amplitude spectrum is analyzed to determine a line frequency equivalent to the sinusoidal frequency to be eliminated. A filter order N (number of filter weights) is selected and the exact autocorrelation function of the selected sinusoidal frequency is determined for lags 0, 1, . . . , N-1. An autocorrelation matrix is produced utilizing the determined autocorrelation values and predictive deconvolution techniques are applied to the autocorrelation matrix to produce a convolutional filter which will remove sinusoidal noise at the determined frequency while leaving other frequencies minimally attenuated. The autocorrelation matrix may be modified using a white noise parameter prior to producing the convolutional filter. The sinusoidal noise is then removed from the seismic data by convolving the acquired seismic traces with the filter.
The above and other objects, advantages and features of the invention will be more readily understood from the following detailed description of the invention, which is provided in connection with the accompanying drawings.
BRIEF DESCRIPTION OF THE DRAWINGS
FIG. 1 illustrates, in flow-chart form, the method of removing sinusoidal noise from seismic data of the present invention;
FIG. 2 illustrates an actual x-t domain seismic record acquired during seismic exploration;
FIG. 3 illustrates a dB scale amplitude spectrum of a seismic trace selected from the seismic record illustrated in FIG. 2;
FIG. 4a illustrates a 128 point filter operator constructed to remove sinusoidal noise from the seismic record illustrated in FIG. 2;
FIG. 4b illustrates a linear scale amplitude spectrum of the filter illustrated in FIG. 4a;
FIG. 4c illustrates a dB scale amplitude spectrum of the filter illustrated in FIG. 4a;
FIG. 4d illustrates a phase spectrum of the filter illustrated in FIG. 4a;
FIG. 5 illustrates the x-t domain seismic record illustrated in FIG. 2 after the removal of sinusoidal noise therefrom in accordance with the methods set forth in FIG. 1;
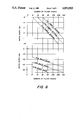
FIG. 6 illustrates a nomogram to be used in conjunction with the method of removing sinusoidal noise from seismic data set forth in FIG. 1; and
FIGS. 7a-c illustrate the characteristics of a filter response to be utilized in constructing the nomogram illustrated in FIG. 6.
DESCRIPTION OF THE PREFERRED EMBODIMENT
Turning first to FIG. 1, the method of removing sinusoidal noise from seismic data is hereby described. The method of the present invention commences at step 100 with the acquisition of seismic data using well-known seismic exploration techniques. For example, an artificial disturbance may be generated in the earth by the use of dynamite or the like. The resulting elastic waves travel downwardly in the earth and are reflected upward from subsurface reflecting interfaces. The reflected waves are received by geophones or other detectors usually located along the surface and recorded in reproducible form as seismograms. Seismic traces which would be acquired by one such seismic survey may be seen by reference to FIG. 2. The seismic traces depicted in FIG. 2 represent reflections as a function of time t and source-receiver distance x along a line of exploration. These traces have been gathered into an x-t array commonly referred to as a "seismic section" or "seismic record".
Each recorded seismic trace xt to be filtered in accordance with the teachings set forth herein may be viewed as being comprised of two components st and dt such that:
x.sub.t =d.sub.t +s.sub.t (1)
where:
st =the sample at time t of an interfering sinusoidal interference of a specific frequency which is easily determined; and
dt =the sample at time t of a white (broadband) random signal to be separated from the interfering sinusoidal noise.
To obtain the desired signal dt, a filter ht must be applied to xt such that the filter output yt is approximately equal to dt.
Proceeding to step 105, one of the seismic traces included as part of the produced seismic section is selected for further processing to remove sinusoidal noise from the trace. At step 110, the sampling interval of the seismic data is determined. The sampling interval may be determined according to the following:
Sampling Interval=1/2W (2)
where W is the highest frequency for which the seismic trace receives useful data. For the selected seismic trace, the highest frequency at which useful data is received, also known as the Nyquist frequency, is determined to be 1000 Hz. The sampling interval would be, therefore, 0.0005 seconds.
Proceeding to step 115, the selected seismic trace is Fast Fourier Transformed into the frequency domain. For a seismic trace xt, the Fourier transform is defined as:
X.sub.f =Σx.sub.t e.sup.-j2πft dt (3)
X.sub.f =.sup.t |X.sub.f |e.sup.jθ f (4)
where:
Rf is the real part of the Fourier transform;
If is the imaginary part of the Fourier transform;
|Xf | is the amplitude or Fourier spectrum of xt and is given by [R2 f +I2 f]1/2 ; and
θf is the phase angle of the Fourier transform and is given by tan-1 [If /Rf ].
Proceeding to step 120, a dB scale frequency domain amplitude spectrum is produced from the FFT of the selected seismic trace utilizing methods well known in the art. For example, FIG. 3 illustrates a dB scale frequency domain amplitude spectrum constructed from the FFT of a selected seismic trace of the seismic section illustrated in FIG. 2.
Proceeding to step 125, the line frequency or frequencies corresponding to the frequency of the contaminating sinusoidal noise to be removed is determined by analyzing the produced frequency domain amplitude spectrum. For a seismic trace comprised of seismic data and at least one sinusoidal noise signal, the transformation of the seismic trace from the time domain into the frequency domain will produce one or more amplitude spikes which correspond to the frequency or frequencies of the sinusoidal noise component of the trace. For example, FIG. 3 clearly indicates that the seismic data is contaminated by strong line interference at 60 Hz, 180 Hz, 300 Hz, 420 Hz and 540 Hz.
Proceeding to step 130, the frequency domain amplitude spectrum is analyzed to yield information necessary to construct a filter for removing the sinusoidal noise from the collected seismic data. At step 135, the desired notch width in Hz is determined from the dB scale frequency domain amplitude spectrum. Preferably, the notch width should be measured as the distance between points on either side of each line frequency where a 3 dB drop in response occurs for a white (broadband) random signal. At step 140, the desired notch depth, i.e. the amount of rejection in dB at each identified line frequency, is determined from the dB scale frequency domain amplitude spectrum.
Proceeding to step 145, a filter order N, i.e. the number of filter weights, is selected for the notch filter to be constructed and, at step 150, a white noise parameter is selected. Having determined the sampling interval, notch width and notch depth, the filter order and white noise parameter may be determined by utilizing the nomogram illustrated in FIG. 6. The construction of a nomogram suitable for use in conjunction with the teachings of the present invention is more fully set forth later.
In its most general sense, the nomogram transforms the sampling interval, notch width and notch depth into the parameters necessary for constructing the desired filter. For example, if it is assumed that the desired notch width is 4 Hz, that -70 dB of rejection is needed and that the seismic data are sampled at 2 ms, then proper utilization of the nomogram illustrated in FIG. 6 would indicate that the desired filter parameters for removing sinusoidal noise from the collected seismic data would be a filter order of 64 and a white noise parameter σ2 of 1%. To determine the desired parameters for the provided example, one would first turn to the top part of the nomogram, proceed across from the 4 Hz notch width to intersect the sloping line labeled 2 ms and read from the top of the nomogram to determine the required filter order--in this case 64 points. Then, turning to the bottom part of the nomogram, the intersection of -70 dB (rejection) and 64 filter points would lay on the line labeled 1% white noise. This means that a 64 point operator designed with 1% white noise parameter will have the desired response necessary to produce a 4 Hz wide, -70 dB deep notch filter.
Proceeding to step 155, the exact autocorrelation function of the contaminating sinusoid is determned for lags 0, 1, . . . , N-1 where N=the determined filter order. More specifically, the exact autocorrelation function is determined according to the following:
Rs (k)=cos 2πfτ (5)
k=0, 1, . . . N-1;
τ=kΔt, where Δt is the sampling interval
f=frequency of the contaminating sinusoid
Having determined at step 155 a series of values for the exact autocorrelation function, an autocorrelation matrix is constructed at step 160 according to the following: ##EQU1##
The autocorrelation matrix may be modified at step 165 utilizing the previously determined white noise parameter to produce the following: ##EQU2##
Proceeding to step 170, as there is a linear system of equations for hk, k=0, 1, . . . , N-1, the produced whitened autocorrelation matrix may be solved according to Equation (8) set forth below to yield a convolutional filter hk capable of removing sinusoidal noise of the designated frequencies while leaving other frequencies minimally attenuated. ##EQU3##
Proceeding to step 175, the produced convolutional filter hk is utilized by application of the convolution technique to determine the filter output yt which closely approximates the desired sinusoidal noise removed seismic data dt. Recalling that it is desired to apply the determined convolutional filter hk to the seismic trace xt to obtain the filter output yt, the filter output yt may be represented according to the following: ##EQU4##
In such a manner, the sinusoidal noise removed seismic data dt is produced. The seismic data may now be processed further, plotted, displayed or analyzed according to any one of numerous techniques to yield useful information regarding the geophysical characteristics of the explored formation.
In a second embodiment of the invention, the methods described above are modified so that the constructed filter is capable of removing sinusoidal noise at a plurality of frequencies. For example, the seismic trace amplitude spectrum illustrated in FIG. 3 includes sinusoidal noise at a fundamental frequency of 60 Hz and harmonics at 180 Hz, 300 Hz, 420 Hz and 540 Hz. Such a goal is accomplished by the procedure set forth below:
After the line frequencies have been identified, each line frequency is subject to the methods of analysis set forth above to determine the notch width and notch depth for each line frequency. Each notch width and notch depth corresponding to a line frequency are examined and compared. Then one selected pair is utilized in conjunction with the nomogram illustrated in FIG. 6 to determine a filter order N and white noise parameter σ2. The exact autocorrelation function is determined and the determined autocorrelation values used to produce an autocorrelation matrices for each line frequency. The autocorrelation matrix for each line frequency are then summed together. The determined white noise parameter is scaled by a factor of 1/L where L is the total number of line frequencies to be rejected by the single filter. The summed autocorrelation matrix is then whitened by the scaled white noise parameter. After whitening, ht and yt may now be determined in accordance with the methods set forth above.
The methods set forth above will produce a minimum phase filter for application to the seismic trace comprised of a data component and a sinusoidal noise component. In yet another embodiment of the invention, it is contemplated that a zero phase, i.e. symmetric, filter may be constructed for use instead. The zero phase filter may be constructed by concatenating the minimum phase filter and its reverse to form a symmetric filter of order 2N-1.
Turning now to FIGS. 7a-c, the method of constructing a nomogram such as the one illustrated in FIG. 6 is now set forth in greater detail. A set of filter parameters such as filter points, sample interval, line frequency and white noise factor are selected and the filter corresponding to the selected parameters is constructed. For example, FIG. 7a illustrates a filter which may be constructed utilizing the specified parameters. The linear scale and dB scale frequency domain amplitude spectrums are then constructed by applying the FFT to the filter. From an analysis of the linear scale and dB scale frequency domain spectrums, which are respectively illustrated in FIGS. 7b and 7c, the notch width and rejection may be determined and the relationship between notch width and filter order and the relationship between notch depth and white noise may be plotted. Repeated determination and plotting of filter responses calculated from selected filter operators may be utilized to produce the nomogram illustrated in FIG. 6.
Thus, there has been described and illustrated herein a method for processing geophysical data to remove sinusoidal noise from the acquired data. However, those skilled in the art will recognize that many modifications and variations besides those specifically mentioned may be made in the techniques described herein without departing substantially from the concept of the present invention. Accordingly, it should be clearly understood that the form of the invention described herein is exemplary only, and is not intended as a limitation on the scope of the present invention.