US4979110A - Characterizing the statistical properties of a biological signal - Google Patents
Characterizing the statistical properties of a biological signal Download PDFInfo
- Publication number
- US4979110A US4979110A US07/247,738 US24773888A US4979110A US 4979110 A US4979110 A US 4979110A US 24773888 A US24773888 A US 24773888A US 4979110 A US4979110 A US 4979110A
- Authority
- US
- United States
- Prior art keywords
- signal
- computing
- function
- obscuring
- autocorrelation
- Prior art date
- Legal status (The legal status is an assumption and is not a legal conclusion. Google has not performed a legal analysis and makes no representation as to the accuracy of the status listed.)
- Expired - Lifetime
Links
Images
Classifications
-
- G—PHYSICS
- G06—COMPUTING; CALCULATING OR COUNTING
- G06F—ELECTRIC DIGITAL DATA PROCESSING
- G06F17/00—Digital computing or data processing equipment or methods, specially adapted for specific functions
- G06F17/10—Complex mathematical operations
- G06F17/18—Complex mathematical operations for evaluating statistical data, e.g. average values, frequency distributions, probability functions, regression analysis
-
- A—HUMAN NECESSITIES
- A61—MEDICAL OR VETERINARY SCIENCE; HYGIENE
- A61B—DIAGNOSIS; SURGERY; IDENTIFICATION
- A61B5/00—Measuring for diagnostic purposes; Identification of persons
- A61B5/02—Detecting, measuring or recording pulse, heart rate, blood pressure or blood flow; Combined pulse/heart-rate/blood pressure determination; Evaluating a cardiovascular condition not otherwise provided for, e.g. using combinations of techniques provided for in this group with electrocardiography or electroauscultation; Heart catheters for measuring blood pressure
- A61B5/021—Measuring pressure in heart or blood vessels
-
- A—HUMAN NECESSITIES
- A61—MEDICAL OR VETERINARY SCIENCE; HYGIENE
- A61B—DIAGNOSIS; SURGERY; IDENTIFICATION
- A61B5/00—Measuring for diagnostic purposes; Identification of persons
- A61B5/02—Detecting, measuring or recording pulse, heart rate, blood pressure or blood flow; Combined pulse/heart-rate/blood pressure determination; Evaluating a cardiovascular condition not otherwise provided for, e.g. using combinations of techniques provided for in this group with electrocardiography or electroauscultation; Heart catheters for measuring blood pressure
- A61B5/024—Detecting, measuring or recording pulse rate or heart rate
-
- A—HUMAN NECESSITIES
- A61—MEDICAL OR VETERINARY SCIENCE; HYGIENE
- A61B—DIAGNOSIS; SURGERY; IDENTIFICATION
- A61B5/00—Measuring for diagnostic purposes; Identification of persons
- A61B5/40—Detecting, measuring or recording for evaluating the nervous system
- A61B5/4029—Detecting, measuring or recording for evaluating the nervous system for evaluating the peripheral nervous systems
- A61B5/4035—Evaluating the autonomic nervous system
-
- A—HUMAN NECESSITIES
- A61—MEDICAL OR VETERINARY SCIENCE; HYGIENE
- A61B—DIAGNOSIS; SURGERY; IDENTIFICATION
- A61B5/00—Measuring for diagnostic purposes; Identification of persons
- A61B5/72—Signal processing specially adapted for physiological signals or for diagnostic purposes
- A61B5/7235—Details of waveform analysis
- A61B5/7253—Details of waveform analysis characterised by using transforms
- A61B5/7257—Details of waveform analysis characterised by using transforms using Fourier transforms
Definitions
- the role of the cardiovascular system is to provide an adequate supply of oxygenated blood to the tissues and organs of the body.
- This function is carefully regulated by the autonomic nervous system (ANS), which continuously senses systemic blood pressure and other hemodynamic variables that reflect the adequacy of tissue perfusion.
- the input sensed by the ANS is processed by the brain stem, which compares the inputs to desired set points. If the inputs deviate from the set points, the ANS is activated and attempts correct for the difference by bringing about changes in heart rate and vascular tone. This constant feedback and correction by the ANS is reflected in the fluctuations in heart rate (HR) and blood pressure (BP).
- HR heart rate
- BP blood pressure
- ectopic beats--beats which originate in parts of the heart other than the sinoatrial node (SAN).
- SAN sinoatrial node
- the timing and occurrence of ectopic beats is not considered an indicator of cardiovascular feedback and control.
- ectopic beats are a contaminating signal which overshadows the normal activity of the SAN.
- the current state of the art is to deal with ectopic beats in one of two ways.
- One approach is to wait for a sufficiently long interval which is free of ectopic beats [5, 6]. While this method is effective in a younger and healthier population, it is often impractical, if not impossible, in an older and sicker clinical population which has more frequent ectopic beats.
- the second approach is to estimate what the HR and BP would have been if they had not been obscured by the ectopic beats, and then to substitute those HR and BP estimates in intervals containing ectopic beats. It is common practice to replace the HR and BP by a simple linear spline or weighted average of the points bordering the ectopic beat intervals [4, 7]. However, such simple estimates make unwarranted assumptions about the HR and BP, especially if the ectopic intervals last more than a few seconds.
- the method according to one aspect of the invention for characterizing the statistical properties of a biological signal intermittently obscured by a relatively independent biological process includes noting the time intervals during which the obscuring process is occurring.
- a windowing function is constructed from the intervals. This windowing function makes a transition from one toward zero as the process obscures the signal and a transition towards one as the process terminates.
- the windowing function is used to weight the relative contributions of corresponding segments of the biological signal so that a statistical characterization of the signal can be performed.
- the statistical property is the autocorrelation function of a biological signal and the product of the windowing function and the signal is taken. Both the autocorrelation of the product and the autocorrelation of the windowing function are computed.
- the quotient of the autocorrelation of the product by the autocorrelation of the windowing function is computed to estimate the autocorrelation function of the biological signal. If the power spectrum of the biological signal is desired, it may be computed from the quotient computed above.
- the crosscorrelation function of a first signal intermittently obscured by a first process and a second signal intermittently obscured by a second process (which may or may not be the same as the first obscuring process) is computed.
- each of the signals is relatively independent of each of the obscuring processes.
- This method notes the time intervals during which the first obscuring process occurs. From these time intervals, a first windowing function is constructed which makes a transition from one towards zero as the first process obscures the first signal and a transition towards one as the first process terminates. The time intervals during which the second obscuring process is occurring is also noted and a second windowing function is constructed from the second set of time intervals.
- the second windowing function makes a transition from one toward zero as the second process obscures the second signal and a transition towards one as the second process terminates.
- the product of the first signal with the first windowing function and the product of the second signal with the second windowing function are computed.
- the crosscorrelation of the two products and the crosscorrelation of the two windowing functions are then computed followed by computing the quotient of the crosscorrelation of the products by the crosscorrelation of the windowing functions.
- the cross-spectrum of the two signals may be computed from the crosscorrelation function by computing the cross-spectrum from the crosscorrelation function.
- the transfer function between the two signals may also be obtained by computing the cross-spectrum as set forth above and computing the power spectrum of the first of the two signals, also as set forth above, and then computing the quotient of the cross-spectrum and the power spectrum.
- the impulse response function between two signals is computed by taking the inverse Fourier transform of the transfer function.
- the impulse response function can also be computed directly from the crosscorrelation and autocorrelation functions which are computed as set out above.
- the transfer function between two signals may be computed directly from the crosscorrelation function and the autocorrelation function.
- the transfer function between two signals is determined by computing the impulse response function and taking its Fourier transform.
- the present invention characterizes statistical properties of a biological signal intermittently obscured by a relatively independent biological process. For example, power spectra and transfer functions of heart rate signals can be estimated for data containing ectopic beats. Instead of trying to "guess” what the obscured heart rate or other signal would have been, the method of the invention treats the heart rate signal during ectopic intervals as "missing data.”
- the computation of the power spectra and transfer functions is based on auto- and crosscorrelation functions which make no direct reference to the heart rate or other signal during the ectopic intervals.
- the method of the present invention is fundamentally different from all existing strategies because it does not attempt to make explicit assumptions about the biological signal during the ectopic interval. The method does, however, assume that the autonomic nervous system activity is not substantially affected by the ectopic beats, and that the biological signal trends on either side of the missing data are part of an ongoing response.
- the method takes advantage of signal processing strategies which have been developed for dealing with signals that are only partially available. Previously, such strategies have been used for dealing with the problem of a receiving or recording device which has failed to faithfully receive or reconstruct a signal [8, 9]. In the biological context of the present invention, there is no difficulty in acquiring the signal. Relabelling the ectopic intervals as "missing data” permits the biological problem to be recast in a way which takes advantage of existing signal processing strategies. Computations on experimental data confirm that estimates computed according to the present invention give better results than prior art techniques involving splining.
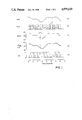
- FIG. 1a is a graph of a function m(t) which represents the level of combined influences modulating the sinoatrial node;
- FIG. 1b is a graph of the ECG corresponding to the function in FIG. 1a;
- FIG. 1c is the instantaneous heart rate tachometer signal estimated from the ECG of FIG. 1b;
- FIG. 1d is a graph of the estimate of heart rate
- FIG. 1e is a graph of a windowing function
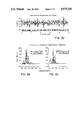
- FIG. 2a is a graph of a simulated heart rate signal including a bar code representing ectopic intervals
- FIG. 2b is a graph comparing the true heart rate spectrum with an estimate computed according to the present invention.
- FIG. 2c is a graph comparing the true heart rate spectrum with an estimate computed by the spline technique.
- x[n] is the time series that we would have observed if parts of the first signal had not been obscured.
- y[n] is the time series that we would have observed if parts of the second signal had not been obscured.
- v[n] is a time series which is defined to be 0 during times in which x[n] was obscured and 1 otherwise. It is assumed that v[n] is independent of x[n] and y[n].
- w[n] is a time series which is defined to be 0 during times in which y[n] was obscured and 1 otherwise. It is assumed that w[n] is independent of x[n] and y[n].
- Equations (3a-c) are valid even if v[n] and w[n] take on intermediate values between 0 and 1. If the definition of the problem at hand is such that use of intermediate values makes sense, then they can be used. That is, the windowing functions v[n] and w[n] make a transition from one toward zero as the process obscures the signal and a transition towards one as the process terminates.
- Parametric techniques like autoregressive (AR) or autoregressive moving average (ARMA) models can compute the spectra, transfer function, and impulse response directly from the auto- and crosscorrelation without the use of the FFT.
- Parametric techniques have the advantage of weighting the major spectral features more heavily and hence usually require fewer degrees of freedom to specify the result.
- parametric transfer functions estimates can be forced to yield a causal relationship between the input and output.
- FFT-based methods require more degrees of freedom to represent the result, but weight all parts of the spectrum equally.
- the IPFM model is appropriate since integration of the modulation function m(t) is analogous to the charging of the phase 4 transmembrane potential of the SAN cells.
- m(t) is proportional to the instantaneous heart rate. It has been shown that for the IPFM model, HR[n] yields a better spectral estimate for m(t) (i.e., lower harmonic and intermodulation distortion) than estimates based on other time series [13].
- FIG. 1a the function m(t) represents the level of the combined influences modulating the SAN.
- the SAN integrates m(t). When the integral reaches a threshold, a beat is produced and the SAN begins integrating again.
- the goal of HR spectral estimation is to recover the spectrum of m(t).
- FIG. 1b is the ECG corresponding to m(t) from FIG. 1a. Each triangle in FIG. 1b represents one beat.
- the beat labelled E is an artificially introduced ectopic beat which did not originate in the SAN; E can be considered an atrial or ventricular ectopic beat.
- FIG. 1a the function m(t) represents the level of the combined influences modulating the SAN.
- the SAN integrates m(t). When the integral reaches a threshold, a beat is produced and the SAN begins integrating again.
- the goal of HR spectral estimation is to recover the spectrum of m(t).
- FIG. 1b is the ECG corresponding to m
- the function HR(t) is the instantaneous HR tachometer estimated from the RR intervals of the ECG. Note that the value of HR(t) for two intervals bounded by the ectopic beat is unknown.
- FIG. 1d is the estimate of HR[n] given by HR[n]/v[n] and
- FIG. 2 compares a spectrum computed according to the method of the invention (labelled "New" in the Figure) to a spectrum computed from a HR[n] series filled in by splining.
- HR[n] Immediately under HR[n] is a bar code which represents the ectopic intervals. The dark part of the bar indicates the "missing data", and accounts for 45% of the 5 minutes.
- the ectopic interval pattern is not simulated, but is taken from an actual clinical ECG containing substantial ectopy.
Abstract
Description
Claims (19)
Priority Applications (7)
| Application Number | Priority Date | Filing Date | Title |
|---|---|---|---|
| US07/247,738 US4979110A (en) | 1988-09-22 | 1988-09-22 | Characterizing the statistical properties of a biological signal |
| AT89911351T ATE142037T1 (en) | 1988-09-22 | 1989-09-19 | CHARACTERIZATION OF THE STATIC PROPERTIES OF A BIOLOGICAL SIGNAL |
| EP89911351A EP0435950B1 (en) | 1988-09-22 | 1989-09-19 | Characterizing the statistical properties of a biological signal |
| JP1510663A JPH04504963A (en) | 1988-09-22 | 1989-09-19 | Characterization of statistical properties of biological signals |
| DE68927056T DE68927056D1 (en) | 1988-09-22 | 1989-09-19 | CHARACTERIZATION OF THE STATIC PROPERTIES OF A BIOLOGICAL SIGNAL |
| PCT/US1989/004089 WO1990003616A1 (en) | 1988-09-22 | 1989-09-19 | Characterizing the statistical properties of a biological signal |
| CA000612273A CA1332762C (en) | 1988-09-22 | 1989-09-21 | Characterizing the statistical properties of a biological signal |
Applications Claiming Priority (1)
| Application Number | Priority Date | Filing Date | Title |
|---|---|---|---|
| US07/247,738 US4979110A (en) | 1988-09-22 | 1988-09-22 | Characterizing the statistical properties of a biological signal |
Publications (1)
| Publication Number | Publication Date |
|---|---|
| US4979110A true US4979110A (en) | 1990-12-18 |
Family
ID=22936166
Family Applications (1)
| Application Number | Title | Priority Date | Filing Date |
|---|---|---|---|
| US07/247,738 Expired - Lifetime US4979110A (en) | 1988-09-22 | 1988-09-22 | Characterizing the statistical properties of a biological signal |
Country Status (7)
| Country | Link |
|---|---|
| US (1) | US4979110A (en) |
| EP (1) | EP0435950B1 (en) |
| JP (1) | JPH04504963A (en) |
| AT (1) | ATE142037T1 (en) |
| CA (1) | CA1332762C (en) |
| DE (1) | DE68927056D1 (en) |
| WO (1) | WO1990003616A1 (en) |
Cited By (54)
| Publication number | Priority date | Publication date | Assignee | Title |
|---|---|---|---|---|
| WO1991019452A1 (en) * | 1990-06-20 | 1991-12-26 | Cedars-Sinai Medical Center | Methods for detecting and evaluating heart disorders |
| US5154180A (en) * | 1990-01-24 | 1992-10-13 | France Telecom | Method and device for determining a subject's sleep state by processing an electroencephalographic signal |
| US5243993A (en) * | 1991-06-28 | 1993-09-14 | Life Fitness | Apparatus and method for measuring heart rate |
| US5309917A (en) * | 1991-09-12 | 1994-05-10 | Drexel University | System and method of impedance cardiography and heartbeat determination |
| US5357970A (en) * | 1993-04-08 | 1994-10-25 | Critikon, Inc. | Method for determining dominant heart rates |
| US5406957A (en) * | 1992-02-05 | 1995-04-18 | Tansey; Michael A. | Electroencephalic neurofeedback apparatus for training and tracking of cognitive states |
| US5423326A (en) * | 1991-09-12 | 1995-06-13 | Drexel University | Apparatus and method for measuring cardiac output |
| WO1996008992A2 (en) * | 1994-09-14 | 1996-03-28 | Ramot University Authority For Applied Research & Industrial Development Ltd. | Apparatus and method for time dependent power spectrum analysis of physiological signals |
| US5555889A (en) * | 1990-06-20 | 1996-09-17 | Cedars-Sinai Medical Center | Methods for detecting propensity fibrillation |
| US5704365A (en) * | 1994-11-14 | 1998-01-06 | Cambridge Heart, Inc. | Using related signals to reduce ECG noise |
| US5724984A (en) * | 1995-01-26 | 1998-03-10 | Cambridge Heart, Inc. | Multi-segment ECG electrode and system |
| US5797840A (en) * | 1994-09-14 | 1998-08-25 | Ramot University Authority For Applied Research & Industrial Development Ltd. | Apparatus and method for time dependent power spectrum analysis of physiological signals |
| US5827195A (en) * | 1997-05-09 | 1998-10-27 | Cambridge Heart, Inc. | Electrocardiogram noise reduction using multi-dimensional filtering |
| US5891047A (en) * | 1997-03-14 | 1999-04-06 | Cambridge Heart, Inc. | Detecting abnormal activation of heart |
| US5891045A (en) * | 1996-07-17 | 1999-04-06 | Cambridge Heart, Inc. | Method and system for obtaining a localized cardiac measure |
| US5908393A (en) * | 1998-05-04 | 1999-06-01 | Cambridge Heart, Inc. | Reducing noise in a biological signal |
| US5935082A (en) * | 1995-01-26 | 1999-08-10 | Cambridge Heart, Inc. | Assessing cardiac electrical stability |
| US5984954A (en) * | 1997-10-01 | 1999-11-16 | Boston Medical Technologies, Inc. | Methods and apparatus for R-wave detection |
| US6021345A (en) * | 1991-05-17 | 2000-02-01 | Cedars-Sinai Medical Center | Methods for detecting propensity for fibrillation using an electrical restitution curve |
| US6094593A (en) * | 1991-05-17 | 2000-07-25 | Cedars-Sinai Medical Center | Method and apparatus for detecting prospenity for ventricular fibrillation using action potential curves |
| US6106481A (en) * | 1997-10-01 | 2000-08-22 | Boston Medical Technologies, Inc. | Method and apparatus for enhancing patient compliance during inspiration measurements |
| US6131084A (en) * | 1997-03-14 | 2000-10-10 | Digital Voice Systems, Inc. | Dual subframe quantization of spectral magnitudes |
| US6161038A (en) * | 1996-04-08 | 2000-12-12 | Rheo-Graphic Pte Ltd. | Non-invasive monitoring of hemodynamic parameters using impedance cardiography |
| US6161089A (en) * | 1997-03-14 | 2000-12-12 | Digital Voice Systems, Inc. | Multi-subframe quantization of spectral parameters |
| US6167351A (en) * | 1998-03-24 | 2000-12-26 | Tektronix, Inc. | Period determination of a periodic signal |
| US6199037B1 (en) | 1997-12-04 | 2001-03-06 | Digital Voice Systems, Inc. | Joint quantization of speech subframe voicing metrics and fundamental frequencies |
| US6377916B1 (en) | 1999-11-29 | 2002-04-23 | Digital Voice Systems, Inc. | Multiband harmonic transform coder |
| US6436053B1 (en) | 1997-10-01 | 2002-08-20 | Boston Medical Technologies, Inc. | Method and apparatus for enhancing patient compliance during inspiration measurements |
| US6478744B2 (en) | 1996-12-18 | 2002-11-12 | Sonomedica, Llc | Method of using an acoustic coupling for determining a physiologic signal |
| US20030067486A1 (en) * | 2001-10-06 | 2003-04-10 | Samsung Electronics Co., Ltd. | Apparatus and method for synthesizing emotions based on the human nervous system |
| US20040111033A1 (en) * | 2002-04-11 | 2004-06-10 | Harry Oung | Method and apparatus for monitoring the autonomic nervous system using non-stationary spectral analysis of heart rate and respiratory activity |
| WO2004108212A3 (en) * | 2003-06-02 | 2005-05-06 | Cameron Health Inc | Method and devices for performing cardiac waveform appraisal |
| US20050215918A1 (en) * | 2004-03-24 | 2005-09-29 | Frantz Ann K | Thoracic impedance monitor and electrode array and method of use |
| WO2007008447A2 (en) * | 2005-07-07 | 2007-01-18 | Oregon Health & Science University | Ventricular tachyarrhythmia prediction and/or prevention |
| US20090082684A1 (en) * | 2004-09-13 | 2009-03-26 | Gambro Lundia Ab | Detection of drastic blood pressure changes |
| US20090318996A1 (en) * | 2004-08-26 | 2009-12-24 | Pacesetter, Inc. | Opto-electrical coherence detection of hemodynamically compromising arrhythmia |
| US20100298717A1 (en) * | 2006-02-20 | 2010-11-25 | Alexander Sergeevich Parfyonov | Method for non-evasively determining an endothelial function and a device for carrying out said method |
| US20110098585A1 (en) * | 2009-10-27 | 2011-04-28 | Cameron Health, Inc. | Methods and Devices for Identifying Overdetection of Cardiac Signals |
| US8057400B2 (en) | 2009-05-12 | 2011-11-15 | Angiologix, Inc. | System and method of measuring changes in arterial volume of a limb segment |
| US8160687B2 (en) | 2008-05-07 | 2012-04-17 | Cameron Health, Inc. | Methods and devices for accurately classifying cardiac activity |
| US8160686B2 (en) | 2008-03-07 | 2012-04-17 | Cameron Health, Inc. | Methods and devices for accurately classifying cardiac activity |
| US8494630B2 (en) | 2008-01-18 | 2013-07-23 | Cameron Health, Inc. | Data manipulation following delivery of a cardiac stimulus in an implantable cardiac stimulus device |
| US8548573B2 (en) | 2010-01-18 | 2013-10-01 | Cameron Health, Inc. | Dynamically filtered beat detection in an implantable cardiac device |
| US8565878B2 (en) | 2008-03-07 | 2013-10-22 | Cameron Health, Inc. | Accurate cardiac event detection in an implantable cardiac stimulus device |
| US8712523B2 (en) | 2008-12-12 | 2014-04-29 | Cameron Health Inc. | Implantable defibrillator systems and methods with mitigations for saturation avoidance and accommodation |
| US8744555B2 (en) | 2009-10-27 | 2014-06-03 | Cameron Health, Inc. | Adaptive waveform appraisal in an implantable cardiac system |
| US9149637B2 (en) | 2009-06-29 | 2015-10-06 | Cameron Health, Inc. | Adaptive confirmation of treatable arrhythmia in implantable cardiac stimulus devices |
| US9149645B2 (en) | 2013-03-11 | 2015-10-06 | Cameron Health, Inc. | Methods and devices implementing dual criteria for arrhythmia detection |
| US9364184B2 (en) | 2002-03-18 | 2016-06-14 | Sonomedica, Inc. | Method of processing cardiovascular sound signals |
| US9470728B2 (en) | 2012-05-09 | 2016-10-18 | Cardioinsight Technologies, Inc. | Channel integrity detection |
| US9554714B2 (en) | 2014-08-14 | 2017-01-31 | Cameron Health Inc. | Use of detection profiles in an implantable medical device |
| CN111035378A (en) * | 2020-03-17 | 2020-04-21 | 深圳市富源欣袋业有限公司 | Health data monitoring method based on travel bag and intelligent travel bag |
| US10874318B2 (en) | 2018-03-06 | 2020-12-29 | Cardioinsight Technologies, Inc. | Channel integrity detection and reconstruction of electrophysiological signals |
| US11284827B2 (en) | 2017-10-21 | 2022-03-29 | Ausculsciences, Inc. | Medical decision support system |
Families Citing this family (4)
| Publication number | Priority date | Publication date | Assignee | Title |
|---|---|---|---|---|
| EP2967482A2 (en) | 2013-03-15 | 2016-01-20 | Andreas Jörg Schriefl | Automated diagnosis-assisting medical devices utilizing rate/frequency estimation and pattern localization of quasi-periodic signals |
| WO2019183412A1 (en) | 2018-03-21 | 2019-09-26 | Massachusetts Institute Of Technology | Systems and methods for detecting seismo-electromagnetic conversion |
| WO2019217653A1 (en) * | 2018-05-09 | 2019-11-14 | Massachusetts Institute Of Technology | Systems and methods for focused blind deconvolution |
| US11085293B2 (en) | 2019-06-06 | 2021-08-10 | Massachusetts Institute Of Technology | Sequential estimation while drilling |
Family Cites Families (4)
| Publication number | Priority date | Publication date | Assignee | Title |
|---|---|---|---|---|
| DE2716739C3 (en) * | 1977-04-14 | 1980-06-26 | Biotronik Mess- Und Therapiegeraete Gmbh & Co Ingenieurbuero Berlin, 1000 Berlin | Method for the detection of signals |
| JPS5633574A (en) * | 1979-08-27 | 1981-04-04 | Toshiba Corp | Detecting device of signal |
| US4777960A (en) * | 1986-08-18 | 1988-10-18 | Massachusetts Institute Of Technology | Method and apparatus for the assessment of autonomic response by broad-band excitation |
| CN1009330B (en) * | 1987-03-30 | 1990-08-29 | 创建基立有限公司 | A kind of computer electrical signal detection blood processor |
-
1988
- 1988-09-22 US US07/247,738 patent/US4979110A/en not_active Expired - Lifetime
-
1989
- 1989-09-19 DE DE68927056T patent/DE68927056D1/en not_active Expired - Lifetime
- 1989-09-19 AT AT89911351T patent/ATE142037T1/en not_active IP Right Cessation
- 1989-09-19 WO PCT/US1989/004089 patent/WO1990003616A1/en active IP Right Grant
- 1989-09-19 JP JP1510663A patent/JPH04504963A/en active Pending
- 1989-09-19 EP EP89911351A patent/EP0435950B1/en not_active Expired - Lifetime
- 1989-09-21 CA CA000612273A patent/CA1332762C/en not_active Expired - Fee Related
Non-Patent Citations (13)
| Title |
|---|
| Akselrod et al., Science, vol. 213 (1981), Power Spectrum Analysis of Heart Rate Fluctuation: a Quantitative Probe of Beat To Beat Cardiovascular Control. * |
| Akselrod et al., Science, vol. 213 (1981), Power Spectrum Analysis of Heart Rate Fluctuation: a Quantitative Probe of Beat-To-Beat Cardiovascular Control. |
| Berger et al., IEEE Trans. Biomed. Eng., vol. BME 33 (1986), An Efficient Algorithm for Spectral Analysis of Heart Rate Variability. * |
| Berger et al., IEEE Trans. Biomed. Eng., vol. BME-33 (1986), An Efficient Algorithm for Spectral Analysis of Heart Rate Variability. |
| Bloomfield, J. R., Statis, Soc. B (1970), Special Analysis with Randomly Missing Observations. * |
| Myers, et al., IEEE Trans. on Biomedical Eng., vol. BME 33 (1986), Power Spectral Analysis of Heart Rate Variability in Sudden Cardiac Death: Comparison to Other Methods. * |
| Myers, et al., IEEE Trans. on Biomedical Eng., vol. BME-33 (1986), Power Spectral Analysis of Heart Rate Variability in Sudden Cardiac Death: Comparison to Other Methods. |
| Pagani et al., Cir. Res., vol 59 (1986), Power Spectral Analysis of Heart Rate and Arterial Pressure Variabilities as a Marker of Sympatho Vagal Interaction in Man and Conscious Dog. * |
| Parzen, Sankhya A., vol. 25 (1963), on Spectral Analysis with Missing Observations and Amplitude Modulation. * |
| Pomeranz et al., M. J., Phys. vol. 248 (1985), Assessment of Autonomic Function in Humans by Heart Rate Spectral Analysis. * |
| Saul et al., Am. J. Cardiol., vol. 61 (1988), Assessment of Autonomic Regulation in Chronic Congestive Heart Failure by Heart Rate Spectral Analysis. * |
| Scheinok, Ann. Math. Statis., vol. 36 (1965), Spectral Analysis with Randomly Missed Observations: the Binomial Case. * |
| Van Der Akker et al. Automedica, vol. 4 (1983), Heart Rate Variability and Blood Pressure Oscillations in Diabetics with Autonomic Neuropathy. * |
Cited By (102)
| Publication number | Priority date | Publication date | Assignee | Title |
|---|---|---|---|---|
| US5154180A (en) * | 1990-01-24 | 1992-10-13 | France Telecom | Method and device for determining a subject's sleep state by processing an electroencephalographic signal |
| US5643325A (en) * | 1990-06-20 | 1997-07-01 | Cedars-Sinai Medical Center | Defibrillator with shock energy based on EKG transform |
| WO1991019452A1 (en) * | 1990-06-20 | 1991-12-26 | Cedars-Sinai Medical Center | Methods for detecting and evaluating heart disorders |
| US5678561A (en) * | 1990-06-20 | 1997-10-21 | Cedars-Sinai Medical Center | Methods for detecting propensity for fibrillation |
| US5555889A (en) * | 1990-06-20 | 1996-09-17 | Cedars-Sinai Medical Center | Methods for detecting propensity fibrillation |
| US6021345A (en) * | 1991-05-17 | 2000-02-01 | Cedars-Sinai Medical Center | Methods for detecting propensity for fibrillation using an electrical restitution curve |
| US6094593A (en) * | 1991-05-17 | 2000-07-25 | Cedars-Sinai Medical Center | Method and apparatus for detecting prospenity for ventricular fibrillation using action potential curves |
| US5243993A (en) * | 1991-06-28 | 1993-09-14 | Life Fitness | Apparatus and method for measuring heart rate |
| US5309917A (en) * | 1991-09-12 | 1994-05-10 | Drexel University | System and method of impedance cardiography and heartbeat determination |
| US5423326A (en) * | 1991-09-12 | 1995-06-13 | Drexel University | Apparatus and method for measuring cardiac output |
| US5443073A (en) * | 1991-09-12 | 1995-08-22 | Drexel University | System and method of impedance cardiography monitoring |
| US5406957A (en) * | 1992-02-05 | 1995-04-18 | Tansey; Michael A. | Electroencephalic neurofeedback apparatus for training and tracking of cognitive states |
| US5357970A (en) * | 1993-04-08 | 1994-10-25 | Critikon, Inc. | Method for determining dominant heart rates |
| US5713367A (en) * | 1994-01-26 | 1998-02-03 | Cambridge Heart, Inc. | Measuring and assessing cardiac electrical stability |
| WO1996008992A3 (en) * | 1994-09-14 | 1996-06-13 | Univ Ramot | Apparatus and method for time dependent power spectrum analysis of physiological signals |
| US5797840A (en) * | 1994-09-14 | 1998-08-25 | Ramot University Authority For Applied Research & Industrial Development Ltd. | Apparatus and method for time dependent power spectrum analysis of physiological signals |
| WO1996008992A2 (en) * | 1994-09-14 | 1996-03-28 | Ramot University Authority For Applied Research & Industrial Development Ltd. | Apparatus and method for time dependent power spectrum analysis of physiological signals |
| US5704365A (en) * | 1994-11-14 | 1998-01-06 | Cambridge Heart, Inc. | Using related signals to reduce ECG noise |
| US5724984A (en) * | 1995-01-26 | 1998-03-10 | Cambridge Heart, Inc. | Multi-segment ECG electrode and system |
| US5935082A (en) * | 1995-01-26 | 1999-08-10 | Cambridge Heart, Inc. | Assessing cardiac electrical stability |
| US6161038A (en) * | 1996-04-08 | 2000-12-12 | Rheo-Graphic Pte Ltd. | Non-invasive monitoring of hemodynamic parameters using impedance cardiography |
| US6047206A (en) * | 1996-07-17 | 2000-04-04 | Cambridge Heart, Inc. | Generation of localized cardiac measures |
| US5891045A (en) * | 1996-07-17 | 1999-04-06 | Cambridge Heart, Inc. | Method and system for obtaining a localized cardiac measure |
| US7416531B2 (en) | 1996-12-18 | 2008-08-26 | Mohler Sailor H | System and method of detecting and processing physiological sounds |
| US6478744B2 (en) | 1996-12-18 | 2002-11-12 | Sonomedica, Llc | Method of using an acoustic coupling for determining a physiologic signal |
| US5891047A (en) * | 1997-03-14 | 1999-04-06 | Cambridge Heart, Inc. | Detecting abnormal activation of heart |
| US6131084A (en) * | 1997-03-14 | 2000-10-10 | Digital Voice Systems, Inc. | Dual subframe quantization of spectral magnitudes |
| US6161089A (en) * | 1997-03-14 | 2000-12-12 | Digital Voice Systems, Inc. | Multi-subframe quantization of spectral parameters |
| US5827195A (en) * | 1997-05-09 | 1998-10-27 | Cambridge Heart, Inc. | Electrocardiogram noise reduction using multi-dimensional filtering |
| US6436053B1 (en) | 1997-10-01 | 2002-08-20 | Boston Medical Technologies, Inc. | Method and apparatus for enhancing patient compliance during inspiration measurements |
| US6161037A (en) * | 1997-10-01 | 2000-12-12 | Boston Medical Technologies, Inc. | Methods and apparatus for R-wave detection |
| US5984954A (en) * | 1997-10-01 | 1999-11-16 | Boston Medical Technologies, Inc. | Methods and apparatus for R-wave detection |
| US6106481A (en) * | 1997-10-01 | 2000-08-22 | Boston Medical Technologies, Inc. | Method and apparatus for enhancing patient compliance during inspiration measurements |
| US6740046B2 (en) | 1997-10-01 | 2004-05-25 | Boston Medical Technologies, Inc. | Method and apparatus for enhancing patient compliance during inspiration measurements |
| US6199037B1 (en) | 1997-12-04 | 2001-03-06 | Digital Voice Systems, Inc. | Joint quantization of speech subframe voicing metrics and fundamental frequencies |
| US6167351A (en) * | 1998-03-24 | 2000-12-26 | Tektronix, Inc. | Period determination of a periodic signal |
| US5908393A (en) * | 1998-05-04 | 1999-06-01 | Cambridge Heart, Inc. | Reducing noise in a biological signal |
| US6377916B1 (en) | 1999-11-29 | 2002-04-23 | Digital Voice Systems, Inc. | Multiband harmonic transform coder |
| US20030067486A1 (en) * | 2001-10-06 | 2003-04-10 | Samsung Electronics Co., Ltd. | Apparatus and method for synthesizing emotions based on the human nervous system |
| US7333969B2 (en) * | 2001-10-06 | 2008-02-19 | Samsung Electronics Co., Ltd. | Apparatus and method for synthesizing emotions based on the human nervous system |
| US9364184B2 (en) | 2002-03-18 | 2016-06-14 | Sonomedica, Inc. | Method of processing cardiovascular sound signals |
| US7079888B2 (en) | 2002-04-11 | 2006-07-18 | Ansar, Inc. | Method and apparatus for monitoring the autonomic nervous system using non-stationary spectral analysis of heart rate and respiratory activity |
| US20040111033A1 (en) * | 2002-04-11 | 2004-06-10 | Harry Oung | Method and apparatus for monitoring the autonomic nervous system using non-stationary spectral analysis of heart rate and respiratory activity |
| US8626285B2 (en) | 2003-06-02 | 2014-01-07 | Cameron Health, Inc. | Method and devices for performing cardiac waveform appraisal |
| US7248921B2 (en) * | 2003-06-02 | 2007-07-24 | Cameron Health, Inc. | Method and devices for performing cardiac waveform appraisal |
| WO2004108212A3 (en) * | 2003-06-02 | 2005-05-06 | Cameron Health Inc | Method and devices for performing cardiac waveform appraisal |
| US20050215918A1 (en) * | 2004-03-24 | 2005-09-29 | Frantz Ann K | Thoracic impedance monitor and electrode array and method of use |
| US7474918B2 (en) | 2004-03-24 | 2009-01-06 | Noninvasive Medical Technologies, Inc. | Thoracic impedance monitor and electrode array and method of use |
| US20090318996A1 (en) * | 2004-08-26 | 2009-12-24 | Pacesetter, Inc. | Opto-electrical coherence detection of hemodynamically compromising arrhythmia |
| US20090082684A1 (en) * | 2004-09-13 | 2009-03-26 | Gambro Lundia Ab | Detection of drastic blood pressure changes |
| US8060190B2 (en) * | 2004-09-13 | 2011-11-15 | Gambro Lundia Ab | Detection of drastic blood pressure changes |
| US20070288061A1 (en) * | 2005-07-07 | 2007-12-13 | Oregon Health & Science University | Ventricular tachyarrhythmia prediction and/or prevention |
| WO2007008447A3 (en) * | 2005-07-07 | 2007-04-05 | Univ Oregon Health & Science | Ventricular tachyarrhythmia prediction and/or prevention |
| US7930025B2 (en) | 2005-07-07 | 2011-04-19 | Oregon Health & Science University | Ventricular tachyarrhythmia prediction and/or prevention |
| WO2007008447A2 (en) * | 2005-07-07 | 2007-01-18 | Oregon Health & Science University | Ventricular tachyarrhythmia prediction and/or prevention |
| US7471982B2 (en) | 2005-07-07 | 2008-12-30 | Oregon Health & Science University | Ventricular tachyarrhythmia prediction and/or prevention |
| US20070038254A1 (en) * | 2005-07-07 | 2007-02-15 | Oregon Health & Science University | Ventricular tachyarrhythmia prediction and/or prevention |
| US20100298717A1 (en) * | 2006-02-20 | 2010-11-25 | Alexander Sergeevich Parfyonov | Method for non-evasively determining an endothelial function and a device for carrying out said method |
| US10238306B2 (en) | 2006-02-20 | 2019-03-26 | Everist Genomics, Inc. | Method for non-evasively determining an endothelial function and a device for carrying out said method |
| US8494630B2 (en) | 2008-01-18 | 2013-07-23 | Cameron Health, Inc. | Data manipulation following delivery of a cardiac stimulus in an implantable cardiac stimulus device |
| US9242112B2 (en) | 2008-01-18 | 2016-01-26 | Cameron Health, Inc. | Data manipulation following delivery of a cardiac stimulus in an implantable cardiac stimulus device |
| US8700152B2 (en) | 2008-01-18 | 2014-04-15 | Cameron Health, Inc. | Data manipulation following delivery of a cardiac stimulus in an implantable cardiac stimulus device |
| US10974058B2 (en) | 2008-03-07 | 2021-04-13 | Cameron Health, Inc. | Methods and devices for accurately classifying cardiac activity |
| US9878172B2 (en) | 2008-03-07 | 2018-01-30 | Cameron Health, Inc. | Methods and devices for accurately classifying cardiac activity |
| US8565878B2 (en) | 2008-03-07 | 2013-10-22 | Cameron Health, Inc. | Accurate cardiac event detection in an implantable cardiac stimulus device |
| US8588896B2 (en) | 2008-03-07 | 2013-11-19 | Cameron Health, Inc. | Methods and devices for accurately classifying cardiac activity |
| US9802056B2 (en) | 2008-03-07 | 2017-10-31 | Cameron Health, Inc. | Accurate cardiac event detection in an implantable cardiac stimulus device |
| US8265749B2 (en) | 2008-03-07 | 2012-09-11 | Cameron Health, Inc. | Methods and devices for accurately classifying cardiac activity |
| US8626280B2 (en) | 2008-03-07 | 2014-01-07 | Cameron Health, Inc. | Methods and devices for accurately classifying cardiac activity |
| US10220219B2 (en) | 2008-03-07 | 2019-03-05 | Cameron Health, Inc. | Methods and devices for accurately classifying cardiac activity |
| US8160686B2 (en) | 2008-03-07 | 2012-04-17 | Cameron Health, Inc. | Methods and devices for accurately classifying cardiac activity |
| US9162074B2 (en) | 2008-03-07 | 2015-10-20 | Cameron Health, Inc. | Methods and devices for accurately classifying cardiac activity |
| US9339662B2 (en) | 2008-03-07 | 2016-05-17 | Cameron Health, Inc. | Methods and devices for accurately classifying cardiac activity |
| US11413468B2 (en) | 2008-03-07 | 2022-08-16 | Cameron Health, Inc. | Accurate cardiac event detection in an implantable cardiac stimulus device |
| US8929977B2 (en) | 2008-03-07 | 2015-01-06 | Cameron Health, Inc. | Methods and devices for accurately classifying cardiac activity |
| US9763619B2 (en) | 2008-05-07 | 2017-09-19 | Cameron Health, Inc. | Methods and devices for accurately classifying cardiac activity |
| US10709379B2 (en) | 2008-05-07 | 2020-07-14 | Cameron Health, Inc. | Methods and devices for accurately classifying cardiac activity |
| US8160687B2 (en) | 2008-05-07 | 2012-04-17 | Cameron Health, Inc. | Methods and devices for accurately classifying cardiac activity |
| US8600489B2 (en) | 2008-05-07 | 2013-12-03 | Cameron Health, Inc. | Methods and devices for accurately classifying cardiac activity |
| US8880161B2 (en) | 2008-05-07 | 2014-11-04 | Cameron Health, Inc. | Methods and devices for accurately classifying cardiac activity |
| US9265432B2 (en) | 2008-05-07 | 2016-02-23 | Cameron Health, Inc. | Methods and devices for accurately classifying cardiac activity |
| US8712523B2 (en) | 2008-12-12 | 2014-04-29 | Cameron Health Inc. | Implantable defibrillator systems and methods with mitigations for saturation avoidance and accommodation |
| US9079035B2 (en) | 2008-12-12 | 2015-07-14 | Cameron Health, Inc. | Electrode spacing in a subcutaneous implantable cardiac stimulus device |
| US8657755B2 (en) | 2009-05-12 | 2014-02-25 | Angiologix, Inc. | System and method of measuring changes in arterial volume of a limb segment |
| US8057400B2 (en) | 2009-05-12 | 2011-11-15 | Angiologix, Inc. | System and method of measuring changes in arterial volume of a limb segment |
| US9636514B2 (en) | 2009-06-29 | 2017-05-02 | Cameron Health, Inc. | Adaptive confirmation of treatable arrhythmia in implantable cardiac stimulus devices |
| US9149637B2 (en) | 2009-06-29 | 2015-10-06 | Cameron Health, Inc. | Adaptive confirmation of treatable arrhythmia in implantable cardiac stimulus devices |
| US8744555B2 (en) | 2009-10-27 | 2014-06-03 | Cameron Health, Inc. | Adaptive waveform appraisal in an implantable cardiac system |
| US8965491B2 (en) | 2009-10-27 | 2015-02-24 | Cameron Health, Inc. | Adaptive waveform appraisal in an implantable cardiac system |
| US20110098585A1 (en) * | 2009-10-27 | 2011-04-28 | Cameron Health, Inc. | Methods and Devices for Identifying Overdetection of Cardiac Signals |
| US8265737B2 (en) | 2009-10-27 | 2012-09-11 | Cameron Health, Inc. | Methods and devices for identifying overdetection of cardiac signals |
| US8548573B2 (en) | 2010-01-18 | 2013-10-01 | Cameron Health, Inc. | Dynamically filtered beat detection in an implantable cardiac device |
| US9470728B2 (en) | 2012-05-09 | 2016-10-18 | Cardioinsight Technologies, Inc. | Channel integrity detection |
| US9977060B2 (en) | 2012-05-09 | 2018-05-22 | Cardioinsight Technologies, Inc. | Channel integrity detection |
| US9149645B2 (en) | 2013-03-11 | 2015-10-06 | Cameron Health, Inc. | Methods and devices implementing dual criteria for arrhythmia detection |
| US9421390B2 (en) | 2013-03-11 | 2016-08-23 | Cameron Health Inc. | Methods and devices implementing dual criteria for arrhythmia detection |
| US9844678B2 (en) | 2013-03-11 | 2017-12-19 | Cameron Health, Inc. | Methods and devices implementing dual criteria for arrhythmia detection |
| US9554714B2 (en) | 2014-08-14 | 2017-01-31 | Cameron Health Inc. | Use of detection profiles in an implantable medical device |
| US10758138B2 (en) | 2014-08-14 | 2020-09-01 | Cameron Health, Inc. | Use of detection profiles in an implantable medical device |
| US11284827B2 (en) | 2017-10-21 | 2022-03-29 | Ausculsciences, Inc. | Medical decision support system |
| US10874318B2 (en) | 2018-03-06 | 2020-12-29 | Cardioinsight Technologies, Inc. | Channel integrity detection and reconstruction of electrophysiological signals |
| CN111035378A (en) * | 2020-03-17 | 2020-04-21 | 深圳市富源欣袋业有限公司 | Health data monitoring method based on travel bag and intelligent travel bag |
Also Published As
| Publication number | Publication date |
|---|---|
| ATE142037T1 (en) | 1996-09-15 |
| EP0435950A4 (en) | 1992-07-22 |
| EP0435950B1 (en) | 1996-08-28 |
| CA1332762C (en) | 1994-10-25 |
| WO1990003616A1 (en) | 1990-04-05 |
| JPH04504963A (en) | 1992-09-03 |
| DE68927056D1 (en) | 1996-10-02 |
| EP0435950A1 (en) | 1991-07-10 |
Similar Documents
| Publication | Publication Date | Title |
|---|---|---|
| US4979110A (en) | Characterizing the statistical properties of a biological signal | |
| US4930517A (en) | Method and apparatus for physiologic system identification | |
| Braun et al. | Demonstration of nonlinear components in heart rate variability of healthy persons | |
| Mulder | Measurement and analysis methods of heart rate and respiration for use in applied environments | |
| Baselli et al. | Spectral and cross-spectral analysis of heart rate and arterial blood pressure variability signals | |
| JP3710823B2 (en) | Improved method and apparatus for measuring cardiac output | |
| US6308094B1 (en) | System for prediction of cardiac arrhythmias | |
| Aboy et al. | An automatic beat detection algorithm for pressure signals | |
| EP0256887B1 (en) | A method of characterizing the dynamic response of the Autonomic Nervous System. | |
| Mulder et al. | Estimating mental effort using heart rate and heart rate variability | |
| US20110319724A1 (en) | Methods and systems for non-invasive, internal hemorrhage detection | |
| Mukkamala et al. | A forward model-based validation of cardiovascular system identification | |
| Mainardi et al. | Pole-tracking algorithms for the extraction of time-variant heart rate variability spectral parameters | |
| Zhong et al. | Nonlinear analysis of the separate contributions of autonomic nervous systems to heart rate variability using principal dynamic modes | |
| Clifford et al. | A realistic coupled nonlinear artificial ECG, BP, and respiratory signal generator for assessing noise performance of biomedical signal processing algorithms | |
| Patton et al. | Baroreflex gain: characterization using autoregressive moving average analysis | |
| Censi et al. | Coupling patterns between spontaneous rhythms and respiration in cardiovascular variability signals | |
| Meste et al. | Time-varying analysis methods and models for the respiratory and cardiac system coupling in graded exercise | |
| Christini et al. | Influence of autoregressive model parameter uncertainty on spectral estimates of heart rate dynamics | |
| US8602985B2 (en) | System and method to estimate signal artifacts | |
| Silva | Quantitative analysis of the autonomic nervous system: toolbox development and application | |
| Woolfson | Study of cardiac arrhythmia using the Kalman filter | |
| Caridade Gomes | Development of an open-source Python toolbox for heart rate variability (HRV) | |
| Clariá et al. | The effects of coronary occlusion location on the RR signal | |
| Fikriastuti et al. | Respiratory Rate Estimations using Three Respiratory-Induced Variations on Photoplethysmogram |
Legal Events
| Date | Code | Title | Description |
|---|---|---|---|
| AS | Assignment |
Owner name: MASSACHUSETTS INSTITUTE OF TECHNOLOGY, CAMBRIDGE, Free format text: ASSIGNMENT OF ASSIGNORS INTEREST.;ASSIGNORS:ALBRECHT, PAUL;COHEN, RICHARD J.;REEL/FRAME:004954/0610 Effective date: 19881027 Owner name: MASSACHUSETTS INSTITUTE OF TECHNOLOGY, CAMBRIDGE, Free format text: ASSIGNMENT OF ASSIGNORS INTEREST;ASSIGNORS:ALBRECHT, PAUL;COHEN, RICHARD J.;REEL/FRAME:004954/0610 Effective date: 19881027 |
|
| STCF | Information on status: patent grant |
Free format text: PATENTED CASE |
|
| FEPP | Fee payment procedure |
Free format text: PAYOR NUMBER ASSIGNED (ORIGINAL EVENT CODE: ASPN); ENTITY STATUS OF PATENT OWNER: SMALL ENTITY |
|
| CC | Certificate of correction | ||
| FEPP | Fee payment procedure |
Free format text: PAYER NUMBER DE-ASSIGNED (ORIGINAL EVENT CODE: RMPN); ENTITY STATUS OF PATENT OWNER: SMALL ENTITY Free format text: PAYOR NUMBER ASSIGNED (ORIGINAL EVENT CODE: ASPN); ENTITY STATUS OF PATENT OWNER: SMALL ENTITY |
|
| FPAY | Fee payment |
Year of fee payment: 4 |
|
| FPAY | Fee payment |
Year of fee payment: 8 |
|
| FPAY | Fee payment |
Year of fee payment: 12 |