US5435310A - Determining cardiac wall thickness and motion by imaging and three-dimensional modeling - Google Patents
Determining cardiac wall thickness and motion by imaging and three-dimensional modeling Download PDFInfo
- Publication number
- US5435310A US5435310A US08/082,404 US8240493A US5435310A US 5435310 A US5435310 A US 5435310A US 8240493 A US8240493 A US 8240493A US 5435310 A US5435310 A US 5435310A
- Authority
- US
- United States
- Prior art keywords
- heart
- tiled
- imaging
- volumetric
- determining
- Prior art date
- Legal status (The legal status is an assumption and is not a legal conclusion. Google has not performed a legal analysis and makes no representation as to the accuracy of the status listed.)
- Expired - Lifetime
Links
Images


Classifications
-
- G—PHYSICS
- G06—COMPUTING; CALCULATING OR COUNTING
- G06T—IMAGE DATA PROCESSING OR GENERATION, IN GENERAL
- G06T17/00—Three dimensional [3D] modelling, e.g. data description of 3D objects
- G06T17/20—Finite element generation, e.g. wire-frame surface description, tesselation
-
- B—PERFORMING OPERATIONS; TRANSPORTING
- B82—NANOTECHNOLOGY
- B82Y—SPECIFIC USES OR APPLICATIONS OF NANOSTRUCTURES; MEASUREMENT OR ANALYSIS OF NANOSTRUCTURES; MANUFACTURE OR TREATMENT OF NANOSTRUCTURES
- B82Y15/00—Nanotechnology for interacting, sensing or actuating, e.g. quantum dots as markers in protein assays or molecular motors
-
- G—PHYSICS
- G06—COMPUTING; CALCULATING OR COUNTING
- G06T—IMAGE DATA PROCESSING OR GENERATION, IN GENERAL
- G06T7/00—Image analysis
- G06T7/10—Segmentation; Edge detection
- G06T7/12—Edge-based segmentation
-
- G—PHYSICS
- G06—COMPUTING; CALCULATING OR COUNTING
- G06T—IMAGE DATA PROCESSING OR GENERATION, IN GENERAL
- G06T7/00—Image analysis
- G06T7/60—Analysis of geometric attributes
- G06T7/62—Analysis of geometric attributes of area, perimeter, diameter or volume
-
- G—PHYSICS
- G16—INFORMATION AND COMMUNICATION TECHNOLOGY [ICT] SPECIALLY ADAPTED FOR SPECIFIC APPLICATION FIELDS
- G16H—HEALTHCARE INFORMATICS, i.e. INFORMATION AND COMMUNICATION TECHNOLOGY [ICT] SPECIALLY ADAPTED FOR THE HANDLING OR PROCESSING OF MEDICAL OR HEALTHCARE DATA
- G16H50/00—ICT specially adapted for medical diagnosis, medical simulation or medical data mining; ICT specially adapted for detecting, monitoring or modelling epidemics or pandemics
- G16H50/50—ICT specially adapted for medical diagnosis, medical simulation or medical data mining; ICT specially adapted for detecting, monitoring or modelling epidemics or pandemics for simulation or modelling of medical disorders
-
- G—PHYSICS
- G06—COMPUTING; CALCULATING OR COUNTING
- G06T—IMAGE DATA PROCESSING OR GENERATION, IN GENERAL
- G06T2207/00—Indexing scheme for image analysis or image enhancement
- G06T2207/10—Image acquisition modality
- G06T2207/10072—Tomographic images
- G06T2207/10081—Computed x-ray tomography [CT]
-
- G—PHYSICS
- G06—COMPUTING; CALCULATING OR COUNTING
- G06T—IMAGE DATA PROCESSING OR GENERATION, IN GENERAL
- G06T2207/00—Indexing scheme for image analysis or image enhancement
- G06T2207/10—Image acquisition modality
- G06T2207/10132—Ultrasound image
-
- G—PHYSICS
- G06—COMPUTING; CALCULATING OR COUNTING
- G06T—IMAGE DATA PROCESSING OR GENERATION, IN GENERAL
- G06T2207/00—Indexing scheme for image analysis or image enhancement
- G06T2207/30—Subject of image; Context of image processing
- G06T2207/30004—Biomedical image processing
- G06T2207/30048—Heart; Cardiac
-
- G—PHYSICS
- G16—INFORMATION AND COMMUNICATION TECHNOLOGY [ICT] SPECIALLY ADAPTED FOR SPECIFIC APPLICATION FIELDS
- G16H—HEALTHCARE INFORMATICS, i.e. INFORMATION AND COMMUNICATION TECHNOLOGY [ICT] SPECIALLY ADAPTED FOR THE HANDLING OR PROCESSING OF MEDICAL OR HEALTHCARE DATA
- G16H30/00—ICT specially adapted for the handling or processing of medical images
- G16H30/20—ICT specially adapted for the handling or processing of medical images for handling medical images, e.g. DICOM, HL7 or PACS
-
- G—PHYSICS
- G16—INFORMATION AND COMMUNICATION TECHNOLOGY [ICT] SPECIALLY ADAPTED FOR SPECIFIC APPLICATION FIELDS
- G16H—HEALTHCARE INFORMATICS, i.e. INFORMATION AND COMMUNICATION TECHNOLOGY [ICT] SPECIALLY ADAPTED FOR THE HANDLING OR PROCESSING OF MEDICAL OR HEALTHCARE DATA
- G16H30/00—ICT specially adapted for the handling or processing of medical images
- G16H30/40—ICT specially adapted for the handling or processing of medical images for processing medical images, e.g. editing
Definitions
- This invention generally relates to a method for imaging and modeling a heart in three-dimensions, and more specifically, to a method for using a three-dimensional model of the heart to determine cardiac parameters.
- monitoring certain parameters of lea ventricular function can provide information useful for evaluating a patient's condition during surgical procedures. These parameters also provide information that can be used to detect coronary heart disease and other medical problems of the heart.
- One of the most commonly used parameters for diagnostic purposes is the left ventricular global ejection fraction, which expresses the proportion of chamber volume ejected with each heart beat.
- Other important parameters include the range of motion of the left ventricular wall and the thickening of the ventricular wall, both of which are indicators of coronary heart disease, and of other disease entities.
- the effects of coronary heart disease are regional, being limited to the portion of the heart muscle receiving blood supply from an affected artery.
- the internal diameter of an artery is reduced by atherosclerotic plaque, blood flow to the specific region of the heart supplied by that artery is restricted.
- some degree of dysfunction occurs in the affected heart muscle.
- the affected muscle dies and is replaced by scar tissue, which is non-contractile.
- the progress of coronary artery disease is revealed by its effect on regional left ventricular function, and the severity of a heart attack is measured by the size of the dysfunctioning region and by the extent of the dysfunction.
- any improvement of regional function in the affected portion of the left ventricle is an indication of the effectiveness of a prescribed treatment.
- the detection of regional dysfunction has also been used during stress studies, wherein a patient's heart is imaged using ultrasound while at rest and after exercise, to determine whether the patient's arteries, which may have been open sufficiently while at rest, provide inadequate blood flow during exercise.
- the degree of dysfunction after a heart attack has occurred may also be determined to develop a prognosis. For example, patients with serious residual dysfunction after a heart attack are at a higher risk of dying in the first year and more aggressive treatment may be indicated.
- one of the preferred methods to detect and evaluate regional dysfunction in the left ventricle is to measure the range of wall motion, i.e., the range of movement of the ventricular wall during a cardiac cycle.
- Another approach is to measure regional wall thickening, which is also an indication of coronary disease and muscle dysfunction.
- Previous techniques for measuring these parameters have typically relied upon two-dimensional imaging of the cardiac wall, which can introduce significant error due to failure to compensate for the angle of the beam relative to the cardiac wall.
- two-dimensional imaging generally is limited in its ability to clearly localize regional left ventricular dysfunction or provide an overall view of an affected region that allows a physician to immediately interpret the extent and degree of dysfunction.
- An optimum device for imaging selected portions of the heart is a transesophageal ultrasonic probe.
- an imaging probe disposed in the esophagus behind the heart most of the heart structure can be imaged without interference from the lungs or ribs, as often occurs with transcutaneous imaging. If the patient is anaesthetized during the procedure, there is no discomfort and the probe can be maintained at the same position for several hours.
- a method for using the image provided by such a probe to model a selected region of the heart so as to determine range of cardiac wall motion and wall thickness at specific points on the cardiac wall in real time will therefore be of significant benefit during cardiac surgery.
- a method that references specific regions of the heart to a standard or average cardiac template so as to provide a specific identification of an affected region that is generally independent of the size and shape of a patient's heart (even if abnormal due to disease) should aid in better assessing problems that are diagnosed.
- a method for analyzing cardiac parameters of a patient's heart begins with the step of imaging the heart to produce imaging data.
- the heart is modeled, producing modeling data corresponding to at least one of an inner surface and an outer surface of the heart, at both an end systole and an end diastole of a cardiac cycle.
- a center surface that is generally midway between two surfaces to which the modeling data correspond is then defined.
- This center surface is represented by a plurality of tiled sections comprising polygons.
- the tiled sections are projected onto the two surfaces to define volumetric elements having opposite ends on the two surfaces. Each volumetric element contains a different one of the tiled sections.
- the respective areas of the opposite ends of each volumetric element are determined, as is a volume for each of the volumetric elements.
- the areas of the opposite ends of the volumetric elements are then averaged.
- Characteristic cardiac parameters at a given volumetric element are determined as a function of the average area of these ends and of the volume of the volumetric element.
- the characteristic parameters include a range of motion for a wall of the heart and a thickness of the wall of the heart, both parameters being spatially related to the volumetric elements.
- the step of imaging includes the steps of digitizing an analog output signal produced by an imaging device to produce a digital signal. Using the digital signal, images of the inner and the outer surfaces of the heart are graphically displayed. Borders of the images of the inner and the outer surfaces of the heart are then traced to define the imaging data. In addition, anatomical landmarks in the heart, e.g., the mitral valve, aorta valve, and papillary muscles, are defined as borders in the imaging data to be used as spatial references.
- the tiled sections each comprise triangles, and the volumetric elements are prism shaped.
- the step of defining the center surface comprises the step of mapping a tiled section template onto the center surface to define the tiled sections.
- the tiled sections on the center surface each have a shape and a size that depend upon individual characteristics of the heart, but are identical in number to those of the tiled section template.
- the tiled section template is derived by averaging tiled section data for a plurality of different hearts: the tiled section template is then mapped onto the center surface of the patient's heart, with respect to the spatial references in the heart.
- the step of projecting comprises the step of extending chords from corners of the tiled sections to the two surfaces.
- Each of the chords extend in a direction normal to an average plane for all tiled sections having corners meeting at the chord, thereby ensuring that the projections of the tiled sections on the two surface do not overlap.
- FIG. 1 is a schematic block diagram of a system in accordance with the present invention that is used for determining cardiac parameters, including thickness of the cardiac wall and range of motion during a cardiac cycle;
- FIG. 2A is an isometric schematic view of a heart and a portion of an esophagus, illustrating how a transesophageal ultrasonic probe is used to image the heart;
- FIG. 2B is a graphic representation of one of the image planes produced by the transesophageal ultrasonic probe
- FIG. 3 illustrates a schematic cross-sectional view of a portion of the heart imaged along its longitudinal axis, through the left ventricle;
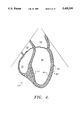
- FIG. 4 is a schematic cross-sectional view of a portion of the heart imaged through the chambers of the heart;
- FIG. 5 is a schematic cross-sectional view of the left ventricle, imaged along a transverse axis
- FIGS. 6A and 6B schematically illustrate the cross-sectional images planes that are in parallel with the transverse axis of the heart and those that are orthogonal thereto, in parallel with the longitudinal axis, as produced by a magnetic resonance imaging system;
- FIG. 7 illustrates the angulated cross-sectional image planes obtained with an ultrasonic imaging probe, from two different imaging positions
- FIG. 8 is an exemplary, schematic representation of one of a plurality of spheres that are produced to fill a space between two modeled surfaces of the left ventricle, in a first embodiment of the method used to define a center surface;
- FIG. 9 illustrates the use of tetrahedrons to define a center surface between two surfaces of the left ventricle, in a second embodiment of the method
- FIG. 10 illustrates a few of the triangular tiled sections representing an average center surface template that is mapped onto the center surface of a specific patient's heart
- FIG. 11 illustrates how the tiled sections mapped onto the center surface are projected onto the inner and outer surfaces representing the endocardium at end systole and end diastole, respectively, to define one of a plurality of triangular prisms used to determine range of motion;
- FIG. 12 illustrates how the tiled sections mapped onto the center surface are projected onto the inner and outer surfaces representing the endocardium and epicardium, respectively, to define one of a plurality of triangular prisms used to determine wall thickening;
- FIG. 13 is a graphic image illustrating a cross-section of the modeled inner and out surfaces and the center surface defined by a plurality of triangles;
- FIG. 14 is a top level flow chart that generally defines the steps of the method for determining regional wall motion and wall thickening in the heart;
- FIG. 15 is a flow chart illustrating the logical steps employed in tracing a border of a displayed image of a portion of the heart
- FIG. 16 is a flow chart that identifies the steps used to generate a three-dimensional model of the portion of the heart imaged and the determination of volume and ejection fraction;
- FIG. 17 is a flow chart illustrating the logical steps employed for generating the center surface
- FIG. 18 is a flow chart that shows the steps followed in one embodiment, to generate additional point on a model surface to improve resolution
- FIG. 19 is a flow chart that shows the steps followed in another embodiment, to generate additional point on a model surface to improve resolution
- FIG. 20 is a flow chart illustrating the steps used to find the intersection of two surfaces
- FIG. 21 is a flow chart the defines the steps followed to identify the points on a surface that will be retained:
- FIG. 22 is a flow chart that shows a first procedure for retaining a plurality of tetrahedrons spanning a space between two surfaces;
- FIG. 23 is a flow chart of the procedure for removing unwanted tetrahedrons produced by the procedure of FIG. 23;
- FIG. 24 is a flow chart illustrating the steps of a first procedure for determining center surface polygons
- FIG. 25 is a flow chart illustrating the steps of a second alternative procedure for determining center surface polygons:
- FIG. 26 is a flow chart of the steps used in determining an average center surface for use as a referential template:
- FIG. 27 is a flow chart of the steps employed in determining regional wall motion.
- FIG. 28 is a flow chart of the steps used to determine regional wall thickening.
- FIG. 1 A cardiac imaging and model processing system 30 is disclosed in FIG. 1.
- This system includes a CPU 32 (personal computer or graphic workstation terminal) that is coupled to a graphics display 34, and to a keyboard 36 for input of data or instructions controlling the image processing and modeling procedures used to determine cardiac parameters in accordance with the present invention.
- a mouse 38 (or other cursor pointing device) is coupled to CPU 32 for use in graphically controlling software running on CPU 32, for example, by selection of menu items, or for manually tracing images produced on graphics display 34, as explained below.
- CPU 32 is coupled through an appropriate input card or port (neither shown) to an analog-to-digital converter (ADC) and image processor 40.
- ADC and image processor 40 receives an analog signal produced by an imaging device 42, converts the analog signal to a digital signal, and processes the digital signal to a form appropriate for input to CPU 32 and display on graphics display 34.
- ADC and image processor 40 controls the imaging device as it scans a heart 44 beating inside a patient (not shown). Details of the processing are not included, since they depend on the type of imaging device used and are well known in the art.
- imaging device 42 may comprise an ultrasound probe, a magnetic resonance imaging system, or a cine CT imaging system, all of which are well known to those of ordinary skill in this art.
- each of these types of imaging devices could provide the analog signal used to create an image of heart 44 on graphics display 34, the current preferred form of cardiac imaging and model processing system 30 uses ultrasound for imaging heart 44.
- a transesophageal ultrasonic probe 50 is the preferred form of imaging device 42. This probe is schematically illustrated in a position adjacent heart 44, where it has been inserted through a patient's esophagus 48.
- the transesophageal ultrasonic probe is coupled to ADC and image processor 40 through a cable 52, which extends upwardly through the esophagus and out of the patient's mouth (not shown).
- the transesophageal ultrasonic probe can readily be located within the esophagus or stomach, in an ideal position to ultrasonically scan at least a selected portion of heart 44, and in the illustrated example, is positioned to scan a left ventricle 46 of the heart.
- transesophageal ultrasonic probe 50 has been developed that is particularly useful for scanning the heart to produce imaging data used in the present invention; however, details of the design of this probe are not disclosed herein, since they do not directly relate to the present invention.
- a more conventional ultrasonic probe can also be used for this purpose, including one operated transcutaneously, as long as the location and orientation of the i probe can be recorded for each imaging plane.
- transesophageal ultrasonic probe 50 produces a plurality of images along planes 54a through 54f.
- An exemplary image along plane 54d is illustrated in FIG. 2B as it would appear on graphics display 34 (shown in FIG. 1).
- each image plane represents a cross-sectional scan of left ventricle 46, showing the various anatomical landmarks of the heart and both the inner and outer surfaces of the left ventricle in the particular plane of the scan.
- ultrasonic scans should be made of heart 44 from a plurality of different positions.
- FIG. 3 shows a schematic representation 60 of an ultrasonic imaging system scan made along the longitudinal axis of heart 44, principally focusing on left ventricle 46.
- An outer surf:ace 62 (medically referred to as the epicardial surface) is clearly visible, as is an inner surface 64 (medically referred to as the endocardial surface).
- an aortic valve 66 at the mouth of an aorta 68.
- a portion of a left atrium 70 is visible in the upper portion of the ultrasonic scan image.
- a chamber image view 72 as schematically illustrated in FIG. 4 is produced.
- a portion of a right ventricle 76 and a right atrium 78 are visible, as well as a papillary muscle 74.
- FIG. 5 a transverse or short axis view image 80 of left ventricle 46 is shown in FIG. 5.
- the intrusion of papillary muscle 74 into the chamber of left ventricle 46 is more clearly evident.
- the images produced by imaging device 42 can be stored for later processing by CPU 32 on any appropriate nonvolatile storage device, such as an analog disk or video tape.
- any appropriate nonvolatile storage device such as an analog disk or video tape.
- the digital data provided by analog-to-digital converter and image processor 40 can be conveyed over a local or wide area network to CPU 32 for display on graphics display 34, or can be stored on a hard drive or on digital tape associated with the CPU, for subsequent processing.
- FIGS. 6A and 6B disclose the image planes of the left ventricle used to produce the imaging data with a magnetic resonance imaging system.
- a magnetic resonance system provides image data 82 for at least eight planes 84 that are transverse to the longitudinal axis, i.e., parallel to the transverse axis of the left ventricle.
- imaging is also carried out in an orthogonal direction to produce imaging data 86, along four planes 88 that are parallel to the longitudinal axis.
- the imaging data represented in FIG. 6B is obtained 16 times during the cardiac cycle so that each frame of eight transverse and four longitudinal image planes are secured at intervals separated in time by about 33 milliseconds.
- the peak of the R-wave on an electrocardiogram (ECG) (not shown) is used to trigger the imaging system for each cardiac cycle.
- ECG electrocardiogram
- the imaging planes developed by using transesophageal probe 50 include a plurality of angulated planes 91 scanned when the esophageal probe is disposed in one position, and a plurality of angulated planes 93 scanned when the esophageal probe is in a different position.
- An appropriate coordinate transformation is used in connection with this imaging data when each image plane is traced on graphics display 34 to compensate for the different imaging positions of the probe and for the fact that the image planes are not parallel to each other or orthogonal.
- an operator can manually outline or trace the borders of the left ventricle endocardium and epicardium using mouse 38.
- borders corresponding to specific anatomic structures within heart 44 are input by tracing to define landmarks or reference points.
- These anatomic structures include papillary muscles 74, the interventricular septum (not separately shown) and various valves, such as aortic valve 66.
- the mitral valve apparatus (not shown) will be included in detail, as an additional reference landmark.
- the image planes developed by imaging device 42 will typically be scanned over several cardiac cycles. During at least one cardiac cycle, an end diastole and an end systole will be selected for each of the image planes.
- the end diastole frames represent the left ventricle at the time of the greatest chamber area, and similarly, the image planes at end systole will be selected to represent the left ventricle when it has the smallest chamber area.
- an ECG and/or a phonocardiogram will be recorded during the imaging process, providing cardiac cycle data corresponding to each of the image planes scanned that identify the particular time in the cardiac cycle in which the image plane was produced.
- the endocardial and epicardial borders that are manually traced are stored as x-y coordinates, representing a series of points defining the inner and outer surface of the heart and the referential landmarks during each image plane visualization. Since the left ventricular contours on angiograms are traced at the outer limits of the intertrabecular crevices, visualized as wispy streaks of contrast, the endocardial border and ultrasound produced images will be traced at the outer most edge of the blood-myocardium interface.
- the manual tracing of these image plane visualizations can alternatively be accomplished by software running on CPU 32 without human intervention.
- the current manual tracing step will be replaced by a computer automated procedure to obtain equivalent border traced data points using software that responds to differences in contrast and shading in the graphics image to recognize borders of the endocardial and epicardial surfaces and anatomical structures that should be included in the traced data.
- the automated tracing of the image plane visualization will be required to accomplish determination of cardiac parameters in real time.
- the traced borders and referenced cardiac structure landmarks in the heart represent data that are stored in a database, together with header information identifying the patient and the location and orientation of the imaging plane for which the data were developed.
- the borders developed by the manual tracing procedure are output/Tom the database as x, y, and z coordinates, the z coordinate depending upon the spatial position of the particular image plane that was traced to produce the series of data points defining the borders of the surfaces of the heart and its anatomical landmark structures.
- the data developed by tracing the surfaces of the heart represented by the image planes are then assembled and used to prepare a three-dimensional reconstruction of the left ventricle surfaces. Details of this reconstruction or modeling of the left ventricle surfaces are disclosed below.
- a coordinate grid of the longitudinal and cross-sectional interpolated borders is sorted into sets of three points to define the corners of triangular tiles. At any point where two borders cross without intersecting, the border with better spatial resolution is considered as the more accurate.
- the above-disclosed method is used to construct a model having an epicardial surface and an endocardial surface at end diastole and at end systole, for use in determining wall thickening.
- a model of the endocardial surface at end diastole and end systole, representing the location of the endocardial surface at the two extreme chamber volume conditions during a cardiac cycle is created using the data developed for each image plane at the end diastole and end systole times during the cardiac cycle.
- the second model is used in determining the range of motion for different portions of the left ventricle, as explained below.
- a center surface be defined between the inner and outer surfaces of each model, i.e., a center surface must be determined between the epicardial and endocardial surfaces, and a center surface must be determined between the endocardial surfaces at end diastole and end systole and between the epicardial surfaces at end diastole and end systole. Substantially the same technique is used to develop the center surface for both models.
- Two approaches can be used for defining the center surface between the inner and outer surface of a model of the lea ventricle.
- a space between the inner and outer surface in this case represented by end diastolic endocardial surface 90 and end systolic endocardial surface 92, is filled with a plurality of spheres like sphere 94 that meet certain requirements.
- spheres like sphere 94 that meet certain requirements.
- Each sphere 94 must touch four points on the inner and outer surfaces, including at least one point on each of the inner and outer surfaces, and must enclose no other points.
- the centers of all spheres 94 are then interconnected with lines (not shown) that define the center surface.
- the second method for defining the center surface is generally illustrated in FIG. 9.
- a plurality of tetrahedrons is defined by connecting points 96 on end diastole endocardium surface 90 to a point 98 on end systole endocardium surface 92 with lines 100.
- Points 96 are connected with lines 102 to form a triangular patch 104, which is similar to a triangular patch 108 formed by connecting midpoints 106 of lines 100 together.
- a series of such triangular patches 108 thus define a center surface 110.
- an average center surface template 114 is developed by determining a center surface for each of a number of left ventricles of people having a range left ventricles of different sizes and shapes.
- This average center surface template comprises a plurality of triangular tiled sections 116, each of which has a specific identifying number associated with it.
- the average center surface template is referenced to the reference landmarks in the heart, such as the mitral valve and papillary muscles.
- this average center surface template 114 is mapped onto the center surface of the patient's heart using the referenced landmarks in the patient's heart to locate the average center surface template.
- This mapping operation may result in a distortion of the triangular tiled sections 116 as they are mapped onto the center surface of the patient's heart, due to differences in the size and shape of the left ventricle in the patient, compared to the average center surface template.
- the mapping operation provides a basis for identifying specific locations in the left ventricle during diagnostic analysis of the cardiac parameters defined using the center surface.
- the next step involves the projection of the triangular tiled sections 120 produced by mapping the average center surface template onto the patient's center surface to produce corresponding triangular tiled sections 120 on the outer surface that was modeled.
- the projection of triangular tiled section 120 onto the outer surface as shown in FIG. 11 produces a corresponding triangular tiled patch on the modeled left ventricular endocardium at end diastole.
- the projection of the triangular tiled section onto the inner surface of the model produces a corresponding triangular tiled section 124 on the modeled left ventricular endocardium at end systole.
- lines 122 are extended perpendicular to an average plane (not shown) through the common junction of each of a plurality of the triangular tiled sections 120.
- the orientation of the average plane is determined by summing unit vectors that are normal to each of the tiled sections around a vertex of triangular tiled section 120, thereby determining a normal to the average plane, i.e., the direction of the line 122 at that vertex.
- the points at which lines 122 intersect the inner and outer surfaces of the model thus define the size and shape of triangular tiled section 124 and 126, respectively. Since the directions of lines 122 are determined relative to the average plane, triangular tiled sections 124 and 126 do not overlap with any other triangular tiled sections on these modeled surfaces.
- Triangular tiled sections 124 and 126 are the ends of a triangular prism 128 that defines a volumetric element.
- a plurality of such volumetric elements or triangular prisms 128 fills the space between modeled end diastolic endocardium surface 90 and modeled end systolic endocardium surface 92.
- the average area of triangular tiled sections 124 and 126 at the ends of prism 128 are determined for each triangular prism.
- the volume of triangular prism 128 is determined, and a range of motion of the cardiac wall at that triangular prism is then determined by dividing its volume by the average of the areas of tiled sections 124 and 126 for that triangular prism. This determination is preferably repeated for each of the triangular prisms filling the space between the inner and outer surfaces of the model.
- FIG. 12 a similar technique is used to project a triangular tiled section 120' onto both modeled endocardial surface 64 and epicardial surface 62 at end systole, producing corresponding triangular tiled sections 124' and 126', respectively.
- the volume of a corresponding triangular prism 128', and the average of the areas of triangular shaped projected tiled sections 124' and 126' comprising the ends of triangular prism 128', are determined, for each such triangular prism filling the space between the inner and outer surfaces of the model.
- Cardiac wall thickness at end systole is then found by dividing this volume by the area of triangular tiled section 120' for each of the triangular tiled sections comprising the center surface. This procedure is repeated for the model of the endocardial and epicardial surfaces at end diastole to determine thickness of the cardiac wall at each triangular prism at that portion of the cardiac cycle. Thickening of the cardiac wall at a given triangular prism is then simply equal to the difference between the thicknesses at end systole and at end diastole.
- center surface 110 is illustrated in a cross-sectional view of the left ventricle model, disposed midway between endocardial surface 64 and epicardial surface 62.
- this image is presented in color so that cardiac parameters are readily evident based on a defined color coding.
- the color coding can represent regional cardiac function, or abnormality regional functions, perhaps as expressed in units of standard deviations from the mean of a normal reference population.
- regional function is intended to mean one of the following: (a) cardiac wall motion normalized by heart chamber size (corresponding to percent fractional shortening, or wall motion divided by the cube root of the chamber volume at end diastole - in percent); (b) change in wall thickness normalized by heart chamber size (corresponding to wall thickening, which equals wall thickness at end systole minus wall thickness at end diastole); and (c) change in wall thickness normalized by wall thickness at end diastole (corresponding to wall thickening divided by wall thickness at end diastole- expressed in percent).
- a medical practitioner can monitor dynamic changes in cardiac function with respect to wall thickness and range of motion of the cardiac wall.
- the step of manually tracing the images of the heart produced by scanning with imaging device 42 must be done automatically by CPU 32, as noted above.
- Software for automatically tracing along surfaces in an image such as that produced by imaging device 42 to automatically produce the traced border of each image plane is being developed.
- FIG. 14 a top level flow chart indicating each of the steps required to determine regional wall motion and wall thickening are illustrated in a flowchart 140.
- cardiac imaging and model processing system 30 acquires images of heart 44 using ultrasound echo or magnetic resonance imaging, along with data that define the spatial orientation and position of each image.
- a specific portion of heart 44 that is of interest is scanned, such as the left ventricle.
- the images acquired by scanning the heart are traced, for example, in the case of the left ventricle, the ventricular borders and anatomic landmarks at end diastole and end systole in each imaging plane.
- a block 146 provides for reconstructing or modeling the surfaces of the left ventricle or other portion of the heart that was scanned, at both the end diastole and end systole, using the border tracing data, which comprise a series of x, y, and z data points.
- a center surface is determined, for example, the center surface between the endocardial surface at end diastole and end systole for one model, or the center surface between the epicardial surface and endocardial surface at the end diastole for the other model.
- an average tiled section template is then matched to the center surface of one of the models by referencing to the landmarks or anatomical structures in the heart, such as valves and papillary muscles, in order to assign numbered triangular tiled sections to the center surface in the patient's heart.
- the regional wall motion and/or wall thickness and thickening are determined.
- the patient is anesthetized, using a combination of high-dose narcotic such as alfentanil and a benzodiazapine, such as midazolam. These agents do not depress myocardial contractility to any significant degree and are of relatively short duration.
- narcotic such as alfentanil
- benzodiazapine such as midazolam.
- an appropriate intracardiac cardiac monitoring technique should be selected by the anesthesiologist as appropriate for the particular patient and operative procedure, but will at least involve continuous ECG monitoring and noninvasive recording of blood pressure.
- the imaging is performed after providing compensation for pasodilation due to the alfentanil, by fluid administration and after hemodynamic stability has been achieved.
- the transesophageal ultrasonic probe is initially inserted, and preferably, a complete two-dimensional and color Doppler examination is made and recorded, that includes both ventricles, both atria, and the valves in heart 44. This preliminary two-dimensional examination will be useful to guide fluid administration and to achieve a truly euvolumic state prior to the three-dimensional imaging and modeling.
- the imaging required for three-dimensional modeling is made during suspended ventilation, between periods of cauterization. Due to the flexibility of the transesophageal ultrasonic probe, images can be recorded for both the transverse (short) and longitudinal (long) axes from multiple positions within esophagus 48 (FIG. 2) or from within the stomach, as necessary, to obtain a complete visualization of the left ventricle or other portion of the heart being imaged. During this imaging process, it is contemplated that up to thirty image planes will be recorded and identified based upon the specific positions of the transesophageal ultrasonic probe.
- the image data developed by transesophageal probe 50 are converted to digital format and displayed on graphics display 34, as described above. These two steps are covered in blocks 162 and 164 in FIG. 15. Further, as noted in blocks 164 and 166, the particular image plane and the ECG are displayed during the tracing. The endocardial and epicardial surfaces of the image planes selected in a block 164 are thus traced, along with any anatomic reference landmarks in the particular views of the heart being imaged.
- a longitudinal (long) axis for the left ventricle is defined as a line segment spanning the two most distant point of all of the traced borders.
- a plane is then passed through this longitudinal (long) axis and rotated about the axis in increments of 15° in a block 174.
- the intersection points between the plane and the original border points determined by tracing is found and the remainder of that border for the plane is filled in using a spline curve filling technique, except at the mitral and aortic valve planes.
- the border points are connected by straight line segments, so that the model being produced has a ruled surface in these two valve regions.
- the original points developed by tracing and those subsequently developed by fitting the points on the successfully rotated planes are then sorted into a closed outline in a block 176.
- the set of longitudinal interpolated borders comprising this outline resembles the slices of an orange.
- a series of 22 planes is passed perpendicularly to the longitudinal (long) axis of the above-generated model in a block 178.
- the intersection points between these transverse axis planes and the longitudinal interpolated borders is determined and sorted to provide a closed outline.
- the resulting parallel cross-sectional interpolated borders is summed according to Simpson's rule to determine volume.
- a number of commercially available software programs are able to convert the Cartesian data points developed in block 180 to a three-dimensional model surface.
- Examples of such software include: SILVER SCREENTM (produced by Schroff Development Corporation), and AVSTM (produced by Advanced Visual Systems Inc.).
- SILVER SCREENTM produced by Schroff Development Corporation
- AVSTM produced by Advanced Visual Systems Inc.
- the coordinates of the position of the probe when it acquired each of the imaging planes, the position of the first, middle, and last scanned image plane, the position of a plane passing through a midline of all of the scanning sectors, a centroid of the most basal and apical imaging planes, and anatomical markings are used.
- a center surface located medially between the modeled inner and outer surfaces is generated in accordance with the method outlined in the steps of a flow chart 186 shown in FIG. 17.
- two surfaces, S1 and S2 in respect to which the center surface is to be generated and represented by connected triangles, are input.
- additional points on each surface are generated by interpolation to improve the resolution with which the center surface is developed, and a variable AllPts is initialized to a null value.
- FIG. 18 details of method A are disclosed in flow chart 192 starting at an input block 210, wherein one of the surfaces S1 or S2 is input.
- a reference number assigned to a block in FIG. 17 is used in connection with a corresponding flow chart that provides the details of that block.
- a block 212 successive triangles on the surface defined by corner points P1, P2, and P3 are taken up. New points are generated at the midpoints of the line segments P1P2, P2P3, and P1P3 in a block 214.
- a point at a centroid of the triangle defined by points P1, P2, and P3 is generated in a block 216.
- Each of the points comprising the corners of the triangle and the generated interpolated points, labeled appropriately, are output in a block 218.
- a decision block 220 determines if more triangles on the selected surface are available to be processed, and if so, returns to block 212. Otherwise, the procedure is finished, as indicated in a block 222.
- the surface to be processed is input at a block 210'.
- Successive triangles are processed, as indicated in a block 212', leading to a block 214' wherein an interpolated Bezier patch (not shown) is determined using each of the neighboring triangles around a triangle being processed.
- the Bezier patch is sampled at the points above the midpoint of each side of the triangle and at its centroid.
- the corner points and the sampled points are output.
- a decision block 220' determines if additional triangles remain to be processed, and if so, returns to block 212'. Otherwise, the process is completed, as indicated in a block 222'.
- a block 194 provides for finding the intersection of surfaces S1 and S2 and adding points along the intersection to the data AllPts. Details of this process are disclosed at flow chart 194 in FIG. 20.
- surfaces S1 and S2 represented by the connected series of triangles are input.
- variables T1 and T2 are respectively initialized to the first triangles of surfaces S1 and S2, respectively.
- a decision block 234 determines whether triangle T1 intersects triangle T2, and if so, proceeds to a block 236, in which the procedure produces as output end points of the intersection, labeled S1 and the midpoint, labeled S2.
- T2 is set to the next triangle in S2 (if it exists) in a decision block 238. Assuming that another triangle on surface S2 remains to be processed, the logic returns to decision block 234 and otherwise, proceeds to a decision block 240. In decision block 240, the logic determines if another triangle T1 on surface S1 remains to be processed, and if so, proceeds back to decision block 234. If not, the program finishes at a block 242.
- a block 196 indicates that the next step is to keep unique points in the data AllPts, providing output data called "UniquePts.” Details of this procedure are shown in FIG. 21 at flow chart 196.
- a combined list of labeled points on surfaces S1 and S2 are input.
- the points defined by the Cartesian coordinates x, y, and z are sorted producing a list L of length LEN.
- i is initialized to one and the variable PREV is initialized to L(i).
- the value of the variable PREV is output, followed by a decision block 258, which determines if the value of i is greater than or equal to the variable LEN.
- a block 260 increments the value of i by one and sets a variable NEXT equal to k(i). Then, a decision block 262 determines if NEXT equals PREV. If so, the logic returns to decision block 258. Otherwise, it proceeds to a block 264 which sets PREV equal to NEXT. The logic then returns to block 256 and finishes whenever the inquiry, of decision block 258 is affirmative, indicating that the value of i is equal to or greater than LEN. An affirmative response to decision block 258 leads to a block 266, in which the process for comparing the coordinates for consecutive points in decision block 262 is used to process each of the data points. If it is determined that any two points have the same coordinates, then one of these duplicate points is deleted. After all such points have been processed, only unique points remain in the database, with no duplicates.
- the next step provides for computing Delaunay tetrahedralization of the unique points, in a block 198.
- the result of this computation is a set of tetrahedrons whose sides connect points from an input set, with the properties that a sphere circumscribing the tetrahedron does not contain any other points in the set, and that the center of the sphere lies close to the medial axis of the tetrahedron.
- the procedure for determining the tetrahedrons that span a distance between two adjacent surfaces (the first step, in block 200, of FIG.
- an input block 270 which provides for input of a set of tetrahedrons with labeled points that define the vertices of the tetrahedrons.
- a parameter T is set equal to the next tetrahedron in the plurality of tetrahedrons spanning the distance between the two surfaces.
- a decision block 274 determines if all tetrahedrons have been processed and if so, proceeds to a block 276, indicating that the procedure is finished. Otherwise, the logic proceeds to a block 278, wherein the number of points comprising the tetrahedron on surface S1 is assigned to a variable parameter C1.
- a decision block 280 the logic determines if the variable C1 is equal to either 0 or 4, and if so, returns to block 272 to process the next tetrahedron. Otherwise, the tetrahedron assigned to the variable T is output in a block 282; the logic then returns to block 272.
- the next step is removing unwanted tetrahedrons to produce a space between surfaces S1 and S2 that is filled with tetrahedrons.
- This procedure produces a tetrahedron list labeled TET. Details of the procedure are shown within FIG. 23 in flow chart 200.
- the tetrahedralization data previously developed and surfaces S1 and S2 are input.
- the variable T is set equal to the next tetrahedron in the list of tetrahedrons returned by the previous procedure.
- a decision block 290 determines if all of the tetrahedrons have been processed, and if so, sets the variable T equal to NULL.
- a Boolean expression I1 is defined as TRUE if the tetrahedron last assigned to the variable T is inside the surface S1, and FALSE, if not.
- a Boolean variable I2 is defined as TRUE if the tetrahedron T is inside the surface S2, and FALSE if not.
- a decision block 298 determines whether the tetrahedron T is inside both surfaces or outside both surfaces, by determining if the Boolean expressions I1 and I2 are equal. If so, the next tetrahedron is processed by returning to block 298, thereby filtering the previous tetrahedron from the output. Otherwise, the tetrahedron equal to T is output in a block 300 before returning to block 298.
- Block 202 references a method A
- block 202 references a method B, both of which produce the center surface from the tetrahedrons.
- Details of method A for determining the center surface polygons are shown in FIG. 24 at flow chart 202, beginning with an input block 308.
- the list of tetrahedrons produced from the previous steps are input, and, in a block 310, are sampled one at a time, until no further tetrahedrons remain.
- the process is concluded.
- a block 314 provides for counting the number of points in the tetrahedron that are labeled as being on surface S1 and assigning that count to a variable C1.
- a decision block 316 determines if C1 equals 2 and if so, a block 318 defines a quadrilateral polygon from midpoints of the lines interconnecting two points marked as being on surface S1 with two points marked as being on the S2 surface. Thereafter the logic proceeds to a block 320, which provides for output of the quadrilateral polygon.
- a decision block 322 determines if the variable C1 is equal to 1, and if so, computes a triangle from the midpoints of the lines connecting three points that are on the S2 surface with one point that is marked as being on the S1 surface. Thereafter, the logic again proceeds to block 320.
- a negative response from decision block 322 leads to a block 326, which computes a triangle from the midpoints of the lines connecting the three points that are on the S1 surface with one point that is marked as being on the S2 surface.
- the logic then proceeds to block 320 to output the polygon and thereafter, returns to block 310 to process the next tetrahedron. Accordingly, it will be apparent that either a quadrilateral or a triangular polygon is determined, depending upon the arrangement of the points on each of the surfaces.
- flow chart 202' provides the steps of method B, starting at a block 308 where again, the tetrahedrons developed from the previous steps are input.
- a block 310' successively processes the tetrahedrons, setting each one in turn to the variable T until no longer any other tetrahedrons remain, leading to a block 332.
- T is set equal to a tetrahedron to be processed
- a block 328 provides for computing a circumscribing sphere from the four corner points of the tetrahedron.
- block 330 indicates that the center of the sphere is stored for the tetrahedron, before returning to block 310' to process the next tetrahedron.
- a succession of spheres developed from the four corner points of the tetrahedron are computed and stored with their center points, until the space between the two surfaces is filled and no further tetrahedrons remain to be processed.
- the logic then proceeds with block 332, which connects the centers of adjacent tetrahedrons, (i.e., the centers of the spheres).
- a block 334 then outputs all of the resulting polygons produced by connecting the centers of the spheres, leading to a block 312' wherein the process is finished.
- a block 204 provides for output of the polygons that are unique and which share sides with only one other polygon, thereby creating a closed surface. This closed surface is the center surface.
- the next step in the overall process requires that the average center surface template be applied to map triangular tiled sections from the template onto the center surface for the patient's heart 44.
- the steps of this process are indicated in a flow chart 340 shown in FIG. 26.
- a number of patients sufficient to comprise a reasonable statistical sample for example, twenty, are identified as having a variety of ventricular shapes and ejection fractions.
- a block 344 provides for determining an average landmark configuration for the ventricles of all of the sample subjects.
- the reference landmarks for this purpose includes anatomical attributes such as the junction of the aortic valve and the mitral valve, centers of the papillary muscle insertions, the left ventricular apex, and the interventricular septum.
- a block 346 provides for mapping the landmarks for the twenty subjects' cardiac data onto the average landmark configuration using a thin-plate spline interpolating function. Then, in a block 348, the center surfaces for each of these patients are averaged locally, defining averaged triangular tiled sections on that center surface. A block 350 then adjusts the tiled sections on the average center surface so that they are evenly spaced and spaced between and within the reference landmarks, applying interpolation as required. Preferably, the final count of triangular tiled sections in the averaged center section template is 1,024.
- the steps shown in FIG. 27 for a flow chart 356 are implemented.
- the average center surface tiled section template is mapped to an individual patient's center surface, derived as explained above, using a thin-plate spline interpolating function.
- a cord is constructed at each corner of each tiled section, generally normal to the average plane of all tiled sections converging at that corner.
- the normal to an average plane has an orientation determined by adding all of the unit vectors normal to tiled sections converging at the corner of the center section tiled sections through which the chord is to extend.
- This cord extends to the intersection with the modeled end diastolic and end systolic surfaces. The points of the intersection between the cords and each modeled surface effectively transfers or projects the tiled section from the patient's center surface to the patient's endocardial end diastolic and end systolic modeled surfaces.
- the regional wall motion for each of the tiled sections on the end diastolic modeled surface is determined by initially determining the volume of the triangular prism defined by the tiled section projected on the end diastolic modeled surface and the corresponding tiled section projected on the end systolic modeled surface, and by the cords that connect the corners of these two end triangular tiled sections.
- the average area of the ends of the triangular prism is determined (for each triangular prism).
- the volume of the prism is divided by the average area of the ends of the triangular prism (this average generally corresponding to the area of the triangular tiled section on the center surface), for each of the triangular prisms.
- the result of this division is the height or length of the triangular prism, which represents the extent or range of motion of the endocardium surface between the end diastole and end systole at that point on the cardiac wall.
- a block 374 provides that the center surface is created between the modeled left ventricular endocardium and epicardium surfaces at end diastole.
- a center surface is also created between the modeled left ventricular endocardium and epicardium surfaces at end systole, again following the procedures already explained above.
- a block 378 provides for averaging center surfaces that are created for end diastole and end systole.
- both the end diastolic and end systolic center surfaces are reformatted to create tiled templates so that in a block 382, both of the tiled templates are warped back to the patient's center surface at end diastole and end systole, respectively.
- the tile pattern created by warping the templates onto the patient's center surface is projected onto the epicardial and endocardial modeled surfaces at end diastole and end systole.
- Triangular prisms are then constructed between the epicardial and endocardial modeled surfaces, and, in a block 386, are used to determine wall thickening based on the changes in wall thickness between end diastole and end systole.
- wall thickening is equal to the change in wall thickness at each tiled section divided by the end diastolic wall thickness at that tiled section.
- wall thickening can be determined by normalizing for a given heart size by tile cube root of the end diastolic volume so that wall thickening is equal to the change in wall thickness divided by the cube root of the end diastolic volume.
- eigen shape analyses the methodology disclosed above can be extended to study shape and shape change in relationship to wall thickening.
- an analysis of shape in terms of the cardiac anatomical landmarks can be pursued in terms of geometric components of shape change. These components, called “principal warps” and “relative warps” provide an appropriate generalization to landmark data of principal components and traditional multivariate analysis.
- the combination of landmark analysis and eigen shape analysis will thus characterize shape and shape change in terms of multiple factors (warps for the landmark data, eigen shapes for the surface analysis).
Abstract
Description
Claims (25)
Priority Applications (2)
| Application Number | Priority Date | Filing Date | Title |
|---|---|---|---|
| US08/082,404 US5435310A (en) | 1993-06-23 | 1993-06-23 | Determining cardiac wall thickness and motion by imaging and three-dimensional modeling |
| US08/451,757 US5601084A (en) | 1993-06-23 | 1995-05-26 | Determining cardiac wall thickness and motion by imaging and three-dimensional modeling |
Applications Claiming Priority (1)
| Application Number | Priority Date | Filing Date | Title |
|---|---|---|---|
| US08/082,404 US5435310A (en) | 1993-06-23 | 1993-06-23 | Determining cardiac wall thickness and motion by imaging and three-dimensional modeling |
Related Child Applications (1)
| Application Number | Title | Priority Date | Filing Date |
|---|---|---|---|
| US08/451,757 Continuation-In-Part US5601084A (en) | 1993-06-23 | 1995-05-26 | Determining cardiac wall thickness and motion by imaging and three-dimensional modeling |
Publications (1)
| Publication Number | Publication Date |
|---|---|
| US5435310A true US5435310A (en) | 1995-07-25 |
Family
ID=22170989
Family Applications (1)
| Application Number | Title | Priority Date | Filing Date |
|---|---|---|---|
| US08/082,404 Expired - Lifetime US5435310A (en) | 1993-06-23 | 1993-06-23 | Determining cardiac wall thickness and motion by imaging and three-dimensional modeling |
Country Status (1)
| Country | Link |
|---|---|
| US (1) | US5435310A (en) |
Cited By (133)
| Publication number | Priority date | Publication date | Assignee | Title |
|---|---|---|---|---|
| US5570430A (en) * | 1994-05-31 | 1996-10-29 | University Of Washington | Method for determining the contour of an in vivo organ using multiple image frames of the organ |
| US5669382A (en) * | 1996-11-19 | 1997-09-23 | General Electric Company | System for measuring myocardium in cardiac images |
| US5675522A (en) * | 1993-09-17 | 1997-10-07 | Nec Corporation | Method and system for dividing analyzing region in device simulator |
| EP0802424A2 (en) * | 1996-04-15 | 1997-10-22 | Olympus Optical Co., Ltd. | Diagnostic ultrasonic imaging system having run extracting means for extracting point closest to start point of scanning lines |
| US5701897A (en) * | 1992-10-02 | 1997-12-30 | Kabushiki Kaisha Toshiba | Ultrasonic diagnosis apparatus and image displaying system |
| US5722405A (en) * | 1993-04-15 | 1998-03-03 | Adac Laboratories | Method and apparatus for acquisition and processsing of event data in semi list mode |
| US5800356A (en) * | 1997-05-29 | 1998-09-01 | Advanced Technology Laboratories, Inc. | Ultrasonic diagnostic imaging system with doppler assisted tracking of tissue motion |
| US5846200A (en) * | 1996-11-08 | 1998-12-08 | Advanced Technology Laboratories, Inc. | Ultrasonic diagnostic imaging system for analysis of left ventricular function |
| US5859922A (en) * | 1997-02-21 | 1999-01-12 | Hoffmann; Kenneth R. | Process of determining the three-dimensional location of a pacemaker leads in the heart of a subject |
| WO1999005638A1 (en) * | 1997-07-25 | 1999-02-04 | International Regenrative Medicine, Inc. | A quantitative visual system for comparing parameters which characterize multiple complex entities |
| US5871019A (en) * | 1996-09-23 | 1999-02-16 | Mayo Foundation For Medical Education And Research | Fast cardiac boundary imaging |
| FR2772162A1 (en) * | 1997-12-10 | 1999-06-11 | Ge Medical Syst Sa | SEMI-AUTOMATIC SEGMENTATION PROCESS FOR THE ESTIMATION OF THREE-DIMENSIONAL VOLUMES |
| US5916168A (en) * | 1997-05-29 | 1999-06-29 | Advanced Technology Laboratories, Inc. | Three dimensional M-mode ultrasonic diagnostic imaging system |
| US5923770A (en) * | 1996-09-30 | 1999-07-13 | Siemens Corporate Research, Inc. | 3D cardiac motion recovery system using tagged MR images |
| US5924991A (en) * | 1997-08-22 | 1999-07-20 | Acuson Corporation | Ultrasonic system and method for harmonic imaging in three dimensions |
| US5930410A (en) * | 1997-01-13 | 1999-07-27 | Hewlett-Packard Company | Method and apparatus for obtaining multiple views from one scan window |
| US5947899A (en) * | 1996-08-23 | 1999-09-07 | Physiome Sciences | Computational system and method for modeling the heart |
| WO1999055233A1 (en) * | 1998-04-24 | 1999-11-04 | University Of Washington | Automated delineation of heart contours |
| US5993390A (en) * | 1998-09-18 | 1999-11-30 | Hewlett- Packard Company | Segmented 3-D cardiac ultrasound imaging method and apparatus |
| US6088472A (en) * | 1996-12-20 | 2000-07-11 | Siemens Corporate Research, Inc. | Global models with parametric offsets for object recovery |
| US6139500A (en) * | 1999-02-24 | 2000-10-31 | Agilent Technologies Inc. | Methods and apparatus for 3D cardiac ultrasound imaging |
| US6201543B1 (en) | 1997-12-17 | 2001-03-13 | Siemens Corporate Research, Inc. | Framework for segmentation of cylindrical structures using two dimensional hybrid models |
| EP1083443A2 (en) * | 1999-09-09 | 2001-03-14 | Medison Co., Ltd. | Ultrasonic image apparatus for separating object |
| US6249693B1 (en) | 1999-11-01 | 2001-06-19 | General Electric Company | Method and apparatus for cardiac analysis using four-dimensional connectivity and image dilation |
| US6275613B1 (en) | 1999-06-03 | 2001-08-14 | Medsim Ltd. | Method for locating a model in an image |
| EP1171033A1 (en) * | 1999-04-21 | 2002-01-16 | Auckland UniServices Limited | Method and system of measuring characteristics of an organ |
| US6346124B1 (en) * | 1998-08-25 | 2002-02-12 | University Of Florida | Autonomous boundary detection system for echocardiographic images |
| US6352509B1 (en) * | 1998-11-16 | 2002-03-05 | Kabushiki Kaisha Toshiba | Three-dimensional ultrasonic diagnosis apparatus |
| US20020070970A1 (en) * | 2000-11-22 | 2002-06-13 | Wood Susan A. | Graphical user interface for display of anatomical information |
| US6415048B1 (en) * | 1993-10-12 | 2002-07-02 | Schneider Medical Technologies, Inc. | Compositional analysis system |
| US6438403B1 (en) | 1999-11-01 | 2002-08-20 | General Electric Company | Method and apparatus for cardiac analysis using four-dimensional connectivity |
| US6447453B1 (en) * | 2000-12-07 | 2002-09-10 | Koninklijke Philips Electronics N.V. | Analysis of cardiac performance using ultrasonic diagnostic images |
| US6464639B1 (en) * | 1999-10-25 | 2002-10-15 | Cybermed, Inc. | Method for modeling an internal object of a human body and apparatus thereof |
| US6470070B2 (en) | 2000-12-20 | 2002-10-22 | Cedara Software Corp. | Image reconstruction using multiple X-ray projections |
| US6473488B2 (en) | 2000-12-20 | 2002-10-29 | Cedara Software Corp. | Three dimensional image reconstruction from single plane X-ray fluorograms |
| US6517485B2 (en) * | 1999-08-23 | 2003-02-11 | G.E. Vingmed Ultrasound As | Method and apparatus for providing real-time calculation and display of tissue deformation in ultrasound imaging |
| US20030038802A1 (en) * | 2001-08-23 | 2003-02-27 | Johnson Richard K. | Automatic delineation of heart borders and surfaces from images |
| US20030063787A1 (en) * | 1995-05-31 | 2003-04-03 | Elscint Ltd. | Registration of nuclear medicine images |
| US6556695B1 (en) * | 1999-02-05 | 2003-04-29 | Mayo Foundation For Medical Education And Research | Method for producing high resolution real-time images, of structure and function during medical procedures |
| US20030097219A1 (en) * | 2001-10-12 | 2003-05-22 | O'donnell Thomas | System and method for 3D statistical shape model for the left ventricle of the heart |
| US20030187362A1 (en) * | 2001-04-30 | 2003-10-02 | Gregory Murphy | System and method for facilitating cardiac intervention |
| US6636769B2 (en) | 2000-12-18 | 2003-10-21 | Biosense, Inc. | Telemetric medical system and method |
| US6638231B2 (en) | 2000-12-18 | 2003-10-28 | Biosense, Inc. | Implantable telemetric medical sensor and method |
| US6652464B2 (en) * | 2000-12-18 | 2003-11-25 | Biosense, Inc. | Intracardiac pressure monitoring method |
| US6658300B2 (en) | 2000-12-18 | 2003-12-02 | Biosense, Inc. | Telemetric reader/charger device for medical sensor |
| US20030236462A1 (en) * | 2002-06-25 | 2003-12-25 | Koninklijke Philips Electronics N.V. | Ultrasound quantification in real-time using acoustic data in more than two dimensions |
| US6679849B2 (en) | 2001-07-31 | 2004-01-20 | Koninklijke Philips Electronics N.V. | Ultrasonic tee probe with two dimensional array transducer |
| US20040011365A1 (en) * | 2002-07-18 | 2004-01-22 | Assaf Govari | Medical sensor having power coil, sensing coil and control chip |
| US20040044283A1 (en) * | 2002-06-18 | 2004-03-04 | Kabushiki Kaisha Toshiba, Tokyo, Japan | Ultrasound diagnosis apparatus that adjusts a time phase between a plurality of image series |
| US20040047498A1 (en) * | 2000-11-22 | 2004-03-11 | Miguel Mulet-Parada | Detection of features in images |
| US20040049116A1 (en) * | 2001-04-30 | 2004-03-11 | Chase Medical, L.P. | System and method for facilitating cardiac intervention |
| US6746404B2 (en) * | 2000-12-18 | 2004-06-08 | Biosense, Inc. | Method for anchoring a medical device between tissue |
| US20040109594A1 (en) * | 2002-12-10 | 2004-06-10 | Eastman Kodak Company | Method for automatic construction of 2D statistical shape model for the lung regions |
| US20040122309A1 (en) * | 2002-12-19 | 2004-06-24 | Deller Timothy W. | Systems and methods for creating reformatted computed tomography images |
| US20040139103A1 (en) * | 1998-11-13 | 2004-07-15 | Cellomics, Inc. | Method and system for efficient collection and storage of experimental data |
| US20040153128A1 (en) * | 2003-01-30 | 2004-08-05 | Mitta Suresh | Method and system for image processing and contour assessment |
| US6783499B2 (en) | 2000-12-18 | 2004-08-31 | Biosense, Inc. | Anchoring mechanism for implantable telemetric medical sensor |
| US6816607B2 (en) | 2001-05-16 | 2004-11-09 | Siemens Corporate Research, Inc. | System for modeling static and dynamic three dimensional anatomical structures by 3-D models |
| WO2004097720A1 (en) * | 2003-04-24 | 2004-11-11 | Koninklijke Philips Electronics N.V. | Non-invasive left ventricular volume determination |
| US20040236220A1 (en) * | 2003-05-23 | 2004-11-25 | Parker Willis | Method and system for registering ultrasound image in three-dimensional coordinate system |
| US20040249281A1 (en) * | 2003-06-09 | 2004-12-09 | Bjorn Olstad | Method and apparatus for extracting wall function information relative to ultrasound-located landmarks |
| US20040249273A1 (en) * | 2003-06-04 | 2004-12-09 | Philippe Briandet | Stereoscopic visualization of beating heart |
| US20050018890A1 (en) * | 2003-07-24 | 2005-01-27 | Mcdonald John Alan | Segmentation of left ventriculograms using boosted decision trees |
| US20050043609A1 (en) * | 2003-01-30 | 2005-02-24 | Gregory Murphy | System and method for facilitating cardiac intervention |
| US20050100203A1 (en) * | 2003-11-10 | 2005-05-12 | Yasuko Fujisawa | Image processor |
| US20050105786A1 (en) * | 2003-11-17 | 2005-05-19 | Romain Moreau-Gobard | Automatic coronary isolation using a n-MIP ray casting technique |
| US20050113665A1 (en) * | 2003-11-26 | 2005-05-26 | Mohr Kelly A. | Cardiac display methods and apparatus |
| US20050187461A1 (en) * | 2004-01-30 | 2005-08-25 | Gregory Murphy | System and method for facilitating cardiac intervention |
| US20050253841A1 (en) * | 2004-05-17 | 2005-11-17 | Stefan Brabec | Volume rendering processing distribution in a graphics processing unit |
| US20050271271A1 (en) * | 2002-09-19 | 2005-12-08 | Koninklijke Philips Electronics N.V. | Segmenting a series of 2d or 3d images |
| WO2006006096A1 (en) * | 2004-07-09 | 2006-01-19 | Philips Intellectual Property & Standards Gmbh | Image processing system for the processing of morphological and functional images |
| US20060058674A1 (en) * | 2004-08-31 | 2006-03-16 | General Electric Company | Optimizing ultrasound acquisition based on ultrasound-located landmarks |
| WO2006044996A2 (en) * | 2004-10-15 | 2006-04-27 | The Trustees Of Columbia University In The City Of New York | System and method for automated boundary detection of body structures |
| US7043063B1 (en) * | 1999-08-27 | 2006-05-09 | Mirada Solutions Limited | Non-rigid motion image analysis |
| US20060159341A1 (en) * | 2003-06-13 | 2006-07-20 | Vladimir Pekar | 3D image segmentation |
| US20070003124A1 (en) * | 2000-11-22 | 2007-01-04 | Wood Susan A | Graphical user interface for display of anatomical information |
| US20070014452A1 (en) * | 2003-12-01 | 2007-01-18 | Mitta Suresh | Method and system for image processing and assessment of a state of a heart |
| US20070049824A1 (en) * | 2005-05-12 | 2007-03-01 | Konofagou Elisa E | System and method for electromechanical wave imaging of body structures |
| EP1781176A2 (en) * | 2004-02-17 | 2007-05-09 | Verathon Inc. | System and method for measuring bladder wall thickness and mass |
| WO2007107918A1 (en) * | 2006-03-20 | 2007-09-27 | Koninklijke Philips Electronics, N.V. | Ultrasonic diagnosis by quantification of myocardial performance |
| US20070276242A1 (en) * | 2004-10-15 | 2007-11-29 | Konofagou Elisa E | System And Method For Localized Measurement And Imaging Of Viscosity Of Tissues |
| US20080012852A1 (en) * | 2005-05-09 | 2008-01-17 | Stefan Brabec | Volume rendering processing distribution in a graphics processing unit |
| US20080086053A1 (en) * | 2006-10-06 | 2008-04-10 | Siemens Corporate Research, Inc. | Component-Based Approach For Fast Left Ventricle Detection |
| US20080101667A1 (en) * | 2006-10-25 | 2008-05-01 | Rcadia Medical Imaging Ltd. | Method and system for the presentation of blood vessel structures and identified pathologies |
| US20080101674A1 (en) * | 2006-10-25 | 2008-05-01 | Rcadia Medical Imaging Ltd. | Method and system for automatic analysis of blood vessel structures and pathologies |
| US20080103389A1 (en) * | 2006-10-25 | 2008-05-01 | Rcadia Medical Imaging Ltd. | Method and system for automatic analysis of blood vessel structures to identify pathologies |
| US20080146932A1 (en) * | 2002-06-07 | 2008-06-19 | Vikram Chalana | 3D ultrasound-based instrument for non-invasive measurement of Amniotic Fluid Volume |
| US20080253638A1 (en) * | 2005-09-16 | 2008-10-16 | The Ohio State University | Method and Apparatus for Detecting Interventricular Dyssynchrony |
| US20080260230A1 (en) * | 2005-09-16 | 2008-10-23 | The Ohio State University | Method and Apparatus for Detecting Intraventricular Dyssynchrony |
| US20080285819A1 (en) * | 2006-08-30 | 2008-11-20 | The Trustees Of Columbia University In The City Of New York | Systems and method for composite elastography and wave imaging |
| US20080312527A1 (en) * | 2007-05-28 | 2008-12-18 | Jun Masumoto | Cardiac function analysis apparatus, method and program |
| US20090005711A1 (en) * | 2005-09-19 | 2009-01-01 | Konofagou Elisa E | Systems and methods for opening of the blood-brain barrier of a subject using ultrasound |
| US20090221916A1 (en) * | 2005-12-09 | 2009-09-03 | The Trustees Of Columbia University In The City Of New York | Systems and Methods for Elastography Imaging |
| US20100056915A1 (en) * | 2006-05-25 | 2010-03-04 | Koninklijke Philips Electronics, N.V. | 3d echocardiographic shape analysis |
| US20100201687A1 (en) * | 2007-09-03 | 2010-08-12 | Koninklijke Philips Electronics N.V. | Visualization of voxel data |
| US7819806B2 (en) | 2002-06-07 | 2010-10-26 | Verathon Inc. | System and method to identify and measure organ wall boundaries |
| US7873194B2 (en) * | 2006-10-25 | 2011-01-18 | Rcadia Medical Imaging Ltd. | Method and system for automatic analysis of blood vessel structures and pathologies in support of a triple rule-out procedure |
| US20110071395A1 (en) * | 2001-07-31 | 2011-03-24 | Koninklijke Philips Electronics N.V. | Transesophageal and transnasal, transesophageal ultrasound imaging systems |
| US7940970B2 (en) | 2006-10-25 | 2011-05-10 | Rcadia Medical Imaging, Ltd | Method and system for automatic quality control used in computerized analysis of CT angiography |
| US8133181B2 (en) | 2007-05-16 | 2012-03-13 | Verathon Inc. | Device, system and method to measure abdominal aortic aneurysm diameter |
| US20120076382A1 (en) * | 2010-09-29 | 2012-03-29 | Siemens Corporation | Motion tracking for clinical parameter derivation and adaptive flow acquisition in magnetic resonance imaging |
| US8167803B2 (en) | 2007-05-16 | 2012-05-01 | Verathon Inc. | System and method for bladder detection using harmonic imaging |
| US8221321B2 (en) | 2002-06-07 | 2012-07-17 | Verathon Inc. | Systems and methods for quantification and classification of fluids in human cavities in ultrasound images |
| US8221322B2 (en) | 2002-06-07 | 2012-07-17 | Verathon Inc. | Systems and methods to improve clarity in ultrasound images |
| US8308644B2 (en) | 2002-08-09 | 2012-11-13 | Verathon Inc. | Instantaneous ultrasonic measurement of bladder volume |
| WO2013023214A1 (en) * | 2011-08-11 | 2013-02-14 | University Of Virginia | Image-based identification of muscle abnormalities |
| GB2495368A (en) * | 2011-09-01 | 2013-04-10 | Tomtec Imaging Syst Gmbh | A Process for Creating a Model of a Surface of a Cavity Wall |
| US8428687B2 (en) | 2008-08-01 | 2013-04-23 | The Trustees Of Columbia University In The City Of New York | Systems and methods for matching and imaging tissue characteristics |
| CN101596111B (en) * | 2008-05-23 | 2013-06-12 | 西门子公司 | Automatic localization of the left ventricle in cardiac cine magnetic resonance imaging |
| US20130230225A1 (en) * | 2010-11-12 | 2013-09-05 | Koninklijke Philips Electronics N.V. | Identifying individual sub-regions of the cardiovascular system for calcium scoring |
| DE102012107825A1 (en) * | 2012-08-24 | 2014-02-27 | Tomtec Imaging Systems Gmbh | Adaptation of a 3D surface model at interfaces of an anatomical structure in a 3D image dataset |
| US8712133B2 (en) * | 2010-09-29 | 2014-04-29 | Siemens Aktiengesellschaft | Cardiac chamber volume computation from contours and base plane in cardiac MR Cine images |
| US20150332483A1 (en) * | 2014-05-15 | 2015-11-19 | The Royal Institution For The Advancement Of Learning / Mcgill University | Methods of modelling and characterising heart fiber geometry |
| US9247921B2 (en) | 2013-06-07 | 2016-02-02 | The Trustees Of Columbia University In The City Of New York | Systems and methods of high frame rate streaming for treatment monitoring |
| US9256933B2 (en) | 2011-02-08 | 2016-02-09 | Region Nordjylland, Aalborg Sygehus | System for determining flow properties of a blood vessel |
| US9265483B2 (en) | 2010-08-06 | 2016-02-23 | The Trustees Of Columbia University In The City Of New York | Medical imaging contrast devices, methods, and systems |
| US9302124B2 (en) | 2008-09-10 | 2016-04-05 | The Trustees Of Columbia University In The City Of New York | Systems and methods for opening a tissue |
| US9320491B2 (en) | 2011-04-18 | 2016-04-26 | The Trustees Of Columbia University In The City Of New York | Ultrasound devices methods and systems |
| US9358023B2 (en) | 2008-03-19 | 2016-06-07 | The Trustees Of Columbia University In The City Of New York | Systems and methods for opening of a tissue barrier |
| US9506027B2 (en) | 2009-09-01 | 2016-11-29 | The Trustees Of Columbia University In The City Of New York | Microbubble devices, methods and systems |
| US9585631B2 (en) | 2010-06-01 | 2017-03-07 | The Trustees Of Columbia University In The City Of New York | Devices, methods, and systems for measuring elastic properties of biological tissues using acoustic force |
| US9691159B2 (en) | 2012-07-18 | 2017-06-27 | Koninklijke Philips N.V. | Local contraction measurements |
| US10010709B2 (en) | 2009-12-16 | 2018-07-03 | The Trustees Of Columbia University In The City Of New York | Composition for on-demand ultrasound-triggered drug delivery |
| US10028723B2 (en) | 2013-09-03 | 2018-07-24 | The Trustees Of Columbia University In The City Of New York | Systems and methods for real-time, transcranial monitoring of blood-brain barrier opening |
| US10058837B2 (en) | 2009-08-28 | 2018-08-28 | The Trustees Of Columbia University In The City Of New York | Systems, methods, and devices for production of gas-filled microbubbles |
| US10322178B2 (en) | 2013-08-09 | 2019-06-18 | The Trustees Of Columbia University In The City Of New York | Systems and methods for targeted drug delivery |
| CN110211170A (en) * | 2019-05-23 | 2019-09-06 | 南京维拓科技股份有限公司 | One kind being based on digital model wall thickness analysis method |
| US10441820B2 (en) | 2011-05-26 | 2019-10-15 | The Trustees Of Columbia University In The City Of New York | Systems and methods for opening of a tissue barrier in primates |
| CN110400298A (en) * | 2019-07-23 | 2019-11-01 | 中山大学 | Detection method, device, equipment and the medium of heart clinical indices |
| US10517564B2 (en) | 2012-10-10 | 2019-12-31 | The Trustees Of Columbia University In The City Of New York | Systems and methods for mechanical mapping of cardiac rhythm |
| US10687785B2 (en) | 2005-05-12 | 2020-06-23 | The Trustees Of Columbia Univeristy In The City Of New York | System and method for electromechanical activation of arrhythmias |
| US10765371B2 (en) | 2017-03-31 | 2020-09-08 | Biosense Webster (Israel) Ltd. | Method to project a two dimensional image/photo onto a 3D reconstruction, such as an epicardial view of heart |
| US11278259B2 (en) | 2018-02-23 | 2022-03-22 | Verathon Inc. | Thrombus detection during scanning |
Citations (7)
| Publication number | Priority date | Publication date | Assignee | Title |
|---|---|---|---|---|
| US4710876A (en) * | 1985-06-05 | 1987-12-01 | General Electric Company | System and method for the display of surface structures contained within the interior region of a solid body |
| US5072384A (en) * | 1988-11-23 | 1991-12-10 | Arch Development Corp. | Method and system for automated computerized analysis of sizes of hearts and lungs in digital chest radiographs |
| US5151856A (en) * | 1989-08-30 | 1992-09-29 | Technion R & D Found. Ltd. | Method of displaying coronary function |
| US5239591A (en) * | 1991-07-03 | 1993-08-24 | U.S. Philips Corp. | Contour extraction in multi-phase, multi-slice cardiac mri studies by propagation of seed contours between images |
| US5274549A (en) * | 1990-05-18 | 1993-12-28 | General Electric Company | Method of deriving a cardiac ejection fraction from nuclear image data |
| US5273040A (en) * | 1991-11-14 | 1993-12-28 | Picker International, Inc. | Measurement of vetricle volumes with cardiac MRI |
| US5273038A (en) * | 1990-07-09 | 1993-12-28 | Beavin William C | Computer simulation of live organ |
-
1993
- 1993-06-23 US US08/082,404 patent/US5435310A/en not_active Expired - Lifetime
Patent Citations (7)
| Publication number | Priority date | Publication date | Assignee | Title |
|---|---|---|---|---|
| US4710876A (en) * | 1985-06-05 | 1987-12-01 | General Electric Company | System and method for the display of surface structures contained within the interior region of a solid body |
| US5072384A (en) * | 1988-11-23 | 1991-12-10 | Arch Development Corp. | Method and system for automated computerized analysis of sizes of hearts and lungs in digital chest radiographs |
| US5151856A (en) * | 1989-08-30 | 1992-09-29 | Technion R & D Found. Ltd. | Method of displaying coronary function |
| US5274549A (en) * | 1990-05-18 | 1993-12-28 | General Electric Company | Method of deriving a cardiac ejection fraction from nuclear image data |
| US5273038A (en) * | 1990-07-09 | 1993-12-28 | Beavin William C | Computer simulation of live organ |
| US5239591A (en) * | 1991-07-03 | 1993-08-24 | U.S. Philips Corp. | Contour extraction in multi-phase, multi-slice cardiac mri studies by propagation of seed contours between images |
| US5273040A (en) * | 1991-11-14 | 1993-12-28 | Picker International, Inc. | Measurement of vetricle volumes with cardiac MRI |
Cited By (235)
| Publication number | Priority date | Publication date | Assignee | Title |
|---|---|---|---|---|
| US5701897A (en) * | 1992-10-02 | 1997-12-30 | Kabushiki Kaisha Toshiba | Ultrasonic diagnosis apparatus and image displaying system |
| US5722405A (en) * | 1993-04-15 | 1998-03-03 | Adac Laboratories | Method and apparatus for acquisition and processsing of event data in semi list mode |
| US5675522A (en) * | 1993-09-17 | 1997-10-07 | Nec Corporation | Method and system for dividing analyzing region in device simulator |
| US6415048B1 (en) * | 1993-10-12 | 2002-07-02 | Schneider Medical Technologies, Inc. | Compositional analysis system |
| US5570430A (en) * | 1994-05-31 | 1996-10-29 | University Of Washington | Method for determining the contour of an in vivo organ using multiple image frames of the organ |
| US7110587B1 (en) * | 1995-05-31 | 2006-09-19 | Ge Medical Systems Israel Ltd. | Registration of nuclear medicine images |
| US6937750B2 (en) | 1995-05-31 | 2005-08-30 | Ge Medical Systems Israel Ltd. | Registration of nuclear medicine images |
| US20030063787A1 (en) * | 1995-05-31 | 2003-04-03 | Elscint Ltd. | Registration of nuclear medicine images |
| US20060182325A1 (en) * | 1995-05-31 | 2006-08-17 | Ge Medical Systems Israel Ltd. | Registration of nuclear medicine images |
| US7190820B2 (en) | 1995-05-31 | 2007-03-13 | Ge Medical Systems Israel Ltd. | Registration of nuclear medicine images |
| EP0802424A2 (en) * | 1996-04-15 | 1997-10-22 | Olympus Optical Co., Ltd. | Diagnostic ultrasonic imaging system having run extracting means for extracting point closest to start point of scanning lines |
| EP0802424A3 (en) * | 1996-04-15 | 1999-04-07 | Olympus Optical Co., Ltd. | Diagnostic ultrasonic imaging system having run extracting means for extracting point closest to start point of scanning lines |
| EP1324070A1 (en) * | 1996-04-15 | 2003-07-02 | Olympus Optical Co., Ltd. | Diagnostic ultrasonic imaging system |
| US5947899A (en) * | 1996-08-23 | 1999-09-07 | Physiome Sciences | Computational system and method for modeling the heart |
| US5871019A (en) * | 1996-09-23 | 1999-02-16 | Mayo Foundation For Medical Education And Research | Fast cardiac boundary imaging |
| US5923770A (en) * | 1996-09-30 | 1999-07-13 | Siemens Corporate Research, Inc. | 3D cardiac motion recovery system using tagged MR images |
| EP0846442A3 (en) * | 1996-11-08 | 1999-05-06 | Advanced Technology Laboratories, Inc. | Ultrasonic diagnostic imaging system for analysis of left ventricular function |
| KR100491623B1 (en) * | 1996-11-08 | 2005-09-16 | 어드밴스트 테크놀로지 래보러토리스 인코퍼레이티드 | Ultrasonic diagnostic imaging system for analysis of left ventricular function |
| US5846200A (en) * | 1996-11-08 | 1998-12-08 | Advanced Technology Laboratories, Inc. | Ultrasonic diagnostic imaging system for analysis of left ventricular function |
| US5669382A (en) * | 1996-11-19 | 1997-09-23 | General Electric Company | System for measuring myocardium in cardiac images |
| US6088472A (en) * | 1996-12-20 | 2000-07-11 | Siemens Corporate Research, Inc. | Global models with parametric offsets for object recovery |
| US5930410A (en) * | 1997-01-13 | 1999-07-27 | Hewlett-Packard Company | Method and apparatus for obtaining multiple views from one scan window |
| US5859922A (en) * | 1997-02-21 | 1999-01-12 | Hoffmann; Kenneth R. | Process of determining the three-dimensional location of a pacemaker leads in the heart of a subject |
| US6106466A (en) * | 1997-04-24 | 2000-08-22 | University Of Washington | Automated delineation of heart contours from images using reconstruction-based modeling |
| US5916168A (en) * | 1997-05-29 | 1999-06-29 | Advanced Technology Laboratories, Inc. | Three dimensional M-mode ultrasonic diagnostic imaging system |
| US5800356A (en) * | 1997-05-29 | 1998-09-01 | Advanced Technology Laboratories, Inc. | Ultrasonic diagnostic imaging system with doppler assisted tracking of tissue motion |
| WO1999005638A1 (en) * | 1997-07-25 | 1999-02-04 | International Regenrative Medicine, Inc. | A quantitative visual system for comparing parameters which characterize multiple complex entities |
| US5928151A (en) * | 1997-08-22 | 1999-07-27 | Acuson Corporation | Ultrasonic system and method for harmonic imaging in three dimensions |
| US5924991A (en) * | 1997-08-22 | 1999-07-20 | Acuson Corporation | Ultrasonic system and method for harmonic imaging in three dimensions |
| WO1999030281A1 (en) * | 1997-12-10 | 1999-06-17 | Ge Medical Systems S.A. | Semiautomatic segmentation method for estimating three-dimensional volumes |
| US20020026299A1 (en) * | 1997-12-10 | 2002-02-28 | Jerome Knoplioch | Method of semiautomatic segmentation for the estimation of three-dimensional volumes |
| FR2772162A1 (en) * | 1997-12-10 | 1999-06-11 | Ge Medical Syst Sa | SEMI-AUTOMATIC SEGMENTATION PROCESS FOR THE ESTIMATION OF THREE-DIMENSIONAL VOLUMES |
| US7191101B2 (en) | 1997-12-10 | 2007-03-13 | Ge Medical Systems Sa | Method of semiautomatic segmentation for the estimation of three-dimensional volumes |
| US6201543B1 (en) | 1997-12-17 | 2001-03-13 | Siemens Corporate Research, Inc. | Framework for segmentation of cylindrical structures using two dimensional hybrid models |
| WO1999055233A1 (en) * | 1998-04-24 | 1999-11-04 | University Of Washington | Automated delineation of heart contours |
| US6346124B1 (en) * | 1998-08-25 | 2002-02-12 | University Of Florida | Autonomous boundary detection system for echocardiographic images |
| US6716175B2 (en) | 1998-08-25 | 2004-04-06 | University Of Florida | Autonomous boundary detection system for echocardiographic images |
| US5993390A (en) * | 1998-09-18 | 1999-11-30 | Hewlett- Packard Company | Segmented 3-D cardiac ultrasound imaging method and apparatus |
| US8090748B2 (en) | 1998-11-13 | 2012-01-03 | Cellomics, Inc. | Method for efficient collection and storage of experimental data |
| US20080301202A1 (en) * | 1998-11-13 | 2008-12-04 | Cellomics, Inc. | Method for spooling experimental data |
| US8024293B2 (en) | 1998-11-13 | 2011-09-20 | Cellomics, Inc. | Method for spooling experimental data |
| US7467153B2 (en) * | 1998-11-13 | 2008-12-16 | Cellomics, Inc. | Method and system for efficient collection and storage of experimental data |
| US20040139103A1 (en) * | 1998-11-13 | 2004-07-15 | Cellomics, Inc. | Method and system for efficient collection and storage of experimental data |
| US20080306989A1 (en) * | 1998-11-13 | 2008-12-11 | Cellomics, Inc. | Method for efficient collection and storage of experimental data |
| US6352509B1 (en) * | 1998-11-16 | 2002-03-05 | Kabushiki Kaisha Toshiba | Three-dimensional ultrasonic diagnosis apparatus |
| US6556695B1 (en) * | 1999-02-05 | 2003-04-29 | Mayo Foundation For Medical Education And Research | Method for producing high resolution real-time images, of structure and function during medical procedures |
| US6139500A (en) * | 1999-02-24 | 2000-10-31 | Agilent Technologies Inc. | Methods and apparatus for 3D cardiac ultrasound imaging |
| EP1171033A4 (en) * | 1999-04-21 | 2005-09-21 | Auckland Uniservices Ltd | Method and system of measuring characteristics of an organ |
| US7155042B1 (en) * | 1999-04-21 | 2006-12-26 | Auckland Uniservices Limited | Method and system of measuring characteristics of an organ |
| EP1171033A1 (en) * | 1999-04-21 | 2002-01-16 | Auckland UniServices Limited | Method and system of measuring characteristics of an organ |
| US6275613B1 (en) | 1999-06-03 | 2001-08-14 | Medsim Ltd. | Method for locating a model in an image |
| US6517485B2 (en) * | 1999-08-23 | 2003-02-11 | G.E. Vingmed Ultrasound As | Method and apparatus for providing real-time calculation and display of tissue deformation in ultrasound imaging |
| US7043063B1 (en) * | 1999-08-27 | 2006-05-09 | Mirada Solutions Limited | Non-rigid motion image analysis |
| EP1083443A2 (en) * | 1999-09-09 | 2001-03-14 | Medison Co., Ltd. | Ultrasonic image apparatus for separating object |
| EP1083443A3 (en) * | 1999-09-09 | 2003-12-10 | Medison Co., Ltd. | Ultrasonic image apparatus for separating object |
| US6464639B1 (en) * | 1999-10-25 | 2002-10-15 | Cybermed, Inc. | Method for modeling an internal object of a human body and apparatus thereof |
| US6249693B1 (en) | 1999-11-01 | 2001-06-19 | General Electric Company | Method and apparatus for cardiac analysis using four-dimensional connectivity and image dilation |
| US6438403B1 (en) | 1999-11-01 | 2002-08-20 | General Electric Company | Method and apparatus for cardiac analysis using four-dimensional connectivity |
| US20020070970A1 (en) * | 2000-11-22 | 2002-06-13 | Wood Susan A. | Graphical user interface for display of anatomical information |
| US7633501B2 (en) * | 2000-11-22 | 2009-12-15 | Mevis Medical Solutions, Inc. | Graphical user interface for display of anatomical information |
| US6925200B2 (en) * | 2000-11-22 | 2005-08-02 | R2 Technology, Inc. | Graphical user interface for display of anatomical information |
| US7519206B2 (en) | 2000-11-22 | 2009-04-14 | Siemens Medical Solutions Usa, Inc. | Detection of features in images |
| US20040047498A1 (en) * | 2000-11-22 | 2004-03-11 | Miguel Mulet-Parada | Detection of features in images |
| US20070003124A1 (en) * | 2000-11-22 | 2007-01-04 | Wood Susan A | Graphical user interface for display of anatomical information |
| US6447453B1 (en) * | 2000-12-07 | 2002-09-10 | Koninklijke Philips Electronics N.V. | Analysis of cardiac performance using ultrasonic diagnostic images |
| US6746404B2 (en) * | 2000-12-18 | 2004-06-08 | Biosense, Inc. | Method for anchoring a medical device between tissue |
| US20060161171A1 (en) * | 2000-12-18 | 2006-07-20 | Biosense, Inc. | Method for anchoring a medical device between tissue |
| US6783499B2 (en) | 2000-12-18 | 2004-08-31 | Biosense, Inc. | Anchoring mechanism for implantable telemetric medical sensor |
| US6658300B2 (en) | 2000-12-18 | 2003-12-02 | Biosense, Inc. | Telemetric reader/charger device for medical sensor |
| US6652464B2 (en) * | 2000-12-18 | 2003-11-25 | Biosense, Inc. | Intracardiac pressure monitoring method |
| US6638231B2 (en) | 2000-12-18 | 2003-10-28 | Biosense, Inc. | Implantable telemetric medical sensor and method |
| US6636769B2 (en) | 2000-12-18 | 2003-10-21 | Biosense, Inc. | Telemetric medical system and method |
| US7229415B2 (en) | 2000-12-18 | 2007-06-12 | Biosense, Inc. | Method for anchoring a medical device between tissue |
| US6587541B2 (en) | 2000-12-20 | 2003-07-01 | Cedara Software Corp. | Three dimensional image reconstruction from single plane x-ray fluorograms |
| US6470070B2 (en) | 2000-12-20 | 2002-10-22 | Cedara Software Corp. | Image reconstruction using multiple X-ray projections |
| US6661869B2 (en) | 2000-12-20 | 2003-12-09 | Cedara Software Corp. | Image reconstruction using multiple X-ray projections |
| US6473488B2 (en) | 2000-12-20 | 2002-10-29 | Cedara Software Corp. | Three dimensional image reconstruction from single plane X-ray fluorograms |
| US20050020929A1 (en) * | 2001-04-30 | 2005-01-27 | Chase Medical, Lp | System and method for facilitating cardiac intervention |
| US7773785B2 (en) * | 2001-04-30 | 2010-08-10 | Chase Medical, L.P. | System and method for facilitating cardiac intervention |
| US7327862B2 (en) * | 2001-04-30 | 2008-02-05 | Chase Medical, L.P. | System and method for facilitating cardiac intervention |
| US7646901B2 (en) | 2001-04-30 | 2010-01-12 | Chase Medical, L.P. | System and method for facilitating cardiac intervention |
| US20040049115A1 (en) * | 2001-04-30 | 2004-03-11 | Chase Medical, L.P. | System and method for facilitating cardiac intervention |
| US20030187362A1 (en) * | 2001-04-30 | 2003-10-02 | Gregory Murphy | System and method for facilitating cardiac intervention |
| US20040049116A1 (en) * | 2001-04-30 | 2004-03-11 | Chase Medical, L.P. | System and method for facilitating cardiac intervention |
| US20040176678A1 (en) * | 2001-04-30 | 2004-09-09 | Chase Medical, L.P. | System and method for facilitating cardiac intervention |
| US7536042B2 (en) | 2001-04-30 | 2009-05-19 | Chase Medical, L.P. | System and method for facilitating cardiac intervention |
| US7526112B2 (en) | 2001-04-30 | 2009-04-28 | Chase Medical, L.P. | System and method for facilitating cardiac intervention |
| US6816607B2 (en) | 2001-05-16 | 2004-11-09 | Siemens Corporate Research, Inc. | System for modeling static and dynamic three dimensional anatomical structures by 3-D models |
| US6679849B2 (en) | 2001-07-31 | 2004-01-20 | Koninklijke Philips Electronics N.V. | Ultrasonic tee probe with two dimensional array transducer |
| USRE45759E1 (en) | 2001-07-31 | 2015-10-20 | Koninklijke Philips N.V. | Transesophageal and transnasal, transesophageal ultrasound imaging systems |
| US20110071395A1 (en) * | 2001-07-31 | 2011-03-24 | Koninklijke Philips Electronics N.V. | Transesophageal and transnasal, transesophageal ultrasound imaging systems |
| US20030038802A1 (en) * | 2001-08-23 | 2003-02-27 | Johnson Richard K. | Automatic delineation of heart borders and surfaces from images |
| US6873718B2 (en) * | 2001-10-12 | 2005-03-29 | Siemens Corporate Research, Inc. | System and method for 3D statistical shape model for the left ventricle of the heart |
| US20030097219A1 (en) * | 2001-10-12 | 2003-05-22 | O'donnell Thomas | System and method for 3D statistical shape model for the left ventricle of the heart |
| US7819806B2 (en) | 2002-06-07 | 2010-10-26 | Verathon Inc. | System and method to identify and measure organ wall boundaries |
| US20080146932A1 (en) * | 2002-06-07 | 2008-06-19 | Vikram Chalana | 3D ultrasound-based instrument for non-invasive measurement of Amniotic Fluid Volume |
| US8221322B2 (en) | 2002-06-07 | 2012-07-17 | Verathon Inc. | Systems and methods to improve clarity in ultrasound images |
| US8221321B2 (en) | 2002-06-07 | 2012-07-17 | Verathon Inc. | Systems and methods for quantification and classification of fluids in human cavities in ultrasound images |
| US7175598B2 (en) * | 2002-06-18 | 2007-02-13 | Kabushiki Kaisha Toshiba | Ultrasound diagnosis apparatus that adjusts a time phase between a plurality of image series |
| US20040044283A1 (en) * | 2002-06-18 | 2004-03-04 | Kabushiki Kaisha Toshiba, Tokyo, Japan | Ultrasound diagnosis apparatus that adjusts a time phase between a plurality of image series |
| US20030236462A1 (en) * | 2002-06-25 | 2003-12-25 | Koninklijke Philips Electronics N.V. | Ultrasound quantification in real-time using acoustic data in more than two dimensions |
| US6824517B2 (en) * | 2002-06-25 | 2004-11-30 | Koninklijke Philips Electronics N.V. | Ultrasound quantification in real-time using acoustic data in more than two dimensions |
| US7060075B2 (en) | 2002-07-18 | 2006-06-13 | Biosense, Inc. | Distal targeting of locking screws in intramedullary nails |
| US20040034355A1 (en) * | 2002-07-18 | 2004-02-19 | Assaf Govari | Distal targeting of locking screws in intramedullary nails |
| US20050080427A1 (en) * | 2002-07-18 | 2005-04-14 | Assaf Govari | Distal targeting of locking screws in intramedullary nails |
| US20040011365A1 (en) * | 2002-07-18 | 2004-01-22 | Assaf Govari | Medical sensor having power coil, sensing coil and control chip |
| US8308644B2 (en) | 2002-08-09 | 2012-11-13 | Verathon Inc. | Instantaneous ultrasonic measurement of bladder volume |
| US9993225B2 (en) | 2002-08-09 | 2018-06-12 | Verathon Inc. | Instantaneous ultrasonic echo measurement of bladder volume with a limited number of ultrasound beams |
| US20050271271A1 (en) * | 2002-09-19 | 2005-12-08 | Koninklijke Philips Electronics N.V. | Segmenting a series of 2d or 3d images |
| US7668370B2 (en) * | 2002-09-19 | 2010-02-23 | Koninklijke Philips Electronics N.V. | Segmenting a series of 2D or 3D images |
| EP1460584A2 (en) * | 2002-12-10 | 2004-09-22 | Eastman Kodak Company | Method for automatic construction of 2D statistical shape model for the lung regions |
| EP1460584A3 (en) * | 2002-12-10 | 2005-02-16 | Eastman Kodak Company | Method for automatic construction of 2D statistical shape model for the lung regions |
| US20070058850A1 (en) * | 2002-12-10 | 2007-03-15 | Hui Luo | Method for automatic construction of 2d statistical shape model for the lung regions |
| US20040109594A1 (en) * | 2002-12-10 | 2004-06-10 | Eastman Kodak Company | Method for automatic construction of 2D statistical shape model for the lung regions |
| US7221786B2 (en) | 2002-12-10 | 2007-05-22 | Eastman Kodak Company | Method for automatic construction of 2D statistical shape model for the lung regions |
| US20040122309A1 (en) * | 2002-12-19 | 2004-06-24 | Deller Timothy W. | Systems and methods for creating reformatted computed tomography images |
| US7211046B2 (en) * | 2002-12-19 | 2007-05-01 | Ge Medical Systems Global Technology Company Llc | Systems and methods for creating reformatted computed tomography images |
| US20040153128A1 (en) * | 2003-01-30 | 2004-08-05 | Mitta Suresh | Method and system for image processing and contour assessment |
| US7693563B2 (en) * | 2003-01-30 | 2010-04-06 | Chase Medical, LLP | Method for image processing and contour assessment of the heart |
| EP1593087A4 (en) * | 2003-01-30 | 2006-10-04 | Chase Medical Lp | A method and system for image processing and contour assessment |
| EP1593087A2 (en) * | 2003-01-30 | 2005-11-09 | Chase Medical, L. P. | A method and system for image processing and contour assessment |
| US20050043609A1 (en) * | 2003-01-30 | 2005-02-24 | Gregory Murphy | System and method for facilitating cardiac intervention |
| CN100377165C (en) * | 2003-04-24 | 2008-03-26 | 皇家飞利浦电子股份有限公司 | Non-invasive left ventricular volume determination |
| US20060241376A1 (en) * | 2003-04-24 | 2006-10-26 | Koninklijke Philips Electronics N.V. | Non-invasive left ventricular volume determination |
| WO2004097720A1 (en) * | 2003-04-24 | 2004-11-11 | Koninklijke Philips Electronics N.V. | Non-invasive left ventricular volume determination |
| US7603154B2 (en) | 2003-04-24 | 2009-10-13 | Koninklijke Philips Electronics N.V. | Non-invasive left ventricular volume determination |
| US20040236220A1 (en) * | 2003-05-23 | 2004-11-25 | Parker Willis | Method and system for registering ultrasound image in three-dimensional coordinate system |
| US6896657B2 (en) | 2003-05-23 | 2005-05-24 | Scimed Life Systems, Inc. | Method and system for registering ultrasound image in three-dimensional coordinate system |
| US20050090744A1 (en) * | 2003-05-23 | 2005-04-28 | Scimed Life Systems, Inc. | Method and system for registering ultrasound image in three-dimensional coordinate system |
| US7052461B2 (en) | 2003-05-23 | 2006-05-30 | Scimed Life Systems, Inc. | Method and system for registering ultrasound image in three-dimensional coordinate system |
| US20040249273A1 (en) * | 2003-06-04 | 2004-12-09 | Philippe Briandet | Stereoscopic visualization of beating heart |
| US6873866B2 (en) * | 2003-06-04 | 2005-03-29 | Segami Corporation | Stereoscopic visualization of beating heart |
| US20040249281A1 (en) * | 2003-06-09 | 2004-12-09 | Bjorn Olstad | Method and apparatus for extracting wall function information relative to ultrasound-located landmarks |
| US7536041B2 (en) * | 2003-06-13 | 2009-05-19 | Koninklijke Philips Electronics N.V. | 3D image segmentation |
| US20060159341A1 (en) * | 2003-06-13 | 2006-07-20 | Vladimir Pekar | 3D image segmentation |
| US20050018890A1 (en) * | 2003-07-24 | 2005-01-27 | Mcdonald John Alan | Segmentation of left ventriculograms using boosted decision trees |
| US7596258B2 (en) * | 2003-11-10 | 2009-09-29 | Kabushiki Kaisha Toshiba | Image processor |
| US20050100203A1 (en) * | 2003-11-10 | 2005-05-12 | Yasuko Fujisawa | Image processor |
| US7574247B2 (en) * | 2003-11-17 | 2009-08-11 | Siemens Medical Solutions Usa, Inc. | Automatic coronary isolation using a n-MIP ray casting technique |
| US20050105786A1 (en) * | 2003-11-17 | 2005-05-19 | Romain Moreau-Gobard | Automatic coronary isolation using a n-MIP ray casting technique |
| US7689261B2 (en) * | 2003-11-26 | 2010-03-30 | General Electric Company | Cardiac display methods and apparatus |
| US20050113665A1 (en) * | 2003-11-26 | 2005-05-26 | Mohr Kelly A. | Cardiac display methods and apparatus |
| US20070014452A1 (en) * | 2003-12-01 | 2007-01-18 | Mitta Suresh | Method and system for image processing and assessment of a state of a heart |
| US7333643B2 (en) * | 2004-01-30 | 2008-02-19 | Chase Medical, L.P. | System and method for facilitating cardiac intervention |
| US20050187461A1 (en) * | 2004-01-30 | 2005-08-25 | Gregory Murphy | System and method for facilitating cardiac intervention |
| EP1781176A4 (en) * | 2004-02-17 | 2009-07-01 | Verathon Inc | System and method for measuring bladder wall thickness and mass |
| EP1781176A2 (en) * | 2004-02-17 | 2007-05-09 | Verathon Inc. | System and method for measuring bladder wall thickness and mass |
| US20080018642A1 (en) * | 2004-05-17 | 2008-01-24 | Stefan Brabec | Volume rendering processing distribution in a graphics processing unit |
| US7714855B2 (en) * | 2004-05-17 | 2010-05-11 | Siemens Medical Solutions Usa, Inc. | Volume rendering processing distribution in a graphics processing unit |
| US20050253841A1 (en) * | 2004-05-17 | 2005-11-17 | Stefan Brabec | Volume rendering processing distribution in a graphics processing unit |
| US8018454B2 (en) | 2004-05-17 | 2011-09-13 | Siemens Medical Solutions Usa, Inc. | Volume rendering processing distribution in a graphics processing unit |
| WO2006006096A1 (en) * | 2004-07-09 | 2006-01-19 | Philips Intellectual Property & Standards Gmbh | Image processing system for the processing of morphological and functional images |
| US20060058674A1 (en) * | 2004-08-31 | 2006-03-16 | General Electric Company | Optimizing ultrasound acquisition based on ultrasound-located landmarks |
| WO2006044996A3 (en) * | 2004-10-15 | 2006-08-03 | Univ Columbia | System and method for automated boundary detection of body structures |
| WO2006044996A2 (en) * | 2004-10-15 | 2006-04-27 | The Trustees Of Columbia University In The City Of New York | System and method for automated boundary detection of body structures |
| US20070276242A1 (en) * | 2004-10-15 | 2007-11-29 | Konofagou Elisa E | System And Method For Localized Measurement And Imaging Of Viscosity Of Tissues |
| US20070276245A1 (en) * | 2004-10-15 | 2007-11-29 | Konofagou Elisa E | System And Method For Automated Boundary Detection Of Body Structures |
| US7852335B2 (en) | 2005-05-09 | 2010-12-14 | Siemens Medical Solutions Usa, Inc. | Volume rendering processing distribution in a graphics processing unit |
| US20080012852A1 (en) * | 2005-05-09 | 2008-01-17 | Stefan Brabec | Volume rendering processing distribution in a graphics processing unit |
| US20070049824A1 (en) * | 2005-05-12 | 2007-03-01 | Konofagou Elisa E | System and method for electromechanical wave imaging of body structures |
| US10687785B2 (en) | 2005-05-12 | 2020-06-23 | The Trustees Of Columbia Univeristy In The City Of New York | System and method for electromechanical activation of arrhythmias |
| US8858441B2 (en) | 2005-05-12 | 2014-10-14 | The Trustees Of Columbia University In The City Of New York | System and method for electromechanical wave imaging of body structures |
| US20080260230A1 (en) * | 2005-09-16 | 2008-10-23 | The Ohio State University | Method and Apparatus for Detecting Intraventricular Dyssynchrony |
| US20080253638A1 (en) * | 2005-09-16 | 2008-10-16 | The Ohio State University | Method and Apparatus for Detecting Interventricular Dyssynchrony |
| US8131043B2 (en) | 2005-09-16 | 2012-03-06 | The Ohio State University | Method and apparatus for detecting interventricular dyssynchrony |
| US8280136B2 (en) * | 2005-09-16 | 2012-10-02 | The Ohio State University | Method and apparatus for detecting intraventricular dyssynchrony |
| US20090005711A1 (en) * | 2005-09-19 | 2009-01-01 | Konofagou Elisa E | Systems and methods for opening of the blood-brain barrier of a subject using ultrasound |
| US20090221916A1 (en) * | 2005-12-09 | 2009-09-03 | The Trustees Of Columbia University In The City Of New York | Systems and Methods for Elastography Imaging |
| US20090136109A1 (en) * | 2006-03-20 | 2009-05-28 | Koninklijke Philips Electronics, N.V. | Ultrasonic diagnosis by quantification of myocardial performance |
| WO2007107918A1 (en) * | 2006-03-20 | 2007-09-27 | Koninklijke Philips Electronics, N.V. | Ultrasonic diagnosis by quantification of myocardial performance |
| JP2009530008A (en) * | 2006-03-20 | 2009-08-27 | コーニンクレッカ フィリップス エレクトロニクス エヌ ヴィ | Ultrasound diagnosis by quantifying myocardial performance |
| US8144956B2 (en) | 2006-03-20 | 2012-03-27 | Koninklijke Philips Electronics N.V. | Ultrasonic diagnosis by quantification of myocardial performance |
| US8287457B2 (en) * | 2006-05-25 | 2012-10-16 | Koninklijke Philips Electronics N.V | 3D echocardiographic shape analysis |
| US20100056915A1 (en) * | 2006-05-25 | 2010-03-04 | Koninklijke Philips Electronics, N.V. | 3d echocardiographic shape analysis |
| US20080285819A1 (en) * | 2006-08-30 | 2008-11-20 | The Trustees Of Columbia University In The City Of New York | Systems and method for composite elastography and wave imaging |
| US8150128B2 (en) | 2006-08-30 | 2012-04-03 | The Trustees Of Columbia University In The City Of New York | Systems and method for composite elastography and wave imaging |
| US20080086053A1 (en) * | 2006-10-06 | 2008-04-10 | Siemens Corporate Research, Inc. | Component-Based Approach For Fast Left Ventricle Detection |
| US7940977B2 (en) | 2006-10-25 | 2011-05-10 | Rcadia Medical Imaging Ltd. | Method and system for automatic analysis of blood vessel structures to identify calcium or soft plaque pathologies |
| US8103074B2 (en) | 2006-10-25 | 2012-01-24 | Rcadia Medical Imaging Ltd. | Identifying aorta exit points from imaging data |
| US20080101674A1 (en) * | 2006-10-25 | 2008-05-01 | Rcadia Medical Imaging Ltd. | Method and system for automatic analysis of blood vessel structures and pathologies |
| US20080101667A1 (en) * | 2006-10-25 | 2008-05-01 | Rcadia Medical Imaging Ltd. | Method and system for the presentation of blood vessel structures and identified pathologies |
| US7983459B2 (en) | 2006-10-25 | 2011-07-19 | Rcadia Medical Imaging Ltd. | Creating a blood vessel tree from imaging data |
| US7940970B2 (en) | 2006-10-25 | 2011-05-10 | Rcadia Medical Imaging, Ltd | Method and system for automatic quality control used in computerized analysis of CT angiography |
| US7873194B2 (en) * | 2006-10-25 | 2011-01-18 | Rcadia Medical Imaging Ltd. | Method and system for automatic analysis of blood vessel structures and pathologies in support of a triple rule-out procedure |
| US7860283B2 (en) * | 2006-10-25 | 2010-12-28 | Rcadia Medical Imaging Ltd. | Method and system for the presentation of blood vessel structures and identified pathologies |
| US20080103389A1 (en) * | 2006-10-25 | 2008-05-01 | Rcadia Medical Imaging Ltd. | Method and system for automatic analysis of blood vessel structures to identify pathologies |
| US8133181B2 (en) | 2007-05-16 | 2012-03-13 | Verathon Inc. | Device, system and method to measure abdominal aortic aneurysm diameter |
| US8167803B2 (en) | 2007-05-16 | 2012-05-01 | Verathon Inc. | System and method for bladder detection using harmonic imaging |
| US8059876B2 (en) * | 2007-05-28 | 2011-11-15 | Fujifilm Corporation | Cardiac function analysis apparatus, method and program |
| US20080312527A1 (en) * | 2007-05-28 | 2008-12-18 | Jun Masumoto | Cardiac function analysis apparatus, method and program |
| US8537159B2 (en) * | 2007-09-03 | 2013-09-17 | Koninklijke Philips N.V. | Visualization of voxel data |
| US20100201687A1 (en) * | 2007-09-03 | 2010-08-12 | Koninklijke Philips Electronics N.V. | Visualization of voxel data |
| US9358023B2 (en) | 2008-03-19 | 2016-06-07 | The Trustees Of Columbia University In The City Of New York | Systems and methods for opening of a tissue barrier |
| US10166379B2 (en) | 2008-03-19 | 2019-01-01 | The Trustees Of Columbia University In The City Of New York | Systems and methods for opening of a tissue barrier |
| CN101596111B (en) * | 2008-05-23 | 2013-06-12 | 西门子公司 | Automatic localization of the left ventricle in cardiac cine magnetic resonance imaging |
| US9514358B2 (en) | 2008-08-01 | 2016-12-06 | The Trustees Of Columbia University In The City Of New York | Systems and methods for matching and imaging tissue characteristics |
| US8428687B2 (en) | 2008-08-01 | 2013-04-23 | The Trustees Of Columbia University In The City Of New York | Systems and methods for matching and imaging tissue characteristics |
| US9302124B2 (en) | 2008-09-10 | 2016-04-05 | The Trustees Of Columbia University In The City Of New York | Systems and methods for opening a tissue |
| US10058837B2 (en) | 2009-08-28 | 2018-08-28 | The Trustees Of Columbia University In The City Of New York | Systems, methods, and devices for production of gas-filled microbubbles |
| US9506027B2 (en) | 2009-09-01 | 2016-11-29 | The Trustees Of Columbia University In The City Of New York | Microbubble devices, methods and systems |
| US10010709B2 (en) | 2009-12-16 | 2018-07-03 | The Trustees Of Columbia University In The City Of New York | Composition for on-demand ultrasound-triggered drug delivery |
| US9585631B2 (en) | 2010-06-01 | 2017-03-07 | The Trustees Of Columbia University In The City Of New York | Devices, methods, and systems for measuring elastic properties of biological tissues using acoustic force |
| US9265483B2 (en) | 2010-08-06 | 2016-02-23 | The Trustees Of Columbia University In The City Of New York | Medical imaging contrast devices, methods, and systems |
| US8712133B2 (en) * | 2010-09-29 | 2014-04-29 | Siemens Aktiengesellschaft | Cardiac chamber volume computation from contours and base plane in cardiac MR Cine images |
| US20120076382A1 (en) * | 2010-09-29 | 2012-03-29 | Siemens Corporation | Motion tracking for clinical parameter derivation and adaptive flow acquisition in magnetic resonance imaging |
| US8792699B2 (en) * | 2010-09-29 | 2014-07-29 | Siemens Aktiengesellschaft | Motion tracking for clinical parameter derivation and adaptive flow acquisition in magnetic resonance imaging |
| US9317919B2 (en) * | 2010-11-12 | 2016-04-19 | Koninklijke Philips N.V. | Identifying individual sub-regions of the cardiovascular system for calcium scoring |
| US20130230225A1 (en) * | 2010-11-12 | 2013-09-05 | Koninklijke Philips Electronics N.V. | Identifying individual sub-regions of the cardiovascular system for calcium scoring |
| US9256933B2 (en) | 2011-02-08 | 2016-02-09 | Region Nordjylland, Aalborg Sygehus | System for determining flow properties of a blood vessel |
| US9320491B2 (en) | 2011-04-18 | 2016-04-26 | The Trustees Of Columbia University In The City Of New York | Ultrasound devices methods and systems |
| US11096660B2 (en) | 2011-04-18 | 2021-08-24 | The Trustees Of Columbia University In The City Of New York | Ultrasound devices methods and systems |
| US10441820B2 (en) | 2011-05-26 | 2019-10-15 | The Trustees Of Columbia University In The City Of New York | Systems and methods for opening of a tissue barrier in primates |
| US11273329B2 (en) | 2011-05-26 | 2022-03-15 | The Trustees Of Columbia University In The City Of New York | Systems and methods for opening of a tissue barrier in primates |
| US20140364723A1 (en) * | 2011-08-11 | 2014-12-11 | University Of Virginia | Image-based identification of muscle abnormalities |
| US10314511B2 (en) * | 2011-08-11 | 2019-06-11 | University Of Virginia Patent Foundation | Image-based identification of muscle abnormalities |
| WO2013023214A1 (en) * | 2011-08-11 | 2013-02-14 | University Of Virginia | Image-based identification of muscle abnormalities |
| AU2012294232B2 (en) * | 2011-08-11 | 2015-08-06 | University Of Virginia | Image-based identification of muscle abnormalities |
| GB2495368B (en) * | 2011-09-01 | 2018-03-28 | Tomtec Imaging Syst Gmbh | A process for creating a model of a surface of a cavity wall |
| US9324185B2 (en) | 2011-09-01 | 2016-04-26 | Tomtec Imaging Systems Gmbh | Process for creating a model of a surface of a cavity wall |
| GB2495368A (en) * | 2011-09-01 | 2013-04-10 | Tomtec Imaging Syst Gmbh | A Process for Creating a Model of a Surface of a Cavity Wall |
| US9691159B2 (en) | 2012-07-18 | 2017-06-27 | Koninklijke Philips N.V. | Local contraction measurements |
| DE102012107825A1 (en) * | 2012-08-24 | 2014-02-27 | Tomtec Imaging Systems Gmbh | Adaptation of a 3D surface model at interfaces of an anatomical structure in a 3D image dataset |
| US9280816B2 (en) | 2012-08-24 | 2016-03-08 | Tomtec Imaging Systems Gmbh | Adaptation of a 3D-surface model to boundaries of an anatomical structure in a 3D-image data set |
| DE102012107825B4 (en) * | 2012-08-24 | 2017-03-16 | Tomtec Imaging Systems Gmbh | Adaptation of a 3D surface model at interfaces of an anatomical structure in a 3D image dataset |
| US10517564B2 (en) | 2012-10-10 | 2019-12-31 | The Trustees Of Columbia University In The City Of New York | Systems and methods for mechanical mapping of cardiac rhythm |
| US9247921B2 (en) | 2013-06-07 | 2016-02-02 | The Trustees Of Columbia University In The City Of New York | Systems and methods of high frame rate streaming for treatment monitoring |
| US10322178B2 (en) | 2013-08-09 | 2019-06-18 | The Trustees Of Columbia University In The City Of New York | Systems and methods for targeted drug delivery |
| US10028723B2 (en) | 2013-09-03 | 2018-07-24 | The Trustees Of Columbia University In The City Of New York | Systems and methods for real-time, transcranial monitoring of blood-brain barrier opening |
| US20150332483A1 (en) * | 2014-05-15 | 2015-11-19 | The Royal Institution For The Advancement Of Learning / Mcgill University | Methods of modelling and characterising heart fiber geometry |
| US9569887B2 (en) * | 2014-05-15 | 2017-02-14 | The Royal Institution For The Advancement Of Learning / Mcgill University | Methods of modelling and characterising heart fiber geometry |
| US10765371B2 (en) | 2017-03-31 | 2020-09-08 | Biosense Webster (Israel) Ltd. | Method to project a two dimensional image/photo onto a 3D reconstruction, such as an epicardial view of heart |
| US11278259B2 (en) | 2018-02-23 | 2022-03-22 | Verathon Inc. | Thrombus detection during scanning |
| CN110211170A (en) * | 2019-05-23 | 2019-09-06 | 南京维拓科技股份有限公司 | One kind being based on digital model wall thickness analysis method |
| CN110400298A (en) * | 2019-07-23 | 2019-11-01 | 中山大学 | Detection method, device, equipment and the medium of heart clinical indices |
| CN110400298B (en) * | 2019-07-23 | 2023-10-31 | 中山大学 | Method, device, equipment and medium for detecting heart clinical index |
Similar Documents
| Publication | Publication Date | Title |
|---|---|---|
| US5435310A (en) | Determining cardiac wall thickness and motion by imaging and three-dimensional modeling | |
| US5601084A (en) | Determining cardiac wall thickness and motion by imaging and three-dimensional modeling | |
| US5889524A (en) | Reconstruction of three-dimensional objects using labeled piecewise smooth subdivision surfaces | |
| US6106466A (en) | Automated delineation of heart contours from images using reconstruction-based modeling | |
| Raichlen et al. | Dynamic three-dimensional reconstruction of the left ventricle from two-dimensional echocardiograms | |
| US7155042B1 (en) | Method and system of measuring characteristics of an organ | |
| US20120002840A1 (en) | Method of and arrangement for linking image coordinates to coordinates of reference model | |
| JP4521271B2 (en) | An image processing system for displaying information on the movement of the top of a deformable three-dimensional object | |
| EP1846896B1 (en) | A method, a system and a computer program for integration of medical diagnostic information and a geometric model of a movable body | |
| US8077944B2 (en) | Method, device, and computer programme for evaluating images of a cavity | |
| Hu et al. | Prostate boundary segmentation from 3D ultrasound images | |
| EP2537111B1 (en) | Method and system for archiving subject-specific, three-dimensional information about the geometry of part of the body | |
| JP4365836B2 (en) | Method and apparatus for reconstructing a two-dimensional cross-sectional image | |
| US10922861B2 (en) | Method and apparatus for correcting dynamic models obtained by tracking methods | |
| Geiser et al. | A framework for three-dimensional time-varying reconstruction of the human left ventricle: sources of error and estimation of their magnitude | |
| van Dam et al. | Development of new anatomy reconstruction software to localize cardiac isochrones to the cardiac surface from the 12 lead ECG | |
| Mæhle et al. | Three‐dimensional echocardiography for quantitative left ventricular wall motion analysis: A method for reconstruction of endocardial surface and evaluation of regional dysfunction | |
| JP2004529719A (en) | Method of processing an image sequence of a deformable three-dimensional object to produce an indication of the deformation of said object wall in time | |
| Martin et al. | Methodology for three-dimensional reconstruction of the left ventricle from transesophageal echocardiograms | |
| Rodevand et al. | Left ventricular volumes assessed by different new three-dimensional echocardiographic methods and ordinary biplane technique | |
| Smith et al. | Four dimensional cardiac imaging | |
| Salgo | Three-dimensional echocardiography | |
| Lee et al. | Comparative study of left ventricular low wall motion with scar tissue using 4d left ventricular cardiac images | |
| Blancher et al. | Time-varying, 3-D echocardiography using a fast-rotating probe | |
| Bolson et al. | Applying the centersurface model to 3-D reconstructions of the left ventricle for regional function analysis |
Legal Events
| Date | Code | Title | Description |
|---|---|---|---|
| STPP | Information on status: patent application and granting procedure in general |
Free format text: APPLICATION UNDERGOING PREEXAM PROCESSING |
|
| AS | Assignment |
Owner name: UNIVERSITY OF WASHINGTON, WASHINGTON Free format text: ASSIGNMENT OF ASSIGNORS INTEREST;ASSIGNOR:BOOKSTEIN, FRED L.;REEL/FRAME:007440/0707 Effective date: 19950323 Owner name: UNIVERSITY OF WASHINGTON, WASHINGTON Free format text: ASSIGNMENT OF ASSIGNORS INTEREST;ASSIGNOR:SHEEHAN, FLORENCE H.;REEL/FRAME:007438/0043 Effective date: 19950317 Owner name: UNIVERSITY OF WASHINGTON, WASHINGTON Free format text: ASSIGNMENT OF ASSIGNORS INTEREST;ASSIGNOR:BOLSON, EDWARD L.;REEL/FRAME:007438/0041 Effective date: 19950317 Owner name: UNIVERSITY OF WASHINGTON, WASHINGTON Free format text: ASSIGNMENT OF ASSIGNORS INTEREST;ASSIGNOR:SAMPSON, PAUL D.;REEL/FRAME:007438/0045 Effective date: 19950321 |
|
| FEPP | Fee payment procedure |
Free format text: PAYOR NUMBER ASSIGNED (ORIGINAL EVENT CODE: ASPN); ENTITY STATUS OF PATENT OWNER: SMALL ENTITY |
|
| FEPP | Fee payment procedure |
Free format text: PAT HLDR NO LONGER CLAIMS SMALL ENT STAT AS INDIV INVENTOR (ORIGINAL EVENT CODE: LSM1); ENTITY STATUS OF PATENT OWNER: SMALL ENTITY |
|
| FPAY | Fee payment |
Year of fee payment: 4 |
|
| FEPP | Fee payment procedure |
Free format text: PAT HOLDER CLAIMS SMALL ENTITY STATUS, ENTITY STATUS SET TO SMALL (ORIGINAL EVENT CODE: LTOS); ENTITY STATUS OF PATENT OWNER: SMALL ENTITY |
|
| FPAY | Fee payment |
Year of fee payment: 8 |
|
| FPAY | Fee payment |
Year of fee payment: 12 |