US5454053A - Method for compressing dynamic ranges of images - Google Patents
Method for compressing dynamic ranges of images Download PDFInfo
- Publication number
- US5454053A US5454053A US08/229,217 US22921794A US5454053A US 5454053 A US5454053 A US 5454053A US 22921794 A US22921794 A US 22921794A US 5454053 A US5454053 A US 5454053A
- Authority
- US
- United States
- Prior art keywords
- image
- sus
- original image
- image signal
- sorg
- Prior art date
- Legal status (The legal status is an assumption and is not a legal conclusion. Google has not performed a legal analysis and makes no representation as to the accuracy of the status listed.)
- Expired - Lifetime
Links
- 238000000034 method Methods 0.000 title claims abstract description 31
- 230000007423 decrease Effects 0.000 claims abstract description 8
- 238000012935 Averaging Methods 0.000 claims abstract description 5
- OAICVXFJPJFONN-UHFFFAOYSA-N Phosphorus Chemical compound [P] OAICVXFJPJFONN-UHFFFAOYSA-N 0.000 claims description 20
- 230000005855 radiation Effects 0.000 claims description 14
- 230000004936 stimulating effect Effects 0.000 claims description 6
- 206010073306 Exposure to radiation Diseases 0.000 claims 2
- 230000006870 function Effects 0.000 description 105
- 230000006835 compression Effects 0.000 description 12
- 238000007906 compression Methods 0.000 description 12
- 230000009466 transformation Effects 0.000 description 12
- 230000003247 decreasing effect Effects 0.000 description 8
- 230000008859 change Effects 0.000 description 4
- 238000003745 diagnosis Methods 0.000 description 2
- NIXOWILDQLNWCW-UHFFFAOYSA-N acrylic acid group Chemical group C(C=C)(=O)O NIXOWILDQLNWCW-UHFFFAOYSA-N 0.000 description 1
- 230000002411 adverse Effects 0.000 description 1
- 210000000988 bone and bone Anatomy 0.000 description 1
- 230000000694 effects Effects 0.000 description 1
- 230000006872 improvement Effects 0.000 description 1
- 230000003287 optical effect Effects 0.000 description 1
- 230000000638 stimulation Effects 0.000 description 1
- 230000001131 transforming effect Effects 0.000 description 1
Images


Classifications
-
- H—ELECTRICITY
- H04—ELECTRIC COMMUNICATION TECHNIQUE
- H04N—PICTORIAL COMMUNICATION, e.g. TELEVISION
- H04N1/00—Scanning, transmission or reproduction of documents or the like, e.g. facsimile transmission; Details thereof
- H04N1/40—Picture signal circuits
- H04N1/407—Control or modification of tonal gradation or of extreme levels, e.g. background level
-
- G06T5/92—
-
- G—PHYSICS
- G06—COMPUTING; CALCULATING OR COUNTING
- G06T—IMAGE DATA PROCESSING OR GENERATION, IN GENERAL
- G06T9/00—Image coding
- G06T9/005—Statistical coding, e.g. Huffman, run length coding
Definitions
- This invention relates to a method for compressing a dynamic range of an image, with which an original image signal representing an original image is processed, and a processed image signal representing an image having a narrower dynamic range than the original image is thereby generated.
- an X-ray image is recorded on an X-ray film having a small gamma value chosen according to the type of image processing to be carried out, the X-ray image is read out from the X-ray film and converted into an electric signal (i.e., an image signal), and the image signal is processed and then used for reproducing the X-ray image as a visible image on a photocopy, or the like.
- an electric signal i.e., an image signal
- stimulable phosphors in radiation image recording and reproducing systems. Specifically, a radiation image of an object, such as a human body, is recorded on a sheet provided with a layer of the stimulable phosphor (hereinafter referred to as a stimulable phosphor sheet).
- the stimulable phosphor sheet on which the radiation image has been stored, is then scanned with stimulating rays, such as a laser beam, which cause it to emit light in proportion to the amount of energy stored thereon during its exposure to the radiation.
- stimulating rays such as a laser beam
- the light emitted by the stimulable phosphor sheet, upon stimulation thereof, is photoelectrically detected and converted into an electric image signal.
- the image signal is then used during the reproduction of the radiation image of the object as a visible image on a recording material, such as photographic film.
- the image signal representing the original image is processed such that the high-density parts of the original image may have an appropriate level of image density in the reproduced image.
- the image signal representing the original image is processed such that the low-density parts of the original image may have an appropriate level of image density in the reproduced image.
- the level of contrast of the parts of the image having a high or low image density or the level of contrast of the whole image has heretofore been rendered low such that the difference between the highest image density and the lowest image density may become small, i.e. such that the dynamic range of the image may become narrow.
- FIG. 15 is a graph showing an example of how the values of the image signal components of an original image signal Sorg are distributed, which image signal components represent picture elements located along a certain direction (the direction indicated by the arrow x) on an original image.
- the values of the image signal components of the original image signal Sorg are distributed in a step-like pattern along the direction indicated by the arrow x (i.e. the image density of the original image changes step-wise along the direction indicated by the arrow x).
- Each step part of the distribution of the image density includes a fine change having a comparatively high spatial frequency.
- FIG. 16A is a graph showing an example of characteristics with which an original image signal Sorg representing an image is transformed into an image signal Sorg such that the dynamic range of the image may be compressed by lowering the level of contrast of part having a high image density.
- FIG. 16B is a graph showing how the values of the image signal components of the image signal Sorg' resulting from the transformation with the characteristics illustrated in FIG. 16A are distributed, which image signal components represent picture elements located along the direction indicated by the arrow x on the image.
- the original image signal Sorg having values shown in FIG. 15 is transformed into the image signal Sorg' having values lying on the line A shown in FIG. 16A.
- the level of image density in the part having a high image density become low.
- the level of contrast of the fine image structures represented by the fine change in each step part of the distribution of the image density, which step part falls within the high density region becomes low. Therefore, the fine image structures having a high image density, which image structures are to be used and therefore are required to have good image quality in the reproduced image, become very hard to observe.
- FIG. 17A is a graph showing an example of characteristics with which an original image signal Sorg representing an image is transformed into an image signal Sorg' such that the dynamic range of the image may be compressed by lowering the level of contrast of part having a low image density.
- FIG. 17B is a graph showing how the values of the image signal components of the image signal Sorg' resulting from the transformation with the characteristics illustrated in FIG. 17A are distributed, which image signal components represent picture elements located along the direction indicated by the arrow x on the image.
- the original image signal Sorg having values shown in FIG. 15 is transformed into the image signal Sorg' having values lying on the line B shown in FIG. 17A.
- the fine image structures having a low image density become very hard to observe.
- the proposed technique has the effects of compressing the dynamic range of an image and keeping the contrast of fine image structures, which are present in each of parts having various levels of image density, high.
- the proposed technique only the dynamic range of parts of the image, which parts have low levels of image density, can be compressed. With the proposed technique, the dynamic range of parts of the image, which parts have high levels of image density, cannot be compressed. Therefore, the proposed technique has the drawback in that it is not suitable for images of bones of limbs, or the like. Also, the proposed technique has the risk that an artificial contour may occur in a visible image reproduced from the processed image signal and adversely affects the image quality of the visible image.
- f 1 (Sus) represents a function, the value of which decreases monotonously as the value of the unsharp mask signal Sus increases, whereby the values of a processed image signal Sproc representing an image having a narrower dynamic range than the original image is generated.
- both the dynamic range of parts of the image, which parts have low levels of image density, and the dynamic range of parts of the image, which have high levels of image density can be compressed.
- the differential coefficient of the function f 1 (Sus) is continuous, no artificial contour occurs in the image represented by the processed image signal Sproc.
- the range of image density of the image can be compressed such that parts of the image covering a wide range of image density can be used and may have good image quality in the reproduced visible image, and the image quality of fine image structures at each of parts having various levels of image density may be kept good.
- the primary object of the present invention is to provide a method for compressing a dynamic range of an image, wherein the compression of the dynamic range of an image is carried out appropriately even for an image having a level of contrast different from ordinary levels of contrast.
- Another object of the present invention is to provide a method for compressing a dynamic range of an image, wherein an image signal representing the image is processed such that no artificial contour may occur in the visible image reproduced from the processed image signal.
- the present invention provides a first method for compressing a dynamic range of an image, comprising the steps of:
- f 1 (Sus) represents a function, the value of which decreases monotonously as the value of the unsharp mask signal Sus increases, whereby the values of a processed image signal Sproc representing an image having a narrower dynamic range than the original image is generated
- signal range to which a function f 1 (Sus) is applied means the range of the image density region of the image signal, which is processed with the function f 1 (Sus).
- level of a value of a function f 1 (Sus) as used herein means the degree of emphasis of the image signal.
- the present invention also provides a second method for compressing a dynamic range of an image, wherein at least a portion of the function f 1 (Sus), the value of which decreases monotonously, contains a curve.
- the value of the function f 1 (Sus) need not necessarily change for every value of the unsharp mask signal Sus, and may not change for a certain range of values of the unsharp mask signal Sus.
- the signal range, to which the function f 1 (Sus) is applied in order to compress the dynamic range of the image, and/or the level of the value of the function f 1 (Sus) is determined in accordance with the level of the contrast of the original image signal Sorg.
- the signal range, to which the function f 1 (Sus) is applied is widened, and/or the level of the value of the function f 1 (Sus) is set at a high level.
- the signal range, to which the function f 1 (Sus) is applied is narrowed, and/or the level of the value of the function f 1 (Sus) is set at a low level.
- the range of image density of the image can be compressed such that parts of the image covering a wide range of image density can be used and may have good image quality in the reproduced visible image. Therefore, a processed image, which has good image quality and can serve as an effective tool in, particularly, the efficient and accurate diagnosis of an illness, can be obtained in accordance with the level of the contrast of the original image.
- the signal range, to which the function f 1 (Sus) is applied in order to compress the dynamic range of the image, and/or the level of the value of the function f 1 (Sus) is determined in accordance with the level of the contrast of the original image signal Sorg. Therefore, the dynamic range of the parts of the image, which parts have high levels of image density, or the dynamic range of the parts of the image, which parts have low levels of image density, or the dynamic range of the entire area of the image can be lowered appropriately regardless of the level of the contrast of the original image. In this manner, the range of image density of the image can be compressed such that parts of the image covering a wide range of image density can be used and may have good image quality in the reproduced visible image.
- FIG. 1 is a schematic view showing an example of an X-ray image recording apparatus
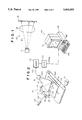
- FIG. 2 is a perspective view showing an example of an X-ray image read-out apparatus
- FIG. 3 is an explanatory view showing picture elements in an original image and image signal components of an original image signal Sorg, which represent the picture elements,
- FIG. 4 is a graph showing an example of contrast of an original image signal Sorg
- FIGS. 5A and 5B are graphs showing examples of monotonously decreasing functions, in which the value of an unsharp mask signal Sus serves as a variable
- FIG. 6 is a graph showing a different example of contrast of an original image signal Sorg
- FIGS. 7A and 7B are graphs showing different examples of monotonously decreasing functions, in which the value of an unsharp mask signal Sus serves as a variable
- FIG. 8 is a graph showing a further example of contrast of an original image signal Sorg
- FIGS. 9A and 9B are graphs showing further examples of monotonously decreasing functions, in which the value of an unsharp mask signal Sus serves as a variable
- FIG. 10 is a graph showing a still further example of contrast of an original image signal Sorg
- FIG. 11 is a graph showing a still further example of a monotonously decreasing function, in which the value of an unsharp mask signal Sus serves as a variable,
- FIG. 12 is a graph showing a different example of a monotonously decreasing function, in which the value of an unsharp mask signal Sus serves as a variable,
- FIG. 13 is a graph showing a further example of a monotonously decreasing function, in which the value of an unsharp mask signal Sus serves as a variable,
- FIG. 14 is a graph showing a still further example of a monotonously decreasing function, in which the value of an unsharp mask signal Sus serves as a variable,
- FIG. 15 is a graph showing an example of how the values of the image signal components of an original image signal Sorg are distributed, which image signal components represent picture elements located along a certain direction (the direction indicated by the arrow x) on an original image,
- FIG. 16A is a graph showing an example of characteristics with which an original image signal Sorg representing an image is transformed into an image signal Sorg' such that the dynamic range of the image may be compressed by lowering the level of contrast of part having a high image density,
- FIG. 16B is a graph showing how the values of the image signal components of the image signal Sorg' resulting from the transformation with the characteristics illustrated in FIG. 16A are distributed, which image signal components represent picture elements located along the direction indicated by the arrow x on the image,
- FIG. 17A is a graph showing an example of characteristics with which an original image signal Sorg representing an image is transformed into an image signal Sorg' such that the dynamic range of the image may be compressed by lowering the level of contrast of part having a low image density, and
- FIG. 17B is a graph showing how the values of the image signal components of the image signal Sorg' resulting from the transformation with the characteristics illustrated in FIG. 17A are distributed, which image signal components represent picture elements located along the direction indicated by the arrow x on the image.
- an X-ray image is stored on a stimulable phosphor sheet.
- FIG. 1 is a schematic view showing an example of an X-ray image recording apparatus.
- X-rays 12 are produced by an X-ray source 11 of an X-ray image recording apparatus and irradiated to an object 13.
- FIG. 2 is a perspective view showing an example of an X-ray image read-out apparatus.
- a stimulable phosphor sheet 14, on which an X-ray image has been stored in the X-ray image recording apparatus shown in FIG. 1, is placed at a predetermined position in a read-out means 20.
- the stimulable phosphor sheet 14 is then conveyed in a sub-scanning direction, which is indicated by the arrow Y, by an endless belt 22, which is operated by a motor 21.
- a laser beam 24, which serves as stimulating rays, is produced by a laser beam source 23.
- the laser beam 24 is reflected and deflected by a rotating polygon mirror 26, which is quickly rotated by a motor 25 in the direction indicated by the arrow.
- the laser beam 24 then passes through a converging lens 27, which may be constituted of an f ⁇ lens, or the like.
- the direction of the optical path of the laser beam 24 is then changed by a mirror 28, and the laser beam 24 impinges upon the stimulable phosphor sheet 14 and scans it in a main scanning direction indicated by the arrow X, which direction is approximately normal to the sub-scanning direction indicated by the arrow Y.
- the exposed portion of the stimulable phosphor sheet 14 emits light 29 in an amount proportional to the amount of energy stored thereon during its exposure to the X-rays.
- the emitted light 29 is guided by a light guide member 30 and photoelectrically detected by a photomultiplier 31.
- the light guide member 30 is made from a light guiding material, such as an acrylic plate.
- the light guide member 30 has a linear light input face 30a, which is positioned so that it extends along the main scanning line on the stimulable phosphor sheet 14, and a ring-shaped light output face 30b, which is positioned so that it is in close contact with a light receiving face of the photomultiplier 31.
- the emitted light 29, which has entered the light guide member 30 at its light input face 30a, is guided through repeated total reflection inside of the light guide member 30, emanates from the light output face 30b, and is received by the photomultiplier 31. In this manner, the amount of the emitted light 29, which amount represents the X-ray image, is converted into an electric signal by the photomultiplier 31.
- An analog output signal SO is generated by the photomultiplier 31.
- the analog output signal SO is logarithmically amplified by a logarithmic amplifier 32, and digitized by an A/D converter 33.
- an original image signal Sorg is obtained.
- the original image signal Sorg is then fed into an image processing and reproducing means 40.
- the image processing and reproducing means 40 is constituted of a CRT display device 41 which reproduces and displays a visible image, a main body 42 in which a CPU, an internal memory, an interface, or the like, are incorporated, a floppy disk drive unit 43 which operates a floppy disk, and a keyboard 44 from which necessary information is fed into the X-ray image read-out apparatus.
- the dynamic range of the image is compressed by transforming the original image signal Sorg in the manner described below.
- FIG. 3 is an explanatory view showing picture elements in an original image and image signal components of an original image signal Sorg, which represent the picture elements.
- dots represent the picture elements
- the symbols, such as S ij represent the image signal components of the original image signal Sorg which represent the corresponding picture elements.
- the value of an unsharp mask signal Sus ij for the picture element which is located in the middle of the region surrounded by the chained line, is calculated with the formula ##EQU2## By carrying out the calculation for every picture element, an unsharp mask signal Sus for the whole image is generated.
- the values of m and n are determined arbitrarily in accordance with the intervals, with which the original image signal Sorg is sampled, the characteristics of the original X-ray image, or the like.
- FIG. 4 is a graph showing an example of contrast Gp of an original image signal Sorg in terms of the relationship between the image density of the image before being subjected to contrast transformation and the image density of the image after being subjected to the contrast transformation.
- the image before being subjected to contrast transformation is reproduced as the image, which has been subjected to the contrast transformation and has a predetermined image density region.
- the contrast Gp is limited such that it may fall within a predetermined range (Gpmin ⁇ Gp ⁇ Gpmax) with the point O on the high density side being fixed.
- FIGS. 5A and 5B are graphs showing examples of monotonously decreasing functions, in which the value of an unsharp mask signal Sus serves as a variable.
- a function f 1 (Sus) shown in FIG. 5A has the characteristics such that the value of the function f 1 (Sus) changes when the unsharp mask signal Sus takes a small value, and such that the value of the function f 1 (Sus) is zero when the value of the unsharp mask signal Sus is larger than d.
- a function f 2 (Sus) shown in FIG. 5A has the characteristics such that the value of the function f 1 (Sus) changes when the unsharp mask signal Sus takes a small value, and such that the value of the function f 1 (Sus) is zero when the value of the unsharp mask signal Sus is larger than d.
- 5B has the characteristics such that the value of the function f 2 (Sus) is zero when the value of the unsharp mask signal Sus falls within the range of zero to e, and such that the function f 2 (Sus) takes values lying on the inclined straight line when the value of the unsharp mask signal Sus is larger than e.
- a calculation using the function f 1 (Sus) and/or the function f 2 (Sus) is carried out with the formula
- the contrast Gp shown in FIG. 4 is limited such that it may fall within the predetermined range (Gpmin ⁇ Gp ⁇ Gpmax). However, for a different image, it will often occur that the contrast Gp falls outside of the predetermined range. In such cases, the signal range, to which the function f 1 (Sus) shown in FIG. 5A and/or the function f 2 (Sus) shown in FIG. 5B is applied, and/or the level of the value of the function f 1 (Sus) and/or the function f 2 (Sus) is varied in accordance with the calculated contrast Gp, and the processing for compressing the dynamic range is thereby carried out.
- a function f 1 ' is employed as the function f 1 (Sus), and/or a function f 2 ' is employed as the function f 2 (Sus).
- the signal range, to which the function f 1 (Sus) is applied is widened, and the level of the value of the function f 1 (Sus) is set at a low level.
- the signal range, to which the function f 2 (Sus) is applied is narrowed. In this manner, the degree of compression is reduced, and the compression of the dynamic range is thereby carried out.
- the signal range, to which the function f 1 (Sus) is applied is narrowed, and the level of the value of the function f 1 (Sus) is set at a high level
- the signal range, to which the function f 2 (Sus) is applied is widened. In this manner, the degree of compression is increased, and the compression of the dynamic range is thereby carried out.
- the processing for compressing the dynamic range can be carried out in accordance with the difference between the maximum image density and the minimum image density of the original image.
- the contrast Gp is limited such that it may fall within a predetermined range (Gpmin ⁇ Gp ⁇ Gpmax) with the point O 2 on the low density side being fixed.
- Gpmin ⁇ Gp ⁇ Gpmax a predetermined range
- the contrast as a whole becomes slightly compressed, and the image density of the image after being subjected to the contrast transformation becomes low. Therefore, in such cases, as illustrated in FIGS. 9A and 9B, a function f 1 ' is employed as the function f 1 (Sus), and/or a function f 2 ' is employed as the function f 2 (Sus).
- the signal range, to which the function f 1 (Sus) is applied is narrowed.
- the signal range to which the function f 2 (Sus) is applied is widened, and the level of the value of the function f 2 (Sus) is set at a low level. In this manner, the degree of compression is reduced, and the compression of the dynamic range is thereby carried out.
- the signal range, to which the function f 2 (Sus) is applied is narrowed, and the level of the value of the function f 2 (Sus) is set at a high level. In this manner, the degree of compression is increased, and the compression of the dynamic range is thereby carried out.
- the contrast Gp is limited such that it may fall within a predetermined range (Gpmin ⁇ Gp ⁇ Gpmax) with the point O 3 at an approximately middle density position being fixed.
- the function f 1 (Sus) for raising the image density on the low density side the functions shown in FIG. 7A may be employed.
- the function f 2 (Sus) for lowering the image density on the high density side the functions shown in FIG. 9B may be employed.
- the function f 1 (Sus) may be changed as indicated by the functions f 1 ' and f 1 " in accordance with the level of the contrast Gp.
- the function f 2 (Sus) may be changed as indicated by the functions f 2 ' and f 2 " in accordance with the level of the contrast Gp.
- the two functions f 1 (Sus) and f 2 (Sus) are employed as the functions for carrying out the processing for compressing the dynamic range.
- f 1 (Sus) and f 2 (Sus) are employed as the functions for carrying out the processing for compressing the dynamic range.
- only either one of the functions may be employed.
- the function for carrying out the processing for compressing the dynamic range is not limited to the functions f 1 (Sus) and f 2 (Sus).
- portions of the function may contain curves.
- the function may contain a portion at which the value of the function f 4 (Sus) does not become zero.
- a function f 5 (Sus) may be employed, in which the degree of compression becomes high on the low image density side and the high image density side.
- the line representing the function f 6 (Sus) may not be folded sharply at the point, d, at which the value of the function f 6 (Sus) becomes zero, but the differential coefficient of the function f 6 (Sus) may be continuous at the point, d.
- a function which has characteristics such that the line representing it folds sharply at the point, d, even if no particular contour is present in the original image, an artificial contour will occur at the part having the image density corresponding to the point, d, in the visible image reproduced from the processed image signal Sproc.
- the function f6(Sus) which has characteristics such that the differential coefficient is continuous at the point, d, no artificial contour occurs in the reproduced visible image.
- an X-ray image is read out from a stimulable phosphor sheet, and an image signal is thereby generated.
- the method for compressing a dynamic range of an image in accordance with the present invention is broadly applicable when image signals are detected from various kinds of recording media, on which images have been recorded, e.g. when an X-ray image is read out from X-ray film.
Abstract
Sproc=Sorg+f.sub.1 (Sus)
Description
b=1,023-a
c=Sorg+α·b (α=0.3)
Sproc=Sorg+f.sub.1 (Sus) (1)
Sproc=Sorg+f.sub.1 (Sus)
Sproc.sub.ij =S.sub.ij +f.sub.k (Sus.sub.ij) (where k=1, 2) (3)
Claims (16)
Sproc=Sorg+f.sub.1 (Sus)
Sproc=Sorg+f.sub.1 (Sus)
Applications Claiming Priority (2)
| Application Number | Priority Date | Filing Date | Title |
|---|---|---|---|
| JP09127693A JP3196864B2 (en) | 1993-04-19 | 1993-04-19 | Image dynamic range compression processing method |
| JP5-091276 | 1993-04-19 |
Publications (1)
| Publication Number | Publication Date |
|---|---|
| US5454053A true US5454053A (en) | 1995-09-26 |
Family
ID=14021940
Family Applications (1)
| Application Number | Title | Priority Date | Filing Date |
|---|---|---|---|
| US08/229,217 Expired - Lifetime US5454053A (en) | 1993-04-19 | 1994-04-18 | Method for compressing dynamic ranges of images |
Country Status (2)
| Country | Link |
|---|---|
| US (1) | US5454053A (en) |
| JP (1) | JP3196864B2 (en) |
Cited By (17)
| Publication number | Priority date | Publication date | Assignee | Title |
|---|---|---|---|---|
| EP0766202A2 (en) * | 1995-09-29 | 1997-04-02 | Fuji Photo Film Co., Ltd. | Image processing method and apparatus |
| EP0813336A2 (en) * | 1996-06-12 | 1997-12-17 | Fuji Photo Film Co., Ltd. | Image processing method and apparatus |
| US5761333A (en) * | 1995-01-31 | 1998-06-02 | General Electric Company | Contrast enhancement for CT systems |
| US5835618A (en) * | 1996-09-27 | 1998-11-10 | Siemens Corporate Research, Inc. | Uniform and non-uniform dynamic range remapping for optimum image display |
| DE19722761A1 (en) * | 1997-06-02 | 1998-12-03 | Heidelberger Druckmasch Ag | Process for processing image data |
| US5926578A (en) * | 1995-10-25 | 1999-07-20 | Dainippon Screen Mfg. Co., Ltd. | Image processor having a partial image preprocessor |
| US6104503A (en) * | 1996-08-26 | 2000-08-15 | Fuji Photo Film Co., Ltd. | Image processing and reproducing apparatus |
| US6201891B1 (en) * | 1996-06-26 | 2001-03-13 | Matsushita Electric Industrial Co., Ltd. | X-ray imaging apparatus and recording medium therefor |
| US6208766B1 (en) * | 1994-02-09 | 2001-03-27 | Deutsche Aerospace Ag | Process for influencing the quality images furnished by an electronic imaging system |
| US6330362B1 (en) | 1996-11-12 | 2001-12-11 | Texas Instruments Incorporated | Compression for multi-level screened images |
| US6384939B1 (en) * | 1995-04-28 | 2002-05-07 | Minolta Co., Ltd. | Image processing apparatus and method for adjustment of density of copied image |
| US6721441B1 (en) * | 1999-12-30 | 2004-04-13 | General Electric Company | Extended dynamic range system for digital X-ray imaging detectors |
| US20070071318A1 (en) * | 2003-09-11 | 2007-03-29 | Haruo Yamashita | Visual processing device, visual processing method, visual processing program, and semiconductor device |
| US20070109447A1 (en) * | 2003-09-11 | 2007-05-17 | Haruo Yamashita | Visual processing device, visual processing method, visual processing program, and semiconductor device |
| US20070165048A1 (en) * | 2003-09-11 | 2007-07-19 | Matsushita Electric Industrial Co., Ltd. | Image processing device, image processing method, and image processing program |
| US20070188623A1 (en) * | 2003-09-11 | 2007-08-16 | Haruo Yamashita | Visual processing device, visual processing method, visual processing program, intergrated circuit, display device, image-capturing device, and portable information terminal |
| US10168794B2 (en) * | 2013-05-23 | 2019-01-01 | Fastvdo Llc | Motion-assisted visual language for human computer interfaces |
Families Citing this family (1)
| Publication number | Priority date | Publication date | Assignee | Title |
|---|---|---|---|---|
| EP1887783B1 (en) | 2005-06-02 | 2011-10-12 | Konica Minolta Holdings, Inc. | Image processing method and image processing apparatus |
Citations (3)
| Publication number | Priority date | Publication date | Assignee | Title |
|---|---|---|---|---|
| US4302672A (en) * | 1979-02-28 | 1981-11-24 | Fuji Photo Film Co., Ltd. | Image gradation processing method and apparatus for radiation image recording system |
| US4315318A (en) * | 1978-12-26 | 1982-02-09 | Fuji Photo Film Co., Ltd. | Method and apparatus for processing a radiation image |
| US4571635A (en) * | 1984-02-17 | 1986-02-18 | Minnesota Mining And Manufacturing Company | Method of image enhancement by raster scanning |
-
1993
- 1993-04-19 JP JP09127693A patent/JP3196864B2/en not_active Expired - Lifetime
-
1994
- 1994-04-18 US US08/229,217 patent/US5454053A/en not_active Expired - Lifetime
Patent Citations (3)
| Publication number | Priority date | Publication date | Assignee | Title |
|---|---|---|---|---|
| US4315318A (en) * | 1978-12-26 | 1982-02-09 | Fuji Photo Film Co., Ltd. | Method and apparatus for processing a radiation image |
| US4302672A (en) * | 1979-02-28 | 1981-11-24 | Fuji Photo Film Co., Ltd. | Image gradation processing method and apparatus for radiation image recording system |
| US4571635A (en) * | 1984-02-17 | 1986-02-18 | Minnesota Mining And Manufacturing Company | Method of image enhancement by raster scanning |
Non-Patent Citations (2)
| Title |
|---|
| "Journal of Japanese Society of Radiological Technology " vol. 45, No. 8, p. 1030, Aug. 1989. |
| Journal of Japanese Society of Radiological Technology vol. 45, No. 8, p. 1030, Aug. 1989. * |
Cited By (29)
| Publication number | Priority date | Publication date | Assignee | Title |
|---|---|---|---|---|
| US6208766B1 (en) * | 1994-02-09 | 2001-03-27 | Deutsche Aerospace Ag | Process for influencing the quality images furnished by an electronic imaging system |
| US5761333A (en) * | 1995-01-31 | 1998-06-02 | General Electric Company | Contrast enhancement for CT systems |
| US6384939B1 (en) * | 1995-04-28 | 2002-05-07 | Minolta Co., Ltd. | Image processing apparatus and method for adjustment of density of copied image |
| US5991457A (en) * | 1995-09-29 | 1999-11-23 | Fuji Photo Film Co., Ltd. | Multi-resolution transforming, image processing and dynamic range compressing method and apparatus |
| EP0766202A3 (en) * | 1995-09-29 | 1998-01-14 | Fuji Photo Film Co., Ltd. | Image processing method and apparatus |
| EP1156451A3 (en) * | 1995-09-29 | 2002-01-23 | Fuji Photo Film Co., Ltd. | Image processing method and apparatus |
| EP1156451A2 (en) * | 1995-09-29 | 2001-11-21 | Fuji Photo Film Co., Ltd. | Image processing method and apparatus |
| EP0766202A2 (en) * | 1995-09-29 | 1997-04-02 | Fuji Photo Film Co., Ltd. | Image processing method and apparatus |
| US5926578A (en) * | 1995-10-25 | 1999-07-20 | Dainippon Screen Mfg. Co., Ltd. | Image processor having a partial image preprocessor |
| EP0813336A2 (en) * | 1996-06-12 | 1997-12-17 | Fuji Photo Film Co., Ltd. | Image processing method and apparatus |
| EP0813336A3 (en) * | 1996-06-12 | 2004-01-02 | Fuji Photo Film Co., Ltd. | Image processing method and apparatus |
| US6201891B1 (en) * | 1996-06-26 | 2001-03-13 | Matsushita Electric Industrial Co., Ltd. | X-ray imaging apparatus and recording medium therefor |
| US6104503A (en) * | 1996-08-26 | 2000-08-15 | Fuji Photo Film Co., Ltd. | Image processing and reproducing apparatus |
| US5835618A (en) * | 1996-09-27 | 1998-11-10 | Siemens Corporate Research, Inc. | Uniform and non-uniform dynamic range remapping for optimum image display |
| US6330362B1 (en) | 1996-11-12 | 2001-12-11 | Texas Instruments Incorporated | Compression for multi-level screened images |
| DE19722761B4 (en) * | 1997-06-02 | 2006-06-01 | Hell Gravure Systems Gmbh | Process for processing image data |
| DE19722761A1 (en) * | 1997-06-02 | 1998-12-03 | Heidelberger Druckmasch Ag | Process for processing image data |
| US6721441B1 (en) * | 1999-12-30 | 2004-04-13 | General Electric Company | Extended dynamic range system for digital X-ray imaging detectors |
| US20070071318A1 (en) * | 2003-09-11 | 2007-03-29 | Haruo Yamashita | Visual processing device, visual processing method, visual processing program, and semiconductor device |
| US20070109447A1 (en) * | 2003-09-11 | 2007-05-17 | Haruo Yamashita | Visual processing device, visual processing method, visual processing program, and semiconductor device |
| US20070165048A1 (en) * | 2003-09-11 | 2007-07-19 | Matsushita Electric Industrial Co., Ltd. | Image processing device, image processing method, and image processing program |
| US20070188623A1 (en) * | 2003-09-11 | 2007-08-16 | Haruo Yamashita | Visual processing device, visual processing method, visual processing program, intergrated circuit, display device, image-capturing device, and portable information terminal |
| US20080107360A1 (en) * | 2003-09-11 | 2008-05-08 | Haruo Yamashita | Visual processing device, visual processing method, visual processing program, integrated circuit, display device, image-capturing device, and portable information terminal |
| US7783126B2 (en) | 2003-09-11 | 2010-08-24 | Panasonic Corporation | Visual processing device, visual processing method, visual processing program, and semiconductor device |
| US7860339B2 (en) | 2003-09-11 | 2010-12-28 | Panasonic Corporation | Visual processing device, visual processing method, visual processing program, intergrated circuit, display device, image-capturing device, and portable information terminal |
| US7945115B2 (en) | 2003-09-11 | 2011-05-17 | Panasonic Corporation | Visual processing device, visual processing method, visual processing program, and semiconductor device |
| US8165417B2 (en) | 2003-09-11 | 2012-04-24 | Panasonic Corporation | Visual processing device, visual processing method, visual processing program, integrated circuit, display device, image-capturing device, and portable information terminal |
| EP1667065B1 (en) * | 2003-09-11 | 2018-06-06 | Panasonic Intellectual Property Corporation of America | Visual processing apparatus, visual processing method, visual processing program, and semiconductor device |
| US10168794B2 (en) * | 2013-05-23 | 2019-01-01 | Fastvdo Llc | Motion-assisted visual language for human computer interfaces |
Also Published As
| Publication number | Publication date |
|---|---|
| JP3196864B2 (en) | 2001-08-06 |
| JPH06303430A (en) | 1994-10-28 |
Similar Documents
| Publication | Publication Date | Title |
|---|---|---|
| US5454044A (en) | Apparatus for enhancing image data using a monotonously decreasing function | |
| US5454053A (en) | Method for compressing dynamic ranges of images | |
| US5953465A (en) | Interpolation processing method and apparatus for image signals having improved image edge differentiation | |
| US5889894A (en) | Interpolating operation method and apparatus for image signals | |
| US5535289A (en) | Method for reducing noise in energy subtraction images | |
| EP0513749A2 (en) | Processing apparatus for radiographic image signals | |
| US5048105A (en) | Method and apparatus for enlarging or reducing images | |
| EP0313042B1 (en) | Method and apparatus for radiation image processing and x-ray image processing | |
| US5425113A (en) | Method and apparatus for performing various types of image processing in one operation | |
| EP0442468A1 (en) | Method for forming energy substraction images | |
| US5737101A (en) | Interpolating operation method and apparatus for image signals | |
| US5796865A (en) | Gradation correcting method and apparatus | |
| US5291403A (en) | Method of and apparatus for processing radiation image | |
| US5301107A (en) | Method for forming energy subtraction images | |
| US5796870A (en) | Method and apparatus for compressing dynamic ranges of images | |
| US5832142A (en) | Interpolating operation method and apparatus for image signals | |
| JPH06274614A (en) | Image processing method | |
| US5229618A (en) | Radiation image read-out apparatus compensating for image distortion | |
| US5726766A (en) | Interpolating operation method and apparatus for image signals | |
| JP3455566B2 (en) | Dynamic range compression method for radiographic images | |
| US5857037A (en) | Image processing method and apparatus | |
| US5237176A (en) | Method of energy subtraction for radiation image and apparatus for carrying out the method | |
| EP1089226B1 (en) | Image interpolating device and method | |
| JP3241488B2 (en) | Image processing method | |
| JP3165461B2 (en) | Image processing method, image reading method and image reproducing method |
Legal Events
| Date | Code | Title | Description |
|---|---|---|---|
| AS | Assignment |
Owner name: FUJI PHOTO FILM CO., LTD, JAPAN Free format text: ASSIGNMENT OF ASSIGNORS INTEREST;ASSIGNORS:OKUBO, TAKESHI;SHIMURA, KAZUO;REEL/FRAME:006956/0933 Effective date: 19940405 |
|
| STCF | Information on status: patent grant |
Free format text: PATENTED CASE |
|
| FPAY | Fee payment |
Year of fee payment: 4 |
|
| FEPP | Fee payment procedure |
Free format text: PAYOR NUMBER ASSIGNED (ORIGINAL EVENT CODE: ASPN); ENTITY STATUS OF PATENT OWNER: LARGE ENTITY |
|
| FPAY | Fee payment |
Year of fee payment: 8 |
|
| AS | Assignment |
Owner name: FUJIFILM CORPORATION, JAPAN Free format text: ASSIGNMENT OF ASSIGNORS INTEREST;ASSIGNOR:FUJIFILM HOLDINGS CORPORATION (FORMERLY FUJI PHOTO FILM CO., LTD.);REEL/FRAME:018904/0001 Effective date: 20070130 Owner name: FUJIFILM CORPORATION,JAPAN Free format text: ASSIGNMENT OF ASSIGNORS INTEREST;ASSIGNOR:FUJIFILM HOLDINGS CORPORATION (FORMERLY FUJI PHOTO FILM CO., LTD.);REEL/FRAME:018904/0001 Effective date: 20070130 |
|
| FPAY | Fee payment |
Year of fee payment: 12 |