US5644643A - Chute for use with an animal evaluation system - Google Patents
Chute for use with an animal evaluation system Download PDFInfo
- Publication number
- US5644643A US5644643A US08/647,221 US64722196A US5644643A US 5644643 A US5644643 A US 5644643A US 64722196 A US64722196 A US 64722196A US 5644643 A US5644643 A US 5644643A
- Authority
- US
- United States
- Prior art keywords
- animal
- pixel
- image
- chute
- block
- Prior art date
- Legal status (The legal status is an assumption and is not a legal conclusion. Google has not performed a legal analysis and makes no representation as to the accuracy of the status listed.)
- Expired - Lifetime
Links
Images


Classifications
-
- G—PHYSICS
- G06—COMPUTING; CALCULATING OR COUNTING
- G06T—IMAGE DATA PROCESSING OR GENERATION, IN GENERAL
- G06T7/00—Image analysis
- G06T7/60—Analysis of geometric attributes
-
- A—HUMAN NECESSITIES
- A01—AGRICULTURE; FORESTRY; ANIMAL HUSBANDRY; HUNTING; TRAPPING; FISHING
- A01K—ANIMAL HUSBANDRY; CARE OF BIRDS, FISHES, INSECTS; FISHING; REARING OR BREEDING ANIMALS, NOT OTHERWISE PROVIDED FOR; NEW BREEDS OF ANIMALS
- A01K1/00—Housing animals; Equipment therefor
- A01K1/06—Devices for fastening animals, e.g. halters, toggles, neck-bars or chain fastenings
- A01K1/0613—Devices for immobilisation or restraint of animals, e.g. chutes
-
- A—HUMAN NECESSITIES
- A01—AGRICULTURE; FORESTRY; ANIMAL HUSBANDRY; HUNTING; TRAPPING; FISHING
- A01K—ANIMAL HUSBANDRY; CARE OF BIRDS, FISHES, INSECTS; FISHING; REARING OR BREEDING ANIMALS, NOT OTHERWISE PROVIDED FOR; NEW BREEDS OF ANIMALS
- A01K29/00—Other apparatus for animal husbandry
- A01K29/005—Monitoring or measuring activity, e.g. detecting heat or mating
-
- G—PHYSICS
- G06—COMPUTING; CALCULATING OR COUNTING
- G06T—IMAGE DATA PROCESSING OR GENERATION, IN GENERAL
- G06T2207/00—Indexing scheme for image analysis or image enhancement
- G06T2207/10—Image acquisition modality
- G06T2207/10004—Still image; Photographic image
- G06T2207/10012—Stereo images
-
- G—PHYSICS
- G06—COMPUTING; CALCULATING OR COUNTING
- G06T—IMAGE DATA PROCESSING OR GENERATION, IN GENERAL
- G06T2207/00—Indexing scheme for image analysis or image enhancement
- G06T2207/30—Subject of image; Context of image processing
- G06T2207/30108—Industrial image inspection
Definitions
- the present invention relates generally to a system for evaluating the economic potential of selected animals and, more particularly, to an animal evaluation system that permits an animal being evaluated to move during evaluation rather than being relatively immobilized.
- those concerned with animal husbandry such as farmers, ranchers and the like, have attempted to evaluate the physical characteristics of animals, such as beef cattle, in order to monitor growth and to select those animals with economically favorable traits.
- Such traits include, among others, the animal's ability to produce meat, milk and other products of a certain type and quality, the animal's ability to convert feed into viable carcass yield, i.e. production efficiency, and the animal's ability to reproduce.
- Hormones are chemical messengers produced by endocrine glands providing secretions directly into the bloodstream which are transported to other parts of the body where they exert a direct effect on peripheral tissues or either stimulate or inhibit other organs or glands. These hormones regulate such important internal processes as growth, muscle development, age of maturity, levels of metabolism, fertility and pregnancy.
- the combination of growth hormones and male sex hormones provide for development and enlargement of the muscle systems in the "fore quarters" or “shoulder” area while the combination of growth hormones and female sex hormones (estrogen) provide for the development and enlargement in the muscle system in the "rear quarters” or more commonly referred to as "stifle” area.
- hormones affect much of an animal's general physical characteristics and so contribute significantly to the animal's economic value. Consequently, research has been conducted to determine, isolate and identify specific hormones appearing in, and the levels of such hormones within, an animal's bloodstreams at particular times and their corresponding bodily effects. This research, however, remains largely incomplete due in part to difficulties in isolating the concentrations and specific types of hormones in an animal's bloodstreams and, given the complex interdependent nature of hormones, difficulties in correlating such presence and quantities with corresponding effects upon present body composition or upon future body composition or both with respect to carcass yield and the animal's ability to reproduce.
- an animal is relatively immobilized by the confines of a chute, not much larger than the animal, in front of a first video camera for recording one side of the animal, and below a second video camera for recording the top side of the animal.
- Specific skeletal reference points such as the hook corner of the pelvic bone, the thurl joint which is where the femur bone and the pelvic bone connect, the outermost portion of the stifle and the point of the shoulder are then located by a technician and identified on the animal with reference markers placed on the animal at those locations.
- the front camera is then activated to record the side profile of the animal and, once this side profile has been recorded, the top camera is activated to record the top profile.
- a computer analyzes the video images to provide linear and angular measurements between the reference points for comparison with other animals of similar kind.
- the present invention provides an arrangement to evaluate animals to determine characteristics or traits thereof.
- the animal is evaluated in the arrangement as it moves through first and second scenes that correspond to different first and second fields of view.
- a first scene evaluation image representation of an image of the first scene is acquired at a selected time and a second scene evaluation image representation of an image of the second scene is acquired at substantially the same selected time.
- Each scene evaluation image representation includes portions that correspond to an animal image portion and a remainder image portion which is defined by excluding the respective animal image portion. Contrasting backgrounds can be provided in these scenes that contrast with the visual appearance of the animal such as by being of a different color or a different pattern, and these backgrounds may be provided in a chute that guides the direction of forward movement of animals through the first and second scenes.
- first and second evaluation image segregation representations After acquiring the first and second scene evaluation image representations, corresponding first and second evaluation image segregation representations are constructed.
- the first and second evaluation image segregation representations segregate portions that correspond to at least a part of the first and second scene image animal image portions from portions that correspond to the first and second scene image remainder image portions. This segregation may be accomplished by finding a border portion therebetween serving to segregate these portions.
- a border portion can be located by sensing differences in the representations of the animal portions and the background portions represented therein such as due to color differences between the two or to pattern differences between the two. If the background pattern is periodic, spectral decomposition of these portions will provide substantial transform value differences therebetween which can be detected to locate a border portion therebetween.
- a plurality of selected parameters are ascertained. The plurality of selected parameters form selected animal indicia that are used to evaluate the animal.
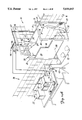
- FIG. 1A illustrates pictorially an animal evaluation system embodying the present invention
- FIG. 1B illustrates pictorially an alternative animal evaluation system embodying the present invention
- FIG. 1C shows in block diagram form a portion of the animal evaluation system of the present invention shown in FIG. 1A;
- FIG. 1D shows in block diagram form a portion of the animal evaluation system of the present invention shown in FIG. 1B;
- FIGS. 1E and 1F illustrate reconstructed scene image portions acquired by the animal evaluation system of FIGS. 1B and 1D in first and second scene settings, respectively;
- FIGS. 2A through 2E illustrate various reconstructed scene image portions acquired by, and in some instances manipulated with, the animal evaluation system of FIGS. 1A and 1C in a first scene setting;
- FIGS. 3A through 3I illustrate various reconstructed scene image portions acquired by, and in some instances manipulated with, the animal evaluation system of FIGS. 1A and 1C in a second scene setting;
- FIGS. 4A through 4K, 5A and 5B together show the evaluation process for a subject animal using the animal evaluation system of FIGS. 1A and 1C;
- FIGS. 6A through 6G together show the evaluation process for a subject animal using the animal evaluation system of FIGS. 1B and 1D.
- the animal evaluation system of the present invention is illustrated in FIG. 1A generally as, 10.
- the animal evaluation system 10 includes a chute, 12, with a relatively narrow passageway, 16, for continuing the path of an animal to be evaluated, 14, such as a cow or a steer, to pass within the field of view of an image recording apparatus.
- the image recording apparatus includes two video cameras, 18, and, 20, placed adjacent chute 12 and pointed to capture light from two different scenes therein along two corresponding lines of sight essentially perpendicular to one another, a side view scene and a top view scene.
- Cameras 18 and 20 are operated to acquire, at a selected moment, contemporaneous or substantially simultaneous profile scene image representations of portions of animal 14 along these two essentially perpendicular lines of sight to provide corresponding video data to a processing and analysis station, generally designated, 22, as animal 14 walks through passageway 16 in chute 12.
- Processing and analysis station 22 receives the video data in each frame, or sampling period, for the two contemporaneously taken profile scene image representations, one image scene each from image video cameras 18 and 20, and determines accurately therefrom selected physical outline measurements or parameters of animal 14 that are used to form selected animal indica that in turn are used to establish and predict, specific characteristics of animal 14.
- Chute 12 comprises a rectangular support frame, 24, having four vertical support columns, 26.
- a rear side wall, 32, and a front side wall, 34 are attached to the vertical support columns 26 to define an entrance location, 28, and an exit location, 30.
- Lateral frame support members, 36, and, 38, located at the upper and lower ends, respectively, of vertical support columns 26 at both the entrance location 28 and the exit location 30, provide lateral support to chute 12 and separate rear side wall 32 from front side wall 34 by an appropriate distance such that the longitudinal extent of animal 14 is oriented generally parallel with the longitudinal extent of passageway 16 when therein.
- Cameras 18 and 20 are placed adjacent chute 12 such that portions of animal 14 are within the field of view of cameras 18 and 20 simultaneously.
- FIG. 1B An alternative chute arrangement, 12', is shown in FIG. 1B involving double chutes, a scanning chute, 12", and a weighing chute, 12'".
- Scanning chute 12" comprises a rectangular support frame, 24', having six vertical support columns, 26'.
- a rear side wall, 32' having an upper right portion thereof presenting a horizontal facing optical background pattern, 33, of about two feet in height and four feet in length, and a from side wall, 34', are attached to the vertical support columns 26' to define an entrance location, 28', controlled by an entrance "barrel" gate, 28", and an exit location, 30', which is also the entrance location for weighing chute 12'".
- Horizontal facing optical background pattern 33 extends between the right two support columns 26' supporting rear wall 32'.
- Lateral and parallel upper frame support members, 36' located at the upper ends of vertical support columns 26' at and between both entrance location 28' and exit location 30', and floor member, 38', provide lateral support to scanning chute 12" and aid in maintaining the separation forming a relatively narrow passageway, 16', between rear side wall 32' and front side wall 34' by an appropriate distance such that the longitudinal extent of an animal (not shown) is oriented generally parallel with the longitudinal extent of passageway 16' when therein.
- the appropriate separation distance in the instance of scanning chute 12" is increased over that of chute 12 of FIG. 1A by the widths of two downwardly and inwardly slanted, substantially vertically facing, optical background pattern shelves, 35, located about 18 in. above floor 38'.
- Shelves 35 are each just under a foot in width in extending the length of scanning chute 12" (about eight feet), and each slants inwardly and downwardly by about 25°.
- Horizontal facing optical background pattern 33 and the pattern on substantially vertical facing optical background pattern shelves 35 are chosen to be relatively large feature spatial patterns, surface texture patterns, colors, or the like, which will always contrast with any animal expected to be scanned and measured which, for cattle, may typically be either a black color, an off-white color, a brown color, a reddish brown color, or some combination thereof on a spotted animal.
- alternating white and black lines extending in the direction of scanning chute 12" i.e. horizontal lines, have been used. These have been provided by a sheet of white polyvinylchloride in which grooves of one-half in. width are made separated by one-half in. spacings therebetween.
- Cameras 18 and 20 are placed adjacent scanning chute 12" with again two different lines of sight such that portions of an animal and portions of horizontal facing optical background pattern 33 are within the field of view of camera 18 simultaneously with portions of that animal and portions of substantially vertically facing optical background pattern shelves 35 being within the field of view of camera 20.
- the slanting of shelves 35 also counters to some extent the placement of camera 20 over the center of scanning chute passageway 16' rather than directly over the shelves.
- cameras 18 and 20 are operated to acquire, at a selected moment, contemporaneous or substantially simultaneous profile scene image representations of portions of animal 14 along these two essentially perpendicular lines of sight to provide corresponding video data to an alternative processing and analysis station, generally designated, 22', as the animal walks through passageway 16' in scanning chute 12".
- Processing and analysis station 22' again receives the video data in each frame, or sampling period, for the two contemporaneously taken profile scene image representations, one image scene each from image video cameras 18 and 20, and determines accurately therefrom selected physical outline measurements or parameters of animals in such image scenes that are used to form selected animal indica that in turn are used to establish, and predict, specific characteristics of animal 14.
- Weighing chute 12' is also formed by a rectangular support frame, 24", having six vertical support columns, 26" and both a rear side wall, 32", and a front side wall, 34", attached to the vertical support columns 26' to define common scanning chute exit, and weighing chute entrance, location 30'. These walls also define a weighing chute exit location, 31, controlled by an exit "barrel" gate, 31".
- Floor member 38" is arranged with a pair of load bar scale sensors, 39, for weighing an animal while in weighing chute 12'” to provide an electronic output signal to a scale controller and display arrangement, 39', which provides a digital output signal indicating the weight measured.
- Cameras 18 and 20 are video cameras of conventional design each having, as its image acquisition element, a charge coupled (CCD) device.
- CCD charge coupled
- Such charge coupled devices herein also referred to individually as a "CCD”
- CCD comprise a plurality of light sensors arrayed in a matrix or grid pattern. The average intensity of light impinging upon each light sensor over a sampling period is converted to a representative analog electric signal, a succession of which forms the video data to be provided to processing and analysis stations 22 or 22'.
- processing and analysis station 22 includes a computer means, 40, having an image video data receiving and storage system, such as a "frame grabber", or image capture, card, 41, of conventional design that receives the analog video data signals for a sampling period and converts these analog electric signals to corresponding digital binary data upon an appropriate command from a control unit and data processing means, 43.
- the digital video data representing the contemporaneous scene images acquired from cameras 18 and 20 are stored in random access memory (RAM) located on the image capture card 41 with the binary value of each byte (8 bits) in RAM representing the average intensity of light that impinged upon the corresponding light sensitive sensor of the CCD during the selected sampling period.
- RAM random access memory
- Data processing means 43 digitally processing the scene image representation video data of the stored scene images in image capture card 41, segregates portions thereof corresponding to at least part of the first and second scene image animal image portions from other portions thereof corresponding to those portions not including the animal image portions. From these segregated scene image representations, data processing means 43 ascertains values of a plurality of selected parameters that in turn are used to form selected animal indicia. The selected animal indicia are used to estimate a value for a selected animal trait or characteristic.
- a conventional keyboard, 76 is connected to computer means 40 to provide for operator control.
- FIG. 1D shows an alternative processing and analysis station 22' block diagram which is shown to have components similar to those of system 22 except for the addition of scale sensors 39 and the connection thereof through controller and display arrangement 39' to computer 40 at processing means 43.
- processing means 43 is configured similarly for each of stations 22 and 22', the software differs somewhat in each since different digital image processing techniques are used in the computers for each station to segregate the scene image portions.
- the stored scene image representations are used as the display basis for a pair of video monitors or displays, 42 and 44, to reconstruct the corresponding scene images thereon at each of stations 22 and 22'.
- the reconstructed scene images approximate the original scene images, which correspond to the original scenes, through a grid or matrix pattern of picture elements, commonly referred to as "pixels", arranged in columns and rows in correspondence with the light sensitive elements on the corresponding CCD.
- Reconstructed scene images for the arrangement of scanning chute 12" and station 22' are illustrated in FIG. 1E based on a scene image captured by camera 18, and in FIG. 1F based on a scene image captured by camera 20.
- Each pixel in either of these two scene images is referenced as a coordinate pair (X,Y) with the first number, X, in FIG.
- 1E for instance, representing the number of pixels in a row, or succession of pixel columns, from a left border edge, 45, of the reconstructed scene of that figure while the second number, Y, in each coordinate pair represents the number of pixels in a column, or succession of pixel rows, from an upper border edge, 48, of that reconstructed scene.
- the intersection of these two borders in the upper left corner, 50, of this pixel matrix has coordinates (0,0), and the diagonally opposite, or lower right corner, 52, has coordinates (X MAX , Y MAX ) wherein X MAX equals the total number of columns in the reconstructed scene image displayed, and Y MAX equals the total number of rows in the reconstructed scene image displayed.
- Typical values are pixel counts of 512 and 480 for the sides of the pixel array representing a scene image occurring on the CCD of one of cameras 18 or 20 to thus provide 245,760 pixels for that image each having 256 possible gray levels.
- each pixel is again referenced as a coordinate pair (X,Y) with the first number, X, representing the number of pixels in a row, or succession of pixel columns, from left border edge 45, while the second number, Y, in each coordinate pair represents the number of pixels in a column, or succession of pixel rows, from upper border edge 48.
- camera 18 is placed on a suitable support means, such as a tripod device, 53, with the camera having its longitudinal axis aligned perpendicularly to an opening, 56, provided in front side wall 34.
- a suitable support means such as a tripod device, 53', with the camera having its longitudinal axis aligned perpendicularly to opening 56 provided in front side wall 34'.
- camera 18 is able to acquire a scene image representation of at least that portion of a side profile of an animal appearing to it in opening 56.
- the scene image acquired by camera 18 during a sampling period in which animal 14 is properly positioned in passageway 16' in scanning chute 12", or in passageway 16 in chute 12, comprises the upper rear portion of the animal's hind quarter, 58, the image of which is projected on the lens of camera 18 through opening 56 as illustrated in the reconstructed scene images of FIGS. 1E or 2A.
- Camera 20 is located above passageway 16' in scanning chute 12" on a support member, 60, either secured to rear side wall 32' or on a free standing tripod device similar to that of tripod 53' or, in the alternative arrangement, above passageway 16 in chute 12 on support member 60 either secured to rear side wall 32 or on a free standing tripod device similar to that of tripod 53.
- the axis of camera 20 is aligned perpendicular to the floor of chute 12' and over the centerline of passageway 16', or aligned perpendicular to the floor of chute 12 and over the centerline of passageway 16.
- Camera 20 acquires a scene image of at least a portion of the back, 64, of animal 14 as illustrated in the reconstructed images of FIGS. 1F or 3A.
- Back or top profile portion 64 extends from a point, 66, forward of the animal's shoulders, 68, rearward to include the animal's rearmost point, 70.
- Suitable lighting means are provided to assure enough light is reflected to cameras 18 and 20 such as portable lights, 72, illustrated pictorially in FIG. 1B, and in FIG. 1A, together with lighting means, 74, not shown in these two figures, but which is shown schematically in FIG. 1F and in FIGS. 3A through 3I, along with lighting means 72, as ovals indicating areas of higher light intensity.
- Lights 74 illuminate animal 14 and either scanning chute 12", along opposite sides of passageway 16', or chute 12 along opposite sides of passageway 16.
- evaluation system 10 All components of evaluation system 10 are portable allowing the evaluation system to be set up in any convenient location. As illustrated in FIG. 1A for chute 12, the chute is typically positioned in a gateway, 77, between two animal collection pens, 76 and 78. Pens 76 and 78 may reside indoors, such as in a barn, or outdoors, such as in a field or stockyard. Power is supplied to evaluation system 10 from either conventional 110 volt line current or alternatively from a generator, not shown.
- animal position detection means 84 includes an ultrasonic transducer, 86, attached to a support member, 88, that in turn is secured perpendicularly to support member 60 to parallel passageway 16.
- Ultrasonic transducer 86 is positioned above passageway 16 such that when the desired portions of the body of animal 14 are simultaneously within the fields of view of camera 18 and camera 20, an output signal is provided therefrom to data processing means 43 in computer 40 as illustrated in FIG. 1C. That signal, in turn, initiates image capture card 41 to direct the contemporaneous capture and storage of the video data provided by video cameras 18 and 20 in the current sampling periods of each scene corresponding to the two profile scene images falling on the lens of those cameras.
- ultrasonic transducer 86 is positioned near exit location 30 such that when the head of animal 14 is detected, the animal's rear quarter 58 is located adjacent opening 56 and in front of camera 18 as illustrated in the reconstructed scene image of FIG. 2A, while main body 64 of animal 14, as illustrated in the reconstructed scene image of FIG. 3A, is located opposite camera 20.
- Storing the video data from the two contemporaneous or substantially simultaneous scene image representations taken of the scenes along the two different lines of sight permits accurate physical measurements of animal 14 while that animal moves through chute 12 from pen 76 to pen 78 without the need for mobilizing animal 14 within chute 12.
- animal position detection means 84 includes a photocell arrangement, 86', attached to the scanning chute side walls, the light transmitter to rear side wall 34' and the light receiver to front side wall 32' with a cable connecting it to computer 40.
- Photocell arrangement 86' is positioned to transmit a beam of light from transmitter to receiver across passageway 16' such that when the desired portions of the body of an animal to be measured are simultaneously within the fields of view of camera 18 and camera 20, an output signal is provided therefrom to data processing means 43 in computer 40 as illustrated in FIG. 1D. That signal, in turn, initiates image capture card 41 to direct the contemporaneous capture and storage of the video data provided by video cameras 18 and 20 in the current sampling periods of each scene corresponding to the two profile scene images falling on the lens of those cameras.
- photocell transducer arrangement 86' is positioned near common scanning chute exit, and weighing chute entrance, location 30' such that when the front legs of an animal are detected by interrupting the photocell light beam, the animal's rear quarter 58 is located adjacent opening 56 and in front of camera 18 as illustrated in the reconstructed scene image of FIG. 1E, while main body 64 of animal 14, as illustrated in the reconstructed scene image of FIG. 1F, is located opposite camera 20.
- Storing the video data from the two contemporaneous or substantially simultaneous scene image representations taken of the scenes along the two different lines of sight permits accurate physical measurements of animal 14 while that animal moves through chute 12' without the need for immobilizing animal 14 within chute 12'.
- various height and width measurements of animal 14 can be obtained from the contemporaneous scene image representations made as that animal moves through either of chute 12 and 12' or changes position therewithin.
- individual muscles of muscle groups are either extended or contracted in a corresponding sequence necessary to accomplish such movement.
- the flexion and extension of these individual muscles causes corresponding interdependent changes in longitudinal and lateral profile dimensions thereof, and so in any measurements contemporaneously taken of that muscle group. That is, the animal's hips and shoulders flex, its legs are first together and then apart, and the animal's back as a result moves up and down.
- animal passage through chute 12 should not be at a rate greater than that of a walk. This is so because as the animal walks the weight of the animal is distributed on three of its legs in a succession of any one of four combinations. When the animal increases its rate to that of a canter, the weight of the animal alternates between distribution upon two legs to distribution on three legs which may result in less accurate measurement data. Even then, the animal may be moving at a rate up to 20 feet a second so that an accuracy of measure of one inch would require that successive scene images be completely captured within four milliseconds of one another. Since typical camera scan times over the scene on the CCD are from 17 to 33 milliseconds in duration, waiting for a completed image capture on one of cameras 18 and 20 before beginning capture on the other would not come close to providing such accuracy.
- evaluation system 10 of FIG. 1A follows the steps shown in a procedure, 100, of FIGS. 4A through 4K, 5A and 5B.
- a block, 102 labeled "START" indicates the beginning of procedure 100 and represents activation of evaluation system 10 by an operator wherein appropriate power is supplied to cameras 18 and 20, lights 72 and 74 (if required), ultrasonic transducer 86 and processing and analysis station 22.
- computer means 40 generates an appropriate message on, for example, monitor 42 to instruct the operator to align the cameras. Procedural flow then continues to blocks 106 and 110.
- Block 106 represents the step of aligning the cameras.
- Camera 18 is aligned having its axis essentially perpendicular to opening 56 to provide a reconstructed scene image on monitor 42 that corresponds to the scene image falling on the lens of camera 18 that substantially encompasses opening 56 of chute 12 as illustrated in the reconstructed image of FIG. 2B.
- a horizontal line, 101 is then superimposed upon this reconstructed image and camera 18 is further adjusted such that horizontal line 101 is positioned substantially parallel to a predetermined image representation of a horizontal edge, 103, of chute 12.
- Camera 20 is aligned in a similar manner. Camera 20 is aligned having its axis essentially perpendicular to the open top through of chute 12 to provide a reconstructed scene image on monitor 44 that corresponds to the scene image falling on the lens of camera 20 that encompasses that portion of chute 12 as illustrated in the reconstructed image of FIG. 3B. A vertical line, 104, is then superimposed upon this reconstructed image and camera 20 is further adjusted such that vertical line 104 is positioned substantially parallel to a predetermined image representation of an edge, 107, of chute 12.
- offset distances are entered or stored in data processing means 43 as represented by a block, 110.
- These offset distances include the horizontal offset distance in inches between the lens of camera 18 and the center longitudinal vertical plane of chute 12, represented herein as "HOD1"; the vertical offset distance in inches from a point in passageway 16 above the floor of chute 12 that corresponds to a pixel or group of pixels on the reconstructed scene image of FIG. 2A essentially on a vertical centerline, 99, thereof, represented herein as "VOD1"; and the vertical offset distance between the lens of camera 20 perpendicular to the centerline of chute 12 in inches, represented herein as "VOD2".
- system parameters include the focal length of camera 18 in millimeters, represented herein as "FL1”; the focal length of camera 20 in millimeters, represented herein as “FL2”; the ratio of a succession of vertical pixels on monitor 42 to a corresponding succession of light sensitive elements arrayed in a portion of the CCD of camera 18, represented herein as "VPR1"; the ratio of a succession of horizontal pixels on monitor 42 to a corresponding succession of light sensitive elements arrayed in a portion of the CCD of camera 18, represented herein as "HPR1”; the ratio of a succession of vertical pixels on monitor 44 to a corresponding succession of light sensitive elements arrayed in a portion of the CCD of camera 20, represented herein as "VPR2”; the ratio of a succession of horizontal pixels on monitor 44 to a corresponding succession of light sensitive elements arrayed in a portion of the CCD of camera 20, represented herein as "HPR2";
- the operator directs the first animal 14 through chute 12 as represented by a block, 112, in FIG. 4A.
- a decision diamond, 114 represents the step of detecting presence of animal 14 within the chute 12.
- ultrasonic transducer 86 detects the presence of animal 14 and provides an output signal that initiates image capture card 41 to direct the contemporaneous capture and storage of the video data provided by cameras 18 and 20 in the current sampling periods of each scene corresponding to the profile scene images falling on the lens of those cameras.
- a block, 118 represents the step of capturing the substantially simultaneous image representation profiles wherein the image capture card 41 of computer means 40 of FIG. 1, captures, during a selected sampling period, a side image representation corresponding to the scene falling upon the lens of camera 18 which is similar to that of the reconstructed image of FIG.
- the image capture card then captures a top image representation corresponding to the scene falling upon the lens of camera 20 which is similar to that of the reconstructed image of FIG. 3A.
- the binary data corresponding to this top image representation is also stored in RAM.
- a decision diamond, 122 then represents animal departure from chute 12 as monitored by the ultrasonic transducer 86.
- the output signal from ultrasonic transducer 86 signifies that animal 14 has departed from chute 12
- procedural flow continues to a block, 126.
- Block 126 represents the step of capturing the substantially simultaneous image representation profiles wherein the image capture card 41 of computer means 40 of FIG. 1, captures, during a selected sampling period, a second side image representation corresponding to the scene falling upon the lens of camera 18 which is similar to that of the reconstructed image of FIG.
- the image capture card then captures a second top image representation corresponding to the scene falling upon the lens of camera 20 which is similar to that of the reconstructed image of FIG. 3B, but without vertical line 105.
- the binary data corresponding to this second top image representation is also stored in RAM.
- a block, 128, then represents the step of constructing from the first side image representation, a first side image segregation representation that segregates portions of the first side image representation into a portion that corresponds to at least a part of the image of the animal's hind quarter 56 as illustrated in the reconstructed image of FIG. 2A from portions that correspond to a side image remainder portion that does not include that image part of the animal's hind quarter 56.
- the step of constructing includes comparing the value (gray level) stored within each corresponding byte for each pixel of the first side image representation with the corresponding value stored within each corresponding byte for each corresponding pixel of the second side image representation.
- the corresponding pixel of the first side image representation is determined to be part of the remainder portion and assigned a gray level value corresponding to white in the side image segregation representation. If, however, the gray levels of a given pixel are substantially different, as determined by a resultant value exceeding the predetermined possible range of values, the corresponding pixel is considered part of the animal portion and assigned a gray level value corresponding to black in the side image segregation representation.
- the gray level value stored within each corresponding byte for each pixel of the first side image representation can be compared to a preselected threshold value. Under this processing operation, if the gray level value of that corresponding pixel is greater than or equal to the threshold value, the corresponding pixel of the first side image representation is determined to be part of the remainder portion and assigned a gray level value corresponding to white in the side image segregation representation.
- the corresponding pixel is considered part of the animal portion and assigned a gray level value corresponding to black in the side image segregation representation.
- chute rear side wall 32, possibly front side wall 34, and the floor of chute 12 (or, more likely, installed spaced apart shelves above the floor like shelves 35 in FIG. 1B) in FIG. 1A are provided in a color that will always contrast well with the expected range of colors of animal 14.
- the animals to be measured including animal 14 are to be cattle, an appropriate color for the chute rear wall and shelves would be green.
- isolation box 131 is also used by processing and analysis station 22 in successive runs of animals through the chute 12 thereby eliminating further operator interaction with successive segregated side image representations. As such, isolation box 131 is made sufficiently large to encompass minor variations between animals of successive runs.
- FIGS. 2C through 2E illustrate a portion of the resultant binary, black, (illustrated with hatching), or white, segregated image representation contained within isolation box 131 superimposed upon the background or second image representation of FIG. 2B but excluding the horizontal line 101.
- These Figures are provided as illustrative aids in describing the location of selected points and calculation therefrom of selected parameters from the segregated representation data that corresponds to the animal image portion. Reconstruction of these images after defining isolation box 131 is not necessary given that selected parameters are based on the corresponding stored segregated representation data.
- isolation box 131 has X ISO1 columns and Y ISO1 rows wherein an upper left corner, 135, has pixel coordinates (1, 1) and a lower right corner, 137, has pixel coordinates (X ISO1 ,Y ISO1 ).
- Isolation box 131 is used by data processing means 43 according to the steps described below to locate selected portions of the corresponding animal image portion to determine selected parameters.
- a counter labeled "column” is initialized with the corresponding value of the right most column, X ISO1 , of isolation box 131.
- a one dimensional search array is then loaded with the gray level values of each pixel contained within the column designated by the column counter as represented by a block, 136.
- a counter labeled "row” is then initialized at a value of one as represented by a block, 138, and the corresponding element value indexed by the row counter in the search array which also corresponds to the pixel having as coordinates (column, row) is examined for a gray level equal to zero which denotes the occurrence of a black pixel.
- a decision diamond, 140 represents examination of the pixel and if this pixel is not black, the row counter value is incremented by one as represented by a block, 142, in FIG. 4D.
- the row counter value does not exceed Y ISO1 , the row corresponding to a lower edge, 139, of the isolation box 131 shown in FIG. 2C, as represented by a decision diamond, 144, procedural control is returned to block 140 with continued searching progression through the one dimensional array corresponding to the current column of pixels.
- the column counter value is then decremented by one as represented by a block, 146. If the column counter obtains a value less than one, indicating that the first column or a left border edge, 145, of isolation box 131 shown in FIG. 2C has been searched and that isolation box 131 has been completely examined without a determination of the "tail point", as represented by a decision diamond 148, the search procedure would then be halted at a block, 150, labeled "STOP", and an appropriate warning or indication would be initiated by processing and analysis station 22. In the event the column counter value is not less than one or beyond left border edge 145 of isolation box 131, control is returned to block 138 wherein the row counter is reinitiated to a value of one.
- a side window, 151 is defined from a portion of isolation box 131.
- a block, 160, in FIG. 4D represents the creation of the side window 151 from isolation box 131.
- the side window 151 comprises a pixel matrix having Y ISO1 rows and X 1 columns wherein an upper left corner, 159, has coordinates (X SW1 , 1) and a lower right corner, 149, has coordinates (X SW2 , Y ISO1 ) and wherein X 1 equals the number of successive columns or pixels between X SW1 , a left border edge, 153, and X SW2 , a right border edge, 155, to be determined below.
- Side window 151 has upper and lower border edges, 141, and 139 respectively, equal to that of isolation box 131.
- Left border edge 153 and right border edge 155 extend forwardly on animal 14 from the rear tail point 147, 24 inches and 12 inches, respectively.
- the location and dimension of side window 151 have been determined from prior research which has indicated the location of the highest rear point of the animal relative to the tail point 147.
- Left border edge 153 and right border edge 155 each are determined from the following equation:
- A represents the number of successive pixels on the segregated side image representation to be subtracted from the column coordinate of the stored tail point 147 to determine the corresponding value of X SW1 and X SW2 ;
- B represents the actual length in inches to be converted, i.e. 12 or 24 inches; and FL1, HLR1, HPR1 and HOD1 represent system parameters described above.
- the quantity (B*FL1/HOD1) represents the distance in millimeters on the CCD of camera 18 that is proportional to distance B while HLR1 and HRP1 are system parameters needed to convert that proportional distance to a succession of pixels.
- a block, 162 represents initialization of a counter labeled "column” with the right most column X SW2 of side window 151 and a variable labeled "highest row” at Y ISO1 , the lower border edge 139.
- a one dimensional search array is then loaded with the gray level values of each pixel contained within the column designated by the column counter value, as represented by a block, 164.
- a counter labeled "row” is then initialized at a value of one as represented by a block, 166, and the corresponding element value indexed by the row counter in the search array which also corresponds to the pixel having as coordinates (column, row) is examined for a gray level value equal to zero which denotes the occurrence of a black pixel.
- a decision diamond, 167 represents examination of the pixel and if this pixel is not black, the row counter value is incremented by one as represented by a block, 168.
- the column counter value is decremented by one as represented by a block, 172. If the column counter value does not obtain a value less than X SW1 , representing left border edge 153, as represented by a decision diamond, 174, procedural control is returned to block 164 where the search array is then loaded with the gray level values of the next column to be searched.
- the step of detecting a black pixel within a given column is represented by decision diamond 167.
- the corresponding row coordinate for that pixel is compared with the value stored in the variable highest row. If the row counter value is less than the value stored in the highest row variable, signifying that the present black pixel is higher than any previous black pixel so far encountered, as represented by a decision diamond, 180, the coordinates (column, row) for the current pixel are stored in memory wherein the row counter value is also stored as the highest row variable, as represented by a block, 182.
- the column counter value is then again decremented by one in block 172 with its value compared to X SW1 , representing the left border edge 153, in decision diamond 174.
- Block 186 represents calculation of the "rump height” and "tail-rump height” distances of animal 14.
- the rump height distance herein also referred as "RH” is the distance in inches of the rump height point 157 of the animal from the ground and is determined from the following equation:
- VOD1 represents the vertical offset distance described above which also corresponds to the center row 99 illustrated in FIG. 2B
- C represents the length in inches between VOD1 and the actual rump height of the animal
- D represents the number of successive vertical pixels on the segregated side image representation between the center row of pixels and the row coordinate of the stored rump height point 157, D being positive if the row coordinate of the stored rump height point is above the center row 99 of pixels illustrated in FIG. 2B and negative if the row coordinate of the stored rump height point 157 is below the center row 99 of pixels.
- VPR1, VLR1, FL1 and HOD1 represent system parameters described above.
- the quantity (D/VLR1/VPR1) represents the distance in millimeters on the CCD of camera 18 that is proportional to the succession of pixels denoted by D while the quantity (HOD1/FL1) is used to convert that proportional distance to a corresponding distance in inches.
- the tail-rump height distance is the corresponding horizontal distance in inches between the column coordinate of the tail point 147 and the column coordinate of the rump height point 157 on the segregated side image representation and is determined from the following equation:
- E represents the number of successive horizontal pixels on the segregated side image representation between the column coordinate of the tail point 147 and the column coordinate of the rump height point 157.
- HPR1, HLR1, FL1 and HOD1 represent system parameters described above.
- the quantity (E/HLR1/HPR1) represents the distance in millimeters on the CCD of camera 18 that is proportional to the succession of pixels denoted by E while the quantity (HOD1/FL1) is used to convert that proportional distance to a corresponding distance in inches.
- Block 188 represents the step of constructing from the first top image representation, a top image segregation representation that segregates portions of the first top image representation into a portion that corresponds to at least a part of the image of the animal's main body 64 illustrated in the reconstructed image of FIG. 3A from portions that correspond to a top image remainder portion that does not include that image part of the animal's main body 64.
- the step of constructing includes comparing the gray level value stored within each corresponding byte for each pixel of the first top image representation with the corresponding value stored within each corresponding byte for each corresponding pixel of the second top image representation.
- the corresponding pixel of the first top image representation is determined to be part of the remainder portion and assigned a gray level value corresponding to white in the top image segregation representation. If, however, the gray level values of a given pixel are substantially different, as determined by a resultant value exceeding the predetermined range of possible values, the corresponding pixel is considered to be part of animal portion 14 and assigned a gray level value corresponding to black in the top image segregation representation.
- isolation box 181 illustrated in reconstructed image of FIG. 3C, to isolate the top portion 64 of the animal.
- isolation box 131 of FIG. 2C utilization of isolation box 181 increases the efficiency of system 10 by reducing the computational operations necessary to obtain physical measurements of animal 14 in that all further processing upon the segregated top image representations is confined within isolation box 181.
- Isolation box 181 is also used by the processing and analysis station 22 in successive runs of animals through the chute 12 thereby eliminating further operator interaction with successive top image representations. As such, isolation box 181 is made sufficiently large to encompass minor variations between animals of successive runs.
- FIGS. 3C through 3I illustrate the resultant binary, black (illustrated with hatching) or white, segregated image representation contained within isolation box 181 superimposed upon the background or second top image representation of FIG. 3B but excluding the vertical line 105.
- These Figures are provided as illustrative aids in describing the location of selected points and calculation therefrom of selected parameters from the segregated representation data that corresponds to the animal image portion. Reconstruction of these images after defining isolation box 181 is not necessary given that selected parameters are based on the corresponding stored segregated representation data.
- isolation box 181 has X ISO2 columns and Y ISO2 rows wherein an upper left corner, 185, has pixel coordinates (1, 1) and a lower right corner, 187, has pixel coordinates (X ISO2 Y ISO2 ).
- Isolation box 181 is used by data processing means 43 according to the steps described below to locate selected portions of the corresponding animal image portion to determine selected parameters.
- a counter labeled "column” is initialized with a value of one and a variable "highest row” is initialized with a value of Y ISO2 , a row value corresponding to a lower border edge, 189, of isolation box 181.
- a one-dimensional search array is then loaded with the gray level values of each pixel contained within the column designated by the column counter value as represented by a block, 196.
- a counter labeled "row” is then initialized at a value of one as represented by a block, 198, and the corresponding element value indexed by the row counter in the search array which also corresponds to the pixel having as coordinates (column, row) is examined for a gray level equal to zero which denotes the occurrence of a black pixel.
- a decision diamond, 200 represents examination of the pixel and if this pixel is not black, the row counter value is incremented by one as represented by a block, 202.
- the row counter value does not exceed Y ISO2
- the lower border edge 189 as represented by a decision diamond, 204
- procedural control is returned to block 200 with continued searching through the one dimensional array that corresponds to the current column of pixels.
- the column counter value is then incremented by one as represented by a block, 206. If the column counter does not obtain a value greater than a right border edge, 191, as determined from a value not exceeding X ISO2 , and as represented by a decision diamond, 207, procedural control returns to block 196 wherein the search array is loaded with the gray level values of pixels corresponding to the next column.
- the row counter value is compared with the value stored in the variable highest row as represented by a decision diamond, 210. If the row counter has a value less than the value of the variable highest row, the coordinates of the detected black pixel (column, row) are saved in memory with the variable highest row set at the row counter value as illustrated in a block, 212.
- the column counter value is incremented by one in a block, 214, and compared with the right border edge 191, as denoted by the value of X ISO2 , and as represented in a decision diamond, 216.
- Procedural control will return to block 196 if the column counter value does not exceed X ISO2 ; otherwise, the coordinates stored in memory indicate the tail point, 193, as illustrated in FIG. 3C.
- the "tail-rump height" distance, TR, previously calculated in block 186 is converted into the corresponding number of pixels for the top image segregation representation in order to locate a rump height row, 201, shown in FIG. 3D, that corresponds to the highest point 157 on the corresponding animal image portion illustrated in FIG. 2E. Rump height row 201 is determined from the following equation:
- TR represents the tail-rump height distance calculated according to Equation 4 above
- FL2, VLR2, VPR2 and VOD2 represent system parameters described above.
- the quantity (TR*FL2/VOD2) represents the distance in millimeters on the CCD of camera 20 that is proportional to distance TR while VLR2 and VPR2 are system parameters needed to convert that proportional distance to a succession of pixels.
- a block, 222 represents the step of creating a top window, 203, as shown in FIG. 3E, from a portion of isolation box 181.
- Top window 203 includes a left and right border edges, 205, and 191, respectively, equal to that of isolation box 181 whereas upper and right border edges, 209, and, 211, extend rearwardly on the corresponding animal image portion from rump height row 201, three inches and nine inches, respectively.
- the location and dimension of top window 203 have been determined from prior research which has indicated the location of the widest point of the animal relative to the tail point 193.
- Upper border edge 209 and lower border edge 211 each are determined from the following equation:
- G represents the number of successive pixels on the segregated top image representation to be subtracted from the value of the rump height row 201; H represents the actual length in inches to be converted, i.e. 3 or 9 inches; and FL2, VLR2, VPR2 and VOD2 represent system parameters described above.
- the quantity (H*FL2/VOD2) represents the distance in millimeters on the CCD of camera 20 that is proportional to distance H while VLR2 and VPR2 are system parameters needed to convert that proportional distance to a succession of pixels.
- Top window 203 comprises a pixel matrix having X ISO2 columns and Y TW1 rows wherein Y TW1 equals the number of successive pixels between the upper and lower border edges 209 and 211, respectively, calculated above.
- An upper left corner, 213, has pixel coordinates (1, upper border edge row) and a lower right corner, 215, has pixel coordinates (X ISO2 , rump height row).
- Each pixel row of top window 203 is then examined, as represented in FIGS. 5A and 5B to locate the pixel row corresponding to the animal's greatest rump width, herein also referred as "RW".
- a block, 230 represents initialization of a counter "row" with the corresponding row to be searched.
- a one dimensional search array is then loaded with the gray level values of each pixel contained within the row designated by the row counter value as represented by a block, 234.
- a counter "left column” is then initialized at a value of one as represented by a block, 236, and the corresponding element value indexed by the left column counter which also corresponds to the pixel (left column, row) is examined for a gray level value equal to zero which denotes the occurrence of a black pixel.
- a decision diamond, 238, represents examination of the pixel and if this pixel is not black, the left column counter value is incremented by one as represented by a block, 240.
- the left column counter value does not exceed X ISO2
- the right border edge 191, as represented by a decision diamond, 242 procedural control is returned to block 238 with continued searching progression through the one dimensional array corresponding to the current row. If, however, the left column counter value exceeds the right border edge 191, as signified by the left column counter value greater than X ISO2 , searching is stopped at a block, 244, and an appropriate warning or indication is initiated by processing and analysis station 22.
- a counter "right column” is initialized at a value of X ISO2 as represented by a block, 250, and the corresponding element value indexed by the right column counter which also corresponds to the pixel having as coordinates (right column, row) is examined for a gray level equal to zero which denotes the occurrence of a black pixel.
- a decision diamond, 252 represents examination of the pixel and if this pixel is not black, the right column counter value is decremented by one as represented by a block, 254.
- the right column counter value is not less than 1, the left border edge 205, as represented by a decision diamond, 256, procedural control is returned to decision diamond 252 with continued searching through the one dimensional array corresponding to leftward progression through the current row of pixels. If, however, the right column counter value is left of the left border edge 205, as signified by the right column counter value less than one, searching is stopped at a block, 258, and an appropriate warning or indication is initiated by processing and analysis station 22.
- the right column counter value is stored in memory as represented by a block, 262.
- the width of the animal at this particular row is calculated by subtracting the stored left column counter value from the stored right column counter value as represented by a block, 264.
- the width of the animal is calculated for each row of the top window 203.
- the greatest width is determined to be the "rump width", herein also referred as "RW”, as represented by a block, 280, in FIG. 4H.
- RW rump width
- a block, 282 then represents determination of a corresponding value in inches using the following equation:
- I represents the number of successive horizontal pixels comprising the rump width.
- HPR2, HLR2, FL2 and VOD2 represent system parameters described above.
- the quantity (I/HPR2/HLR2) represents the distance in millimeters on the CCD of camera 20 that is proportional to the succession of pixels denoted by I while the quantity (VOD2/FL2) is used to convert that proportional distance to a corresponding distance in inches.
- a particular muscle is indicated as a site for recording of muscle width such as rump width and other muscle widths to be located below, it is done for the purpose of denoting an anatomical area of interest and not for the purpose of measurement of one particular muscle.
- Research has indicated that when the musculoskeletal development of an animal, such as cattle, is used for an indication of specific traits or performance characteristics, which are influenced by the animal's hormonal activity, it is better to group muscle systems into anatomical regions rather than consider individual muscle systems in the region of interest because the musculoskeletal development of an anatomical area of interest is a superior indicator of hormonal activity within the animal.
- Second top window 221 comprises a pixel matrix having X ISO2 columns and Y TW2 rows wherein Y TW2 equals the number of pixels between rump height row 201 and lower border edge 189.
- An upper left corner, 241 has pixel coordinates (1, rump height row) and the lower right corner 187 has coordinates (X ISO2 , Y ISO2 ).
- a block, 286 represents examination of each row of second top window 221 according to the procedure described above and illustrated in FIGS. 5A and 5B to locate the row having the greatest width which is determined to be the animal's "stomach width", herein also referred as "STW".
- a block, 288, represents conversion of the stomach width to inches as determined from the following equation:
- J represents the number of successive horizontal pixels comprising the stomach width.
- HPR2, HLR2, FL2 and VOD2 represent system parameters described above.
- the quantity (J/HPR2/HLR2) represents the distance in millimeters on the CCD of camera 20 that is proportional to the succession of pixels denoted by J while the quantity (VOD2/FL2) is used to convert that proportional distance to a corresponding distance in inches.
- stomach row 223, illustrated in FIG. 3G
- This reference location is called the "indent row” and indicates the start of the shoulder region of the animal.
- a block, 300, illustrated in Figure 4H represents initialization of a counter "row” with the value corresponding to the stomach row 223, located above; variable "left edge” with a value of zero which represents left border edge 205; and variable "right edge” with X ISO2 which represents right border edge 191.
- a one dimensional search array is then loaded with the gray level values of each pixel contained within the row designated by the row counter value as represented by a block, 301.
- a counter "left column” is then initialized at a value of one as represented by a block, 302, and the corresponding element value indexed by the left column counter in the search array which also corresponds to the pixel (left column, row) is examined for a gray level value equal to zero which denotes the occurrence of a black pixel.
- a decision diamond, 303 represents examination of the pixel and if this pixel is not black, the left counter value is incremented by one as represented by a block, 304.
- the left counter value does not exceed X ISO2
- the right border edge 191 as represented by a decision diamond, 305
- procedural control is returned to decision diamond 303 with continued searching progression through the one dimensional array corresponding to rightward progression through the current row of pixels. If, however, the left column counter value exceeds the right border 191, as signified by the left column counter value greater than X ISO2 , searching is stopped at a block, 306, and an appropriate warning or indication is initiated by processing and analysis station 22.
- the left column counter value is compared to the value stored in the left edge variable as represented by a block, 308. If the left column counter value exceeds the value stored in the left edge variable, indicating that the current pixel is to the right of any previously detected left edge pixel, a block, 309, represents storing the coordinates of the current pixel wherein the left edge variable value is also set to the value of left column counter.
- a counter "right column” is initialized at a value of X ISO2 as represented by a block, 310, and the corresponding element value indexed by the right column counter in the search array which corresponds to the pixel (right column, row) is examined for a gray level value equal to zero which denotes the occurrence of a black pixel.
- a decision diamond, 311 represents examination of the pixel and if this pixel is not black, the right counter value is decremented by one as represented by a block, 312.
- the right counter value is not less than 1, or left of the left border edge 205, as represented by a decision diamond, 313, procedural control is returned to decision diamond 311 with continued searching through the one dimensional array corresponding to leftward progression through the current row of pixels. If, however, the right column counter value is left of the left border edge 205, as signified by the right column counter value less than 1, searching is stopped at a block, 314, and an appropriate warning or indication is initiated by processing and analysis station 22.
- the right column counter value is compared to the value stored in the right edge variable as represented by a block, 316. If the right column counter value is less than the value of the right edge variable, indicating that the current pixel is to the left of any previously detected left edge pixel, a block, 317, represents storing the coordinates of the current pixel wherein the right edge variable value is set to value of the right column counter.
- the row counter value is incremented by one, as represented by a block, 318. If the row counter does not exceed Y ISO2 , the lower border edge 189, as represented by a decision diamond, 319, the remaining rows of second top window 221 are examined. If, however, the row counter value does exceed Y ISO2 , indicating that all rows have been examined, then an indent row variable is set, as represented by a block, 320 in FIG. 4K, with the corresponding row coordinate of the left or right edge stored coordinates that is farthest away from lower border edge 189. In other words, the indent row variable is set equal to the lowest row value of either the left edge variable or the right edge variable.
- FIG. 3H illustrates location of an indent row, 225, located according to the above prescribed procedure.
- the indent row 225 is used as the upper boundary edge of a third window defined from a portion of isolation box 181 that extends forwardly upon the animal to lower edge 189.
- the value of the variable indent row is provided as input to a block, 321, that represents the step of creating a third top window, 227.
- Third top window 227 comprises a pixel matrix having X ISO2 columns and Y TW3 rows wherein Y TW3 equals the number of pixels between indent row 225, located above, and lower border edge 189.
- An upper left corner, 229 has pixel coordinates (1, indent row) and the lower right corner 187 has pixel coordinates (X ISO2 , Y ISO2 ).
- a block, 322, in FIG. 4K represents examination of each row of third top window 227 according to the procedure described above and illustrated in FIGS. 5A and 5B.
- the row corresponding to the widest portion of the animal is determined to be the "shoulder width", herein also referred as "SHW", of the animal.
- a block, 324, in FIG. 4K represents conversion of the shoulder width to inches as determined from the following equation:
- K represents the number of successive horizontal pixels comprising the shoulder width.
- HPR2, HLR2, FL2 and VOD2 represent system parameters described above.
- the quantity (K/HPR2/HLR2) represents the distance in millimeters on the CCD of camera 20 that is proportional to the succession of pixels denoted by K while the quantity (VOD2/FL2) is used to convert that proportional distance to a corresponding distance in inches.
- a block, 326 represents the step of calculating the animal's "body length", herein also referred as "BL".
- the body length is calculated by subtracting the rump height row 201 value from the shoulder width row 231 value.
- the body length, BL is converted to inches with the following equation:
- L represents the number of successive vertical pixels comprising the body length.
- VPR2, VLR2, FL2 and VOD2 represent system parameters described above.
- the quantity (L/VPR2/VLR2) represents the distance in millimeters on the CCD of camera 20 that is proportional to the succession of pixels denoted by L while the quantity (VOD2/FL2) is used to convert that proportional distance to a corresponding distance in inches.
- Such periodic spatial patterns in these background portions introduce significant spatial frequencies into optical images of these backgrounds at spatial frequencies near the pattern repetition frequency, or at least do so in those portions of these images in which these backgrounds appear. Such spatial frequencies are highly unlikely to appear in portions of these images in which animal 14 appears as seen in FIGS. 1E and 1F. Thus, an appropriate spectral decomposition of such optical images captured by cameras 18 and 20, and computer 40, will reveal large differences in spatial frequencies in image background portions versus animal 14 portions which can be used to distinguish between such kinds of portions.
- Suitable spectral decompositions of optical images are known to be provided by unitary transformations of the optical image, or portions thereof, such transformations being linear transformations satisfying certain conditions. These transformations turn out to be just multidimensional coordinate rotations leaving signal energies preserved so that mean-square energy differences between images portions are equal to the mean-square energy differences between the transforms of these image portions. Thus, differences between portions of the transform of an optical image will represent differences between corresponding portions of that image so that spatial frequency differences between image transform portions will correspond to differences between the corresponding images portions.
- Spectral decompositions leading to finding spatial frequencies in sampled optical images are typically obtained by the computer through transforming such stored sampled images using the discrete two-dimensional Fourier transform, or appropriate variants of that transform.
- the alternating white and black bands in background 33 and the background on shelves 35 resemble a spatial square wave in the vertical direction much more closely than a spatial sine or cosine wave, a spectral decomposition based on spatial square waves rather than spatial sine waves or cosine waves can save considerable computation.
- Such a transform will have significant values only for that spatial square wave having a spatial square wave repetition rate equal to, or approximately equal to, that of the background bands spatial alternation rate in the background portions of the image (ignoring the zero frequency spatial square wave which is just the pixel column portion average intensity value).
- the alternating background stripes, or bands, spatial alternation rate is represented in the rate of alternations across the stored optical image pixels from relatively high intensity values to relatively low intensity values, and back, in the vertical columns of pixels forming the images of those bands as stored in image capture card 41.
- the other spatial square wave repetition rates can be ignored insofar as having any significant values in the background portions if the image.
- Such a spatial square wave based spectral decomposition is provided by the Hadamard transform.
- This transform is based on the Hadamard matrix, represented by H, which is square and of a dimension corresponding to the size of the portion of the stored sampled optical image to be transformed.
- This square array has elements that have values equal to either 1 or -1 suggesting its relationship to spatial square waves, a typical array being the following having dimension eight: ##EQU1## Since spatial frequencies are usually understood to mean spatial sine or cosine waves (many of which are needed to approximately represent a spatial square wave), the periodic frequency interpretation for this matrix has instead been termed the "sequency" thereof and is taken to be the number of algebraic sign changes along a row.
- the transform values will be significant only for the row in H with the sequency corresponding to the background bands vertical spatial alternation rate in the background portions of the image (and significant at zero sequency which, as indicated, is to be ignored) so that the whole of the transform for a selected optical image portion need not be computed to determine if such alternating bands are present in the optical image portion being considered.
- the optical sensing arrangement is configured to result in each such background stripe or band being two pixels wide
- the only rows of H 8 that can yield a significant transform value are the third and fourth rows thereof in both of which two low element values alternate with two high element values. The one of these rows which yields a significant transform value will depend on whether the column vector p starts representing a band at an edge or in the middle thereof, that is, these two rows represent two different phases corresponding to the same spatial alternation rate.
- the pixel intensity values change from relatively high to relatively low, or vice verse, as a result of the alternations between white and black background stripes or bands in the background part of the scene that is the source of the stored image.
- Typical pixel intensity values for a pixel column portion in this background part might be 95, 103, 45, 44, 107, 90, 40, 47 to thus provide a column vector p of ##EQU2## where the higher intensity values represent relatively brighter image portions and the lower values represent relatively darker image portions.
- r sel is a row selection matrix formed as eight element matrix row vector having all zero value elements, except for the element having the same column position in this row vector as the row position of the row in H 8 to be selected which element has the value of one.
- r sel H 8 forms a limited Hadamard transform matrix.
- Such zero element values permit a significant reduction in computation.
- a second limited transform is taken which is limited to one row of H at a sequency that corresponds to half the background bands alternation rate, i.e. using the fifth line of H 8 .
- the limited transform based on sequencies corresponding to half the background bands alternation rate is quite small in a true alternating bands background portion of a stored image thus indicating that this last pixel column vector does not come from such a background portion of the stored image.
- a subtraction process can be used having the limited transform based on a sequency corresponding to half the background bands alternation rate as the subtrahend, and the limited transform based on a sequency corresponding to the background alternation rate as the minuend, to thereby provide a check on whether the finding of a substantial value for the limited transform based on the sequency corresponding to the background alternation rate is due to the pixel column vector coming from a background portion of the stored image, or instead coming from elsewhere in the image. This is accomplished by noting whether the result of the subtraction process has a substantial positive value, indicating a background portion is involved, or has, instead, a small or negative value indicating that a pair of substantial light and dark areas are involved.
- the phasing of the pixel column vector will typically be uncertain. That is, the first pixel in such a pixel column portion taken from a background part of the scene could occur on either a black or white stripe or band from the scene, and could occur at different points in such a stripe or band. If such a pixel column portion is subjected to being transformed by a limited transform based on a sequency, i.e.
- cameras 18 and 20 each, as indicated above, have a CCD light sensor which sense intensities of light in an optical image form thereon at each of the pixel locations in a 512 column by 480 row sensor array.
- the light intensity falling on each sensor to form an image pixel is resolved into 256 intensity levels numbered 0 to 255.
- the focal lengths of each of the camera lenses for cameras 18 and 20 is 6 millimeters, and these lenses are located at a distance of about 8 feet 7 inches to give a resolution of about 0.17 in. per pixel in the vertical direction in the optical field of view for camera 18 in FIG.
- the Hadamard transform of portions of the stored optical image to be provided in the system in connection with FIG. 1B has been chosen to be based on the Hadamard matrix of dimension 12, H 12 , rather than the Hadamard matrix of dimension 8 used in the examples above.
- the same principles apply, and so only those rows of that matrix having sequencies which corresponds to the background stripe alternation rate, and those rows having sequencies corresponding to half that rate, are needed from that matrix to thereby form corresponding limited transforms based on those square wave period frequencies.
- This partial Hadamard matrix is not, however, the one actually used in connection with the system of FIG. 1B as this result can be further modified to eliminate another possible source of error in the stored optical image.
- Cameras 18 and 20 both capture images of the scene occurring on the CCD sensor therein by sensing the light intensity on the sensors of those arrays on an "interlaced" basis, that is, by first extracting the data from all of either the even or odd rows of sensors in the CCD array and thereafter obtaining the data from the remaining rows of sensors.
- a pixel column vector can effectively have an erroneous spatial periodic frequency introduced therein such that every other pixel, obtained at the first acquisition of sensor row data, is at a somewhat different intensity due to animal movement from that of the adjacent pixels acquired during the second acquisition of sensor row data some milliseconds later.
- This series of row sensor data suffers alternating intensity effects in the animal image portions of the rows due to the animal's movement, and so the cumulatively forming column vectors with these effects are primarily located in an animal portion of the stored optical image.
- This kind of periodic change frequency due to successive interlaced acquisitions of light intensity data from a scene occurring on the camera CCD array can be removed by substituting a zero in each three of the relatively same value elements that occur for each of the background stripe alternation rate phase rows in the partial Hadamard matrix just set out to provide the following matrix used in the operation of the system of FIG.
- This matrix assures that successive pairs of values in the preceding pixel column vector cancel to thereby eliminate this interlace periodic frequency from affecting the limited transform values in the animal portion of a stored optical image due to any movement thereof. In other situations such as no movement of the animal or transforms of pixel columns obtained in a portion of the image representation due to the stationary background, this matrix has the effect of merely reducing the magnitude of the limited transform values at the background stripe alternation rate. Because of the pairing of successive values being sufficient to substantially eliminate this interlace-scene item motion effect, the use of an even number of pixels per background stripe can be seen to also be effective to substantially eliminate the effect. A further alternative would be to find the transform value at the interlace frquency and subtract that value from the transform value at the background stripe alternation rate.
- Some representative pixel column vectors from a stored optical image that was captured in image capture card 41 provide the basis of an example of the principles described above using the Hadamard dimension 8 matrix.
- the modified Hadamard matrix of dimension 12, H 12-mod is used.
- the column vectors chosen are parts of pixel columns in the stored optical image that occur near the boundary between an animal portion of the image and the background portion of the image. These column vectors were chosen to each contain 12 elements with values equal to the pixel light intensity values for pixels that in these columns have Y coordinate values 268 through 279.
- p T trans [40 40 40 40 140 140 140 140 140 140 140 140].
- the first two elements represent the transform values for the two phases corresponding to half the background stripe alternation rate
- the remaining three elements represent the transform value for the three phases corresponding to the background stripe alternation rate.
- the transform values for the two phases at half the background stripe alternation rate have had their absolute values combined to provide the effective transform value corresponding to half the background stripe alternation rate which has been denoted as BAR/2-eff .
- the transform values for the three phases at the background alternation rate have the absolute values thereof combined to provide the effective transform value corresponding to the background stripe alternation rate which has been denoted BAR-eff .
- difference values in this last row vector can be considered representative of the situation at or near the center of the pixel column vector on the average.
- a row vector such as the last and determine at which X coordinate there is substantial increase in the transform difference value to indicate the edge or boundary occurring between an animal portion and a background portion in the stored optical image.
- a new twelve by twelve block of pixel intensity values can be chosen to the right of the present block assuming the stored optical image is like that shown in FIG. 1E, and the process for obtaining the transform value is repeated. This can be continued until a block of pixels chosen includes the more or less vertical boundary between the animal portion of the stored optical image near the rear of the animal in FIG. 1E and the background image portion.
- successively selecting higher blocks of pixels and repeating the matrix methods shown above until a significant rise in the transform differences occurs allows determining the more or less horizontal boundary between the animal portion of the stored optical image near the top of its back and the background image portion.
- FIG. 1B and 1D The operation of the evaluation system shown in FIG. 1B and 1D is indicated generally in the flow chart of FIGS. 6A, 6B and 6C which presents the operation in somewhat less detail than the operation of the evaluation system of FIGS. 1A and 1C is shown in FIGS. 4 and 5, but makes use of similar methods.
- An animal to be measured interrupts the beam of light established by the photocell system 86' to initiate acquisition and storage of the scenes viewed by cameras 18 and 20. These cameras are, of course, synchronized so that these scene images are acquired from each more or less simultaneously so that again various measurement ratios can be formed that are consistent with one another in view of the changes in the animal's widths and heights as it walks through scanner chute 12".
- the desired accuracy of one inch requires that the images be taken within about four milliseconds of one another. Normal acquisition of the data in the camera CCD array and storing in image capture card 41 typically takes from 17 to 33 milliseconds, thus eliminating the possibility of operating the cameras one after the other if such accuracy is to be maintained. Furthermore, the substantially simultaneous acquisition of the scene images by cameras 18 and 20 is required for accurate computation of position on the animal for measurement purposes. This is because camera 18 providin a side view stored optical image is used to calculate the expected position of various parts of an animal's body for camera 20 providing a top view stored optical image. If the images are not acquired from each camera substantially simultaneously, the distance moved by the animal between the acquisition of the images would be two errors in position determination in the top view image using such methods.
- scale sensors 39 and controller 39' provide weight information of an animal to computer 40.
- the weight can be estimated from the body measurements of the animal so that the use of a scale is optional, the scale does furnish useful additional information for the classification process and provides a check on the quality of the information obtained by the body measurement methods.
- Barrel gate 31 in controlling the passage of cattle out of weighing chute 12'", is used to keep an animal in the scale location long enough for the weight data to stabilize which is typically five to ten seconds.
- FIG. 6 The methodology followed in using the system of FIGS. 1B and 1D is indicated in the flow chart of FIG. 6.
- the system through computer 40 Upon switching on the system of FIG. 1D in an initial block, 400, in FIG. 6A at the start, the system through computer 40 provides a prompt on one or the other, or both, of displays 42 and 44 to enter information at the discretion of the operator as indicated in another block, 402.
- Some of the possible information that can be entered is indicated in an entry block, 404, including animal gender, age, estimated fleshiness, breed, average weight of animals in the group, purchase order number, desired number sequence for numerical identifier tags, display type to be used in remotely located sign, file name for data record, whether a hard copy is desired, etc.
- the computer program in computer 40 directs cameras 18 and 20 to each acquire a corresponding image of scanning chute 12" absent any animal therein as indicated in a further block, 408.
- the position of the alternating background stripe or band pattern in the field of view of each of these cameras is located in the data captured in image capture card 41 of the scene images impinging on the camera CCD arrays assuming they are properly aligned, lens cap is off, backgrounds are visible from the camera lens, etc.
- the position of these background patterns in the stored optical images is found as indicated above by locating the positions in each image from the edges thereof where the results of the limited Hadamard transform of these stored images have transitions to higher amplitude values in the manner decribed above.
- the transition positions in the limited Hadamard transform values found for the background alternating stripe patterns viewed by each camera are compared in a cut-corner decision box, 410, in FIG. 6B to data stored in computer 40 to determine whether cameras 18 and 20 are at correct distances and pointed in the correct direction, and whether an acceptable optical path exists between the CCD array in each camera and the background alternating stripe patterns corresponding thereto. If this pattern is not found to be in the right position, the camera optical access may be misaligned with the direction desired therefor. If limited Hadamard transform amplitudes are low, this may indicate problems of insufficient lighting, dirt or other matter covering the background alternating stripe patterns, or that the camera lens cover has not been removed, or the like. Such problem are indicated to the operator as a basis to initiate proper corrective measures as indicated in a corrective measures block, 412, seen in FIG. 6B.
- the system feedback loop through box 412 brings the operator back to the beginning of the calibration procedure ahead of box 408 for the operator to restart the calibration process.
- the program automatically moves ahead with the calibration procedure and calibrates the system of FIGS. 1B and 1D by noting the position of the background alternating stripe patterns in the stored optical images for each of cameras 18 and 20. For example, the distance to the lowest black line in background pattern 33 in the side of scanning chute 12" facing camera 18 is measured manually above floor 38' of that chute prior to beginning operation, and the result of that measurement, typically thirty-four inches above the floor, is entered and stored in computer 40 as an initial parameter.
- this lowest black line corresponds to Y coordinate 280
- the spatial distance corresponding to the pixel distance between a subsequently scanned animal's back Y coordinate and that line is determined, and the result added to the thirty-four inches to obtain the height of that animal's back.
- the overall gist of the calculation is given for this example since an actual calculation must also include corrections for camera angle and for shortened distances since a measured animal is located between camera 18 and background pattern 33.
- the program moves on after the calibration procedure to the next block, 416, to display the program main menu to the operator to thereby permit the operator to decide in a cut-corner decision box, 418, whether to measure cattle, or another kind of animal if scanning chute 12" is adapted for such other animal (cattle being assumed here), or to choose other menu options such a rechecking the pattern or changing initial parameters after a camera readjustment, for instance.
- a cut-corner decision box, 422 determines whether terminating operation of the system of FIGS.
- the system of FIGS. 1B and 1D is placed in a waiting mode by a further cut-corner decision box, 426.
- This waiting mode is established through a feedback loop about decision box 426 that is entered into in the event of no signal change being indicated by photocell arrangement 86' of position sensor means 84, the system awaiting the interruption of the light beam established by photocell arrangement 86' across passageway 16' at a height that is interceptable by legs of cattle.
- cameras 18 and 20, along with image capture card 41 substantially simultaneously acquire and store a chute side, or elevation, scene optical image representation and a chute overhead (top), or plan, scene optical image representation, respectively, as indicated in a further block, 428, based on the scene image light intensities impinging on the camera CCD arrays.
- digital image processing techniques based on the limited Hadamard transform, as described above, are used on the stored optical image representation data to obtain, first, the position of the rear of the animal, and then the height of the animal, using the side scene optical image representation captured by camera 18 with image capture card 41, this processing being directed and undertaken by computer 40 in accord with the program provided therein.
- the digital processing begins with the pixel intensity information in the lower left corner of the stored scene optical image representation of background 33 established in the calibration procedure as indicated in a further block, 430.
- the 12 pixel by 12 pixel square block of 144 pixels having the pixel in the lower left-hand corner thereof coinciding with the location of the lower left-hand corner pixel in the calibration scene image representation of the alternating stripe pattern forming background 33, has limited Hadamard transform values computed by the program of computer 40 for the twelve pixel column vectors in that 12 by 12 pixel block as indicated in a further block, 432, in FIG. 6B.
- the transform values for each of the phases at the background alternating stripe alternation rate are combined in absolute value for each such column vector, as above, as are the transform values for each of the phases at half the background alternating stripe alternation rate for each such column vector.
- the latter result is then subtracted from the first result for each of these pixel column vectors in this pixel block to provide 12 block pixel column vector results with each of these results being found as described above.
- these 12 block pixel column vector results are additively combined into a single block result to provide an avenge value for the pixel block termed the avenge limited tranform difference value (ALTDF).
- ALTDF avenge limited tranform difference value
- a new 12 by 12 pixel block is selected by moving horizontally to the right one pixel column from the original block as the basis for a repetition of this avenge two rate difference limitedly transformed block evaluation process, or block evaluation process, to determine a further ALTDF value.
- This repitition of the block evaluation process is continued rightward across all of the pixel columns over the width of the stored scene optical image representation with the result for each block stored as an element of a row vector in a register in computer 40.
- further avenging or other error removal techniques can be additionally used in this processing which will not be described here for purposes of maintaining relative simplicity.
- This resulting row vector, [ALTDV i ], having its elements formed by the resulting average two rate difference limitedly transformed block evaluation process values ALTDV for each block in succession will have typically about 240 values for a background pattern 33 of the size described above, and the camera 18 spaced therefrom as described above.
- the "i" in the elements ALTDV i will range from approximately 0 to 239.
- This set of ordered elements forming the above-described row vector is reviewed by the program of computer 40 to find a transition location among the elements therein where the element values go from being relatively small, representing blocks contained in the animal image portion of the stored optical image representation, to being relatively large past the border separating this portion from the background 33 alternating strip or band portion of that representation as more and more of that background pattern is included in the pixel column vectors being subjected to the block evaluation process based on the limited Hadamard transform.
- the approximate center of this transition can be determined through using a first derivative, edge spatial gradient method along the ALTDV row vector that can be implemented by finding the maximum of the difference along the row vector over the expected pixel transition width as indicated in the feedback loop around a further cut-corner decision box, 434, through a row vector element position incrementing block, 436, both of which are shown in FIG. 6C.
- the difference function ALTDV i+6 -ALTDV i-6 should be a maximum when "i" represents the location along the row vector at the boundary between the rear of the animal portion of the stored optical image representation and the background alternating stripe portion of that representation.
- the row vector element ALTDV i-6 will represent a 12 by 12 pixel block which is completely in the animal portion of the stored optical image
- the row vector element ALTDV i+6 will represent a 12 by 12 pixel block which is entirely within the background alternating stripe portion of that image.
- the value "i" indicates the intermediate location therebetween where such a boundary occurs at which the difference ALTDV i+6 -ALTDV i-6 is a maximum, and which can be related to a pixel location in the original stored optical image.
- This pixel location is then stored as the identifier of the location of the rear boundary of the animal portion of the stored optical image as shown in a further data storage block, 438.
- the pixel which corresponds to a point about 16 inches left of the rear of the animal is located in the animal portion of the stored side view optical image representation. That is, the pixel column approximately 73 (16/0.22) horizontal pixels to the left of that pixel column found above as a rear boundary of the animal portion in the stored side view scene optical image representation is located, and the corresponding ALTDV i element found there is used to form the first element of a new column vector, [ALTDV j ].
- a 12 by 12 pixel block one pixel row upward is then selected, and essentially the same steps used to determine the successive elements of the [ALTDV i ] row vector are again used to determine the successive elements of this [ALTDV j ] column vector.
- the block evaluation process starts with the same 12 pixel column vectors used to form the 16 inch forward element in row vector [ALTDV i ] that now also serves as the first element in the [ALTDV j ] column vector, and the process in the program of computer 40 then forms a new block by moving upward one pixel row in the same 12 pixel columns to form this next block as the basis for determining the next element in column vector [ALTDV j ].
- This process repeats, moving up one further pixel row in the same 12 pixel columns to obtain the next new block used as the basis for the next element in the column vector, until the top of that stored optical image representation is reached, as is known from the calibration data, this vertical block evaluation process being indicated in a further block, 442, in FIG. 6.
- a first derivative spatial edge gradient method is used on column vector [ALTDV j ] to find the element thereof marking the boundary between the animal portion of the stored optical image representation and the alternating stripe background portion of that representation thereabove to provide the location of the top of the back of the animal as indicated in the feedback loop in FIG. 6C formed by a cut-corner decision box, 444, and an element position incrementing block, 446.
- the coordinate is stored in computer system 40 as indicated in another block, 448.
- the measurement process then continues by making use of the data in the top view scene optical image representation captured by overhead camera 20 which is begun a further block, 450, in FIG. 6C.
- the rear boundary location between the animal portion and the background alternating stripe portion to the right in the side view scene representation that was previously obtained therefrom and stored, as set out back in block 438, and the calibration data from the stored optical images obtained without an animal scanning chute 12", as set out back in block 414, are used to find a corresponding rear boundary pixel location in the stored optical image representation captured by camera 20 and image capture card 41. This determination must take into account any differences in location of the rear edge of background pattern 33 and the rear edge of the background pattern on shelves 35 in the direction along passageway 16' that is followed by an animal passing through scanning chute 12".
- the rear of an animal being measured is indicated in block 438 to be 32 inches from the rear or right edge of background pattern 33 in the side view scene optical image representation, but the background pattern on shelves 35 begins 2 inches forward along passageway 16' from the rear edge of background pattern 33, i.e. 2 inches to the left of the rear edge of background pattern 33 in FIG. 1B, the rear boundary of the animal portion of the top view scene optical image representation captured by camera 20 will be 30 inches forward from the rear edge of the pattern on shelves 35. Since pixel width dimensions are approximately 0.22 inches per pixel, there are approximately 4.6 pixels per inch in the width dimension.
- the rear boundary of the animal portion of that stored optical image representation will be found at X coordinate 470 less 30 inches converted to pixels, or 30*4.6, that is, at approximately X coordinate 332 in the top view scene stored optical image representation.
- the rump width of the animal is then determined at a location in that animal portion image along the Y coordinate center line (parallel to the chute sides) by subtracting 55 pixels from this rear boundary X coordinate to find the X coordinate representing approximately 12 inches (55/4.6) into the animal portion of the image forward of the rear boundary location.
- the resulting column vector [ALTDV k-1 ] is used with a first derivative spatial edge gradient method to find the maximum therein indicating the boundary separating the side of the animal portion of the image from the background image portion, this done in the feedback loop involving a cut-corner decision box, 454, and a subsequent vector element incrementing block, 456, shown in FIG. 6D.
- the boundary location coordinate found is then stored as a first side boundary coordinate as indicated in a further storage block, 458.
- the process continues by again using a first derivative, spatial edge gradient method to find the maximum of the resulting column vector [ALTDV k-2 ] to locate the boundary, and again is implemented in another feedback loop including a further cut-corner decision box, 462, and another vector element incrementing block, 464.
- the resulting second side coordinate of the animal is also stored as indicated in another storage block, 466.
- the first side coordinate and the second side coordinates are subtracted as indicated in another block, 468, to determine the rump width of the animal being measured. Also, since an animal being measured is closer to the camera than the alternating stripe background on shelves 35, a correction factor is used to account for the geometrical shift between the background and the animal that in effect reduces the pixel dimensions over the animal portion of the image.
- the shoulder width of the animal is next measured also using the top view scene stored optical image representation. This measurement is begun, as indicated in a following block, 470, in FIG. 6D, by first approximating the location of the animal's shoulders in this representation as that X coordinate value that is forward of the rear boundary between the animal and background portions of the representation by a distance equivalent to the height of the animal earlier found using the side view scene stored optical image.
- the location of the photocell light beam is found in the top view calibration image taken in the absence of an animal in scanning chute 12", and that location is also stored as an X coordinate value in the calibration data.
- That X coordinate value, and the X coordinate value just found based on the apprximation provided by the previously determined height of the animal, are together averaged to provide the estimated X coordinate of the animal's shoulders in the top view scene stored optical image representation as indicated in a further block, 472, shown in FIG. 6E.
- an offset X coordinate is found along the Y coordinate center line which is offset from the estimated shoulder location X coordinate by a pixel columns distance equivalent to about 6 inches, and this offset location X coordinate forms the initial trial width location as indicated in a following block, 474.
- a trial location counter is reset to have its count, n, equal to 0, as indicated in a next block, 476.
- the program in computer 40 determines nine different trial shoulder widths at nine locations arranged symmetrically at and about the earlier found X coordinate determined as the estimated shoulder location.
- This series determinations of trial shoulder widths begins first at the initial trial width location X coordinate, or the offset location X coordinate, and, after finding and storing the width between the sides of the animal portion of the representation there in the same manner as the rump width was found, the computer 40 program then continues from there to shift positions in pixel column distances equivalent to 1.5 inch shifts over these columns along the center line and, in doing so, crosses over the estimated shoulder width location X coordinate to four further trial shoulder width locations on the other side thereof.
- the computer 40 program determines at each of these eight further trial width locations the corresponding width there between the sides of the animal portion of the representation in the same manner as was used to determine the rump width.
- This series of trial width determinations is accomplished through the steps set out in the corresponding blocks and cut-corner decision boxes following block 476, these including a following first transform operations block, 478, to form an average limited transform two rate difference based column vector for a twelve pixel column band extending from the center line at a trial width location past the animal portion boundary.
- the formation of this column vector is followed by use of a first feedback loop to perform a maximum gradient search of that vector which includes a cut-corner decision box, 480, and a vector element incrementing block, 482, with the resulting boundary coordinate therefrom stored in a further block, 484.
- these blocks following block 478 determine the pixel distance from the center line to one side of the animal at the particular trial shoulder width location involved.
- the distance from the center line to the other side of the animal at such a trial shoulder width location is obtained by further performing transform operations as indicated in a second operations block, 486, to again form another average limited transform two rate difference based column vector for a twelve pixel column band extending from the center line at a trial width location past the opposite animal portion boundary.
- a gradient maximum search of this last resulting column vector to find the animal portion boundary for this opposite side is provided by a second feedback arrangement established by a cut-corner decision box, 488, and another vector element incrementing block, 490, both shown in FIG. 6F.
- the resulting boundary coordinate is stored in another storage block, 492.
- a further block, 494 indicates that the first side and second side coordinates found for a trial width location are subtracted to obtain the animal pixel width at that location with correction made for the animal being nearer the camera than the background.
- the result is the top view scene trial width at that trial shoulder width location after conversion to acutal distance which is stored, and thereafter the trial location counter is incremented by one as indicated in a subsequent block, 496.
- the computer 40 program After a trial width has been determined and stored at a trial shoulder width location, the computer 40 program operates to obtain a trial width at the next of the remaining trial shoulder width locations.
- a cut-corner decision box, 498 determines that the current iteration of the trial width determination is checked as to its number in the trials sequence and, if not the last one, the computer 40 program is led to a further block, 500, to locate the next trial width location X coordinate along the top view center line, and the trial width determination process is begun again following the feedback arrow to just before block 478.
- the second greatest trial width found in this procedure is selected as the top view scene shoulder width of the animal being measured which is then stored as indicated in a further block, 502. Choosing the second largest trial width is equivalent to throwing out the largest trial width which is the most likely one of the trial widths to be in error perhaps because that measurement may have occurred near the stomach bulge of the animal, or because some mud has caked on the animal or the like. At the same time, since the shoulder area of the animal is going to occur over at least two or three of the trial shoulder width locations, eliminating the largest trial width, even if accurate, will not lead to much difference in the determined shoulder width of the animal obtained by choosing the second largest trial width value.
- the measurement data generated by the system of FIGS. 1A and 1C, specifically, the animal's: rump height (RH); rump width (RW); shoulder width (SHW); and body length (BL) are used to evaluate and predict characteristic traits of each animal.
- the characteristic traits of each animal are determined from animal indicia or characteristic indicating ratios formed from the above listed physical measurements.
- a shoulder muscle to bone ratio herein also referred as "SMB”
- a rump muscle to bone ratio herein also referred as “RMB”
- a musculoskeletal development per unit length ratio herein referred as “MSDL”
- MSDH musculoskeletal development per unit height ratio
- a first functional characteristic equation represented as follows:
- Coefficients a, b, c, d are weighting factors used to emphasis one or more of the four characteristic indicating ratios.
- Coefficient e is used as an adjustment constant to provide a numerical value in a particular range of values, for example to create a range of values from one to ten.
- two different sets of weighting coefficients are provided wherein one set is provided for each sex of the animal.
- a first set of carcass value coefficients (a M , b M , c M , d M , e M ) are provided for the male gender of the animal while a second set of carcass value coefficients (a F , b F , c F , d F , e F ) are provided for the female gender of the animal.
- Separate sets of carcass value coefficients are provided in order to isolate similar economically valuable characteristics of each particular gender of the animal such that animals of a particular sex can be accurately compared.
- characteristic indicating ratio SMB provides an indicative value that relates to the animal's shoulder muscles.
- this particular area is well developed in the male gender of those animals that have reached or surpassed the age of puberty due in part to the presence of both growth hormones and male sex hormones (testosterone).
- the characteristic indicating ratio RMB provides an indicative value that relates to the animal's rump muscles.
- this particular area is well developed in the female gender of those animals that have reached or surpassed the age of puberty due in part to the presence of both growth hormones and female sex hormones (estrogen). Since each gender develops differently from the age of puberty, emphasizing different structural characteristics, separate sets of coefficients are provided in order to compare accurately like animals of a particular herd, or like animals of different herds.
- a third set of carcass value coefficients (a MF , b MF , C MF , d MF , e MF ) can be used wherein the subscript "MF" represents both male and female animals that have not reached puberty.
- carcass value coefficients of the first set (a M , b M , c M , d M , e M ), second set (a F , b F , c F , d F , e F ) and third set (a MF , b MF , c MF , d MF , e MF ) have numerical values.
- the corresponding numerical values of each coefficient of each set of coefficients is determined by analyzing an appropriate number of animals that meet those age and gender requirements to obtain the measurements necessary to calculate the four characteristic indicating ratios, SMB, RMB, MSDL and MSDH.
- each coefficient can be determined from any suitable mathematical convergence technique.
- a multiple linear regression model using a least square estimator technique is used, as represented by the following equations: ##EQU9##
- coefficients a, b, c, d, e represent the set of carcass value coefficients to be determined, either (a M , b M , c M , d M , e M ), (a F , b F , c F , d F , e F ) or (a MF , b MF , c MF , d MF , e MF );
- N represents the total number of individual animals that meet the age and gender requirements for the particular set of coefficients to be determined, for example, if numerical values are desired for the carcass value coefficients (a M , b M , c M , d M , e M ), then N equals the total number of male animals that have at least reached the age of puberty; subscript "i” represents a particular individual of the total number of animals; SMB i , RMB i , MSDL i and MSDH i are the four characteristic indicating ratios for each
- each animal would be analyzed to obtain the four characteristic indicating ratios listed above with CV i for that particular animal gauged or assigned a corresponding value from one to ten.
- CV i the coefficients listed above can be solved simultaneously for the coefficients (a, b, c, d, e).
- PA functional characteristic equation
- Coefficients f, g, h, j are weighting factors used to emphasize one or more of the four characteristic indicating ratios.
- Coefficient k is used as an adjustment constant to provide a numerical value in a particular range of values, for example to create a range of values from one to ten.
- a first set of production audit coefficients (f M , g M , h M , j M , k M ) are provided for the male gender of the animal while a second set of production audit coefficients (f F , g F , h F , j F , k F ) are provided for the female gender of the animal.
- the separate sets of production audit coefficients are provided in order to isolate similar economically valuable characteristics of each particular gender of the animal such that animals of a particular sex can be accurately compared.
- a third set of production audit coefficients (f MF , g MF , h MF , j MF , k MF ) can be used wherein the subscript "MF" represents both male and female animals that have not reached puberty.
- the production audit coefficients of the first set (f M , g M , h M , j M , k M ), second set (f F , g F , h F , j F , k F ) and third set (f MF , g MF , h MF , j MF , k MF ) have numerical values.
- the corresponding numerical values of each coefficient of each set of coefficients is determined by analyzing an appropriate number of animals that meet the age and gender requirements to obtain the measurements necessary to calculate the four characteristic indicating ratios, SMB, RMB, MSDL and MSDH.
- each coefficient can be determined from any suitable mathematical convergence technique.
- a multiple linear regression model using a least square estimator technique is used, as represented by the following equations: ##EQU10##
- coefficients f, g, h, j, k represent the set of production audit coefficients to be determined, either (f M , g M , h M , j M , k M ), (f F , g F , h F , j F , k F ) or (f MF , g MF , h MF , j MF , k MF );
- N represents the total number of individual animals that meet the requirements for age and gender of the particular coefficients to be determined, for example, if numerical values are desired for the production audit coefficients (f M , g M , h M , j M , k M ), then N equals the total number of male animals that have at least reached the age of puberty; subscript "i" represents a particular individual of the total number of animals; SMB i , RMB i , MSDL i and MSDH i are the four characteristic indicating ratios for each particular animal used
- each animal would be analyzed to obtain the four characteristic indicating ratios listed above with PA i for that particular animal gauged or assigned a corresponding value from one to ten.
- SMB i , RMB i , MSDL i , MSDH i and PA i for each animal, then using known mathematical techniques, the equations listed above can be solved simultaneously for the coefficients (f, g, h, j, k).
- a block, 330 represents the step of evaluating the animal using Equations 15 and 21 for determination of the carcass value and production audit values, respectively, wherein given the age and gender of the animal, the appropriate set of carcass value and production audit coefficients are used.
- Calculated numerical values for carcass value and production audit are displayed on monitor 42 or monitor 44 and stored on any convenient storage device such as a portable magnetic memory disk, 332, on computer means 40 illustrated in FIG. 1A.
- a decision diamond, 334, illustrated in FIG. 4K, represents continuing the analysis procedure for another animal. If another animal is to be analyzed, procedural control returns to decision diamond 104 in FIG. 4A; otherwise, the procedure 100 is stopped at a block, 336, labeled "EXIT".
- the calculated numerical values for carcass value and production audit of each animal can be compared with corresponding values for other like animals from the same or a different herd.
- the calculated values can be grouped together to determine a herd carcass value or a herd production audit value. Use of the system of FIGS. 1A and 1C will thus provide efficient, accurate physical measurements which correlate to predictable characteristics of animals and their offspring.
- 1B and 1D can be directed to provide other physical measurements from the data captured in the side view and top view optical images stored therein if such other physical measurements would prove to have evaluative or predictive value as a result of further research relating such physical measurements to carcass characteristics such as marbeling and lean yield percentage, days needed on feed to reach certain goals, desirable end weights for particular biological types, etc.
- carcass characteristics such as marbeling and lean yield percentage, days needed on feed to reach certain goals, desirable end weights for particular biological types, etc.
- Such relationships between animal physical measurements and such characteristics is, as above, typically expressed in linear and nonlinear regression statistical relationships.
- evaluations of skeletal development and muscle maturity can be used to classify animals being measured into various groupings such as by "biological type", if desired.
- animals could be divided into nine classes as follows:
- Each of these nine classifications would contain animals having different production and carcass characteristics. Very large frame animals with below average muscle development are less likely to be graded Choice, and will have the highest end weight of any group. Small frame animals with above average, more mature muscle development will more likely be graded choice and finish at much lower end weight.
- a further alternative would be to classify animals for particular markets.
- a user's classification scheme can be selected by a user depending on the user's needs which may well change with the time of the year, price of feed, price of feeder cattle, changes in consumer demand, etc. Whatever classification scheme is chosen, further displays can be operated from computer 40 in the cattle segregating arrangements so that operators in those locations can tag the cattle, and implant them with such medicinal items as desired, read the correct pen indicator, etc.
- the data for each animal is stored by computer 40 and can be printed out or stored on a magnetic disk, and a summary for a group of animals can also be provided by the computer.
Abstract
Description
A=(B*FL1/HOD1)*HLR1*HPR1 Equation 1
RH=VOD1+C Equation 2
C=(D/VLR1/VPR1)*(HOD1/FL1) Equation 3
TR=(E/HLR1/HPR1)*(HOD1/FL1) Equation 4
F=(TR*FL2/VOD2)*VLR2*VPR2 Equation 5
G=(H*FL2/VOD2)*VLR2*VPR2 Equation 6
RW=(I/HPR2/HLR2)*(VOD2/FL2) Equation 7
STW=(J/HPR2/HLR2)*(VOD2/FL2)Equation 8
SHW=(K/HPR2/HLR2)*(VOD2/FL2) Equation 9
BL=(L/VPR2/VLR2)*(VOD2/FL2)Equation 10
[.sub.BAR -.sub.BAR/2 ]=[d d -8 d 190 d 486 d 612 d d d]. Equation 23
SMB=SHW/RH Equation 24
RMB=RW/RH Equation 25
MSDL=(SMB+RMB)/BL Equation 26
MSDH=(SMB+RMB)/RH Equation 27
CV=(a*SMB)+(b*RMB)+(c*MSDL)+(d*MSDH)+e Equation 28
PA=(f*SMB)+(g*RMB)+(h*MSDL)+(j*MSDH)+k Equation 34
Claims (6)
Priority Applications (1)
| Application Number | Priority Date | Filing Date | Title |
|---|---|---|---|
| US08/647,221 US5644643A (en) | 1991-08-30 | 1996-05-09 | Chute for use with an animal evaluation system |
Applications Claiming Priority (4)
| Application Number | Priority Date | Filing Date | Title |
|---|---|---|---|
| US75342891A | 1991-08-30 | 1991-08-30 | |
| US08/238,979 US5483441A (en) | 1991-08-30 | 1994-05-06 | System for animal evaluation through image acquisition |
| US08/262,234 US5576949A (en) | 1991-08-30 | 1994-06-20 | System for animal evaluation through image acquisition |
| US08/647,221 US5644643A (en) | 1991-08-30 | 1996-05-09 | Chute for use with an animal evaluation system |
Related Parent Applications (1)
| Application Number | Title | Priority Date | Filing Date |
|---|---|---|---|
| US08/262,234 Division US5576949A (en) | 1991-08-30 | 1994-06-20 | System for animal evaluation through image acquisition |
Publications (1)
| Publication Number | Publication Date |
|---|---|
| US5644643A true US5644643A (en) | 1997-07-01 |
Family
ID=26932151
Family Applications (2)
| Application Number | Title | Priority Date | Filing Date |
|---|---|---|---|
| US08/262,234 Expired - Lifetime US5576949A (en) | 1991-08-30 | 1994-06-20 | System for animal evaluation through image acquisition |
| US08/647,221 Expired - Lifetime US5644643A (en) | 1991-08-30 | 1996-05-09 | Chute for use with an animal evaluation system |
Family Applications Before (1)
| Application Number | Title | Priority Date | Filing Date |
|---|---|---|---|
| US08/262,234 Expired - Lifetime US5576949A (en) | 1991-08-30 | 1994-06-20 | System for animal evaluation through image acquisition |
Country Status (1)
| Country | Link |
|---|---|
| US (2) | US5576949A (en) |
Cited By (25)
| Publication number | Priority date | Publication date | Assignee | Title |
|---|---|---|---|---|
| US5809133A (en) * | 1996-05-24 | 1998-09-15 | Advanced Micro Devices, Inc. | DTMF detector system and method which performs frequency domain energy calculations with improved performance |
| US5996529A (en) * | 1998-01-13 | 1999-12-07 | Dairy Creations, Inc. | Milk metering and cow ID system |
| US20020037092A1 (en) * | 2000-07-19 | 2002-03-28 | Craig Monique F. | Method and system for analyzing animal digit conformation |
| US20020065765A1 (en) * | 2000-07-20 | 2002-05-30 | Agspan, Inc. | Systems and methods for interactive beef cattle marketplace |
| WO2003006919A2 (en) * | 2001-07-13 | 2003-01-23 | Rms Research Management Systems, Usa, Inc. | System and method for obtaining animal and carcass measurements |
| US6526919B1 (en) * | 2001-09-28 | 2003-03-04 | Paul Schick | Self-sorting hog facility and method |
| EP1382312A1 (en) * | 2002-07-18 | 2004-01-21 | Siemens Aktiengesellschaft | Process and device to immobilize and examine living creatures and use of the same for imaging |
| EP1396188A2 (en) * | 2002-08-26 | 2004-03-10 | Hölscher & Leuschner GmbH & Co. | Method for monitoring pigs |
| US6710800B1 (en) * | 1998-04-22 | 2004-03-23 | Time & Space Tech. Co., Ltd. | Displaying system capable of internet communication and control method thereof |
| US20040123811A1 (en) * | 2000-11-20 | 2004-07-01 | Bonsall Sandie W. | Animal transportation and tracking system |
| US20050136819A1 (en) * | 2002-08-02 | 2005-06-23 | Kriesel Marshall S. | Apparatus and methods for the volumetric and dimensional measurement of livestock |
| US20060029289A1 (en) * | 2004-08-05 | 2006-02-09 | Kabushiki Kaisha Toshiba | Information processing apparatus and method for detecting scene change |
| US20060048720A1 (en) * | 2002-12-03 | 2006-03-09 | Yasuhiro Kajihara | Apparatus for detecting animals |
| EP1625789A3 (en) * | 2002-03-11 | 2006-03-15 | Lely Enterprises AG | A device and an assembly for an animal related action |
| US20070209594A1 (en) * | 2003-11-07 | 2007-09-13 | Peter Kaever | Method and Device for Providing Information on the Occupancy of Milking Stations of a Milking System |
| WO2007107987A2 (en) * | 2006-03-21 | 2007-09-27 | S.A.E. Afikim - Computerized Dairy Management Systems | A method and a system for measuring an animal's height |
| EP1854054A2 (en) * | 2004-11-29 | 2007-11-14 | Cargill, Incorporated | Animal management system |
| US20080202444A1 (en) * | 2007-01-17 | 2008-08-28 | Jerome Albin Stenzel | Method and system for weighing confined livestock, such as penned pigs |
| US7444961B1 (en) | 2005-04-11 | 2008-11-04 | Ellis James S | Animal sorting and grading system using an internal evaluation to predict maximum value |
| WO2012040782A1 (en) * | 2010-09-29 | 2012-04-05 | John Conan Doyle | A system and method for measuring relative leg positions of an ungulate |
| US20130064432A1 (en) * | 2010-05-19 | 2013-03-14 | Thomas Banhazi | Image analysis for making animal measurements |
| US20150320535A1 (en) * | 2013-01-25 | 2015-11-12 | Precision Pastoral Pty Ltd | Methods For Estimating Birthing Data for an Animal |
| US9311556B2 (en) * | 2010-05-19 | 2016-04-12 | Plf Agritech Pty Ltd | Image analysis for making animal measurements including 3-D image analysis |
| US20190090459A1 (en) * | 2017-08-16 | 2019-03-28 | Adams Land & Cattle Co. | Livestock Sorting Facility |
| US20220217950A1 (en) * | 2019-05-10 | 2022-07-14 | Lely Patent N.V. | Ruminant animal monitoring system |
Families Citing this family (33)
| Publication number | Priority date | Publication date | Assignee | Title |
|---|---|---|---|---|
| US5576949A (en) * | 1991-08-30 | 1996-11-19 | C-Scan, Llc | System for animal evaluation through image acquisition |
| USRE36664E (en) * | 1991-09-04 | 2000-04-18 | Texas Beef Group | Method and apparatus for automatically segmenting animal carcasses |
| WO1998008088A1 (en) * | 1996-08-23 | 1998-02-26 | Her Majesty The Queen In Right Of Canada, As Represented By The Department Of Agriculture And Agri-Food Canada | Method and apparatus for using image analysis to determine meat and carcass characteristics |
| AU744213B2 (en) * | 1998-06-22 | 2002-02-21 | John Conan Doyle | Method and device for assessing cattle |
| AUPP422798A0 (en) | 1998-06-22 | 1998-07-09 | Doyle, John Conan | Method and device for assessing cattle |
| DE10232682B4 (en) * | 2002-07-18 | 2006-01-05 | Siemens Ag | Method and apparatus for non-magnetically identifying living things and using the same |
| IL150915A0 (en) | 2002-07-25 | 2003-02-12 | Vet Tech Ltd | Imaging system and method for body condition evaluation |
| US7039220B2 (en) * | 2002-08-14 | 2006-05-02 | C-Scan, L.L.P. | Methods and apparatus for the dimensional measurement of livestock using a single camera |
| US7128024B2 (en) * | 2003-07-15 | 2006-10-31 | Doyle Ii John Conan | System and method for measuring animals |
| US8565490B2 (en) * | 2004-07-01 | 2013-10-22 | David A. Krien | Computerized imaging of sporting trophies and method of providing a replica |
| US20110028212A1 (en) | 2004-07-01 | 2011-02-03 | David Krien | Computerized Imaging of Sporting Trophies and Method of Providing a Replica |
| US7711151B2 (en) * | 2005-11-14 | 2010-05-04 | Scott Jurk | System and method for determining physical characteristics of an unrestrained animal |
| GB0716333D0 (en) * | 2007-08-22 | 2007-10-03 | White Spark Holdings Ltd | Method and apparatus for the automatic grading of condition of livestock |
| AU2010203357B2 (en) * | 2009-01-10 | 2014-07-10 | Carne Tender, Llc | System and method for analyzing properties of meat using multispectral imaging |
| RU2011139320A (en) * | 2009-02-27 | 2013-04-20 | Боди Серфейс Транслэйшнз, Инк. | EVALUATION OF PHYSICAL PARAMETERS USING THREE-DIMENSIONAL REPRESENTATIONS |
| WO2010127023A1 (en) * | 2009-05-01 | 2010-11-04 | Spicola Tool, Llc | Remote contactless stereoscopic mass estimation system |
| US8369566B2 (en) * | 2009-05-01 | 2013-02-05 | Texas Tech University System | Remote contactless stereoscopic mass estimation system |
| US8755570B2 (en) * | 2011-04-27 | 2014-06-17 | Steve Gomas | Apparatus and method for estimation of livestock weight |
| US9355329B2 (en) | 2011-05-09 | 2016-05-31 | Catherine G. McVey | Image analysis for determining characteristics of pairs of individuals |
| US9098898B2 (en) | 2011-05-09 | 2015-08-04 | Catherine Grace McVey | Image analysis for determining characteristics of individuals |
| WO2012154841A2 (en) * | 2011-05-09 | 2012-11-15 | Mcvey Catherine Grace | Image analysis for determining characteristics of animal and humans |
| US9552637B2 (en) | 2011-05-09 | 2017-01-24 | Catherine G. McVey | Image analysis for determining characteristics of groups of individuals |
| US8588476B1 (en) | 2012-06-04 | 2013-11-19 | Clicrweight, LLC | Systems for determining animal metrics and related devices and methods |
| US9167800B2 (en) | 2012-06-04 | 2015-10-27 | Clicrweight, LLC | Systems for determining animal metrics and related devices and methods |
| NL2011952C2 (en) * | 2013-12-12 | 2015-06-15 | Lely Patent Nv | Method and device to monitor growth of an animal, in particular a calf. |
| RU2714709C2 (en) | 2015-02-27 | 2020-02-19 | Ингенера Са | Improved method and apparatus for determining point value of body condition, live weight and fertility index |
| US10412935B2 (en) | 2015-08-24 | 2019-09-17 | Illinois Tool Works Inc. | Multifunction livestock measurement station |
| US10863724B2 (en) * | 2018-12-11 | 2020-12-15 | Animal Health Analytics, Inc | System and method for tracking and scoring animal health and meat quality |
| US11412705B2 (en) * | 2019-10-24 | 2022-08-16 | Te Pari Products Limited | Animal handling device |
| US10769807B1 (en) * | 2019-11-25 | 2020-09-08 | Pet3D Corp | System, method, and apparatus for clothing a pet |
| WO2022077113A1 (en) | 2020-10-14 | 2022-04-21 | One Cup Productions Ltd. | Animal visual identification, tracking, monitoring and assessment systems and methods thereof |
| CN112837291B (en) * | 2021-02-03 | 2022-07-29 | 中国空气动力研究与发展中心高速空气动力研究所 | Laminar flow wing transition position measurement image processing method based on temperature-sensitive paint technology |
| CN114532242B (en) * | 2022-02-16 | 2023-02-28 | 深圳市元疆科技有限公司 | Experimental box for studying behavior of small animals |
Citations (16)
| Publication number | Priority date | Publication date | Assignee | Title |
|---|---|---|---|---|
| US3762818A (en) * | 1970-02-11 | 1973-10-02 | Lockheed Aircraft Corp | Contour measurement apparatus |
| US3877818A (en) * | 1974-01-28 | 1975-04-15 | Us Agriculture | Photo-optical method for determining fat content in meat |
| US3902811A (en) * | 1973-06-27 | 1975-09-02 | Vsi Corp | Electro-optical scanning system for dimensional gauging of parts |
| US3930991A (en) * | 1974-10-13 | 1976-01-06 | Sortex Company Of North America, Inc. | Meat processing |
| US4089608A (en) * | 1976-10-21 | 1978-05-16 | Hoadley Howard W | Non-contact digital contour generator |
| US4232334A (en) * | 1979-05-22 | 1980-11-04 | Revlon, Inc. | Cosmetic apparatus and method |
| US4413279A (en) * | 1980-12-17 | 1983-11-01 | Pfister Gmbh | Method for contact-free determination of quality features of a test subject of the meat goods class |
| US4745472A (en) * | 1981-03-30 | 1988-05-17 | Applied Genetics International, Inc. | Animal measuring system |
| US4783833A (en) * | 1985-11-27 | 1988-11-08 | Hitachi, Ltd. | Method of extracting an image of a moving object |
| US4788429A (en) * | 1986-04-21 | 1988-11-29 | The Medical College Of Wisconsin, Inc. | Device and method for measuring bone mineral mass |
| US4939574A (en) * | 1987-12-22 | 1990-07-03 | Slagteriernes Forskningsinstitut | Method and apparatus for classifying livestock carcasses and in particular cattle carcasses using a data processing system to determine the properties of the carcass |
| US5134661A (en) * | 1991-03-04 | 1992-07-28 | Reinsch Roger A | Method of capture and analysis of digitized image data |
| US5140988A (en) * | 1991-08-22 | 1992-08-25 | Animal Ultrasound Services, Inc. | Detection of abnormal bone structure in animals and carcasses with ultrasound |
| US5208747A (en) * | 1988-04-07 | 1993-05-04 | John Wilson | Ultrasonic scanning method and apparatus for grading of live animals and animal carcases |
| US5483441A (en) * | 1991-08-30 | 1996-01-09 | Uniform Scanner Data Analysis, Inc. | System for animal evaluation through image acquisition |
| US5576949A (en) * | 1991-08-30 | 1996-11-19 | C-Scan, Llc | System for animal evaluation through image acquisition |
Family Cites Families (1)
| Publication number | Priority date | Publication date | Assignee | Title |
|---|---|---|---|---|
| US5339815A (en) * | 1992-12-22 | 1994-08-23 | Cornell Research Foundation, Inc. | Methods and apparatus for analyzing an ultrasonic image of an animal or carcass |
-
1994
- 1994-06-20 US US08/262,234 patent/US5576949A/en not_active Expired - Lifetime
-
1996
- 1996-05-09 US US08/647,221 patent/US5644643A/en not_active Expired - Lifetime
Patent Citations (16)
| Publication number | Priority date | Publication date | Assignee | Title |
|---|---|---|---|---|
| US3762818A (en) * | 1970-02-11 | 1973-10-02 | Lockheed Aircraft Corp | Contour measurement apparatus |
| US3902811A (en) * | 1973-06-27 | 1975-09-02 | Vsi Corp | Electro-optical scanning system for dimensional gauging of parts |
| US3877818A (en) * | 1974-01-28 | 1975-04-15 | Us Agriculture | Photo-optical method for determining fat content in meat |
| US3930991A (en) * | 1974-10-13 | 1976-01-06 | Sortex Company Of North America, Inc. | Meat processing |
| US4089608A (en) * | 1976-10-21 | 1978-05-16 | Hoadley Howard W | Non-contact digital contour generator |
| US4232334A (en) * | 1979-05-22 | 1980-11-04 | Revlon, Inc. | Cosmetic apparatus and method |
| US4413279A (en) * | 1980-12-17 | 1983-11-01 | Pfister Gmbh | Method for contact-free determination of quality features of a test subject of the meat goods class |
| US4745472A (en) * | 1981-03-30 | 1988-05-17 | Applied Genetics International, Inc. | Animal measuring system |
| US4783833A (en) * | 1985-11-27 | 1988-11-08 | Hitachi, Ltd. | Method of extracting an image of a moving object |
| US4788429A (en) * | 1986-04-21 | 1988-11-29 | The Medical College Of Wisconsin, Inc. | Device and method for measuring bone mineral mass |
| US4939574A (en) * | 1987-12-22 | 1990-07-03 | Slagteriernes Forskningsinstitut | Method and apparatus for classifying livestock carcasses and in particular cattle carcasses using a data processing system to determine the properties of the carcass |
| US5208747A (en) * | 1988-04-07 | 1993-05-04 | John Wilson | Ultrasonic scanning method and apparatus for grading of live animals and animal carcases |
| US5134661A (en) * | 1991-03-04 | 1992-07-28 | Reinsch Roger A | Method of capture and analysis of digitized image data |
| US5140988A (en) * | 1991-08-22 | 1992-08-25 | Animal Ultrasound Services, Inc. | Detection of abnormal bone structure in animals and carcasses with ultrasound |
| US5483441A (en) * | 1991-08-30 | 1996-01-09 | Uniform Scanner Data Analysis, Inc. | System for animal evaluation through image acquisition |
| US5576949A (en) * | 1991-08-30 | 1996-11-19 | C-Scan, Llc | System for animal evaluation through image acquisition |
Cited By (42)
| Publication number | Priority date | Publication date | Assignee | Title |
|---|---|---|---|---|
| US5809133A (en) * | 1996-05-24 | 1998-09-15 | Advanced Micro Devices, Inc. | DTMF detector system and method which performs frequency domain energy calculations with improved performance |
| US5996529A (en) * | 1998-01-13 | 1999-12-07 | Dairy Creations, Inc. | Milk metering and cow ID system |
| US6710800B1 (en) * | 1998-04-22 | 2004-03-23 | Time & Space Tech. Co., Ltd. | Displaying system capable of internet communication and control method thereof |
| US20020037092A1 (en) * | 2000-07-19 | 2002-03-28 | Craig Monique F. | Method and system for analyzing animal digit conformation |
| US7088847B2 (en) * | 2000-07-19 | 2006-08-08 | Craig Monique F | Method and system for analyzing animal digit conformation |
| US20020065765A1 (en) * | 2000-07-20 | 2002-05-30 | Agspan, Inc. | Systems and methods for interactive beef cattle marketplace |
| US7028638B2 (en) * | 2000-11-20 | 2006-04-18 | Bonsall Sandie W | Animal transportation and tracking system |
| US20040123811A1 (en) * | 2000-11-20 | 2004-07-01 | Bonsall Sandie W. | Animal transportation and tracking system |
| WO2003006919A2 (en) * | 2001-07-13 | 2003-01-23 | Rms Research Management Systems, Usa, Inc. | System and method for obtaining animal and carcass measurements |
| WO2003006919A3 (en) * | 2001-07-13 | 2003-12-04 | Rms Res Man Systems Usa Inc | System and method for obtaining animal and carcass measurements |
| US6625302B2 (en) * | 2001-07-13 | 2003-09-23 | Rms Research Management Systems Usa, Inc. | System and method for obtaining animal and carcass measurements |
| US6837189B2 (en) * | 2001-09-28 | 2005-01-04 | Schick Paul H | Hog facility management system and method |
| US6526919B1 (en) * | 2001-09-28 | 2003-03-04 | Paul Schick | Self-sorting hog facility and method |
| EP1625789A3 (en) * | 2002-03-11 | 2006-03-15 | Lely Enterprises AG | A device and an assembly for an animal related action |
| US20040073097A1 (en) * | 2002-07-18 | 2004-04-15 | Arne Hengerer | Method and device for substantially restricting the freedom of movement of a living being and examining the living being and use thereof for optical imaging |
| EP1382312A1 (en) * | 2002-07-18 | 2004-01-21 | Siemens Aktiengesellschaft | Process and device to immobilize and examine living creatures and use of the same for imaging |
| US7214128B2 (en) * | 2002-08-02 | 2007-05-08 | Geissler Technologies, Llc | Apparatus and methods for the volumetric and dimensional measurement of livestock |
| US20050136819A1 (en) * | 2002-08-02 | 2005-06-23 | Kriesel Marshall S. | Apparatus and methods for the volumetric and dimensional measurement of livestock |
| US6974373B2 (en) | 2002-08-02 | 2005-12-13 | Geissler Technologies, Llc | Apparatus and methods for the volumetric and dimensional measurement of livestock |
| EP1396188A3 (en) * | 2002-08-26 | 2005-10-26 | Hölscher & Leuschner GmbH & Co. | Method for monitoring pigs |
| EP1396188A2 (en) * | 2002-08-26 | 2004-03-10 | Hölscher & Leuschner GmbH & Co. | Method for monitoring pigs |
| US20060048720A1 (en) * | 2002-12-03 | 2006-03-09 | Yasuhiro Kajihara | Apparatus for detecting animals |
| US20070209594A1 (en) * | 2003-11-07 | 2007-09-13 | Peter Kaever | Method and Device for Providing Information on the Occupancy of Milking Stations of a Milking System |
| US7721675B2 (en) * | 2003-11-07 | 2010-05-25 | Gea Farm Technologies Gmbh | Method for providing information on the occupancy of milking stations of a milking system |
| US20060029289A1 (en) * | 2004-08-05 | 2006-02-09 | Kabushiki Kaisha Toshiba | Information processing apparatus and method for detecting scene change |
| EP1854054A2 (en) * | 2004-11-29 | 2007-11-14 | Cargill, Incorporated | Animal management system |
| EP1854054A4 (en) * | 2004-11-29 | 2009-11-11 | Cargill Inc | Animal management system |
| US7444961B1 (en) | 2005-04-11 | 2008-11-04 | Ellis James S | Animal sorting and grading system using an internal evaluation to predict maximum value |
| WO2007107987A2 (en) * | 2006-03-21 | 2007-09-27 | S.A.E. Afikim - Computerized Dairy Management Systems | A method and a system for measuring an animal's height |
| WO2007107987A3 (en) * | 2006-03-21 | 2009-04-09 | E Afikim Computerized Dairy Ma | A method and a system for measuring an animal's height |
| US20080202444A1 (en) * | 2007-01-17 | 2008-08-28 | Jerome Albin Stenzel | Method and system for weighing confined livestock, such as penned pigs |
| US9311556B2 (en) * | 2010-05-19 | 2016-04-12 | Plf Agritech Pty Ltd | Image analysis for making animal measurements including 3-D image analysis |
| US20130064432A1 (en) * | 2010-05-19 | 2013-03-14 | Thomas Banhazi | Image analysis for making animal measurements |
| US9142028B2 (en) * | 2010-05-19 | 2015-09-22 | Plf Agritech Pty Ltd | Image analysis for making animal measurements |
| WO2012040782A1 (en) * | 2010-09-29 | 2012-04-05 | John Conan Doyle | A system and method for measuring relative leg positions of an ungulate |
| US9363983B2 (en) | 2010-09-29 | 2016-06-14 | John Conan Doyle | System and method for measuring relative leg positions of an ungulate |
| US20150320535A1 (en) * | 2013-01-25 | 2015-11-12 | Precision Pastoral Pty Ltd | Methods For Estimating Birthing Data for an Animal |
| US9839502B2 (en) * | 2013-01-25 | 2017-12-12 | Precision Pastoral Pty Ltd | Methods for estimating birthing data for an animal |
| US20190090459A1 (en) * | 2017-08-16 | 2019-03-28 | Adams Land & Cattle Co. | Livestock Sorting Facility |
| US11324203B2 (en) * | 2017-08-16 | 2022-05-10 | Adams Land & Cattle Co. | Livestock sorting facility |
| US11819008B2 (en) | 2017-08-16 | 2023-11-21 | Adams Land & Cattle Co. | Livestock sorting facility |
| US20220217950A1 (en) * | 2019-05-10 | 2022-07-14 | Lely Patent N.V. | Ruminant animal monitoring system |
Also Published As
| Publication number | Publication date |
|---|---|
| US5576949A (en) | 1996-11-19 |
Similar Documents
| Publication | Publication Date | Title |
|---|---|---|
| US5644643A (en) | Chute for use with an animal evaluation system | |
| US5483441A (en) | System for animal evaluation through image acquisition | |
| US4745472A (en) | Animal measuring system | |
| US7853046B2 (en) | Imaging system and method for body condition evaluation | |
| Song et al. | Automated body weight prediction of dairy cows using 3-dimensional vision | |
| Bewley et al. | Potential for estimation of body condition scores in dairy cattle from digital images | |
| US8971586B2 (en) | Apparatus and method for estimation of livestock weight | |
| US6549289B1 (en) | Three-dimensional measuring system for animals using light pattern triangulation | |
| Condotta et al. | Evaluation of a depth sensor for mass estimation of growing and finishing pigs | |
| US7128024B2 (en) | System and method for measuring animals | |
| Schofield | Evaluation of image analysis as a means of estimating the weight of pigs | |
| EP2027770B1 (en) | Method and apparatus for the automatic grading of condition of livestock | |
| Wang et al. | ASAS-NANP SYMPOSIUM: Applications of machine learning for livestock body weight prediction from digital images | |
| US20100224140A1 (en) | Method and a System for Measuring an Animal's Height | |
| JPH10500207A (en) | Animal three-dimensional phenotype measurement device | |
| Van Hertem et al. | Comparison of segmentation algorithms for cow contour extraction from natural barn background in side view images | |
| CN110693499B (en) | System and method for detecting animal body ruler and weight | |
| Yu et al. | Forecasting dynamic body weight of nonrestrained pigs from images using an RGB-D sensor camera | |
| Wang et al. | A review of three-dimensional computer vision used in precision livestock farming for cattle growth management | |
| Shelley | Incorporating machine vision in precision dairy farming technologies | |
| Franchi et al. | Estimating body weight in conventional growing pigs using a depth camera | |
| Weales et al. | A robust machine vision system for body measurements of beef calves | |
| Minagawa et al. | A hands-off method to estimate pig weight by light projection and image analysis | |
| Zehender et al. | Image analysis in morphological animal evaluation: a group for the development of new techniques in zoometry | |
| Frost et al. | The development and evaluation of image analysis procedures for guiding a livestock monitoring sensor placement robot |
Legal Events
| Date | Code | Title | Description |
|---|---|---|---|
| STCF | Information on status: patent grant |
Free format text: PATENTED CASE |
|
| CC | Certificate of correction | ||
| FEPP | Fee payment procedure |
Free format text: PAYOR NUMBER ASSIGNED (ORIGINAL EVENT CODE: ASPN); ENTITY STATUS OF PATENT OWNER: LARGE ENTITY |
|
| REMI | Maintenance fee reminder mailed | ||
| FPAY | Fee payment |
Year of fee payment: 4 |
|
| SULP | Surcharge for late payment | ||
| AS | Assignment |
Owner name: BANK OF AMERICA, N.A., CALIFORNIA Free format text: SECURITY AGREEMENT;ASSIGNOR:MICRO BEEF TECHNOLOGIES, LTD.;REEL/FRAME:013691/0619 Effective date: 20030110 |
|
| FPAY | Fee payment |
Year of fee payment: 8 |
|
| FEPP | Fee payment procedure |
Free format text: PAT HOLDER NO LONGER CLAIMS SMALL ENTITY STATUS, ENTITY STATUS SET TO UNDISCOUNTED (ORIGINAL EVENT CODE: STOL); ENTITY STATUS OF PATENT OWNER: LARGE ENTITY |
|
| AS | Assignment |
Owner name: GEISSLER TECHNOLOGIES, LLC, A MINNESOTA LIMITED LI Free format text: ASSIGNMENT OF ASSIGNORS INTEREST;ASSIGNOR:C-SCAN, LLC, A MINNESOTA LIMITED LIABILITY COMPANY;REEL/FRAME:020468/0694 Effective date: 20071119 |
|
| AS | Assignment |
Owner name: GEISSLER TECHNOLOGIES CORPORATION, A MINNESOTA COR Free format text: CHANGE OF NAME;ASSIGNOR:GEISSLER TECHNOLOGIES, LLC, A MINNESOTA LIMITED LIABILITY COMPANY;REEL/FRAME:020497/0502 Effective date: 20071120 |
|
| AS | Assignment |
Owner name: GT ACQUISITION SUB, INC., A MINNESOTA CORPORATION, Free format text: ASSIGNMENT OF ASSIGNORS INTEREST;ASSIGNOR:GEISSLER TECHNOLOGIES CORPORATION, A MINNESOTA CORPORATION;REEL/FRAME:020525/0972 Effective date: 20080115 |
|
| AS | Assignment |
Owner name: KALLINA CORPORATION, NEW YORK Free format text: JOINDER AGREEMENT;ASSIGNOR:GT ACQUISITION SUB, INC.;REEL/FRAME:020617/0368 Effective date: 20080114 |
|
| AS | Assignment |
Owner name: KALLINA CORPORATION, NEW YORK Free format text: CORRECTIVE ASSIGNMENT TO CORRECT THE NATURE OF CONVEYANCE PREVIOUSLY RECORDED ON REEL 020617 FRAME 0368;ASSIGNOR:GT ACQUISITION SUB, INC.;REEL/FRAME:020704/0777 Effective date: 20080114 |
|
| AS | Assignment |
Owner name: DESTRON FEARING CORPORATION, MINNESOTA Free format text: CHANGE OF NAME;ASSIGNOR:DIGITAL ANGEL CORPORATION;REEL/FRAME:021348/0436 Effective date: 20080506 |
|
| FPAY | Fee payment |
Year of fee payment: 12 |
|
| AS | Assignment |
Owner name: TCI BUSINESS CAPITAL, INC., MINNESOTA Free format text: SECURITY AGREEMENT;ASSIGNORS:DESTRON FEARING CORPORATION;DIGITAL ANGEL CORPORATION;DIGITAL ANGEL TECHNOLOGY CORPORATION;AND OTHERS;REEL/FRAME:024933/0139 Effective date: 20100831 |
|
| AS | Assignment |
Owner name: FEARING MANUFACTURING CO., INC., MINNESOTA Free format text: RELEASE BY SECURED PARTY;ASSIGNOR:TCI BUSINESS CAPITAL, INC.;REEL/FRAME:026648/0034 Effective date: 20110725 Owner name: DESTRON FEARING CORPORATION, MINNESOTA Free format text: RELEASE BY SECURED PARTY;ASSIGNOR:TCI BUSINESS CAPITAL, INC.;REEL/FRAME:026648/0034 Effective date: 20110725 Owner name: DIGITAL ANGEL CORPORATION, FLORIDA Free format text: RELEASE BY SECURED PARTY;ASSIGNOR:TCI BUSINESS CAPITAL, INC.;REEL/FRAME:026648/0034 Effective date: 20110725 Owner name: DIGITAL ANGEL TECHNOLOGY CORPORATION, MINNESOTA Free format text: RELEASE BY SECURED PARTY;ASSIGNOR:TCI BUSINESS CAPITAL, INC.;REEL/FRAME:026648/0034 Effective date: 20110725 Owner name: GT ACQUISITION SUB, INC., MINNESOTA Free format text: RELEASE BY SECURED PARTY;ASSIGNOR:TCI BUSINESS CAPITAL, INC.;REEL/FRAME:026648/0034 Effective date: 20110725 |
|
| AS | Assignment |
Owner name: MORGAN STANLEY SENIOR FUNDING, INC., AS COLLATERAL Free format text: FIRST LIEN SECURITY AGREEMENT;ASSIGNORS:ALLFLEX USA, INC.;DESTRON FEARING CORPORATION;REEL/FRAME:030825/0310 Effective date: 20130717 |
|
| AS | Assignment |
Owner name: BANK OF AMERICA, N.A., AS COLLATERAL AGENT, TEXAS Free format text: SECOND LIEN SECURITY AGREEMENT;ASSIGNORS:ALLFLEX USA, INC.;DESTRON FEARING CORPORATION;REEL/FRAME:030833/0469 Effective date: 20130717 |
|
| AS | Assignment |
Owner name: GT ACQUISITION SUB, INC., MINNESOTA Free format text: RELEASE (REEL 030833 / FRAME 0469);ASSIGNOR:BANK OF AMERICA, N.A.;REEL/FRAME:048762/0555 Effective date: 20190401 Owner name: ALLFLEX, USA, INC., TEXAS Free format text: RELEASE (REEL 030833 / FRAME 0469);ASSIGNOR:BANK OF AMERICA, N.A.;REEL/FRAME:048762/0555 Effective date: 20190401 Owner name: DESTRON FEARING CORPORATION, TEXAS Free format text: RELEASE (REEL 030833 / FRAME 0469);ASSIGNOR:BANK OF AMERICA, N.A.;REEL/FRAME:048762/0555 Effective date: 20190401 Owner name: DIGITAL ANGEL CORPORATION, MINNESOTA Free format text: RELEASE (REEL 030833 / FRAME 0469);ASSIGNOR:BANK OF AMERICA, N.A.;REEL/FRAME:048762/0555 Effective date: 20190401 Owner name: ALLFLEX, USA, INC., TEXAS Free format text: RELEASE (REEL 030825 / FRAME 0310);ASSIGNOR:MORGAN STANLEY SENIOR FUNDING, INC.;REEL/FRAME:049126/0851 Effective date: 20190401 Owner name: DIGITAL ANGEL CORPORATION, MINNESOTA Free format text: RELEASE (REEL 030825 / FRAME 0310);ASSIGNOR:MORGAN STANLEY SENIOR FUNDING, INC.;REEL/FRAME:049126/0851 Effective date: 20190401 Owner name: GT ACQUISITION SUB, INC., MINNESOTA Free format text: RELEASE (REEL 030825 / FRAME 0310);ASSIGNOR:MORGAN STANLEY SENIOR FUNDING, INC.;REEL/FRAME:049126/0851 Effective date: 20190401 Owner name: DESTRON FEARING CORPORATION, TEXAS Free format text: RELEASE (REEL 030825 / FRAME 0310);ASSIGNOR:MORGAN STANLEY SENIOR FUNDING, INC.;REEL/FRAME:049126/0851 Effective date: 20190401 |