US6477471B1 - Product defect predictive engine - Google Patents
Product defect predictive engine Download PDFInfo
- Publication number
- US6477471B1 US6477471B1 US08/741,494 US74149496A US6477471B1 US 6477471 B1 US6477471 B1 US 6477471B1 US 74149496 A US74149496 A US 74149496A US 6477471 B1 US6477471 B1 US 6477471B1
- Authority
- US
- United States
- Prior art keywords
- defects
- different stages
- electrical signals
- software
- current
- Prior art date
- Legal status (The legal status is an assumption and is not a legal conclusion. Google has not performed a legal analysis and makes no representation as to the accuracy of the status listed.)
- Expired - Fee Related, expires
Links
Images


Classifications
-
- G—PHYSICS
- G06—COMPUTING; CALCULATING OR COUNTING
- G06F—ELECTRIC DIGITAL DATA PROCESSING
- G06F11/00—Error detection; Error correction; Monitoring
- G06F11/36—Preventing errors by testing or debugging software
- G06F11/3604—Software analysis for verifying properties of programs
- G06F11/3616—Software analysis for verifying properties of programs using software metrics
-
- G—PHYSICS
- G06—COMPUTING; CALCULATING OR COUNTING
- G06Q—INFORMATION AND COMMUNICATION TECHNOLOGY [ICT] SPECIALLY ADAPTED FOR ADMINISTRATIVE, COMMERCIAL, FINANCIAL, MANAGERIAL OR SUPERVISORY PURPOSES; SYSTEMS OR METHODS SPECIALLY ADAPTED FOR ADMINISTRATIVE, COMMERCIAL, FINANCIAL, MANAGERIAL OR SUPERVISORY PURPOSES, NOT OTHERWISE PROVIDED FOR
- G06Q10/00—Administration; Management
Definitions
- This invention is related to a method and apparatus for predicting product defects.
- Texas Instruments Incorporated Defense Systems and Electronics Group (DSEG), a 1992 Malcolm Baldrige Quality Award Winner, has developed both the technology and deployment infrastructure for a quality initiative named Six Sigma. Aimed at measuring and reducing variation in a product or service, this technology has allowed many Texas Instruments disciplines, including software development, to quantify progress towards zero defects. Six Sigma originated with a concept that variation in a product or service is the culprit behind defects. Consequently, one can begin with customer requirements and identify units of product or service in which opportunities for defects and actual defects are itemized. Through simple computations, a sigma level of performance may be identified. Higher sigma values represent higher quality levels. Six Sigma performance is equivalent to no more than 3.4 defects per million opportunities. But why do we care about Six Sigma?
- DPU defects per unit
- opportunity count source lines of delivered software
- the number of defects per million opportunities may be converted into a Sigma level via use of a conversion chart as shown in FIG. 1 .
- changes in the DPMO levels are not linearly proportional to the Sigma levels.
- Sigma measures support benchmarking of quality levels.
- RA requirement stage
- PD preliminary design stage
- DD design detail stage
- I&T integrating and testing stage
- a method and statistical tool apparatus for predicting defects in products includes the step of providing historical data of defects at different stages of development and a value representing a goal for escaping defects. Also provided is the planned total number of opportunities for defects. The goal for number of escaping defects and planed number of opportunities for defects are backsolved to determine the total number of defects. The total defects are distributed as a function of the historical data to provide prediction of defects at the different stages of development.
- the apparatus comprises a processor, a memory, a keyboard, a drive for loading a software package and a display.
- the processor is loaded with a program for storing historical data indicating the historical pattern of defect containment in the stages of development.
- the processor has stored therein algorithms for computing sigma values based on opportunities and escaping defects in the stages and including an algorithm for backsolving from historical data.
- FIG. 1 is a conversion chart of DPMO to Sigma
- FIG. 2 is a diagram of the personal computer used for the engine according one embodiment of the present invention.
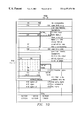
- FIG. 3 is a system diagram according to one embodiment of the present invention.
- FIG. 4 is a flow chart of the operation according to one embodiment of the present invention.
- FIG. 5 illustrates defect flow analysis
- FIG. 6 illustrates the historical sheet
- FIG. 7 illustrates the current sheet
- FIG. 8 illustrates a summary sheet
- FIG. 9 illustrates a current sheet with equations embedded therein.
- the Software Sigma process according to the present invention stresses defect prevention, monitoring of defect levels, causal analysis for process improvement, and the sigma metric to predict, early in the development cycle, the level of escaping defect delivered with the product.
- a unique aspect of the statistical model we construct to predict escaping defects is the use of project defect phase containment data in a dual manner. As historical data, phase containment data, converted to conditional probabilities, is used to model the current state of a projects software process's effectiveness to prevent and capture defects. During the development phase, actual phase containment data is captured and utilized to make the prediction of escaping defects from the finished product.
- Variation in performance of a quality attribute causes defects.
- Performance of a quality attribute is often assumed to follow a normal distribution (bell shape curve) which is centered on a given mean (average) value.
- the potential for defects arises when the tails of the performance curve fall outside given specification limits.
- Adapted to software there is no assumption made about distribution normality. In fact, distributions of interest appear to follow Poisson or Weibull distributions.
- a software sigma predictive engine for predicting defects in software.
- the engine comprises, for example, a personal computer (PC) 19 with a processor 11 , a storage unit 13 (such as a disk drive), a monitor 15 , and input device such as a keyboard 17 and mouse 17 a as shown in FIG. 2 .
- the processor is loaded with a software spreadsheet program such as Microsoft Excel 5.0.
- the operation is implemented as a workbook in three sheets.
- the user enters data in two sheets, the historical sheet 21 and the current sheet 23 . See diagram in FIG. 3.
- a third sheet 27 the summary sheet, automatically summarizes the decisions made, actual observed defects, the predicted number of escaping defects, and statistical confidence intervals qualifying the “goodness” of the prediction.
- There is also a fourth sheet or page which contains the original computer program to calculate the Poisson probabilities.
- step A historical defect containment data is entered (step A) in the cells of Excel 5.0 as a workbook in the historical sheet as a stage defect containment matrix.
- the user enters historical defect containment data for the various stages of design in a defect containment matrix at cell locations. This is arrived at from previous designs and detections of defects at these stages.
- Step B Based on estimated efficiency of detection of defects entered (Step B), the inspection efficiencies are calculated and copied to the second sheet or page called the current sheet 27 .
- the estimated overall efficiency of the process to detect DPU of each type over all stages is entered.
- the number of software lines of code (SLOC) is entered on the current workbook sheet 23 (step C) and the goal sigma value is entered on the current workbook sheet 23 (step D).
- Each SLOC represents a defect opportunity.
- the initial distribution of these defects is calculated using probability P ij (step E) of a defect in ith step of being detected and removed in jth step.
- the upper bounds for initial defect spread is calculated (step F) and the lower bounds for initial defect spread is calculated (step G).
- the defect spread is copied down to the actual locations in the current sheet (step H).
- the confidence interval is then calculated (step I).
- the statistical model used views the number of defects generated in each stage as Poisson random variables which are independent between the different stages of the development process. These random numbers of defects are then subjected to the random process of defect detection and the resulting number of detected, and undetected, defects are random variables whose distributions remain Poisson.
- the total number of detected defects, as well as the total number of escaping defects, then can be represented as the sum of independent Poisson random variables and it is this that makes it possible to develop an unbiased estimator for the mean number of escaping defects.
- An estimate of the variance of the estimator, along with the asymptotic normality of its distribution, allows for the calculation of an approximate statistical confidence interval for the mean number of escaping defects, as well as an approximate prediction interval for the actual number of escaping defects.
- step J The initial prediction is up-dated (step J) with actual data until all actuals have been entered (step K). As the design progresses and actual defects are measured the actual defects are compared to the error bounds to determine if there is consistency between the data and the model and to see if the sigma goal will be reached.
- FIG. 5 indicates the defect data flow model used to estimate the number of escaping defects for a typical software product.
- Some of the final defects from the requirements (RA) escape through the preliminary design, the detailed design, the coding and integration and test.
- some uncorrected defects in the preliminary design (second line) escape and pass on to detailed design, through the coding, and through integration and test.
- Some defects at the detailed design escape through coding and integration and test.
- Some coding errors escape through integration and test.
- the total escaped defects per million opportunities is the defects per million opportunities (DPMO) which is converted to the Sigma level.
- the historical sheet shown in FIG. 6 is the primary location for loading historical data to prime the pump in preparation for the collection of actual defect data during the project.
- the primary software sigma measure is defects per unit (DPU).
- DPU defects per unit
- opportunities and a chance for non-conformance we are providing a measure of complexity that allows us to compare products of different size.
- the use of opportunities as a common denominator to compute defects per million opportunities (dpmo) is a way to normalize the different sizes between both intermediate and final product.
- Enter in cells C 4 :G 8 of Excel 5.0 historical workbook sheet the defects for each stage observed from historical data or best engineering judgement. This data represents the pattern of defects detected across the project phases. For example the defects originated at requirements stage RA and detected at RA is 30 .
- the percentages listed represent derating of perfect capture which the conditional probabilities would suggest. In fact, the conditional probabilities are adjusted by the estimated efficiency percentages to indicate that our observations are not 100% efficient. These multipliers may be estimated for programs with complete data, but without that one must use best engineering judgement.
- the spreadsheet shown in FIG. 6 has these values preset at 95% for requirements DPU, 94% for preliminary design defects, 93% for detailed design defects, 92% for code and unit test and 90% for integration and test. Screening effectiveness percentages are conditional probabilities estimated from historical stage containment data and may be revised.
- the initial values in the current sheet allow the developer to model his environment and the effect in terms of DPU for given values of screen effectiveness and assumed sigma for the product.
- the screen detection probabilities may be increased by improving the screens ability to detect both in-stage and out-of-stage DPU. The process is improved by finding most DPU in early stages of development.
- the product name, delivered SLOC (Software Lines of Code) and goal sigma are entered at E 4 and E 5 in the shaded blocks at the top of the current sheet illustrated in FIG. 7 .
- the goal sigma may be based upon Fault Density Data of similar products or be the development goal the project expects to attain.
- the DPU count by percentage in the historical sheet based on defects observed are computed and copied to in the current sheet. These percentages are used to spread the DPU in the following cells with planning DPU spread by stage. The percentages may be adjusted to reflect engineering judgement if required.
- the engine uses the percent spread, knowledge of the goal sigma of E 5 , the delivered SLOC E 4 and the probabilities of detection, the engine back calculates the DPU needed in each phase to reach the sigma goal. These DPU are copied to the cells (C 51 , G 55 ) called “defects observed” where actuals will overwrite these estimates as they are received. Note that the number of DPU passed to the next phase and the number generated (greater than observed) are also indicated below these cells. First the total DPU are calculated from the sigma value and SLOC and then based on percentage in C 10 :G 14 . The initial values in C 51 :G 55 are entered. This predictive framework is based on assumptions.
- step i L i defects are introduced.
- L i has a Poisson distribution with mean ⁇ i and that L i and L j are independent for i ⁇ j.
- a defect introduced in the ith step has a probability P ij of being detected and removed in the jth step, j ⁇ i, and that the detection of defects forms a Bernoulli process and the detection of one defect is independent of the detection of other defects.
- the number of step i defects detected (and removed) in the jth step is given by K ij and has a Poisson distribution with mean (1 ⁇ P ii )(1 ⁇ P ii+1 ) . . . (1 ⁇ P ij ⁇ 1 ) P ij ⁇ i .
- K ij are all independent.
- the total number of defects detected in each stage, the total number of detected defects introduced at each stage, and the total number of escaping defects all have Poisson distributions.
- L i * has Poisson distribution.
- the K i. also form a sufficient statistic for estimating the ⁇ i , and hence the ⁇ i * and ⁇ *.
- MLE maximum likelihood estimators
- ⁇ circumflex over ( ⁇ ) ⁇ * is also an unbiased estimator of ⁇ * with variance given by.
- a 1 (1 ⁇ P 11 )(1 ⁇ P 12 )(1 ⁇ P 13 )(1 ⁇ P 14 )(1 ⁇ P 15 )
- a 3 (1 ⁇ P 33 )(1 ⁇ P 34 )(1 ⁇ P 35 )
- ⁇ * a 1 ⁇ 1 +a 2 ⁇ 2 +a 3 ⁇ 3 +a 4 ⁇ 4 +a 5 ⁇ 5
- the block of cells C 31 :G 35 are the upper limits and these are calculated based upon Poisson probability tails.
- the numbers represent upper bounds for actual DPU counts entered in the defects observed block or cells.
- the probability that one of the actual DPU values is greater than the corresponding upper bound cell, given our historical assumptions, is at most Alpha_U. In other words, there is at most an Alpha_U ⁇ 100% chance that an actual number of defects will exceed the corresponding upper limit, given true historical assumptions. If several actuals, say n, exceed their corresponding upper bounds, then there is at most an (Alpha_U) n ⁇ 100% chance that the historical assumptions are correct. To reject the historical assumptions there are two alternatives hypothesis:
- the DPU may exceed expected results due to superior process which is finding more DPU.
- the block of cells C 41 :G 45 are lower limits are calculated based upon Poisson probability tails.
- the numbers represent lower bounds for actual DPU counts entered in the defects observed block of cells.
- the DPU may be less than expected due to an inferior inspection process which is finding fewer defects than expected.
- the process is more effective than expected at preventing defects from occurring in the process, resulting in fewer defects to be found. Only experienced engineering judgement can determine the correct conclusion.
- the block of cells C 51 :G 55 is initialized to the planning DPU spread by stage. As actual DPU data is collected by the project, it is entered to overwrite this data. Finally, the data contains only actual data and based upon actual data observed, the sigma of escaping DPU is calculated.
- the confidence level E 58 represents the probability that the true values of DPU, dmpo, and sigma in the corresponding cells are within the upper and lower bounds indicated.
- the sigma interval labeled in this program represents a confidence interval predicting the sigma for escaping DPU based upon this programs actual data.
- the interval labeled average represents a confidence interval based upon repeating the experiment of collecting actuals multiple times for this program.
- the estimator can be used to generate an approximate confidence interval for the mean number of escaping defects, as well as an approximate prediction interval for the actual number of escaping defects.
- the first block of cells in the Summary page as illustrated in FIG. 8 reminds the reviewer of the historical stage containment data which has been used to model process effectiveness at defect observation.
- the second block of cells represents the data set of actual stage containment DPU for the current project. This data resulted from overwriting the planning DPU spread on the current sheet into the defects observed block.
- the confidence level set on the current page is copied to the summary page. It represents the probability that the true values of DPU, dpmo, and sigma in the corresponding cells are within the upper and lower bounds indicated.
- the sigma interval labeled in this program represents a confidence interval predicting the sigma for escaping DPU based upon this programs actual data.
- the interval labeled average represents a confidence interval for the long-term average DPU level for all projects with the same defect generation and inspection characteristics.
- FIG. 9 there is illustrated a current sheet with equations behind the cells.
- Cells C 81 :G 86 calculate the total defects.
- the Poisson upper limits are cells C 31 :G 35 .
- the Poisson lower limits are in cells C 41 :G 45 .
Abstract
A software predictive engine is described that provides a tool to analyze the import of defects in the software development process. By providing a prediction of escaping defects, in terms of the normalized sigma measure and the predicted lines of code, together with historical data the impact of defects at the stages of the design can be predicted. As actual defects are measured predicted sigma level can also be predicted. The engine includes generating a defect containment matrix for the historical data and for the current software program being developed.
Description
This application claims priority under 35 USC §119(e)(1) of provisional application No. 60/008,116, filed Oct. 30, 1995.
Copyright© 1994 Texas Instruments Incorporated
A portion of the disclosure of this patent document contains material which is subject to copyright protection. The copyright owner has no objection to the facsimile reproduction by anyone of the patent document or the patent disclosure, as it appears in the United States Patent and Trademark Office patent file or records, but otherwise reserves all copyright rights whatsoever.
This invention is related to a method and apparatus for predicting product defects.
Texas Instruments Incorporated Defense Systems and Electronics Group (DSEG), a 1992 Malcolm Baldrige Quality Award Winner, has developed both the technology and deployment infrastructure for a quality initiative named Six Sigma. Aimed at measuring and reducing variation in a product or service, this technology has allowed many Texas Instruments disciplines, including software development, to quantify progress towards zero defects. Six Sigma originated with a concept that variation in a product or service is the culprit behind defects. Consequently, one can begin with customer requirements and identify units of product or service in which opportunities for defects and actual defects are itemized. Through simple computations, a sigma level of performance may be identified. Higher sigma values represent higher quality levels. Six Sigma performance is equivalent to no more than 3.4 defects per million opportunities. But why do we care about Six Sigma? In terms of cost of quality, a Four Sigma organization cannot compete with a Six Sigma organization A Four Sigma organization will spend as much as 25% of each sales dollar on cost of non-conformance while a Six Sigma organization will spend less than 1%. Organizations performing at Four Sigma will spend 25 times more dollars on rework, etc. than a Six Sigma organization will. Additionally, Six Sigma analysis supports defect causal analysis, prevention and prediction. It has been incorporated into our process improvement program and is part of a widespread training program for all employees of Texas Instruments DSEG. Over the past 5 years, we believe that this technology contributed to our 10X improvement in software fault density. Six Sigma measurement begins with the customers and their requirements. Defect categories may then be identified along with units of product or service. From this framework, defects per unit, opportunities for defects, defects per million opportunities and sigma levels may be computed. Defects per million opportunities (DPMO) may be computed by simply dividing the defects per unit (DPU) by the opportunity count (source lines of delivered software) and then multiplying by 1 million.
The number of defects per million opportunities (DPMO) may be converted into a Sigma level via use of a conversion chart as shown in FIG. 1. Note that changes in the DPMO levels are not linearly proportional to the Sigma levels. Thus, for an organization of higher levels of sigma performance, smaller amounts of DPMO improvement are needed to achieve the same sigma improvement as that of an organization at a lower level of sigma performance. Sigma measures support benchmarking of quality levels.
In the development of software there are generally at least five stages—the first being the requirement stage (RA); the second being the preliminary design stage (PD); the third being the design detail stage (DD); the fourth being the coding stage (CUT), and the fifth being the integrating and testing stage (I&T). Defects in software development activity represent rework, resulting in increased cost and cycle times.
While it is known to make estimates of escaping defects mode during a latter phase of integration and test using Weibull curve fittings, there is no known solution for long range prediction of the number of escaping defects.
In accordance with one preferred embodiment of a present invention, there is provided a method and statistical tool apparatus for predicting defects in products. The method according to one embodiment includes the step of providing historical data of defects at different stages of development and a value representing a goal for escaping defects. Also provided is the planned total number of opportunities for defects. The goal for number of escaping defects and planed number of opportunities for defects are backsolved to determine the total number of defects. The total defects are distributed as a function of the historical data to provide prediction of defects at the different stages of development.
The apparatus according to one preferred embodiment of the present invention comprises a processor, a memory, a keyboard, a drive for loading a software package and a display. The processor is loaded with a program for storing historical data indicating the historical pattern of defect containment in the stages of development. The processor has stored therein algorithms for computing sigma values based on opportunities and escaping defects in the stages and including an algorithm for backsolving from historical data.
These and other features of the invention will be apparent to those skilled in the art from the following detailed description of the invention, taken together with the accompanying drawings.
FIG. 1 is a conversion chart of DPMO to Sigma;
FIG. 2 is a diagram of the personal computer used for the engine according one embodiment of the present invention;
FIG. 3 is a system diagram according to one embodiment of the present invention;
FIG. 4 is a flow chart of the operation according to one embodiment of the present invention;
FIG. 5 illustrates defect flow analysis;
FIG. 6 illustrates the historical sheet;
FIG. 7 illustrates the current sheet;
FIG. 8 illustrates a summary sheet; and
FIG. 9 illustrates a current sheet with equations embedded therein.
The Software Sigma process according to the present invention stresses defect prevention, monitoring of defect levels, causal analysis for process improvement, and the sigma metric to predict, early in the development cycle, the level of escaping defect delivered with the product. A unique aspect of the statistical model we construct to predict escaping defects is the use of project defect phase containment data in a dual manner. As historical data, phase containment data, converted to conditional probabilities, is used to model the current state of a projects software process's effectiveness to prevent and capture defects. During the development phase, actual phase containment data is captured and utilized to make the prediction of escaping defects from the finished product.
Variation in performance of a quality attribute causes defects. Performance of a quality attribute is often assumed to follow a normal distribution (bell shape curve) which is centered on a given mean (average) value. The potential for defects arises when the tails of the performance curve fall outside given specification limits. Adapted to software, there is no assumption made about distribution normality. In fact, distributions of interest appear to follow Poisson or Weibull distributions.
In accordance with one embodiment of the present invention, a software sigma predictive engine is provided for predicting defects in software. The engine comprises, for example, a personal computer (PC) 19 with a processor 11, a storage unit 13 (such as a disk drive), a monitor 15, and input device such as a keyboard 17 and mouse 17 a as shown in FIG. 2. The processor is loaded with a software spreadsheet program such as Microsoft Excel 5.0. The operation is implemented as a workbook in three sheets. The user enters data in two sheets, the historical sheet 21 and the current sheet 23. See diagram in FIG. 3. A third sheet 27, the summary sheet, automatically summarizes the decisions made, actual observed defects, the predicted number of escaping defects, and statistical confidence intervals qualifying the “goodness” of the prediction. There is also a fourth sheet or page which contains the original computer program to calculate the Poisson probabilities.
In accordance with one embodiment of the present invention illustrated by the flow chart of FIG. 4, historical defect containment data is entered (step A) in the cells of Excel 5.0 as a workbook in the historical sheet as a stage defect containment matrix. The user enters historical defect containment data for the various stages of design in a defect containment matrix at cell locations. This is arrived at from previous designs and detections of defects at these stages. Based on estimated efficiency of detection of defects entered (Step B), the inspection efficiencies are calculated and copied to the second sheet or page called the current sheet 27. The estimated overall efficiency of the process to detect DPU of each type over all stages is entered. The number of software lines of code (SLOC) is entered on the current workbook sheet 23 (step C) and the goal sigma value is entered on the current workbook sheet 23 (step D). Each SLOC represents a defect opportunity. Based on the goal sigma values and lines of code (SLOC) entered the total number of observed defects are calculated. The initial distribution of these defects is calculated using probability Pij (step E) of a defect in ith step of being detected and removed in jth step. The upper bounds for initial defect spread is calculated (step F) and the lower bounds for initial defect spread is calculated (step G). The defect spread is copied down to the actual locations in the current sheet (step H). The confidence interval is then calculated (step I). The statistical model used views the number of defects generated in each stage as Poisson random variables which are independent between the different stages of the development process. These random numbers of defects are then subjected to the random process of defect detection and the resulting number of detected, and undetected, defects are random variables whose distributions remain Poisson. The total number of detected defects, as well as the total number of escaping defects, then can be represented as the sum of independent Poisson random variables and it is this that makes it possible to develop an unbiased estimator for the mean number of escaping defects. An estimate of the variance of the estimator, along with the asymptotic normality of its distribution, allows for the calculation of an approximate statistical confidence interval for the mean number of escaping defects, as well as an approximate prediction interval for the actual number of escaping defects. These estimates and intervals are automatically calculated and displayed in the spreadsheet, along with corresponding estimates and intervals for the process sigma level. The initial prediction is up-dated (step J) with actual data until all actuals have been entered (step K). As the design progresses and actual defects are measured the actual defects are compared to the error bounds to determine if there is consistency between the data and the model and to see if the sigma goal will be reached.
Referring to FIG. 5, there is illustrated the defect flow analysis for a software design project which starts with RA as a requirement and proceeds to the second Step PD, which is preliminary design, which proceeds to a detailed design (DD) which then proceeds to actual generation of code (CUT) and then to the fifth step of integration and test (I&T). FIG. 5 indicates the defect data flow model used to estimate the number of escaping defects for a typical software product. Some of the final defects from the requirements (RA) escape through the preliminary design, the detailed design, the coding and integration and test. Likewise some uncorrected defects in the preliminary design (second line) escape and pass on to detailed design, through the coding, and through integration and test. Some defects at the detailed design escape through coding and integration and test. Some coding errors escape through integration and test. Some integration and test errors escape. The total escaped defects per million opportunities is the defects per million opportunities (DPMO) which is converted to the Sigma level.
The historical sheet shown in FIG. 6 is the primary location for loading historical data to prime the pump in preparation for the collection of actual defect data during the project. The primary software sigma measure is defects per unit (DPU). When we associate opportunities and a chance for non-conformance, we are providing a measure of complexity that allows us to compare products of different size. The use of opportunities as a common denominator to compute defects per million opportunities (dpmo) is a way to normalize the different sizes between both intermediate and final product. Enter in cells C4:G8 of Excel 5.0 historical workbook sheet the defects for each stage observed from historical data or best engineering judgement. This data represents the pattern of defects detected across the project phases. For example the defects originated at requirements stage RA and detected at RA is 30. The defects detected at Integration and Test originated 1 at RA, 1 at PD, 5 at DD, 17 at CUT, and 3 at I&T. It represents the pattern most likely to occur and is transformed into conditional probabilities in cells C15:G19 labeled “inspection efficiencies”. These probabilities are automatically calculated in cells C15:G19 of the historical sheet: and are copied onto the current and summary sheets. Represented as percentages, these are the conditional probabilities that a defect generated in a prior or same stage will be observed in the current stage. For example, the total RA defects is 64 and the defect at C4 is 30 so the percentage is 30/64×100%=47. These percentages are then derated by the estimated efficiencies. The percentages listed represent derating of perfect capture which the conditional probabilities would suggest. In fact, the conditional probabilities are adjusted by the estimated efficiency percentages to indicate that our observations are not 100% efficient. These multipliers may be estimated for programs with complete data, but without that one must use best engineering judgement. The spreadsheet shown in FIG. 6 has these values preset at 95% for requirements DPU, 94% for preliminary design defects, 93% for detailed design defects, 92% for code and unit test and 90% for integration and test. Screening effectiveness percentages are conditional probabilities estimated from historical stage containment data and may be revised.
The initial values in the current sheet (FIG. 7) allow the developer to model his environment and the effect in terms of DPU for given values of screen effectiveness and assumed sigma for the product. As actual data is entered for each phase, it overrides the DPU computed by the spreadsheet, which were needed to obtain the assumed goal sigma. From this point in time forward, to improve the product's sigma it is necessary to reduce the DPU observed at each stage by improved software process steps. The screen detection probabilities may be increased by improving the screens ability to detect both in-stage and out-of-stage DPU. The process is improved by finding most DPU in early stages of development.
The product name, delivered SLOC (Software Lines of Code) and goal sigma are entered at E4 and E5 in the shaded blocks at the top of the current sheet illustrated in FIG. 7. Note that the goal sigma may be based upon Fault Density Data of similar products or be the development goal the project expects to attain.
The DPU count by percentage in the historical sheet based on defects observed are computed and copied to in the current sheet. These percentages are used to spread the DPU in the following cells with planning DPU spread by stage. The percentages may be adjusted to reflect engineering judgement if required.
Using the percent spread, knowledge of the goal sigma of E5, the delivered SLOC E4 and the probabilities of detection, the engine back calculates the DPU needed in each phase to reach the sigma goal. These DPU are copied to the cells (C51, G55) called “defects observed” where actuals will overwrite these estimates as they are received. Note that the number of DPU passed to the next phase and the number generated (greater than observed) are also indicated below these cells. First the total DPU are calculated from the sigma value and SLOC and then based on percentage in C10:G14. The initial values in C51:G55 are entered. This predictive framework is based on assumptions.
Assume a process has N steps or stages. In step i, Li defects are introduced. Assume Li has a Poisson distribution with mean λi and that Li and Lj are independent for i≠j. Assume also that a defect introduced in the ith step has a probability Pij of being detected and removed in the jth step, j≧i, and that the detection of defects forms a Bernoulli process and the detection of one defect is independent of the detection of other defects. It can be shown that the number of defects detected in stage, Kii, has a Poisson distribution with mean λiPii and that the number of defects escaping from the stage they were introduced, Li−Kii, has a Poisson distribution with mean λi(1−Pii). Furthermore, it can be shown that these random variables are independent.
This leads to the fact that the numbers of defects of a specific origin, found in each stage, have Poisson distributions and are all independent of each other. Since the number of defects which escape from step i to step i+1, Li−Kii, has a Poisson distribution with mean λi(1−Pii), and since these defects each have a probability Pii+1 of being detected, the number of stage i defects detected in step i+1, Kii+1, has a Poisson distribution with mean (1−Pii)Pii+1λi. In general, the number of step i defects detected (and removed) in the jth step is given by Kij and has a Poisson distribution with mean (1−Pii)(1−Pii+1) . . . (1−Pij−1) Pijλi. Furthermore, these Kij are all independent. In addition, since they are simply the sum of independent Poisson variables, the total number of defects detected in each stage, the total number of detected defects introduced at each stage, and the total number of escaping defects all have Poisson distributions.
Let 
be the number of step i defects which have not been detected after the Nth step. By induction, it can be shown that Li* has Poisson distribution. The mean of Li* is given by 
where 
Let 
be the total number of escaping defects. Since the Li* are independent Poisson variables, L* has a Poisson distribution with mean 
Estimators
As stated before, the Kij are independent, Poisson variables with means 
where 
This means that 
the total number of defects from stage i which were detected, has a Poisson distribution with mean and variance given by: 
The Ki. also form a sufficient statistic for estimating the λi, and hence the λi* and λ*.
The maximum likelihood estimators (MLE) for the λi are given by 
and this the MLE for λ* is given by 
Since 
{circumflex over (λ)}* is also an unbiased estimator of λ* with variance given by. 
which can be estimated by 
For the above software development/inspection process N=5. Thus
and 
with 
The block of cells C31:G35 are the upper limits and these are calculated based upon Poisson probability tails. The numbers represent upper bounds for actual DPU counts entered in the defects observed block or cells. The probability that one of the actual DPU values is greater than the corresponding upper bound cell, given our historical assumptions, is at most Alpha_U. In other words, there is at most an Alpha_U×100% chance that an actual number of defects will exceed the corresponding upper limit, given true historical assumptions. If several actuals, say n, exceed their corresponding upper bounds, then there is at most an (Alpha_U)n×100% chance that the historical assumptions are correct. To reject the historical assumptions there are two alternatives hypothesis:
First, the DPU may exceed expected results due to superior process which is finding more DPU.
Second, the process is not as effective at preventing DPU from occurring in the process, resulting in more defects to be found. Only experienced engineering judgement can determine the correct conclusion. In any case, the DPU escaping and product sigma will be lower than the initial goal. A fourth page in Excel Macros contains the original computer programs to calculate Poisson probabilities.
The block of cells C41:G45 are lower limits are calculated based upon Poisson probability tails. The numbers represent lower bounds for actual DPU counts entered in the defects observed block of cells. The probability that one of the actual DPU values is less than the corresponding lower bound, given our historical assumptions, is at most Alpha_L. To reject the historical assumptions there are two alternative hypothesis:
First, the DPU may be less than expected due to an inferior inspection process which is finding fewer defects than expected.
Second, the process is more effective than expected at preventing defects from occurring in the process, resulting in fewer defects to be found. Only experienced engineering judgement can determine the correct conclusion.
The block of cells C51:G55 is initialized to the planning DPU spread by stage. As actual DPU data is collected by the project, it is entered to overwrite this data. Finally, the data contains only actual data and based upon actual data observed, the sigma of escaping DPU is calculated.
The confidence level E58 represents the probability that the true values of DPU, dmpo, and sigma in the corresponding cells are within the upper and lower bounds indicated. The sigma interval labeled in this program represents a confidence interval predicting the sigma for escaping DPU based upon this programs actual data. The interval labeled average represents a confidence interval based upon repeating the experiment of collecting actuals multiple times for this program. The estimator can be used to generate an approximate confidence interval for the mean number of escaping defects, as well as an approximate prediction interval for the actual number of escaping defects.
The first block of cells in the Summary page as illustrated in FIG. 8 reminds the reviewer of the historical stage containment data which has been used to model process effectiveness at defect observation. The second block of cells represents the data set of actual stage containment DPU for the current project. This data resulted from overwriting the planning DPU spread on the current sheet into the defects observed block. The confidence level set on the current page is copied to the summary page. It represents the probability that the true values of DPU, dpmo, and sigma in the corresponding cells are within the upper and lower bounds indicated. The sigma interval labeled in this program represents a confidence interval predicting the sigma for escaping DPU based upon this programs actual data. The interval labeled average represents a confidence interval for the long-term average DPU level for all projects with the same defect generation and inspection characteristics.
In FIG. 9 there is illustrated a current sheet with equations behind the cells. Cells C81:G86 calculate the total defects. The Poisson upper limits are cells C31:G35. The Poisson lower limits are in cells C41:G45.
Other Embodiments
Although the present invention and its advantages have been described in detail, it should be understood that various changes, substitutions and alterations can be made herein without departing from the spirit and scope of the invention as defined by the appended claims.
Claims (12)
1. A computer implemented method for predicting product defects of a future product comprising the steps of:
storing in a first database historical data of defects at different stages of development from a past product and a value representing corresponding escaping defects;
providing a first signal representing a first value of a predicted number of opportunities for defects and a second signal representing a second value of planned defects per opportunities for said future product;
backsolving said first and second values represented by said first and second signals to provide a third signal representing total predicted defects;
generating a second database of predictive defects for different stages of development for said future product as a function of said first database historical data and said first and second signals; and
displaying said predictive defects at different stages of development for said future product.
2. The method of claim 1 wherein said method is for predicting software defects and said predictive opportunities for defects are the number of software lines of code.
3. The method of claim 2 wherein said value representing corresponding escaping defects is a sigma value dependent on defects per million opportunities.
4. The method of claim 2 including the steps of changing the number of defects in said second database for the different stages from predictive defects to actual defects as actual defects are detected, producing a fourth signal representing actual defects, and displaying said actual defects.
5. The method of claim 1 wherein said value representing corresponding escaping defects is a sigma value dependent on defects per million opportunities.
6. The method of claim 1 including the steps of changing the number of defects in said second database for the different stages from predictive defects to actual defects as actual defects are detected, producing a fourth signal representing actual defects, and displaying said actual defects.
7. A method of software defect prediction of a current product being developed comprising the steps of:
constructing project phase defect containment data from past one or more projects and quality level in terms of escaping defects;
converting said project containment data to conditional probabilities;
providing a first signal representing software lines of code and a second signal representing quality level in terms of escaping defects;
generating a database of predictive defects at different stages of development for said current product as a function of said conditional probabilities and said first and second signals; and
displaying said predictive defects at different stages of development for said current product.
8. The method of claim 7 including the steps of changing the number of defects in said database for the different stages from predictive defects to actual defects as actual defects are detected, producing a third signal representing actual defects, and displaying said actual defects.
9. A computer implemented method of predicting software defects in a computer program comprising the steps of:
generating and displaying a historical sheet and a current sheet for providing data representing defects at different stages of software design;
entering data in said historical sheet representing defects at different stages of design and sigma value corresponding thereto based on previous designs;
entering estimated efficiencies of said historical data;
generating and displaying percentage of distribution of defects based in efficiencies;
entering proposed number of lines of code and sigma value for current code to be predicted;
backsolving said sigma value and said lines of code to provide a count of defects; distributing said defects based on said percentage of distribution of defects; providing said defects on said current sheet; displaying said current sheet;
calculating upper bounds for initial defect spread;
displaying said upper bounds for observed defect spread;
calculating lower bounds for initial defect spread; and
displaying said lower bounds for observed defect spread.
10. A software predictive apparatus comprising:
means, interactive with user, for storing historical data of defects at different stages of software development;
means, coupled to said storing means, for calculating sigma values;
means, coupled to said storing means and calculating means, for displaying said historical data and said sigma values; and
means responsive to entering new sigma values for backsolving said new sigma values to provide a distribution of predictive defects at different stages of software development.
11. A software defect predictive engine for a current software design comprising:
a processor;
a first computer storage for storing under program control first electrical signals representing historical data on defects at different stages of a previous software design;
said processor responsive to said first electrical signals and estimated prediction efficiencies for providing second electrical signals representing predicted defects at different stages of said current software design;
a second computer storage for storing said second electrical signals representing predicted defects at different stages of said current software design;
said processor responsive to lines of code entered and sigma value entered for calculating and for providing third electrical signals representing defects projected and responsive to said third electrical signals for calculating and for providing fourth electrical signals representing a final distribution of defects for the said current software design;
said second computer storage storing said fourth electrical signals; and
a display coupled to said processor and said second computer storage and responsive to said fourth electrical signals for displaying said final distribution of defects of said current software design.
12. A software defect predictive engine for a current software design comprising:
a processor;
a first computer storage for storing under program control first electrical signals representing historical data on defects at different stages of a previous software design;
said processor responsive to said first electrical signal and estimated prediction efficiencies for providing second electrical signals representing predicted defects at different stages of said current software design;
a second computer storage for storing said second electrical signals representing predicted defects at different stages of said current design;
said processor responsive to lines of code entered and sigma value entered for calculating and for providing third electrical signals representing total defects projected and responsive to said third electrical signals for calculating and for providing fourth electrical signals representing a final distribution of defects for the current software design;
said second computer storage storing said fourth electrical signals; and
a display coupled to said processor and said second computer storage and responsive to said fourth electrical signals for displaying said final distribution of defects of the current software program and for displaying a prediction of defects in the current software design.
Priority Applications (1)
| Application Number | Priority Date | Filing Date | Title |
|---|---|---|---|
| US08/741,494 US6477471B1 (en) | 1995-10-30 | 1996-10-30 | Product defect predictive engine |
Applications Claiming Priority (2)
| Application Number | Priority Date | Filing Date | Title |
|---|---|---|---|
| US811695P | 1995-10-30 | 1995-10-30 | |
| US08/741,494 US6477471B1 (en) | 1995-10-30 | 1996-10-30 | Product defect predictive engine |
Publications (1)
| Publication Number | Publication Date |
|---|---|
| US6477471B1 true US6477471B1 (en) | 2002-11-05 |
Family
ID=21729865
Family Applications (1)
| Application Number | Title | Priority Date | Filing Date |
|---|---|---|---|
| US08/741,494 Expired - Fee Related US6477471B1 (en) | 1995-10-30 | 1996-10-30 | Product defect predictive engine |
Country Status (2)
| Country | Link |
|---|---|
| US (1) | US6477471B1 (en) |
| EP (1) | EP0786725A1 (en) |
Cited By (70)
| Publication number | Priority date | Publication date | Assignee | Title |
|---|---|---|---|---|
| US6553270B1 (en) * | 1999-06-30 | 2003-04-22 | Kimberly-Clark Worldwide, Inc. | Proactive control of a process after the beginning of a destabilizing event |
| US20030126505A1 (en) * | 2001-12-31 | 2003-07-03 | Globespanvirata Incorporated | System and method for determining fault path behavior |
| US20030182098A1 (en) * | 1999-05-03 | 2003-09-25 | Ehrler Timothy J. | Derating factor determination for integrated circuit logic design tools |
| US20040030427A1 (en) * | 2002-07-25 | 2004-02-12 | Drake Paul J. | Mechanical tolerance method |
| US20040194019A1 (en) * | 2003-03-27 | 2004-09-30 | Mast Donald R | Bolted joint statistical spreadsheet |
| US6839656B1 (en) * | 1998-12-16 | 2005-01-04 | Siemens Aktiengesellschaft | Method and arrangement for predicting measurement data by means of given measurement |
| US20050071807A1 (en) * | 2003-09-29 | 2005-03-31 | Aura Yanavi | Methods and systems for predicting software defects in an upcoming software release |
| US20050091151A1 (en) * | 2000-08-23 | 2005-04-28 | Ronald Coleman | System and method for assuring the integrity of data used to evaluate financial risk or exposure |
| US20060041864A1 (en) * | 2004-08-19 | 2006-02-23 | International Business Machines Corporation | Error estimation and tracking tool for testing of code |
| US7167865B1 (en) * | 2003-06-30 | 2007-01-23 | Mvalent, Inc. | Collaborative environment for producing software products |
| US7197466B1 (en) * | 2000-11-02 | 2007-03-27 | General Electric Capital Corporation | Web-based system for managing software assets |
| US20080189237A1 (en) * | 2007-02-02 | 2008-08-07 | Microsoft Corporation | Goal seeking using predictive analytics |
| US20080263507A1 (en) * | 2007-04-17 | 2008-10-23 | Ching-Pao Chang | Action-based in-process software defect prediction software defect prediction techniques based on software development activities |
| US7484087B2 (en) | 2003-02-24 | 2009-01-27 | Jp Morgan Chase Bank | Systems, methods, and software for preventing redundant processing of transmissions sent to a remote host computer |
| US20090164974A1 (en) * | 2007-12-19 | 2009-06-25 | International Business Machines Corporation | Quality measure tool for a composite application |
| US20090319984A1 (en) * | 2008-06-24 | 2009-12-24 | Internaional Business Machines Corporation | Early defect removal model |
| US7665127B1 (en) | 2004-06-30 | 2010-02-16 | Jp Morgan Chase Bank | System and method for providing access to protected services |
| US7702767B2 (en) | 2004-03-09 | 2010-04-20 | Jp Morgan Chase Bank | User connectivity process management system |
| US7895565B1 (en) | 2006-03-15 | 2011-02-22 | Jp Morgan Chase Bank, N.A. | Integrated system and method for validating the functionality and performance of software applications |
| US20110067006A1 (en) * | 2009-09-11 | 2011-03-17 | International Business Machines Corporation | System and method to classify automated code inspection services defect output for defect analysis |
| US20110066557A1 (en) * | 2009-09-11 | 2011-03-17 | International Business Machines Corporation | System and method to produce business case metrics based on defect analysis starter (das) results |
| US20110066890A1 (en) * | 2009-09-11 | 2011-03-17 | International Business Machines Corporation | System and method for analyzing alternatives in test plans |
| US20110066490A1 (en) * | 2009-09-11 | 2011-03-17 | International Business Machines Corporation | System and method for resource modeling and simulation in test planning |
| US20110066893A1 (en) * | 2009-09-11 | 2011-03-17 | International Business Machines Corporation | System and method to map defect reduction data to organizational maturity profiles for defect projection modeling |
| US20110066486A1 (en) * | 2009-09-11 | 2011-03-17 | International Business Machines Corporation | System and method for efficient creation and reconciliation of macro and micro level test plans |
| US20110067005A1 (en) * | 2009-09-11 | 2011-03-17 | International Business Machines Corporation | System and method to determine defect risks in software solutions |
| US20110066887A1 (en) * | 2009-09-11 | 2011-03-17 | International Business Machines Corporation | System and method to provide continuous calibration estimation and improvement options across a software integration life cycle |
| US20110066558A1 (en) * | 2009-09-11 | 2011-03-17 | International Business Machines Corporation | System and method to produce business case metrics based on code inspection service results |
| US7913249B1 (en) | 2006-03-07 | 2011-03-22 | Jpmorgan Chase Bank, N.A. | Software installation checker |
| US20120017195A1 (en) * | 2010-07-17 | 2012-01-19 | Vikrant Shyamkant Kaulgud | Method and System for Evaluating the Testing of a Software System Having a Plurality of Components |
| US8181016B1 (en) | 2005-12-01 | 2012-05-15 | Jpmorgan Chase Bank, N.A. | Applications access re-certification system |
| US8234156B2 (en) | 2001-06-28 | 2012-07-31 | Jpmorgan Chase Bank, N.A. | System and method for characterizing and selecting technology transition options |
| US8255902B1 (en) * | 2008-03-17 | 2012-08-28 | Symantec Corporation | Systems and methods for determining and quantifying the impact of an application on the health of a system |
| US8266025B1 (en) * | 1999-08-09 | 2012-09-11 | Citibank, N.A. | System and method for assuring the integrity of data used to evaluate financial risk or exposure |
| US8572516B1 (en) | 2005-08-24 | 2013-10-29 | Jpmorgan Chase Bank, N.A. | System and method for controlling a screen saver |
| US8635056B2 (en) | 2009-09-11 | 2014-01-21 | International Business Machines Corporation | System and method for system integration test (SIT) planning |
| US20140033176A1 (en) * | 2012-07-26 | 2014-01-30 | Infosys Limited | Methods for predicting one or more defects in a computer program and devices thereof |
| US8813039B2 (en) | 2010-04-14 | 2014-08-19 | International Business Machines Corporation | Method and system for software defect reporting |
| US20140310629A1 (en) * | 2013-04-12 | 2014-10-16 | The Boeing Company | Nonconformance Visualization System |
| US20150025942A1 (en) * | 2013-07-17 | 2015-01-22 | Bank Of America Corporation | Framework for internal quality analysis |
| US9088459B1 (en) | 2013-02-22 | 2015-07-21 | Jpmorgan Chase Bank, N.A. | Breadth-first resource allocation system and methods |
| US9110560B1 (en) | 2013-02-28 | 2015-08-18 | The Boeing Company | Shop order status visualization system |
| US9182892B2 (en) | 2013-02-28 | 2015-11-10 | The Boeing Company | Condition of assembly visualization system |
| US9286394B2 (en) | 2013-07-17 | 2016-03-15 | Bank Of America Corporation | Determining a quality score for internal quality analysis |
| US9292180B2 (en) | 2013-02-28 | 2016-03-22 | The Boeing Company | Locator system for three-dimensional visualization |
| US9340304B2 (en) | 2013-02-28 | 2016-05-17 | The Boeing Company | Aircraft comparison system |
| US9448792B2 (en) | 2013-03-14 | 2016-09-20 | Microsoft Technology Licensing, Llc | Automatic risk analysis of software |
| US9492900B2 (en) | 2013-03-15 | 2016-11-15 | The Boeing Company | Condition of assembly visualization system based on build cycles |
| US9542259B1 (en) | 2013-12-23 | 2017-01-10 | Jpmorgan Chase Bank, N.A. | Automated incident resolution system and method |
| US9612725B1 (en) | 2013-02-28 | 2017-04-04 | The Boeing Company | Nonconformance visualization system |
| US9619363B1 (en) * | 2015-09-25 | 2017-04-11 | International Business Machines Corporation | Predicting software product quality |
| US9619410B1 (en) | 2013-10-03 | 2017-04-11 | Jpmorgan Chase Bank, N.A. | Systems and methods for packet switching |
| US9720655B1 (en) | 2013-02-01 | 2017-08-01 | Jpmorgan Chase Bank, N.A. | User interface event orchestration |
| US9868054B1 (en) | 2014-02-10 | 2018-01-16 | Jpmorgan Chase Bank, N.A. | Dynamic game deployment |
| US9870444B2 (en) | 2013-03-05 | 2018-01-16 | The Boeing Company | Shop order status visualization system |
| US9880694B2 (en) | 2013-05-09 | 2018-01-30 | The Boeing Company | Shop order status visualization system |
| US10002041B1 (en) | 2013-02-01 | 2018-06-19 | Jpmorgan Chase Bank, N.A. | System and method for maintaining the health of a machine |
| US10061481B2 (en) | 2013-02-28 | 2018-08-28 | The Boeing Company | Methods and devices for visually querying an aircraft based on an area of an image |
| US10068176B2 (en) | 2013-02-28 | 2018-09-04 | Huawei Technologies Co., Ltd. | Defect prediction method and apparatus |
| US10067650B2 (en) | 2013-06-20 | 2018-09-04 | The Boeing Company | Aircraft comparison system with synchronized displays |
| US10275333B2 (en) * | 2014-06-16 | 2019-04-30 | Toyota Jidosha Kabushiki Kaisha | Risk analysis of codebase using static analysis and performance data |
| US10331295B2 (en) | 2013-03-28 | 2019-06-25 | The Boeing Company | Visualization of an object using a visual query system |
| US10354210B2 (en) | 2015-04-16 | 2019-07-16 | Entit Software Llc | Quality prediction |
| US10416857B2 (en) | 2013-05-09 | 2019-09-17 | The Boeing Company | Serial number control visualization system |
| US20190377665A1 (en) * | 2015-03-19 | 2019-12-12 | Teachers Insurance And Annuity Association Of America | Evaluating and presenting software testing project status indicators |
| US10685147B2 (en) | 2016-02-29 | 2020-06-16 | The Boeing Company | Non-conformance mapping and visualization |
| CN111782548A (en) * | 2020-07-28 | 2020-10-16 | 南京航空航天大学 | Software defect prediction data processing method and device and storage medium |
| US11144308B2 (en) | 2017-09-15 | 2021-10-12 | Cognizant Technology Solutions India Pvt. Ltd. | System and method for predicting defects in a computer program |
| US11151023B2 (en) | 2017-11-20 | 2021-10-19 | Cognizant Technology Solutions India Pvt. Ltd. | System and method for predicting performance failures in a computer program |
| US11288065B2 (en) | 2018-07-02 | 2022-03-29 | International Business Machines Corporation | Devops driven cognitive cost function for software defect prediction |
Families Citing this family (2)
| Publication number | Priority date | Publication date | Assignee | Title |
|---|---|---|---|---|
| FR3046687A1 (en) * | 2016-01-07 | 2017-07-14 | Valeo Vision | DETECTION OF INDUSTRIAL PRODUCTION FAILURES |
| CN116466657B (en) * | 2023-03-17 | 2023-09-19 | 浙江立群汽车配件制造有限公司 | Automatic production and processing control system for universal joint assembly |
Citations (3)
| Publication number | Priority date | Publication date | Assignee | Title |
|---|---|---|---|---|
| US5301118A (en) * | 1991-11-18 | 1994-04-05 | International Business Machines Corporation | Monte carlo simulation design methodology |
| US5452218A (en) * | 1994-02-03 | 1995-09-19 | Texas Instruments | System and method for determining quality analysis on fabrication and/or assembly design using shop capability data |
| US5581466A (en) * | 1994-05-12 | 1996-12-03 | Texas Instruments Incorporated | Tolerance analysis system and method |
-
1996
- 1996-10-30 US US08/741,494 patent/US6477471B1/en not_active Expired - Fee Related
- 1996-10-30 EP EP96307828A patent/EP0786725A1/en not_active Withdrawn
Patent Citations (3)
| Publication number | Priority date | Publication date | Assignee | Title |
|---|---|---|---|---|
| US5301118A (en) * | 1991-11-18 | 1994-04-05 | International Business Machines Corporation | Monte carlo simulation design methodology |
| US5452218A (en) * | 1994-02-03 | 1995-09-19 | Texas Instruments | System and method for determining quality analysis on fabrication and/or assembly design using shop capability data |
| US5581466A (en) * | 1994-05-12 | 1996-12-03 | Texas Instruments Incorporated | Tolerance analysis system and method |
Non-Patent Citations (5)
| Title |
|---|
| Billy Mitchell, "The Six Sigma Appeal", Engineering Management Journal, vol. 2, Iss. 1, Feb. 1992, pp. 41-47.* * |
| Fieler et al., "Defects Tail Off with Six-Sigma Manufacturing", IEEE Circuits and Devices Magazine, vol. 7, Iss. 5, Sep. 1991, pp. 18-20.* * |
| Fuller et al., "Total Quality Manufacturing at the RIT Integrated Circuit Factory", Proceedings of the Eleventh Biennial University/Government/Industry Microelectronics Symposium, May 1995, pp. 52-56.* * |
| Robert V. White, "An Introduction to Six Sigma with a Design Example", APEC '92 Seventh Annual Applied Power Electronics Conference and Exposition, Feb. 1992, pp.28-35.* * |
| William K. Hoehn, "Robust Designs Through Design to Six Sigma Manufacturing", Proceedings of the 1995 IEEE Annual International Engineering Management Conference, Jun. 1995, pp. 241-246. * |
Cited By (123)
| Publication number | Priority date | Publication date | Assignee | Title |
|---|---|---|---|---|
| US6839656B1 (en) * | 1998-12-16 | 2005-01-04 | Siemens Aktiengesellschaft | Method and arrangement for predicting measurement data by means of given measurement |
| US7010475B2 (en) * | 1999-05-03 | 2006-03-07 | Koninklijke Philips Electronics N.V. | Derating factor determination for integrated circuit logic design tools |
| US20030182098A1 (en) * | 1999-05-03 | 2003-09-25 | Ehrler Timothy J. | Derating factor determination for integrated circuit logic design tools |
| US6553270B1 (en) * | 1999-06-30 | 2003-04-22 | Kimberly-Clark Worldwide, Inc. | Proactive control of a process after the beginning of a destabilizing event |
| US8266025B1 (en) * | 1999-08-09 | 2012-09-11 | Citibank, N.A. | System and method for assuring the integrity of data used to evaluate financial risk or exposure |
| US20050091151A1 (en) * | 2000-08-23 | 2005-04-28 | Ronald Coleman | System and method for assuring the integrity of data used to evaluate financial risk or exposure |
| US7197466B1 (en) * | 2000-11-02 | 2007-03-27 | General Electric Capital Corporation | Web-based system for managing software assets |
| US8234156B2 (en) | 2001-06-28 | 2012-07-31 | Jpmorgan Chase Bank, N.A. | System and method for characterizing and selecting technology transition options |
| US20030126505A1 (en) * | 2001-12-31 | 2003-07-03 | Globespanvirata Incorporated | System and method for determining fault path behavior |
| US6651187B2 (en) * | 2001-12-31 | 2003-11-18 | Globespanvirata Inc. | System and method for determining fault path behavior |
| US20040030427A1 (en) * | 2002-07-25 | 2004-02-12 | Drake Paul J. | Mechanical tolerance method |
| US7024263B2 (en) | 2002-07-25 | 2006-04-04 | Drake Jr Paul J | Mechanical tolerance method |
| US7484087B2 (en) | 2003-02-24 | 2009-01-27 | Jp Morgan Chase Bank | Systems, methods, and software for preventing redundant processing of transmissions sent to a remote host computer |
| US7136785B2 (en) * | 2003-03-27 | 2006-11-14 | Caterpillar Inc. | Bolted joint statistical spreadsheet |
| US20040194019A1 (en) * | 2003-03-27 | 2004-09-30 | Mast Donald R | Bolted joint statistical spreadsheet |
| US7167865B1 (en) * | 2003-06-30 | 2007-01-23 | Mvalent, Inc. | Collaborative environment for producing software products |
| US20050071807A1 (en) * | 2003-09-29 | 2005-03-31 | Aura Yanavi | Methods and systems for predicting software defects in an upcoming software release |
| US7702767B2 (en) | 2004-03-09 | 2010-04-20 | Jp Morgan Chase Bank | User connectivity process management system |
| US7665127B1 (en) | 2004-06-30 | 2010-02-16 | Jp Morgan Chase Bank | System and method for providing access to protected services |
| US20060041864A1 (en) * | 2004-08-19 | 2006-02-23 | International Business Machines Corporation | Error estimation and tracking tool for testing of code |
| US10200444B1 (en) | 2005-08-24 | 2019-02-05 | Jpmorgan Chase Bank, N.A. | System and method for controlling a screen saver |
| US8572516B1 (en) | 2005-08-24 | 2013-10-29 | Jpmorgan Chase Bank, N.A. | System and method for controlling a screen saver |
| US8972906B1 (en) | 2005-08-24 | 2015-03-03 | Jpmorgan Chase Bank, N.A. | System and method for controlling a screen saver |
| US8181016B1 (en) | 2005-12-01 | 2012-05-15 | Jpmorgan Chase Bank, N.A. | Applications access re-certification system |
| US7913249B1 (en) | 2006-03-07 | 2011-03-22 | Jpmorgan Chase Bank, N.A. | Software installation checker |
| US7895565B1 (en) | 2006-03-15 | 2011-02-22 | Jp Morgan Chase Bank, N.A. | Integrated system and method for validating the functionality and performance of software applications |
| US9477581B2 (en) | 2006-03-15 | 2016-10-25 | Jpmorgan Chase Bank, N.A. | Integrated system and method for validating the functionality and performance of software applications |
| US20080189237A1 (en) * | 2007-02-02 | 2008-08-07 | Microsoft Corporation | Goal seeking using predictive analytics |
| US7788200B2 (en) | 2007-02-02 | 2010-08-31 | Microsoft Corporation | Goal seeking using predictive analytics |
| US20080263507A1 (en) * | 2007-04-17 | 2008-10-23 | Ching-Pao Chang | Action-based in-process software defect prediction software defect prediction techniques based on software development activities |
| US7856616B2 (en) * | 2007-04-17 | 2010-12-21 | National Defense University | Action-based in-process software defect prediction software defect prediction techniques based on software development activities |
| US20090164974A1 (en) * | 2007-12-19 | 2009-06-25 | International Business Machines Corporation | Quality measure tool for a composite application |
| US8762987B1 (en) * | 2008-03-17 | 2014-06-24 | Symantec Corporation | Systems and methods for determining and quantifying the impact of an application on the health of a system |
| US8255902B1 (en) * | 2008-03-17 | 2012-08-28 | Symantec Corporation | Systems and methods for determining and quantifying the impact of an application on the health of a system |
| US20090319984A1 (en) * | 2008-06-24 | 2009-12-24 | Internaional Business Machines Corporation | Early defect removal model |
| US8352904B2 (en) * | 2008-06-24 | 2013-01-08 | International Business Machines Corporation | Early defect removal model |
| US9052981B2 (en) | 2009-09-11 | 2015-06-09 | International Business Machines Corporation | System and method to map defect reduction data to organizational maturity profiles for defect projection modeling |
| US9594671B2 (en) | 2009-09-11 | 2017-03-14 | International Business Machines Corporation | System and method for resource modeling and simulation in test planning |
| US20110066558A1 (en) * | 2009-09-11 | 2011-03-17 | International Business Machines Corporation | System and method to produce business case metrics based on code inspection service results |
| US20110066887A1 (en) * | 2009-09-11 | 2011-03-17 | International Business Machines Corporation | System and method to provide continuous calibration estimation and improvement options across a software integration life cycle |
| US20110067005A1 (en) * | 2009-09-11 | 2011-03-17 | International Business Machines Corporation | System and method to determine defect risks in software solutions |
| US8495583B2 (en) | 2009-09-11 | 2013-07-23 | International Business Machines Corporation | System and method to determine defect risks in software solutions |
| US8527955B2 (en) | 2009-09-11 | 2013-09-03 | International Business Machines Corporation | System and method to classify automated code inspection services defect output for defect analysis |
| US8539438B2 (en) | 2009-09-11 | 2013-09-17 | International Business Machines Corporation | System and method for efficient creation and reconciliation of macro and micro level test plans |
| US8566805B2 (en) | 2009-09-11 | 2013-10-22 | International Business Machines Corporation | System and method to provide continuous calibration estimation and improvement options across a software integration life cycle |
| US20110066486A1 (en) * | 2009-09-11 | 2011-03-17 | International Business Machines Corporation | System and method for efficient creation and reconciliation of macro and micro level test plans |
| US8578341B2 (en) | 2009-09-11 | 2013-11-05 | International Business Machines Corporation | System and method to map defect reduction data to organizational maturity profiles for defect projection modeling |
| US10372593B2 (en) | 2009-09-11 | 2019-08-06 | International Business Machines Corporation | System and method for resource modeling and simulation in test planning |
| US8635056B2 (en) | 2009-09-11 | 2014-01-21 | International Business Machines Corporation | System and method for system integration test (SIT) planning |
| US10235269B2 (en) * | 2009-09-11 | 2019-03-19 | International Business Machines Corporation | System and method to produce business case metrics based on defect analysis starter (DAS) results |
| US8645921B2 (en) | 2009-09-11 | 2014-02-04 | International Business Machines Corporation | System and method to determine defect risks in software solutions |
| US8667458B2 (en) | 2009-09-11 | 2014-03-04 | International Business Machines Corporation | System and method to produce business case metrics based on code inspection service results |
| US8689188B2 (en) * | 2009-09-11 | 2014-04-01 | International Business Machines Corporation | System and method for analyzing alternatives in test plans |
| US20110066893A1 (en) * | 2009-09-11 | 2011-03-17 | International Business Machines Corporation | System and method to map defect reduction data to organizational maturity profiles for defect projection modeling |
| US20110067006A1 (en) * | 2009-09-11 | 2011-03-17 | International Business Machines Corporation | System and method to classify automated code inspection services defect output for defect analysis |
| US10185649B2 (en) | 2009-09-11 | 2019-01-22 | International Business Machines Corporation | System and method for efficient creation and reconciliation of macro and micro level test plans |
| US8893086B2 (en) | 2009-09-11 | 2014-11-18 | International Business Machines Corporation | System and method for resource modeling and simulation in test planning |
| US8924936B2 (en) | 2009-09-11 | 2014-12-30 | International Business Machines Corporation | System and method to classify automated code inspection services defect output for defect analysis |
| US9753838B2 (en) | 2009-09-11 | 2017-09-05 | International Business Machines Corporation | System and method to classify automated code inspection services defect output for defect analysis |
| US20110066490A1 (en) * | 2009-09-11 | 2011-03-17 | International Business Machines Corporation | System and method for resource modeling and simulation in test planning |
| US9710257B2 (en) | 2009-09-11 | 2017-07-18 | International Business Machines Corporation | System and method to map defect reduction data to organizational maturity profiles for defect projection modeling |
| US20110066890A1 (en) * | 2009-09-11 | 2011-03-17 | International Business Machines Corporation | System and method for analyzing alternatives in test plans |
| US9558464B2 (en) | 2009-09-11 | 2017-01-31 | International Business Machines Corporation | System and method to determine defect risks in software solutions |
| US20110066557A1 (en) * | 2009-09-11 | 2011-03-17 | International Business Machines Corporation | System and method to produce business case metrics based on defect analysis starter (das) results |
| US9176844B2 (en) | 2009-09-11 | 2015-11-03 | International Business Machines Corporation | System and method to classify automated code inspection services defect output for defect analysis |
| US9442821B2 (en) | 2009-09-11 | 2016-09-13 | International Business Machines Corporation | System and method to classify automated code inspection services defect output for defect analysis |
| US9262736B2 (en) | 2009-09-11 | 2016-02-16 | International Business Machines Corporation | System and method for efficient creation and reconciliation of macro and micro level test plans |
| US9292421B2 (en) | 2009-09-11 | 2016-03-22 | International Business Machines Corporation | System and method for resource modeling and simulation in test planning |
| US8813039B2 (en) | 2010-04-14 | 2014-08-19 | International Business Machines Corporation | Method and system for software defect reporting |
| US9465725B2 (en) | 2010-04-14 | 2016-10-11 | International Business Machines Corporation | Software defect reporting |
| US10489283B2 (en) | 2010-04-14 | 2019-11-26 | International Business Machines Corporation | Software defect reporting |
| US8601441B2 (en) * | 2010-07-17 | 2013-12-03 | Accenture Global Services Limited | Method and system for evaluating the testing of a software system having a plurality of components |
| US20120017195A1 (en) * | 2010-07-17 | 2012-01-19 | Vikrant Shyamkant Kaulgud | Method and System for Evaluating the Testing of a Software System Having a Plurality of Components |
| US20140033176A1 (en) * | 2012-07-26 | 2014-01-30 | Infosys Limited | Methods for predicting one or more defects in a computer program and devices thereof |
| US9038030B2 (en) * | 2012-07-26 | 2015-05-19 | Infosys Limited | Methods for predicting one or more defects in a computer program and devices thereof |
| US10664335B2 (en) | 2013-02-01 | 2020-05-26 | Jpmorgan Chase Bank, N.A. | System and method for maintaining the health of a machine |
| US10002041B1 (en) | 2013-02-01 | 2018-06-19 | Jpmorgan Chase Bank, N.A. | System and method for maintaining the health of a machine |
| US9898262B2 (en) | 2013-02-01 | 2018-02-20 | Jpmorgan Chase Bank, N.A. | User interface event orchestration |
| US9720655B1 (en) | 2013-02-01 | 2017-08-01 | Jpmorgan Chase Bank, N.A. | User interface event orchestration |
| US9537790B1 (en) | 2013-02-22 | 2017-01-03 | Jpmorgan Chase Bank, N.A. | Breadth-first resource allocation system and methods |
| US9882973B2 (en) | 2013-02-22 | 2018-01-30 | Jpmorgan Chase Bank, N.A. | Breadth-first resource allocation system and methods |
| US9088459B1 (en) | 2013-02-22 | 2015-07-21 | Jpmorgan Chase Bank, N.A. | Breadth-first resource allocation system and methods |
| US9612725B1 (en) | 2013-02-28 | 2017-04-04 | The Boeing Company | Nonconformance visualization system |
| US9292180B2 (en) | 2013-02-28 | 2016-03-22 | The Boeing Company | Locator system for three-dimensional visualization |
| US9340304B2 (en) | 2013-02-28 | 2016-05-17 | The Boeing Company | Aircraft comparison system |
| US9182892B2 (en) | 2013-02-28 | 2015-11-10 | The Boeing Company | Condition of assembly visualization system |
| US10068176B2 (en) | 2013-02-28 | 2018-09-04 | Huawei Technologies Co., Ltd. | Defect prediction method and apparatus |
| US10061481B2 (en) | 2013-02-28 | 2018-08-28 | The Boeing Company | Methods and devices for visually querying an aircraft based on an area of an image |
| US9110560B1 (en) | 2013-02-28 | 2015-08-18 | The Boeing Company | Shop order status visualization system |
| US9870444B2 (en) | 2013-03-05 | 2018-01-16 | The Boeing Company | Shop order status visualization system |
| US9448792B2 (en) | 2013-03-14 | 2016-09-20 | Microsoft Technology Licensing, Llc | Automatic risk analysis of software |
| US10747652B2 (en) | 2013-03-14 | 2020-08-18 | Microsoft Technology Licensing, Llc | Automatic risk analysis of software |
| US9864678B2 (en) | 2013-03-14 | 2018-01-09 | Microsoft Technology Licensing, Llc | Automatic risk analysis of software |
| US9492900B2 (en) | 2013-03-15 | 2016-11-15 | The Boeing Company | Condition of assembly visualization system based on build cycles |
| US10331295B2 (en) | 2013-03-28 | 2019-06-25 | The Boeing Company | Visualization of an object using a visual query system |
| US10481768B2 (en) * | 2013-04-12 | 2019-11-19 | The Boeing Company | Nonconformance identification and visualization system and method |
| US20140310629A1 (en) * | 2013-04-12 | 2014-10-16 | The Boeing Company | Nonconformance Visualization System |
| US9880694B2 (en) | 2013-05-09 | 2018-01-30 | The Boeing Company | Shop order status visualization system |
| US10416857B2 (en) | 2013-05-09 | 2019-09-17 | The Boeing Company | Serial number control visualization system |
| US10067650B2 (en) | 2013-06-20 | 2018-09-04 | The Boeing Company | Aircraft comparison system with synchronized displays |
| US9922299B2 (en) | 2013-07-17 | 2018-03-20 | Bank Of America Corporation | Determining a quality score for internal quality analysis |
| US20150025942A1 (en) * | 2013-07-17 | 2015-01-22 | Bank Of America Corporation | Framework for internal quality analysis |
| US9286394B2 (en) | 2013-07-17 | 2016-03-15 | Bank Of America Corporation | Determining a quality score for internal quality analysis |
| US9633324B2 (en) | 2013-07-17 | 2017-04-25 | Bank Of America Corporation | Determining a quality score for internal quality analysis |
| US9916548B2 (en) | 2013-07-17 | 2018-03-13 | Bank Of America Corporation | Determining a quality score for internal quality analysis |
| US9600794B2 (en) | 2013-07-17 | 2017-03-21 | Bank Of America Corporation | Determining a quality score for internal quality analysis |
| US9378477B2 (en) * | 2013-07-17 | 2016-06-28 | Bank Of America Corporation | Framework for internal quality analysis |
| US9900267B2 (en) | 2013-10-03 | 2018-02-20 | Jpmorgan Chase Bank, N.A. | Systems and methods for packet switching |
| US9619410B1 (en) | 2013-10-03 | 2017-04-11 | Jpmorgan Chase Bank, N.A. | Systems and methods for packet switching |
| US9542259B1 (en) | 2013-12-23 | 2017-01-10 | Jpmorgan Chase Bank, N.A. | Automated incident resolution system and method |
| US10678628B2 (en) | 2013-12-23 | 2020-06-09 | Jpmorgan Chase Bank, N.A. | Automated incident resolution system and method |
| US9868054B1 (en) | 2014-02-10 | 2018-01-16 | Jpmorgan Chase Bank, N.A. | Dynamic game deployment |
| US10275333B2 (en) * | 2014-06-16 | 2019-04-30 | Toyota Jidosha Kabushiki Kaisha | Risk analysis of codebase using static analysis and performance data |
| US20190377665A1 (en) * | 2015-03-19 | 2019-12-12 | Teachers Insurance And Annuity Association Of America | Evaluating and presenting software testing project status indicators |
| US10901875B2 (en) * | 2015-03-19 | 2021-01-26 | Teachers Insurance And Annuity Association Of America | Evaluating and presenting software testing project status indicators |
| US10354210B2 (en) | 2015-04-16 | 2019-07-16 | Entit Software Llc | Quality prediction |
| US9619363B1 (en) * | 2015-09-25 | 2017-04-11 | International Business Machines Corporation | Predicting software product quality |
| US10685147B2 (en) | 2016-02-29 | 2020-06-16 | The Boeing Company | Non-conformance mapping and visualization |
| US11144308B2 (en) | 2017-09-15 | 2021-10-12 | Cognizant Technology Solutions India Pvt. Ltd. | System and method for predicting defects in a computer program |
| US11151023B2 (en) | 2017-11-20 | 2021-10-19 | Cognizant Technology Solutions India Pvt. Ltd. | System and method for predicting performance failures in a computer program |
| US11288065B2 (en) | 2018-07-02 | 2022-03-29 | International Business Machines Corporation | Devops driven cognitive cost function for software defect prediction |
| CN111782548A (en) * | 2020-07-28 | 2020-10-16 | 南京航空航天大学 | Software defect prediction data processing method and device and storage medium |
| CN111782548B (en) * | 2020-07-28 | 2022-04-05 | 南京航空航天大学 | Software defect prediction data processing method and device and storage medium |
Also Published As
| Publication number | Publication date |
|---|---|
| EP0786725A1 (en) | 1997-07-30 |
Similar Documents
| Publication | Publication Date | Title |
|---|---|---|
| US6477471B1 (en) | Product defect predictive engine | |
| Musa et al. | Software reliability | |
| AU3473299A (en) | Computer-aided methods and apparatus for assessing an organizational process or system | |
| Kanoun et al. | Qualitative and quantitative reliability assessment | |
| Westfall | 12 Steps to useful software metrics | |
| Freimut et al. | Determining inspection cost-effectiveness by combining project data and expert opinion | |
| US20040204972A1 (en) | Software tool for evaluating the efficacy of investments in software verification and validation activities and risk assessment | |
| Huang et al. | Daily mortality/morbidity and air quality: Using multivariate time series with seasonally varying covariances | |
| US20040019519A1 (en) | Method of evaluating a service to be supplied and system using the same | |
| US6480808B1 (en) | Method and apparatus for calculating confidence intervals | |
| Stringfellow et al. | Estimating the number of components with defects post‐release that showed no defects in testing | |
| JP2954613B2 (en) | Plant life diagnosis support equipment | |
| Sweeney | Measuring process safety management | |
| Nielsen | Value of information of structural health monitoring with temporally dependent observations | |
| JPH0949896A (en) | Radiation control plan planning system | |
| Bendixen et al. | Chemical plant risk assessment using HAZOP and fault tree methods | |
| Rosqvist | Stopping time optimisation in condition monitoring | |
| Grbac et al. | Quantifying value of adding inspection effort early in the development process: A case study | |
| Rani et al. | Risk probability of time and cost on building construction project: A Monte Carlo simulation | |
| JP2004150920A (en) | Loss evaluation system for building and program therefor | |
| Cook | Estimating required contingency funds for construction projects using multiple linear regression | |
| Miller et al. | Activities on component reliability under the OECD Nuclear Energy Agency | |
| Generazio | Interrelationships Between Receiver/Relative Operating Characteristics Display, Binomial, Logit, and Bayes' Rule Probability of Detection Methodologies | |
| Sherer et al. | Focusing Audit Testing on High Risk Software Modules: A Methodology and an Application. | |
| JP3229773B2 (en) | Product sales volume forecasting device |
Legal Events
| Date | Code | Title | Description |
|---|---|---|---|
| AS | Assignment |
Owner name: TEXAS INSTRUMENTS INCORPORATED, TEXAS Free format text: ASSIGNMENT OF ASSIGNORS INTEREST;ASSIGNORS:HEDSTROM, JOHN R.;WATSON, DAN A.;REEL/FRAME:008293/0841;SIGNING DATES FROM 19951025 TO 19951116 |
|
| FPAY | Fee payment |
Year of fee payment: 4 |
|
| FPAY | Fee payment |
Year of fee payment: 8 |
|
| REMI | Maintenance fee reminder mailed | ||
| LAPS | Lapse for failure to pay maintenance fees | ||
| STCH | Information on status: patent discontinuation |
Free format text: PATENT EXPIRED DUE TO NONPAYMENT OF MAINTENANCE FEES UNDER 37 CFR 1.362 |
|
| FP | Lapsed due to failure to pay maintenance fee |
Effective date: 20141105 |