US6668079B2 - Method of processing image signal - Google Patents

Method of processing image signal Download PDF

Info

Publication number
US6668079B2
US6668079B2 US09/852,633 US85263301A US6668079B2 US 6668079 B2 US6668079 B2 US 6668079B2 US 85263301 A US85263301 A US 85263301A US 6668079 B2 US6668079 B2 US 6668079B2
Authority
US
United States
Prior art keywords
signals
colorimetric
color
density
converting
Prior art date
Legal status (The legal status is an assumption and is not a legal conclusion. Google has not performed a legal analysis and makes no representation as to the accuracy of the status listed.)
Expired - Fee Related, expires
Application number
US09/852,633
Other versions
US20030053085A1 (en
Inventor
Fumito Takemoto
Current Assignee (The listed assignees may be inaccurate. Google has not performed a legal analysis and makes no representation or warranty as to the accuracy of the list.)
Fujifilm Corp
Original Assignee
Fuji Photo Film Co Ltd
Priority date (The priority date is an assumption and is not a legal conclusion. Google has not performed a legal analysis and makes no representation as to the accuracy of the date listed.)
Filing date
Publication date
Priority claimed from JP31976996A external-priority patent/JP3770671B2/en
Priority claimed from JP31973696A external-priority patent/JP3803441B2/en
Priority claimed from JP31974996A external-priority patent/JP3671097B2/en
Priority claimed from JP8342050A external-priority patent/JPH10191077A/en
Application filed by Fuji Photo Film Co Ltd filed Critical Fuji Photo Film Co Ltd
Priority to US09/852,633 priority Critical patent/US6668079B2/en
Publication of US20030053085A1 publication Critical patent/US20030053085A1/en
Application granted granted Critical
Publication of US6668079B2 publication Critical patent/US6668079B2/en
Assigned to FUJIFILM CORPORATION reassignment FUJIFILM CORPORATION ASSIGNMENT OF ASSIGNORS INTEREST (SEE DOCUMENT FOR DETAILS). Assignors: FUJIFILM HOLDINGS CORPORATION (FORMERLY FUJI PHOTO FILM CO., LTD.)
Adjusted expiration legal-status Critical
Expired - Fee Related legal-status Critical Current

Links

Images

Classifications

    • HELECTRICITY
    • H04ELECTRIC COMMUNICATION TECHNIQUE
    • H04NPICTORIAL COMMUNICATION, e.g. TELEVISION
    • H04N1/00Scanning, transmission or reproduction of documents or the like, e.g. facsimile transmission; Details thereof
    • H04N1/46Colour picture communication systems
    • H04N1/56Processing of colour picture signals
    • H04N1/60Colour correction or control
    • H04N1/6058Reduction of colour to a range of reproducible colours, e.g. to ink- reproducible colour gamut
    • HELECTRICITY
    • H04ELECTRIC COMMUNICATION TECHNIQUE
    • H04NPICTORIAL COMMUNICATION, e.g. TELEVISION
    • H04N1/00Scanning, transmission or reproduction of documents or the like, e.g. facsimile transmission; Details thereof
    • H04N1/46Colour picture communication systems
    • H04N1/56Processing of colour picture signals
    • H04N1/60Colour correction or control
    • H04N1/6016Conversion to subtractive colour signals
    • H04N1/6022Generating a fourth subtractive colour signal, e.g. under colour removal, black masking
    • HELECTRICITY
    • H04ELECTRIC COMMUNICATION TECHNIQUE
    • H04NPICTORIAL COMMUNICATION, e.g. TELEVISION
    • H04N1/00Scanning, transmission or reproduction of documents or the like, e.g. facsimile transmission; Details thereof
    • H04N1/46Colour picture communication systems
    • H04N1/56Processing of colour picture signals
    • H04N1/60Colour correction or control
    • H04N1/603Colour correction or control controlled by characteristics of the picture signal generator or the picture reproducer
    • H04N1/6033Colour correction or control controlled by characteristics of the picture signal generator or the picture reproducer using test pattern analysis

Definitions

  • the present invention relates to a method of processing an image signal, and more particularly to a method of converting an image signal such as R (red), G (green), B (blue) signals generated by an imaging device such as a color digital camera (also referred to as a digital camera) and representing an original scene which is captured by the imaging device, or an imaging signal such as R, G, B signals generated by an image reading device such as a color scanner (also referred to as a scanner), into a colorimetric signal, processing a colorimetric signal for setup, converting a calorimetric signal processed for setup into a dye density signal for use on a reversal medium, or converting a colorimetric signal processed for setup into c, m, y, k (cyan, magenta, yellow, and black) signals for being supplied to an image output device such as a film producing device, a plate producing device, a color printer, or the like.
  • an image output device such as a film producing device, a plate producing device, a color printer,
  • Device-dependent image signals such as R, G, B signals generated by color digital cameras are converted into device-independent image signals such as tristimulus signals X, Y, Z according to color conversion processes disclosed in Japanese laid-open patent publications Nos. 2-291777 and 2-291778, for example.
  • a three-dimensional (XYZ) color space is divided into 512 cubic regions, and color correcting values at a total of 729 grid points are calculated in a process optimized for the characteristics of an output device and stored as the data of a look up table (LUT).
  • Input values between the grid points are determined by a interpolating process which three-dimensionally interpolates the LUT.
  • R, G, B signals produced from a color reversal subject (prepared by exposing a color reversal film to light from an image, developing the image on the color reversal film) which carries a positive image are converted into equivalent neutral density (END) signals by a color scanner which is a linear scanning reader, and the END signals are converted into halftone dot % signals with reference to setup points (highlight and shadow points) determined by a setup process.
  • the halftone dot % signals are then converted into c, m, y, k signals, which are then binarized (i.e., converted into halftone dots), finally producing a printing plate or a printed material.
  • R, G, B signals are processed for setup based on color-separating default conditions (image processing conditions including at least a gradation conversion process, a color correction process, an under color removal process, and a K-plate generating process) which are carried on the respective color scanners and empirically optimized, and R, G, B signals produced from a color reversal subject are converted into c, m, y, k signals.
  • image processing conditions including at least a gradation conversion process, a color correction process, an under color removal process, and a K-plate generating process
  • color-separating default conditions may be established using an image processing tool (software) such as Adobe Photoshop (registered trademark).
  • Another object of the present invention is to provide a method of processing an image signal, which allows a setup process based on END signals, for which gray conditions are prescribed in a device-dependent signal system, to be applied to a device-independent signal system.
  • Still another object of the present invention is to provide a method of processing an image signal for producing c, m, y, k signals capable of reproducing colors of an original scene with ease and accuracy.
  • Yet still another object of the present invention is to provide a method of processing an image signal, which is capable of converting image signals of an original scene captured by a digital camera into color signals that can utilize empirically optimized standard default separating conditions of an existing scanner.
  • a further object of the present invention is to provide a method of processing an image signal, which will convert R, G, B image signals generated by a digital camera or R, G, B image signals read by a scanner into c, m, y, k signals using empirically optimized default separating conditions of a particular existing scanner.
  • FIG. 1 is a block diagram of an image signal processing apparatus which can carry out a method of processing an image signal according to the present invention
  • FIG. 2 is a flowchart of a sequence for generating a colorimetric conversion matrix
  • FIG. 3 is a flowchart of an operation sequence of a colorimetric setup unit
  • FIG. 4 is a CIE chromaticity diagram illustrative of a color reproduction range for reversal films
  • FIG. 5 is a flowchart of a conversion process for converting a colorimetric signal of a digital camera into a dye density signal on a reversal subject
  • FIG. 6 is a flowchart of another conversion process for converting a calorimetric signal of a digital camera into a dye density signal on a reversal subject
  • FIG. 7 is a flowchart of a sequence for generating a dye density conversion matrix
  • FIG. 8 is a diagram illustrative of the Newton-Raphson method
  • FIG. 9 is a flowchart of a portion of the sequence for generating a dye density conversion matrix
  • FIG. 10 is a flowchart of a sequence for generating an accurate original scene reproduction table.
  • FIG. 11 is a flowchart of a sequence for generating a standard condition reproduction table.
  • FIG. 1 shows an overall arrangement of an image signal processing apparatus 10 which can carry out a method of processing an image signal according to the present invention.
  • the image signal processing apparatus 10 has a calorimetric converter 16 which will be supplied with R, G, B signals (digital image signals) 12 representing image-information of a scene that has been captured by a digital camera (not shown) as an imaging device, and also with R, G, B signals (digital image signals) 14 representing image information of a reversal subject that has been read by an image input unit (which may be referred to as a linear scanning reader or a scanner input unit) of a scanner (not shown) as an image reading device.
  • the digital camera may be a digital video camera or any device capable of capturing image signals and outputting digital image signals (digital image data).
  • the scanner may be a linear scanning reader which is a color scanner incorporating a linear image sensor or an area scanning reader which is a color scanner incorporating an area image sensor.
  • the calorimetric converter 16 has a colorimetric conversion matrix (hereinafter simply referred to as a matrix) 20 for converting R, G, B signals 12 from a digital camera into X, Y, Z or L*, a*, b* colorimetric signals (hereinafter referred to as X, Y, Z signals) 18 , and a colorimetric conversion table (hereinafter referred to as a colorimetric conversion lookup table, a lookup table, or a table) 24 for converting R, G, B signals from the scanner input unit into X, Y, Z signals or L*, a*, b* colorimetric signals 22 .
  • a colorimetric conversion matrix hereinafter simply referred to as a matrix
  • a colorimetric conversion matrix for converting R, G, B signals 12 from a digital camera into X, Y, Z or L*, a*, b* colorimetric signals (hereinafter referred to as X, Y, Z signals) 18
  • the R, G, B signals 12 , 14 are called device-dependent signals (data), and the calorimetric signals 18 , 22 are called device-independent signals (data).
  • the colorimetric signals 18 originating from the digital camera is supplied, if necessary, to a light source changer 25 which absorbs the difference between an imaging light source and an observing light source, a colorimetric setup unit (hereinafter also referred to as a setup unit) 26 for setting up a highlight area density and a shadow area density, a dye density converter 30 for converting the colorimetric signals 18 of the original scene (captured scene) into dye density signals 28 on the reversal subject, and an accurate original scene reproduction table 42 of a cmyk converter 32 .
  • a light source changer 25 absorbs the difference between an imaging light source and an observing light source
  • a colorimetric setup unit hereinafter also referred to as a setup unit 26 for setting up a highlight area density and a shadow area density
  • a dye density converter 30 for converting the colorimetric signals 18 of the original scene (captured scene) into dye density signals 28 on the reversal subject
  • an accurate original scene reproduction table 42 of a cmyk converter 32 for converting
  • the calorimetric signals 22 originating from the scanner input unit are supplied to the colorimetric setup unit 26 and a dye density converter 36 of a standard condition reproduction table unit 43 , for converting the calorimetric signals 22 into dye density signals 34 .
  • the dye density signals (c, m, y signals) 28 , 34 outputted from the dye density converters 30 , 36 are selected by a switch (multiplexer or selector) 45 and supplied to a standard condition reproduction table 44 .
  • the cmyk converter 32 basically has the accurate original scene reproduction table 42 and the standard condition reproduction table unit 43 .
  • the accurate original scene reproduction table 42 comprises a lookup table for converting the calorimetric signals 18 supplied from the digital camera into c, m, y, k signals 46 which are halftone dot % signals that are calorimetrically saved.
  • the standard condition reproduction table unit 43 has the dye density converter 36 for converting the colorimetric signals 22 into dye density signals 34 , the switch 45 for selecting either the dye density signals 28 from the dye density converter 30 or the dye density signals 34 signals from the dye density converter 36 , and the standard condition reproduction table 44 .
  • the standard condition reproduction table 44 serves to convert either the dye density signals 28 or the dye density signals 34 into c, m, y, k signals 48 which are halftone dot % signals.
  • the cmyk converter 32 has a three-color/four-color conversion function for converting signals in a trichromatic system into signals in a tetrachromatic system.
  • the c, m, y, k signals 46 , 48 which are halftone dot % signals outputted from the cmyk converter 32 are supplied to an image output unit 35 which outputs an image based on the c, m, y, k signals 46 , 48 .
  • the image output unit 35 may be of a known nature which comprises a binary converter (not shown), a laser beam exposure scanner (image setter or the like), an image developing unit, a printing plate generator, and a printing unit.
  • the binary converter compares the c, m, y, k signals 46 , 48 with C, M, Y, K threshold matrixes selected depending on output conditions representative of a screen ruling, a screen angle, and so on for thereby converting the c, m, y, k signals 46 , 48 into binary signals.
  • the laser beam exposure scanner applies a laser beam that is selectively turned on and off by the binary signals (also called binary image signals) to films to form latent images on the films.
  • the image developing unit develops the latent images on the films, producing platemaking films.
  • the printing plate generator then generates printing plates from the platemaking films.
  • the printing plates i.e., four C, M, Y, K printing plates, are mounted on a printing press, and inks of four colors applied to the printing plates are transferred to a sheet of print paper, which is produced as a printed hard copy carrying a color image.
  • the image output unit 35 may comprise a direct digital color proofing (DDCP) system capable of printing halftone dots according to a given screen ruling and angle directly as a halftone dot image on a sheet of print paper, without developing an image on a film, for simulating the image.
  • DDCP direct digital color proofing
  • the colorimetric setup unit 26 comprises a colorimetric END forward/inverse conversion matrix (hereinafter also referred to as a matrix) 50 for converting the calorimetric signals 18 , 22 into colorimetric END signals 52 , a rough data generator 54 for generating calorimetric END signals 56 from the colorimetric END signals 52 through a decimation process and outputting the colorimetric END signals 56 , an automatic setup unit 58 for automatically determining a highlight density signal 60 and a shadow density signal 62 based on the generated colorimetric END signals 56 , and an END/END converter 64 for gradation-converting the calorimetric END signals 52 into colorimetric END signals 66 .
  • the calorimetric END forward/inverse conversion matrix 50 also serves to convert the colorimetric END signals 66 back into the calorimetric signals 22 .
  • the image signal processing apparatus 10 is controlled by a computer (not shown) which includes a CPU, a ROM, a RAM, an external storage unit, a display monitor, an input/output device, and so on.
  • a computer not shown
  • the blocks of the image signal processing apparatus 10 which are described above are both hardware-implemented and software-implemented.
  • the computer which controls the image signal processing apparatus 10 functions as control, decision, calculation, and comparison means.
  • the matrix 20 of the colorimetric converter 16 for converting R, G, B signals 12 into X, Y, Z signals 18 is generated according to a sequence shown in FIG. 2 .
  • the matrix 20 will be described below as converting signals from an RGB color space into signals in a CIE-L*a*b* (light source: auxiliary standard light CIE-D50) color space.
  • Signal conversion between the CIE-L*a*b* color space and the XYZ color space can uniquely be carried out according to known equations (1) given below.
  • processing in the XYZ color space can be replaced with processing in the CIE-L*a*b* color space (or the XYZ color space), or with processing in an equivalent calorimetric color space.
  • a color chart 70 having a plurality of color patches 72 (see FIG. 2) representing typical colors with different chromas, lightnesses, and hues is generated in a step S 1 .
  • a Macbeth color checker (registered trademark: manufactured by Macbeth, a division of Kollmorgen, USA) is used as the color chart.
  • the Macbeth color checker has 24 colored squares with CIE (1931) xyY values, hues, Munsell color values, and chromas. The 24 colors are:
  • Neutral 8 (light gray, “8” represents Munsell color value 8)
  • the color chart is not limited to the Macbeth color checker, but may be a color chart which uniformly covers a color space, such as JIS standard color chips or the like.
  • the 24 colors of the color chart i.e., the 24 patches 72
  • the 24 colors of the color chart are imaged by a digital camera thereby to produce R, G, B signals 12 of each of the patches 72
  • the R, G, B signals 12 are converted into luminance values, which are then raised to the one-third power in a step S 2 .
  • the R, G, B signals 12 may be converted into luminance values by canceling the ⁇ correction that has been performed in the device.
  • the luminance values are raised to the one-third power in order to process the produced R, G, B signals 12 in the CIE-L*a*b* colorimetric system, as can be seen from the above equations (1).
  • R, G, B, R 2 , G 2 , B 2 , RG, GB, BR no variables up to terms of second order are calculated from the R, G, B signals 12 produced with respect to each of the patches 72 in the step S 2 , specifically, the R, G, B values that have been converged into luminance values and raised to the one-third power, in a step S 3 .
  • the 24-color data of the nine variables produced in the step S 3 are subjected to a principal component analysis to produce principal component scores V of the nine variables, in order to avoid a multicollineation phenomenon in a multiple regression analysis, in a step S 4 .
  • the principal component score V (V is considered to be a vector) expressed by the following equation (2):
  • V (v 1 , v 2 , v 3 , v 4 , v 5 , v 6 , v 7 , v 8 , v 9 ) (2)
  • the components (v 1 , v 2 , v 3 , v 4 , v 5 , v 6 , v 7 , v 8 , v 9 ) of the principal component score V are not correlated to each other whatsoever, and do not cause the multicollineation phenomenon.
  • the patches 72 of the color chart 70 are measured by a colorimetric meter (not shown) to produce their colorimetric values C (L*a*b*) (C is also considered to be a vector as it is produced for the 24 colors) in a step S 5 .
  • the colorimetric values C may be measured at any point of time in the steps S 2 -S 4 .
  • partial regression coefficients A (A is also considered to be a vector) are determined according to a multiple regression analysis in a step S 6 .
  • Pi represents the weight of each color.
  • Neutral 8 (light gray, “8” represents Munsell color value 8), 21.
  • Neutral 6.5 light medium gray
  • Neutral 5 medium gray
  • 23. Neutral 3.5 dark gray
  • the weights of not only the grays, but other limited desired colors, e.g., the color of skin for human beings or the color of sky for outdoor backgrounds, may be increased to reproduce those colors of skin and sky with higher accuracy.
  • the colors may automatically be weighted by statistically processing the inputted R, G, B signals 12 , i.e., dividing the color space of a one-frame image signal, i.e., pixel-divided image data, into regions around the colors of the patches of the chart, and weighting the colors depending on the frequencies of the pixels present in the regions, e.g., increasing the weight of the color whose pixel frequency is highest and progressively reducing the weights of the colors whose pixel frequencies are progressively lower.
  • the color space to be divided may be an RGB color space or an XYZ (L*a*b*) color space which has been converted with an unweighted matrix.
  • the partial regression coefficients A are determined using a method of least squares with respect to each of L*a*b*. With respect to L*, for example, partial regression coefficients a ij which minimize e L according to the following equation (6) may be determined:
  • i is the patch number of the color chart 70
  • Pi is the weight of each color
  • j is the number (1, 2, . . . , 10) of the variable.
  • the equation (6) is expressed by a vector and a matrix according to an equation (7) given below.
  • the calorimetric values C and the partial regression coefficients a are a vector
  • the principal component scores [V] and the weighted matrix [P] are a matrix
  • t represents the transpose of a matrix.
  • 10 partial regression coefficients a (a 1j ) with respect to L* are determined.
  • 10 partial regression coefficients a 2j with respect to a* and 10 partial regression coefficients a 3j with respect to b* are determined according to the same process.
  • the total number of the determined partial regression coefficients a 1j , a 2j , a 3j is 3 ⁇ 10 ⁇ see the equation (4) ⁇ .
  • the partial regression coefficients A determined with respect to the criterion variables L*a*b* are then tested with a significance level of 5% in a step S 8 , and explanatory variables V at the significance level of 5% (confidence level of 95%) are stored in the RAM, and the partial regression coefficients A are stored as the matrix 20 shown in FIG. 1 in a step S 9 .
  • the partial regression coefficients A may be tested with a significance level of 1% in the step S 8 .
  • the remark (j: a variable with a significance level of 5%) means that only a variable obtained by the test with the significance level of 5% is used, unlike the equation (5).
  • a 1j , a 2j , a 3j represent elements of the partial regression coefficient matrix A, and v j represent the principal component scores V as the explanatory variables determined in the step S 4 .
  • the matrix 20 it is possible to effect calorimetric conversion with the existing color chart 70 . Since no lookup table is employed, any memory capacity used may be small, i.e., calorimetric conversion can be effected with accuracy even though the memory capacity used is small.
  • Use of the weighted matrix P makes it possible to effect color conversion with accuracy, limited to desired colors (principal colors) of the image. If the number of explanatory variables is 9, then the testing process in the step S 8 may be dispensed with, and a matrix corresponding to the equations (17) may be generated using all the partial regression coefficients A.
  • the calorimetric signals 18 are then calorimetrically changed by the light source changer 25 into new calorimetric signals 18 . If the observing light source is the same as the imaging light source (CIE-D50) used when the image is captured by the digital camera, then calorimetric signals 18 do not need to be colorimetrically changed by the light source changer 25 .
  • CIE-D50 imaging light source
  • Colorimetric values X, Y, Z can be converted into new calorimetric values X′, Y′, Z′ by the light source changer 25 according to the following equations
  • X, Y, Z represent calorimetric values under the imaging light source
  • X′, Y′, Z calorimetric values under the observing light source X 1 , Y 1 , Z 1 white dots of the imaging light source
  • X 2 , Y 2 , Z 2 white dots of the observing light source X 1 , Y 1 , Z 1 white dots of the imaging light source.
  • the R, G, B signals from the scanner input unit are converted into calorimetric signals 22 which are X, Y, Z signals by the colorimetric conversion table 24 .
  • the R, G, B signals 14 supplied from the scanner input unit are converted into the colorimetric signals 22 by the colorimetric conversion table 24 and the R, G, B signals 12 supplied from the digital camera are converted into the calorimetric signals 18 by the colorimetric conversion matrix 20 , they can be processed by an automatic setup process using the calorimetric setup unit 26 in common.
  • automatic setup process software can be used in common on the colorimetric signals 18 , 22 because the colorimetric signals 18 , 22 are converted into a colorimetric END signal.
  • the calorimetric setup unit 26 and its operation sequence will be described below with reference to FIGS. 1, 3 , and 4 .
  • gradation conversion has been carried out in a density space as its intuitive understanding can easily be attained in the density space.
  • Image processing such as gradation conversion and color correction on commercially available color scanners is also effected with respect to density signals.
  • the colorimetric END forward/inverse conversion matrix 50 converts the colorimetric signals 18 or the colorimetric signals 22 into c, m, y END (equivalent neutral density) signals 52 , which are colorimetric density signals, in a step S 11 .
  • the conversion process in the step S 11 comprises a linear conversion process for converting calorimetric signals in an XYZ colorimetric system into calorimetric signals in an RGB colorimetric system in a step S 11 a, and a nonlinear conversion process for converting colorimetric signals in the RGB colorimetric system into colorimetric signals in a cmy colorimetric system in a step S 11 b.
  • the END signals converted from the calorimetric signals 18 or the calorimetric signals 22 are referred to as calorimetric END signals 52 .
  • a color reproduction range 71 (shown hatched in FIG. 4) of a reversal film is drawn on a CIE chromaticity diagram shown in FIG. 4 . It is assumed that coordinates on the chromaticity diagram, i.e., chromaticity coordinates, of three reference color stimuli Rxyz, Gxyz, Bxyz of a range 73 which contains the color reproduction range 71 are represented by equations (21)-(23) given below.
  • the range 73 represents a triangular area whose vertexes are indicated respectively by the reference color stimuli Rxyz, Gxyz, Bxyz on the chromaticity diagram shown in FIG. 4 .
  • the equation (25) given below can convert the colorimetric signals 22 in the XYZ colorimetric system (the right matrix on the right-hand side of the equation (25)) through a conversion matrix (the left matrix on the right-hand side of the equation (25)) into color signals R, G, B in the RGB colorimetric system (the matrix on the left-hand side of the equation (25)).
  • R G B ( R X R Y R Z G X G Y G Z B X B Y B Z ) ⁇ ( X Y Z ) ( 25 )
  • R X A 11 / ⁇ 1
  • R Y A 12 / ⁇ 1
  • R Z A 13 / ⁇ 1
  • G X A 21 / ⁇ 2
  • G Y A 22 / ⁇ 2
  • G Z A 33 / ⁇ 2
  • B X A 31 / ⁇ 3
  • B Y A 32 / ⁇ 3
  • B Z A 33 / ⁇ 3
  • the cofactor A ij is determined according to the following equation:
  • D ij represents a submatrix from which an ith row and a jth column have been removed.
  • the c, m, y values of the calorimetric END signals 52 can be determined by finding ratios of the values of R, G, B calculated according to the equation (25) to the values Rw, Gw, Bw of R, G, B which are calculated by substituting the coordinates of the basic stimulus (white stimulus) Wxyz in the equation (25), and logarithmically converting the ratios according to the following equations (26) through (28):
  • the rough data generator 54 effects a rough scanning process in order to shorten the setup process by selecting data from only an image area of the subject that has been specified by the operator through the CPU or generating decimated data from an image that is present on the entire area of the subject, rather than processing colorimetric END signals 52 of the entire subject.
  • the automatic setup unit 58 carries out an automatic setup process based on colorimetric END signals 56 which are the rough data selected by the rough data generator 54 in a step S 12 .
  • the automatic setup unit 58 generates a histogram with respect to the colorimetric END signals 56 and thereafter generates a cumulative histogram, as is known from Japanese laid-open patent publication No. 2-105676.
  • a value of the colorimetric END signals 56 which corresponds to 0.1% point data (HL density) D 1 is set to DH
  • a value of the calorimetric END signals 56 which corresponds to 98% point data (SD density) D 2 is set to DS, in the step S 12 .
  • point data (HL density) D 1 of 0.1% is converted into a density corresponding to 0% in terms of halftone dot %
  • point data (SD density) D 2 of 98% is converted into a density corresponding to 100% in terms of halftone dot %.
  • the END/END converter 64 converts all the colorimetric END signals 52 of main scanned data (data toward which the rough scanning process is directed) into colorimetric END signals 66 , i.e., converts gradation characteristics or corrects the gradation of the colorimetric END signals 52 .
  • the conversion equation used by the END/END converter 64 may be the equation of a curve that passes through a highlight point 75 (D 1 , DH) and a shadow point 76 (D 2 , DS).
  • the values of HL density D 1 and SD density D 2 (or the setup points 75 , 76 ) are automatically determined under the predetermined conditions described above.
  • the values of HL density D 1 and SD density D 2 may be determined manually, or the values of DH, DS may be corrected manually after the automatic setup process, in a manual setup process.
  • the calorimetric END forward/inverse conversion matrix inversely converts the c, m, y values of the calorimetric END signals 66 converted by the END/END converter 64 back into X, Y, Z values of calorimetric signals 22 in a step S 14 .
  • the conversion process in the step S 14 comprises a conversion process for converting the c, m, y values of the calorimetric END signals 66 into R, G, B values in an RGB calorimetric system in a step S 14 a, and a conversion process for converting the R, G, B values in the RGB calorimetric system into calorimetric signals 22 which have X, Y, Z values in an XYZ colorimetric system in a step S 14 b.
  • the conversion process for converting the c, m, y values of the calorimetric END signals 66 into R, G, B values in an RGB colorimetric system is carried out according to the following equations (29)-(31) which solve the equations (26)-(28) for R, G, B, and the conversion process for converting the R, G, B values in the RGB calorimetric system into X, Y, Z values in an XYZ colorimetric system is carried out according to the following equation (32) which solves the equation (25) for a matrix XYZ:
  • the above setup process has been described with respect to colorimetric signals 22 from a reversal subject. However, the setup process may be applied to colorimetric signals 18 from a digital camera.
  • reversal subjects are generally used as original subjects in the art of printing and platemaking.
  • a reversal subject is exposed to an original scene, and a print is produced on the basis of colors in a color reproduction range 71 on the reversal subject.
  • This means that the color reproduction range 71 in which colors are produced on the reversal subject is sufficient as a color reproduction range for image signals that are handled.
  • the colorimetric setup unit 26 linearly converts colorimetric values X, Y, Z into R, G, B values in a three-primary colorimetric system, logarithmically converts the ratios of the R, G, B values to basic stimuli (light source) R W , G W , B W thereby to determine END values, and effects the automatic setup process using the END values. Then, the colorimetric setup unit 26 converts the END values into other END values, inversely logarithmically converts the END values into modified R, G, B values, and converts the R, G, B values into colorimetric values X, Y, Z. Therefore, the automatic setup process can be carried out on the basis of existing density signals. The setup process may also be effected as the manual setup process.
  • the dye density converter 30 will be described below with reference to FIGS. 1, 5 , and 6 .
  • the dye density converter 30 converts the calorimetric signals (X, Y, Z) 18 of an original scene which are captured by a digital camera into dye density signals (c, m, y) 28 on a reversal subject.
  • the conversion process carried out by the dye density converter 30 may be a process shown in FIG. 5 or a process shown in FIG. 6 .
  • the colorimetric signals (X, Y, Z) 18 of an original scene are converted into dye density signals (c, m, y) 81 of the original scene by a lookup table in a step S 21 (first stage), and the dye density signals (c, m, y) 81 of the original scene are converted into dye density signals (c, m, y) 28 on a reversal subject (hereafter also referred to as an RV) by a matrix (described later on) in a step S 22 (second stage).
  • a reversal subject hereafter also referred to as an RV
  • the calorimetric signals (X, Y, Z) 18 of an original scene are converted into dye density signals (c, m, y) 82 on a reversal subject by a matrix (described later on) in a step S 31 (first stage), and the dye density signals (c, m, y) 82 on the reversal subject are converted into dye density signals (c, m, y) 28 on the reversal subject by a lookup table in a step S 32 (second stage).
  • ⁇ vis definite integral in the visible wavelength range (380 nm-780 nm)
  • T( ⁇ ) spectral transmittance data of the dye of a transmissive object
  • x( ⁇ ), y( ⁇ ), z( ⁇ ) color matching function Dc( ⁇ ), Dm( ⁇ ), Dy( ⁇ ): spectral density data of c, m, y dyes
  • equations (33)-(35) can be expressed as the following equations (37)-(39):
  • ⁇ fx/ ⁇ c represents a partial differential coefficient of the function fx with respect to c.
  • Equation (40) is modified into an equation (41) given below.
  • ⁇ Y, ⁇ Z are also represented by respective equations (42), (43) as follows:
  • (Q) represents a three-row, one-column matrix of elements which are ⁇ X, ⁇ Y, ⁇ Z arranged successively from the first row, (J) a Jacobian matrix of partial differential coefficients arranged in three rows and three columns, and (P) a three-row, one-column matrix of elements which are ⁇ c, ⁇ m, ⁇ y arranged successively from the first row.
  • a process of generating a matrix for use in the second stage which follows the first stage in the step S 21 will be described below.
  • the process of generating a matrix for use in the second stage includes the multiple regression analysis described above with reference to FIG. 2, and hence will briefly be described below.
  • the 24-color data of the nine variables produced in the step S 22 a are subjected to a principal component analysis to produce principal component scores of the nine principal components in a step S 22 b.
  • Colorimetric values X, Y, Z of 24 colors of a Macbeth color checker on a reversal film are measured by a colorimetric meter in a step S 22 c.
  • Dye densities c, m, y (also referred to as RVc, RVm, RVy) on the reversal film are determined by the Newton-Raphson method in a step S 22 d.
  • a 3 ⁇ 10 matrix of partial regression coefficients is determined by a multiple regression analysis in a step S 22 e.
  • the multiple regression analysis may be subjected to a weighted matrix that is held in 1:1 correspondence to the 24 colors which constitute a group of criterion variables in a step S 22 f.
  • the partial regression coefficients determined with respect to the criterion variables RVc, RVm, RVy are tested with a significance level of 5% in a step S 22 g, and explanatory variables at the significance level of 5% are stored in the RAM, and the partial regression coefficients are stored as the matrix for use in the second-stage processing in the dye density converter 30 in a step S 22 h.
  • the partial regression coefficients may not be tested, but all of them may be used.
  • the dye density converter 30 for converting calorimetric signals 18 of an original scene into dye density signals c, m, y on a reversal subject is constructed.
  • FIG. 9 The process shown in FIG. 6 will be described with reference to FIG. 9 .
  • the sequence shown in FIG. 9 includes the multiple regression analysis described above with reference to FIG. 2, and hence will briefly be described below.
  • Colorimetric values X, Y, Z of the 24 colors of the Macbeth color checker 70 are measured by a calorimetric meter in a step S 31 a (FIG. 9 ).
  • the 24-color data of the nine variables are subjected to a principal component analysis to produce principal component scores of the nine principal components in a step S 31 c.
  • Colorimetric values X, Y, Z of 24 colors of a Macbeth color checker on a reversal film are measured by a calorimetric meter in a step S 31 d.
  • the Macbeth color checker on the reversal film is produced by photographing the image of a Macbeth color checker under a certain light source with an optical camera loaded with a reversal film, and then developing the photographed image on the reversal film.
  • a 3 ⁇ 10 matrix of partial regression coefficients is determined by a multiple regression analysis in a step S 31 e.
  • the multiple regression analysis may be subjected to a weighted matrix that is held in 1:1 correspondence to the 24 colors which constitute a group of criterion variables in a step S 31 f.
  • the partial regression coefficients determined with respect to the criterion variables RVX, RVY, RVZ are tested with a significance level of 5% in a step S 31 g, and explanatory variables at the significance level of 5% are stored in the RAM, and the partial regression coefficients are stored as the matrix for use in the first-stage processing in the dye density converter 30 in a step S 31 h.
  • the partial regression coefficients may not be tested, but all of them may be used.
  • the table for use in the second stage in the step S 32 is generated according to a process which is the same as the process in the step S 21 or the step S 22 d described with reference to FIG. 7, and hence the process of generating the table for use in the second stage in the step S 32 will not be described below.
  • a process of generating the accurate original scene reproduction table 42 of the cmyk converter 32 will be described below with reference to FIG. 10 .
  • the accurate original scene reproduction table 42 is a lookup table for converting the calorimetric signals (X, Y, Z) 18 into c, m, y, k signals (c, m, y, k data) 46 which are calorimetrically saved halftone dot % data.
  • a plurality of c, m, y, k halftone dot % data spaced at regular intervals are supplied to the image output unit 35 to generate a cmyk color chart having color patches whose c, m, y, k densities and mixed ratios vary stepwise in a step S 41 .
  • the color patches of the cmyk color chart generated by the image output unit 35 are calorimetrically measured by a calorimetric meter in a step S 42 .
  • Colorimetric values (stimulus values) X, Y, Z are determined from the measured calorimetric data, and a conversion table (called a forward conversion table) for converting the c, m, y, k halftone dot % data into calorimetric value data X, Y, Z is generated in a step S 43 .
  • the forward conversion table is used as an interpolating table. Therefore, the smaller the regular intervals described above, the better for interpolation accuracy. However, since smaller regular intervals result in a larger expenditure of time and labor required for calorimetrically measuring the color patches, a trade-off should be made between the complexity of the colorimetric measurement and the interpolation accuracy, and a computer processing time described below.
  • c, m, y, k signals (c, m, y, k halftone dot % data, color data c, m, y, k, or c, m, y, k) from inputted arbitrary calorimetric value signals (colorimetric value data X, Y, Z, stimulus value data X, Y, Z, or X, Y, Z) according to the accurate original scene reproduction table 42 , since variables increase from three variables to four variables, a plurality of solutions of c, m, y, k halftone dot % data 46 may exist with respect to one set of colorimetric value data X, Y, Z.
  • Kmax is the same as 100%, for example, for the value of k of the c, m, y, k halftone dot % data.
  • the determined c, m, y values are values (colors) within a reproduction range of the image output unit 35 in a step S 46 . Specifically, it is determined whether the determined values c, m, y satisfy the following ranges: Cmin ⁇ c ⁇ Cmax ⁇ ⁇ Mmin ⁇ m ⁇ Mmax ⁇ ⁇ Ymin ⁇ y ⁇ Ymax ( 49 )
  • Cmin, Mmin, Ymin represent reproducible minimum densities of the halftone dot % data (color data) and Cmax, Mmax, Ymax reproducible maximum densities thereof.
  • the data set (csol, msol, ysol, ksol) will also be referred to as color data cmyksol.
  • the minute change ⁇ k constitutes an arbitrary data interval of the color data k of the inverse conversion table.
  • the minute change ⁇ k may be set to 1%, and if the color data k is established as data in a range from 0 to 255,then the minute change ⁇ k may be set to 1.
  • the above process is carried out while all the stimulus value data X, Y, Z 18 supplied to the accurate original scene reproduction table 42 are being used as target values (X0, Y0, Z0), for thereby determining color data cmyksol when maximum color data k is given to the stimulus value data X, Y, Z 18 capable of producing halftone dot % data c, m, y, k 46 within the color reproduction range of the image output unit 35 , in a step S 51 .
  • the color data c, m, y, k indicated as data outside of the color reproduction range of the image output unit 35 in the steps S 49 , S 50 will not be described in detail because they have no direct bearing on the features of the present invention.
  • the association table of the c, m, y, k signals 46 determined with respect to all the target values (X0, Y0, Z0) of the colorimetric signals 18 is stored as the accurate original scene reproduction table 42 for thereby converting arbitrary colorimetric signals 18 into c, m, y, k signals 46 within the color reproduction range of the image output unit 35 .
  • a color chart having 13 ⁇ 13 ⁇ 13 color patches having different dye densities c, m, y that are arranged in a grid-like pattern on a reversal subject are generated in a step S 61 .
  • the color chart has color patches representing a combination of colors c, m, y, each having 13 densities ranging from a minimum density to a maximum density.
  • the color chart is color-separated under color-separating default conditions of a color scanner. Stated otherwise, the color chart, which is a transmissive subject, is read by the color scanner so as to be converted into digital data in a step S 62 .
  • the color-separating default conditions include at least a gradation conversion process, a color correction process, an under color removal process, and a K-plate generating process.
  • the minimum density of gray of the color patches is established such that the corresponding data of c, m, y, k halftone dot % are all 0%
  • the maximum density of gray of the color patches is established such that the corresponding data of c, m, y, k halftone dot % represent a solid image.
  • the dye densities of the color patches and the values of c, m, y, k halftone dot % which are color-separated under the color-separating default conditions of the color scanner are associated with each other, thus generating a conversion table (lookup table) as the standard condition reproduction table 44 in a step S 63 .
  • arbitrary dye density signals (c, m, y) 28 or dye density signals (c, m, y) 34 ranging from the minimum density to the maximum density can be converted into desired c, m, y, k halftone dot % signal 48 by the standard condition reproduction table 44 and an interpolation process.
  • a color chart having a plurality of color patches representing typical colors with different chromas, lightnesses, and hues, i.e., a commercially available Macbeth color checker, is imaged by the digital camera which is to output the color signals 12 in the first color space.
  • At least first-order, second-order, and cross terms of R, G, B signals of the imaged color chart are calculated as a group of first explanatory variables.
  • the group of first explanatory variables is then subjected to a principal component analysis for conversion into a group of second explanatory variables which cross each other.
  • Colorimetric values of the color patches of the color chart are used as a group of criterion variables, and the group of criterion variables and the group of second explanatory variables are subjected to a multiple regression analysis to determine a matrix of partial regression coefficients.
  • the partial regression coefficients are tested to select explanatory variables at a predetermined significance level among the group of second explanatory variables, and the selected explanatory variables are established as usable explanatory variables.
  • the R, G, B signals are then subjected to a matrix of partial regression coefficients relative to the usable explanatory variables for conversion into the calorimetric signals (X, Y, Z) 18 .
  • the storage capacity for storing the matrices may be relatively small. Because the group of second explanatory variables converted by the principal component analysis is used, the accuracy of color conversion is much better than the conventional matrix process. If the weighting of desired colors corresponding to certain scene types such as the color of human skin, the color of sky (blue), and the color of vegetables green), among the colorimetric values of the group of criterion variables is increased, then those desired colors can be converted with greater accuracy.
  • the desired colors may be a most frequent color or an average color that is determined by statistically processing R, G, B signals of one frame supplied from the digital camera, so that the colors of that frame can be converted with highest accuracy. If a Macbeth color checker having color patches which represent 24 colors substantially uniformly covering a color space is used as the color chart, then a conversion matrix for converting the colors of R, G, B signals accurately into colorimetric values can easily be generated.
  • colors can be converted with high accuracy using a relatively small memory capacity.
  • Desired colors that have been selected can be converted with higher accuracy.
  • an existing color chart may be used.
  • a Macbeth color checker registered trademark
  • R, G, B signals 12 which are device-dependent image signals of an original scene captured by a digital camera and/or R, G, B signals 14 which are device-dependent image signals of a reversal film subject read by a scanner are converted into colorimetric signals (X, Y, Z) 18 , 22 which are device-independent image signals by the calorimetric converter 16 .
  • the calorimetric signals (X, Y, Z) 18 , 22 are forwardly converted into colorimetric END signals 52 by the colorimetric END forward/inverse conversion matrix 50 .
  • chromaticity coordinates Rxyz, Gxyz, Bxyz of three reference color stimuli R, G, B on a chromaticity diagram are established in a range 73 (see FIG. 4) which contains a color reproduction range 71 .
  • the rough data generator 54 In order to effect automatic setup calculations in a short period of time, the rough data generator 54 generate only decimated signals from the calorimetric END signals 52 .
  • the automatic setup unit 58 effects an existing automatic setup process on the colorimetric END signals 52 for which gray conditions have been prescribed. For example, the automatic setup unit 58 generates a histogram with respect to the colorimetric END signals 52 and thereafter generates a cumulative histogram. Certain values of the histogram, e.g., a value of 0.1% is set to highlight point density (highlight setup point) D 1 and a value of 98% is set to a shadow point density (shadow setup point) D 2 .
  • the highlight setup point D 1 and the shadow setup point D 2 are associated respectively with colorimetric END values corresponding to highlight halftone dot % and shadow halftone dot %, e.g., DH of 0.1 and DS of 2.0 by a gradation conversion curve 74 .
  • the calorimetric END signals 52 are converted into calorimetric END signals 66 by the END/END converter 64 .
  • the gradation-converted colorimetric END signals 66 are inversely converted into the colorimetric signals 18 by the calorimetric END forward/inverse conversion matrix 50 .
  • the highlight point density (highlight setup point) D 1 and the shadow point density (shadow setup point) D 2 may be set to arbitrary desired values, or stated otherwise, may be determined manually, so that a conventional setup process in terms of densities can be carried out.
  • colorimetric signals are converted into colorimetric END signals, it is possible to effect the setup process thereon in terms of densities.
  • colorimetric signals are converted into colorimetric END signals, they are converted within the reproduction range of the reversal film, it is possible to employ an existing automatic (or manual) setup process of a linear scanning reader, e.g., a scanner, for image signals from the reversal subject.
  • a linear scanning reader e.g., a scanner
  • a color chart having a plurality of color patches representing desired typical colors with different chromas, lightnesses, and hues i.e., a commercially available Macbeth color checker
  • At least first-order terms of R, G, B signals of the imaged color chart are calculated as a group of first explanatory variables.
  • the group of first explanatory variables is then subjected to a principal component analysis for conversion into a group of second explanatory variables which cross each other.
  • Colorimetric values of the color patches of the color chart are used as a group of criterion variables, and the group of criterion variables and the group of second explanatory variables are subjected to a multiple regression analysis to determine a matrix of partial regression coefficients.
  • the partial regression coefficients are tested to select explanatory variables at a predetermined significance level among the group of second explanatory variables, and the selected explanatory variables are established as usable explanatory variables.
  • the R, G, B signals are then subjected to a matrix of partial regression coefficients relative to the usable explanatory variables for conversion into the colorimetric signals (X, Y, Z) 18 .
  • the calorimetric signals 18 of the original scene which have been converted by the matrix 20 are converted into c, m, y, k signals whose colors are calorimetrically saved by the accurate original scene reproduction table 42 which is an association table of c, m, y, k signals 46 determined with respect to all target values of the colorimetric signals 18 of the original scene.
  • hues, in particular, of an image on a hard copy that is produced by the image output unit 35 based on the c, m, y, k signals 46 which is produced depending on the R, G, B signals 12 , are highly accurately representative of the hues of the original scene.
  • the colorimetric signals 18 of the original scene are converted into calorimetric END signals 52 .
  • the calorimetric END signals 52 are subjected to a setup process and a gradation conversion process, they are inversely converted into colorimetric signals 18 , which are then converted into c, m, y, k signals 46 whose colors are calorimetrically saved. Accordingly, it is possible to achieve a desired image-dependent finish based on accurately reproduced colors of the original scene.
  • a process of changing the colorimetric signals 18 of the original scene into colorimetric signals 18 under an observing light source different from the imaging light source may be added to accomplish the same color reproduction as under the imaging light source.
  • c, m, y, k signals having hues which are highly similar to those of the original scene can be produced from the device-dependent image signals that are generated from the original scene.
  • the device-dependent image signals are generated from a digital camera, for example, it is possible to obtain a hard copy accurately representative of the colors of the original scene more easily than the conventional process of generating a hard copy from a reversal film as a subject.
  • R, G, B signals 12 of an original scene captured by a digital camera are converted into device-independent calorimetric signals 18 , which are then converted into c, m, y signals 28 which are dye density signals on an exposed reversal film by the dye density converter 30 .
  • the c, m, y signals 28 which are dye density signals on the exposed reversal film have been converted as signals that can be processed in the same manner as dye density signals (c, m, y signals) 34 on a reversal film that has been exposed to signals read by a scanner input unit. Therefore, the c, m, y signals 28 can easily be converted into c, m, y, k signals 48 which are halftone dot % signals under so-called color-separating default conditions (image processing conditions including a gradation conversion process, a color correction process, a sharpness controlling process, an under color removal process, and a K-plate generating process) which are stored as the standard condition reproduction table 44 in a memory.
  • color-separating default conditions image processing conditions including a gradation conversion process, a color correction process, a sharpness controlling process, an under color removal process, and a K-plate generating process
  • the R, G, B signals 12 outputted from the digital camera can easily be converted into c, m, y, k signals 48 which are halftone dot % signals.
  • device-dependent image signals of an original scene are converted into calorimetric signals, and the calorimetric signals are then converted into dye density signals on a reversal subject.
  • signals supplied to a signal processing system of a scanner are dye density signals on a reversal subject
  • the device-dependent image signals are generated by a digital camera or a scanner
  • the additional advantage of shortening a period of time required until the image is outputted is also provided.
  • R, G, B signals 12 of an original image captured by a digital camera are converted into calorimetric signals (X, Y, Z) 18 by the matrix 20 of the calorimetric converter 16 , and the colorimetric signals (X, Y, Z) 18 are subjected, if necessary, to a setup process by the calorimetric setup unit 26 and converted into dye density signals (c, m, y) 28 on a reversal subject by the dye density converter 30 .
  • R, G, B signals 14 obtained from a reversal subject by the scanner input unit are converted into colorimetric signals (X, Y, Z) 22 by the table 24 of the calorimetric converter 16 , and the colorimetric signals (X, Y, Z) 22 are subjected, if necessary, to a setup process by the colorimetric setup unit 26 and converted into dye density signals (c, m, y) 34 by the dye density converter 36 .
  • the dye density signals (c, m, y) 34 supplied through the dye density converter 36 to one port of the switch 45 of the cmyk converter 32 are dye density signals on a reversal subject, and the dye density signals (c, m, y) 28 supplied through the dye density converter 30 to the other port of the switch 45 are also dye density signals on a reversal subject.
  • the standard condition reproduction table 44 stores standard color-separating default conditions (image processing conditions including a gradation conversion process, a color correction process, an under color removal process, and a K-plate generating process) for color-separating the dye density signals on the reversal subject.
  • the dye density signals 28 , 34 on the reversal subject are color-separated and converted into c, m, y, k signals which are halftone dot % signals by the color-separating default conditions.
  • the switch 45 can select one of its input ports depending on whether image signals are supplied from a digital camera (R, G, B signals 12 ) or a scanner input unit (R, G, B signals 14 ), and output signals from the switch 45 can easily be converted into c, m, y, k signals which are halftone dot % signals by the common standard color-separating default conditions.
  • R, G, B signals outputted from a digital camera are converted into colorimetric signals, and then the colorimetric signals are converted into dye density signals.
  • R, G, B signals outputted from an image reader are converted into calorimetric signals, and then the colorimetric signals are converted into dye density signals.
  • the dye density signals are then processed under standard image processing conditions including a gradation conversion process, a color correction process, an under color removal process, and a K-plate generating process, for conversion into c, m, y, k signals which are halftone dot % signals.
  • R, G, B signals are supplied from a digital camera or an image reader, a desired image can be outputted on the basis of the R, G, B signals directly using so-called color-separating default conditions which are stored as standard conditions in a particular image reader, e.g., a scanner, that has been standardized empirically.
  • the R, G, B signals are converted into device-independent calorimetric signals, it is possible to output a device-independent image based on the R, G, B signals.

Abstract

R, G, B signals outputted from a digital camera or a color scanner are converted into calorimetric signals by a colorimetric converter having a colorimetric conversion matrix and a calorimetric conversion table. Colorimetric signals are processed for setup by a calorimetric setup unit. Colorimetric signals processed for setup are converted by a cmyk converter into c, m, y, k signals that are half tone dot % signals for being supplied to an image output unit such as a film producing device, a color printer, or the like.

Description

This is a divisional of application Ser. No. 08/980,367 filed Nov. 28, 1997, now U.S. Pat. No. 6,278,533 issued Aug. 21, 2001 the disclosure of which is incorporated herein by reference.
BACKGROUND OF THE INVENTION
1. Field of the Invention
The present invention relates to a method of processing an image signal, and more particularly to a method of converting an image signal such as R (red), G (green), B (blue) signals generated by an imaging device such as a color digital camera (also referred to as a digital camera) and representing an original scene which is captured by the imaging device, or an imaging signal such as R, G, B signals generated by an image reading device such as a color scanner (also referred to as a scanner), into a colorimetric signal, processing a colorimetric signal for setup, converting a calorimetric signal processed for setup into a dye density signal for use on a reversal medium, or converting a colorimetric signal processed for setup into c, m, y, k (cyan, magenta, yellow, and black) signals for being supplied to an image output device such as a film producing device, a plate producing device, a color printer, or the like.
2. Description of the Related Art
Device-dependent image signals such as R, G, B signals generated by color digital cameras are converted into device-independent image signals such as tristimulus signals X, Y, Z according to color conversion processes disclosed in Japanese laid-open patent publications Nos. 2-291777 and 2-291778, for example.
Techniques for predicting reproducible colors on prints, for example, device-independent tristimulus signals X, Y, Z from device-dependent c, m, y halftone dot % signals or reproducible colors based on color signals c, m, y, k are disclosed in Japanese laid-open patent publications Nos. 4-337965 and 4-337966, for example.
According to a process of accurately converting colors as disclosed in the Journal of the Institute of Image Electron, Vol. 18, No. 5 (1989), a three-dimensional (XYZ) color space is divided into 512 cubic regions, and color correcting values at a total of 729 grid points are calculated in a process optimized for the characteristics of an output device and stored as the data of a look up table (LUT). Input values between the grid points are determined by a interpolating process which three-dimensionally interpolates the LUT.
According to another known process, R, G, B signals produced from a color reversal subject (prepared by exposing a color reversal film to light from an image, developing the image on the color reversal film) which carries a positive image are converted into equivalent neutral density (END) signals by a color scanner which is a linear scanning reader, and the END signals are converted into halftone dot % signals with reference to setup points (highlight and shadow points) determined by a setup process. The halftone dot % signals are then converted into c, m, y, k signals, which are then binarized (i.e., converted into halftone dots), finally producing a printing plate or a printed material.
With conventional color scanners, R, G, B signals are processed for setup based on color-separating default conditions (image processing conditions including at least a gradation conversion process, a color correction process, an under color removal process, and a K-plate generating process) which are carried on the respective color scanners and empirically optimized, and R, G, B signals produced from a color reversal subject are converted into c, m, y, k signals.
With respect to R, G, B signals produced by a digital camera, color-separating default conditions may be established using an image processing tool (software) such as Adobe Photoshop (registered trademark).
SUMMARY OF THE INVENTION
It is a major object of the present invention to provide a method of processing an image signal, which can easily convert device-dependent image signals into device-independent image signals.
Another object of the present invention is to provide a method of processing an image signal, which allows a setup process based on END signals, for which gray conditions are prescribed in a device-dependent signal system, to be applied to a device-independent signal system.
Still another object of the present invention is to provide a method of processing an image signal for producing c, m, y, k signals capable of reproducing colors of an original scene with ease and accuracy.
Yet still another object of the present invention is to provide a method of processing an image signal, which is capable of converting image signals of an original scene captured by a digital camera into color signals that can utilize empirically optimized standard default separating conditions of an existing scanner.
A further object of the present invention is to provide a method of processing an image signal, which will convert R, G, B image signals generated by a digital camera or R, G, B image signals read by a scanner into c, m, y, k signals using empirically optimized default separating conditions of a particular existing scanner.
The above and other objects, features, and advantages of the present invention will become more apparent from the following description when taken in conjunction with the accompanying drawings in which preferred embodiments of the present invention are shown by way of illustrative example.
BRIEF DESCRIPTION OF THE DRAWINGS
FIG. 1 is a block diagram of an image signal processing apparatus which can carry out a method of processing an image signal according to the present invention;
FIG. 2 is a flowchart of a sequence for generating a colorimetric conversion matrix;
FIG. 3 is a flowchart of an operation sequence of a colorimetric setup unit;
FIG. 4 is a CIE chromaticity diagram illustrative of a color reproduction range for reversal films;
FIG. 5 is a flowchart of a conversion process for converting a colorimetric signal of a digital camera into a dye density signal on a reversal subject;
FIG. 6 is a flowchart of another conversion process for converting a calorimetric signal of a digital camera into a dye density signal on a reversal subject;
FIG. 7 is a flowchart of a sequence for generating a dye density conversion matrix;
FIG. 8 is a diagram illustrative of the Newton-Raphson method;
FIG. 9 is a flowchart of a portion of the sequence for generating a dye density conversion matrix;
FIG. 10 is a flowchart of a sequence for generating an accurate original scene reproduction table; and
FIG. 11 is a flowchart of a sequence for generating a standard condition reproduction table.
DETAILED DESCRIPTION OF THE PREFERRED EMBODIMENTS
FIG. 1 shows an overall arrangement of an image signal processing apparatus 10 which can carry out a method of processing an image signal according to the present invention.
As shown in FIG. 1, the image signal processing apparatus 10 has a calorimetric converter 16 which will be supplied with R, G, B signals (digital image signals) 12 representing image-information of a scene that has been captured by a digital camera (not shown) as an imaging device, and also with R, G, B signals (digital image signals) 14 representing image information of a reversal subject that has been read by an image input unit (which may be referred to as a linear scanning reader or a scanner input unit) of a scanner (not shown) as an image reading device. The digital camera may be a digital video camera or any device capable of capturing image signals and outputting digital image signals (digital image data).
The scanner may be a linear scanning reader which is a color scanner incorporating a linear image sensor or an area scanning reader which is a color scanner incorporating an area image sensor.
The calorimetric converter 16 has a colorimetric conversion matrix (hereinafter simply referred to as a matrix) 20 for converting R, G, B signals 12 from a digital camera into X, Y, Z or L*, a*, b* colorimetric signals (hereinafter referred to as X, Y, Z signals) 18, and a colorimetric conversion table (hereinafter referred to as a colorimetric conversion lookup table, a lookup table, or a table) 24 for converting R, G, B signals from the scanner input unit into X, Y, Z signals or L*, a*, b* colorimetric signals 22.
Usually, the R, G, B signals 12, 14 are called device-dependent signals (data), and the calorimetric signals 18, 22 are called device-independent signals (data).
The colorimetric signals 18 originating from the digital camera is supplied, if necessary, to a light source changer 25 which absorbs the difference between an imaging light source and an observing light source, a colorimetric setup unit (hereinafter also referred to as a setup unit) 26 for setting up a highlight area density and a shadow area density, a dye density converter 30 for converting the colorimetric signals 18 of the original scene (captured scene) into dye density signals 28 on the reversal subject, and an accurate original scene reproduction table 42 of a cmyk converter 32.
The calorimetric signals 22 originating from the scanner input unit are supplied to the colorimetric setup unit 26 and a dye density converter 36 of a standard condition reproduction table unit 43, for converting the calorimetric signals 22 into dye density signals 34.
The dye density signals (c, m, y signals) 28, 34 outputted from the dye density converters 30, 36 are selected by a switch (multiplexer or selector) 45 and supplied to a standard condition reproduction table 44.
The cmyk converter 32 basically has the accurate original scene reproduction table 42 and the standard condition reproduction table unit 43.
The accurate original scene reproduction table 42 comprises a lookup table for converting the calorimetric signals 18 supplied from the digital camera into c, m, y, k signals 46 which are halftone dot % signals that are calorimetrically saved.
The standard condition reproduction table unit 43 has the dye density converter 36 for converting the colorimetric signals 22 into dye density signals 34, the switch 45 for selecting either the dye density signals 28 from the dye density converter 30 or the dye density signals 34 signals from the dye density converter 36, and the standard condition reproduction table 44. The standard condition reproduction table 44 serves to convert either the dye density signals 28 or the dye density signals 34 into c, m, y, k signals 48 which are halftone dot % signals. The cmyk converter 32 has a three-color/four-color conversion function for converting signals in a trichromatic system into signals in a tetrachromatic system.
The c, m, y, k signals 46, 48 which are halftone dot % signals outputted from the cmyk converter 32 are supplied to an image output unit 35 which outputs an image based on the c, m, y, k signals 46, 48.
The image output unit 35 may be of a known nature which comprises a binary converter (not shown), a laser beam exposure scanner (image setter or the like), an image developing unit, a printing plate generator, and a printing unit. The binary converter compares the c, m, y, k signals 46, 48 with C, M, Y, K threshold matrixes selected depending on output conditions representative of a screen ruling, a screen angle, and so on for thereby converting the c, m, y, k signals 46, 48 into binary signals. The laser beam exposure scanner applies a laser beam that is selectively turned on and off by the binary signals (also called binary image signals) to films to form latent images on the films. The image developing unit develops the latent images on the films, producing platemaking films. The printing plate generator then generates printing plates from the platemaking films. In the printing unit, the printing plates, i.e., four C, M, Y, K printing plates, are mounted on a printing press, and inks of four colors applied to the printing plates are transferred to a sheet of print paper, which is produced as a printed hard copy carrying a color image.
The image output unit 35 may comprise a direct digital color proofing (DDCP) system capable of printing halftone dots according to a given screen ruling and angle directly as a halftone dot image on a sheet of print paper, without developing an image on a film, for simulating the image.
The colorimetric setup unit 26 comprises a colorimetric END forward/inverse conversion matrix (hereinafter also referred to as a matrix) 50 for converting the calorimetric signals 18, 22 into colorimetric END signals 52, a rough data generator 54 for generating calorimetric END signals 56 from the colorimetric END signals 52 through a decimation process and outputting the colorimetric END signals 56, an automatic setup unit 58 for automatically determining a highlight density signal 60 and a shadow density signal 62 based on the generated colorimetric END signals 56, and an END/END converter 64 for gradation-converting the calorimetric END signals 52 into colorimetric END signals 66. The calorimetric END forward/inverse conversion matrix 50 also serves to convert the colorimetric END signals 66 back into the calorimetric signals 22.
The image signal processing apparatus 10 is controlled by a computer (not shown) which includes a CPU, a ROM, a RAM, an external storage unit, a display monitor, an input/output device, and so on. The blocks of the image signal processing apparatus 10 which are described above are both hardware-implemented and software-implemented. The computer which controls the image signal processing apparatus 10 functions as control, decision, calculation, and comparison means.
Detailed arrangements and operation of the blocks of the image signal processing apparatus 10 will be described below.
The matrix 20 of the colorimetric converter 16 for converting R, G, B signals 12 into X, Y, Z signals 18 is generated according to a sequence shown in FIG. 2. The matrix 20 will be described below as converting signals from an RGB color space into signals in a CIE-L*a*b* (light source: auxiliary standard light CIE-D50) color space. Signal conversion between the CIE-L*a*b* color space and the XYZ color space can uniquely be carried out according to known equations (1) given below. Therefore, processing in the XYZ color space (or the CIE-L*a*b* color space) can be replaced with processing in the CIE-L*a*b* color space (or the XYZ color space), or with processing in an equivalent calorimetric color space. L * = 116 ( Y / Yn ) 1 / 3 - 16 a * = 500 { ( X / Xn ) 1 / 3 - ( Y / Yn ) 1 / 3 } b * = 200 { ( Y / Yn ) 1 / 3 - ( Z / Zn ) 1 / 3 } ( 1 )
Figure US06668079-20031223-M00001
First, a color chart 70 having a plurality of color patches 72 (see FIG. 2) representing typical colors with different chromas, lightnesses, and hues is generated in a step S1. In this embodiment, a Macbeth color checker (registered trademark: manufactured by Macbeth, a division of Kollmorgen, USA) is used as the color chart. As well known in the art, the Macbeth color checker has 24 colored squares with CIE (1931) xyY values, hues, Munsell color values, and chromas. The 24 colors are:
1. Dark skin
2. Light skin
3. Blue sky
4. Foliage
5. Blue flower
6. Bluish green
7. Orange
8. Purplish green
9. Moderate red
10. Purple
11. Yellow green
12. Orange yellow
13. Blue
14. Green
15. Red
16. Yellow
17. Magenta
18. Cyan
19. White
20. Neutral 8 (light gray, “8” represents Munsell color value 8)
21. Neutral 6.5 (light medium gray)
22. Neutral 5 (medium gray)
23. Neutral 3.5 (dark gray)
24. Black
The color chart is not limited to the Macbeth color checker, but may be a color chart which uniformly covers a color space, such as JIS standard color chips or the like.
Then, under the imaging light source CIE-D50, the 24 colors of the color chart, i.e., the 24 patches 72, are imaged by a digital camera thereby to produce R, G, B signals 12 of each of the patches 72, and the R, G, B signals 12 are converted into luminance values, which are then raised to the one-third power in a step S2. The R, G, B signals 12 may be converted into luminance values by canceling the γ correction that has been performed in the device. The luminance values are raised to the one-third power in order to process the produced R, G, B signals 12 in the CIE-L*a*b* colorimetric system, as can be seen from the above equations (1).
Values R, G, B, R2, G2, B2, RG, GB, BR (nine variables) up to terms of second order are calculated from the R, G, B signals 12 produced with respect to each of the patches 72 in the step S2, specifically, the R, G, B values that have been converged into luminance values and raised to the one-third power, in a step S3.
Then, the 24-color data of the nine variables produced in the step S3 are subjected to a principal component analysis to produce principal component scores V of the nine variables, in order to avoid a multicollineation phenomenon in a multiple regression analysis, in a step S4. For each of the colors, the principal component score V (V is considered to be a vector) expressed by the following equation (2):
V=(v1, v2, v3, v4, v5, v6, v7, v8, v9)  (2)
In the equation (2), the components (v1, v2, v3, v4, v5, v6, v7, v8, v9) of the principal component score V are not correlated to each other whatsoever, and do not cause the multicollineation phenomenon.
Thereafter, the patches 72 of the color chart 70, i.e., the 24 colors, are measured by a colorimetric meter (not shown) to produce their colorimetric values C (L*a*b*) (C is also considered to be a vector as it is produced for the 24 colors) in a step S5. The colorimetric values C may be measured at any point of time in the steps S2-S4.
Then, using the colorimetric values C as criterion variables (dependent variables) and the principal component scores V as explanatory variables (independent variables), partial regression coefficients A (A is also considered to be a vector) are determined according to a multiple regression analysis in a step S6.
The multiple regression analysis is subjected to a weighted matrix (hereinafter referred to as a matrix) P=[Pi] (i=1, 2, . . . 24) that is held in 1:1 correspondence to the 24 colors of the colorimetric values C, which constitute a group of criterion variables, in a step S7. Pi represents the weight of each color. Of the above 24 colors, the weights of the grays indicated by 20. Neutral 8 (light gray, “8” represents Munsell color value 8), 21. Neutral 6.5 (light medium gray), 22. Neutral 5 (medium gray), and 23. Neutral 3.5 (dark gray) are increased to improve color reproducibility of the grays. The weights of not only the grays, but other limited desired colors, e.g., the color of skin for human beings or the color of sky for outdoor backgrounds, may be increased to reproduce those colors of skin and sky with higher accuracy. The colors may automatically be weighted by statistically processing the inputted R, G, B signals 12, i.e., dividing the color space of a one-frame image signal, i.e., pixel-divided image data, into regions around the colors of the patches of the chart, and weighting the colors depending on the frequencies of the pixels present in the regions, e.g., increasing the weight of the color whose pixel frequency is highest and progressively reducing the weights of the colors whose pixel frequencies are progressively lower. The color space to be divided may be an RGB color space or an XYZ (L*a*b*) color space which has been converted with an unweighted matrix.
Those colors with increased weights are called principal colors of an image. In order that the sum of the values of elements of the matrix P is equal to “1”, the values of the elements are standardized by being divided by the sum of the values of the elements.
The multiple regression analysis for determining partial regression coefficients A in the step S6 will be described in greater detail below.
It is assumed that a linear equation (3) given below is satisfied between the colorimetric values (vector) C which are criterion variables, the multiple regression coefficients (vector) A to be determined, and the principal component scores (vector) V with respect to each of the calorimetric values C of the 24 colors.
C=AV  (3)
The equation (3) is equivalent to an equation (4) expressed by a matrix and equations (5) expressed by a sum symbol Σ as follows: ( L * a * b * ) = ( a 11 a 12 a 110 a 21 a 22 a 210 a 31 a 32 a 310 ) ( V 1 V 2 V 10 ) where V 10 = 1 ( 4 ) L * = j = 1 10 a 1 j V j a * = j = 1 10 a 2 j V j b * = j = 1 10 a 3 j V j where V 10 = 1 ( 5 )
Figure US06668079-20031223-M00002
Equations which use the sum symbol Σ, like the equations (5), will be expressed as L*=Σ (j=1→10)aijVj, for example.
The partial regression coefficients A are determined using a method of least squares with respect to each of L*a*b*. With respect to L*, for example, partial regression coefficients aij which minimize eL according to the following equation (6) may be determined:
e L=Σ (i=1→24)Pi{Ci−Σ (j=1→10)a 1j V j}2  (6)
where i is the patch number of the color chart 70, Pi is the weight of each color, and j is the number (1, 2, . . . , 10) of the variable.
The equation (6) is expressed by a vector and a matrix according to an equation (7) given below. In the equation (7), the calorimetric values C and the partial regression coefficients a are a vector, and the principal component scores [V] and the weighted matrix [P] are a matrix, and t represents the transpose of a matrix.
e L=(vector C−vector a[V])t [P](vector C−vector a[V])  (7)
Hereinafter, the vector C is indicated simply as C and the vector a as a. The equation (7) can be modified as follows:
e L=(C t −[V] t a t)t [P](C t −[V] t a)
By switching a and [V] around, the above equation becomes:
e L=(C−a[V])[P](C t −[V] t a)
Since, generally, (ABC)t=CtBtAt,
e L =C[P]C t +a[V][P][V] t a t −a[V][P]C t −C[P][V] t a t
By putting [V][P][V]t=[N], [V][P]Ct=[U], the above equation becomes:
e L =C[P]C t +a[N]a t−2a[U]  (8)
To minimize eL according to the equation (8), the differential of each element of the partial multiple coefficients a must be equal to “0”. Therefore, the following equation is satisfied:
1 2 · e L a = 1 2 ( a [ N ] a t ) a - ( a [ U ] ) a = 0 ( 9 )
Figure US06668079-20031223-M00003
From the equation (9), the partial multiple coefficients a can be determined according to the following equation (10): ( 1 / 2 ) { [ N ] a t + ( a [ N ] ) t } - [ U ] = 0 [ N ] a t = [ U ] a t = [ N ] - 1 [ U ] a = [ U ] t ( [ N ] t ) - 1 = ( [ V ] [ P ] C t ) t ( [ V ] [ P ] [ U ] t ) - 1 = C [ P ] [ U ] t ( [ V ] [ P ] [ U ] t ) - 1 ( 10 )
Figure US06668079-20031223-M00004
where [ ]−1 represents an inverse matrix.
In this manner, 10 partial regression coefficients a (a1j) with respect to L* are determined. Similarly, 10 partial regression coefficients a2j with respect to a* and 10 partial regression coefficients a3j with respect to b* are determined according to the same process. The total number of the determined partial regression coefficients a1j, a2j, a3j is 3×10 {see the equation (4)}.
The partial regression coefficients A with respect to the criterion variables L*a*b* are collectively expressed as follows:
A=CPV t(VPV t)−1  (11)
The partial regression coefficients A determined with respect to the criterion variables L*a*b* are then tested with a significance level of 5% in a step S8, and explanatory variables V at the significance level of 5% (confidence level of 95%) are stored in the RAM, and the partial regression coefficients A are stored as the matrix 20 shown in FIG. 1 in a step S9. The partial regression coefficients A may be tested with a significance level of 1% in the step S8.
In the step S8, as shown in equations (12)-(16) given below, a regression sum SR of squares {a sum of squares of differences between the estimated values L*i (with the symbol “{circumflex over ( )}” over “L”) and the average L*i of the colorimetric values (with the symbol “−” over “L”): see the equation (12)} and a residual sum SE of squares {a sum of squares of differences between the colorimetric values L*i and the estimated values L*i: see the equation (13)} are determined, and unbiased variances VR, VE {see the equations (14), (15)} of the regression sum SR of squares and the residual sum SE of squares are determined. Furthermore, partial F values Fj {see the equation (16)} are determined. In the equation (16), “a” with “{circumflex over ( )}” placed thereover represents estimated values of coefficients of the left matrix on the right-hand side of the equation (4), and Sjj represents diagonal terms of inverse matrixes of variance or covariance matrixes of explanatory variables vj. S R = i = 1 24 ( L ^ * i - L _ * i ) 2 ( 12 ) S E = i = 1 24 ( L * i - L ^ * i ) 2 ( 13 ) V R = S R 10 ( 14 ) V E = S E 24 - 9 - 1 ( 15 ) F j = a ^ j 2 S jj V E / ( 24 - 1 ) ( 16 )
Figure US06668079-20031223-M00005
If the partial F values Fj are greater than a value=F′n−p−1(0.05)=F′24−9−1(0.05 )=F′14(0.05)=4.60011 which has been determined by referring to an F distribution with a signification level of 5%, then the regression is significant with the signification level of 5%, and the partial regression coefficients are judged as useful for prediction and stored in the matrix 20 (see FIG. 1).
In this manner, it is possible to generate the matrix 20 for determining the criterion variables L*a*b* which will convert the R, G, B signals (see FIG. 1) produced by the digital camera into the X, Y, Z colorimetric signals 18. Equations relative to the matrix are given below:
L*=Σa 1j v j (j: a variable at a significance level of 5%)
a*=Σa 2j v j (j: a variable at a significance level of 5%)
b*=Σa 3j v j (j: a variable at a significance level of 5%)  (17)
In the equations (17), the remark (j: a variable with a significance level of 5%) means that only a variable obtained by the test with the significance level of 5% is used, unlike the equation (5). In the equations (17), a1j, a2j, a3j represent elements of the partial regression coefficient matrix A, and vj represent the principal component scores V as the explanatory variables determined in the step S4.
Using the matrix 20, it is possible to effect calorimetric conversion with the existing color chart 70. Since no lookup table is employed, any memory capacity used may be small, i.e., calorimetric conversion can be effected with accuracy even though the memory capacity used is small. Use of the weighted matrix P makes it possible to effect color conversion with accuracy, limited to desired colors (principal colors) of the image. If the number of explanatory variables is 9, then the testing process in the step S8 may be dispensed with, and a matrix corresponding to the equations (17) may be generated using all the partial regression coefficients A.
The values thus obtained in the CIE-L*a*b* color space are converted into values in the XYZ color space according to the equations (1), which are used as the colorimetric signals 18 outputted from the matrix 20 (see FIG. 1).
The calorimetric signals 18 are then calorimetrically changed by the light source changer 25 into new calorimetric signals 18. If the observing light source is the same as the imaging light source (CIE-D50) used when the image is captured by the digital camera, then calorimetric signals 18 do not need to be colorimetrically changed by the light source changer 25.
Colorimetric values X, Y, Z can be converted into new calorimetric values X′, Y′, Z′ by the light source changer 25 according to the following equations
(18), (19), (20):
X′=XX 2 /X 1  (18)
Y′=YY 2 /Y 1  (19)
Z′=ZZ 2 /Z 1  (20)
where X, Y, Z represent calorimetric values under the imaging light source, X′, Y′, Z calorimetric values under the observing light source, X1, Y1, Z1 white dots of the imaging light source, and X2, Y2, Z2 white dots of the observing light source.
It is hereinafter assumed that the calorimetric signals 18 have been converted by the light source changer 25.
The R, G, B signals from the scanner input unit are converted into calorimetric signals 22 which are X, Y, Z signals by the colorimetric conversion table 24.
The colorimetric conversion table 24 is prepared as follows: First, a color reversal subject having, for example, a combination of 13 equally spaced densities of c, m, y color patches, i.e., a total of 13×13×13=2197 color patches, is prepared. Then, the color patches of the reversal subject are read by a scanner input unit and also read by a colorimetric meter. The R, G, B values read by the scanner input unit and the X, Y, Z values read by the calorimetric meter are associated with each other into a table, which will be used as the colorimetric conversion table 24. Values between the read values, which are not present in the calorimetric conversion table 24, are determined by an interpolation process.
Since the R, G, B signals 14 supplied from the scanner input unit are converted into the colorimetric signals 22 by the colorimetric conversion table 24 and the R, G, B signals 12 supplied from the digital camera are converted into the calorimetric signals 18 by the colorimetric conversion matrix 20, they can be processed by an automatic setup process using the calorimetric setup unit 26 in common. Specifically, automatic setup process software can be used in common on the colorimetric signals 18, 22 because the colorimetric signals 18, 22 are converted into a colorimetric END signal.
The calorimetric setup unit 26 and its operation sequence will be described below with reference to FIGS. 1, 3, and 4.
Heretofore, gradation conversion has been carried out in a density space as its intuitive understanding can easily be attained in the density space. Image processing such as gradation conversion and color correction on commercially available color scanners is also effected with respect to density signals.
First, the colorimetric END forward/inverse conversion matrix 50 converts the colorimetric signals 18 or the colorimetric signals 22 into c, m, y END (equivalent neutral density) signals 52, which are colorimetric density signals, in a step S11. Specifically, the conversion process in the step S11 comprises a linear conversion process for converting calorimetric signals in an XYZ colorimetric system into calorimetric signals in an RGB colorimetric system in a step S11 a, and a nonlinear conversion process for converting colorimetric signals in the RGB colorimetric system into colorimetric signals in a cmy colorimetric system in a step S11 b. The END signals converted from the calorimetric signals 18 or the calorimetric signals 22 are referred to as calorimetric END signals 52.
For converting the calorimetric signals 22 of the reversal subject into the colorimetric END signals 52, for example, a color reproduction range 71 (shown hatched in FIG. 4) of a reversal film is drawn on a CIE chromaticity diagram shown in FIG. 4. It is assumed that coordinates on the chromaticity diagram, i.e., chromaticity coordinates, of three reference color stimuli Rxyz, Gxyz, Bxyz of a range 73 which contains the color reproduction range 71 are represented by equations (21)-(23) given below. The range 73 represents a triangular area whose vertexes are indicated respectively by the reference color stimuli Rxyz, Gxyz, Bxyz on the chromaticity diagram shown in FIG. 4.
Rxyz=Rxyz(x R , y R , z R)  (21)
Gxyz=Gxyz(x G , y G , z G)  (22)
Bxyz=Bxyz(x B , y B , z B)  (23)
Coordinates of a basic stimulus (white stimulus) Wxyz in the XYZ calorimetric system on the chromaticity diagram shown in FIG. 4 are expressed as follows:
Wxyz=Wxyz(x W , y W , z W)  (24)
The equation (25) given below can convert the colorimetric signals 22 in the XYZ colorimetric system (the right matrix on the right-hand side of the equation (25)) through a conversion matrix (the left matrix on the right-hand side of the equation (25)) into color signals R, G, B in the RGB colorimetric system (the matrix on the left-hand side of the equation (25)). ( R G B ) = ( R X R Y R Z G X G Y G Z B X B Y B Z ) ( X Y Z ) ( 25 )
Figure US06668079-20031223-M00006
where
R X =A 111 , R Y =A 121 , R Z =A 131
G X =A 212 , G Y =A 222 , G Z =A 332
B X =A 313 , B Y =A 323 , B Z =A 333
Δi =A i1 x W +A i2 y W +A i3 z W
Aij represents a cofactor of the following matrix equation D: D = x R y R z R x G y G z G x B y B z B
Figure US06668079-20031223-M00007
The cofactor Aij is determined according to the following equation:
A ij=(−1)i+j D ij
where Dij represents a submatrix from which an ith row and a jth column have been removed.
The c, m, y values of the calorimetric END signals 52 can be determined by finding ratios of the values of R, G, B calculated according to the equation (25) to the values Rw, Gw, Bw of R, G, B which are calculated by substituting the coordinates of the basic stimulus (white stimulus) Wxyz in the equation (25), and logarithmically converting the ratios according to the following equations (26) through (28):
c=−log(R/Rw)  (26)
m=−log(G/Gw)  (27)
y=−log(B/Bw)  (28)
The rough data generator 54 effects a rough scanning process in order to shorten the setup process by selecting data from only an image area of the subject that has been specified by the operator through the CPU or generating decimated data from an image that is present on the entire area of the subject, rather than processing colorimetric END signals 52 of the entire subject.
Then, the automatic setup unit 58 carries out an automatic setup process based on colorimetric END signals 56 which are the rough data selected by the rough data generator 54 in a step S12. In the automatic setup process, the automatic setup unit 58 generates a histogram with respect to the colorimetric END signals 56 and thereafter generates a cumulative histogram, as is known from Japanese laid-open patent publication No. 2-105676.
As indicated by a characteristic diagram representative of operation of the END/END converter 64 in FIG. 1, a value of the colorimetric END signals 56 which corresponds to 0.1% point data (HL density) D1 is set to DH, and a value of the calorimetric END signals 56 which corresponds to 98% point data (SD density) D2 is set to DS, in the step S12.
If the density of D1 is D1=1.0 and the density of D2 is D2=2.0, for example, DH corresponding to the density of D1 is set to DH=0.1 and DS corresponding to the density of D2 is set to DS=3.0. Actually, point data (HL density) D1 of 0.1% is converted into a density corresponding to 0% in terms of halftone dot %, and point data (SD density) D2 of 98% is converted into a density corresponding to 100% in terms of halftone dot %.
Using the equation of a straight line 74 thus established in the characteristic diagram, the END/END converter 64 converts all the colorimetric END signals 52 of main scanned data (data toward which the rough scanning process is directed) into colorimetric END signals 66, i.e., converts gradation characteristics or corrects the gradation of the colorimetric END signals 52. The conversion equation used by the END/END converter 64 may be the equation of a curve that passes through a highlight point 75 (D1, DH) and a shadow point 76 (D2, DS). In the automatic setup process, the values of HL density D1 and SD density D2 (or the setup points 75, 76) are automatically determined under the predetermined conditions described above. However, the values of HL density D1 and SD density D2 may be determined manually, or the values of DH, DS may be corrected manually after the automatic setup process, in a manual setup process.
Then, the calorimetric END forward/inverse conversion matrix inversely converts the c, m, y values of the calorimetric END signals 66 converted by the END/END converter 64 back into X, Y, Z values of calorimetric signals 22 in a step S14. Specifically, the conversion process in the step S14 comprises a conversion process for converting the c, m, y values of the calorimetric END signals 66 into R, G, B values in an RGB calorimetric system in a step S14 a, and a conversion process for converting the R, G, B values in the RGB calorimetric system into calorimetric signals 22 which have X, Y, Z values in an XYZ colorimetric system in a step S14 b. The conversion process for converting the c, m, y values of the calorimetric END signals 66 into R, G, B values in an RGB colorimetric system is carried out according to the following equations (29)-(31) which solve the equations (26)-(28) for R, G, B, and the conversion process for converting the R, G, B values in the RGB calorimetric system into X, Y, Z values in an XYZ colorimetric system is carried out according to the following equation (32) which solves the equation (25) for a matrix XYZ:
R=Rw10−c  (29)
G=Gw10−m  (30)
B=Bw10−y  (31) ( X Y Z ) = ( R X R Y R Z G X G Y G Z B X B Y B Z ) - 1 ( R G B ) ( 32 )
Figure US06668079-20031223-M00008
The above setup process has been described with respect to colorimetric signals 22 from a reversal subject. However, the setup process may be applied to colorimetric signals 18 from a digital camera.
Specifically, reversal subjects are generally used as original subjects in the art of printing and platemaking. A reversal subject is exposed to an original scene, and a print is produced on the basis of colors in a color reproduction range 71 on the reversal subject. This means that the color reproduction range 71 in which colors are produced on the reversal subject is sufficient as a color reproduction range for image signals that are handled.
As described above, the colorimetric setup unit 26 linearly converts colorimetric values X, Y, Z into R, G, B values in a three-primary colorimetric system, logarithmically converts the ratios of the R, G, B values to basic stimuli (light source) RW, GW, BW thereby to determine END values, and effects the automatic setup process using the END values. Then, the colorimetric setup unit 26 converts the END values into other END values, inversely logarithmically converts the END values into modified R, G, B values, and converts the R, G, B values into colorimetric values X, Y, Z. Therefore, the automatic setup process can be carried out on the basis of existing density signals. The setup process may also be effected as the manual setup process.
The dye density converter 30 will be described below with reference to FIGS. 1, 5, and 6.
The dye density converter 30 converts the calorimetric signals (X, Y, Z) 18 of an original scene which are captured by a digital camera into dye density signals (c, m, y) 28 on a reversal subject.
The conversion process carried out by the dye density converter 30 may be a process shown in FIG. 5 or a process shown in FIG. 6.
According to the process shown in FIG. 5, the colorimetric signals (X, Y, Z) 18 of an original scene are converted into dye density signals (c, m, y) 81 of the original scene by a lookup table in a step S21 (first stage), and the dye density signals (c, m, y) 81 of the original scene are converted into dye density signals (c, m, y) 28 on a reversal subject (hereafter also referred to as an RV) by a matrix (described later on) in a step S22 (second stage). According to the process shown in FIG. 6, the calorimetric signals (X, Y, Z) 18 of an original scene are converted into dye density signals (c, m, y) 82 on a reversal subject by a matrix (described later on) in a step S31 (first stage), and the dye density signals (c, m, y) 82 on the reversal subject are converted into dye density signals (c, m, y) 28 on the reversal subject by a lookup table in a step S32 (second stage).
The process shown in FIG. 5 will be described in detail with reference to FIG. 7.
Calculations in the step S21 for determining dye densities c, m, y from colorimetric values (tristimulus values) X, Y, Z will be described below.
The following equations (33)-(36) are satisfied between the colorimetric values X, Y, Z and the dye densities c, m, y:
X=k∫visP(λ)T(λ)x(λ)  (33)
Y=k∫visP(λ)T(λ)y(λ)  (34)
Z=k∫visP(λ)T(λ)z(λ)  (35)
T(λ)=10−h  (36)
where
h={cDc(λ)+mDm(λ)+yDy(λ)+base(λ)}
k=100/∫visP(λ)y(λ)dλ (λ represents the wavelength of light)
∫vis: definite integral in the visible wavelength range (380 nm-780 nm)
P(λ): spectral data of the observing light source
T(λ): spectral transmittance data of the dye of a transmissive object
x(λ), y(λ), z(λ): color matching function Dc(λ), Dm(λ), Dy(λ): spectral density data of c, m, y dyes
base(λ): spectral density data of a film base
To determine the dye densities c, m, y from the equations (33)-(36), inverse functions may be determined. However, such inverse functions cannot directly be determined. One solution is to use a successive approximating process such as the known Newton-Raphson method (see, for example, “Color Engineering” written by Noboru Ohta, pp. 254-260, published by Tokyo Denki University, publishing office, Dec. 20, 1993, 1st edition, 1st print) The Newton-Raphson method will briefly be described with reference to the above book.
When a general equation y=f(x) is expanded into a Taylor's series with x=x0 close to the root of f(x)=0, and only a term of first order is taken, f(x0+Δx)=f(x0)+f′(x0)·Δx is satisfied with respect to a minute change Δx of x. f′(x0) is produced by substituting x=x0 in a differential coefficient f′(x) of f(x). Therefore, a more correct value x1 of f(x)=0 is determined, assuming f(x0+Δx)=0, from x1=x0+Δx=x0−f(x0)/f′(x0). As shown in FIG. 8, this is equivalent to drawing a tangential line 83 to a point (x0, y0) on a function y=f(x) and determining a point x1 of intersection between the tangential line 83 and the x-axis.
Substituting the equation (36) in the equations (33)-(35) and using certain functions fx, fy, fz, the equations (33)-(35) can be expressed as the following equations (37)-(39):
X=fx(c, m, y)  (37)
Y=fy(c, m, y)  (38)
Z=fz(c, m, y)  (39)
It is assumed in the equations (37)-(39) that initial values are represented by c0, m0, y0 and tristimulus values by X0, Y0, Z0 at those initial values. If the tristimulus values X0, Y0, Z0 change respectively by ΔX0, ΔY0, ΔZ0 when the initial values c0, m0, y0 are subjected to minute changes Δc0, Δm0, Δy0, then the following equation (40) is obtained: X0 + Δ X = fx ( c0 + Δ c , m0 + Δ m , y0 + Δ y ) = fx ( c0 , m0 , y0 ) + Δ c · fx / c + Δ m · fx / m + Δ y · fx / y = X0 + Δ c · X / c + Δ m · X / m + Δ y · X / y ( 40 )
Figure US06668079-20031223-M00009
where ∂fx/∂c, for example, represents a partial differential coefficient of the function fx with respect to c. The equation (40) is modified into an equation (41) given below. Similarly, ΔY, ΔZ are also represented by respective equations (42), (43) as follows:
 ΔX=Δc·∂X/∂c+Δm·∂X/∂m+Δy·∂X/∂y  (41)
ΔY=Δc·∂Y/∂c+Δm·∂Y/∂m+Δy·∂Y/∂y  (42)
ΔZ=Δc·∂Z/∂c+Δm·∂Z/∂m+Δy·∂Z/∂y  (43)
The equations (41)-(43) can be presented in a matrix representation according to the following equation (44):
(Q)=(J)(P)  (44)
where (Q) represents a three-row, one-column matrix of elements which are ΔX, ΔY, ΔZ arranged successively from the first row, (J) a Jacobian matrix of partial differential coefficients arranged in three rows and three columns, and (P) a three-row, one-column matrix of elements which are Δc, Δm, Δy arranged successively from the first row.
When both sides of the equation (44) are multiplied by an inverse matrix (J)−1 of the Jacobian matrix (J), the following equation (45) is obtained:
(P)=(J)−1(Q)  (45)
Therefore, if the initial values c0, m0, y0 are corrected respectively into c1, m1, y1 as indicated by the following equations (46), then more correct approximate values can be produced:
c1=c0+Δc
m1=m0+Δm
y1=y0+Δy  (46)
By repeating calculations using the Jacobian matrix (J) thus obtained, it is possible to determine dye density signals c, m, y with respect to colorimetric values X, Y, Z which are arbitrary target values. The same process is effected on all target values on a grid in the XYZ color space to generate an inverse conversion table for converting the calorimetric signals (X, Y, Z) 18 of the original scene into dye density signals (c, m, y) 81 of the original scene, and the inverse conversion table is stored as a lookup table for the first-stage processing in the dye density converter 30 in the step S21.
A process of generating a matrix for use in the second stage which follows the first stage in the step S21 will be described below. The process of generating a matrix for use in the second stage includes the multiple regression analysis described above with reference to FIG. 2, and hence will briefly be described below.
With respect to the dye densities c, m, y calculated in the step S21, data of 24 colors of nine variables c, m, y, c2, m2, y2, cm, my, yc are calculated in a step S22 a.
Then, the 24-color data of the nine variables produced in the step S22 a are subjected to a principal component analysis to produce principal component scores of the nine principal components in a step S22 b.
Colorimetric values X, Y, Z of 24 colors of a Macbeth color checker on a reversal film are measured by a colorimetric meter in a step S22 c.
Dye densities c, m, y (also referred to as RVc, RVm, RVy) on the reversal film are determined by the Newton-Raphson method in a step S22 d.
With each of the dye densities RVc, RVm, RVy being used as a criterion variable and also with the principal component scores (including constant terms) determined in the step S22 b being used as explanatory variables, a 3×10 matrix of partial regression coefficients is determined by a multiple regression analysis in a step S22 e.
The multiple regression analysis may be subjected to a weighted matrix that is held in 1:1 correspondence to the 24 colors which constitute a group of criterion variables in a step S22 f.
Then, the partial regression coefficients determined with respect to the criterion variables RVc, RVm, RVy are tested with a significance level of 5% in a step S22 g, and explanatory variables at the significance level of 5% are stored in the RAM, and the partial regression coefficients are stored as the matrix for use in the second-stage processing in the dye density converter 30 in a step S22 h. The partial regression coefficients may not be tested, but all of them may be used.
In this manner, the dye density converter 30 for converting calorimetric signals 18 of an original scene into dye density signals c, m, y on a reversal subject is constructed.
The process shown in FIG. 6 will be described with reference to FIG. 9. The sequence shown in FIG. 9 includes the multiple regression analysis described above with reference to FIG. 2, and hence will briefly be described below.
Colorimetric values X, Y, Z of the 24 colors of the Macbeth color checker 70 are measured by a calorimetric meter in a step S31 a (FIG. 9).
With respect to the measured calorimetric data X, Y, Z, data of 24 colors of nine variables X, Y, Z, X2, Y2, Z2, XY, YZ, ZX are calculated in a step S31 b.
Then, the 24-color data of the nine variables are subjected to a principal component analysis to produce principal component scores of the nine principal components in a step S31 c.
Colorimetric values X, Y, Z of 24 colors of a Macbeth color checker on a reversal film are measured by a calorimetric meter in a step S31 d. The Macbeth color checker on the reversal film is produced by photographing the image of a Macbeth color checker under a certain light source with an optical camera loaded with a reversal film, and then developing the photographed image on the reversal film.
With the calorimetric values X, Y, Z being used as criterion variables (RVX, RVY, RVZ) and also with the principal component scores (including constant terms) determined in the step S31 c being used as explanatory variables, a 3×10 matrix of partial regression coefficients is determined by a multiple regression analysis in a step S31 e.
The multiple regression analysis may be subjected to a weighted matrix that is held in 1:1 correspondence to the 24 colors which constitute a group of criterion variables in a step S31 f.
Then, the partial regression coefficients determined with respect to the criterion variables RVX, RVY, RVZ are tested with a significance level of 5% in a step S31 g, and explanatory variables at the significance level of 5% are stored in the RAM, and the partial regression coefficients are stored as the matrix for use in the first-stage processing in the dye density converter 30 in a step S31 h. The partial regression coefficients may not be tested, but all of them may be used.
The table for use in the second stage in the step S32 is generated according to a process which is the same as the process in the step S21 or the step S22 d described with reference to FIG. 7, and hence the process of generating the table for use in the second stage in the step S32 will not be described below.
A process of generating the accurate original scene reproduction table 42 of the cmyk converter 32 will be described below with reference to FIG. 10.
The accurate original scene reproduction table 42 is a lookup table for converting the calorimetric signals (X, Y, Z) 18 into c, m, y, k signals (c, m, y, k data) 46 which are calorimetrically saved halftone dot % data.
The process of generating the accurate original scene reproduction table 42 is the same as a process described in Japanese patent application No. 8-154584 filed by the same applicant as the present application.
A plurality of c, m, y, k halftone dot % data spaced at regular intervals are supplied to the image output unit 35 to generate a cmyk color chart having color patches whose c, m, y, k densities and mixed ratios vary stepwise in a step S41.
The regular intervals may be six intervals comprising increments of 20%, representing 0, 20, . . . , 100% in terms of halftone dot % for each of the colors c, m, y, k. In such a case, the total number of color patches is 46=1296.
Then, the color patches of the cmyk color chart generated by the image output unit 35 are calorimetrically measured by a calorimetric meter in a step S42. Colorimetric values (stimulus values) X, Y, Z are determined from the measured calorimetric data, and a conversion table (called a forward conversion table) for converting the c, m, y, k halftone dot % data into calorimetric value data X, Y, Z is generated in a step S43.
The forward conversion table is used as an interpolating table. Therefore, the smaller the regular intervals described above, the better for interpolation accuracy. However, since smaller regular intervals result in a larger expenditure of time and labor required for calorimetrically measuring the color patches, a trade-off should be made between the complexity of the colorimetric measurement and the interpolation accuracy, and a computer processing time described below.
For determining c, m, y, k signals (c, m, y, k halftone dot % data, color data c, m, y, k, or c, m, y, k) from inputted arbitrary calorimetric value signals (colorimetric value data X, Y, Z, stimulus value data X, Y, Z, or X, Y, Z) according to the accurate original scene reproduction table 42, since variables increase from three variables to four variables, a plurality of solutions of c, m, y, k halftone dot % data 46 may exist with respect to one set of colorimetric value data X, Y, Z. In order to eliminate this drawback, it is necessary to establish a relationship between three variables and three variables for the accurate original scene reproduction table 42. To meet this requirement, the color data k of the c, m, y, k halftone dot % data is fixed to a maximum value Kmax (k=Kmax) that can be employed by the image output unit 35 in a step S44. The maximum value Kmax is the same as 100%, for example, for the value of k of the c, m, y, k halftone dot % data.
Then, arbitrary values X, Y, Z which are three variables are converted into corresponding values c, m, y (with k being fixed) which are three variables in a step S45.
For determining c0, m0, y0, k0=Kmax which are values c, m, y, k (since k is fixed to k=Kmax, k is a constant, and therefore c, m, y are three variables) with respect to target values X0, Y0, Z0 that are arbitrary values X, Y, Z, the forward conversion table with k0=Kmax is used to determine partial regression coefficients of a regression equation.
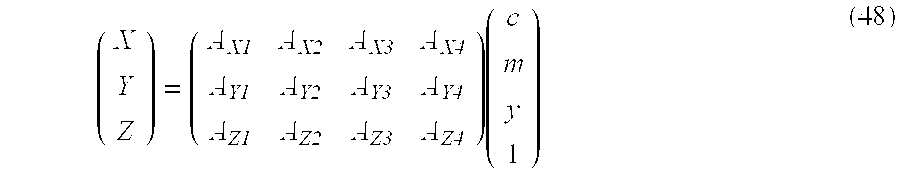
If it is assumed that a matrix of coefficient terms in three rows and four columns is represented by A, a matrix of calorimetric values X, Y, Z in three rows and one column by T, and a matrix of c, m, y, k (k is fixed or a constant) in four rows and one column by D, then the regression equation is expressed by:
T=AD  (47)
The equation (47) represents the following equation (48): ( X Y Z ) = ( A X1 A X2 A X3 A X4 A Y1 A Y2 A Y3 A Y4 A Z1 A Z2 A Z3 A Z4 ) ( c m y 1 ) ( 48 )
Figure US06668079-20031223-M00010
In the equations (47), (48), “1” of the matrix D is a value established to give a constant term in a three-dimensional plane equation of c, m, y.
The coefficients in the equation (48) can be determined according to the above multiple regression analysis by substituting the data sets of the above forward conversion table which are obtained when k=Kmax.
Then, using the regression equation determined when k=Kmax, c, m, y (with k being established as Kmax) values corresponding to the target values X0, Y0, Z0 can be determined according to the Newton-Raphson method.
Therefore, it is determined whether the determined c, m, y values are values (colors) within a reproduction range of the image output unit 35 in a step S46. Specifically, it is determined whether the determined values c, m, y satisfy the following ranges: Cmin c Cmax Mmin m Mmax Ymin y Ymax ( 49 )
Figure US06668079-20031223-M00011
where Cmin, Mmin, Ymin represent reproducible minimum densities of the halftone dot % data (color data) and Cmax, Mmax, Ymax reproducible maximum densities thereof.
If the determined values c, m, y satisfy the ranges (49), then an inverse conversion table is generated by setting the color data c, m, y, k with respect to the target values (X0, Y0, Z0) for the stimulus value data X, Y, Z respectively to c=csol, m=msol, y=ysol, k=ksol (ksol=Kmax), and established as the accurate original scene reproduction table 42 in a step S47. The data set (csol, msol, ysol, ksol) will also be referred to as color data cmyksol.
If the determined values c, m, y do not satisfy the ranges (49), then the color data k which has been fixed to k=Kmax is set to k=k−Δk, i.e., k=kmax−Δk, in a step S48, and the step S45 is repeated insofar as the color data k is greater than a given minimum value k=Kmin in a step S49. The minute change Δk constitutes an arbitrary data interval of the color data k of the inverse conversion table. For example, if the color data k is established as data in a range from 0% to 100%, then the minute change Δk may be set to 1%, and if the color data k is established as data in a range from 0 to 255,then the minute change Δk may be set to 1. In the second execution of the step S45, the values X, Y, Z which are colorimetric vales on the left-hand side of the equation (48) with respect to the color data k=Kmax=1=100−1=99 can be determined by interpolating the X, Y, Z data calorimetrically measured at the values k=Kmax=100% and k=80% and stored in the forward conversion table.
If Kmin>k in the step S49, then the color data c, m, y, k with respect to the target values (X0, Y0, Z0) are indicated as data outside of the color reproduction range of the image output unit 35, and no color data cmyksol is calculated in a step S50.
The above process is carried out while all the stimulus value data X, Y, Z 18 supplied to the accurate original scene reproduction table 42 are being used as target values (X0, Y0, Z0), for thereby determining color data cmyksol when maximum color data k is given to the stimulus value data X, Y, Z 18 capable of producing halftone dot % data c, m, y, k 46 within the color reproduction range of the image output unit 35, in a step S51.
In the step S44, the color data k may be fixed to the minimum value Kmin (k=Kmin), rather than the maximum value Kmax. In such a case, the color data k is set to k=k+Δk in the step S48, and it is determined in the step S49 whether the color data k is greater than the maximum value Kmax (Kmax<k). The color data k may alternatively be set to an arbitrary value. If the color data k is set to an arbitrary value, then the color data k may set alternately to k=k−Δk and k=k+Δk, and the step S49 may be carried out in a manner depending on the step S48.
The color data c, m, y, k indicated as data outside of the color reproduction range of the image output unit 35 in the steps S49, S50 will not be described in detail because they have no direct bearing on the features of the present invention. However, as described in Japanese patent application No. 8-154584, it is possible to generate an inverse conversion table of color data c, m, y, k with respect to the target values (X0, Y0, Z0) based on the compression or clipping of color data C, M, Y, K according to gamut mapping.
The association table of the c, m, y, k signals 46 determined with respect to all the target values (X0, Y0, Z0) of the colorimetric signals 18 is stored as the accurate original scene reproduction table 42 for thereby converting arbitrary colorimetric signals 18 into c, m, y, k signals 46 within the color reproduction range of the image output unit 35.
A process of generating the standard condition reproduction table 44 of the cmyk converter 32 will be described below.
The process of generating the standard condition reproduction table 44 will be described below with reference to FIG. 11.
First, a color chart having 13×13×13 color patches having different dye densities c, m, y that are arranged in a grid-like pattern on a reversal subject are generated in a step S61. Specifically, the color chart has color patches representing a combination of colors c, m, y, each having 13 densities ranging from a minimum density to a maximum density.
Then, the color chart is color-separated under color-separating default conditions of a color scanner. Stated otherwise, the color chart, which is a transmissive subject, is read by the color scanner so as to be converted into digital data in a step S62. The color-separating default conditions include at least a gradation conversion process, a color correction process, an under color removal process, and a K-plate generating process. For color separation, the minimum density of gray of the color patches is established such that the corresponding data of c, m, y, k halftone dot % are all 0%, and the maximum density of gray of the color patches is established such that the corresponding data of c, m, y, k halftone dot % represent a solid image.
Then, the dye densities of the color patches and the values of c, m, y, k halftone dot % which are color-separated under the color-separating default conditions of the color scanner are associated with each other, thus generating a conversion table (lookup table) as the standard condition reproduction table 44 in a step S63. Actually, arbitrary dye density signals (c, m, y) 28 or dye density signals (c, m, y) 34 ranging from the minimum density to the maximum density can be converted into desired c, m, y, k halftone dot % signal 48 by the standard condition reproduction table 44 and an interpolation process.
As described above, according to the embodiment of the present invention, for converting arbitrary color signals 12 in a first color space, e.g., R, G, B signals 12 captured by a digital camera, into color signals in a second color space, e.g., calorimetric signals (X, Y, Z or L*, a*, b*) 18, a color chart having a plurality of color patches representing typical colors with different chromas, lightnesses, and hues, i.e., a commercially available Macbeth color checker, is imaged by the digital camera which is to output the color signals 12 in the first color space. At least first-order, second-order, and cross terms of R, G, B signals of the imaged color chart are calculated as a group of first explanatory variables. The group of first explanatory variables is then subjected to a principal component analysis for conversion into a group of second explanatory variables which cross each other. Colorimetric values of the color patches of the color chart (color signals in the second color space) are used as a group of criterion variables, and the group of criterion variables and the group of second explanatory variables are subjected to a multiple regression analysis to determine a matrix of partial regression coefficients. Finally, the partial regression coefficients are tested to select explanatory variables at a predetermined significance level among the group of second explanatory variables, and the selected explanatory variables are established as usable explanatory variables.
The R, G, B signals are then subjected to a matrix of partial regression coefficients relative to the usable explanatory variables for conversion into the calorimetric signals (X, Y, Z) 18.
Since the above process of converting color signals use matrices which have a small amount of data, the storage capacity for storing the matrices may be relatively small. Because the group of second explanatory variables converted by the principal component analysis is used, the accuracy of color conversion is much better than the conventional matrix process. If the weighting of desired colors corresponding to certain scene types such as the color of human skin, the color of sky (blue), and the color of vegetables green), among the colorimetric values of the group of criterion variables is increased, then those desired colors can be converted with greater accuracy. The desired colors may be a most frequent color or an average color that is determined by statistically processing R, G, B signals of one frame supplied from the digital camera, so that the colors of that frame can be converted with highest accuracy. If a Macbeth color checker having color patches which represent 24 colors substantially uniformly covering a color space is used as the color chart, then a conversion matrix for converting the colors of R, G, B signals accurately into colorimetric values can easily be generated.
Because the embodiment employs an improved matrix process, colors can be converted with high accuracy using a relatively small memory capacity.
Desired colors that have been selected can be converted with higher accuracy.
If necessary, an existing color chart may be used. For example, if a Macbeth color checker (registered trademark) is used as the color chart, then it is possible to generate, with color patches of 24 colors, a matrix capable of converting colors highly accurately with respect to an overall color space.
According to the embodiment of the present invention, as described above, R, G, B signals 12 which are device-dependent image signals of an original scene captured by a digital camera and/or R, G, B signals 14 which are device-dependent image signals of a reversal film subject read by a scanner are converted into colorimetric signals (X, Y, Z) 18, 22 which are device-independent image signals by the calorimetric converter 16. The calorimetric signals (X, Y, Z) 18, 22 are forwardly converted into colorimetric END signals 52 by the colorimetric END forward/inverse conversion matrix 50.
In the forward conversion process, chromaticity coordinates Rxyz, Gxyz, Bxyz of three reference color stimuli R, G, B on a chromaticity diagram are established in a range 73 (see FIG. 4) which contains a color reproduction range 71.
In order to effect automatic setup calculations in a short period of time, the rough data generator 54 generate only decimated signals from the calorimetric END signals 52.
The automatic setup unit 58 effects an existing automatic setup process on the colorimetric END signals 52 for which gray conditions have been prescribed. For example, the automatic setup unit 58 generates a histogram with respect to the colorimetric END signals 52 and thereafter generates a cumulative histogram. Certain values of the histogram, e.g., a value of 0.1% is set to highlight point density (highlight setup point) D1 and a value of 98% is set to a shadow point density (shadow setup point) D2.
The highlight setup point D1 and the shadow setup point D2 are associated respectively with colorimetric END values corresponding to highlight halftone dot % and shadow halftone dot %, e.g., DH of 0.1 and DS of 2.0 by a gradation conversion curve 74. Based on the gradation conversion curve 74, the calorimetric END signals 52 are converted into calorimetric END signals 66 by the END/END converter 64.
Based on the gradation conversion curve 74 which has been established by the automatic setup process, the gradation-converted colorimetric END signals 66 are inversely converted into the colorimetric signals 18 by the calorimetric END forward/inverse conversion matrix 50.
As a result, the automatic setup process based on existing density signals of the scanner can be effected on the R, G, B signals 12 from the digital camera. The highlight point density (highlight setup point) D1 and the shadow point density (shadow setup point) D2 may be set to arbitrary desired values, or stated otherwise, may be determined manually, so that a conventional setup process in terms of densities can be carried out.
Since colorimetric signals are converted into colorimetric END signals, it is possible to effect the setup process thereon in terms of densities.
Because when colorimetric signals are converted into colorimetric END signals, they are converted within the reproduction range of the reversal film, it is possible to employ an existing automatic (or manual) setup process of a linear scanning reader, e.g., a scanner, for image signals from the reversal subject.
According to the above embodiment, furthermore, for converting device-dependent image signals of an original scene, e.g., R, G, B signals 12 captured by a digital camera, into calorimetric signals (X, Y, Z or L*, a*, b*) 18, a color chart having a plurality of color patches representing desired typical colors with different chromas, lightnesses, and hues, i.e., a commercially available Macbeth color checker, is imaged by the digital camera which is to output the device-depending image signals. At least first-order terms of R, G, B signals of the imaged color chart are calculated as a group of first explanatory variables. The group of first explanatory variables is then subjected to a principal component analysis for conversion into a group of second explanatory variables which cross each other. Colorimetric values of the color patches of the color chart (color signals in the second color space) are used as a group of criterion variables, and the group of criterion variables and the group of second explanatory variables are subjected to a multiple regression analysis to determine a matrix of partial regression coefficients. Finally, the partial regression coefficients are tested to select explanatory variables at a predetermined significance level among the group of second explanatory variables, and the selected explanatory variables are established as usable explanatory variables.
The R, G, B signals are then subjected to a matrix of partial regression coefficients relative to the usable explanatory variables for conversion into the colorimetric signals (X, Y, Z) 18.
Since the above process of converting the R, G, B signals 12 as device-dependent image signals into the calorimetric signals 18 as device-independent image signals use matrices which have a small amount of data, the storage capacity for storing the matrices may be relatively small. Because the group of second explanatory variables converted by the principal component analysis is used, the accuracy of color conversion is much better than the matrix process of the color conversion technique as disclosed in Japanese laid-open patent publication No. 2-29177 (According to this color conversion technique, R, G, B signals which are not subjected to a principal component analysis and their squared terms are used for color conversion with a matrix produced by a multiple regression analysis. Because explanatory variables are highly correlated to each other, a multicollineation phenomenon which is an unstable model may be caused statistically, and as a result a low accuracy of color conversion with respect to colors other than those colors which are used to generate the matrix is not compensated for).
If a Macbeth color checker having color patches which represent 24 colors substantially uniformly covering a color space is used as the color chart, then a conversion matrix for converting the colors of R, G, B signals accurately into calorimetric values can easily be generated.
The calorimetric signals 18 of the original scene which have been converted by the matrix 20 are converted into c, m, y, k signals whose colors are calorimetrically saved by the accurate original scene reproduction table 42 which is an association table of c, m, y, k signals 46 determined with respect to all target values of the colorimetric signals 18 of the original scene.
Therefore, hues, in particular, of an image on a hard copy that is produced by the image output unit 35 based on the c, m, y, k signals 46 which is produced depending on the R, G, B signals 12, are highly accurately representative of the hues of the original scene.
Before the calorimetric signals 18 of the original scene are converted into the c, m, y, k signals 46, the colorimetric signals 18 are converted into calorimetric END signals 52. After the calorimetric END signals 52 are subjected to a setup process and a gradation conversion process, they are inversely converted into colorimetric signals 18, which are then converted into c, m, y, k signals 46 whose colors are calorimetrically saved. Accordingly, it is possible to achieve a desired image-dependent finish based on accurately reproduced colors of the original scene.
If necessary, a process of changing the colorimetric signals 18 of the original scene into colorimetric signals 18 under an observing light source different from the imaging light source may be added to accomplish the same color reproduction as under the imaging light source.
According to the present invention, therefore, c, m, y, k signals having hues which are highly similar to those of the original scene can be produced from the device-dependent image signals that are generated from the original scene.
Since the device-dependent image signals are generated from a digital camera, for example, it is possible to obtain a hard copy accurately representative of the colors of the original scene more easily than the conventional process of generating a hard copy from a reversal film as a subject.
According to the above embodiment, moreover, R, G, B signals 12 of an original scene captured by a digital camera are converted into device-independent calorimetric signals 18, which are then converted into c, m, y signals 28 which are dye density signals on an exposed reversal film by the dye density converter 30.
The c, m, y signals 28 which are dye density signals on the exposed reversal film have been converted as signals that can be processed in the same manner as dye density signals (c, m, y signals) 34 on a reversal film that has been exposed to signals read by a scanner input unit. Therefore, the c, m, y signals 28 can easily be converted into c, m, y, k signals 48 which are halftone dot % signals under so-called color-separating default conditions (image processing conditions including a gradation conversion process, a color correction process, a sharpness controlling process, an under color removal process, and a K-plate generating process) which are stored as the standard condition reproduction table 44 in a memory.
Thus, the R, G, B signals 12 outputted from the digital camera can easily be converted into c, m, y, k signals 48 which are halftone dot % signals.
According to the present invention, device-dependent image signals of an original scene are converted into calorimetric signals, and the calorimetric signals are then converted into dye density signals on a reversal subject.
Consequently, device-dependent image signals of an original scene can easily be handled by a color-separating system of a scanner (under standard color-separating conditions).
More specifically, inasmuch as signals supplied to a signal processing system of a scanner are dye density signals on a reversal subject, even if the device-dependent image signals are generated by a digital camera or a scanner, it is possible to output a desired image from the supplied image signals, directly using so-called color-separating default conditions (image processing conditions including a gradation conversion process, a color correction process, an under color removal process, and a K-plate generating process) which are stored as standard conditions in a particular scanner that has been standardized empirically.
Since the color-separating default conditions can be used, the additional advantage of shortening a period of time required until the image is outputted is also provided.
According to the above embodiment, furthermore, R, G, B signals 12 of an original image captured by a digital camera are converted into calorimetric signals (X, Y, Z) 18 by the matrix 20 of the calorimetric converter 16, and the colorimetric signals (X, Y, Z) 18 are subjected, if necessary, to a setup process by the calorimetric setup unit 26 and converted into dye density signals (c, m, y) 28 on a reversal subject by the dye density converter 30.
R, G, B signals 14 obtained from a reversal subject by the scanner input unit are converted into colorimetric signals (X, Y, Z) 22 by the table 24 of the calorimetric converter 16, and the colorimetric signals (X, Y, Z) 22 are subjected, if necessary, to a setup process by the colorimetric setup unit 26 and converted into dye density signals (c, m, y) 34 by the dye density converter 36.
The dye density signals (c, m, y) 34 supplied through the dye density converter 36 to one port of the switch 45 of the cmyk converter 32 are dye density signals on a reversal subject, and the dye density signals (c, m, y) 28 supplied through the dye density converter 30 to the other port of the switch 45 are also dye density signals on a reversal subject.
The standard condition reproduction table 44 stores standard color-separating default conditions (image processing conditions including a gradation conversion process, a color correction process, an under color removal process, and a K-plate generating process) for color-separating the dye density signals on the reversal subject. The dye density signals 28, 34 on the reversal subject are color-separated and converted into c, m, y, k signals which are halftone dot % signals by the color-separating default conditions.
Therefore, the switch 45 can select one of its input ports depending on whether image signals are supplied from a digital camera (R, G, B signals 12) or a scanner input unit (R, G, B signals 14), and output signals from the switch 45 can easily be converted into c, m, y, k signals which are halftone dot % signals by the common standard color-separating default conditions.
According to the present invention, R, G, B signals outputted from a digital camera are converted into colorimetric signals, and then the colorimetric signals are converted into dye density signals. Furthermore, R, G, B signals outputted from an image reader are converted into calorimetric signals, and then the colorimetric signals are converted into dye density signals. The dye density signals are then processed under standard image processing conditions including a gradation conversion process, a color correction process, an under color removal process, and a K-plate generating process, for conversion into c, m, y, k signals which are halftone dot % signals.
Even if inputted R, G, B signals are supplied from a digital camera or an image reader, a desired image can be outputted on the basis of the R, G, B signals directly using so-called color-separating default conditions which are stored as standard conditions in a particular image reader, e.g., a scanner, that has been standardized empirically. Inasmuch as the R, G, B signals are converted into device-independent calorimetric signals, it is possible to output a device-independent image based on the R, G, B signals.
Although a certain preferred embodiment of the present invention has been shown and described in detail, it should be understood that various changes and modifications may be made therein without departing from the scope of the appended claims.

Claims (5)

What is claimed is:
1. A method of processing an image signal, comprising:
converting device-dependent image signals produced from an original scene into a plurality of colorimetric signals and converting said colorimetric signals into colorimetric equivalent-neutral-density signals of said original scene;
generating rough data of said colorimetric equivalent-neutral-density signals;
setting up automatically a gradation conversion curve based on said rough data;
converting gradations of said colorimetric equivalent-neutral-density signals based on said gradation conversion curve; and
converting the colorimetric equivalent-neutral-density signals whose gradations have been converted into a plurality of colorimetric signals;
wherein setting up the gradation conversion curve comprises determining a cumulative histogram of density values and assigning a high density point and a low density point based on the histogram values.
2. A method according to claim 1, wherein said step of converting colorimetric signals into colorimetric equivalent-neutral-density signals comprises converting the colorimetric signals into R, G, B signals in a RGB color system, and logarithmically converting ratios of said R, G, B signals to a basic stimulus into the colorimetric equivalent-neutral-density signals, and wherein said step of converting the colorimetric equivalent-neutral-density signals whose gradations have been converted into colorimetric signals comprises inversely logarithmically converting the colorimetric equivalent-neutral-density signals whose gradations have been converted into R, G, B signals, and converting the R, G, B signals into the colorimetric signals.
3. A method according to claim 2, wherein said RGB color system comprises a range including reference color stimuli and containing a color reproduction range of a reversal film.
4. The method of claim 3, wherein the plurality of colorimetric signals comprise a plurality of device-independent colorimetric signals.
5. The method of claim 1, wherein the high density point is associated with a colorimetric END value corresponding to a highlight halftone percentage, and the low density point is associated with a colorimetric END value corresponding to a shadow halftone dot percentage.
US09/852,633 1996-11-29 2001-05-11 Method of processing image signal Expired - Fee Related US6668079B2 (en)

Priority Applications (1)

Application Number Priority Date Filing Date Title
US09/852,633 US6668079B2 (en) 1996-11-29 2001-05-11 Method of processing image signal

Applications Claiming Priority (12)

Application Number Priority Date Filing Date Title
JP31976996A JP3770671B2 (en) 1996-11-29 1996-11-29 Color conversion method
JP8-319749 1996-11-29
JP8-319754 1996-11-29
JP31973696A JP3803441B2 (en) 1996-11-29 1996-11-29 Color conversion method
JP8-319769 1996-11-29
JP8-319736 1996-11-29
JP31975496 1996-11-29
JP31974996A JP3671097B2 (en) 1996-11-29 1996-11-29 Image signal processing method
JP8342050A JPH10191077A (en) 1996-12-20 1996-12-20 Image signal processing method
JP8-342050 1996-12-20
US08/980,367 US6278533B1 (en) 1996-11-29 1997-11-28 Method of processing image signal
US09/852,633 US6668079B2 (en) 1996-11-29 2001-05-11 Method of processing image signal

Related Parent Applications (1)

Application Number Title Priority Date Filing Date
US08/980,367 Division US6278533B1 (en) 1996-11-29 1997-11-28 Method of processing image signal

Publications (2)

Publication Number Publication Date
US20030053085A1 US20030053085A1 (en) 2003-03-20
US6668079B2 true US6668079B2 (en) 2003-12-23

Family

ID=27531101

Family Applications (2)

Application Number Title Priority Date Filing Date
US08/980,367 Expired - Fee Related US6278533B1 (en) 1996-11-29 1997-11-28 Method of processing image signal
US09/852,633 Expired - Fee Related US6668079B2 (en) 1996-11-29 2001-05-11 Method of processing image signal

Family Applications Before (1)

Application Number Title Priority Date Filing Date
US08/980,367 Expired - Fee Related US6278533B1 (en) 1996-11-29 1997-11-28 Method of processing image signal

Country Status (1)

Country Link
US (2) US6278533B1 (en)

Cited By (10)

* Cited by examiner, † Cited by third party
Publication number Priority date Publication date Assignee Title
US20020018225A1 (en) * 2000-07-11 2002-02-14 Fuji Photo Film Co., Ltd. Color processing method, color processing apparatus, and color processing program storage medium
US20020163586A1 (en) * 2001-03-08 2002-11-07 Fuji Photo Film Co., Ltd. Method and apparatus for capturing image
US20030020727A1 (en) * 2001-07-30 2003-01-30 Newman Todd D. Reducing metamerism in color management systems
US20030086104A1 (en) * 2001-11-02 2003-05-08 Chun-Yen Chen Color conversion method for preferred color tones
US20050018226A1 (en) * 2003-07-25 2005-01-27 Pentax Corporation Color-space transformation-matrix calculating system and calculating method
US20050046883A1 (en) * 2003-08-29 2005-03-03 Pentax Corporation Color-space transformation-matrix calculating system and calculating method
US20050248781A1 (en) * 2004-05-06 2005-11-10 Canon Kabushiki Kaisha Color characterization with enhanced purity
US20070183659A1 (en) * 2006-02-06 2007-08-09 Canon Kabushiki Kaisha Method of creating color chart for color evaluation, and information processing apparatus thereof
US20090073088A1 (en) * 2007-09-13 2009-03-19 Au Optronics Corp. Multi-primary color display and color filter
US20100238300A1 (en) * 2009-03-23 2010-09-23 Seiko Epson Corporation Color control apparatus, method for creating color control system, and method for creating color reproduction apparatus

Families Citing this family (59)

* Cited by examiner, † Cited by third party
Publication number Priority date Publication date Assignee Title
US6278533B1 (en) * 1996-11-29 2001-08-21 Fuji Photo Film Co., Ltd. Method of processing image signal
JP3634633B2 (en) * 1998-07-24 2005-03-30 キヤノン株式会社 Image processing apparatus and method
US6396599B1 (en) * 1998-12-21 2002-05-28 Eastman Kodak Company Method and apparatus for modifying a portion of an image in accordance with colorimetric parameters
JP2000276094A (en) * 1999-03-29 2000-10-06 Fuji Photo Film Co Ltd Gradation correcting method and picture display system
JP4191854B2 (en) * 1999-08-20 2008-12-03 東芝テック株式会社 Color image processing device
EP1085748A3 (en) * 1999-09-16 2003-04-02 Fuji Photo Film Co., Ltd. Method and apparatus for converting a colour image signal
US7057766B1 (en) * 1999-10-14 2006-06-06 Fuji Photo Film Co., Ltd. Apparatus for and method of outputting image
GB2361158B (en) * 2000-04-04 2004-03-17 Coats Viyella Plc Colour specification
JP2002016818A (en) * 2000-04-28 2002-01-18 Fuji Photo Film Co Ltd Color correction method and device, and recording medium
US6681042B1 (en) * 2000-08-29 2004-01-20 Eastman Kodak Company Digital color image processing method
JP2002094812A (en) * 2000-09-12 2002-03-29 Canon Inc Image-processing method and device, and record medium
JP4609682B2 (en) * 2000-11-29 2011-01-12 ソニー株式会社 Communication system and information processing method
PL200158B1 (en) * 2000-12-06 2008-12-31 Avt Advanced Vision Technology Spectral color control method
EP1248087B1 (en) * 2001-04-05 2006-05-31 Gretag-Macbeth AG Method for generating a color palette
DE10132589B4 (en) 2001-07-05 2005-11-03 Koenig & Bauer Ag Method for qualitative assessment of material
JP3818098B2 (en) * 2001-08-17 2006-09-06 ソニー株式会社 Image signal processing method and image signal processing apparatus
DE10148131B4 (en) * 2001-09-28 2010-07-01 Gkss-Forschungszentrum Geesthacht Gmbh Process for the preparation of a polymer, polymer and proton conductive membrane for electrochemical applications
JP3820979B2 (en) * 2001-12-17 2006-09-13 ブラザー工業株式会社 Patch forming apparatus and program
DE10208289C1 (en) * 2002-02-26 2003-02-27 Koenig & Bauer Ag Electronic image sensor with read out of signals from individual sensors so that overlapping image regions are only read once
DE10208285A1 (en) * 2002-02-26 2003-09-18 Koenig & Bauer Ag Process for correcting the image data of a camera system
JP2003299116A (en) * 2002-04-01 2003-10-17 Minolta Co Ltd Image processing apparatus and program thereof
US20050200902A1 (en) * 2002-04-08 2005-09-15 Marc Mahy System and method for characterizing a printing device
JP4475623B2 (en) * 2002-07-31 2010-06-09 キヤノン株式会社 Color processing method and color processing apparatus
US7342593B2 (en) * 2002-11-01 2008-03-11 Hewlett-Packard Development Company, L.P. Color mapping methods, data signals, articles of manufacture, and color mapping apparatuses
KR100612835B1 (en) * 2002-12-12 2006-08-18 삼성전자주식회사 A method and apparatus for generating user preference data regarding color characteristic of image, and method and apparatus for converting color preference of image using the method and appatatus
US7375851B2 (en) * 2003-01-21 2008-05-20 Xerox Corporation State-space based modeling of pixel elements of a dynamically varying color marking device
US20050078747A1 (en) * 2003-10-14 2005-04-14 Honeywell International Inc. Multi-stage moving object segmentation
US7177474B2 (en) * 2003-11-10 2007-02-13 Mobixell Networks Inc. Video to animation conversion with file size constraint
JP4344628B2 (en) * 2004-02-25 2009-10-14 富士フイルム株式会社 Image processing method, image processing system, image processing apparatus, and image processing program
JP2005286999A (en) * 2004-03-05 2005-10-13 Fuji Photo Film Co Ltd Allocation method of threshold matrix
JP2005252893A (en) 2004-03-05 2005-09-15 Fuji Photo Film Co Ltd Threshold matrix
JP2005252888A (en) 2004-03-05 2005-09-15 Fuji Photo Film Co Ltd Method for generating threshold matrix and threshold matrix thereof, and reproducing method of color image
US7663788B2 (en) * 2004-06-29 2010-02-16 Fujifilm Corporation Image correcting apparatus and method, and image correction program
JP4241632B2 (en) * 2005-01-25 2009-03-18 富士フイルム株式会社 Color plate creation threshold value matrix creation method, color image reproduction method, color image separation creation device, and threshold matrix
JP4540492B2 (en) * 2005-01-28 2010-09-08 Hoya株式会社 Color conversion matrix calculation method and image signal processing apparatus
US7733353B2 (en) 2005-02-15 2010-06-08 Eastman Kodak Company System and method for profiling digital-image input devices
EP1849295A1 (en) * 2005-02-15 2007-10-31 Eastman Kodak Company Profiling digital-image input devices
JP4290136B2 (en) * 2005-03-14 2009-07-01 キヤノン株式会社 Color processing apparatus and method
JP4854340B2 (en) * 2006-03-08 2012-01-18 キヤノン株式会社 Image processing method and apparatus
TWI352943B (en) * 2007-09-28 2011-11-21 Au Optronics Corp Multi-primary color display and the manufacturing
US8749861B2 (en) * 2007-09-28 2014-06-10 Xerox Corporation L*a*b* scanning using RGB-clear
US8189232B2 (en) * 2007-10-23 2012-05-29 Fujifilm Corporation Density calculating apparatus, density setting apparatus, density calculating program storage medium, and density setting program storage medium
US8189233B2 (en) * 2007-10-23 2012-05-29 Fujifilm Corporation Density calculating apparatus, density setting apparatus, density calculating program storage medium, and density setting program storage medium
US7847976B2 (en) * 2007-12-20 2010-12-07 Xerox Corporation Image output color management system and method
US20100157330A1 (en) * 2008-12-18 2010-06-24 Yue Qiao Optimized color conversion
US20100157331A1 (en) * 2008-12-23 2010-06-24 Vladimir Shestak Color Smoothing Mechanism for an Ink Minimizing Profile Making Tool
CN102292991B (en) * 2009-05-15 2014-10-08 夏普株式会社 Image processing device and image processing method
US8390885B2 (en) * 2009-09-11 2013-03-05 Palo Alto Research Center Incorporated Methods and system for improved color characterization
JP5504909B2 (en) * 2010-01-21 2014-05-28 株式会社リコー Image processing apparatus, image processing method, program, and recording medium
US9264558B2 (en) * 2010-07-20 2016-02-16 Kodak Alaris Inc. System for verifying accuracy of a raster scanned image of a document
JP5618211B2 (en) * 2011-02-09 2014-11-05 株式会社リコー Control apparatus, image forming apparatus, and control method
WO2014011786A2 (en) * 2012-07-10 2014-01-16 Fgroupip1, Llc Method to identify chemical compounds using colorimetric spot tests
JP6264288B2 (en) * 2012-09-03 2018-01-24 株式会社ニコン Image processing apparatus and image processing method
JP5901563B2 (en) * 2013-03-29 2016-04-13 富士フイルム株式会社 Signal conversion method and apparatus, program, and print system
US9934595B2 (en) 2015-11-12 2018-04-03 Qualcomm Incorporated White point calibration and gamut mapping for a display
US9626775B1 (en) * 2015-11-12 2017-04-18 Qualcomm Incorporated White point calibration and gamut mapping for a display
JP6891403B2 (en) * 2016-05-02 2021-06-18 富士フイルムビジネスイノベーション株式会社 Change degree derivation device, change degree derivation system, change degree derivation method, color known body and program used for this
US20180188113A1 (en) * 2016-12-29 2018-07-05 Printing Technology Research Institute Cover device and method for measuring hue using mobile device
US20230102663A1 (en) * 2021-09-21 2023-03-30 Samsung Electronics Co., Ltd. Skin tone protection using a dual-core geometric skin tone model built in device-independent space

Citations (28)

* Cited by examiner, † Cited by third party
Publication number Priority date Publication date Assignee Title
US3612753A (en) 1969-04-23 1971-10-12 Ventures Res & Dev Self-adaptive system for the reproduction of color
US4561016A (en) 1982-06-04 1985-12-24 Dr. -Ing. Rudolf Hell Gmbh Method and apparatus for recording color pictures for multicolor printing
US4642680A (en) 1982-12-14 1987-02-10 Dainippon Screen Mfg. Co., Ltd. Method and system for processing image data stored in RGB form
US4812879A (en) 1986-07-29 1989-03-14 Fuji Photo Film Co., Ltd. Automatic photographic printing apparatus with simulator and method of adjusting simulator of automatic photographic printing apparatus
US4893180A (en) 1985-11-09 1990-01-09 Fuji Photo Film Co., Ltd. Color image signal processing method
JPH02105676A (en) 1988-10-13 1990-04-18 Fuji Photo Film Co Ltd Image input/output system and automatic setting method for signal processing condition
JPH02291778A (en) 1989-05-02 1990-12-03 Fuji Xerox Co Ltd Color converter
JPH02291777A (en) 1989-05-02 1990-12-03 Fuji Xerox Co Ltd Color converter
JPH04337965A (en) 1991-05-15 1992-11-25 Toppan Printing Co Ltd Method and device for predicting print reproducible color and device for deciding print reproducible color predicting expression
JPH04337966A (en) 1991-05-15 1992-11-25 Toppan Printing Co Ltd Method and device for predicting multicolor image reproducible color density and device for deciding multicolor image reproducible color density predicting expression
US5187570A (en) 1989-06-14 1993-02-16 Fuji Xerox Co., Ltd. Color image outputting system for an image processing apparatus
US5200817A (en) 1991-08-29 1993-04-06 Xerox Corporation Conversion of an RGB color scanner into a colorimetric scanner
US5268754A (en) 1991-03-01 1993-12-07 Barco Graphics N.V. Method and a device for converting a color coordinate set
US5278669A (en) 1991-02-21 1994-01-11 Fuji Photo Film Co. Ltd. Image reading apparatus for automatically setting up image reading region and method thereof
US5315347A (en) 1992-04-27 1994-05-24 Fuji Photo Film Co., Ltd. Diffusion transfer type duplicating camera
US5317678A (en) 1989-03-15 1994-05-31 Hitachi, Ltd. Method for changing color of displayed images by use of color components
US5375193A (en) 1992-03-27 1994-12-20 Milliken Research Corporation Method and apparatus for reproducing blended colorants on an electronic display
US5416890A (en) 1991-12-11 1995-05-16 Xerox Corporation Graphical user interface for controlling color gamut clipping
US5471324A (en) 1994-04-05 1995-11-28 Xerox Corporation Color printer calibration with improved color mapping linearity
US5479524A (en) 1993-08-06 1995-12-26 Farrell; Joyce E. Method and apparatus for identifying the color of an image
US5537228A (en) 1992-05-04 1996-07-16 Hewlett-Packard Apparatus for forming color images, using a hue-plus-gray color model
US5668596A (en) 1996-02-29 1997-09-16 Eastman Kodak Company Digital imaging device optimized for color performance
US5668890A (en) 1992-04-06 1997-09-16 Linotype-Hell Ag Method and apparatus for the automatic analysis of density range, color cast, and gradation of image originals on the BaSis of image values transformed from a first color space into a second color space
JPH10816A (en) 1996-06-14 1998-01-06 Fuji Photo Film Co Ltd Method for color conversion
US5734801A (en) 1994-12-28 1998-03-31 Fuji Photo Film Co., Ltd. Method of and apparatus for producing color proof
US5768130A (en) 1995-05-15 1998-06-16 Lsi Logic Corporation Method of calculating macrocell power and delay values
US5844699A (en) 1990-11-15 1998-12-01 Canon Kabushiki Kaisha Color image processing apparatus
US6278533B1 (en) * 1996-11-29 2001-08-21 Fuji Photo Film Co., Ltd. Method of processing image signal

Patent Citations (30)

* Cited by examiner, † Cited by third party
Publication number Priority date Publication date Assignee Title
US3612753A (en) 1969-04-23 1971-10-12 Ventures Res & Dev Self-adaptive system for the reproduction of color
US4561016A (en) 1982-06-04 1985-12-24 Dr. -Ing. Rudolf Hell Gmbh Method and apparatus for recording color pictures for multicolor printing
US4642680A (en) 1982-12-14 1987-02-10 Dainippon Screen Mfg. Co., Ltd. Method and system for processing image data stored in RGB form
US4893180A (en) 1985-11-09 1990-01-09 Fuji Photo Film Co., Ltd. Color image signal processing method
US4812879A (en) 1986-07-29 1989-03-14 Fuji Photo Film Co., Ltd. Automatic photographic printing apparatus with simulator and method of adjusting simulator of automatic photographic printing apparatus
JPH02105676A (en) 1988-10-13 1990-04-18 Fuji Photo Film Co Ltd Image input/output system and automatic setting method for signal processing condition
US5317678A (en) 1989-03-15 1994-05-31 Hitachi, Ltd. Method for changing color of displayed images by use of color components
JPH02291778A (en) 1989-05-02 1990-12-03 Fuji Xerox Co Ltd Color converter
JPH02291777A (en) 1989-05-02 1990-12-03 Fuji Xerox Co Ltd Color converter
US5343312A (en) 1989-06-14 1994-08-30 Fuji Xerox Co., Ltd. Color image outputting system for an image processing apparatus
US5187570A (en) 1989-06-14 1993-02-16 Fuji Xerox Co., Ltd. Color image outputting system for an image processing apparatus
US5844699A (en) 1990-11-15 1998-12-01 Canon Kabushiki Kaisha Color image processing apparatus
US5278669A (en) 1991-02-21 1994-01-11 Fuji Photo Film Co. Ltd. Image reading apparatus for automatically setting up image reading region and method thereof
US5268754A (en) 1991-03-01 1993-12-07 Barco Graphics N.V. Method and a device for converting a color coordinate set
JPH04337966A (en) 1991-05-15 1992-11-25 Toppan Printing Co Ltd Method and device for predicting multicolor image reproducible color density and device for deciding multicolor image reproducible color density predicting expression
JPH04337965A (en) 1991-05-15 1992-11-25 Toppan Printing Co Ltd Method and device for predicting print reproducible color and device for deciding print reproducible color predicting expression
US5200817A (en) 1991-08-29 1993-04-06 Xerox Corporation Conversion of an RGB color scanner into a colorimetric scanner
US5416890A (en) 1991-12-11 1995-05-16 Xerox Corporation Graphical user interface for controlling color gamut clipping
US5375193A (en) 1992-03-27 1994-12-20 Milliken Research Corporation Method and apparatus for reproducing blended colorants on an electronic display
US5428720A (en) 1992-03-27 1995-06-27 Milliken Research Corporation Method and apparatus for reproducing blended colorants on an electronic display
US5668890A (en) 1992-04-06 1997-09-16 Linotype-Hell Ag Method and apparatus for the automatic analysis of density range, color cast, and gradation of image originals on the BaSis of image values transformed from a first color space into a second color space
US5315347A (en) 1992-04-27 1994-05-24 Fuji Photo Film Co., Ltd. Diffusion transfer type duplicating camera
US5537228A (en) 1992-05-04 1996-07-16 Hewlett-Packard Apparatus for forming color images, using a hue-plus-gray color model
US5479524A (en) 1993-08-06 1995-12-26 Farrell; Joyce E. Method and apparatus for identifying the color of an image
US5471324A (en) 1994-04-05 1995-11-28 Xerox Corporation Color printer calibration with improved color mapping linearity
US5734801A (en) 1994-12-28 1998-03-31 Fuji Photo Film Co., Ltd. Method of and apparatus for producing color proof
US5768130A (en) 1995-05-15 1998-06-16 Lsi Logic Corporation Method of calculating macrocell power and delay values
US5668596A (en) 1996-02-29 1997-09-16 Eastman Kodak Company Digital imaging device optimized for color performance
JPH10816A (en) 1996-06-14 1998-01-06 Fuji Photo Film Co Ltd Method for color conversion
US6278533B1 (en) * 1996-11-29 2001-08-21 Fuji Photo Film Co., Ltd. Method of processing image signal

Non-Patent Citations (1)

* Cited by examiner, † Cited by third party
Title
Kanamori et al., "Color Correction of Color Hardcopy by Interpolation using 4-Neighborhood Points," The Journal of the Institute of Image Election, vol. 18, No. 5 (1989) pp. 319-328.

Cited By (17)

* Cited by examiner, † Cited by third party
Publication number Priority date Publication date Assignee Title
US20020018225A1 (en) * 2000-07-11 2002-02-14 Fuji Photo Film Co., Ltd. Color processing method, color processing apparatus, and color processing program storage medium
US7202971B2 (en) * 2000-07-11 2007-04-10 Fujifilm Corporation Color processing method, color processing apparatus, and color processing program storage medium
US20020163586A1 (en) * 2001-03-08 2002-11-07 Fuji Photo Film Co., Ltd. Method and apparatus for capturing image
US7053910B2 (en) * 2001-07-30 2006-05-30 Canon Kabushiki Kaisha Reducing metamerism in color management systems
US20030020727A1 (en) * 2001-07-30 2003-01-30 Newman Todd D. Reducing metamerism in color management systems
US20030086104A1 (en) * 2001-11-02 2003-05-08 Chun-Yen Chen Color conversion method for preferred color tones
US6873730B2 (en) * 2001-11-02 2005-03-29 Industrial Technology Research Institute Color conversion method for preferred color tones
US20050018226A1 (en) * 2003-07-25 2005-01-27 Pentax Corporation Color-space transformation-matrix calculating system and calculating method
US7586642B2 (en) 2003-07-25 2009-09-08 Hoya Corporation Color-space transformation-matrix calculating system and calculating method
US20050046883A1 (en) * 2003-08-29 2005-03-03 Pentax Corporation Color-space transformation-matrix calculating system and calculating method
US20050248781A1 (en) * 2004-05-06 2005-11-10 Canon Kabushiki Kaisha Color characterization with enhanced purity
US7397582B2 (en) 2004-05-06 2008-07-08 Canon Kabushiki Kaisha Color characterization with enhanced purity
US20070183659A1 (en) * 2006-02-06 2007-08-09 Canon Kabushiki Kaisha Method of creating color chart for color evaluation, and information processing apparatus thereof
US7676080B2 (en) * 2006-02-06 2010-03-09 Canon Kabushiki Kaisha Method of creating color chart for color evaluation, and information processing apparatus thereof
US20090073088A1 (en) * 2007-09-13 2009-03-19 Au Optronics Corp. Multi-primary color display and color filter
US8040027B2 (en) 2007-09-13 2011-10-18 Au Optronics Corp. Multi-primary color display and color filter
US20100238300A1 (en) * 2009-03-23 2010-09-23 Seiko Epson Corporation Color control apparatus, method for creating color control system, and method for creating color reproduction apparatus

Also Published As

Publication number Publication date
US6278533B1 (en) 2001-08-21
US20030053085A1 (en) 2003-03-20

Similar Documents

Publication Publication Date Title
US6668079B2 (en) Method of processing image signal
US7206100B2 (en) Image processing method and apparatus
EP0675636B1 (en) Extended density color printing
Vrhel et al. Color device calibration: A mathematical formulation
US5594558A (en) Color image processing apparatus
US5317425A (en) Technique for use in conjunction with an imaging system for providing an appearance match between two images and for calibrating the system thereto
US6975437B2 (en) Method, apparatus and recording medium for color correction
EP0653879B1 (en) Method of and system for predicting a colour reproduction image
CA1312290C (en) Method of describing a color image using a triaxial planar vector color space
US5481655A (en) System for matching a picture on a monitor to a printed picture
JPH06501144A (en) How to display multitone images
US7889403B2 (en) Methods and apparatus for calibrating a digital color imaging device that uses multi-hue colorants
US5781709A (en) Method of and apparatus for generating proof
US7409082B2 (en) Method, apparatus, and recording medium for processing image data to obtain color-balance adjusted image data based on white-balance adjusted image data
JP3803441B2 (en) Color conversion method
US20050243339A1 (en) Methods and apparatus for calibrating digital imaging devices
EP0446914A2 (en) Method for electronic color processing
CA2117030C (en) Color reproducing method used in an image data processing system comprising independent input and output devices
US7164495B1 (en) Method of converting image signal, method of determining original color of color image, and apparatus for converting image signal
US7742204B2 (en) Methods and apparatus for determining a total colorant limit for digital imaging devices
JP3671097B2 (en) Image signal processing method
JP3770671B2 (en) Color conversion method
JPH10191077A (en) Image signal processing method
JPH10215384A (en) Color signal processing method
JP3360531B2 (en) Method and apparatus for determining color gamut

Legal Events

Date Code Title Description
AS Assignment

Owner name: FUJIFILM CORPORATION, JAPAN

Free format text: ASSIGNMENT OF ASSIGNORS INTEREST;ASSIGNOR:FUJIFILM HOLDINGS CORPORATION (FORMERLY FUJI PHOTO FILM CO., LTD.);REEL/FRAME:018904/0001

Effective date: 20070130

Owner name: FUJIFILM CORPORATION,JAPAN

Free format text: ASSIGNMENT OF ASSIGNORS INTEREST;ASSIGNOR:FUJIFILM HOLDINGS CORPORATION (FORMERLY FUJI PHOTO FILM CO., LTD.);REEL/FRAME:018904/0001

Effective date: 20070130

FPAY Fee payment

Year of fee payment: 4

FEPP Fee payment procedure

Free format text: PAYOR NUMBER ASSIGNED (ORIGINAL EVENT CODE: ASPN); ENTITY STATUS OF PATENT OWNER: LARGE ENTITY

FPAY Fee payment

Year of fee payment: 8

REMI Maintenance fee reminder mailed
LAPS Lapse for failure to pay maintenance fees
STCH Information on status: patent discontinuation

Free format text: PATENT EXPIRED DUE TO NONPAYMENT OF MAINTENANCE FEES UNDER 37 CFR 1.362

FP Lapsed due to failure to pay maintenance fee

Effective date: 20151223