US6703819B2 - Particle impedance sensor - Google Patents
Particle impedance sensor Download PDFInfo
- Publication number
- US6703819B2 US6703819B2 US10/005,373 US537301A US6703819B2 US 6703819 B2 US6703819 B2 US 6703819B2 US 537301 A US537301 A US 537301A US 6703819 B2 US6703819 B2 US 6703819B2
- Authority
- US
- United States
- Prior art keywords
- particle
- sensor
- impedance
- signal
- characteristic
- Prior art date
- Legal status (The legal status is an assumption and is not a legal conclusion. Google has not performed a legal analysis and makes no representation as to the accuracy of the status listed.)
- Expired - Lifetime
Links
- 239000002245 particle Substances 0.000 title claims abstract description 326
- 238000000034 method Methods 0.000 claims abstract description 95
- 239000012530 fluid Substances 0.000 claims description 84
- 239000012528 membrane Substances 0.000 claims description 58
- 239000002131 composite material Substances 0.000 claims description 27
- 238000006073 displacement reaction Methods 0.000 claims description 10
- 230000001086 cytosolic effect Effects 0.000 claims description 7
- 239000004642 Polyimide Substances 0.000 claims description 4
- 210000000170 cell membrane Anatomy 0.000 claims description 4
- 229920001721 polyimide Polymers 0.000 claims description 4
- RYGMFSIKBFXOCR-UHFFFAOYSA-N Copper Chemical compound [Cu] RYGMFSIKBFXOCR-UHFFFAOYSA-N 0.000 claims description 3
- 229910052802 copper Inorganic materials 0.000 claims description 3
- 239000010949 copper Substances 0.000 claims description 3
- 238000001514 detection method Methods 0.000 abstract description 16
- 239000003124 biologic agent Substances 0.000 abstract description 5
- 210000004666 bacterial spore Anatomy 0.000 abstract description 3
- 210000004027 cell Anatomy 0.000 description 42
- 238000004458 analytical method Methods 0.000 description 33
- 230000006870 function Effects 0.000 description 25
- 239000000523 sample Substances 0.000 description 19
- 238000012545 processing Methods 0.000 description 17
- 238000005259 measurement Methods 0.000 description 16
- 238000010586 diagram Methods 0.000 description 14
- 230000005284 excitation Effects 0.000 description 14
- 230000004044 response Effects 0.000 description 13
- 239000000463 material Substances 0.000 description 11
- 238000013461 design Methods 0.000 description 10
- 238000002847 impedance measurement Methods 0.000 description 9
- 238000004088 simulation Methods 0.000 description 9
- 238000009826 distribution Methods 0.000 description 8
- 230000008901 benefit Effects 0.000 description 7
- 230000000694 effects Effects 0.000 description 7
- 230000008859 change Effects 0.000 description 6
- 239000000203 mixture Substances 0.000 description 6
- 239000007864 aqueous solution Substances 0.000 description 5
- 238000005516 engineering process Methods 0.000 description 5
- 238000001914 filtration Methods 0.000 description 5
- 238000003672 processing method Methods 0.000 description 5
- 238000013459 approach Methods 0.000 description 4
- 238000006243 chemical reaction Methods 0.000 description 4
- 238000004140 cleaning Methods 0.000 description 4
- 238000007405 data analysis Methods 0.000 description 4
- 238000004720 dielectrophoresis Methods 0.000 description 4
- 238000002474 experimental method Methods 0.000 description 4
- 238000001825 field-flow fractionation Methods 0.000 description 4
- 238000005194 fractionation Methods 0.000 description 4
- 210000004962 mammalian cell Anatomy 0.000 description 4
- 230000008569 process Effects 0.000 description 4
- 238000011160 research Methods 0.000 description 4
- 210000000601 blood cell Anatomy 0.000 description 3
- 239000006285 cell suspension Substances 0.000 description 3
- 239000003153 chemical reaction reagent Substances 0.000 description 3
- 229930195733 hydrocarbon Natural products 0.000 description 3
- 150000002430 hydrocarbons Chemical class 0.000 description 3
- 230000001965 increasing effect Effects 0.000 description 3
- 239000007788 liquid Substances 0.000 description 3
- 239000007787 solid Substances 0.000 description 3
- 238000001228 spectrum Methods 0.000 description 3
- 239000000725 suspension Substances 0.000 description 3
- 239000004215 Carbon black (E152) Substances 0.000 description 2
- 238000012512 characterization method Methods 0.000 description 2
- 238000007796 conventional method Methods 0.000 description 2
- 238000012937 correction Methods 0.000 description 2
- 230000007423 decrease Effects 0.000 description 2
- 230000007123 defense Effects 0.000 description 2
- 230000001419 dependent effect Effects 0.000 description 2
- 239000000428 dust Substances 0.000 description 2
- 239000007789 gas Substances 0.000 description 2
- 150000002500 ions Chemical class 0.000 description 2
- 230000007246 mechanism Effects 0.000 description 2
- 238000012986 modification Methods 0.000 description 2
- 230000004048 modification Effects 0.000 description 2
- 230000001338 necrotic effect Effects 0.000 description 2
- 239000003921 oil Substances 0.000 description 2
- 238000005070 sampling Methods 0.000 description 2
- 238000000926 separation method Methods 0.000 description 2
- 238000004513 sizing Methods 0.000 description 2
- 210000004215 spore Anatomy 0.000 description 2
- 239000000126 substance Substances 0.000 description 2
- 241000193738 Bacillus anthracis Species 0.000 description 1
- 229920002472 Starch Polymers 0.000 description 1
- 238000009825 accumulation Methods 0.000 description 1
- 239000003570 air Substances 0.000 description 1
- 239000012491 analyte Substances 0.000 description 1
- 230000001640 apoptogenic effect Effects 0.000 description 1
- 230000006907 apoptotic process Effects 0.000 description 1
- 238000009360 aquaculture Methods 0.000 description 1
- 244000144974 aquaculture Species 0.000 description 1
- 230000003190 augmentative effect Effects 0.000 description 1
- 238000005311 autocorrelation function Methods 0.000 description 1
- 230000001580 bacterial effect Effects 0.000 description 1
- 239000011324 bead Substances 0.000 description 1
- 239000012472 biological sample Substances 0.000 description 1
- 210000004369 blood Anatomy 0.000 description 1
- 239000008280 blood Substances 0.000 description 1
- 230000032823 cell division Effects 0.000 description 1
- 230000036978 cell physiology Effects 0.000 description 1
- 230000003833 cell viability Effects 0.000 description 1
- 238000003570 cell viability assay Methods 0.000 description 1
- 230000036755 cellular response Effects 0.000 description 1
- 239000013043 chemical agent Substances 0.000 description 1
- 239000007795 chemical reaction product Substances 0.000 description 1
- 239000013626 chemical specie Substances 0.000 description 1
- 239000003795 chemical substances by application Substances 0.000 description 1
- 238000004891 communication Methods 0.000 description 1
- 238000005094 computer simulation Methods 0.000 description 1
- 238000010276 construction Methods 0.000 description 1
- 238000005314 correlation function Methods 0.000 description 1
- 210000000805 cytoplasm Anatomy 0.000 description 1
- 230000007812 deficiency Effects 0.000 description 1
- 239000010432 diamond Substances 0.000 description 1
- 239000003989 dielectric material Substances 0.000 description 1
- 239000006185 dispersion Substances 0.000 description 1
- 230000005684 electric field Effects 0.000 description 1
- 230000007613 environmental effect Effects 0.000 description 1
- 238000000684 flow cytometry Methods 0.000 description 1
- 238000011010 flushing procedure Methods 0.000 description 1
- 238000004186 food analysis Methods 0.000 description 1
- 239000008187 granular material Substances 0.000 description 1
- 230000002209 hydrophobic effect Effects 0.000 description 1
- 238000001566 impedance spectroscopy Methods 0.000 description 1
- 230000006872 improvement Effects 0.000 description 1
- 230000001939 inductive effect Effects 0.000 description 1
- 238000002347 injection Methods 0.000 description 1
- 239000007924 injection Substances 0.000 description 1
- 230000010354 integration Effects 0.000 description 1
- 239000013067 intermediate product Substances 0.000 description 1
- 238000011835 investigation Methods 0.000 description 1
- 238000002032 lab-on-a-chip Methods 0.000 description 1
- 238000010030 laminating Methods 0.000 description 1
- 239000004816 latex Substances 0.000 description 1
- 229920000126 latex Polymers 0.000 description 1
- 238000004519 manufacturing process Methods 0.000 description 1
- 238000013178 mathematical model Methods 0.000 description 1
- 239000002184 metal Substances 0.000 description 1
- 229910052751 metal Inorganic materials 0.000 description 1
- 238000004452 microanalysis Methods 0.000 description 1
- 239000011859 microparticle Substances 0.000 description 1
- 239000004005 microsphere Substances 0.000 description 1
- 238000010606 normalization Methods 0.000 description 1
- 239000003960 organic solvent Substances 0.000 description 1
- 239000011236 particulate material Substances 0.000 description 1
- 238000000206 photolithography Methods 0.000 description 1
- 239000000047 product Substances 0.000 description 1
- 230000000717 retained effect Effects 0.000 description 1
- 239000012488 sample solution Substances 0.000 description 1
- 239000013049 sediment Substances 0.000 description 1
- 239000011540 sensing material Substances 0.000 description 1
- 230000035945 sensitivity Effects 0.000 description 1
- 239000000779 smoke Substances 0.000 description 1
- 238000004856 soil analysis Methods 0.000 description 1
- 239000000243 solution Substances 0.000 description 1
- 239000002904 solvent Substances 0.000 description 1
- 238000000638 solvent extraction Methods 0.000 description 1
- 239000008107 starch Substances 0.000 description 1
- 235000019698 starch Nutrition 0.000 description 1
- 239000000758 substrate Substances 0.000 description 1
- 210000001519 tissue Anatomy 0.000 description 1
- 239000003053 toxin Substances 0.000 description 1
- 231100000765 toxin Toxicity 0.000 description 1
- 108700012359 toxins Proteins 0.000 description 1
- 230000035899 viability Effects 0.000 description 1
- XLYOFNOQVPJJNP-UHFFFAOYSA-N water Substances O XLYOFNOQVPJJNP-UHFFFAOYSA-N 0.000 description 1
Images


Classifications
-
- G01N15/13—
-
- G01N2015/1027—
-
- G01N2015/1029—
-
- G01N2015/135—
Definitions
- the present invention relates generally to fluidic processing and sensor technology. More particularly, it relates to a variety of apparatuses and methods for sensing particle properties in a microfluidic environment. Even more particularly, it relates to novel techniques for microfluidic, impedance sensing of particles.
- the technique passes a carrier fluid in which the particles to be counted are suspended through a small volume channel that usually consists of a hole in a membrane. As particles pass through the channel, the flow of electrical current between electrodes immersed in the carrier fluid on either side of the membrane is perturbed. Electronics in the circuitry that drives the electrodes detect the electrical perturbations as particles pass through the channel, and information about the size of the particles may be inferred from the characteristics of these signals.
- the strength of the electrical perturbation due to the presence of a particle in the channel depends approximately on the ratio of the particle volume to the channel volume and on the magnitude of the electrical current passing in the channel. Counting the electrical events that occur when a metered volume of suspending medium is drawn through the channel, and then dividing the count by the volume is done to determine the concentration of particles in a sample.
- U.S. Pat. No. 5,683,569 which is hereby incorporated by reference, discloses a method of sensing chemicals using a sensing material and an impedance sensor containing a channel separated from an electrode by a gap. By comparing the surface potential to the electrical impedance, the presence of a chemical species may be determined. Surface potential may be used to detect particles at low concentrations and resistance may be used to detect particles at high concentrations.
- WO 9804355 which is hereby incorporated by reference, discloses a method for determining the behavior of particles in a chamber subject to a spectrum of different frequency dielectrophoretic fields. An electrical measurement is used to detect impedance fluctuations.
- U.S. Pat. No. 6,149,789 discloses a process for particle manipulation using feedback from impedance sensors.
- U.S. Pat. No. 6,169,394, which is hereby incorporated by reference discloses an impedance sensor for the electrical detection of samples in a micro-analysis system; at least one pair of electrodes is used to detect the conductivity or impedance of a sample in a microchannel. Impedance sensors are also disclosed in U.S. Pat. Nos. 6,084,503, 5,569,591 and 5,580,435, each of which is hereby incorporated by reference.
- the present disclosure overcomes such disadvantages through the introduction of, among other things, a membrane and the use of novel electronic detection and signal processing methods.
- the design and methodology of this disclosure invoke principles not previously applied to particle impedance sensor apparatuses to realize robust, multi-frequency impedance sensor capabilities that may eliminate the need for external fluid metering, permit miniaturization, allow in-line operation with other fluidic systems and instruments, and facilitate rapid and potentially automated replacement of sensor elements.
- Applications of the present invention are vast and include, but are not limited to any application in which Coulter counters are used, cell and particle counting, cell and particle subpopulation analysis, cell viability analysis, cell and particle concentration analysis, cell differential analysis, medical applications, veterinary applications, bioengineering, food analysis, soil analysis, in-line particle detection in fluidic circuits and systems, detection of bacterial spores and other biological agents of potential use in warfare and terrorism, discrimination of potentially harmful biological agents from non harmful biological cells such as pollen and from inert particulate materials such as dust, smoke, and non-viable cells, detection of responses of cells such as human blood cell subpopulations to biological and chemical agents, and detection and discrimination of bacterial cells and spores (including anthrax) for medical, agricultural, environmental, and bio-warfare and bio-terrorism detection applications.
- Coulter counters are used, cell and particle counting, cell and particle subpopulation analysis, cell viability analysis, cell and particle concentration analysis, cell differential analysis, medical applications, veterinary applications, bioengineering
- the invention is an impedance sensor including a sensor electrode, first and second driver electrodes, and a channel.
- the first and second driver electrodes are coupled to the sensor electrode and driven in counter phase to produce a net output signal of about zero at the sensor electrode.
- the channel is defined through the sensor electrode and the first and second driver electrodes.
- the sensor electrode may include copper.
- the sensor electrode may include a first and second dielectric membrane sandwiching a detector electrode.
- the first or second dielectric membrane may include polyimide.
- the first or second dielectric membrane may be laminated.
- the first and second driver electrodes may contact the first and second dielectric membranes, respectively.
- the first and second driver electrodes may be driven at multiple frequencies.
- the first and second driver electrodes may be driven with an alternating current signal.
- the cross section of the channel may be rectangular.
- the sensor may also include a programmable fluid processor coupled to the sensor electrode.
- the invention is a flow-through impedance sensor including a channel, a composite membrane sensor assembly, and first and second driver electrodes.
- the channel is for transporting a carrier medium and particles through the impedance sensor.
- the composite membrane sensor assembly is coupled to the channel and includes a detector electrode sandwiched between first and second dielectric membranes.
- the first and second driver electrodes are coupled to the channel and are positioned adjacent opposite sides of the composite membrane sensor assembly.
- the first and second driver electrodes are driven in counter phase to produce: (a) a net output signal of about zero at the detector electrode when no particle is within the impedance sensor; and (b) a non-zero net output signal at the detector electrode when a particle is within the impedance sensor.
- the first and second driver electrodes may be in contact with the composite membrane sensor assembly.
- the first and second driver electrodes may be driven at multiple frequencies.
- the first and second driver electrodes may be driven with an alternating current signal.
- the impedance sensor may also include a programmable fluid processor coupled to the sensor electrode.
- the invention is a method for determining a characteristic of a packet.
- a fluid containing a packet is flowed through an impedance sensor that includes first and second driver electrodes driven in counter phase to produce a net output signal of about zero at a sensor electrode.
- Perturbations of the net output signal arising from changes in impedance associated with the presence of the packet within the impedance sensor are measured.
- the characteristic of the packet are then determined from the perturbations.
- the characteristic of the packet may include packet size.
- the characteristic of the packet may include packet transit time through the impedance sensor.
- the characteristic of the packet may include packet velocity.
- the characteristic of the packet may include packet concentration.
- the characteristic of the packet may include a relative displacement within the impedance sensor.
- the characteristic of the packet may include packet impedance.
- the invention is a method for determining a characteristic of a particle.
- An impedance sensor including a sensor electrode, first and second driver electrodes coupled to the sensor electrode and driven in counter phase to produce a net output signal of about zero at the sensor electrode, and a channel defined through the sensor electrode and the first and second driver electrodes.
- a multi-frequency drive signal is applied to the first and second driver electrodes.
- An impedance signal is received from the sensor electrode. In-phase and out-of-phase components of the impedance signal are determined at the frequencies of the drive signal. Changes in the in-phase and out-of-phase components indicative of a particle event are detected. Portions of the impedance signal are analyzed about the particle event to determine the characteristic of the particle.
- the drive signal may include a composite of separate waveforms of different frequencies, each frequency being an integer multiple of a fundamental frequency.
- the drive signal may consist of 8 separate sine waves having frequencies f, 2f, 4f, 8f, 16f, 32f, 64f, and 128f.
- the impedance signal components may be represented as 24 bit words.
- the method may also include deriving a composite signal comprising a moving sum of magnitudes of changes of the in-phase and out-of-phase components. Detecting changes indicative of a particle event may include determining when the composite signal exceeds a threshold value above a noise floor.
- Analyzing portions of the impedance signal about the particle event to determine the characteristic of the particle may include: calculating an overlap integral, constraining curves associated with the in-phase and out-of-phase components to obey a Kramers-Kronig relationship, determining a velocity of the particle, determining a mean fluid velocity, determining a concentration of particles, determining a size of the particle, determining a relative displacement of the particle, determining a dielectric property of the particle, determining a conductivity property of the particle, determining an impedance of the particle, determining a cell membrane permittivity of the particle, and/or determining a cytoplasmic permittivity of the particle.
- FIGS. 1A and 1B are schematic diagrams of conventional impedance sensors having a single channel.
- FIG. 1A shows a device having no particle in the sensor channel.
- FIG. 1B shows a device having one particle in the sensor channel.
- FIG. 2 is a schematic diagram showing a typical configuration of a conventional particle impedance sensor element, which may be employed in particle counters and sizers.
- FIGS. 3A and 3B are schematic diagrams of a conventional microfabricated impedance sensor.
- FIG. 3A is a side view
- FIG. 3B is a top view.
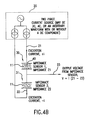
- FIG. 4 A and FIG. 4B are schematic diagrams showing a configuration of an impedance sensor having two channels, according to embodiments of the present disclosure.
- FIG. 4A has no particle in the sensor channels.
- FIG. 4B has one particle in a sensor channel.
- FIG. 5 is a schematic diagram of a configuration of an impedance sensor having one channel and two sensors connected to the channel, according to embodiments of the present disclosure.
- FIG. 6 is a schematic diagram of a configuration of an impedance sensor having one channel and two sensors connected to the channel in close proximity to each other such that a particle will pass both sensors before a second particle reaches the first sensor, according to embodiments of the present disclosure.
- FIG. 7 is a cross sectional view of a sensor based on a two-sensor, hybrid design, according to embodiments of the present disclosure.
- FIGS. 8A and 8B are exploded diagrams of a particle impedance sensor showing the driver electrodes, sensor electrodes and dielectric membranes, according to embodiments of the present disclosure.
- FIG. 9 A and FIG. 9B are schematic diagrams of an embodiment of a particle impedance sensor according to the present disclosure.
- FIG. 9A shows top views of the structures of three individual layers. Layers I and III are dielectric membranes, and layer II is a sensor electrode. All of the dimensions and materials shown (e.g., bottom being 50 ⁇ polyimide, center being 50 ⁇ copper, and top being 50 ⁇ polyimide) are exemplary only.
- FIG. 9B shows a side view of the structure after assembly. The hole all the way through the sensor assembly is the sensor channel. The larger hole that passes through only the top dielectric layer permits access to the sensor electrode through which electrical contact can be made to sensor electronics.
- FIG. 10 is a schematic diagram showing a flow pattern of a particle carried through a sensor channel by flow of the suspending medium, according to embodiments of the present disclosure.
- FIG. 11 is a plot of the peak of voltage perturbation on an sensor electrode produced by a 10 ⁇ m diameter particle as a function of its distance from the center of the sensor channel, according to embodiments of the present disclosure.
- the line shows a fit of the hyperbolic cosine function to the data.
- FIG. 12 is a finite element simulation showing the effect of a particle on the electrical potential distribution in a two membrane impedance sensor, according to embodiments of the present disclosure.
- FIG. 13 A and FIG. 13B are plots of sensor electrode potential where the potential perturbation is produced by a packet that is 15 times more conductive (FIG. 13A) and 1000 times less conductive (FIG. 13B) than the medium filling the channel, according to embodiments of the present disclosure.
- FIG. 14 shows a flow velocity profile under laminar flow conditions, according to embodiments of the present disclosure.
- FIG. 15 is a plot of velocity of a carrier medium in a sensor channel as a function of the distance from the centerline for a parabolic flow profile, according to embodiments of the present disclosure.
- FIG. 16 is a plot showing pulse shapes for particles carried by a carrier medium having a parabolic flow profile as they pass through a sensor, according to embodiments of the present disclosure.
- FIG. 17 is a finite element simulation, according to embodiments of the present disclosure.
- the curve is an approximation for a channel geometry based on a hyperbolic cosine function.
- FIG. 18 is a plot showing peak to peak voltage for a 10 ⁇ m particle travelling through an impedance sensor channel as a function of the time it takes to travel from the first peak position to the second of opposite sign, according to embodiments of the present disclosure.
- FIG. 19 is a plot showing the number of particles passing through a sensor channel as a function of their peak to peak time, according to embodiments of the present disclosure.
- FIG. 20A, FIG. 20 B and FIG. 20C are plots according to embodiments of the present disclosure showing the phase and strength of a sensor signal reflect the particle response (FIG. 20A) times the AC signal (shown as a single frequency sine function, FIG. 20 B). The resulting sensor signal is shown in FIG. 20 C.
- FIG. 21 is a plot showing a waveform containing eight different frequencies spanning a range of 128:1, according to embodiments of the present disclosure.
- FIGS. 22-30 illustrate simulation data taken in accordance with specific embodiments of data processing aspects of the present disclosure.
- FIG. 31 shows an impedance sensor embodiment according to the present disclosure.
- FIG. 32 is an illustration of the effective impedance circuit of FIG. 31 .
- FIG. 33 is a combination flowchart and schematic diagram that illustrates impedance measurement steps, according to embodiments of the present disclosure.
- FIGS. 34A and 34B are schematic diagrams of an impedance sensor according to embodiments of the present disclosure in which the driver and sensor electrodes are microfabricated inside a fluidic channel of circular cross section.
- FIGS. 35A and 35B are schematic diagrams of an impedance sensor according to embodiments of the present disclosure in which the driver and sensor electrodes are microfabricated inside a fluidic channel of rectangular cross section.
- the present disclosure overcomes deficiencies in the art by providing, in certain embodiments, a sensor that is a robust, multi-frequency impedance sensor that can be used to measure both particle characteristics and concentrations.
- This sensor can be used in microfluidic systems as an in-line component with other fluidic systems and instruments and the sensor element can easily be replaced. Also provided are processing methods for determining fluidic characteristics using sensor readings.
- Sensor devices of the current disclosure may be used with, for example, the apparatuses and methods described in U.S. Pat. No. 6,294,063, which is incorporated herein by reference. That patent discloses techniques that relate to the manipulation of packets of material using a reaction surface, an inlet port, a programmable manipulation force, a position sensor, and a controller.
- material may be introduced onto a reaction surface with the inlet port.
- the material may be compartmentalized to form a packet, and the position of the packet may be tracked with the position sensor.
- the programmable manipulation force (which, in one embodiment, may involve a dielectrophoretic force) can be adjusted as a function of the packet's position and may be applied so that the packet is programmably moved along arbitrarily chosen paths.
- Still another application that may be used in conjunction with the teachings of the current invention include those described in “Micromachined impedance spectroscopy flow cytometer of cell analysis and particle sizing,” Lab on a Chip , vol. 1, pp. 76-82 (2001), which is incorporated by reference.
- methods for processing signals to determine particle concentrations and for correcting signals for particle trajectories disclosed herein may be applied to the planar electrode embodiments described in this journal article. More particularly, the methods of this disclosure may provide (a) more accurate impedance data for particles and (b) particle concentration values without the need to explicitly measure fluid flow volumes by methods outside the sensor.
- impedance measurements are typically used to determine certain informative characteristics of samples under study or analysis. For instance, if a dielectric medium above an electrode is displaced by a packet of material having different dielectric and/or conductive properties, the impedance detected at the electrode element will change. Thus, one may accordingly determine the position of packets by noting the impedance measurements associated therewith.
- Other characteristics of packets may also be determined from the impedance detected at the electrode element. For example, the velocity of a packet flowing past an electrode may be measured by using the time difference between when the packet is above one electrode and when the same packet is above a second electrode. When the spacing between the electrodes is known, the velocity can correspondingly be determined. Since the number of packets flowing past an electrode can also be measured, the concentration of the packets can be determined directly from appropriate impedance sensors.
- impedance measurement device known in the art to function with one or more electrodes.
- Such devices may include an impedance analyzer, a DC/AC conductance meter, or any circuit based upon methods of operation of these or other instruments having an identical or similar function.
- An impedance sensor can measure changes in the voltage over a cross-sectional area.
- a simple, conventional impedance sensor for packet characterization may include a single channel device that is excited by a current from a current generator—as shown in FIGS. 1A and 1B.
- a voltage develops across the sensor in proportion to the drive current and the impedance of the sensor.
- the current may be direct (DC excitation), an AC signal consisting of one or more sinusoidal components comprising an arbitrary waveform, or a mixture of DC and arbitrary components.
- DC excitation direct
- AC signal consisting of one or more sinusoidal components comprising an arbitrary waveform
- a mixture of DC and arbitrary components When a particle enters the sensor channel, it perturbs the channel impedance, resulting in a change in the output voltage characteristics. Analysis of the voltage change allows the effective impedance of the particle to be deduced.
- the driving current contains one or more AC frequencies
- analysis of the voltage change allows the effective impedance of the particle to be deduced for each of those frequencies.
- this method is straightforward in principle and uses only one sensor channel, it has the disadvantage that analysis of the particle impedance information necessitates detection of a potentially small perturbation in the output voltage.
- FIG. 2 shows a typical configuration of another conventional particle impedance sensor element, which is typically employed in particle counters and sizers.
- the electrical current is driven from one electrode to the other via the small hole (the sensor channel) in the sensor membrane.
- the impedance of the element is dominated by that of the narrow column of carrier fluid in the sensor channel. Particles are drawn into the sensor from the outside carrier medium suspension and perturb the impedance of the sensor channel as they pass through it.
- FIGS. 3A and 3B views of another conventional microfabricated impedance sensor are shown (FIG. 3A is a side view, and FIG. 3B is a top view).
- FIG. 3A is a side view
- FIG. 3B is a top view
- the requirement to achieve a high enough ratio of particle volume to sensor volume is realized by microfabricating a capillary channel 11 , having facing electrodes 1 along a short section of its walls.
- Channel 11 contains a carrier medium.
- the effective volume of the sensor channel 11 is approximately equal to the volume of fluid contained within the region between the electrodes 1 . Displacement of the fluid between the electrodes 1 by particles transported by the carrier medium in the microfluidic channel 11 , perturbs the electrical impedance between the two electrodes.
- two channels 11 are connected and driven by identical, but opposite, current signals 21 (+i) and 22 ( ⁇ i), which come from a two phase current source 20 , as shown in FIGS. 4A and 4B.
- Particles are typically passed through only one of the sensor channels 30 , and the other channel 31 is the reference channel.
- the impedance of only that channel is perturbed. This destroys the balance in the channels, and the output voltage 23 deviates from zero.
- This scheme therefore provides an output signal 23 that reflects only the sample impedance.
- the output signal 23 also contains voltages resulting from imperfections in the initial matching of the sensors and their drive circuits. Nevertheless, signal processing is greatly simplified by canceling almost all of the voltage from each sensor channel.
- the circuit is symmetrical, and particles that pass through channel 31 will result in an output voltage of opposite phase from that caused by particles travelling through channel 30 .
- the two sensors may be connected in the same flow path 11 , as shown in FIG. 5 .
- the ability to balance the impedance of the sensors is enhanced because they are in the same microfluidic channel 11 and filled by the same carrier fluid.
- the output of voltage of the sensor 23 is, in the absence of imperfections in the sensor and the drive circuitry, summed to zero.
- Particles that enter the first sensor 30 produce an imbalance in the circuit that produces a signal +v.
- the sample particles produce a signal ⁇ v.
- the method can result in ambiguous signals unless it is possible to track each particle as it passes from one sensor to the next. This, despite its great advantages over conventional techniques, may prove problematic if the sensors are far apart.
- the two sensors can be brought very close together so that it becomes possible to observe each particle as it passes through both impedance sensor 30 and impedance sensor 31 before a second particle enters impedance sensor 30 , as demonstrated in FIG. 6 .
- This can be accomplished by microfabricating the two sensors in close proximity within a capillary tube 11 .
- the small separation between the two sensor electrodes required for tracking particles as they pass from one sensor to the next may be, in certain embodiments, less than 500 ⁇ m, 400 ⁇ m, 300 ⁇ m, 200 ⁇ m or less than 100 ⁇ m. Those of ordinary skill in the art will recognize, however, that other separations will also be suitable.
- the fluid channel 11 can be formed through the electrodes, and the sensor membranes and the electrodes that are connected to the output 23 to sum the voltages from the two sensors 30 and 31 can be combined into a single electrode, effectively hybridizing the two sensors.
- This not only simplifies fabrication, but from an electrical standpoint confers the advantage that the electrode on which the output voltage is sensed can be made smaller. Further, it is effectively sandwiched between the electrodes to which the excitation signals are provided, having the advantageous effect of shielding it from electrical noise carried through the conductive carrier medium.
- FIG. 7 shows a cross sectional view of an embodiment of an impedance sensor where the design of the sensor channel is based on a two-sensor, hybrid design.
- the sensor electrode 4 is surrounded by two dielectric membranes 12 , where a first dielectric membrane is indicted by 12 a and a second dielectric membrane is indicated by 12 b .
- the two dielectric membranes 12 , and the sensor electrode 4 together form a composite membrane sensor assembly.
- each of the electrodes 3 and 4 , and membranes 12 appear to be segmented into a top and bottom half by the fluid channel 11 in the diagram, in reality they are situated as shown in the different viewpoint of FIG. 8 .
- Driver electrode 3 a and driver electrode 3 b are excited by electrical signals of opposite phase 21 and 22 from an arbitrary waveform generator 20 programmed to provide a waveform consisting of the sum of one or more sinusoidal waves of known frequencies and phases. Because of the symmetrical construction of the sensor membrane 12 , the signals from the driver electrodes 3 cancel at the sensor electrode 4 to provide a zero signal to the detector 24 when there is no particle in the channel. However, when a particle 40 (see FIG. 10) enters the channel 11 , it disturbs the electrical symmetry, causing a net signal to appear on the sensor electrode 4 . This signal 23 is detected and analyzed by the signal processing electronics 24 . The signal 23 depends upon the position of the particle 40 in the channel 11 and it changes as the particle 40 is carried through the channel 11 by fluid flow. The nature of an exemplary signal is discussed and described in FIG. 12 .
- FIGS. 8A and 8B show an exploded diagram of the particle impedance sensor of FIG. 7, showing the driver electrodes 3 , sensor electrode 4 , and dielectric membranes 12 .
- the fluid flow path to and from the composite membrane sensor assembly 13 occurs via channel 11 through the driver electrodes 3 .
- the impedance sensor channel 11 is a small hole bored through the composite membrane sensor assembly 13 .
- the fluid flow path may be completed with tubing, and the driver electrodes 3 may be mounted close to, or in contact with, the dielectric membranes 12 of the composite membrane assembly 13 .
- FIGS. 9A and 9B Two views of an assembled, three-layered composite sensor 13 according to embodiments of this disclosure are shown in FIGS. 9A and 9B.
- the channel 11 going all the way through the sensor assembly, is the sensor channel.
- the larger hole 15 that passes through only the top dielectric layer 12 b permits access to sensor electrode 4 , through which electrical contact may be made to the sensor electronics.
- Particles 40 may be carried through sensor channel 11 by the flow of a suspending medium, as demonstrated by FIG. 10 .
- Particles 40 may move along different trajectories through the channel 11 in accordance to their entry point. Trajectories 1, 2 and 3 correspond to three different entry points for the particles.
- the perturbation to the electrical symmetry caused by the presence of the particle 40 will vary with particle position in the channel, and different signals will result on the sensing electrode 4 from the passage of particles travelling along different trajectories. For example, particles that enter the channel close to the edge of the channel will have a greater effect on the impedance detected at the electrode than a particles that enter the channel near the centerline (a horizontal line through the midpoint of the sensor channel).
- the peak of voltage perturbation produced by a particle of 10 ⁇ m diameter passing through the impedance sensor as a function of its distance from the centerline is given in FIG. 11 .
- the circles show the peak perturbations determined from finite element analysis for a 10 ⁇ m diameter sphere of conductivity 1.5 S/m carried in a suspending medium of conductivity 100 mS/m with a drive voltage of ⁇ 10 V and +10 V.
- FIG. 12 To determine the effect of a particle on the electrical potential distribution in an impedance sensor, a finite element simulation was done (FIG. 12 ).
- a sensor having a sensor electrode sandwiched between two dielectric membranes was used.
- the driver electrodes on either side of the composite membrane sensor assembly were driven at ⁇ 10 V and +10 V.
- the particle is located on the horizontal center line of the channel half way through the first dielectric membrane 12 a .
- the potential on the sensor electrode 4 is zero but the presence of the particle 40 perturbs the potential as shown. This perturbation depends upon the particle position in the sensor channel 11 .
- Finite element analyses like this may be used to calculate the response of the sensor for different particle positions and different sensor and driver geometries.
- FIGS. 13A and 13B depict plots of a sensor electrode potential, determined from finite element analysis as shown in FIG. 12, as a function of particle positions in the sensor channel ranging from 25 ⁇ m to the left of the first dielectric membrane 12 a to 25 ⁇ m to the right of the second dielectric membrane 12 b .
- a packet position of 75 ⁇ m corresponds to the center of the channel in the horizontal (x) direction.
- Three curves are shown for particles positioned at different distances from the horizontal center line (axis) of the channel.
- FIG. 13A corresponds to the potential perturbations produced by a packet that is 15 times more conductive than the medium filling the channel.
- FIG. 13B correspond to a packet that is 1,000 times less conductive than the medium filling the channel.
- the channel height was 50 ⁇ m and the thickness of the dielectric membranes and the sensor electrode were 50 ⁇ m.
- the conductivity of the medium in the channel was 1100 mS/m. It is apparent from this data that the signal produced by the impedance sensor when a packet moves through it depends on the trajectory of the packet. Therefore, it is necessary to deduce the packet position in order to infer impedance information about the packet from the impedance sensor data.
- FIG. 14 depicts two particles traveling along trajectories at different distances from the channel walls. These particles are being carried at two different velocities. If the speed that an arbitrary particle travels in the channel is known, its position relative to the channel walls can be inferred from a knowledge of the flow velocity profile.
- the flow profile can be calculated using simple equations. In more complex geometries, finite element or other modeling methods can be used to calculate the fluid flow profile distribution.
- the velocity of the carrier medium in the sensor channel can be given as a function of the distance from the centerline for a parabolic flow profile in FIG. 15 .
- This profile pertains when the channel is sufficiently long, and the fluid is flowing sufficiently slowly to assure that laminar flow conditions prevail. Under these or other conditions, the flow profile may be simulated using finite element or other methods.
- FIG. 16 describes pulse shapes for particles carried by a carrier medium having a parabolic flow profile as they pass through the sensor along three trajectories parallel to the centerline calculated by scaling the horizontal axis of the finite element simulation results shown of FIG. 12 to allow for the relative flow rates corresponding to their position in the channel.
- fits to data like this can be used to derive characteristic curves for the behavior of the sensor channel.
- the finite element simulations of FIG. 17 show that the position, in the horizontal direction, from the center of the sensor at which the peak voltage perturbations to the sensor electrode occur depends on how far the particle trajectory is away from the horizontal centerline of the channel.
- One peak occurs as the particle travels through the first dielectric membrane and a second peak, of opposite sign, occurs as it travels through the second dielectric membrane before leaving the sensor.
- the curve shown in FIG. 17 is an approximation for the channel geometry shown earlier based on a hyperbolic cosine function. Finite element or other analysis methods may be used to obtain characteristics for any channel geometry, based on the procedures provided herein combined with what is understood in the art of, for instance, fluid dynamics.
- Peak to peak voltage for a 10 ⁇ m particle travelling through an impedance sensor channel can be described as a function of the time it takes the particle to travel from the first peak position to the second of opposite sign (FIG. 18 ).
- This curve was calculated from the characteristics shown in FIGS. 11-17 and takes into account the relationships between peak positions, peak heights, fluid flow velocity and a distance of the particle trajectory from the horizontal centerline of the sensor. It shows that a 10 ⁇ m particle that has a peak to peak time of 0.028 seconds and causes a peak to peak sensor voltage perturbation of 0.2 volts is identical to a 10 ⁇ m particle having a peak to peak time of 0.037 seconds that gives a peak to peak voltage perturbation of 0.03 volts.
- a count of the number of particles passing through the sensor channel as a function of their peak to peak time may be determined from the sensor voltage data, and a profile like the one above can be plotted.
- the curve in FIG. 19 reflects the distribution of particle velocities that results from the flow profile in the sensor channel.
- the shortest transit time observed corresponds to the maximum flow velocity, which occurs for particles being carried along the centerline of the channel.
- the profile may therefore be used to calculate the flow rate in the channel and, knowing the total number of particles counted in a given period of time, this information may be used to calculate the concentration of particles present within the sample.
- the concentration of particles in the sample may be determined from the impedance sensor signals without using ancillary methods to measure the volume of sample suspension that flows through the channel.
- This represents a major improvement over conventional electrozone sensors that rely on sophisticated fluid control and metering apparatus to allow them to determine particle concentrations. Its freedom from such metering equipment makes sensors disclosed herein simpler and more flexible than previous designs.
- Direct Current (DC) methods used in the original Coulter Counter and other standard impedance sensors, are augmented by Alternating Current (AC) approaches in which the electrical current that is passes through the channel contains not only a DC current but also an AC current.
- AC Alternating Current
- dielectric information about the particles can also be deduced, adding greater discriminatory capabilities to the method.
- the signal appearing on the sensor electrode is an AC voltage whose magnitude and the phase is modulated as the particle passes through the sensor channel.
- the phase and strength of the sensor signal reflect the particle response (FIG. 20A) times the AC signal (as in the example, a single frequency sine function, FIG. 20 B).
- the resulting sensor signal is shown in FIG. 20 C.
- the particle response reflects the effective impedance at the AC frequency.
- the particle response is frequency dependent and the frequency dependency can be used to characterize or identify the particle.
- the sensor signal may be multiplied by the excitation waveform or one of its components, and the resulting signal may be passed through a low pass filter to recover the particle response shown in FIG. 20 A.
- Such packet detection may be accomplished by analog methods or by digital signal processing using, for example, a DSP or FPGA chip as is known in the art.
- excitation signals composed of multiple frequency components.
- the waveform shown in FIG. 21 contains eight different frequencies spanning a range of 128:1.
- Other excitation signals may contain 2, 3, 4, 5, 6, 7, 9, 10, 11, 12, 13, 14, 15, 16, 17, 18, 19, 20, 21, 22, 23, 24, 25, 26, 27, 28, 29, 30, 31, 32, 33, 34, 35, 36, 37, 38, 39, 40, 41, 42, 43, 44, 45, 46, 47, 48 or more different frequencies.
- the frequencies may be multiples of a base frequency (i.e., the base frequency multiplied by 2, 4, 8, 16, 32, 64 and 128) or have a more random relationship.
- the impedance sensor response will also contain a contribution from each of the frequency components of the excitation signal, but each component will be modified in accordance with the particle's dielectric response characteristics at that frequency.
- Impedance sensors of the current disclosure are designed such that they facilitate rapid and potentially automated replacement of the sensor element to overcome blockage and cleaning issues.
- the current system permits the rapid exchange of sensor elements.
- the sensor element may be changed manually or automatically and may be changed between experiments or during experiments when flow through the sensor channel has been halted.
- These sensor elements can have different channel characteristics such as shape and size which allow the sensor characteristics to be optimized on the fly to match the needs of different particle sensing needs.
- a sensor element, or composite membrane sensor assembly containing a sensor electrode sandwiched between two dielectric membranes may be removed from a flow system and replaced with another sensor or composite membrane sensor assembly with a different size or shaped hole to create a sensor element with a more or less constricting fluid flow path.
- this exchange of sensor elements may be advantageous.
- the resulting data are the in-phase and out-of-phase components of the particle impedance perturbation at each of the frequencies that were present in the excitation signal.
- Each of these impedance parameters will contain unwanted contributions from thermal noise as is well known in the art of electronics.
- the impedance properties of particles in the frequency range between 1 kHz and 1 GHz are dispersive rather than resonant in nature. This means that both the in-phase and out-of-phase impedance data obtained for particles by the impedance sensor must be functions of frequency that are smooth and members of a limited set of allowed curves.
- the quality of the impedance data for particles passing through the sensor can be greatly improved so as to increase the effective signal to noise ratio of the impedance measurements.
- the analysis may be further constrained so as to include an appropriate mathematical model for the particle dielectric characteristics.
- an appropriate mathematical model for the particle dielectric characteristics For example, many mammalian cells have dielectric characteristics that are described well by a single-shell dielectric model. By constraining the curve fits of the dielectric data from the impedance sensor to fit this model, explicit data reflecting the structure of the cells under measurement may be derived. All of these data analysis steps may be accomplished in a computer using appropriate algorithms or in dedicated DSP or FPGA hardware programmed for this purpose or in a combination of these means.
- the data analysis techniques employed may be single-pass least squares methods or iterative error minimization methods, as are well known in the art of data processing, or a combination of these but need not be limited to these methods.
- the sensor signal containing multiple frequencies may be parallel-processed by multiplying it by each of the frequency components of the original excitation followed by low pass filtering (product detection). In this way, the effective impedance of the particle at each of the frequencies may be independently derived from the sensor signal even though the excitation electrodes applied them simultaneously as a single, composite signal. This may be accomplished by digital signal processing using a DSP or FPGA chip as known in the art.
- data for individual particles, for groups of particles, and statistical data for populations of particles may be provided.
- Processed data of this kind or individual particle data may be used for particle analysis, identification, or classification.
- Such data may in turn allow conclusions to be drawn by those skilled in the art. For example, population distributions of impedance properties of cells allow cell type, size, viability, apoptotic state, and membrane and cytoplasmic status to be drawn by life scientists skilled in the art and allow blood cell subpopulation differential analyses to be performed. With the benefit of this disclosure, those of ordinary skill in the art will recognize a host of other potential applications.
- the waveform that is used to drive the electrodes on either side of the impedance sensor membrane is synthesized by a field programmable gate array (FPGA, model Altera FLEX EPF10k200SBC600-1).
- An exemplary waveform (FIG. 21) consists of a composite of 8 separate sine waves having frequencies f, 2f, 4f, 8f, 16f, 32f, 64f, and 128f.
- the fundamental frequency f is adjustable and typically about 10 kHz.
- the FPGA generates this composite signal in the form of a string of digital numbers that are converted to a voltage signal by appropriate equipment such as a Burr Brown DAC902U digital to analog converter.
- An output stage drives the electrodes on either side of the sensor membrane, one with this drive signal and the other with a signal of the opposite phase.
- the signals driving the driver electrodes including a signal and a signal of opposite phase, are referred to generically as the “drive signal.”
- Other methods and other electronic components known in the art may be used to produce waveforms, which may be of any desired composition with respect to Fourier components, and to drive the sensor. Other approaches to producing waveforms and driving electrodes with voltage signals are well known in the art.
- a low noise preamplifier located very close to the sensor amplifies the signal from the center metal layer of the sensor membrane.
- the resulting higher amplitude signal which incorporates the desired impedance information, may be fed to a circuit based on an Analog Devices AD9224 12 bit analog to digital converter (DAC).
- DAC Analog Devices AD9224 12 bit analog to digital converter
- the inventors call the signal from the sensor membrane the “impedance signal.”
- the digital output from this circuit may be fed to a second Altera FLEX FPGA.
- the rate of sampling of the impedance signal provides 16-fold oversampling, adding three extra bits of resolution beyond the 12 bit width of the digital to analog converter by a mechanism well known in the art.
- the second FPGA accomplishes a Fourier-type analysis of the impedance signal to derive from it the intensities of the in-phase and out-of-phase components of the same frequencies used to compose the drive signal.
- These impedance signal frequency components are represented as 24 bit words that are passed to a digital signal processor (DSP) board, which may be based on a Texas Instruments TM S320 C6211 integrated circuit.
- DSP digital signal processor
- the impedance data is represented by a stream of 16,000 digital samples per second, each comprising sixteen 24 bit words: one 24 bit word for each real and imaginary component for each of the 8 frequencies.
- the inventors refer to these sixteen data sets as the “data channels.” There are two data channels for each of the 8 frequencies; one is the in-phase component, the other the out-of-phase component.
- the function of the DSP is to analyze this data stream from the impedance data to detect changes in the data that correspond to particles passing through the impedance sensor.
- the inventors call these changes “particle events.” Exemplary shapes of impedance signals corresponding to a particle event has been shown earlier in this disclosure. Because of the rapid sampling of the impedance data, a single particle event, which may typically last from 1 to 5 milliseconds as the particle passes through the sensor, corresponds to between 16 and 80 digital samples, each comprising sixteen 24 bit words (one 24 bit word for each real and imaginary component for each of the 8 frequencies).
- the signals may contain significant electrical noise especially if the impedance signal preamplifier is set to high gain in order to detect small particles producing small impedance signals.
- the first step of filtering is to apply low pass digital filtering of the signals by computing the moving sum of N digital samples where N is of the order of half the number of digital samples corresponding to a particle event (i.e. typically between 8 and 40).
- the changes in the digital data that occur with time during a particle event are typically of different intensities and of different phases for each of the sixteen data channels.
- an algorithm in the DSP is used to derive a composite signal comprising the moving sum of the (unsigned) magnitudes of changes with time in each of the sixteen digital channels. This sum is conducted over N 1 digital samples, where N 1 is typically of the order of half the number of digital samples within a particle event. This produces a signal related to the average square root of the power density of changes summed for all sixteen channels. This signal has a mean value that reflects the mean noise (the “noise floor”) and increases when a particle event occurs. In one embodiment, a particle event is detected by determining when this signal exceeds a given threshold value above the noise floor. This threshold value may be adjusted to alter the sensitivity of the system to different particle sizes.
- N 3 and N 4 are chosen to be sufficiently large that the saved data covers the entire particle event, i.e. includes the entire data record of the impedance signal as the particle enters, passes through, and leaves the impedance sensor.
- particle events span up to 80 samples in a given experiment, 100 samples might be saved spanning the range from 50 points before the peak to 50 points after.
- the DSP continues to analyze the digital sample stream looking for additional particle events. In this way, the impedance data is continuously screened for particle events, and the data for these alone are saved for further analysis.
- the moving sum of the magnitude of the signal changes of the 16 channels of a saved particle event has a peak whose position indicates when a particle has passed half way through the impedance sensor.
- the width of the peak at half its height above the noise floor is proportional to the amount of time the particle took to travel through the sensor.
- the velocity of each particle is calculated from saved event data by dividing the length of the sensor by the time the particle takes to transit the sensor as inferred from the peak width. Particles travel at different velocities according to how far they pass from the axis of the sensor. By taking the average of the velocities for many particles, the mean fluid velocity may be deduced. Multiplication of this mean flow velocity by the area of the sensor orifice allows the mean fluid flow rate to be deduced. Division of the mean number of particles counted per unit time by the mean flow rate gives the concentration of particles in the sample.
- the saved particle event data is further analyzed to deduce size, dielectric, and conductivity data for each particle.
- the shape of the impedance sensor signal corresponding to a particle event depends on the axial displacement of the particle transit path from the center of the sensor. When highly accurate particle data is needed, this axial displacement can be taken into account. It is possible to calculate the displacement position from the particle velocity and mean fluid velocity data (deduced using the method described above) because, as is known in the art, fluid flowing under laminar flow conditions within a flow path follows a parabolic flow profile.
- the family of impedance sensor response characteristics S(l, x/r) representing the impedance signals as a function of distance l along a particle transit path for axial displacements x/r may be stored in a lookup table in one embodiment of the impedance signal analysis system. Alternatively, in another embodiment, these characteristics may be calculated from an empirical equation.
- l is the distance of the particle from the center of its transit through the sensor
- ⁇ (l,x/r) is the true strength of the impedance signal for a standard particle along the particle transit path
- S(l,x/r) has the same form as ⁇ (l,x/r) but is scaled to ensure normalization according to the integral expression.
- FIGS. 22-30 illustrate simulation data taken in accordance with specific embodiments of data processing aspects of the present disclosure.
- FIG. 22 there is shown simulated impedance signals for a train of 9 particles passing through a sensor. Included is simulated Gaussian noise. The sixteen separate signals represent the real and imaginary components for each of eight frequencies, as illustrated.
- FIG. 23 shows the data of FIG. 22 after applying a low pass filter—here, a moving sum of 16 digital samples.
- FIG. 24 shows the signal derived by computing the moving sum of absolute differences over 16 digital samples summed over both real and imaginary components for all 8 frequencies (i.e., it shows computing the power in each channel and then adding all channels). The mean signal level has been subtracted to remove a noise floor.
- FIG. 25 is a table showing peaks detected from the signal of FIG. 24 by thresholding. As shown, the columns of the table include, from left to right: peak start time (seconds), peak end time (seconds), and peak height.
- FIG. 26 shows a comparison of a theoretical signal (single smooth curve) and the signals extracted from the digital sample for the in phase components at f 1 for the 9 particles in the simulation.
- FIG. 27 illustrates the multiplication of the signal from one of the data channels with the theoretical signal shape.
- FIG. 28 shows the area of this multiplication, which reflects the intensity of the impedance signal.
- FIGS. 29 and 30 respectively show the imaginary and real parts of impedance signal recovered after processing. These plots show data for 9 separate signal events for identical cells.
- the impedance perturbation information is of interest, a more useful parameter in many applications is the impedance data for the individual particles themselves.
- additional analysis to the coefficients A i is employed so as to extract the explicit particle impedance information.
- the odd-indexed coefficients A 1 , A 3 , A 5 . . . A 15 are proportional to the in-phase, or resistive, components of the impedance perturbation for the eight frequencies while the even coefficients are proportional to the corresponding out-of-phase, or capacitative, components.
- the out-of-phase part of the particle impedance arises from particle capacitance and not inductance. Inductive impedances will correspond to negative capacitance values.
- the particle size is very small compared to the sensor volume (e.g., 1% or less).
- the denominator may be approximated as 2K 1 and assumed to be constant so that the voltage perturbation when a particle is present can be accurately approximated by Q(K 2 ⁇ K 1 ) where Q is a calibration constant for the measurement.
- a orifice and L orifice are the effective area of the membrane sensor channel and the electrical distance from where the particle enters the sensor to the sensor's midpoint, respectively.
- the complex permittivity of the fluid inside the sensor includes any contribution from the particle and can be written:
- ⁇ * sensorfluid ⁇ sensorfluid ⁇ j ⁇ sensorfluid / ⁇
- ⁇ sensorfluid is the real permittivity (“dielectric constant”) of the fluid
- ⁇ sensorfluid is the conductivity of the fluid
- j ( ⁇ 1) 1 ⁇ 2 .
- each data sample comprises one ⁇ * sensor for each of the eight frequencies, each having separate channels for the in-phase and out-of-phase components.
- the eight ⁇ * sensor k data points are stored in the 16 coefficients A i such that
- ⁇ * sensorK A (2K ⁇ 1) +jA 2K .
- ⁇ sensorfluid ⁇ ⁇ with ⁇ ⁇ particle * ⁇ fluid * ⁇ ( ( v sensor v particle ) + 2 ⁇ ( ⁇ particle * - ⁇ fluid * ⁇ particle * + 2 ⁇ ⁇ fluid * ) ( v sensor v particle ) - ( ⁇ particle * - ⁇ fluid * ⁇ particle * + 2 ⁇ ⁇ ⁇ fluid * ) ) ,
- ⁇ sensor * ⁇ fluid * ⁇ ( ( ⁇ particle * - ⁇ fluid * ⁇ particle * + 2 ⁇ ⁇ fluid * ) ( v sensor v particle ) - ( ⁇ particle * - ⁇ fluid * ⁇ particle * + 2 ⁇ ⁇ ⁇ fluid * ) ) .
- the particle usually has a very small volume compared to the sensor so that ( v sensor v particle )
- ⁇ ⁇ ⁇ sensor * ⁇ fluid * ⁇ ( v particle v sensor ) ⁇ ( ⁇ particle * - ⁇ fluid * ⁇ particle * + 2 ⁇ ⁇ fluid * ) .
- the permittivity and conductivity of the suspending fluid and the sensor volume are known for a given measurement condition, leaving the particle volume and complex permittivity as the only unknowns.
- the goal of analyzing the impedance signals further is to deduce these parameters.
- the coefficients A i representing the values ⁇ * sensor k for eight measurement frequencies may be subjected to further filtering to lower the effect of noise of the measurements. Dielectric theory requires that both the real and imaginary components of ⁇ * sensor be continuous functions of frequency and that the real (in phase component) ⁇ sensor either remains constant with increasing frequency or else decreases with increasing frequency.
- ⁇ o and ⁇ g are offset and gain parameters relating to the electronics and algorithms earlier in the signal processing sequence that are constant for a given event.
- the coefficients A i may be analyzed by a curve fitting procedure and replaced by best-fit values that obey all of these constraints. This has the effect of lowering measurement noise.
- a dielectric model exists for the particles under investigation, then that model may also be used to deduce explicit characteristics of the particles from the massaged A i coefficients.
- the dielectric properties of mammalian cells can be modeled to a good approximation by a single shell structure.
- This structure comprises an electrically homogeneous cell cytoplasm of radius r having complex permittivity ⁇ * int surrounded by a thin membrane of thickness d and permittivity ⁇ * mem .
- ⁇ particle * ⁇ mem * ⁇ ( r + d r ) 3 + 2 ⁇ ( ⁇ int * - ⁇ mem * ⁇ int * + 2 ⁇ ⁇ mem * ) ( r + d r ) 3 - ( ⁇ int * - ⁇ mem * ⁇ int * + 2 ⁇ ⁇ mem * ) .
- ⁇ * mem reflects the cell membrane permittivity and conductivity
- ⁇ * int reflects the cell interior permittivity and conductivity.
- the DSP uploads the massaged coefficients A i for each particle event to a host personal computer.
- This computer uses a Nelder-Meade simplex algorithm or other non-linear curve fitting procedure to derive values for ⁇ particle , ⁇ mem , and ⁇ int for each particle, and displays the accumulated results for all particle events during an experiment on dot plots and histograms in a fashion similar to that commonly employed for displaying flow cytometry data.
- the host computer also allows communications with the DSP and FPGA systems to set the measurement and data analysis parameters for those systems.
- the single shell model fairly closely approximates the dielectric characteristics of mammalian cells.
- the cell permittivity is a strong function of frequency so that the fitting of coefficients A i by the dielectric shell model may be robust.
- Typical cytoplasmic conductivity values for viable cells are ⁇ 0.6 S/m, so that conductivities for the suspending fluid of 0.1 S/m or lower are preferred.
- the suspending fluid conductivity has a value chosen to causes the crossover frequency of the modal cell type in the experimental sample to be close to 8f, the center frequency probed in the 8-frequency, octave spaced embodiment.
- necrotic cells When necrotic cells are suspended in the low conductivity suspending fluid, they typically lose ions from their interiors causing their cytoplasmic conductivity to fall. Such damaged cells do not exhibit a crossover frequency and may be easily distinguished by impedance measurements from healthy cells of the same type that have retained their cytoplasmic ions. In this way impedance sensor measurements may be used to discriminate viable cells from non-viable and necrotic cells. This provides a useful tool for assessing cell viability in tissue culture facilities, for example.
- the membrane permittivity of cells has also been shown to be highly characteristic of cell type and to changes for a given cell type during cell division, apoptosis, and if cells are exposed to biological signals, are chemically modified, or are damaged by toxins. For these reasons, different cell types may be discriminated and identified by the AC impedance sensing method. In addition, changes in cell physiology and morphology and cell responses to various agents may be deduced from impedance sensor data. Other data analysis steps appropriate to different particle measurement applications may be accomplished by appropriate adjustment of the analysis procedure.
- FIG. 33 displays a summary of impedance measurement steps, according to embodiments of the present disclosure.
- Flow of suspending medium brought about by a pressure differential across the sensor channel drives the sample and the suspended particles through the sensor.
- the boxes represent functionality embodied in the support electronics.
- the excitation signals 21 and 22 are generated digitally from a lookup table containing waveforms of composite sine frequencies (f 1 , f 2 , f 3 . . . f n ) 52 before going through a digital to analog converter 50 .
- the sensor signal 23 is analyzed digitally after going through an analog to digital converter 51 , although analog methods may be used for either or both processes as is known in the art.
- a clock signal 53 may be used to synchronize the excitation and analysis process.
- the signal is sent to a signal processing 54 , where the sensor signal 23 is multiplied by each one of the sine frequencies (f 1 , f 2 , f 3 . . . f n ) and subjected to low pass filtering in n separate parallel processes to yield a continuous stream of sensor data for each frequency (1 ⁇ n). Perturbations in the sensor data that follow the characteristic reversal of peaks are recognized as particle responses, and sets of impedance data at the different frequencies are output for each particle.
- Signal analysis 55 of the sensor signal 23 involves analyzing the sets of impedance data corresponding to particles and correcting the data for trajectory, based upon transit time through the sensor channel 11 .
- a frequency spectrum for each particle may be constructed and used for particle identification or classification.
- the fluid flow rate and flow profile may be computed and used to calculate the particle concentration.
- embodiments of the present disclosure may be used to analyze the concentration of samples.
- This specific, non-limiting embodiment may involve the following general steps:
- dielectric differences between different particles can be detected by techniques of the present disclosure, and this allows particles in homogeneous suspensions to be identified and dissimilar particles in heterogeneous particulate mixtures to be profiled according to their dielectric differences.
- blood cell differential analysis may be accomplished by impedance sensing, and cells such as bacterial spores may be discriminated from other cell types such as mammalian cells and pollen and from inert particles.
- the techniques of the present disclosures are suitable for use as a detection and discrimination element for use not only in clinical applications involving cell suspensions and in other applications where particle profiling is desirable, but also in biological agent applications in agriculture, aquaculture, and warfare and terrorism detection applications.
- the impedance technology may be used in a stand-alone form or as an in-line detection element for other devices.
- the technology may be used in conjunction with devices and methods such as those disclosed in U.S. Pat. Nos. 6,287,832; 5,993,632; 5,993,630; 5,888,370; and 5,858,192 (each of which is incorporated by reference) in order to provide particle detection and discrimination capabilities.
- the driving electrodes and sensor electrodes may be formed using any method known in the art. They may be formed in conjunction with the capillary or reaction surface or coupled after forming both elements. In one embodiment, the electrodes may be formed by laminating the materials.
- FIGS. 34A and 34B show a design of an impedance sensor according to embodiments of the present disclosure in which the driver 3 and sensor 4 electrodes are microfabricated inside a fluidic channel 11 of circular cross section within a dielectric body 10 .
- the fluid flow profile is analogous to that present in the laminated membrane design, and the signal shapes and signal processing methods for deducing the fluid flow characteristics and the particle impedance corrections are the same.
- This microfabricated embodiment may be realized for fluidic channels consisting of capillary tubes as well as for fluidic channels within larger structures.
- One constraint on the material in which the impedance sensor is constructed is that it should be of low conductivity relative to the carrier medium in which particles to be sensed are carried through the channel.
- the channel has circular cross section, and the electrodes circle the channel, as represented by the dotted line around the channel shown in the end view.
- FIGS. 35A and 35B An alternative design of the impedance sensor (FIGS. 35A and 35B) is one in which the driver 3 and sensor 4 electrodes are microfabricated inside a fluidic channel 11 of rectangular cross section.
- the electrodes may be fabricated on two opposing sides of the channel case.
- the fluid flow profile is analogous to, but more complex, than that present in flow channels of circular cross section, and the signal shapes and signal processing methods for deducing fluid flow characteristics and particle impedance corrections are correspondingly different from the circular sensor channel cases but handled in an analogous manner as will be understood by those of ordinary skill in the art.
- This microfabricated embodiment may be realized for fluidic channels in capillary tubes or in larger structures where rectangular channels may be easier to realize.
- the material in which the impedance sensor is constructed should be of low conductivity relative to the carrier medium in which particles to be sensed are carried through the channel.
- the electrodes may be formed using standard photolithography techniques. For example, one may refer to, e.g., D. Qin et al., “Microfabrication, Microstructures and Microsystems,” Microsystem Technology in Chemistry and Life Sciences (Ed. Manz and Becker), Springer, Berlin, 1997, pp 1-20, which is incorporated herein by reference. Also, one may refer to Madou, Fundamentals of Microfabrication, CRC Press, Boca Raton, 1997, which is incorporated herein by reference. Depending upon the particular application, and the nature of the packets and partitioning medium, the size and spacing of electrodes may be smaller than, of similar size, or larger than the diameters of the packets.
- the spacing between the driving electrodes and sensor electrodes may vary, but in one embodiment, the spacing may be between about 2 microns and about 50 ⁇ m.
- the electrodes may have different forms such as lines, squares, circles, diamonds, polygons, or other suitable shapes.
- the dimensions of each electrode may vary, but a typical electrode may be between about 0.2 ⁇ m and about 10 mm., and more particularly, between about 1 ⁇ m and about 200 ⁇ m.
- a “carrier fluid” refers to matter that may be adapted to suspend other matter to form packets on a reaction surface.
- a carrier fluid may act by utilizing differences in hydrophobicity between a fluid and a packet.
- hydrocarbon molecules may serve as a carrier fluid for packets of aqueous solution because molecules of an aqueous solution introduced into a suspending hydrocarbon fluid will strongly tend to stay associated with one another. This phenomenon is referred to as a hydrophobic effect, and it allows for compartmentalization and easy transport of packets.
- a carrier fluid may also be a dielectric carrier liquid which is immiscible with sample solutions.
- suitable carrier fluid include, but are not limited to, air, aqueous solutions, organic solvents, oils, and hydrocarbons.
- a “programmable fluid processor” refers to an electrode array whose individual elements can be addressed with different electrical signals.
- the addressing of electrode elements with electrical signals may initiate different field distributions and generate dielectrophoretic or other manipulation forces that trap, repel, transport, or perform other manipulations upon packets on and above the electrode plane.
- electric field distributions and manipulation forces acting upon packets may be programmable so that packets may be manipulated along arbitrarily chosen or predetermined paths.
- the impedance sensor may also be coupled to an integrated circuit which is coupled to the PFP.
- the impedance sensor may also be coupled to a controller which is coupled to the PFP. The controller may be adapted to provide a feedback from the impedance sensor to the PFP.
- Counter phase, or anti-phase means that the two electrodes are driven by identical but opposite currents.
- the identical but opposite current signals (+i) and ( ⁇ i) must be within 5% or more preferably 2% of the ideal values.
- packet and “particle” both refer to any compartmentalized matter.
- the terms may refer to a fluid packet or particle, an encapsulated packet or particle, and/or a solid packet or particle.
- a fluid packet or particle refers to one or more packets or particles of liquids or gases.
- a fluid packet or particle may refer to a droplet or bubble of a liquid or gas.
- a fluid packet or particle may refer to a droplet of water, a droplet of reagent, a droplet of solvent, a droplet of solution, a droplet of sample, a particle or cell suspension, a droplet of an intermediate product, a droplet of a final reaction product, or a droplet of any material.
- An example of a fluid packet or particle is a droplet of aqueous solution suspended in oil.
- the packet or particle may be encapsulated or a solid.
- solid packets or particles are a latex microsphere with reagent bound to its surface suspended in an aqueous solution, a cell, a spore, a granule of starch, dust, sediment and others.
- Methods for producing or obtaining packets or particle as defined herein are known in the art. Packets or particles may vary greatly in size and shape, as is known in the art.
- an “array” refers to any grouping or arrangement.
- An array may be a linear arrangement of elements. It may also be a two dimensional grouping having columns and rows. Columns and rows need not be uniformly spaced or orthogonal.
- An array may also be any three dimensional arrangement.
Abstract
Apparatuses and methods for analyzing particles using an impedance sensor. A flow-through impedance sensor may use two in-line electrodes driven in counter phase. A common sensor electrode may be used to, for example, detect impedance and determine trajectories through the sensor area. The sensor may be used in a wide variety of applications, including but not limited to use with microfluidic devices for determining particle characteristics such as position, velocity, size, and concentration as well as detection of bacterial spores and other biological agents of potential use in warfare and bio-terrorism.
Description
The government may own rights in the present invention pursuant to the following grants: Defense Advance Research Projects Agency, Office of Naval Research; Contract No. N6601-97-C-8608; National Cancer Institute, 1 R21 CA88364-01; and Defense Advance Research Projects Agency, Army Research Office, No. DAAD10-00-1-0515.
1. Field of the Invention
The present invention relates generally to fluidic processing and sensor technology. More particularly, it relates to a variety of apparatuses and methods for sensing particle properties in a microfluidic environment. Even more particularly, it relates to novel techniques for microfluidic, impedance sensing of particles.
2. Description of Related Art
Conventional impedance-based sensing of particles is a well-accepted method for the counting and sizing of particles and cells and finds wide application in clinical and veterinary laboratories for the analysis of blood, cell suspensions, and other samples. In operation, the technique passes a carrier fluid in which the particles to be counted are suspended through a small volume channel that usually consists of a hole in a membrane. As particles pass through the channel, the flow of electrical current between electrodes immersed in the carrier fluid on either side of the membrane is perturbed. Electronics in the circuitry that drives the electrodes detect the electrical perturbations as particles pass through the channel, and information about the size of the particles may be inferred from the characteristics of these signals. The strength of the electrical perturbation due to the presence of a particle in the channel depends approximately on the ratio of the particle volume to the channel volume and on the magnitude of the electrical current passing in the channel. Counting the electrical events that occur when a metered volume of suspending medium is drawn through the channel, and then dividing the count by the volume is done to determine the concentration of particles in a sample.
Various sensors have been developed that use impedance. U.S. Pat. No. 5,683,569, which is hereby incorporated by reference, discloses a method of sensing chemicals using a sensing material and an impedance sensor containing a channel separated from an electrode by a gap. By comparing the surface potential to the electrical impedance, the presence of a chemical species may be determined. Surface potential may be used to detect particles at low concentrations and resistance may be used to detect particles at high concentrations.
WO 9804355, which is hereby incorporated by reference, discloses a method for determining the behavior of particles in a chamber subject to a spectrum of different frequency dielectrophoretic fields. An electrical measurement is used to detect impedance fluctuations.
U.S. Pat. No. 6,149,789, which is hereby incorporated by reference, discloses a process for particle manipulation using feedback from impedance sensors. U.S. Pat. No. 6,169,394, which is hereby incorporated by reference, discloses an impedance sensor for the electrical detection of samples in a micro-analysis system; at least one pair of electrodes is used to detect the conductivity or impedance of a sample in a microchannel. Impedance sensors are also disclosed in U.S. Pat. Nos. 6,084,503, 5,569,591 and 5,580,435, each of which is hereby incorporated by reference.
Although such conventional techniques offer at least some advantage, they nevertheless include a number of significant disadvantages. While AC methods have allowed the impedances of particles to be determined at several frequencies, far greater information about the particle properties is available if more measurements over a wider range of frequencies could be accomplished for each particle. In addition, the need to accurately meter a set volume of fluid through a channel during a determination of concentrations places stringent constraints on fluid control mechanisms. This typically results in the need for a specialized fluidics platform that is often more bulky than the sensor and electronics combined. Another problem is that conventional membranes used in particle sensing are prone to blockage, necessitating accessibility for vigorous flushing. To accommodate rapid and convenient accessibility, particle impedance sensors usually take the form of benchtop instruments that are not readily adaptable to automated sample handling or in-line detection applications. Finally, the sensors of conventional instruments are often expensive and difficult to change.
The present disclosure overcomes such disadvantages through the introduction of, among other things, a membrane and the use of novel electronic detection and signal processing methods. The design and methodology of this disclosure invoke principles not previously applied to particle impedance sensor apparatuses to realize robust, multi-frequency impedance sensor capabilities that may eliminate the need for external fluid metering, permit miniaturization, allow in-line operation with other fluidic systems and instruments, and facilitate rapid and potentially automated replacement of sensor elements.
Applications of the present invention are vast and include, but are not limited to any application in which Coulter counters are used, cell and particle counting, cell and particle subpopulation analysis, cell viability analysis, cell and particle concentration analysis, cell differential analysis, medical applications, veterinary applications, bioengineering, food analysis, soil analysis, in-line particle detection in fluidic circuits and systems, detection of bacterial spores and other biological agents of potential use in warfare and terrorism, discrimination of potentially harmful biological agents from non harmful biological cells such as pollen and from inert particulate materials such as dust, smoke, and non-viable cells, detection of responses of cells such as human blood cell subpopulations to biological and chemical agents, and detection and discrimination of bacterial cells and spores (including anthrax) for medical, agricultural, environmental, and bio-warfare and bio-terrorism detection applications.
In one aspect, the invention is an impedance sensor including a sensor electrode, first and second driver electrodes, and a channel. The first and second driver electrodes are coupled to the sensor electrode and driven in counter phase to produce a net output signal of about zero at the sensor electrode. The channel is defined through the sensor electrode and the first and second driver electrodes.
In other respects, the sensor electrode may include copper. The sensor electrode may include a first and second dielectric membrane sandwiching a detector electrode. The first or second dielectric membrane may include polyimide. The first or second dielectric membrane may be laminated. The first and second driver electrodes may contact the first and second dielectric membranes, respectively. The first and second driver electrodes may be driven at multiple frequencies. The first and second driver electrodes may be driven with an alternating current signal. The cross section of the channel may be rectangular. The sensor may also include a programmable fluid processor coupled to the sensor electrode.
In another aspect, the invention is a flow-through impedance sensor including a channel, a composite membrane sensor assembly, and first and second driver electrodes. The channel is for transporting a carrier medium and particles through the impedance sensor. The composite membrane sensor assembly is coupled to the channel and includes a detector electrode sandwiched between first and second dielectric membranes. The first and second driver electrodes are coupled to the channel and are positioned adjacent opposite sides of the composite membrane sensor assembly. The first and second driver electrodes are driven in counter phase to produce: (a) a net output signal of about zero at the detector electrode when no particle is within the impedance sensor; and (b) a non-zero net output signal at the detector electrode when a particle is within the impedance sensor.
In other respects, the first and second driver electrodes may be in contact with the composite membrane sensor assembly. The first and second driver electrodes may be driven at multiple frequencies. The first and second driver electrodes may be driven with an alternating current signal. The impedance sensor may also include a programmable fluid processor coupled to the sensor electrode.
In another aspect, the invention is a method for determining a characteristic of a packet. A fluid containing a packet is flowed through an impedance sensor that includes first and second driver electrodes driven in counter phase to produce a net output signal of about zero at a sensor electrode. Perturbations of the net output signal arising from changes in impedance associated with the presence of the packet within the impedance sensor are measured. The characteristic of the packet are then determined from the perturbations.
In other respects, the characteristic of the packet may include packet size. The characteristic of the packet may include packet transit time through the impedance sensor. The characteristic of the packet may include packet velocity. The characteristic of the packet may include packet concentration. The characteristic of the packet may include a relative displacement within the impedance sensor. The characteristic of the packet may include packet impedance.
In another aspect, the invention is a method for determining a characteristic of a particle. An impedance sensor is provided including a sensor electrode, first and second driver electrodes coupled to the sensor electrode and driven in counter phase to produce a net output signal of about zero at the sensor electrode, and a channel defined through the sensor electrode and the first and second driver electrodes. A multi-frequency drive signal is applied to the first and second driver electrodes. An impedance signal is received from the sensor electrode. In-phase and out-of-phase components of the impedance signal are determined at the frequencies of the drive signal. Changes in the in-phase and out-of-phase components indicative of a particle event are detected. Portions of the impedance signal are analyzed about the particle event to determine the characteristic of the particle.
In other respects, the drive signal may include a composite of separate waveforms of different frequencies, each frequency being an integer multiple of a fundamental frequency. The drive signal may consist of 8 separate sine waves having frequencies f, 2f, 4f, 8f, 16f, 32f, 64f, and 128f. The impedance signal components may be represented as 24 bit words. The method may also include deriving a composite signal comprising a moving sum of magnitudes of changes of the in-phase and out-of-phase components. Detecting changes indicative of a particle event may include determining when the composite signal exceeds a threshold value above a noise floor. Analyzing portions of the impedance signal about the particle event to determine the characteristic of the particle may include: calculating an overlap integral, constraining curves associated with the in-phase and out-of-phase components to obey a Kramers-Kronig relationship, determining a velocity of the particle, determining a mean fluid velocity, determining a concentration of particles, determining a size of the particle, determining a relative displacement of the particle, determining a dielectric property of the particle, determining a conductivity property of the particle, determining an impedance of the particle, determining a cell membrane permittivity of the particle, and/or determining a cytoplasmic permittivity of the particle.
The following drawings form part of the present specification and are included to further demonstrate certain aspects of the present invention. The invention may be better understood by reference to one or more of these drawings in combination with the detailed description of specific embodiments presented herein.
FIGS. 1A and 1B are schematic diagrams of conventional impedance sensors having a single channel. FIG. 1A shows a device having no particle in the sensor channel. FIG. 1B shows a device having one particle in the sensor channel.
FIG. 2 is a schematic diagram showing a typical configuration of a conventional particle impedance sensor element, which may be employed in particle counters and sizers.
FIGS. 3A and 3B are schematic diagrams of a conventional microfabricated impedance sensor. FIG. 3A is a side view, and FIG. 3B is a top view.
FIG. 4A and FIG. 4B are schematic diagrams showing a configuration of an impedance sensor having two channels, according to embodiments of the present disclosure. FIG. 4A has no particle in the sensor channels. FIG. 4B has one particle in a sensor channel.
FIG. 5 is a schematic diagram of a configuration of an impedance sensor having one channel and two sensors connected to the channel, according to embodiments of the present disclosure.
FIG. 6 is a schematic diagram of a configuration of an impedance sensor having one channel and two sensors connected to the channel in close proximity to each other such that a particle will pass both sensors before a second particle reaches the first sensor, according to embodiments of the present disclosure.
FIG. 7 is a cross sectional view of a sensor based on a two-sensor, hybrid design, according to embodiments of the present disclosure.
FIGS. 8A and 8B are exploded diagrams of a particle impedance sensor showing the driver electrodes, sensor electrodes and dielectric membranes, according to embodiments of the present disclosure.
FIG. 9A and FIG. 9B are schematic diagrams of an embodiment of a particle impedance sensor according to the present disclosure. FIG. 9A shows top views of the structures of three individual layers. Layers I and III are dielectric membranes, and layer II is a sensor electrode. All of the dimensions and materials shown (e.g., bottom being 50μ polyimide, center being 50μ copper, and top being 50μ polyimide) are exemplary only. FIG. 9B shows a side view of the structure after assembly. The hole all the way through the sensor assembly is the sensor channel. The larger hole that passes through only the top dielectric layer permits access to the sensor electrode through which electrical contact can be made to sensor electronics.
FIG. 10 is a schematic diagram showing a flow pattern of a particle carried through a sensor channel by flow of the suspending medium, according to embodiments of the present disclosure.
FIG. 11 is a plot of the peak of voltage perturbation on an sensor electrode produced by a 10 μm diameter particle as a function of its distance from the center of the sensor channel, according to embodiments of the present disclosure. The line shows a fit of the hyperbolic cosine function to the data.
FIG. 12 is a finite element simulation showing the effect of a particle on the electrical potential distribution in a two membrane impedance sensor, according to embodiments of the present disclosure.
FIG. 13A and FIG. 13B are plots of sensor electrode potential where the potential perturbation is produced by a packet that is 15 times more conductive (FIG. 13A) and 1000 times less conductive (FIG. 13B) than the medium filling the channel, according to embodiments of the present disclosure.
FIG. 14 shows a flow velocity profile under laminar flow conditions, according to embodiments of the present disclosure.
FIG. 15 is a plot of velocity of a carrier medium in a sensor channel as a function of the distance from the centerline for a parabolic flow profile, according to embodiments of the present disclosure.
FIG. 16 is a plot showing pulse shapes for particles carried by a carrier medium having a parabolic flow profile as they pass through a sensor, according to embodiments of the present disclosure.
FIG. 17 is a finite element simulation, according to embodiments of the present disclosure. The curve is an approximation for a channel geometry based on a hyperbolic cosine function.
FIG. 18 is a plot showing peak to peak voltage for a 10 μm particle travelling through an impedance sensor channel as a function of the time it takes to travel from the first peak position to the second of opposite sign, according to embodiments of the present disclosure.
FIG. 19 is a plot showing the number of particles passing through a sensor channel as a function of their peak to peak time, according to embodiments of the present disclosure.
FIG. 20A, FIG. 20B and FIG. 20C are plots according to embodiments of the present disclosure showing the phase and strength of a sensor signal reflect the particle response (FIG. 20A) times the AC signal (shown as a single frequency sine function, FIG. 20B). The resulting sensor signal is shown in FIG. 20C.
FIG. 21 is a plot showing a waveform containing eight different frequencies spanning a range of 128:1, according to embodiments of the present disclosure.
FIGS. 22-30 illustrate simulation data taken in accordance with specific embodiments of data processing aspects of the present disclosure.
FIG. 31 shows an impedance sensor embodiment according to the present disclosure.
FIG. 32 is an illustration of the effective impedance circuit of FIG. 31.
FIG. 33 is a combination flowchart and schematic diagram that illustrates impedance measurement steps, according to embodiments of the present disclosure.
FIGS. 34A and 34B are schematic diagrams of an impedance sensor according to embodiments of the present disclosure in which the driver and sensor electrodes are microfabricated inside a fluidic channel of circular cross section.
FIGS. 35A and 35B are schematic diagrams of an impedance sensor according to embodiments of the present disclosure in which the driver and sensor electrodes are microfabricated inside a fluidic channel of rectangular cross section.
The present disclosure overcomes deficiencies in the art by providing, in certain embodiments, a sensor that is a robust, multi-frequency impedance sensor that can be used to measure both particle characteristics and concentrations. This sensor can be used in microfluidic systems as an in-line component with other fluidic systems and instruments and the sensor element can easily be replaced. Also provided are processing methods for determining fluidic characteristics using sensor readings.
Fluidic Systems
Technology in fluidic and microfluidic systems has advanced such that there are numerous devices and systems available for the manipulation and analysis of small chemical and biological samples. As will be understood by those of ordinary skill in the art, it would be advantageous for those systems to be used with the techniques of the current disclosure.
Sensor devices of the current disclosure may be used with, for example, the apparatuses and methods described in U.S. Pat. No. 6,294,063, which is incorporated herein by reference. That patent discloses techniques that relate to the manipulation of packets of material using a reaction surface, an inlet port, a programmable manipulation force, a position sensor, and a controller. In one embodiment of that disclosure, material may be introduced onto a reaction surface with the inlet port. The material may be compartmentalized to form a packet, and the position of the packet may be tracked with the position sensor. Those of ordinary skill in the art will recognize, having the benefit of this disclosure, that techniques disclosed herein may be applied to the position sensor to allow for efficient, robust tracking of packets of material. The programmable manipulation force (which, in one embodiment, may involve a dielectrophoretic force) can be adjusted as a function of the packet's position and may be applied so that the packet is programmably moved along arbitrarily chosen paths.
Other patents and applications that may be used in conjunction with the sensor of the current invention include U.S. Pat. No. 5,858,192, entitled “Method and apparatus for manipulation using spiral electrodes,” filed Oct. 18, 1996 and issued Jan. 12, 1999; U.S. Pat. No. 5,888,370 entitled “Method and apparatus for fractionation using generalized dielectrophoresis and field flow fractionation,” filed Feb. 23, 1996 and issued Mar. 30, 1999; U.S. Pat. No. 5,993,630 entitled “Method and apparatus for fractionation using conventional dielectrophoresis and field flow fractionation,” filed Jan. 31, 1996 and issued Nov. 30, 1999; U.S. Pat. No. 5,993,632 entitled “Method and apparatus for fractionation using generalized dielectrophoresis and field flow fractionation,” filed Feb. 1, 1999 and issued Nov. 30, 1999; U.S. patent application Ser. No. 09/395,890 entitled “Method and apparatus for fractionation using generalized dielectrophoresis and field flow fractionation,” filed Sep. 14, 1999; U.S. patent application Ser. No. 09/883,109 entitled “Apparatus and method for fluid injection,” filed Jun. 14, 2001; U.S. patent application Ser. No. 09/882,805 entitled “Method and apparatus for combined magnetophoretic and dielectrophoretic manipulation of analyte mixtures,” filed Jun. 14, 2001; U.S. patent application Ser. No. 09/883,112 entitled “Dielectrically-engineered microparticles,” filed Jun. 14, 2001; and U.S. patent application Ser. No. 09/883,110 entitled “Systems and methods for cell subpopulation analysis,” filed Jun. 14, 2001, each of which are herein incorporated by reference.
Yet another application that may be used in conjunction with the teachings of the current invention include those described in “Micromachined impedance spectroscopy flow cytometer of cell analysis and particle sizing,” Lab on a Chip, vol. 1, pp. 76-82 (2001), which is incorporated by reference. For instance, methods for processing signals to determine particle concentrations and for correcting signals for particle trajectories disclosed herein may be applied to the planar electrode embodiments described in this journal article. More particularly, the methods of this disclosure may provide (a) more accurate impedance data for particles and (b) particle concentration values without the need to explicitly measure fluid flow volumes by methods outside the sensor.
In many of the systems referenced above, impedance measurements are typically used to determine certain informative characteristics of samples under study or analysis. For instance, if a dielectric medium above an electrode is displaced by a packet of material having different dielectric and/or conductive properties, the impedance detected at the electrode element will change. Thus, one may accordingly determine the position of packets by noting the impedance measurements associated therewith.
Other characteristics of packets may also be determined from the impedance detected at the electrode element. For example, the velocity of a packet flowing past an electrode may be measured by using the time difference between when the packet is above one electrode and when the same packet is above a second electrode. When the spacing between the electrodes is known, the velocity can correspondingly be determined. Since the number of packets flowing past an electrode can also be measured, the concentration of the packets can be determined directly from appropriate impedance sensors.
With the benefit of this disclosure, one of skill in the art will appreciate that the descriptions herein may be implemented in many different ways. In particular, one may use any suitable type of impedance measurement device known in the art to function with one or more electrodes. Such devices may include an impedance analyzer, a DC/AC conductance meter, or any circuit based upon methods of operation of these or other instruments having an identical or similar function.
Impedance Sensors
An impedance sensor can measure changes in the voltage over a cross-sectional area. A simple, conventional impedance sensor for packet characterization may include a single channel device that is excited by a current from a current generator—as shown in FIGS. 1A and 1B. A voltage develops across the sensor in proportion to the drive current and the impedance of the sensor. The current may be direct (DC excitation), an AC signal consisting of one or more sinusoidal components comprising an arbitrary waveform, or a mixture of DC and arbitrary components. When a particle enters the sensor channel, it perturbs the channel impedance, resulting in a change in the output voltage characteristics. Analysis of the voltage change allows the effective impedance of the particle to be deduced. If the driving current contains one or more AC frequencies, analysis of the voltage change allows the effective impedance of the particle to be deduced for each of those frequencies. Although this method is straightforward in principle and uses only one sensor channel, it has the disadvantage that analysis of the particle impedance information necessitates detection of a potentially small perturbation in the output voltage.
FIG. 2 shows a typical configuration of another conventional particle impedance sensor element, which is typically employed in particle counters and sizers. The electrical current is driven from one electrode to the other via the small hole (the sensor channel) in the sensor membrane. The impedance of the element is dominated by that of the narrow column of carrier fluid in the sensor channel. Particles are drawn into the sensor from the outside carrier medium suspension and perturb the impedance of the sensor channel as they pass through it.
In FIGS. 3A and 3B, views of another conventional microfabricated impedance sensor are shown (FIG. 3A is a side view, and FIG. 3B is a top view). In this configuration, the requirement to achieve a high enough ratio of particle volume to sensor volume is realized by microfabricating a capillary channel 11, having facing electrodes 1 along a short section of its walls. Channel 11 contains a carrier medium. The effective volume of the sensor channel 11 is approximately equal to the volume of fluid contained within the region between the electrodes 1. Displacement of the fluid between the electrodes 1 by particles transported by the carrier medium in the microfluidic channel 11, perturbs the electrical impedance between the two electrodes.
In an embodiment of the present disclosure, two channels 11, are connected and driven by identical, but opposite, current signals 21 (+i) and 22 (−i), which come from a two phase current source 20, as shown in FIGS. 4A and 4B. The output voltage 23 at the junction of the two sensors 30 and 31 with impedances Z1 and Z2 respectively comprises the sum of the two sensor voltages which can be given as V=i(Z1−Z2). When the two sensors 30 and 31, have identical impedance, the output voltage 23 is zero (i.e., if Z1=Z2, then V=0). Particles are typically passed through only one of the sensor channels 30, and the other channel 31 is the reference channel. When a particle 40 enters sensor channel 30 (FIG. 4B), the impedance of only that channel is perturbed. This destroys the balance in the channels, and the output voltage 23 deviates from zero. This scheme therefore provides an output signal 23 that reflects only the sample impedance.
In practice, the output signal 23 also contains voltages resulting from imperfections in the initial matching of the sensors and their drive circuits. Nevertheless, signal processing is greatly simplified by canceling almost all of the voltage from each sensor channel. The circuit is symmetrical, and particles that pass through channel 31 will result in an output voltage of opposite phase from that caused by particles travelling through channel 30.
In a variation of the two-sensor method and according to another embodiment of this disclosure, the two sensors may be connected in the same flow path 11, as shown in FIG. 5. In this case, the ability to balance the impedance of the sensors is enhanced because they are in the same microfluidic channel 11 and filled by the same carrier fluid. As before, the output of voltage of the sensor 23 is, in the absence of imperfections in the sensor and the drive circuitry, summed to zero. Particles that enter the first sensor 30 produce an imbalance in the circuit that produces a signal +v. When the particles are carried downstream by the fluid and enter the second sensor 31, the sample particles produce a signal −v. The method can result in ambiguous signals unless it is possible to track each particle as it passes from one sensor to the next. This, despite its great advantages over conventional techniques, may prove problematic if the sensors are far apart.
In a refinement of the two sensors, inline method, the two sensors can be brought very close together so that it becomes possible to observe each particle as it passes through both impedance sensor 30 and impedance sensor 31 before a second particle enters impedance sensor 30, as demonstrated in FIG. 6. This can be accomplished by microfabricating the two sensors in close proximity within a capillary tube 11. The small separation between the two sensor electrodes required for tracking particles as they pass from one sensor to the next may be, in certain embodiments, less than 500 μm, 400 μm, 300 μm, 200 μm or less than 100 μm. Those of ordinary skill in the art will recognize, however, that other separations will also be suitable.
In another method of forming the inline sensor, the fluid channel 11 can be formed through the electrodes, and the sensor membranes and the electrodes that are connected to the output 23 to sum the voltages from the two sensors 30 and 31 can be combined into a single electrode, effectively hybridizing the two sensors. This not only simplifies fabrication, but from an electrical standpoint confers the advantage that the electrode on which the output voltage is sensed can be made smaller. Further, it is effectively sandwiched between the electrodes to which the excitation signals are provided, having the advantageous effect of shielding it from electrical noise carried through the conductive carrier medium.
FIG. 7 shows a cross sectional view of an embodiment of an impedance sensor where the design of the sensor channel is based on a two-sensor, hybrid design. The sensor electrode 4 is surrounded by two dielectric membranes 12, where a first dielectric membrane is indicted by 12 a and a second dielectric membrane is indicated by 12 b. The two dielectric membranes 12, and the sensor electrode 4, together form a composite membrane sensor assembly. Although each of the electrodes 3 and 4, and membranes 12, appear to be segmented into a top and bottom half by the fluid channel 11 in the diagram, in reality they are situated as shown in the different viewpoint of FIG. 8. Driver electrode 3 a and driver electrode 3 b are excited by electrical signals of opposite phase 21 and 22 from an arbitrary waveform generator 20 programmed to provide a waveform consisting of the sum of one or more sinusoidal waves of known frequencies and phases. Because of the symmetrical construction of the sensor membrane 12, the signals from the driver electrodes 3 cancel at the sensor electrode 4 to provide a zero signal to the detector 24 when there is no particle in the channel. However, when a particle 40 (see FIG. 10) enters the channel 11, it disturbs the electrical symmetry, causing a net signal to appear on the sensor electrode 4. This signal 23 is detected and analyzed by the signal processing electronics 24. The signal 23 depends upon the position of the particle 40 in the channel 11 and it changes as the particle 40 is carried through the channel 11 by fluid flow. The nature of an exemplary signal is discussed and described in FIG. 12.
FIGS. 8A and 8B show an exploded diagram of the particle impedance sensor of FIG. 7, showing the driver electrodes 3, sensor electrode 4, and dielectric membranes 12. The fluid flow path to and from the composite membrane sensor assembly 13 occurs via channel 11 through the driver electrodes 3. The impedance sensor channel 11 is a small hole bored through the composite membrane sensor assembly 13. In operation, the fluid flow path may be completed with tubing, and the driver electrodes 3 may be mounted close to, or in contact with, the dielectric membranes 12 of the composite membrane assembly 13.
Two views of an assembled, three-layered composite sensor 13 according to embodiments of this disclosure are shown in FIGS. 9A and 9B. The channel 11, going all the way through the sensor assembly, is the sensor channel. The larger hole 15 that passes through only the top dielectric layer 12 b permits access to sensor electrode 4, through which electrical contact may be made to the sensor electronics.
Particle Position
The peak of voltage perturbation produced by a particle of 10 μm diameter passing through the impedance sensor as a function of its distance from the centerline is given in FIG. 11. The circles show the peak perturbations determined from finite element analysis for a 10 μm diameter sphere of conductivity 1.5 S/m carried in a suspending medium of conductivity 100 mS/m with a drive voltage of −10 V and +10 V.
Finite Element Simulations
To determine the effect of a particle on the electrical potential distribution in an impedance sensor, a finite element simulation was done (FIG. 12). In this example, a sensor having a sensor electrode sandwiched between two dielectric membranes was used. The driver electrodes on either side of the composite membrane sensor assembly were driven at −10 V and +10 V. The particle is located on the horizontal center line of the channel half way through the first dielectric membrane 12 a. In the absence of the particle 40, the potential on the sensor electrode 4 is zero but the presence of the particle 40 perturbs the potential as shown. This perturbation depends upon the particle position in the sensor channel 11. Finite element analyses like this may be used to calculate the response of the sensor for different particle positions and different sensor and driver geometries.
FIGS. 13A and 13B depict plots of a sensor electrode potential, determined from finite element analysis as shown in FIG. 12, as a function of particle positions in the sensor channel ranging from 25 μm to the left of the first dielectric membrane 12 a to 25 μm to the right of the second dielectric membrane 12 b. A packet position of 75 μm corresponds to the center of the channel in the horizontal (x) direction. Three curves are shown for particles positioned at different distances from the horizontal center line (axis) of the channel. FIG. 13A corresponds to the potential perturbations produced by a packet that is 15 times more conductive than the medium filling the channel. FIG. 13B correspond to a packet that is 1,000 times less conductive than the medium filling the channel. The channel height was 50 μm and the thickness of the dielectric membranes and the sensor electrode were 50 μm. The conductivity of the medium in the channel was 1100 mS/m. It is apparent from this data that the signal produced by the impedance sensor when a packet moves through it depends on the trajectory of the packet. Therefore, it is necessary to deduce the packet position in order to infer impedance information about the packet from the impedance sensor data.
Particle Velocity
When fluid flows through a channel under laminar flow conditions, or conditions where the flow through the channel is slow enough so as not to cause turbulence (referred to as at low Reynolds numbers in hydrodynamics), a flow velocity profile develops such that the fastest fluid flow occurs at the center of the channel and the lowest velocity occurs at the walls of the channel. Consequently, particles that travel through the channel under the influence of laminar fluid flow will be carried at velocities that accurately reflect their position in the fluid flow profile. FIG. 14 depicts two particles traveling along trajectories at different distances from the channel walls. These particles are being carried at two different velocities. If the speed that an arbitrary particle travels in the channel is known, its position relative to the channel walls can be inferred from a knowledge of the flow velocity profile. In simple geometries, the flow profile can be calculated using simple equations. In more complex geometries, finite element or other modeling methods can be used to calculate the fluid flow profile distribution.
The velocity of the carrier medium in the sensor channel can be given as a function of the distance from the centerline for a parabolic flow profile in FIG. 15. This profile pertains when the channel is sufficiently long, and the fluid is flowing sufficiently slowly to assure that laminar flow conditions prevail. Under these or other conditions, the flow profile may be simulated using finite element or other methods. In FIG. 15, the channel height (H) is assumed to be 50 μm and the mean flow velocity v0, the velocity distance x from the channel wall for a rectangular channel is given by 
FIG. 16 describes pulse shapes for particles carried by a carrier medium having a parabolic flow profile as they pass through the sensor along three trajectories parallel to the centerline calculated by scaling the horizontal axis of the finite element simulation results shown of FIG. 12 to allow for the relative flow rates corresponding to their position in the channel. In general, fits to data like this can be used to derive characteristic curves for the behavior of the sensor channel.
Sample Analysis
The finite element simulations of FIG. 17 show that the position, in the horizontal direction, from the center of the sensor at which the peak voltage perturbations to the sensor electrode occur depends on how far the particle trajectory is away from the horizontal centerline of the channel. One peak occurs as the particle travels through the first dielectric membrane and a second peak, of opposite sign, occurs as it travels through the second dielectric membrane before leaving the sensor. The curve shown in FIG. 17 is an approximation for the channel geometry shown earlier based on a hyperbolic cosine function. Finite element or other analysis methods may be used to obtain characteristics for any channel geometry, based on the procedures provided herein combined with what is understood in the art of, for instance, fluid dynamics.
Peak to peak voltage for a 10 μm particle travelling through an impedance sensor channel can be described as a function of the time it takes the particle to travel from the first peak position to the second of opposite sign (FIG. 18). This curve was calculated from the characteristics shown in FIGS. 11-17 and takes into account the relationships between peak positions, peak heights, fluid flow velocity and a distance of the particle trajectory from the horizontal centerline of the sensor. It shows that a 10 μm particle that has a peak to peak time of 0.028 seconds and causes a peak to peak sensor voltage perturbation of 0.2 volts is identical to a 10 μm particle having a peak to peak time of 0.037 seconds that gives a peak to peak voltage perturbation of 0.03 volts. By measuring the peak to peak times for different particles and then using a characteristic curve like this one constructed for the sensor geometry being used, sensor voltages can be corrected to provide accurate impedance data for all particles regardless of their trajectory through the sensor channel.
During the analysis of a sample using the impedance sensor, a count of the number of particles passing through the sensor channel as a function of their peak to peak time may be determined from the sensor voltage data, and a profile like the one above can be plotted. The curve in FIG. 19 reflects the distribution of particle velocities that results from the flow profile in the sensor channel. The shortest transit time observed corresponds to the maximum flow velocity, which occurs for particles being carried along the centerline of the channel. The profile may therefore be used to calculate the flow rate in the channel and, knowing the total number of particles counted in a given period of time, this information may be used to calculate the concentration of particles present within the sample. In this way, the concentration of particles in the sample may be determined from the impedance sensor signals without using ancillary methods to measure the volume of sample suspension that flows through the channel. This represents a major improvement over conventional electrozone sensors that rely on sophisticated fluid control and metering apparatus to allow them to determine particle concentrations. Its freedom from such metering equipment makes sensors disclosed herein simpler and more flexible than previous designs.
Alternating Current Excitation
Direct Current (DC) methods, used in the original Coulter Counter and other standard impedance sensors, are augmented by Alternating Current (AC) approaches in which the electrical current that is passes through the channel contains not only a DC current but also an AC current. Through this enhancement, dielectric information about the particles can also be deduced, adding greater discriminatory capabilities to the method. When AC voltages are used for excitation, the signal appearing on the sensor electrode is an AC voltage whose magnitude and the phase is modulated as the particle passes through the sensor channel. The phase and strength of the sensor signal reflect the particle response (FIG. 20A) times the AC signal (as in the example, a single frequency sine function, FIG. 20B). The resulting sensor signal is shown in FIG. 20C. Note that the particle response reflects the effective impedance at the AC frequency. In general, the particle response is frequency dependent and the frequency dependency can be used to characterize or identify the particle. To detect the particle properties, the sensor signal may be multiplied by the excitation waveform or one of its components, and the resulting signal may be passed through a low pass filter to recover the particle response shown in FIG. 20A. Such packet detection may be accomplished by analog methods or by digital signal processing using, for example, a DSP or FPGA chip as is known in the art.
In order to provide sufficient information to fully characterize the dielectric properties of a particle, it may be desirable to use excitation signals composed of multiple frequency components. For example, the waveform shown in FIG. 21 contains eight different frequencies spanning a range of 128:1. Other excitation signals may contain 2, 3, 4, 5, 6, 7, 9, 10, 11, 12, 13, 14, 15, 16, 17, 18, 19, 20, 21, 22, 23, 24, 25, 26, 27, 28, 29, 30, 31, 32, 33, 34, 35, 36, 37, 38, 39, 40, 41, 42, 43, 44, 45, 46, 47, 48 or more different frequencies. The frequencies may be multiples of a base frequency (i.e., the base frequency multiplied by 2, 4, 8, 16, 32, 64 and 128) or have a more random relationship. The impedance sensor response will also contain a contribution from each of the frequency components of the excitation signal, but each component will be modified in accordance with the particle's dielectric response characteristics at that frequency.
Sensor Replacement
One problem with many sensors and components in microfluidic systems is the need for rigorous cleaning or replacement of various elements due to unwanted accumulation within the element. For any system using small diameter tubes or channels, keeping the system clean can be problematic. Small amounts of material can effectively block a passageway and cause device function to drastically decrease. Many systems have elaborate cleaning protocols, manual or automated, that take substantial time and reagents. However, even with an optimized cleaning protocol, it is often still difficult to obtain a clean system. It is often preferred to use disposable elements and provide a clean substrate for every use. Impedance sensors of the current disclosure are designed such that they facilitate rapid and potentially automated replacement of the sensor element to overcome blockage and cleaning issues.
The current system permits the rapid exchange of sensor elements. The sensor element may be changed manually or automatically and may be changed between experiments or during experiments when flow through the sensor channel has been halted. These sensor elements can have different channel characteristics such as shape and size which allow the sensor characteristics to be optimized on the fly to match the needs of different particle sensing needs. For example, a sensor element, or composite membrane sensor assembly containing a sensor electrode sandwiched between two dielectric membranes may be removed from a flow system and replaced with another sensor or composite membrane sensor assembly with a different size or shaped hole to create a sensor element with a more or less constricting fluid flow path. When the particles to be analyzed have a substantially different particle size distribution from the previous sample, this exchange of sensor elements may be advantageous.
Impedance Signal Processing I
Once a signal from the sensor has been corrected to take into account trajectory through the sensor channel using sensor channel characteristics such as those described herein, and processing by detector electronics is completed, the resulting data are the in-phase and out-of-phase components of the particle impedance perturbation at each of the frequencies that were present in the excitation signal. Each of these impedance parameters will contain unwanted contributions from thermal noise as is well known in the art of electronics. However, the impedance properties of particles in the frequency range between 1 kHz and 1 GHz are dispersive rather than resonant in nature. This means that both the in-phase and out-of-phase impedance data obtained for particles by the impedance sensor must be functions of frequency that are smooth and members of a limited set of allowed curves. Furthermore, the Kramers-Kronig equation (Kramers, H. A., Nature, 117 (1926) 775, Kronig, R. de L., J. Opt. Soc. Am. 12 (1926) 547), is well known in the art of dielectrics and provides an explicit relationship between the in-phase and out-of-phase curves that cannot be violated. By fitting smooth curves from the set of curves characteristic of dispersive dielectric responses to the in-phase and out-of-phase impedance data points at the different frequencies contained in the excitation signal, and by further constraining the in-phase and out-of-phase curves so that they obey the Kramers-Kronig relationship, the quality of the impedance data for particles passing through the sensor can be greatly improved so as to increase the effective signal to noise ratio of the impedance measurements.
Furthermore, if the particle types being measured are known to have dielectric properties that are limited in some other way, the analysis may be further constrained so as to include an appropriate mathematical model for the particle dielectric characteristics. For example, many mammalian cells have dielectric characteristics that are described well by a single-shell dielectric model. By constraining the curve fits of the dielectric data from the impedance sensor to fit this model, explicit data reflecting the structure of the cells under measurement may be derived. All of these data analysis steps may be accomplished in a computer using appropriate algorithms or in dedicated DSP or FPGA hardware programmed for this purpose or in a combination of these means. The data analysis techniques employed may be single-pass least squares methods or iterative error minimization methods, as are well known in the art of data processing, or a combination of these but need not be limited to these methods.
The sensor signal containing multiple frequencies may be parallel-processed by multiplying it by each of the frequency components of the original excitation followed by low pass filtering (product detection). In this way, the effective impedance of the particle at each of the frequencies may be independently derived from the sensor signal even though the excitation electrodes applied them simultaneously as a single, composite signal. This may be accomplished by digital signal processing using a DSP or FPGA chip as known in the art.
After signal processing and impedance analysis, data for individual particles, for groups of particles, and statistical data for populations of particles may be provided. Processed data of this kind or individual particle data may be used for particle analysis, identification, or classification. Such data may in turn allow conclusions to be drawn by those skilled in the art. For example, population distributions of impedance properties of cells allow cell type, size, viability, apoptotic state, and membrane and cytoplasmic status to be drawn by life scientists skilled in the art and allow blood cell subpopulation differential analyses to be performed. With the benefit of this disclosure, those of ordinary skill in the art will recognize a host of other potential applications.
Impedance Signal Processing II
In one embodiment, the waveform that is used to drive the electrodes on either side of the impedance sensor membrane is synthesized by a field programmable gate array (FPGA, model Altera FLEX EPF10k200SBC600-1). An exemplary waveform (FIG. 21) consists of a composite of 8 separate sine waves having frequencies f, 2f, 4f, 8f, 16f, 32f, 64f, and 128f. The fundamental frequency f is adjustable and typically about 10 kHz. The FPGA generates this composite signal in the form of a string of digital numbers that are converted to a voltage signal by appropriate equipment such as a Burr Brown DAC902U digital to analog converter. An output stage drives the electrodes on either side of the sensor membrane, one with this drive signal and the other with a signal of the opposite phase. The signals driving the driver electrodes, including a signal and a signal of opposite phase, are referred to generically as the “drive signal.” Other methods and other electronic components known in the art may be used to produce waveforms, which may be of any desired composition with respect to Fourier components, and to drive the sensor. Other approaches to producing waveforms and driving electrodes with voltage signals are well known in the art.
In one embodiment, a low noise preamplifier located very close to the sensor amplifies the signal from the center metal layer of the sensor membrane. The resulting higher amplitude signal, which incorporates the desired impedance information, may be fed to a circuit based on an Analog Devices AD9224 12 bit analog to digital converter (DAC). The inventors call the signal from the sensor membrane the “impedance signal.” The digital output from this circuit may be fed to a second Altera FLEX FPGA. The rate of sampling of the impedance signal provides 16-fold oversampling, adding three extra bits of resolution beyond the 12 bit width of the digital to analog converter by a mechanism well known in the art.
In this embodiment, the second FPGA accomplishes a Fourier-type analysis of the impedance signal to derive from it the intensities of the in-phase and out-of-phase components of the same frequencies used to compose the drive signal. These impedance signal frequency components are represented as 24 bit words that are passed to a digital signal processor (DSP) board, which may be based on a Texas Instruments TM S320 C6211 integrated circuit. At this stage, the impedance data is represented by a stream of 16,000 digital samples per second, each comprising sixteen 24 bit words: one 24 bit word for each real and imaginary component for each of the 8 frequencies. The inventors refer to these sixteen data sets as the “data channels.” There are two data channels for each of the 8 frequencies; one is the in-phase component, the other the out-of-phase component.
The function of the DSP is to analyze this data stream from the impedance data to detect changes in the data that correspond to particles passing through the impedance sensor. The inventors call these changes “particle events.” Exemplary shapes of impedance signals corresponding to a particle event has been shown earlier in this disclosure. Because of the rapid sampling of the impedance data, a single particle event, which may typically last from 1 to 5 milliseconds as the particle passes through the sensor, corresponds to between 16 and 80 digital samples, each comprising sixteen 24 bit words (one 24 bit word for each real and imaginary component for each of the 8 frequencies). The signals may contain significant electrical noise especially if the impedance signal preamplifier is set to high gain in order to detect small particles producing small impedance signals. As is well known in the art, it is advantageous to filter signals to reduce the noise as much as possible. In one embodiment, the first step of filtering is to apply low pass digital filtering of the signals by computing the moving sum of N digital samples where N is of the order of half the number of digital samples corresponding to a particle event (i.e. typically between 8 and 40).
The changes in the digital data that occur with time during a particle event are typically of different intensities and of different phases for each of the sixteen data channels. By using an algorithm that is independent of phase to correlate the time changes in the 16 channels, a robust way of detecting particle events is produced.
In one embodiment, an algorithm in the DSP is used to derive a composite signal comprising the moving sum of the (unsigned) magnitudes of changes with time in each of the sixteen digital channels. This sum is conducted over N1 digital samples, where N1 is typically of the order of half the number of digital samples within a particle event. This produces a signal related to the average square root of the power density of changes summed for all sixteen channels. This signal has a mean value that reflects the mean noise (the “noise floor”) and increases when a particle event occurs. In one embodiment, a particle event is detected by determining when this signal exceeds a given threshold value above the noise floor. This threshold value may be adjusted to alter the sensitivity of the system to different particle sizes.
Once a particle event is detected, portions of the signal about the particle event are analyzed. In one embodiment, all 16 channels of N3 digital data samples preceding, and N4 digital data samples following, the point at which the threshold was exceeded are saved by the DSP for further analysis. Such additional analysis may be undertaken by the DSP itself, by an additional DSP or microcomputer, or by a host computer after uploading the (N3+N4) samples. N3 and N4 are chosen to be sufficiently large that the saved data covers the entire particle event, i.e. includes the entire data record of the impedance signal as the particle enters, passes through, and leaves the impedance sensor. For example, if particle events span up to 80 samples in a given experiment, 100 samples might be saved spanning the range from 50 points before the peak to 50 points after. After saving the digital samples for a particle event, the DSP continues to analyze the digital sample stream looking for additional particle events. In this way, the impedance data is continuously screened for particle events, and the data for these alone are saved for further analysis.
The moving sum of the magnitude of the signal changes of the 16 channels of a saved particle event has a peak whose position indicates when a particle has passed half way through the impedance sensor. The width of the peak at half its height above the noise floor is proportional to the amount of time the particle took to travel through the sensor. In one embodiment, the velocity of each particle is calculated from saved event data by dividing the length of the sensor by the time the particle takes to transit the sensor as inferred from the peak width. Particles travel at different velocities according to how far they pass from the axis of the sensor. By taking the average of the velocities for many particles, the mean fluid velocity may be deduced. Multiplication of this mean flow velocity by the area of the sensor orifice allows the mean fluid flow rate to be deduced. Division of the mean number of particles counted per unit time by the mean flow rate gives the concentration of particles in the sample.
In one embodiment, the saved particle event data is further analyzed to deduce size, dielectric, and conductivity data for each particle. As shown earlier from computer simulations, the shape of the impedance sensor signal corresponding to a particle event depends on the axial displacement of the particle transit path from the center of the sensor. When highly accurate particle data is needed, this axial displacement can be taken into account. It is possible to calculate the displacement position from the particle velocity and mean fluid velocity data (deduced using the method described above) because, as is known in the art, fluid flowing under laminar flow conditions within a flow path follows a parabolic flow profile. If the velocity calculated for a given particle is vp and the mean fluid flow velocity based on the average of the velocities of many particles is vm then the relative displacement x/r at which the particle traversed the sensor from its central axis, assuming that the impedance sensor has an orifice radius r, is described by the following equation: 
for a parabolic flow profile. The family of impedance sensor response characteristics S(l, x/r) representing the impedance signals as a function of distance l along a particle transit path for axial displacements x/r may be stored in a lookup table in one embodiment of the impedance signal analysis system. Alternatively, in another embodiment, these characteristics may be calculated from an empirical equation. Each characteristic curve is normalized so that its integral along a path L that spans the entire length of a particle transit from the point where it enters the sensor to the point where it leaves obeys the expression: 
Here, l is the distance of the particle from the center of its transit through the sensor, Ŝ(l,x/r) is the true strength of the impedance signal for a standard particle along the particle transit path, and S(l,x/r) has the same form as Ŝ(l,x/r) but is scaled to ensure normalization according to the integral expression. As shown earlier, the shape characteristics of the impedance signals are antisymmetric about the mid point of the transit path, so that 
Because of these properties, the intensity coefficients Ai of the sixteen impedance signals Ci comprising the real and imaginary parts of the eight frequencies (embodied in the saved impedance signal sample) may be obtained by calculating the overlap integral for each channel in turn with the relevant shape characteristic 
where the constants Bi correct for gain imperfections in the electronics of the 16 channels. The 16 Ai coefficients summarize the frequency and phase characteristics of the perturbation caused by the particle to the overall impedance of the sensor channel. Besides using this overlap integration technique, it will be understood that one could also use other well-known signal processing approaches such as, but not limited to, (a) calculating a correlation function or autocorrelation function or (b) performing a double integral of the signal. Although the double integral technique may be more noise prone, it would nevertheless work well for good signal to noise ratios.
Other approaches to solving this problem may be derived from digital signal processing methods known in the art. Therefore, the algorithm described above is an example of a specific embodiment only.
FIGS. 22-30 illustrate simulation data taken in accordance with specific embodiments of data processing aspects of the present disclosure. In FIG. 22, there is shown simulated impedance signals for a train of 9 particles passing through a sensor. Included is simulated Gaussian noise. The sixteen separate signals represent the real and imaginary components for each of eight frequencies, as illustrated.
FIG. 23 shows the data of FIG. 22 after applying a low pass filter—here, a moving sum of 16 digital samples.
FIG. 24 shows the signal derived by computing the moving sum of absolute differences over 16 digital samples summed over both real and imaginary components for all 8 frequencies (i.e., it shows computing the power in each channel and then adding all channels). The mean signal level has been subtracted to remove a noise floor.
FIG. 25 is a table showing peaks detected from the signal of FIG. 24 by thresholding. As shown, the columns of the table include, from left to right: peak start time (seconds), peak end time (seconds), and peak height.
FIG. 26 shows a comparison of a theoretical signal (single smooth curve) and the signals extracted from the digital sample for the in phase components at f1 for the 9 particles in the simulation.
FIG. 27 illustrates the multiplication of the signal from one of the data channels with the theoretical signal shape. FIG. 28 shows the area of this multiplication, which reflects the intensity of the impedance signal.
FIGS. 29 and 30 respectively show the imaginary and real parts of impedance signal recovered after processing. These plots show data for 9 separate signal events for identical cells.
Impedance Data
Although the impedance perturbation information is of interest, a more useful parameter in many applications is the impedance data for the individual particles themselves. In one embodiment, additional analysis to the coefficients Ai is employed so as to extract the explicit particle impedance information. To accomplish this, it is first noted that the odd-indexed coefficients A1, A3, A5 . . . A15 are proportional to the in-phase, or resistive, components of the impedance perturbation for the eight frequencies while the even coefficients are proportional to the corresponding out-of-phase, or capacitative, components. In this analysis it is assumed that the out-of-phase part of the particle impedance arises from particle capacitance and not inductance. Inductive impedances will correspond to negative capacitance values.
The impedance sensor embodiment of FIG. 31 has an effective impedance circuit as shown in FIG. 32. Assuming that the impedances are driven by a symmetrical voltage source with voltage waveforms V and −V, the voltage at the junction of the impedances will be given by 
In the absence of a particle, Z1=Z2 and the output signal is zero. Expressed in terms of conductivities, K1 and K2 where K1=1/Z1 and K2=1/Z2, the junction voltage is given by 
In many applications, such as the characterization of cells, for example, the particle size is very small compared to the sensor volume (e.g., 1% or less). In such cases, the denominator may be approximated as 2K1 and assumed to be constant so that the voltage perturbation when a particle is present can be accurately approximated by Q(K2−K1) where Q is a calibration constant for the measurement. The conductivies K1 and K2 can be expressed in terms of the geometrical characteristics of the sensor and the complex permittivity of the fluid inside the sensor in the form: 
where Aorifice and Lorifice are the effective area of the membrane sensor channel and the electrical distance from where the particle enters the sensor to the sensor's midpoint, respectively. The complex permittivity of the fluid inside the sensor includes any contribution from the particle and can be written:
where εsensorfluid is the real permittivity (“dielectric constant”) of the fluid, σsensorfluid is the conductivity of the fluid, and ω=2πf is the angular frequency of a voltage component of V that is under consideration, and j=(−1)½. When V is a composite of many frequencies, the signal from the sensor will be the sum of a voltage for each frequency each bearing similar dependences.
Because Aorifice and Lorifice are the same for both impedances in the sensor, the voltage signal corresponding to a particle can be further simplified to {circumflex over (Q)}(ε*sensorfluidnoparticle−ε*sensorfluidwithparticle)={circumflex over (Q)}Δε*sensor. This complex number contains both the in phase (real) and out-of-phase (imaginary) components of the signal. In the embodiment described here, each data sample comprises one Δε*sensor for each of the eight frequencies, each having separate channels for the in-phase and out-of-phase components. The eight Δε*sensor k data points are stored in the 16 coefficients Ai such that
The effect that the presence of a particle has on the effective permittivity of fluid within the sensor can be described by dielectric mixture theory.
From this mixture theory, 
giving the sensor signal, which arises from the difference in the fluid properties in the left and right sections of the sensor, as: 
In each expression, all complex permittivities (denoted by the stars) take the form ε*=ε−jσ/ω as before.
As already indicated the particle usually has a very small volume compared to the sensor so that 
is very large. Therefore, the signal expression can usually be accurately approximated as: 
The permittivity and conductivity of the suspending fluid and the sensor volume are known for a given measurement condition, leaving the particle volume and complex permittivity as the only unknowns. The goal of analyzing the impedance signals further is to deduce these parameters. The coefficients Ai representing the values Δε*sensor k for eight measurement frequencies may be subjected to further filtering to lower the effect of noise of the measurements. Dielectric theory requires that both the real and imaginary components of Δε*sensor be continuous functions of frequency and that the real (in phase component) Δεsensor either remains constant with increasing frequency or else decreases with increasing frequency. The rate of change of these functions with frequency are also limited because the narrowest dielectric response in a dispersive system is that given by the Debye dispersion function, which has a width at half height of about 1.1 decades of frequency. Lastly, the Kramers-Kronig relationship also requires that the real and imaginary parts of Δε*sensor obey the relationship: 
where α is a constant and Δσ0 is related to the DC conductivity of the particle. For the geometrically-spaced measurements frequencies f, 2f, 4f, . . . used in one embodiment, this means that the coefficients A(2k−1) must be related to the coefficients Ak by 
where αo and αg are offset and gain parameters relating to the electronics and algorithms earlier in the signal processing sequence that are constant for a given event. In one embodiment, the coefficients Ai may be analyzed by a curve fitting procedure and replaced by best-fit values that obey all of these constraints. This has the effect of lowering measurement noise.
If a dielectric model exists for the particles under investigation, then that model may also be used to deduce explicit characteristics of the particles from the massaged Ai coefficients. For example, the dielectric properties of mammalian cells can be modeled to a good approximation by a single shell structure. This structure comprises an electrically homogeneous cell cytoplasm of radius r having complex permittivity ε*int surrounded by a thin membrane of thickness d and permittivity ε*mem. The complex permittivity of such a particle is given by: 
As before, each complex permittivity takes the form ε*=ε−jσ/ω, and ε*mem reflects the cell membrane permittivity and conductivity and ε*int reflects the cell interior permittivity and conductivity. Because the complex permittivity of a particle described by this model is highly frequency dependent, it is possible to use an iterative fitting algorithm to fit the particle permittivity equation to the coefficients Ai to yield best-fit estimates for the cell volume, the cell cytoplasmic conductivity and permittivity, and the cell membrane conductivity and permittivity. As is known in the art, other dielectric models may be used for specific particle types as appropriate and the above analysis adjusted accordingly.
In one embodiment, the DSP uploads the massaged coefficients Ai for each particle event to a host personal computer. This computer uses a Nelder-Meade simplex algorithm or other non-linear curve fitting procedure to derive values for νparticle, εmem, and σint for each particle, and displays the accumulated results for all particle events during an experiment on dot plots and histograms in a fashion similar to that commonly employed for displaying flow cytometry data. The host computer also allows communications with the DSP and FPGA systems to set the measurement and data analysis parameters for those systems.
As already indicated, the single shell model fairly closely approximates the dielectric characteristics of mammalian cells. In order to most effectively measure the explicit cell parameters, it is helpful to undertake impedance measurements under conditions where the cell permittivity is a strong function of frequency so that the fitting of coefficients Ai by the dielectric shell model may be robust. For the frequency range of measurements in the present embodiment, this occurs when the conductivity of the cell suspending fluid is much lower than the conductivity of viable cells. Typical cytoplasmic conductivity values for viable cells are ˜0.6 S/m, so that conductivities for the suspending fluid of 0.1 S/m or lower are preferred. Under these conditions, the difference between the permittivity of viable cells and that of their suspending medium changes from a negative value to a positive value as frequency is increased and is zero at a so-called crossover frequency. Ideally, the suspending fluid conductivity has a value chosen to causes the crossover frequency of the modal cell type in the experimental sample to be close to 8f, the center frequency probed in the 8-frequency, octave spaced embodiment.
When necrotic cells are suspended in the low conductivity suspending fluid, they typically lose ions from their interiors causing their cytoplasmic conductivity to fall. Such damaged cells do not exhibit a crossover frequency and may be easily distinguished by impedance measurements from healthy cells of the same type that have retained their cytoplasmic ions. In this way impedance sensor measurements may be used to discriminate viable cells from non-viable and necrotic cells. This provides a useful tool for assessing cell viability in tissue culture facilities, for example.
The membrane permittivity of cells has also been shown to be highly characteristic of cell type and to changes for a given cell type during cell division, apoptosis, and if cells are exposed to biological signals, are chemically modified, or are damaged by toxins. For these reasons, different cell types may be discriminated and identified by the AC impedance sensing method. In addition, changes in cell physiology and morphology and cell responses to various agents may be deduced from impedance sensor data. Other data analysis steps appropriate to different particle measurement applications may be accomplished by appropriate adjustment of the analysis procedure.
Impedance Measurement Steps
FIG. 33 displays a summary of impedance measurement steps, according to embodiments of the present disclosure. Flow of suspending medium brought about by a pressure differential across the sensor channel drives the sample and the suspended particles through the sensor. The boxes represent functionality embodied in the support electronics. It is assumed that the excitation signals 21 and 22 are generated digitally from a lookup table containing waveforms of composite sine frequencies (f1, f2, f3 . . . fn) 52 before going through a digital to analog converter 50. It is also assumed that the sensor signal 23 is analyzed digitally after going through an analog to digital converter 51, although analog methods may be used for either or both processes as is known in the art. A clock signal 53 may be used to synchronize the excitation and analysis process. After obtaining the sensor signal 23, the signal is sent to a signal processing 54, where the sensor signal 23 is multiplied by each one of the sine frequencies (f1, f2, f3 . . . fn) and subjected to low pass filtering in n separate parallel processes to yield a continuous stream of sensor data for each frequency (1−n). Perturbations in the sensor data that follow the characteristic reversal of peaks are recognized as particle responses, and sets of impedance data at the different frequencies are output for each particle. Signal analysis 55 of the sensor signal 23 involves analyzing the sets of impedance data corresponding to particles and correcting the data for trajectory, based upon transit time through the sensor channel 11. A frequency spectrum for each particle may be constructed and used for particle identification or classification. The fluid flow rate and flow profile may be computed and used to calculate the particle concentration.
Concentration Algorithm
As stated previously, embodiments of the present disclosure may be used to analyze the concentration of samples. This specific, non-limiting embodiment may involve the following general steps:
1. Measure signal intensity and transit time for multiple (e.g., about 500) particles. Record time for entire measurement.
2. (Optional) Construct frequency histogram for transmit times (using, e.g., data such as that from FIG. 19).
3. (Optional) Curve fit histogram to laminar (or other type) flow profile.
4. Find mean time and divide it into a factor to convert it to flow rate through the orifice.
5. Calculate total volume by multiplying flow rate by time for entire measurement.
6. Calculate particle concentration by dividing number of particles counted by volume of entire measurement.
Those having skill in the art will recognize, with the benefit of this disclosure, that several other methods may be utilized to use the techniques explored herein to calculate properties such as concentration. All such modifications are deemed to be within the scope of this disclosure.
Different Cell Models
As is known in the art, different cell types possess characteristically different dielectric properties. In addition, inert particles such as dusts and smokes possess strikingly different dielectric frequency spectra from biological cells. Dielectric differences between different particles can be detected by techniques of the present disclosure, and this allows particles in homogeneous suspensions to be identified and dissimilar particles in heterogeneous particulate mixtures to be profiled according to their dielectric differences. In this way, blood cell differential analysis may be accomplished by impedance sensing, and cells such as bacterial spores may be discriminated from other cell types such as mammalian cells and pollen and from inert particles.
Therefore, the techniques of the present disclosures are suitable for use as a detection and discrimination element for use not only in clinical applications involving cell suspensions and in other applications where particle profiling is desirable, but also in biological agent applications in agriculture, aquaculture, and warfare and terrorism detection applications. The impedance technology may be used in a stand-alone form or as an in-line detection element for other devices. For example, the technology may be used in conjunction with devices and methods such as those disclosed in U.S. Pat. Nos. 6,287,832; 5,993,632; 5,993,630; 5,888,370; and 5,858,192 (each of which is incorporated by reference) in order to provide particle detection and discrimination capabilities. In addition, the techniques of this disclosure may be used to discriminate between different subpopulations of beads or other particles chosen so as to possess characteristic dielectric differences including dielectrically-engineered packets. In this regard, U.S. patent application Ser. No. 09/883,112, which is hereby incorporated by reference, may be useful.
Electrode Design
The driving electrodes and sensor electrodes may be formed using any method known in the art. They may be formed in conjunction with the capillary or reaction surface or coupled after forming both elements. In one embodiment, the electrodes may be formed by laminating the materials.
FIGS. 34A and 34B show a design of an impedance sensor according to embodiments of the present disclosure in which the driver 3 and sensor 4 electrodes are microfabricated inside a fluidic channel 11 of circular cross section within a dielectric body 10. The fluid flow profile is analogous to that present in the laminated membrane design, and the signal shapes and signal processing methods for deducing the fluid flow characteristics and the particle impedance corrections are the same. This microfabricated embodiment may be realized for fluidic channels consisting of capillary tubes as well as for fluidic channels within larger structures. One constraint on the material in which the impedance sensor is constructed is that it should be of low conductivity relative to the carrier medium in which particles to be sensed are carried through the channel. In the design shown, the channel has circular cross section, and the electrodes circle the channel, as represented by the dotted line around the channel shown in the end view.
An alternative design of the impedance sensor (FIGS. 35A and 35B) is one in which the driver 3 and sensor 4 electrodes are microfabricated inside a fluidic channel 11 of rectangular cross section. In one embodiment, the electrodes may be fabricated on two opposing sides of the channel case. The fluid flow profile is analogous to, but more complex, than that present in flow channels of circular cross section, and the signal shapes and signal processing methods for deducing fluid flow characteristics and particle impedance corrections are correspondingly different from the circular sensor channel cases but handled in an analogous manner as will be understood by those of ordinary skill in the art. This microfabricated embodiment may be realized for fluidic channels in capillary tubes or in larger structures where rectangular channels may be easier to realize. The material in which the impedance sensor is constructed should be of low conductivity relative to the carrier medium in which particles to be sensed are carried through the channel.
The electrodes may be formed using standard photolithography techniques. For example, one may refer to, e.g., D. Qin et al., “Microfabrication, Microstructures and Microsystems,” Microsystem Technology in Chemistry and Life Sciences (Ed. Manz and Becker), Springer, Berlin, 1997, pp 1-20, which is incorporated herein by reference. Also, one may refer to Madou, Fundamentals of Microfabrication, CRC Press, Boca Raton, 1997, which is incorporated herein by reference. Depending upon the particular application, and the nature of the packets and partitioning medium, the size and spacing of electrodes may be smaller than, of similar size, or larger than the diameters of the packets. The spacing between the driving electrodes and sensor electrodes may vary, but in one embodiment, the spacing may be between about 2 microns and about 50 μm. The electrodes may have different forms such as lines, squares, circles, diamonds, polygons, or other suitable shapes. The dimensions of each electrode may vary, but a typical electrode may be between about 0.2 μm and about 10 mm., and more particularly, between about 1 μm and about 200 μm.
Definitions
As used herein, a “carrier fluid” refers to matter that may be adapted to suspend other matter to form packets on a reaction surface. A carrier fluid may act by utilizing differences in hydrophobicity between a fluid and a packet. For instance, hydrocarbon molecules may serve as a carrier fluid for packets of aqueous solution because molecules of an aqueous solution introduced into a suspending hydrocarbon fluid will strongly tend to stay associated with one another. This phenomenon is referred to as a hydrophobic effect, and it allows for compartmentalization and easy transport of packets. A carrier fluid may also be a dielectric carrier liquid which is immiscible with sample solutions. Other suitable carrier fluid include, but are not limited to, air, aqueous solutions, organic solvents, oils, and hydrocarbons.
As used herein, a “programmable fluid processor” (PFP) refers to an electrode array whose individual elements can be addressed with different electrical signals. The addressing of electrode elements with electrical signals may initiate different field distributions and generate dielectrophoretic or other manipulation forces that trap, repel, transport, or perform other manipulations upon packets on and above the electrode plane. By programmably addressing electrode elements within the array with electrical signals, electric field distributions and manipulation forces acting upon packets may be programmable so that packets may be manipulated along arbitrarily chosen or predetermined paths. The impedance sensor may also be coupled to an integrated circuit which is coupled to the PFP. The impedance sensor may also be coupled to a controller which is coupled to the PFP. The controller may be adapted to provide a feedback from the impedance sensor to the PFP.
Counter phase, or anti-phase means that the two electrodes are driven by identical but opposite currents. The identical but opposite current signals (+i) and (−i) must be within 5% or more preferably 2% of the ideal values.
As used herein, “packet” and “particle” both refer to any compartmentalized matter. The terms may refer to a fluid packet or particle, an encapsulated packet or particle, and/or a solid packet or particle. A fluid packet or particle refers to one or more packets or particles of liquids or gases. A fluid packet or particle may refer to a droplet or bubble of a liquid or gas. A fluid packet or particle may refer to a droplet of water, a droplet of reagent, a droplet of solvent, a droplet of solution, a droplet of sample, a particle or cell suspension, a droplet of an intermediate product, a droplet of a final reaction product, or a droplet of any material. An example of a fluid packet or particle is a droplet of aqueous solution suspended in oil. The packet or particle may be encapsulated or a solid. Examples of solid packets or particles are a latex microsphere with reagent bound to its surface suspended in an aqueous solution, a cell, a spore, a granule of starch, dust, sediment and others. Methods for producing or obtaining packets or particle as defined herein are known in the art. Packets or particles may vary greatly in size and shape, as is known in the art.
As used herein, an “array” refers to any grouping or arrangement. An array may be a linear arrangement of elements. It may also be a two dimensional grouping having columns and rows. Columns and rows need not be uniformly spaced or orthogonal. An array may also be any three dimensional arrangement.
All of the methods disclosed and claimed herein can be made and executed without undue experimentation in light of the present disclosure. While the techniques of this invention have been described in terms of specific embodiments, it will be apparent to those of skill in the art that variations may be applied to the methods and in the steps or in the sequence of steps of the method described herein without departing from the concept, spirit and scope of the invention. All such similar substitutes and modifications apparent to those skilled in the art are deemed to be within the spirit, scope and concept of the invention as defined by the appended claims.
Claims (40)
1. A impedance sensor comprising:
a sensor electrode;
first and second driver electrodes coupled to the sensor electrode and driven in counter phase to produce a net output signal of about zero at the sensor electrode; and
a fluid channel defined through the sensor electrode and the first and second driver electrodes.
2. The impedance sensor of claim 1 , wherein the sensor electrode comprises copper.
3. The impedance sensor of claim 1 , wherein the sensor electrode comprises a first and second dielectric membrane sandwiching a detector electrode.
4. The impedance sensor of claim 3 , wherein the first or second dielectric membrane comprises polyimide.
5. The impedance sensor of claim 3 , wherein the first or second dielectric membrane is laminated.
6. The impedance sensor of claim 3 , wherein the first and second driver electrodes contact the first and second dielectric membranes, respectively.
7. The impedance sensor of claim 1 , wherein the first and second driver electrodes are driven at multiple frequencies.
8. The impedance sensor of claim 1 , wherein the first and second driver electrodes are driven with an alternating current signal.
9. The impedance sensor of claim 1 , wherein the cross section of the channel is rectangular.
10. The impedance sensor of claim 1 , further comprising a programmable fluid processor coupled to the sensor electrode.
11. A flow-through impedance sensor, comprising:
a fluid channel for transporting a carrier medium and particles through the impedance sensor;
a composite membrane sensor assembly coupled to the channel and comprising a detector electrode sandwiched between first and second dielectric membranes;
first and second driver electrodes coupled to the channel and positioned adjacent opposite sides of the composite membrane sensor assembly, the first and second driver electrodes being driven in counter phase to produce:
(a) a net output signal of about zero at the detector electrode when no particle is within the impedance sensor; and
(b) a non-zero net output signal at the detector electrode when a particle is within the impedance sensor.
12. The impedance sensor of claim 11 , wherein the first and second driver electrodes are in contact with the composite membrane sensor assembly.
13. The impedance sensor of claim 11 , wherein the first and second driver electrodes are driven at multiple frequencies.
14. The impedance sensor of claim 11 , wherein the first and second driver electrodes are driven with an alternating current signal.
15. The impedance sensor of claim 11 , further comprising a programmable fluid processor coupled to the sensor electrode.
16. A method for determining a characteristic of a packet, comprising:
flowing a fluid containing a packet through an impedance sensor that includes first and second driver electrodes driven in counter phase to produce a net output signal of about zero at a sensor electrode;
measuring perturbations of the net output signal arising from changes in impedance associated with the presence of the packet within the impedance sensor; and
determining the characteristic of the packet from the perturbations.
17. The method of claim 16 , wherein the characteristic of the packet comprises packet size.
18. The method of claim 16 , wherein the characteristic of the packet comprises packet transit time through the impedance sensor.
19. The method of claim 16 , wherein the characteristic of the packet comprises packet velocity.
20. The method of claim 16 , wherein the characteristic of the packet comprises packet concentration.
21. The method of claim 16 , wherein the characteristic of the packet comprises a relative displacement within the impedance sensor.
22. The method of claim 16 , wherein the characteristic of the packet comprises packet impedance.
23. A method for determining a characteristic of a particle, comprising:
providing an impedance sensor comprising a sensor electrode, first and second driver electrodes coupled to the sensor electrode and driven in counter phase to produce a net output signal of about zero at the sensor electrode, and a channel defined through the sensor electrode and the first and second driver electrodes;
applying a multi-frequency drive signal to the first and second driver electrodes;
receiving an impedance signal from the sensor electrode;
determining in-phase and out-of-phase components of the impedance signal at the frequencies of the drive signal;
detecting changes in the in-phase and out-of-phase components indicative of a particle event; and
analyzing portions of the impedance signal about the particle event to determine the characteristic of the particle.
24. The method of claim 23 , wherein the drive signal comprises a composite of separate waveforms of different frequencies, each frequency being an integer multiple of a fundamental frequency.
25. The method of claim 24 , wherein the drive signal consists of 8 separate sine waves having frequencies f, 2f 4f 8f, 16f, 32f 64f and 128f.
26. The method of claim 23 , wherein impedance signal components are represented as 24 bit words.
27. The method of claim 23 , further comprising deriving a composite signal comprising a moving sum of magnitudes of changes of the in-phase and out-of-phase components.
28. The method of claim 27 , wherein detecting changes indicative of a particle event comprises determining when the composite signal exceeds a threshold value above a noise floor.
29. The method of claim 23 , wherein analyzing portions of the impedance signal about the particle event to determine the characteristic of the particle comprises calculating an overlap integral.
30. The method of claim 23 , wherein analyzing portions of the impedance signal about the particle event to determine the characteristic of the particle comprises constraining curves associated with the in-phase and out-of-phase components to obey a Kramers-Kronig relationship.
31. The method of claim 23 , wherein analyzing portions of the impedance signal about the particle event to determine the characteristic of the particle comprises determining a velocity of the particle.
32. The method of claim 23 , wherein analyzing portions of the impedance signal about the particle event to determine the characteristic of the particle comprises determining a mean fluid velocity.
33. The method of claim 23 , wherein analyzing portions of the impedance signal about the particle event to determine the characteristic of the particle comprises determining a concentration of particles.
34. The method of claim 23 , wherein analyzing portions of the impedance signal about the particle event to determine the characteristic of the particle comprises determining a size of the particle.
35. The method of claim 23 , wherein analyzing portions of the impedance signal about the particle event to determine the characteristic of the particle comprises determining a relative displacement of the particle.
36. The method of claim 23 , wherein analyzing portions of the impedance signal about the particle event to determine the characteristic of the particle comprises determining a dielectric property of the particle.
37. The method of claim 23 , wherein analyzing portions of the impedance signal about the particle event to determine the characteristic of the particle comprises determining a conductivity property of the particle.
38. The method of claim 23 , wherein analyzing portions of the impedance signal about the particle event to determine the characteristic of the particle comprises determining an impedance of the particle.
39. The method of claim 23 , wherein analyzing portions of the impedance signal about the particle event to determine the characteristic of the particle comprises determining a cell membrane permittivity of the particle.
40. The method of claim 23 , wherein analyzing portions of the impedance signal about the particle event to determine the characteristic of the particle comprises determining a cytoplasmic permittivity of the particle.
Priority Applications (6)
| Application Number | Priority Date | Filing Date | Title |
|---|---|---|---|
| US10/005,373 US6703819B2 (en) | 2001-12-03 | 2001-12-03 | Particle impedance sensor |
| PCT/US2002/038424 WO2003048728A2 (en) | 2001-12-03 | 2002-12-02 | Particle impedance sensor |
| EP02804483A EP1451566A4 (en) | 2001-12-03 | 2002-12-02 | Particle impedance sensor |
| CA002468862A CA2468862A1 (en) | 2001-12-03 | 2002-12-02 | Particle impedance sensor |
| JP2003549874A JP2005512042A (en) | 2001-12-03 | 2002-12-02 | Particle impedance sensor |
| AU2002365810A AU2002365810A1 (en) | 2001-12-03 | 2002-12-02 | Particle impedance sensor |
Applications Claiming Priority (1)
| Application Number | Priority Date | Filing Date | Title |
|---|---|---|---|
| US10/005,373 US6703819B2 (en) | 2001-12-03 | 2001-12-03 | Particle impedance sensor |
Publications (2)
| Publication Number | Publication Date |
|---|---|
| US20030102854A1 US20030102854A1 (en) | 2003-06-05 |
| US6703819B2 true US6703819B2 (en) | 2004-03-09 |
Family
ID=21715518
Family Applications (1)
| Application Number | Title | Priority Date | Filing Date |
|---|---|---|---|
| US10/005,373 Expired - Lifetime US6703819B2 (en) | 2001-12-03 | 2001-12-03 | Particle impedance sensor |
Country Status (6)
| Country | Link |
|---|---|
| US (1) | US6703819B2 (en) |
| EP (1) | EP1451566A4 (en) |
| JP (1) | JP2005512042A (en) |
| AU (1) | AU2002365810A1 (en) |
| CA (1) | CA2468862A1 (en) |
| WO (1) | WO2003048728A2 (en) |
Cited By (43)
| Publication number | Priority date | Publication date | Assignee | Title |
|---|---|---|---|---|
| US20040183553A1 (en) * | 2002-10-15 | 2004-09-23 | Post E. Rehmatulla | Three-dimensional characterization using a one-dimensional electrode array |
| US20050129580A1 (en) * | 2003-02-26 | 2005-06-16 | Swinehart Philip R. | Microfluidic chemical reactor for the manufacture of chemically-produced nanoparticles |
| US20060017123A1 (en) * | 2004-07-23 | 2006-01-26 | Cetech Solutions Inc. | Field imager |
| US20060114296A1 (en) * | 2004-05-28 | 2006-06-01 | Board Of Regents | Programmable fluidic processors |
| US7075428B1 (en) | 2003-11-20 | 2006-07-11 | Biowarn Llc | Methodology and apparatus for the detection of biological substances |
| US20060201811A1 (en) * | 2005-03-04 | 2006-09-14 | Hamers Robert J | Apparatus for transport and analysis of particles using dielectrophoresis |
| US20060267570A1 (en) * | 2005-05-26 | 2006-11-30 | Arkin Brian J | Apparatus and method for testing bio-semiconductor integrated circuits |
| US20070139451A1 (en) * | 2005-12-20 | 2007-06-21 | Somasiri Nanayakkara L | Microfluidic device having hydrophilic microchannels |
| US20070159156A1 (en) * | 2005-10-21 | 2007-07-12 | Jun Hu | Coulter counter having a plurality of channels |
| US7417418B1 (en) | 2005-06-14 | 2008-08-26 | Ayliffe Harold E | Thin film sensor |
| US20080309528A1 (en) * | 2007-06-18 | 2008-12-18 | Samsung Electro-Mechanics Co., Ltd. | Device for detecting voltage and analog-to-digital converter (ADC) using the same |
| US20080315860A1 (en) * | 2007-06-19 | 2008-12-25 | Jean-Marc Reymond | Device and method for counting elementary particles emitted by a fluid in a conduit |
| WO2009045343A1 (en) | 2007-09-29 | 2009-04-09 | El Spectra, Llc | Instrumented pipette tip |
| US7520164B1 (en) | 2006-05-05 | 2009-04-21 | E.I. Spectra, Llc | Thin film particle sensor |
| US20090137925A1 (en) * | 2007-11-23 | 2009-05-28 | Divya Cantor | Impedance Spectroscopy Cervix Scanning Apparatus and Method |
| US20090272179A1 (en) * | 2006-05-05 | 2009-11-05 | E.I. Spectra, Llc | Thin film particle sensor |
| US20100006441A1 (en) * | 2006-02-01 | 2010-01-14 | Ecole Polytechnique Federale De Lausanne | Apparatus for manipulating, modifying and characterizing particles in a micro channel |
| US20100063738A1 (en) * | 2007-05-08 | 2010-03-11 | Halliburton Energy Services,K Inc | Fluid conductivity measurement tool and methods |
| US20100140111A1 (en) * | 2007-04-25 | 2010-06-10 | Fraunhofer-Gesellschaft zur Förderung der angewandten Forschung e.V. | Method and arrangement for electrically contacting an object surrounded by a membrane, using an electrode |
| US20100288941A1 (en) * | 2007-11-27 | 2010-11-18 | Ayliffe Harold E | Fluorescence-based pipette instrument |
| US20110030888A1 (en) * | 2008-04-07 | 2011-02-10 | Ayliffe Harold E | Method for manufacturing a microfluidic sensor |
| US7932726B1 (en) * | 2005-08-16 | 2011-04-26 | Environmental Metrology Corporation | Method of design optimization and monitoring the clean/rinse/dry processes of patterned wafers using an electro-chemical residue sensor (ECRS) |
| US20110162439A1 (en) * | 2006-02-02 | 2011-07-07 | Ayliffe Harold E | Reusable thin film particle sensor |
| US20110189714A1 (en) * | 2010-02-03 | 2011-08-04 | Ayliffe Harold E | Microfluidic cell sorter and method |
| US20120208283A1 (en) * | 2011-02-16 | 2012-08-16 | Eugen Gheorghiu | Systems and Methods for Detection and Quantitation of Analytes Using an Oscillating Stimulus |
| CN102661983A (en) * | 2012-04-27 | 2012-09-12 | 苏州市汉微环保科技有限公司 | Value iterative fitting method of electrochemical impedance spectrums of porous electrodes |
| US8329437B1 (en) | 2004-07-29 | 2012-12-11 | E.I. Spectra, Llc | Disposable particle counter cartridge |
| WO2013184168A1 (en) | 2012-06-09 | 2013-12-12 | E.I. Spectra, Llc | Fluorescence flow cytometry |
| US8804105B2 (en) | 2012-03-27 | 2014-08-12 | E. I. Spectra, Llc | Combined optical imaging and electrical detection to characterize particles carried in a fluid |
| DE102013109217A1 (en) * | 2013-08-26 | 2015-02-26 | MBA Instruments GmbH | Measuring probe for measuring the electrical conductivity in low-conductivity liquids |
| US9103760B2 (en) | 2012-06-09 | 2015-08-11 | E. I. Spectra, Llc | Fluorescence flow cytometry device and method |
| US9293311B1 (en) | 2006-02-02 | 2016-03-22 | E. I. Spectra, Llc | Microfluidic interrogation device |
| US9434937B2 (en) | 2011-03-07 | 2016-09-06 | Accelerate Diagnostics, Inc. | Rapid cell purification systems |
| US9452429B2 (en) | 2006-02-02 | 2016-09-27 | E. I. Spectra, Llc | Method for mutiplexed microfluidic bead-based immunoassay |
| US9657327B2 (en) | 2003-07-12 | 2017-05-23 | Accelerate Diagnostics, Inc. | Rapid microbial detection and antimicrobial susceptibility testing |
| US9677109B2 (en) | 2013-03-15 | 2017-06-13 | Accelerate Diagnostics, Inc. | Rapid determination of microbial growth and antimicrobial susceptibility |
| US9841422B2 (en) | 2003-07-12 | 2017-12-12 | Accelerate Diagnostics, Inc. | Sensitive and rapid determination of antimicrobial susceptibility |
| US10023895B2 (en) | 2015-03-30 | 2018-07-17 | Accelerate Diagnostics, Inc. | Instrument and system for rapid microogranism identification and antimicrobial agent susceptibility testing |
| US10254204B2 (en) | 2011-03-07 | 2019-04-09 | Accelerate Diagnostics, Inc. | Membrane-assisted purification |
| US10253355B2 (en) | 2015-03-30 | 2019-04-09 | Accelerate Diagnostics, Inc. | Instrument and system for rapid microorganism identification and antimicrobial agent susceptibility testing |
| EP3480580A1 (en) | 2017-11-03 | 2019-05-08 | Sharp Life Science (EU) Limited | Co-planar micro-impedance cytometry device |
| US11585772B2 (en) | 2019-02-08 | 2023-02-21 | Tallinn University Of Technology | Microfluidic method and device |
| US11808686B2 (en) * | 2017-06-23 | 2023-11-07 | Cellix Limited | System and method for improved identification of particles or cells |
Families Citing this family (38)
| Publication number | Priority date | Publication date | Assignee | Title |
|---|---|---|---|---|
| US20050072677A1 (en) * | 2003-02-18 | 2005-04-07 | Board Of Regents, The University Of Texas System | Dielectric particle focusing |
| EP1528387A3 (en) * | 2003-10-27 | 2006-05-24 | Leister Process Technologies | Method for discrimination of particles in a flow cytometer |
| US7250775B1 (en) * | 2003-11-12 | 2007-07-31 | The Regents Of The University Of California | Microfluidic devices and methods based on measurements of electrical admittance |
| US7514938B2 (en) * | 2004-05-11 | 2009-04-07 | Board Of Regents Of The University And College System Of Nevada, On Behalf Of The University Of Nevada, Reno | Dielectric relaxation spectroscopy apparatus and methods of use |
| US7457709B2 (en) * | 2005-12-20 | 2008-11-25 | Beckman Coulter, Inc. | Systems and methods for particle counting |
| CN101500694B (en) | 2006-05-09 | 2012-07-18 | 先进液体逻辑公司 | Droplet manipulation systems |
| KR100778762B1 (en) | 2006-07-18 | 2007-11-27 | 한국과학기술원 | Automatic particle motion detector in fluidic channel and detecting method thereof |
| WO2008117853A1 (en) * | 2007-03-27 | 2008-10-02 | Ngk Insulators, Ltd. | Fine particle sensor |
| AP2937A (en) | 2007-04-20 | 2014-07-31 | Gen Hospital Corp | Method for counting cells |
| JP4893526B2 (en) | 2007-08-10 | 2012-03-07 | ソニー株式会社 | Cell physical property value measuring method and physical property measuring apparatus |
| WO2009041914A1 (en) * | 2007-09-26 | 2009-04-02 | Agency For Science, Technology And Research | A biosensor and a method for determining the ohmic resistance of a sensing circuit of a biosensor |
| DE102009007060B4 (en) * | 2009-02-02 | 2014-07-17 | Fraunhofer-Gesellschaft zur Förderung der angewandten Forschung e.V. | Statistical method for the resistive determination of the particle density and particle size in liquids and apparatus for carrying out the method |
| WO2011083581A1 (en) * | 2010-01-08 | 2011-07-14 | トヨタ自動車株式会社 | Particle detection device |
| IT1400195B1 (en) * | 2010-04-15 | 2013-05-24 | Carpigiani Group Ali Spa | BACTERIAL CHARGE CONTROL DEVICE FOR A LIQUID OR SEMILIQUID FOOD PRODUCT. |
| DE102010029575A1 (en) | 2010-06-01 | 2011-12-01 | Robert Bosch Gmbh | Method and particle sensor for detecting particles in an exhaust gas stream |
| US9170138B2 (en) * | 2010-10-01 | 2015-10-27 | The Board Of Trustees Of The Leland Stanford Junior University | Enhanced microfluidic electromagnetic measurements |
| ITBO20110165A1 (en) | 2011-03-30 | 2012-10-01 | Carpigiani Group Ali Spa | MACHINE FOR THE PRODUCTION AND DISTRIBUTION OF SEMILIATED AND / OR SEMISOLIDED PRODUCTS. |
| WO2012154745A2 (en) * | 2011-05-09 | 2012-11-15 | Advanced Liquid Logic, Inc. | Microfluidic feedback using impedance detection |
| CN103084229B (en) * | 2012-01-16 | 2015-09-23 | 中国科学院深圳先进技术研究院 | Micro-fluidic chip, blood cell analysis system and blood cell analysis method |
| EP2890240A1 (en) | 2012-08-29 | 2015-07-08 | Yissum Research Development Company of the Hebrew University of Jerusalem Ltd. | System and method for determining properties of liquids |
| US9915599B2 (en) | 2013-02-08 | 2018-03-13 | Sony Corporation | Microparticle analysis apparatus and microparticle analysis system |
| EP2781906B1 (en) * | 2013-03-19 | 2021-08-18 | IMEC vzw | Method for identifying cells |
| GB201306913D0 (en) | 2013-04-16 | 2013-05-29 | Univ Southampton | A method of electrically measuring the size of individual particles flowing in a liquid |
| GB201306914D0 (en) | 2013-04-16 | 2013-05-29 | Univ Southampton | Apparatus for electrically measuring individual particles flowing in a liquid |
| ES2716898T3 (en) * | 2013-10-15 | 2019-06-17 | Ecole Polytechnique Fed Lausanne Epfl | Detector tip with electric impedance sensor |
| WO2015091777A1 (en) | 2013-12-19 | 2015-06-25 | Basf Se | Process for the preparation of an aliphatic or partially aromatic polyamide |
| EP2915423B1 (en) * | 2014-03-06 | 2021-08-11 | Amphasys AG | Method for the determination of pollen viability and maturation grade of a pollen population |
| EP3247998B1 (en) | 2015-01-21 | 2021-09-22 | SBT Instruments A/S | Microfluidic particle analysis device |
| US11633737B2 (en) * | 2016-04-20 | 2023-04-25 | Cellix Limited | Microfluidic chip for focussing a stream of particulate containing fluid |
| US11680957B2 (en) | 2018-02-12 | 2023-06-20 | Hewlett-Packard Development Company, L.P. | Microfluidic flow sensor |
| WO2019156711A1 (en) | 2018-02-12 | 2019-08-15 | Hewlett-Packard Development Company, L.P. | Devices to measure flow rates with movable elements |
| WO2019236682A1 (en) | 2018-06-05 | 2019-12-12 | Chronus Health, Inc. | Devices, cartridge, and sensors for controlling liquid movement and analyzing biological samples |
| US11268932B2 (en) * | 2019-04-16 | 2022-03-08 | Raytheon Technologies Corporation | Oil debris monitor to detect mechanical failures in high noise environments |
| CN110988975B (en) * | 2019-12-13 | 2021-12-24 | 西北核技术研究院 | MV-level voltage peak value measuring probe and manufacturing method thereof |
| US20220126291A1 (en) * | 2020-10-23 | 2022-04-28 | Applied Materials, Inc. | High throughput compact microfluidic cell counter |
| CN112986107B (en) * | 2021-02-03 | 2022-03-11 | 东南大学 | Cell flow type electrical impedance detection method based on asymmetric sinusoidal flow channel |
| TW202334633A (en) * | 2022-01-21 | 2023-09-01 | 日商堀場製作所股份有限公司 | Dilution mechanism, particle diameter distribution measurement system, particle diameter distribution measurement method, and particle diameter distribution measurement computer program product |
| WO2023199234A1 (en) * | 2022-04-12 | 2023-10-19 | Seed Biosciences Sa | System and method for impedance-based analysis of biological entities |
Citations (35)
| Publication number | Priority date | Publication date | Assignee | Title |
|---|---|---|---|---|
| US4940976A (en) * | 1988-02-05 | 1990-07-10 | Utilicom Inc. | Automated remote water meter readout system |
| EP0513064A1 (en) | 1990-01-30 | 1992-11-19 | P & B Sciences Ltd | Manipulation of solid, semi-solid or liquid materials. |
| WO1993016383A1 (en) | 1992-02-08 | 1993-08-19 | Genera Technologies Limited | Methods of analysis |
| WO1994016821A1 (en) | 1993-01-21 | 1994-08-04 | Scientific Generics Limited | Methods of analysis/separation |
| US5454472A (en) | 1991-08-19 | 1995-10-03 | Fraunhofer Gesellschaft Zur Forderung Der Angewandten Forschung E.V. | Method of continuously separating mixtures of microscopic dielectric particles and apparatus for carrying through this method |
| EP0691891A1 (en) | 1993-03-31 | 1996-01-17 | Btg International Limited | Apparatus for separating by dielectrophoresis |
| US5569591A (en) | 1990-08-03 | 1996-10-29 | University College Of Wales Aberystwyth | Analytical or monitoring apparatus and method |
| US5569367A (en) | 1992-04-16 | 1996-10-29 | British Technology Group Limited | Apparatus for separating a mixture |
| US5571401A (en) | 1995-03-27 | 1996-11-05 | California Institute Of Technology | Sensor arrays for detecting analytes in fluids |
| US5580435A (en) | 1994-06-10 | 1996-12-03 | The Board Of Trustees Of The Leland Stanford Junior University | System for detecting components of a sample in electrophoretic separation |
| WO1997034689A1 (en) | 1996-03-18 | 1997-09-25 | University College Of North Wales | Apparatus with electrode arrays for carrying out chemical, physical or physico-chemical reactions |
| US5680708A (en) * | 1996-01-16 | 1997-10-28 | Precision Navigation, Inc. | Temperature compensated tilt sensor |
| US5683569A (en) | 1996-02-28 | 1997-11-04 | Motorola, Inc. | Method of sensing a chemical and sensor therefor |
| US5694343A (en) * | 1993-07-09 | 1997-12-02 | Mitsubishi Denki Kabushiki Kaisha | System for simulating properties of a material having periodically repeated structure |
| WO1998004355A1 (en) | 1996-07-26 | 1998-02-05 | Btg International Limited | Apparatus and method for testing particles using dielectrophoresis |
| US5858192A (en) | 1996-10-18 | 1999-01-12 | Board Of Regents, The University Of Texas System | Method and apparatus for manipulation using spiral electrodes |
| US5888370A (en) | 1996-02-23 | 1999-03-30 | Board Of Regents, The University Of Texas System | Method and apparatus for fractionation using generalized dielectrophoresis and field flow fractionation |
| US5965452A (en) | 1996-07-09 | 1999-10-12 | Nanogen, Inc. | Multiplexed active biologic array |
| US5993630A (en) | 1996-01-31 | 1999-11-30 | Board Of Regents The University Of Texas System | Method and apparatus for fractionation using conventional dielectrophoresis and field flow fractionation |
| WO1999062622A1 (en) | 1998-05-29 | 1999-12-09 | Industrial Research Limited | Method and apparatus for concentrating and/or positioning particles or cells |
| US6017696A (en) | 1993-11-01 | 2000-01-25 | Nanogen, Inc. | Methods for electronic stringency control for molecular biological analysis and diagnostics |
| US6084503A (en) | 1995-04-18 | 2000-07-04 | Siemens Aktiengesellschaft | Radio-interrogated surface-wave technology sensor |
| US6093308A (en) | 1995-03-27 | 2000-07-25 | California Institute Of Technology | Sensors for detecting analytes in fluids |
| US6099803A (en) | 1994-07-07 | 2000-08-08 | Nanogen, Inc. | Advanced active electronic devices for molecular biological analysis and diagnostics |
| US6113768A (en) | 1993-12-23 | 2000-09-05 | Fraunhofer-Gesellschaft Zur Forderung Der Angewandten Forschung E.V. | Ultraminiaturized surface structure with controllable adhesion |
| US6129828A (en) | 1996-09-06 | 2000-10-10 | Nanogen, Inc. | Apparatus and methods for active biological sample preparation |
| US6149789A (en) | 1990-10-31 | 2000-11-21 | Fraunhofer Gesellschaft Zur Forderung Der Angewandten Forschung E.V. | Process for manipulating microscopic, dielectric particles and a device therefor |
| WO2000069565A1 (en) | 1999-05-18 | 2000-11-23 | Silicon Biosystems S.R.L. | Method and apparatus for the manipulation of particles by means of dielectrophoresis |
| US6169394B1 (en) | 1998-09-18 | 2001-01-02 | University Of The Utah Research Foundation | Electrical detector for micro-analysis systems |
| US6224745B1 (en) | 1995-04-27 | 2001-05-01 | Private Universitat | Process and device for continuously detecting at least one substance in a gaseous or liquid mixture by means of a sensor electrode |
| US6225059B1 (en) | 1993-11-01 | 2001-05-01 | Nanogen, Inc. | Advanced active electronic devices including collection electrodes for molecular biological analysis and diagnostics |
| US6294063B1 (en) | 1999-02-12 | 2001-09-25 | Board Of Regents, The University Of Texas System | Method and apparatus for programmable fluidic processing |
| US6426615B1 (en) * | 1998-02-13 | 2002-07-30 | Shailesh Mehta | Apparatus and method for analyzing particles |
| US6437551B1 (en) * | 1999-11-02 | 2002-08-20 | The Regents Of The University Of California | Microfabricated AC impedance sensor |
| US6466021B1 (en) * | 1998-05-07 | 2002-10-15 | Apti, Inc. | Deep underground imaging utilizing resistivity regularization for magnetotelluric processing |
Family Cites Families (3)
| Publication number | Priority date | Publication date | Assignee | Title |
|---|---|---|---|---|
| DE3518186A1 (en) * | 1985-05-21 | 1986-11-27 | Fraunhofer-Gesellschaft zur Förderung der angewandten Forschung e.V., 8000 München | Device for detecting the effective dielectric constant of a medium, particularly for determining the water content in a filled container for oil or alcohol |
| DD290952A5 (en) * | 1989-12-27 | 1991-06-13 | Brennstoffinstitut Freiberg,De | ARRANGEMENT FOR DETERMINING THE FLOW SPEED OF TWO AND MULTIPLE PHASE FLOWS IN TUBE SYSTEMS |
| US5682788A (en) * | 1995-07-12 | 1997-11-04 | Netzer; Yishay | Differential windshield capacitive moisture sensor |
-
2001
- 2001-12-03 US US10/005,373 patent/US6703819B2/en not_active Expired - Lifetime
-
2002
- 2002-12-02 AU AU2002365810A patent/AU2002365810A1/en not_active Abandoned
- 2002-12-02 WO PCT/US2002/038424 patent/WO2003048728A2/en active Application Filing
- 2002-12-02 EP EP02804483A patent/EP1451566A4/en not_active Withdrawn
- 2002-12-02 CA CA002468862A patent/CA2468862A1/en not_active Abandoned
- 2002-12-02 JP JP2003549874A patent/JP2005512042A/en not_active Withdrawn
Patent Citations (44)
| Publication number | Priority date | Publication date | Assignee | Title |
|---|---|---|---|---|
| US4940976A (en) * | 1988-02-05 | 1990-07-10 | Utilicom Inc. | Automated remote water meter readout system |
| EP0513064A1 (en) | 1990-01-30 | 1992-11-19 | P & B Sciences Ltd | Manipulation of solid, semi-solid or liquid materials. |
| US5569591A (en) | 1990-08-03 | 1996-10-29 | University College Of Wales Aberystwyth | Analytical or monitoring apparatus and method |
| US6149789A (en) | 1990-10-31 | 2000-11-21 | Fraunhofer Gesellschaft Zur Forderung Der Angewandten Forschung E.V. | Process for manipulating microscopic, dielectric particles and a device therefor |
| US5454472A (en) | 1991-08-19 | 1995-10-03 | Fraunhofer Gesellschaft Zur Forderung Der Angewandten Forschung E.V. | Method of continuously separating mixtures of microscopic dielectric particles and apparatus for carrying through this method |
| WO1993016383A1 (en) | 1992-02-08 | 1993-08-19 | Genera Technologies Limited | Methods of analysis |
| EP0625267A1 (en) | 1992-02-08 | 1994-11-23 | Genera Technologies Limited | Methods of analysis |
| US5569367A (en) | 1992-04-16 | 1996-10-29 | British Technology Group Limited | Apparatus for separating a mixture |
| US5993631A (en) | 1993-01-21 | 1999-11-30 | Scientific Generics Limited | Methods of analysis/separation |
| WO1994016821A1 (en) | 1993-01-21 | 1994-08-04 | Scientific Generics Limited | Methods of analysis/separation |
| US5653859A (en) | 1993-01-21 | 1997-08-05 | Parton; Adrian | Methods of analysis/separation |
| EP0680380A1 (en) | 1993-01-21 | 1995-11-08 | Scientific Generics Ltd | Methods of analysis/separation |
| US5814200A (en) | 1993-03-31 | 1998-09-29 | British Technology Group Limited | Apparatus for separating by dielectrophoresis |
| EP0691891A1 (en) | 1993-03-31 | 1996-01-17 | Btg International Limited | Apparatus for separating by dielectrophoresis |
| US5694343A (en) * | 1993-07-09 | 1997-12-02 | Mitsubishi Denki Kabushiki Kaisha | System for simulating properties of a material having periodically repeated structure |
| US6017696A (en) | 1993-11-01 | 2000-01-25 | Nanogen, Inc. | Methods for electronic stringency control for molecular biological analysis and diagnostics |
| US6225059B1 (en) | 1993-11-01 | 2001-05-01 | Nanogen, Inc. | Advanced active electronic devices including collection electrodes for molecular biological analysis and diagnostics |
| US6113768A (en) | 1993-12-23 | 2000-09-05 | Fraunhofer-Gesellschaft Zur Forderung Der Angewandten Forschung E.V. | Ultraminiaturized surface structure with controllable adhesion |
| US5580435A (en) | 1994-06-10 | 1996-12-03 | The Board Of Trustees Of The Leland Stanford Junior University | System for detecting components of a sample in electrophoretic separation |
| US6099803A (en) | 1994-07-07 | 2000-08-08 | Nanogen, Inc. | Advanced active electronic devices for molecular biological analysis and diagnostics |
| US6093308A (en) | 1995-03-27 | 2000-07-25 | California Institute Of Technology | Sensors for detecting analytes in fluids |
| US6010616A (en) | 1995-03-27 | 2000-01-04 | California Institute Of Technology | Sensor arrays for detecting analytes in fluids |
| US5571401A (en) | 1995-03-27 | 1996-11-05 | California Institute Of Technology | Sensor arrays for detecting analytes in fluids |
| US6084503A (en) | 1995-04-18 | 2000-07-04 | Siemens Aktiengesellschaft | Radio-interrogated surface-wave technology sensor |
| US6224745B1 (en) | 1995-04-27 | 2001-05-01 | Private Universitat | Process and device for continuously detecting at least one substance in a gaseous or liquid mixture by means of a sensor electrode |
| US5680708A (en) * | 1996-01-16 | 1997-10-28 | Precision Navigation, Inc. | Temperature compensated tilt sensor |
| US5993630A (en) | 1996-01-31 | 1999-11-30 | Board Of Regents The University Of Texas System | Method and apparatus for fractionation using conventional dielectrophoresis and field flow fractionation |
| US5888370A (en) | 1996-02-23 | 1999-03-30 | Board Of Regents, The University Of Texas System | Method and apparatus for fractionation using generalized dielectrophoresis and field flow fractionation |
| US5993632A (en) | 1996-02-23 | 1999-11-30 | Board Of Regents The University Of Texas System | Method and apparatus for fractionation using generalized dielectrophoresis and field flow fractionation |
| US6287832B1 (en) | 1996-02-23 | 2001-09-11 | Board Of Regents, The University Of Texas System | Method and apparatus for fractionation using generalized dielectrophoresis and field flow fractionation |
| US5683569A (en) | 1996-02-28 | 1997-11-04 | Motorola, Inc. | Method of sensing a chemical and sensor therefor |
| EP0898493A1 (en) | 1996-03-18 | 1999-03-03 | University Of Wales, Bangor | Apparatus with electrode arrays for carrying out chemical, physical or physico-chemical reactions |
| WO1997034689A1 (en) | 1996-03-18 | 1997-09-25 | University College Of North Wales | Apparatus with electrode arrays for carrying out chemical, physical or physico-chemical reactions |
| US5965452A (en) | 1996-07-09 | 1999-10-12 | Nanogen, Inc. | Multiplexed active biologic array |
| WO1998004355A1 (en) | 1996-07-26 | 1998-02-05 | Btg International Limited | Apparatus and method for testing particles using dielectrophoresis |
| US6129828A (en) | 1996-09-06 | 2000-10-10 | Nanogen, Inc. | Apparatus and methods for active biological sample preparation |
| US5858192A (en) | 1996-10-18 | 1999-01-12 | Board Of Regents, The University Of Texas System | Method and apparatus for manipulation using spiral electrodes |
| US6426615B1 (en) * | 1998-02-13 | 2002-07-30 | Shailesh Mehta | Apparatus and method for analyzing particles |
| US6466021B1 (en) * | 1998-05-07 | 2002-10-15 | Apti, Inc. | Deep underground imaging utilizing resistivity regularization for magnetotelluric processing |
| WO1999062622A1 (en) | 1998-05-29 | 1999-12-09 | Industrial Research Limited | Method and apparatus for concentrating and/or positioning particles or cells |
| US6169394B1 (en) | 1998-09-18 | 2001-01-02 | University Of The Utah Research Foundation | Electrical detector for micro-analysis systems |
| US6294063B1 (en) | 1999-02-12 | 2001-09-25 | Board Of Regents, The University Of Texas System | Method and apparatus for programmable fluidic processing |
| WO2000069565A1 (en) | 1999-05-18 | 2000-11-23 | Silicon Biosystems S.R.L. | Method and apparatus for the manipulation of particles by means of dielectrophoresis |
| US6437551B1 (en) * | 1999-11-02 | 2002-08-20 | The Regents Of The University Of California | Microfabricated AC impedance sensor |
Non-Patent Citations (30)
| Title |
|---|
| "Bangor biochip heads for California," EPSRC Home Page: http://www.epsrc.ac.uk/documents/about13 epsrc/corporate_publi ../bangor.ht, article printed on Dec. 26, 2000. |
| "Diagnostic dielectrophoresis-on-a-chip," Science/Technology, 77(8):32, 1999. Article printed from http://www.pubs.acs.org/hotartcl/cenear/99022/7708scitobox.2.html on Dec. 26, 2000. |
| Allsopp et al., "Impedance technique for measuring dielectrophoretic collection of microbiological particles," J. Phys. D: Appl. Phys., 32:1066-1074, 1999. |
| Balachandran et al., "Electrostatic atomization of conducting liquids using AC superimposed on DC fields," IEEE Transactions on Industry Applications, 30(4):850-854, 1994. |
| Cheng et al., "Preparation and hybridization analysis of DNA/RNA form E. coli on microfabricated bioelectronic chips," Nature Biotechnology, 16:541-546, 1998. |
| El-Kishky and Gorur, "Electric field and energy computation on wet insulating surfaces," IEEE Transaction on Dielectrics and Electrical Insulation, 3(4):587-593, 1996. |
| El-Kishky and Gorur, "Electric field computation on an insulating surface with discrete water droplets," IEEE Transactions on Dielectrics and Electrical Insulation, 3(3):450-456, 1996. |
| Fuller et al., "Microfabricated multi-frequency particle impedance characterization system," Micro Total Analysis System, van den Berg et al. (eds.), 265-268, 2000. |
| Galicki et al., "Electrohydrodynamic atomization of dielectric fluids," Conference on Electrical Insulation and Dielectric Phenomena, IEEE Annual Report, 365-368, 1996. |
| Gawad et al., "Impedance spectroscopy cell analysis in microchannels," Micro Total Analysis Systems, 253-255, 2001. |
| Gawad et al., "Micronarcined impedance spectroscopy flow cytometer for cell analysis and particle sizing," Lab on a Chip, 1:76-82, 2001. |
| He et al., "Droplet charge-to-mass ratio measurement in an EHD liquid-liquid extraction system," IEEE Transactions on Industry Applications, 32(1):146-154, 1996. |
| Higashiyama et al., "Behavior of water droplets located on a hydrophobic insulating plate under DC field," IEEE, 1808-1813, 1998. |
| Hoffman and Britt, "Flow-system measurement of a cell impedance properties," J. Histochemistry and Cytochemistry, 27:234-240, 1979. |
| Hoffman et al., "Flow cytometric electronic direct current volume and radiofrequency impedance measurements of single cells and particles," Cytometry, 1:377-384, 1981. |
| Hosokawa et al., "Handling of picoliter liquid samples in a Poly(dimethylsiloxane)-based microfluidic device," Anal. Chem., 71:4781-4785, 1999. |
| Huneiti et al., "Harmonic Spraying of conducting liquids employing AC-DC electric fields," IEEE Transactions on Industry Applications, 34(2):279-285, 1998. |
| Jones, Electromechanics of Particles, Cambridge University Press, Cambridge, Chapter 3:34-82, 1995. |
| Kashyap and Gratzl, "Electrochemistry in microscopic domains. 1. The electrochemical cell and its voltammetric and amperometric response," Anal. Chem., 70:1468-1476, 1998. |
| Kloes and Koenig, "Basic investigation of the performance of droplets on electrically stressed polymer surfaces," Conference on Electrical Insulation and Dielectric Phenomena, IEEE Annual Report, 374-377, 1997. |
| Lee and Kim, "Liquid micromotor driven by continuous electrowetting," IEEE, 538-543, 1998. |
| Metwally, "Electrostatic charging and modeling of aqueous sprays and fission of droplets," Conference on Electrical Insulation and Dielectric Phenomena, IEEE Annual Report, 117-120, 1996. |
| Mizuno et al., "Behavior of water droplets on silicone rubber sheet under AC voltage application," IEEE, 96-99, 1998. |
| Moesner et al., "Electrostatic devices for particle microhandling," IEEE Transactions on Industry Applications, 35(3):530-536, 1999. |
| Sathuvalli and Bayazitoglu, "The lorentz forces on an electrically conducting sphere in an alternating magnetic field," IEEE Transactions on Magnetics, 32(2):386-399, 1996. |
| Sato et al., "Experimental investigation of droplet formation mechanisms by electrostatic dispersion in a liquid-liquid system," IEEE Transactions on Industry Applications, 33(6):1527-1534, 1997. |
| Sato et al., "Production of oil/water type uniformly sized droplets using a convergent AC elctric field," IEEE Transactions on Industry Applications, 32(1):138-145, 1996. |
| Wang et al., "A theoretical method of electrical field analysis for dielectrophoretic electrode arrays using Green's theorum," J. Phys. D: Appl. Phys., 29:1649-1660, 1996. |
| Wang et al., "Separation of polystyrene microbeads using dielectrophoretic/gravitational field-flow-fractionation," Biophysical Journal, 74:2689-2701, 1998. |
| Washizu, "Electrostatic actuation of liquid droplets for microreactor applications," IEEE Transactions on Industry Applications, 34(4):732-737, 1998. |
Cited By (77)
| Publication number | Priority date | Publication date | Assignee | Title |
|---|---|---|---|---|
| US6891382B2 (en) * | 2002-10-15 | 2005-05-10 | Massachusetts Instiute Of Technology | Three-dimensional characterization using a one-dimensional electrode array |
| US20040183553A1 (en) * | 2002-10-15 | 2004-09-23 | Post E. Rehmatulla | Three-dimensional characterization using a one-dimensional electrode array |
| US20050129580A1 (en) * | 2003-02-26 | 2005-06-16 | Swinehart Philip R. | Microfluidic chemical reactor for the manufacture of chemically-produced nanoparticles |
| US9657327B2 (en) | 2003-07-12 | 2017-05-23 | Accelerate Diagnostics, Inc. | Rapid microbial detection and antimicrobial susceptibility testing |
| US11054420B2 (en) | 2003-07-12 | 2021-07-06 | Accelerate Diagnostics, Inc. | Sensitive and rapid determination of antimicrobial susceptibility |
| US9841422B2 (en) | 2003-07-12 | 2017-12-12 | Accelerate Diagnostics, Inc. | Sensitive and rapid determination of antimicrobial susceptibility |
| US7075428B1 (en) | 2003-11-20 | 2006-07-11 | Biowarn Llc | Methodology and apparatus for the detection of biological substances |
| US20060114296A1 (en) * | 2004-05-28 | 2006-06-01 | Board Of Regents | Programmable fluidic processors |
| US10413912B2 (en) | 2004-05-28 | 2019-09-17 | The Board Of Regents Of The University Of Texas System | Programmable fluidic processors |
| US8974652B2 (en) | 2004-05-28 | 2015-03-10 | Board Of Regents, The University Of Texas System | Programmable fluidic processors |
| US7405562B2 (en) | 2004-07-23 | 2008-07-29 | Yehya Ghallab | Magnetic field imaging detection apparatus |
| US20070241748A1 (en) * | 2004-07-23 | 2007-10-18 | Cetech Solutions Inc. | Field imager |
| US20060017123A1 (en) * | 2004-07-23 | 2006-01-26 | Cetech Solutions Inc. | Field imager |
| US8329437B1 (en) | 2004-07-29 | 2012-12-11 | E.I. Spectra, Llc | Disposable particle counter cartridge |
| US20060201811A1 (en) * | 2005-03-04 | 2006-09-14 | Hamers Robert J | Apparatus for transport and analysis of particles using dielectrophoresis |
| US7704362B2 (en) | 2005-03-04 | 2010-04-27 | Wisconsin Alumni Research Foundation | Apparatus for transport and analysis of particles using dielectrophoresis |
| US20060267570A1 (en) * | 2005-05-26 | 2006-11-30 | Arkin Brian J | Apparatus and method for testing bio-semiconductor integrated circuits |
| US7417418B1 (en) | 2005-06-14 | 2008-08-26 | Ayliffe Harold E | Thin film sensor |
| US7579823B1 (en) | 2005-06-14 | 2009-08-25 | E. I. Spectra, Llc | Thin film sensor |
| US7932726B1 (en) * | 2005-08-16 | 2011-04-26 | Environmental Metrology Corporation | Method of design optimization and monitoring the clean/rinse/dry processes of patterned wafers using an electro-chemical residue sensor (ECRS) |
| US20070159156A1 (en) * | 2005-10-21 | 2007-07-12 | Jun Hu | Coulter counter having a plurality of channels |
| US20090066315A1 (en) * | 2005-10-21 | 2009-03-12 | The University Of Akron | Dynamic modulation for multiplexation of microfluidic and nanofluidic based biosensors |
| US7397232B2 (en) * | 2005-10-21 | 2008-07-08 | The University Of Akron | Coulter counter having a plurality of channels |
| US7777476B2 (en) | 2005-10-21 | 2010-08-17 | The University Of Akron | Dynamic modulation for multiplexation of microfluidic and nanofluidic based biosensors |
| US20070139451A1 (en) * | 2005-12-20 | 2007-06-21 | Somasiri Nanayakkara L | Microfluidic device having hydrophilic microchannels |
| US20100006441A1 (en) * | 2006-02-01 | 2010-01-14 | Ecole Polytechnique Federale De Lausanne | Apparatus for manipulating, modifying and characterizing particles in a micro channel |
| US9995668B2 (en) * | 2006-02-01 | 2018-06-12 | Ecole polytechnique fédérale de Lausanne (EPFL) | Apparatus for manipulating, modifying and characterizing particles in a micro channel |
| US8616048B2 (en) | 2006-02-02 | 2013-12-31 | E I Spectra, LLC | Reusable thin film particle sensor |
| US9952135B2 (en) | 2006-02-02 | 2018-04-24 | E. I. Spectra, Llc | Microfluidic interrogation device |
| US9452429B2 (en) | 2006-02-02 | 2016-09-27 | E. I. Spectra, Llc | Method for mutiplexed microfluidic bead-based immunoassay |
| US20110162439A1 (en) * | 2006-02-02 | 2011-07-07 | Ayliffe Harold E | Reusable thin film particle sensor |
| US9293311B1 (en) | 2006-02-02 | 2016-03-22 | E. I. Spectra, Llc | Microfluidic interrogation device |
| US20090272179A1 (en) * | 2006-05-05 | 2009-11-05 | E.I. Spectra, Llc | Thin film particle sensor |
| US7520164B1 (en) | 2006-05-05 | 2009-04-21 | E.I. Spectra, Llc | Thin film particle sensor |
| US8171778B2 (en) | 2006-05-05 | 2012-05-08 | E I Spectra, LLC | Thin film particle sensor |
| US20100140111A1 (en) * | 2007-04-25 | 2010-06-10 | Fraunhofer-Gesellschaft zur Förderung der angewandten Forschung e.V. | Method and arrangement for electrically contacting an object surrounded by a membrane, using an electrode |
| US20100063738A1 (en) * | 2007-05-08 | 2010-03-11 | Halliburton Energy Services,K Inc | Fluid conductivity measurement tool and methods |
| US8538701B2 (en) | 2007-05-08 | 2013-09-17 | Halliburton Energy Services, Inc. | Fluid conductivity measurement tool and methods |
| US7532143B2 (en) * | 2007-06-18 | 2009-05-12 | Samsung Electro-Mechanics Co., Ltd. | Device for detecting voltage and analog-to-digital converter (ADC) using the same |
| US20080309528A1 (en) * | 2007-06-18 | 2008-12-18 | Samsung Electro-Mechanics Co., Ltd. | Device for detecting voltage and analog-to-digital converter (ADC) using the same |
| US20080315860A1 (en) * | 2007-06-19 | 2008-12-25 | Jean-Marc Reymond | Device and method for counting elementary particles emitted by a fluid in a conduit |
| US7821248B2 (en) * | 2007-06-19 | 2010-10-26 | Commissariat A L'energie Atomique | Device and method for counting elementary particles emitted by a fluid in a conduit |
| US8015887B2 (en) | 2007-09-29 | 2011-09-13 | E I Spectra, LLC | Instrumented pipette tip |
| US20100199788A1 (en) * | 2007-09-29 | 2010-08-12 | Ayliffe Harold E | Instrumented pipette tip |
| WO2009045343A1 (en) | 2007-09-29 | 2009-04-09 | El Spectra, Llc | Instrumented pipette tip |
| US20090137925A1 (en) * | 2007-11-23 | 2009-05-28 | Divya Cantor | Impedance Spectroscopy Cervix Scanning Apparatus and Method |
| US20100288941A1 (en) * | 2007-11-27 | 2010-11-18 | Ayliffe Harold E | Fluorescence-based pipette instrument |
| US8608891B2 (en) | 2008-04-07 | 2013-12-17 | Ei Spectra, Llc | Method for manufacturing a microfluidic sensor |
| US20110030888A1 (en) * | 2008-04-07 | 2011-02-10 | Ayliffe Harold E | Method for manufacturing a microfluidic sensor |
| US8182635B2 (en) | 2008-04-07 | 2012-05-22 | E I Spectra, LLC | Method for manufacturing a microfluidic sensor |
| US20110189714A1 (en) * | 2010-02-03 | 2011-08-04 | Ayliffe Harold E | Microfluidic cell sorter and method |
| US20120208283A1 (en) * | 2011-02-16 | 2012-08-16 | Eugen Gheorghiu | Systems and Methods for Detection and Quantitation of Analytes Using an Oscillating Stimulus |
| US9315855B2 (en) * | 2011-02-16 | 2016-04-19 | Centrul International De Biodinamica | Systems and methods for detection and quantitation of analytes using an oscillating stimulus |
| US10254204B2 (en) | 2011-03-07 | 2019-04-09 | Accelerate Diagnostics, Inc. | Membrane-assisted purification |
| US10202597B2 (en) | 2011-03-07 | 2019-02-12 | Accelerate Diagnostics, Inc. | Rapid cell purification systems |
| US9714420B2 (en) | 2011-03-07 | 2017-07-25 | Accelerate Diagnostics, Inc. | Rapid cell purification systems |
| US9434937B2 (en) | 2011-03-07 | 2016-09-06 | Accelerate Diagnostics, Inc. | Rapid cell purification systems |
| US8804105B2 (en) | 2012-03-27 | 2014-08-12 | E. I. Spectra, Llc | Combined optical imaging and electrical detection to characterize particles carried in a fluid |
| CN102661983A (en) * | 2012-04-27 | 2012-09-12 | 苏州市汉微环保科技有限公司 | Value iterative fitting method of electrochemical impedance spectrums of porous electrodes |
| US9103760B2 (en) | 2012-06-09 | 2015-08-11 | E. I. Spectra, Llc | Fluorescence flow cytometry device and method |
| US9945770B2 (en) * | 2012-06-09 | 2018-04-17 | E. I. Spectra, Llc | Fluorescence flow cytometry device and method |
| US8735853B2 (en) * | 2012-06-09 | 2014-05-27 | E.I. Spectra, Llc | Fluorescence flow cytometry |
| WO2013184168A1 (en) | 2012-06-09 | 2013-12-12 | E.I. Spectra, Llc | Fluorescence flow cytometry |
| US9528926B2 (en) * | 2012-06-09 | 2016-12-27 | Ei Spectra, Llc | Fluorescence flow cytometry device and method |
| US11603550B2 (en) | 2013-03-15 | 2023-03-14 | Accelerate Diagnostics, Inc. | Rapid determination of microbial growth and antimicrobial susceptibility |
| US9677109B2 (en) | 2013-03-15 | 2017-06-13 | Accelerate Diagnostics, Inc. | Rapid determination of microbial growth and antimicrobial susceptibility |
| DE102013109217A1 (en) * | 2013-08-26 | 2015-02-26 | MBA Instruments GmbH | Measuring probe for measuring the electrical conductivity in low-conductivity liquids |
| DE102013109217B4 (en) | 2013-08-26 | 2022-02-24 | MBA Instruments GmbH | Measuring probe for measuring electrical conductivity in low-conductivity liquids |
| US10273521B2 (en) | 2015-03-30 | 2019-04-30 | Accelerate Diagnostics, Inc. | Instrument and system for rapid microorganism identification and antimicrobial agent susceptibility testing |
| US10619180B2 (en) | 2015-03-30 | 2020-04-14 | Accelerate Diagnostics, Inc. | Instrument and system for rapid microorganism identification and antimicrobial agent susceptibility testing |
| US10669566B2 (en) | 2015-03-30 | 2020-06-02 | Accelerate Giagnostics, Inc. | Instrument and system for rapid microorganism identification and antimicrobial agent susceptibility testing |
| US10253355B2 (en) | 2015-03-30 | 2019-04-09 | Accelerate Diagnostics, Inc. | Instrument and system for rapid microorganism identification and antimicrobial agent susceptibility testing |
| US10023895B2 (en) | 2015-03-30 | 2018-07-17 | Accelerate Diagnostics, Inc. | Instrument and system for rapid microogranism identification and antimicrobial agent susceptibility testing |
| US11808686B2 (en) * | 2017-06-23 | 2023-11-07 | Cellix Limited | System and method for improved identification of particles or cells |
| EP3480580A1 (en) | 2017-11-03 | 2019-05-08 | Sharp Life Science (EU) Limited | Co-planar micro-impedance cytometry device |
| US10816453B2 (en) | 2017-11-03 | 2020-10-27 | Sharp Life Science (Eu) Limited | Co-planar micro-impedance cytometry device |
| US11585772B2 (en) | 2019-02-08 | 2023-02-21 | Tallinn University Of Technology | Microfluidic method and device |
Also Published As
| Publication number | Publication date |
|---|---|
| US20030102854A1 (en) | 2003-06-05 |
| WO2003048728A3 (en) | 2003-11-20 |
| JP2005512042A (en) | 2005-04-28 |
| WO2003048728A2 (en) | 2003-06-12 |
| AU2002365810A1 (en) | 2003-06-17 |
| EP1451566A2 (en) | 2004-09-01 |
| EP1451566A4 (en) | 2012-02-22 |
| CA2468862A1 (en) | 2003-06-12 |
Similar Documents
| Publication | Publication Date | Title |
|---|---|---|
| US6703819B2 (en) | Particle impedance sensor | |
| Daguerre et al. | Positional dependence of particles and cells in microfluidic electrical impedance flow cytometry: Origin, challenges and opportunities | |
| US10222314B2 (en) | Flow channel device, complex permittivity measuring apparatus, and dielectric cytometry system | |
| Gawad et al. | Micromachined impedance spectroscopy flow cytometer for cell analysis and particle sizing | |
| Sun et al. | Single-cell microfluidic impedance cytometry: a review | |
| Kozak et al. | Advances in resistive pulse sensors: devices bridging the void between molecular and microscopic detection | |
| Errico et al. | Mitigating positional dependence in coplanar electrode Coulter-type microfluidic devices | |
| Jagtiani et al. | A microfluidic multichannel resistive pulse sensor using frequency division multiplexing for high throughput counting of micro particles | |
| Nikolic-Jaric et al. | Microwave frequency sensor for detection of biological cells in microfluidic channels | |
| Zhu et al. | Microfluidic impedance cytometry for single-cell sensing: Review on electrode configurations | |
| US9110010B2 (en) | Electrical detection using confined fluids | |
| Sun et al. | Broadband single cell impedance spectroscopy using maximum length sequences: theoretical analysis and practical considerations | |
| Grenvall et al. | Two-dimensional acoustic particle focusing enables sheathless chip Coulter counter with planar electrode configuration | |
| US20070238112A1 (en) | Microfluidic and nanofluidic electronic devices for detecting changes in capacitance of fluids and methods of using | |
| Mernier et al. | Characterization of a novel impedance cytometer design and its integration with lateral focusing by dielectrophoresis | |
| Vaclavek et al. | Resistive pulse sensing as particle counting and sizing method in microfluidic systems: Designs and applications review | |
| Yao et al. | On induced surface charge in solid-state nanopores | |
| Caselli et al. | A Bayesian approach for coincidence resolution in microfluidic impedance cytometry | |
| Bilican et al. | Focusing-free impedimetric differentiation of red blood cells and leukemia cells: A system optimization | |
| Panwar et al. | Integrated Field's metal microelectrodes based microfluidic impedance cytometry for cell-in-droplet quantification | |
| EP3042179A1 (en) | Measurement of particle charge | |
| Zhou et al. | Enhancing signals of microfluidic impedance cytometry through optimization of microelectrode array | |
| EP3642597A1 (en) | System and method for improved identification of particles or cells | |
| Gawad et al. | Fabrication of a microfluidic cell analyzer in a microchannel using impedance spectroscopy | |
| Afshar et al. | In-flow dielectrophoresis sensor for measuring the dielectric spectrum of single cells: Viable and non-viable cells |
Legal Events
| Date | Code | Title | Description |
|---|---|---|---|
| AS | Assignment |
Owner name: BOARD OF REGENTS, UNIVERSITY OF TEXAS SYSTEM, THE, Free format text: ASSIGNMENT OF ASSIGNORS INTEREST;ASSIGNORS:GASCOYNE, PETER;ANDERSON, TOM;VYKOUKAL, JODY;AND OTHERS;REEL/FRAME:012952/0679 Effective date: 20020507 |
|
| STCF | Information on status: patent grant |
Free format text: PATENTED CASE |
|
| CC | Certificate of correction | ||
| FPAY | Fee payment |
Year of fee payment: 4 |
|
| FPAY | Fee payment |
Year of fee payment: 8 |
|
| SULP | Surcharge for late payment |
Year of fee payment: 7 |
|
| FPAY | Fee payment |
Year of fee payment: 12 |