US6943793B2 - Method and apparatus for displaying resource information - Google Patents

Method and apparatus for displaying resource information Download PDF

Info

Publication number
US6943793B2
US6943793B2 US10/703,020 US70302003A US6943793B2 US 6943793 B2 US6943793 B2 US 6943793B2 US 70302003 A US70302003 A US 70302003A US 6943793 B2 US6943793 B2 US 6943793B2
Authority
US
United States
Prior art keywords
dimensional
data processing
processing system
dimensional element
elements
Prior art date
Legal status (The legal status is an assumption and is not a legal conclusion. Google has not performed a legal analysis and makes no representation as to the accuracy of the status listed.)
Expired - Lifetime, expires
Application number
US10/703,020
Other versions
US20050099422A1 (en
Inventor
Roderick Clint Bowser
Brian Douglas Brandenburg
Robert P. Lowe
Darren Kelly Upton
Current Assignee (The listed assignees may be inaccurate. Google has not performed a legal analysis and makes no representation or warranty as to the accuracy of the list.)
International Business Machines Corp
Original Assignee
International Business Machines Corp
Priority date (The priority date is an assumption and is not a legal conclusion. Google has not performed a legal analysis and makes no representation as to the accuracy of the date listed.)
Filing date
Publication date
Application filed by International Business Machines Corp filed Critical International Business Machines Corp
Priority to US10/703,020 priority Critical patent/US6943793B2/en
Assigned to INTERNATIONAL BUSINESS MACHINES CORPORATION reassignment INTERNATIONAL BUSINESS MACHINES CORPORATION ASSIGNMENT OF ASSIGNORS INTEREST (SEE DOCUMENT FOR DETAILS). Assignors: UPTON, DARREN KELLY, BOWSER, RODERICK CLINT, BRANDENBURG, BRIAN DOUGLAS, LOWE, ROBERT P.
Publication of US20050099422A1 publication Critical patent/US20050099422A1/en
Application granted granted Critical
Publication of US6943793B2 publication Critical patent/US6943793B2/en
Adjusted expiration legal-status Critical
Expired - Lifetime legal-status Critical Current

Links

Images

Classifications

    • HELECTRICITY
    • H04ELECTRIC COMMUNICATION TECHNIQUE
    • H04LTRANSMISSION OF DIGITAL INFORMATION, e.g. TELEGRAPHIC COMMUNICATION
    • H04L41/00Arrangements for maintenance, administration or management of data switching networks, e.g. of packet switching networks
    • H04L41/22Arrangements for maintenance, administration or management of data switching networks, e.g. of packet switching networks comprising specially adapted graphical user interfaces [GUI]
    • HELECTRICITY
    • H04ELECTRIC COMMUNICATION TECHNIQUE
    • H04LTRANSMISSION OF DIGITAL INFORMATION, e.g. TELEGRAPHIC COMMUNICATION
    • H04L41/00Arrangements for maintenance, administration or management of data switching networks, e.g. of packet switching networks
    • H04L41/08Configuration management of networks or network elements
    • H04L41/0893Assignment of logical groups to network elements

Definitions

  • the present invention relates generally to an improved data processing system, and in particular, to a method and apparatus for processing data. Still more particularly, the present invention provides a method, apparatus, and computer instructions for displaying information in a data processing system.
  • Businesses employ networks and enterprise systems having a vast array of resources. These resources include, for example, servers, routers, work stations, terminals, storage libraries, and other types of devices used in providing data processing system capabilities.
  • resources include, for example, servers, routers, work stations, terminals, storage libraries, and other types of devices used in providing data processing system capabilities.
  • viewing large numbers of resources such as work stations or servers in a server farm may be viewed by scrolling through names in a table. This type of presentation may be in a window with a scroll box allowing the user to scroll up and down through names of servers or other types of devices that are being viewed.
  • the different resources may be presented in different orders, such as in the order of name or usage.
  • the present invention provides a method, apparatus, and computer instructions for presenting resource information.
  • a plurality of three-dimensional elements in a view is displayed in which each element represents a resource in a network data processing system. Additional information regarding a parameter associated with the element is displayed in response to a user input interacting with an element from the plurality of three-dimensional elements.
  • FIG. 1 is a pictorial representation of a network of data processing systems in which the present invention may be implemented
  • FIG. 2 is a block diagram of a data processing system that may be implemented as a server in accordance with a preferred embodiment of the present invention
  • FIG. 3 is a block diagram illustrating a data processing system in which the present invention may be implemented
  • FIG. 4 is a diagram illustrating components used in providing for a graphical display of resource information in accordance with a preferred embodiment of the present invention
  • FIGS. 5A-5D are windows in a graphical user interface for presenting resource information in accordance with a preferred embodiment of the present invention.
  • FIG. 6 is a flowchart of a process for presenting a graphical display of resource information in a network data process system in accordance with a preferred embodiment of the present invention.
  • FIG. 1 depicts a pictorial representation of a network of data processing systems in which the present invention may be implemented.
  • Network data processing system 100 is a network of computers in which the present invention may be implemented.
  • Network data processing system 100 contains a network 102 , which is the medium used to provide communications links between various devices and computers connected together within network data processing system 100 .
  • Network 102 may include connections, such as wire, wireless communication links, or fiber optic cables.
  • server 104 is connected to network 102 along with storage unit 106 .
  • clients 108 , 110 , and 112 are connected to network 102 .
  • These clients 108 , 110 , and 112 may be, for example, personal computers or network computers.
  • server 104 provides data, such as boot files, operating system images, and applications to clients 108 - 112 .
  • Clients 108 , 110 , and 112 are clients to server 104 .
  • Network data processing system 100 may include additional servers, clients, and other devices not shown.
  • network data processing system 100 is the Internet with network 102 representing a worldwide collection of networks and gateways that use the Transmission Control Protocol/Internet Protocol (TCP/IP) suite of protocols to communicate with one another.
  • TCP/IP Transmission Control Protocol/Internet Protocol
  • At the heart of the Internet is a backbone of high-speed data communication lines between major nodes or host computers, consisting of thousands of commercial, government, educational and other computer systems that route data and messages.
  • network data processing system 100 also may be implemented as a number of different types of networks, such as for example, an intranet, a local area network (LAN), or a wide area network (WAN).
  • FIG. 1 is intended as an example, and not as an architectural limitation for the present invention.
  • Data processing system 200 may be a symmetric multiprocessor (SMP) system including a plurality of processors 202 and 204 connected to system bus 206 . Alternatively, a single processor system may be employed. Also connected to system bus 206 is memory controller/cache 208 , which provides an interface to local memory 209 . I/O bus bridge 210 is connected to system bus 206 and provides an interface to I/O bus 212 . Memory controller/cache 208 and I/O bus bridge 210 may be integrated as depicted.
  • SMP symmetric multiprocessor
  • Peripheral component interconnect (PCI) bus bridge 214 connected to I/O bus 212 provides an interface to PCI local bus 216 .
  • PCI Peripheral component interconnect
  • a number of modems may be connected to PCI local bus 216 .
  • Typical PCI bus implementations will support four PCI expansion slots or add-in connectors.
  • Communications links to clients 108 - 112 in FIG. 1 may be provided through modem 218 and network adapter 220 connected to PCI local bus 216 through add-in boards.
  • Additional PCI bus bridges 222 and 224 provide interfaces for additional PCI local buses 226 and 228 , from which additional modems or network adapters may be supported. In this manner, data processing system 200 allows connections to multiple network computers.
  • a memory-mapped graphics adapter 230 and hard disk 232 may also be connected to I/O bus 212 as depicted, either directly or indirectly.
  • FIG. 2 may vary.
  • other peripheral devices such as optical disk drives and the like, also may be used in addition to or in place of the hardware depicted.
  • the depicted example is not meant to imply architectural limitations with respect to the present invention.
  • the data processing system depicted in FIG. 2 may be, for example, an IBM eServer pSeries system, a product of International Business Machines Corporation in Armonk, N.Y., running the Advanced Interactive Executive (AIX) operating system or LINUX operating system.
  • AIX Advanced Interactive Executive
  • Data processing system 300 is an example of a client computer.
  • Data processing system 300 employs a peripheral component interconnect (PCI) local bus architecture.
  • PCI peripheral component interconnect
  • AGP Accelerated Graphics Port
  • ISA Industry Standard Architecture
  • Processor 302 and main memory 304 are connected to PCI local bus 306 through PCI bridge 308 .
  • PCI bridge 308 also may include an integrated memory controller and cache memory for processor 302 . Additional connections to PCI local bus 306 may be made through direct component interconnection or through add-in boards.
  • local area network (LAN) adapter 310 SCSI host bus adapter 312 , and expansion bus interface 314 are connected to PCI local bus 306 by direct component connection.
  • audio adapter 316 graphics adapter 318 , and audio/video adapter 319 are connected to PCI local bus 306 by add-in boards inserted into expansion slots.
  • Expansion bus interface 314 provides a connection for a keyboard and mouse adapter 320 , modem 322 , and additional memory 324 .
  • Small computer system interface (SCSI) host bus adapter 312 provides a connection for hard disk drive 326 , tape drive 328 , and CD-ROM drive 330 .
  • Typical PCI local bus implementations will support three or four PCI expansion slots or add-in connectors.
  • An operating system runs on processor 302 and is used to coordinate and provide control of various components within data processing system 300 in FIG. 3 .
  • the operating system may be a commercially available operating system, such as Windows XP, which is available from Microsoft Corporation.
  • An object oriented programming system such as Java may run in conjunction with the operating system and provide calls to the operating system from Java programs or applications executing on data processing system 300 . “Java” is a trademark of Sun Microsystems, Inc. Instructions for the operating system, the object-oriented programming system, and applications or programs are located on storage devices, such as hard disk drive 326 , and may be loaded into main memory 304 for execution by processor 302 .
  • FIG. 3 may vary depending on the implementation.
  • Other internal hardware or peripheral devices such as flash read-only memory (ROM), equivalent nonvolatile memory, or optical disk drives and the like, may be used in addition to or in place of the hardware depicted in FIG. 3 .
  • the processes of the present invention may be applied to a multiprocessor data processing system.
  • data processing system 300 also may be a notebook computer or hand held computer in addition to taking the form of a PDA.
  • data processing system 300 also may be a kiosk or a Web appliance.
  • the present invention provides a method, apparatus, and computer instructions for displaying resource information within a network data processing system, such as network data processing system 100 in FIG. 1 .
  • the mechanism of the present invention provides a graphical display of resource information that is especially useful for systems with large numbers of resources, such as work stations or servers. This mechanism allows for presenting many resources within a small display area.
  • this mechanism allows for selecting a particular area and obtaining a larger picture or view of the selected area in which to view and select graphics to obtain additional information about associated resources. Also, this type of presentation and selection mechanism provides for a gain in accessibility for disabled users.
  • the mechanism of the present invention displays a window or portal panel containing icons segmented into user-defined groups.
  • groups may be, for example, work stations, servers, storage libraries, and routers.
  • the groups may be divided up into particular types of work stations, such as work stations located in particular buildings or work stations assigned to particular business groups. Selection of one of these groups results in display of a three-dimensional scale element that may be viewed and manipulated by the user for additional information.
  • FIG. 4 a diagram illustrating components used in providing for a graphical display of resource information is depicted in accordance with a preferred embodiment of the present invention.
  • a user may view resource information for a network data processing system through client 400 .
  • This information is obtained from server 402 in the illustrative examples.
  • Client 400 includes client process 404 , which may request the resource information from resource server process 406 .
  • Resource server process 406 obtains information regarding various metrics that are of interest and stores that information in resource database 408 .
  • This information may include, for example, an identification of work stations or servers.
  • This information may be divided into types of servers, such as Web servers, database servers, and other types of servers.
  • Metrics that may be gathered for these servers include, for example, the operational level of a particular server, such as whether a server is operating in a normal mode, a warning mode, or a critical mode. Further, other metrics may include, for example, the capacity or amount of processing being performed by a particular server. Some other metrics include for example, TCP/IP parameters including a high ping or response level and retransmission of segments. Another metric that may be used includes low available memory or high paging of data. Stopped or failed services are additional metrics. Metrics also include physical disk measurements that indicate a high percentage of disk time, a high transfer rate, a slow physical drive, and a high reading of bytes per second. Logical disk metrics include, for example, low disk space, amount of fragmentation, and slow logical drive response. A high print job error rate for a printer is yet another example of a metric that may be used.
  • Client process 404 receives this information from resource server process 406 .
  • This information is displayed in display 410 to the user in a graphical manner that allows for viewing the entire system of servers. Additionally, the display also allows the user to select particular servers, displayed in a graphical manner, to obtain more information for that particular server.
  • the selection of a particular server also may provide a display of controls to adjust parameters on that server depending on the implementation.
  • the process used to obtain and display resource information is located in a client separate from server 402 , that process and display may be located at server 402 depending on the particular implementation.
  • FIGS. 5A-5D windows in a graphical user interface for presenting resource information are depicted in accordance with a preferred embodiment of the present invention.
  • the windows in FIGS. 5A-5D are illustrative examples of information that may be presented as display 410 within client 400 in FIG. 4 .
  • window 500 provides a summary status view of information for a set of servers.
  • user-defined groups for presentation are Web servers 502 , database (DB) servers 504 , Siebel servers 506 , and WAS servers 508 within section 510 .
  • section 510 is divided into quadrants of servers. Selection of one of these quadrants results in a three-dimensional display in section 512 of the servers in the selected quadrant.
  • Window 500 illustrates all of the servers in a network data processing system, such as network data processing system 100 in FIG. 1 .
  • network data processing system 100 in FIG. 1
  • Other types of grouping for section 510 may include, for example, storage libraries or client workstations.
  • the groupings in the quadrants may be made in many different ways in addition to the grouping illustrated in section 510 .
  • the servers in section 510 may be grouped by location of the servers or business groups assigned to or associated with the servers. Further, these groups may be of a heterogeneous nature.
  • section 510 may also show storage libraries and routers in addition to server groups.
  • Web servers 502 have been selected by the user and are presented in a three-dimensional form in section 512 .
  • the elements in section 512 correspond to those within Web servers 502 .
  • element 514 in Web servers 502 corresponds to three-dimensional element 516 in section 512 .
  • key table 517 is used to color code the different elements to show the state of normal, warning, and critical in both sections 512 and 514 .
  • Element 518 in Web servers 502 corresponds to element 520 in section 512 . Further, in addition to the color coding provided by key table 517 , three-dimensional elements within section 512 are presented in a manner to illustrate relative states between the different servers in Web servers 502 .
  • Window 500 also provides for different types of controls to manipulate the presentation of data on toolbar 522 .
  • toolbar 522 includes zoom in button 524 and zoom out button 526 , zoom to fit button 528 , pan button 530 , select items button 532 , selective magnification button 534 , and level button 536 .
  • Zoom in button 524 and zoom out button 526 allow a user to zoom in or zoom out from a display, such as that of the three dimensional elements section 512 .
  • a user may move a pointer to the display and use the selected function to either zoom in to obtain a closer view or zoom out to obtain a farther view of the display.
  • Zoom to fit button 528 allows a user selecting the function to zoom the image to fit the available space.
  • Pan button 530 allows a user to move the image area in the display with a pointing device.
  • Select items button 532 allows a user to select items with a pointing device for manipulation.
  • Selective magnification button 524 provides a function for a user to select a section of the display for magnification. The area selected is magnified to fit window 500 or a section in window 500 .
  • Level button 536 allows a user to go up or down in levels of detail.
  • pointer 538 is moved to hover over three-dimensional element 540 .
  • Hover means that the pointer stays over a particular area for some selected period of time.
  • This hovering results in label 542 being displayed.
  • This label is for the resource represented by three-dimensional element 540 as well as affected metrics.
  • label 542 indicates that a server named “Abel” has a disk that is 95% full. Selection of element 540 may be made to show more details with respect to this particular resource.
  • FIG. 5C a selection of element 540 has been made by the user, resulting in section 544 being displayed.
  • This section provides for a display of a metric table containing all indications or parameters running on the affected model with the indication being highlighted.
  • An indication is a metric of a resource.
  • the resource may be, for example, how much room is present in a disk or how much space is being used in a disk.
  • Another example of an indication is how busy a processor is at a given time.
  • indication 546 is a representation of the processor usage on the selected resource.
  • FIG. 5D the selection of indication 546 results in section 548 being displayed.
  • This section provides chart 550 , which displays processor or CPU usage within the selected resource.
  • chart 550 shows processor usage for four different processors on the selected resource. Different tables and indications may be displayed depending on the particular resource selected.
  • FIGS. 5A-5D are not intended as limitations to the manner in which data may be presented to a user. These examples illustrate one way in which all resources in a network data processing system of a particular type or all resources in their entirety may be displayed to a user in a fashion that allows the user to view usage or availability of resources as a whole.
  • FIG. 6 a flowchart of a process for presenting a graphical display of resource information in a network data processing system is depicted in accordance with a preferred embodiment of the present invention.
  • the process illustrated in FIG. 6 may be implemented in a data processing system, such as data processing system 200 in FIG. 2 or data processing system 300 in FIG. 3 .
  • the process begins by displaying user-defined groups in a graphical user interface (step 600 ). This display may be presented using a window, such as window 500 in FIGS. 5A-5D . Thereafter, user input is received (step 602 ). A determination is made as to whether the user input is the selection of a group from the user-defined groups (step 604 ). If the selection is of a group, elements in the group are displayed using three-dimensional elements (step 606 ) with the process returning to step 602 to receive further user input.
  • step 604 If the user input in step 604 is not a selection of a group, a determination is made as to whether the user input moves a pointer over an element (step 608 ). If the user input moves the pointer over an element, the resource label and the affected metric for that particular resource represented by the element are displayed (step 610 ) with the process then returning to step 602 .
  • step 608 if the user input in step 608 is not a movement of the pointer over an element, a determination is made as to whether the user input selects an element (step 612 ). If an element is selected, a metrics table with indications is displayed (step 614 ) with the process then returning to step 602 . Otherwise, a determination is made as to whether the user input selects an indication (step 616 ).
  • step 618 a chart of the indication is displayed (step 618 ) with the process then returning to step 602 .
  • a determination is made as to whether the display is to be terminated (step 620 ). If the display is to be terminated, the process terminates. Otherwise, the process returns to step 602 as described above.
  • the present invention provides an improved method, apparatus, and computer instructions for displaying resource information within a network data processing system.
  • the mechanism of the present invention provides for a graphical display that allows a user to view the entire system at one time, rather than only part of a system.
  • the mechanism of the present invention provides for a window containing icons segmented or divided into user-defined groups. Selection of a group presents a three-dimensional scale image that may be viewed and manipulated for additional information.

Abstract

A method, apparatus, and computer instructions for presenting resource information. A plurality of three-dimensional elements in a view is displayed in which each element represents a resource in a network data processing system. Additional information regarding a parameter associated with the element is displayed in response to a user input interacting with an element from the plurality of three-dimensional elements.

Description

BACKGROUND OF THE INVENTION
1. Technical Field
The present invention relates generally to an improved data processing system, and in particular, to a method and apparatus for processing data. Still more particularly, the present invention provides a method, apparatus, and computer instructions for displaying information in a data processing system.
2. Description of Related Art
Businesses employ networks and enterprise systems having a vast array of resources. These resources include, for example, servers, routers, work stations, terminals, storage libraries, and other types of devices used in providing data processing system capabilities. Currently, viewing large numbers of resources such as work stations or servers in a server farm may be viewed by scrolling through names in a table. This type of presentation may be in a window with a scroll box allowing the user to scroll up and down through names of servers or other types of devices that are being viewed. Within this table, the different resources may be presented in different orders, such as in the order of name or usage.
The drawback of this type of resource information presentation is that a user is unable to view the entire system at one time. A user may only see part of the system at any one time. Further, requesting each work station or server as an icon helps provide a view of the entire system one piece at a time. Obtaining useful information from this type of display, however, is difficult. A user may move a pointer to hover over an icon to display additional text. This type of presentation of information with these steps is difficult for users with disabilities to use.
Therefore, it would be advantageous to have an improved method, apparatus, and computer instructions for presenting resource information for a network data processing system.
SUMMARY OF THE INVENTION
The present invention provides a method, apparatus, and computer instructions for presenting resource information. A plurality of three-dimensional elements in a view is displayed in which each element represents a resource in a network data processing system. Additional information regarding a parameter associated with the element is displayed in response to a user input interacting with an element from the plurality of three-dimensional elements.
BRIEF DESCRIPTION OF THE DRAWINGS
The novel features believed characteristic of the invention are set forth in the appended claims. The invention itself, however, as well as a preferred mode of use, further objectives and advantages thereof, will best be understood by reference to the following detailed description of an illustrative embodiment when read in conjunction with the accompanying drawings, wherein:
FIG. 1 is a pictorial representation of a network of data processing systems in which the present invention may be implemented;
FIG. 2 is a block diagram of a data processing system that may be implemented as a server in accordance with a preferred embodiment of the present invention;
FIG. 3 is a block diagram illustrating a data processing system in which the present invention may be implemented;
FIG. 4 is a diagram illustrating components used in providing for a graphical display of resource information in accordance with a preferred embodiment of the present invention;
FIGS. 5A-5D are windows in a graphical user interface for presenting resource information in accordance with a preferred embodiment of the present invention; and
FIG. 6 is a flowchart of a process for presenting a graphical display of resource information in a network data process system in accordance with a preferred embodiment of the present invention.
DETAILED DESCRIPTION OF THE PREFERRED EMBODIMENT
With reference now to the figures, FIG. 1 depicts a pictorial representation of a network of data processing systems in which the present invention may be implemented. Network data processing system 100 is a network of computers in which the present invention may be implemented. Network data processing system 100 contains a network 102, which is the medium used to provide communications links between various devices and computers connected together within network data processing system 100. Network 102 may include connections, such as wire, wireless communication links, or fiber optic cables.
In the depicted example, server 104 is connected to network 102 along with storage unit 106. In addition, clients 108, 110, and 112 are connected to network 102. These clients 108, 110, and 112 may be, for example, personal computers or network computers. In the depicted example, server 104 provides data, such as boot files, operating system images, and applications to clients 108-112. Clients 108, 110, and 112 are clients to server 104. Network data processing system 100 may include additional servers, clients, and other devices not shown.
In the depicted example, network data processing system 100 is the Internet with network 102 representing a worldwide collection of networks and gateways that use the Transmission Control Protocol/Internet Protocol (TCP/IP) suite of protocols to communicate with one another. At the heart of the Internet is a backbone of high-speed data communication lines between major nodes or host computers, consisting of thousands of commercial, government, educational and other computer systems that route data and messages. Of course, network data processing system 100 also may be implemented as a number of different types of networks, such as for example, an intranet, a local area network (LAN), or a wide area network (WAN). FIG. 1 is intended as an example, and not as an architectural limitation for the present invention.
Referring to FIG. 2, a block diagram of a data processing system that may be implemented as a server, such as server 104 in FIG. 1, is depicted in accordance with a preferred embodiment of the present invention. Data processing system 200 may be a symmetric multiprocessor (SMP) system including a plurality of processors 202 and 204 connected to system bus 206. Alternatively, a single processor system may be employed. Also connected to system bus 206 is memory controller/cache 208, which provides an interface to local memory 209. I/O bus bridge 210 is connected to system bus 206 and provides an interface to I/O bus 212. Memory controller/cache 208 and I/O bus bridge 210 may be integrated as depicted.
Peripheral component interconnect (PCI) bus bridge 214 connected to I/O bus 212 provides an interface to PCI local bus 216. A number of modems may be connected to PCI local bus 216. Typical PCI bus implementations will support four PCI expansion slots or add-in connectors. Communications links to clients 108-112 in FIG. 1 may be provided through modem 218 and network adapter 220 connected to PCI local bus 216 through add-in boards.
Additional PCI bus bridges 222 and 224 provide interfaces for additional PCI local buses 226 and 228, from which additional modems or network adapters may be supported. In this manner, data processing system 200 allows connections to multiple network computers. A memory-mapped graphics adapter 230 and hard disk 232 may also be connected to I/O bus 212 as depicted, either directly or indirectly.
Those of ordinary skill in the art will appreciate that the hardware depicted in FIG. 2 may vary. For example, other peripheral devices, such as optical disk drives and the like, also may be used in addition to or in place of the hardware depicted. The depicted example is not meant to imply architectural limitations with respect to the present invention.
The data processing system depicted in FIG. 2 may be, for example, an IBM eServer pSeries system, a product of International Business Machines Corporation in Armonk, N.Y., running the Advanced Interactive Executive (AIX) operating system or LINUX operating system.
With reference now to FIG. 3, a block diagram illustrating a data processing system is depicted in which the present invention may be implemented. Data processing system 300 is an example of a client computer. Data processing system 300 employs a peripheral component interconnect (PCI) local bus architecture. Although the depicted example employs a PCI bus, other bus architectures such as Accelerated Graphics Port (AGP) and Industry Standard Architecture (ISA) may be used. Processor 302 and main memory 304 are connected to PCI local bus 306 through PCI bridge 308. PCI bridge 308 also may include an integrated memory controller and cache memory for processor 302. Additional connections to PCI local bus 306 may be made through direct component interconnection or through add-in boards. In the depicted example, local area network (LAN) adapter 310, SCSI host bus adapter 312, and expansion bus interface 314 are connected to PCI local bus 306 by direct component connection. In contrast, audio adapter 316, graphics adapter 318, and audio/video adapter 319 are connected to PCI local bus 306 by add-in boards inserted into expansion slots. Expansion bus interface 314 provides a connection for a keyboard and mouse adapter 320, modem 322, and additional memory 324. Small computer system interface (SCSI) host bus adapter 312 provides a connection for hard disk drive 326, tape drive 328, and CD-ROM drive 330. Typical PCI local bus implementations will support three or four PCI expansion slots or add-in connectors.
An operating system runs on processor 302 and is used to coordinate and provide control of various components within data processing system 300 in FIG. 3. The operating system may be a commercially available operating system, such as Windows XP, which is available from Microsoft Corporation. An object oriented programming system such as Java may run in conjunction with the operating system and provide calls to the operating system from Java programs or applications executing on data processing system 300. “Java” is a trademark of Sun Microsystems, Inc. Instructions for the operating system, the object-oriented programming system, and applications or programs are located on storage devices, such as hard disk drive 326, and may be loaded into main memory 304 for execution by processor 302.
Those of ordinary skill in the art will appreciate that the hardware in FIG. 3 may vary depending on the implementation. Other internal hardware or peripheral devices, such as flash read-only memory (ROM), equivalent nonvolatile memory, or optical disk drives and the like, may be used in addition to or in place of the hardware depicted in FIG. 3. Also, the processes of the present invention may be applied to a multiprocessor data processing system.
The depicted example in FIG. 3 and above-described examples are not meant to imply architectural limitations. For example, data processing system 300 also may be a notebook computer or hand held computer in addition to taking the form of a PDA. Data processing system 300 also may be a kiosk or a Web appliance.
The present invention provides a method, apparatus, and computer instructions for displaying resource information within a network data processing system, such as network data processing system 100 in FIG. 1. The mechanism of the present invention provides a graphical display of resource information that is especially useful for systems with large numbers of resources, such as work stations or servers. This mechanism allows for presenting many resources within a small display area.
Further, this mechanism allows for selecting a particular area and obtaining a larger picture or view of the selected area in which to view and select graphics to obtain additional information about associated resources. Also, this type of presentation and selection mechanism provides for a gain in accessibility for disabled users.
The mechanism of the present invention displays a window or portal panel containing icons segmented into user-defined groups. These groups may be, for example, work stations, servers, storage libraries, and routers. Alternatively, the groups may be divided up into particular types of work stations, such as work stations located in particular buildings or work stations assigned to particular business groups. Selection of one of these groups results in display of a three-dimensional scale element that may be viewed and manipulated by the user for additional information.
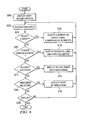
Turning now to FIG. 4, a diagram illustrating components used in providing for a graphical display of resource information is depicted in accordance with a preferred embodiment of the present invention. In this example, a user may view resource information for a network data processing system through client 400. This information is obtained from server 402 in the illustrative examples. Client 400 includes client process 404, which may request the resource information from resource server process 406.
Resource server process 406 obtains information regarding various metrics that are of interest and stores that information in resource database 408. This information may include, for example, an identification of work stations or servers. This information may be divided into types of servers, such as Web servers, database servers, and other types of servers.
Metrics that may be gathered for these servers include, for example, the operational level of a particular server, such as whether a server is operating in a normal mode, a warning mode, or a critical mode. Further, other metrics may include, for example, the capacity or amount of processing being performed by a particular server. Some other metrics include for example, TCP/IP parameters including a high ping or response level and retransmission of segments. Another metric that may be used includes low available memory or high paging of data. Stopped or failed services are additional metrics. Metrics also include physical disk measurements that indicate a high percentage of disk time, a high transfer rate, a slow physical drive, and a high reading of bytes per second. Logical disk metrics include, for example, low disk space, amount of fragmentation, and slow logical drive response. A high print job error rate for a printer is yet another example of a metric that may be used.
Client process 404 receives this information from resource server process 406. This information is displayed in display 410 to the user in a graphical manner that allows for viewing the entire system of servers. Additionally, the display also allows the user to select particular servers, displayed in a graphical manner, to obtain more information for that particular server.
Moreover, the selection of a particular server also may provide a display of controls to adjust parameters on that server depending on the implementation. Although in this example the process used to obtain and display resource information is located in a client separate from server 402, that process and display may be located at server 402 depending on the particular implementation.
Turning now to FIGS. 5A-5D, windows in a graphical user interface for presenting resource information are depicted in accordance with a preferred embodiment of the present invention. The windows in FIGS. 5A-5D are illustrative examples of information that may be presented as display 410 within client 400 in FIG. 4.
In FIG. 5A, window 500 provides a summary status view of information for a set of servers. In this example, user-defined groups for presentation are Web servers 502, database (DB) servers 504, Siebel servers 506, and WAS servers 508 within section 510. In this group, section 510 is divided into quadrants of servers. Selection of one of these quadrants results in a three-dimensional display in section 512 of the servers in the selected quadrant. Window 500 illustrates all of the servers in a network data processing system, such as network data processing system 100 in FIG. 1. Of course, other numbers of groups may be defined and images in section 510 may be made smaller to accommodate additional groups. Other types of grouping for section 510 may include, for example, storage libraries or client workstations. The groupings in the quadrants may be made in many different ways in addition to the grouping illustrated in section 510. For example, the servers in section 510 may be grouped by location of the servers or business groups assigned to or associated with the servers. Further, these groups may be of a heterogeneous nature. For example, section 510 may also show storage libraries and routers in addition to server groups.
In this illustrative example, Web servers 502 have been selected by the user and are presented in a three-dimensional form in section 512. The elements in section 512 correspond to those within Web servers 502. For example, element 514 in Web servers 502 corresponds to three-dimensional element 516 in section 512. In this example, key table 517 is used to color code the different elements to show the state of normal, warning, and critical in both sections 512 and 514.
Element 518 in Web servers 502 corresponds to element 520 in section 512. Further, in addition to the color coding provided by key table 517, three-dimensional elements within section 512 are presented in a manner to illustrate relative states between the different servers in Web servers 502. Window 500 also provides for different types of controls to manipulate the presentation of data on toolbar 522. For example, toolbar 522 includes zoom in button 524 and zoom out button 526, zoom to fit button 528, pan button 530, select items button 532, selective magnification button 534, and level button 536.
Zoom in button 524 and zoom out button 526 allow a user to zoom in or zoom out from a display, such as that of the three dimensional elements section 512. A user may move a pointer to the display and use the selected function to either zoom in to obtain a closer view or zoom out to obtain a farther view of the display. Zoom to fit button 528 allows a user selecting the function to zoom the image to fit the available space.
Pan button 530 allows a user to move the image area in the display with a pointing device. Select items button 532 allows a user to select items with a pointing device for manipulation. Selective magnification button 524 provides a function for a user to select a section of the display for magnification. The area selected is magnified to fit window 500 or a section in window 500. Level button 536 allows a user to go up or down in levels of detail.
In FIG. 5B, pointer 538 is moved to hover over three-dimensional element 540. Hover means that the pointer stays over a particular area for some selected period of time. This hovering results in label 542 being displayed. This label is for the resource represented by three-dimensional element 540 as well as affected metrics. In this example, label 542 indicates that a server named “Abel” has a disk that is 95% full. Selection of element 540 may be made to show more details with respect to this particular resource.
In FIG. 5C, a selection of element 540 has been made by the user, resulting in section 544 being displayed. This section provides for a display of a metric table containing all indications or parameters running on the affected model with the indication being highlighted. An indication is a metric of a resource. The resource may be, for example, how much room is present in a disk or how much space is being used in a disk. Another example of an indication is how busy a processor is at a given time. In this example, indication 546 is a representation of the processor usage on the selected resource.
In FIG. 5D, the selection of indication 546 results in section 548 being displayed. This section provides chart 550, which displays processor or CPU usage within the selected resource. In this example, chart 550 shows processor usage for four different processors on the selected resource. Different tables and indications may be displayed depending on the particular resource selected.
The illustrative examples in FIGS. 5A-5D are not intended as limitations to the manner in which data may be presented to a user. These examples illustrate one way in which all resources in a network data processing system of a particular type or all resources in their entirety may be displayed to a user in a fashion that allows the user to view usage or availability of resources as a whole.
Turning next to FIG. 6, a flowchart of a process for presenting a graphical display of resource information in a network data processing system is depicted in accordance with a preferred embodiment of the present invention. The process illustrated in FIG. 6 may be implemented in a data processing system, such as data processing system 200 in FIG. 2 or data processing system 300 in FIG. 3.
The process begins by displaying user-defined groups in a graphical user interface (step 600). This display may be presented using a window, such as window 500 in FIGS. 5A-5D. Thereafter, user input is received (step 602). A determination is made as to whether the user input is the selection of a group from the user-defined groups (step 604). If the selection is of a group, elements in the group are displayed using three-dimensional elements (step 606) with the process returning to step 602 to receive further user input.
If the user input in step 604 is not a selection of a group, a determination is made as to whether the user input moves a pointer over an element (step 608). If the user input moves the pointer over an element, the resource label and the affected metric for that particular resource represented by the element are displayed (step 610) with the process then returning to step 602.
On the other hand, if the user input in step 608 is not a movement of the pointer over an element, a determination is made as to whether the user input selects an element (step 612). If an element is selected, a metrics table with indications is displayed (step 614) with the process then returning to step 602. Otherwise, a determination is made as to whether the user input selects an indication (step 616).
If an indication is selected, a chart of the indication is displayed (step 618) with the process then returning to step 602. With reference again to step 616, if the user input does not select an indication, a determination is made as to whether the display is to be terminated (step 620). If the display is to be terminated, the process terminates. Otherwise, the process returns to step 602 as described above.
Thus, the present invention provides an improved method, apparatus, and computer instructions for displaying resource information within a network data processing system. The mechanism of the present invention provides for a graphical display that allows a user to view the entire system at one time, rather than only part of a system. The mechanism of the present invention provides for a window containing icons segmented or divided into user-defined groups. Selection of a group presents a three-dimensional scale image that may be viewed and manipulated for additional information.
It is important to note that while the present invention has been described in the context of a fully functioning data processing system, those of ordinary skill in the art will appreciate that the processes of the present invention are capable of being distributed in the form of a computer readable medium of instructions and a variety of forms and that the present invention applies equally regardless of the particular type of signal bearing media actually used to carry out the distribution. Examples of computer readable media include recordable-type media, such as a floppy disk, a hard disk drive, a RAM, CD-ROMs, DVD-ROMs, and transmission-type media, such as digital and analog communications links, wired or wireless communications links using transmission forms, such as, for example, radio frequency and light wave transmissions. The computer readable media may take the form of coded formats that are decoded for actual use in a particular data processing system.
The description of the present invention has been presented for purposes of illustration and description, and is not intended to be exhaustive or limited to the invention in the form disclosed. Many modifications and variations will be apparent to those of ordinary skill in the art. The embodiment was chosen and described in order to best explain the principles of the invention, the practical application, and to enable others of ordinary skill in the art to understand the invention for various embodiments with various modifications as are suited to the particular use contemplated.

Claims (19)

1. A method in a data processing system for presenting resource information, the method comprising:
displaying a set of user defined groups, wherein a user defined group within the set of user defined groups contains a set of two-dimensional elements and each two dimensional element represents a resource in a network data processing system;
responsive to a selection of the user defined group, displaying a three dimensional view of the two-dimensional elements from the user defined group to form a plurality of three dimensional elements, wherein a three-dimensional element within the plurality of three-dimensional elements visually conveys information about an associated metric for resource represented by the three-dimensional element; and
responsive to a user input interacting with the three-dimensional element, displaying additional information regarding the three-dimensional element.
2. The method of claim 1, wherein the additional information is for another metric associated with the three-dimensional element.
3. The method of claim 1, wherein the user input is a movement of a pointer over the three-dimensional element and wherein the additional information is displayed as a label with text identifying a metric associated with the three-dimensional element.
4. The method of claim 1, wherein the user input is a selection of the three-dimensional element and wherein the additional information is a table containing an indication.
5. The method of claim 1, wherein the plurality of three-dimensional elements are a plurality of bars.
6. The method of claim 1, wherein the plurality of three-dimensional elements are color coded to provide information on a selected metric.
7. A data processing system for presenting resource information, the data processing system comprising:
a bus system;
a communications unit connected to the bus system;
a memory connected to the bus system, wherein the memory includes a set of instructions; and
a processing unit connected to the bus system, wherein the processing unit executes the set of instructions to display a set of user defined groups, wherein a user defined group within the set of user defined groups contains a set of two-dimensional elements and each two dimensional element represents a resource in a network data processing system; display a three dimensional view of the two-dimensional elements from a group to form a plurality of three dimensional elements in response to a selection of the group from the groups of two-dimensional elements, wherein a three-dimensional element within the plurality of three-dimensional elements visually conveys information about an associated metric for resource represented by the three-dimensional element; and display additional information regarding the three-dimensional element in response to a user input interacting with the three-dimensional element.
8. A data processing system for presenting resource information, the data processing system comprising:
first displaying means for displaying a set of user defined groups, wherein a user defined group within the set of user defined groups contains a set of two-dimensional elements and each two dimensional element represents a resource in a network data processing system;
second displaying means, responsive to a selection of a group from the groups of two-dimensional elements, for displaying a three dimensional view of the two-dimensional elements from the group to form a plurality of three dimensional elements, wherein a three-dimensional element within the plurality of three-dimensional elements visually conveys information about an associated metric for resource represented by the three-dimensional element; and
third displaying means, responsive to a user input interacting with the three-dimensional element, for displaying additional information regarding the three-dimensional element.
9. The data processing system of claim 8, wherein the additional information is for another metric associated with the three-dimensional element.
10. The data processing system of claim 8, wherein the user input is a movement of a pointer over the three-dimensional element and wherein the additional information is displayed as a label with text identifying a metric associated with the three-dimensional element.
11. The data processing system of claim 8, wherein the user input is a selection of the three-dimensional element and wherein the additional information is a table containing an indication.
12. The data processing system of claim 8, wherein the plurality of three-dimensional elements are a plurality of bars.
13. The data processing system of claim 8, wherein the plurality of three-dimensional elements are color coded to provide information on a selected metric.
14. A computer program product in a computer readable medium for presenting resource information, the computer program product comprising:
first instructions for displaying a set of user defined groups, wherein a user defined group within the set of user defined groups contains a set of two-dimensional elements, and each two dimensional element represents a resource in a network data processing system;
second instructions, responsive to a selection of a group from the groups of two-dimensional elements, for displaying a three dimensional view of the two-dimensional elements from the group to form a plurality of three dimensional elements, wherein a three-dimensional element within the plurality of three-dimensional elements visually conveys information about an associated metric for resource represented by the three-dimensional element; and
third instructions, responsive to a user input interacting with the three-dimensional element, for displaying additional information regarding the three-dimensional element.
15. The computer program product of claim 14, wherein the additional information is for another metric associated with the three-dimensional element.
16. The computer program product of claim 14, wherein the user input is a movement of a pointer over the three-dimensional element and wherein the additional information is displayed as a label with text identifying a metric associated with the three-dimensional element.
17. The computer program product of claim 14, wherein the user input is a selection of the three-dimensional element and wherein the additional information is a table containing an indication.
18. The computer program product of claim 14, wherein the plurality of three-dimensional elements are a plurality of bars.
19. The computer program product of claim 14, wherein the plurality of three-dimensional elements are color coded to provide information on a selected metric.
US10/703,020 2003-11-06 2003-11-06 Method and apparatus for displaying resource information Expired - Lifetime US6943793B2 (en)

Priority Applications (1)

Application Number Priority Date Filing Date Title
US10/703,020 US6943793B2 (en) 2003-11-06 2003-11-06 Method and apparatus for displaying resource information

Applications Claiming Priority (1)

Application Number Priority Date Filing Date Title
US10/703,020 US6943793B2 (en) 2003-11-06 2003-11-06 Method and apparatus for displaying resource information

Publications (2)

Publication Number Publication Date
US20050099422A1 US20050099422A1 (en) 2005-05-12
US6943793B2 true US6943793B2 (en) 2005-09-13

Family

ID=34551808

Family Applications (1)

Application Number Title Priority Date Filing Date
US10/703,020 Expired - Lifetime US6943793B2 (en) 2003-11-06 2003-11-06 Method and apparatus for displaying resource information

Country Status (1)

Country Link
US (1) US6943793B2 (en)

Cited By (10)

* Cited by examiner, † Cited by third party
Publication number Priority date Publication date Assignee Title
US20050104799A1 (en) * 2003-11-14 2005-05-19 Shimizu Clifford S. Systems and methods for displaying individual processor usage in a multiprocessor system
US20060213381A1 (en) * 2005-03-25 2006-09-28 Fuji Xerox Co., Ltd. Statistical variable display apparatus and method, and storage medium storing statistical variable display program
US20080163048A1 (en) * 2006-12-29 2008-07-03 Gossweiler Iii Richard Carl System and method for displaying multimedia events scheduling information and Corresponding search results
US20080270395A1 (en) * 2007-04-24 2008-10-30 Gossweiler Iii Richard Carl Relevance Bar for Content Listings
US20080270446A1 (en) * 2007-04-24 2008-10-30 Richard Carl Gossweiler Virtual Channels
US20090100370A1 (en) * 2007-10-10 2009-04-16 Microsoft Corporation Graphical Representation of Tabular Data
US20110261068A1 (en) * 2007-10-09 2011-10-27 Boris Oliver Kneisel System and method for identifying process bottenecks
US8544040B2 (en) 2006-12-29 2013-09-24 Google Inc. System and method for displaying multimedia events scheduling information
US8640167B2 (en) 2006-12-29 2014-01-28 Google Inc. System and method for displaying and searching multimedia events scheduling information
US9084025B1 (en) 2007-08-06 2015-07-14 Google Inc. System and method for displaying both multimedia events search results and internet search results

Families Citing this family (2)

* Cited by examiner, † Cited by third party
Publication number Priority date Publication date Assignee Title
JP2002123530A (en) * 2000-10-12 2002-04-26 Hitachi Ltd Method and device for visualizing multidimensional data
US20090024950A1 (en) * 2007-07-17 2009-01-22 Xerox Corporation Printer Driver Interface and Methods

Citations (5)

* Cited by examiner, † Cited by third party
Publication number Priority date Publication date Assignee Title
US5528735A (en) 1993-03-23 1996-06-18 Silicon Graphics Inc. Method and apparatus for displaying data within a three-dimensional information landscape
US5555354A (en) 1993-03-23 1996-09-10 Silicon Graphics Inc. Method and apparatus for navigation within three-dimensional information landscape
US5909217A (en) 1997-09-30 1999-06-01 International Business Machines Corporation Large scale system status map
US6222540B1 (en) * 1997-11-21 2001-04-24 Portola Dimensional Systems, Inc. User-friendly graphics generator including automatic correlation
US6707454B1 (en) * 1999-07-01 2004-03-16 Lucent Technologies Inc. Systems and methods for visualizing multi-dimensional data in spreadsheets and other data structures

Patent Citations (5)

* Cited by examiner, † Cited by third party
Publication number Priority date Publication date Assignee Title
US5528735A (en) 1993-03-23 1996-06-18 Silicon Graphics Inc. Method and apparatus for displaying data within a three-dimensional information landscape
US5555354A (en) 1993-03-23 1996-09-10 Silicon Graphics Inc. Method and apparatus for navigation within three-dimensional information landscape
US5909217A (en) 1997-09-30 1999-06-01 International Business Machines Corporation Large scale system status map
US6222540B1 (en) * 1997-11-21 2001-04-24 Portola Dimensional Systems, Inc. User-friendly graphics generator including automatic correlation
US6707454B1 (en) * 1999-07-01 2004-03-16 Lucent Technologies Inc. Systems and methods for visualizing multi-dimensional data in spreadsheets and other data structures

Cited By (22)

* Cited by examiner, † Cited by third party
Publication number Priority date Publication date Assignee Title
US7595804B2 (en) * 2003-11-14 2009-09-29 Unisys Corporation Systems and methods for displaying individual processor usage in a multiprocessor system
US20050104799A1 (en) * 2003-11-14 2005-05-19 Shimizu Clifford S. Systems and methods for displaying individual processor usage in a multiprocessor system
US20060213381A1 (en) * 2005-03-25 2006-09-28 Fuji Xerox Co., Ltd. Statistical variable display apparatus and method, and storage medium storing statistical variable display program
US7782321B2 (en) * 2005-03-25 2010-08-24 Fuji Xerox Co., Ltd. Statistical variable display apparatus and method, and storage medium storing statistical variable display program
US9066148B2 (en) 2006-12-29 2015-06-23 Google Inc. System and method for displaying and searching multimedia events scheduling information
US9237380B2 (en) 2006-12-29 2016-01-12 Google Inc. System and method for displaying multimedia events scheduling information
US9872077B2 (en) 2006-12-29 2018-01-16 Google Llc System and method for displaying multimedia events scheduling information
US9282376B2 (en) 2006-12-29 2016-03-08 Google Inc. System and method for displaying and searching multimedia events scheduling information
US20080163048A1 (en) * 2006-12-29 2008-07-03 Gossweiler Iii Richard Carl System and method for displaying multimedia events scheduling information and Corresponding search results
US8544040B2 (en) 2006-12-29 2013-09-24 Google Inc. System and method for displaying multimedia events scheduling information
US8640167B2 (en) 2006-12-29 2014-01-28 Google Inc. System and method for displaying and searching multimedia events scheduling information
US8799952B2 (en) 2007-04-24 2014-08-05 Google Inc. Virtual channels
US8972875B2 (en) * 2007-04-24 2015-03-03 Google Inc. Relevance bar for content listings
US20080270395A1 (en) * 2007-04-24 2008-10-30 Gossweiler Iii Richard Carl Relevance Bar for Content Listings
US9369765B2 (en) 2007-04-24 2016-06-14 Google Inc. Virtual channels
US9747290B2 (en) 2007-04-24 2017-08-29 Google Inc. Relevance bar for content listings
US20080270446A1 (en) * 2007-04-24 2008-10-30 Richard Carl Gossweiler Virtual Channels
US9084025B1 (en) 2007-08-06 2015-07-14 Google Inc. System and method for displaying both multimedia events search results and internet search results
US8989886B2 (en) * 2007-10-09 2015-03-24 Sap Se System and method for identifying process bottlenecks
US20110261068A1 (en) * 2007-10-09 2011-10-27 Boris Oliver Kneisel System and method for identifying process bottenecks
US8984433B2 (en) * 2007-10-10 2015-03-17 Microsoft Technology Licensing, Llc. Graphical representation of tabular data
US20090100370A1 (en) * 2007-10-10 2009-04-16 Microsoft Corporation Graphical Representation of Tabular Data

Also Published As

Publication number Publication date
US20050099422A1 (en) 2005-05-12

Similar Documents

Publication Publication Date Title
US10482411B2 (en) Dashboard for dynamic display of distributed transaction data
US6788313B1 (en) Method and apparatus for providing on line help for custom application interfaces
US7574671B2 (en) Apparatus and method of displaying electronic desktops based on a scheduler or network connection
US8086970B2 (en) Address range viewer
US8112705B2 (en) Magnifying the text of a link while still retaining browser function in the magnified display
US6456307B1 (en) Automatic icon generation
US7917864B2 (en) Automatically scaling the information and controls in navigation tabs per available window area
US6594696B1 (en) Network management apparatus and method employing “object tips” for the display of detailed data
US7788584B2 (en) Computer-implemented method, system, and program product for hiding columns in an electronic table
JP4447612B2 (en) Method and system for connecting, scanning and accessing computer network resources
US20050097480A1 (en) Method and apparatus for displaying status of hierarchical operations
US6943793B2 (en) Method and apparatus for displaying resource information
JP2001511609A (en) User interface for examining graphical expressions of packet trace information
US7539933B2 (en) Apparatus and method of highlighting links in a web page
US7574667B2 (en) Apparatus, system and computer program product for appending a group of files to files on a clipboard of a desktop
US6314449B1 (en) Method and system for accessing application log messages appearing in a web-based user interface in a distributed network
US20140380178A1 (en) Displaying interactive charts on devices with limited resources
US20080140832A1 (en) Mechanism for improving accessibility of jmx monitoring information in web content
JP2010250815A (en) Method, device and computer program for navigating a plurality of instantiated virtual desktops (navigation of a plurality of virtual instantiated desktops)
US5343409A (en) System and method for probing object resources in a window server environment
US20090063955A1 (en) Depth indicator for a link in a document
US6587121B1 (en) Graphical table of contents for a help system
US20030076526A1 (en) Method and apparatus for printing documents using a document repository in a distributed data processing system
US7146569B2 (en) Method, apparatus, and program for visual representation of an address space
US20040100495A1 (en) Apparatus, system and method of enabling a user to configure a desktop

Legal Events

Date Code Title Description
AS Assignment

Owner name: INTERNATIONAL BUSINESS MACHINES CORPORATION, NEW Y

Free format text: ASSIGNMENT OF ASSIGNORS INTEREST;ASSIGNORS:BOWSER, RODERICK CLINT;BRANDENBURG, BRIAN DOUGLAS;LOWE, ROBERT P.;AND OTHERS;REEL/FRAME:014686/0306;SIGNING DATES FROM 20031015 TO 20031103

FEPP Fee payment procedure

Free format text: PAYOR NUMBER ASSIGNED (ORIGINAL EVENT CODE: ASPN); ENTITY STATUS OF PATENT OWNER: LARGE ENTITY

STCF Information on status: patent grant

Free format text: PATENTED CASE

FPAY Fee payment

Year of fee payment: 4

REMI Maintenance fee reminder mailed
FPAY Fee payment

Year of fee payment: 8

SULP Surcharge for late payment

Year of fee payment: 7

REMI Maintenance fee reminder mailed
FEPP Fee payment procedure

Free format text: 11.5 YR SURCHARGE- LATE PMT W/IN 6 MO, LARGE ENTITY (ORIGINAL EVENT CODE: M1556)

MAFP Maintenance fee payment

Free format text: PAYMENT OF MAINTENANCE FEE, 12TH YEAR, LARGE ENTITY (ORIGINAL EVENT CODE: M1553)

Year of fee payment: 12