US6954745B2 - Signal processing system - Google Patents
Signal processing system Download PDFInfo
- Publication number
- US6954745B2 US6954745B2 US09/866,597 US86659701A US6954745B2 US 6954745 B2 US6954745 B2 US 6954745B2 US 86659701 A US86659701 A US 86659701A US 6954745 B2 US6954745 B2 US 6954745B2
- Authority
- US
- United States
- Prior art keywords
- values
- signal
- parameter values
- sources
- parameters
- Prior art date
- Legal status (The legal status is an assumption and is not a legal conclusion. Google has not performed a legal analysis and makes no representation as to the accuracy of the status listed.)
- Expired - Fee Related, expires
Links
Images
Classifications
-
- G—PHYSICS
- G10—MUSICAL INSTRUMENTS; ACOUSTICS
- G10L—SPEECH ANALYSIS OR SYNTHESIS; SPEECH RECOGNITION; SPEECH OR VOICE PROCESSING; SPEECH OR AUDIO CODING OR DECODING
- G10L21/00—Processing of the speech or voice signal to produce another audible or non-audible signal, e.g. visual or tactile, in order to modify its quality or its intelligibility
- G10L21/02—Speech enhancement, e.g. noise reduction or echo cancellation
- G10L21/0272—Voice signal separating
- G10L21/028—Voice signal separating using properties of sound source
-
- G—PHYSICS
- G10—MUSICAL INSTRUMENTS; ACOUSTICS
- G10L—SPEECH ANALYSIS OR SYNTHESIS; SPEECH RECOGNITION; SPEECH OR VOICE PROCESSING; SPEECH OR AUDIO CODING OR DECODING
- G10L21/00—Processing of the speech or voice signal to produce another audible or non-audible signal, e.g. visual or tactile, in order to modify its quality or its intelligibility
- G10L21/02—Speech enhancement, e.g. noise reduction or echo cancellation
- G10L21/0208—Noise filtering
- G10L21/0216—Noise filtering characterised by the method used for estimating noise
- G10L2021/02161—Number of inputs available containing the signal or the noise to be suppressed
- G10L2021/02166—Microphone arrays; Beamforming
-
- H—ELECTRICITY
- H04—ELECTRIC COMMUNICATION TECHNIQUE
- H04R—LOUDSPEAKERS, MICROPHONES, GRAMOPHONE PICK-UPS OR LIKE ACOUSTIC ELECTROMECHANICAL TRANSDUCERS; DEAF-AID SETS; PUBLIC ADDRESS SYSTEMS
- H04R2201/00—Details of transducers, loudspeakers or microphones covered by H04R1/00 but not provided for in any of its subgroups
- H04R2201/40—Details of arrangements for obtaining desired directional characteristic by combining a number of identical transducers covered by H04R1/40 but not provided for in any of its subgroups
- H04R2201/403—Linear arrays of transducers
-
- H—ELECTRICITY
- H04—ELECTRIC COMMUNICATION TECHNIQUE
- H04R—LOUDSPEAKERS, MICROPHONES, GRAMOPHONE PICK-UPS OR LIKE ACOUSTIC ELECTROMECHANICAL TRANSDUCERS; DEAF-AID SETS; PUBLIC ADDRESS SYSTEMS
- H04R3/00—Circuits for transducers, loudspeakers or microphones
- H04R3/005—Circuits for transducers, loudspeakers or microphones for combining the signals of two or more microphones
Definitions
- the present invention relates to a signal processing method and apparatus.
- the invention is particularly relevant to a statistical analysis of signals output by a plurality of sensors in response to signals generated by a plurality of sources.
- the invention may be used in speech applications and in other applications to process the received signals in order to separate the signals generated by the plurality of sources.
- the invention can also be used to identify the number of sources that are present.
- the sources may, for example, be different users speaking and the sensors may be microphones.
- Current techniques employ arrays of microphones and an adaptive beam forming technique in order to isolate the speech from one of the speakers.
- This kind of beam forming system suffers from a number of problems. Firstly, it can only isolate signals from sources that are spatially distinct. It also does not work if the sources are relatively close together since the “beam” which it uses has a finite resolution. It is also necessary to know the directions from which the signals of interest will arrive and also the spacing between the sensors in the sensor array. Further, if N sensors are available, then only N ⁇ 1 “nulls” can be created within the sensing zone.
- An aim of the present invention is to provide an alternative technique for processing the signals output from a plurality of sensors in response to signals received from a plurality of sources.
- the present invention provides a signal processing apparatus comprising: one or more receivers for receiving a set of signal values representative of signals generated by a plurality of signal sources; a memory for storing a probability density function for parameters of a respective signal model, each of which is assumed to have generated a respective one of the signals represented by the received signal values; means for applying the received signal values to the probability density function; means for processing the probability density function with those values applied to derive samples of parameter values from the probability density function; and means for analysing some of the derived samples to determine parameter values that are representative of the signals generated by at least one of the sources.
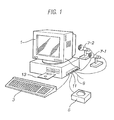
- FIG. 1 is a schematic view of a computer which may be programmed to operate in accordance with an embodiment of the present invention
- FIG. 2 is a block diagram illustrating the principal components of a speech recognition system
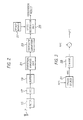
- FIG. 3 is a block diagram representing a model employed by a statistical analysis unit which forms part of the speech recognition system shown in FIG. 2 ;
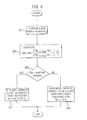
- FIG. 4 is a flow chart illustrating the processing steps performed by a model order selection unit forming part of the statistical analysis unit shown in FIG. 2 ;
- FIG. 5 is a flow chart illustrating the main processing steps employed by a Simulation Smoother which forms part of the statistical analysis unit shown in FIG. 2 ;
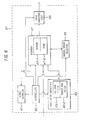
- FIG. 6 is a block diagram illustrating the main processing components of the statistical analysis unit shown in FIG. 2 ;
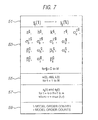
- FIG. 7 is a memory map illustrating the data that is stored in a memory which forms part of the statistical analysis unit shown in FIG. 2 ;
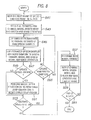
- FIG. 8 is a flow chart illustrating the main processing steps performed by the statistical analysis unit shown in FIG. 6 ;
- FIG. 9 a is a histogram for a model order of an auto regressive filter model which forms part of the model shown in FIG. 3 ;
- FIG. 9 b is a histogram for the variance of process noise modelled by the model shown in FIG. 3 ;
- FIG. 9 c is a histogram for a third coefficient of the AR filter model
- FIG. 10 is a block diagram illustrating the principal components of a speech recognition system embodying the present invention.
- FIG. 11 is a block diagram representing a model employed by a statistical analysis unit which forms part of the speech recognition system shown in FIG. 10 ;
- FIG. 12 is block diagram illustrating the principal components of a speech recognition system embodying the present invention.
- FIG. 13 is a flow chart illustrating the main processing steps performed by the statistical analysis units used in the speech recognition system shown in FIG. 12 ;
- FIG. 14 is a flow chart illustrating the processing steps performed by a model comparison unit forming part of the system shown in FIG. 12 during the processing of a frame of speech by the statistical analysis units shown in FIG. 12 ;
- FIG. 15 is a flow chart illustrating the processing steps performed by the model comparison unit shown in FIG. 12 after a sampling routine performed by the statistical analysis unit shown in FIG. 12 has been completed;
- FIG. 16 is a block diagram illustrating the main components of an alternative speech recognition system in which data output by the statistical analysis unit is used to detect the beginning and end of speech within the input signal;
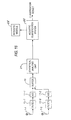
- FIG. 17 is a schematic block diagram illustrating the principal components of a speaker verification system
- FIG. 18 is a schematic block diagram illustrating the principal components of an acoustic classification system
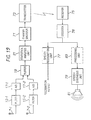
- FIG. 19 is a schematic block diagram illustrating the principal components of a speech encoding and transmission.
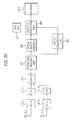
- FIG. 20 is a block diagram illustrating the principal components of a data file annotation system which uses the statistical analysis unit shown in FIG. 6 to provide quality of speech data for an associated annotation.
- Embodiments of the present invention can be implemented on computer hardware, but the embodiment to be described is implemented in software which is run in conjunction with processing hardware such as a personal computer, workstation, photocopier, facsimile machine or the like.
- FIG. 1 is a personal computer (PC) 1 which may be programmed to operate an embodiment of the present invention.
- a keyboard 3 , a pointing device 5 , two microphones 7 - 1 and 7 - 2 and a telephone-line 9 are connected to the PC 1 via an interface 11 .
- a keyboard 3 and pointing device 5 allow the system to be controlled by a user.
- the microphones 7 convert the acoustic speech signal of one or more users into equivalent electrical signals and supplies them to the PC 1 for processing.
- An internal modem and speech receiving circuit may be connected to the telephone line 9 so that the PC 1 can communicate with, for example, a remote computer or with a remote user.
- the program instructions which make the PC 1 operate in accordance with the present invention may be supplied for use with an existing PC 1 on, for example, a storage device such as a magnetic disc 13 , or by downloading the software from the Internet (not shown) via the internal modem and telephone line 9 .
- electrical signals representative of the input speech from the microphone 7 are input to a filter 15 which removes unwanted frequencies (in this embodiment frequencies above 8 kHz) within the input signal.
- the filtered signal is then sampled (at a rate of 16 kHz) and digitised by the analogue to digital converter 17 and the digitised speech samples are then stored in a buffer 19 .
- Sequential blocks (or frames) of speech samples are then passed from the buffer 19 to a statistical analysis unit 21 which performs a statistical analysis of each frame of speech samples in sequence to determine, amongst other things, a set of auto regressive (AR) coefficients representative of the speech within the frame.
- AR auto regressive
- the AR coefficients output by the statistical analysis unit 21 are then input, via a coefficient converter 23 to a cepstral based speech recognition unit 25 .
- the coefficient converter 23 converts the AR coefficients output by the analysis unit 21 into cepstral coefficients. This can be achieved using the conversion technique described in, for example, “Fundamentals of Speech Recognition” by Rabiner and Juang at pages 115 and 116.
- the speech recognition unit 25 then compares the cepstral coefficients for successive frames of speech with a set of stored speech models 27 , which may be template based or Hidden Markov Model based, to generate a recognition result.
- the statistical analysis unit 21 analyses the speech within successive frames of the input speech signal.
- the frames are overlapping.
- the frames of speech are non-overlapping and have a duration of 20 ms which, with the 16 kHz sampling rate of the analogue to digital converter 17 , results in a frame size of 320 samples.
- the analysis unit 21 assumes that there is an underlying process which generated each sample within the frame.
- the model of this process used in this embodiment is shown in FIG. 3 .
- AR auto regressive
- these AR filter coefficients are the same coefficients that the linear prediction (LP) analysis estimates albeit using a different processing technique.
- the raw speech samples s(n) generated by the speech source are input to a channel 33 which models the acoustic environment between the speech source 31 and the output of the analogue to digital converter 17 .
- the channel 33 should simply attenuate the speech as it travels from the source 31 to the microphone 7 .
- the signal (y(n)) output by the analogue to digital converter 17 will depend not only on the current raw speech sample (s(n)) but it will also depend upon previous raw speech samples.
- h 0 , h 1 , h 2 . . . h r are the channel filter coefficients representing the amount of distortion within the channel 33
- r is the channel filter model order
- ⁇ (n) represents a random additive measurement noise component.
- the analysis unit 21 aims to determine, amongst other things, values for the AR filter coefficients ( a ) which best represent the observed signal samples ( y (n)) in the current frame. It does this by determining the AR filter coefficients ( a ) that maximise the joint probability density function of the speech model, channel model, raw speech samples and the noise statistics given the observed signal samples output from the analogue to digital converter 17 , i.e.
- This term represents the joint probability density function for generating the vector of raw speech samples ( s (n)) during a frame, given the AR filter coefficients ( a ), the AR filter model order (k) and the process noise statistics ( ⁇ e 2 ). From equation (6) above, this joint probability density function for the raw speech samples can be determined from the joint probability density function for the process noise.
- a , k, ⁇ e 2 ) is given by: p ⁇ ( s _ ⁇ ( n )
- p( e (n)) is the joint probability density function for the process noise during a frame of the input speech and the second term on the right-hand side is known as the Jacobean of the transformation. In this case, the Jacobean is unity because of the triangular form of the matrix ⁇ (see equations (6) above).
- the statistical analysis unit 21 assumes that the process noise associated with the speech source 31 is Gaussian having zero mean and some unknown variance ⁇ e 2 .
- the joint probability density function for a vector of raw speech samples given the AR filter coefficients ( a ), the AR filter model order (k) and the process noise variance ( ⁇ e 2 ) is given by: p ⁇ ( s _ ⁇ ( n )
- a _ , k , ⁇ e 2 ) ⁇ ( 2 ⁇ ⁇ e 2 ) - N 2 ⁇ exp ⁇ [ - 1 2 ⁇ ⁇ e 2 ⁇ ( s _ ⁇ ( n ) T ⁇ s _ ⁇ ( n ) - 2 ⁇ a _ T ⁇ S ⁇ s _ ⁇ ( n ) + a _ T ⁇ S T ⁇ S ⁇ a _ ) ] ( 13 ) p( y (n)
- This term represents the joint probability density function for generating the vector of speech samples ( y (n)) output from the analogue to digital converter 17 , given the vector of raw speech samples ( s (n)), the channel filter coefficients ( h ), the channel filter model order (r) and the measurement noise statistics ( ⁇ ⁇ 2 )
- this joint probability density function can be determined from the joint probability density function for the process noise.
- s (n), h , r, ⁇ ⁇ 2 ) is given by: p ⁇ ( y _ ⁇ ( n )
- p( ⁇ (n)) is the joint probability density function for the measurement noise during a frame of the input speech and the second term on the right hand side is the Jacobean of the transformation which again has
- the statistical analysis unit 21 assumes that the measurement noise is Gaussian having zero mean and some unknown variance ⁇ ⁇ 2 . It also assumes that the measurement noise at one time point is independent of the measurement noise at another time point. Therefore, the joint probability density function for the measurement noise in a frame of the input speech will have the same form as the process noise defined in equation (12).
- the joint probability density function for a vector of speech samples ( y (n)) output from the analogue to digital converter 17 given the channel filter coefficients ( h ), the channel filter model order (r), the measurement noise statistics ( ⁇ ⁇ 2 ) and the raw speech samples ( s (n)) will have the following form: p ⁇ ( y _ ⁇ ( n )
- s _ ⁇ ( n ) , h _ , r , ⁇ ⁇ 2 ) ( 2 ⁇ ⁇ ⁇ 2 ) - N 2 ⁇ exp ⁇ [ - 1 2 ⁇ ⁇ ⁇ 2 ⁇ ( q _ ⁇ ( n ) T ⁇ q _ ⁇ ( n ) - 2 ⁇ h _ T ⁇ Y ⁇ q _ ⁇ ( n ) + h _ T ⁇ Y T ⁇ Y ⁇ h _ ) ] ( 15 )
- this joint probability density function for the vector of speech samples ( y (n)) is in terms of the variable q (n), this does not matter since q (n) is a function of y (n) and s (n), and s (n) is a given variable (ie known) for this probability density function.
- This term defines the prior probability density function for the AR filter coefficients ( a ) and it allows the statistical analysis unit 21 to introduce knowledge about what values it expects these coefficients will take.
- the statistical analysis unit 21 models this prior probability density function by a Gaussian having an unknown variance ( ⁇ a 2 ) and mean vector ( ⁇ a ) i.e.: p ⁇ ( a _
- k , ⁇ a 2 , ⁇ _ a ) ( 2 ⁇ ⁇ a 2 ) - N 2 ⁇ exp ⁇ [ - ( a _ - ⁇ _ a ) T ⁇ ( a _ - ⁇ _ a ) 2 ⁇ ⁇ a 2 ] ( 16 )
- the prior density functions (p( ⁇ a 2 ) and P( ⁇ a ) ) for these variables must be added to the numerator of equation (10) above.
- the mean vector ( ⁇ a ) can be set to zero and for the second and subsequent frames of speech being processed, it can be set to the mean vector obtained during the processing of the previous frame.
- p( ⁇ a ) is just a Dirac delta function located at the current value of ⁇ a and can therefore be ignored.
- the statistical analysis unit 21 could set this equal to some constant to imply that all variances are equally probable. However, this term can be used to introduce knowledge about what the variance of the AR filter coefficients is expected to be.
- the statistical analysis unit 21 models this variance prior probability density function by an Inverse Gamma function having parameters ⁇ a and ⁇ a , i.e.: p ⁇ ( ⁇ a 2
- ⁇ a , ⁇ a ) ( ⁇ a 2 ) - ( ⁇ a + 1 ) ⁇ a ⁇ ⁇ ⁇ ( ⁇ a ) ⁇ exp ⁇ [ - 1 ⁇ a 2 ⁇ ⁇ a ] ( 17 )
- the statistical analysis unit 21 will not have much knowledge about the variance of the AR filter coefficients. Therefore, initially, the statistical analysis unit 21 sets the variance ⁇ a 2 and the ⁇ and ⁇ parameters of the Inverse Gamma function to ensure that this probability density function is fairly flat and therefore non-informative. However, after the first frame of speech has been processed, these parameters can be set more accurately during the processing of the next frame of speech by using the parameter values calculated during the processing of the previous frame of speech.
- This term represents the prior probability density function for the channel model coefficients ( h ) and it allows the statistical analysis unit 21 to introduce knowledge about what values it expects these coefficients to take.
- this probability density function is modelled by a Gaussian having an unknown variance ( ⁇ h 2 ) and mean vector ( ⁇ h ), i.e.: p ⁇ ( h _
- r , ⁇ h 2 , ⁇ _ h ) ( 2 ⁇ ⁇ h 2 ) - N 2 ⁇ exp ⁇ [ - ( h _ - ⁇ _ h ) T ⁇ ( h _ - ⁇ _ h ) 2 ⁇ ⁇ h 2 ] ( 18 )
- the prior density functions (p( ⁇ h ) and p( ⁇ h )) must be added to the numerator of equation (10).
- the mean vector can initially be set to zero and after the first frame of speech has been processed and for all subsequent frames of speech being processed, the mean vector can be set to equal the mean vector obtained during the processing of the previous frame. Therefore, p( ⁇ h ) is also just a Dirac delta function located at the current value of ⁇ h and can be ignored.
- this is modelled by an Inverse Gamma function having parameters ⁇ h and ⁇ h .
- the variance ( ⁇ h 2 ) and the ⁇ and ⁇ parameters of the Inverse Gamma function can be chosen initially so that these densities are non-informative so that they will have little effect on the subsequent processing of the initial frame.
- the statistical analysis unit 21 models these by an Inverse Gamma function having parameters ⁇ e , ⁇ e and ⁇ ⁇ , ⁇ ⁇ respectively. Again, these variances and these Gamma function parameters can be set initially so that they are non-informative and will not appreciably affect the subsequent calculations for the initial frame.
- the prior probability density functions for the AR filter model order (k) and the channel model order (r) respectively are modelled by a uniform distribution up to some maximum order. In this way, there is no prior bias on the number of coefficients in the models except that they can not exceed these predefined maximums.
- the maximum AR filter model order (k) is thirty and the maximum channel model order (r) is one hundred and fifty.
- the statistical analysis unit 21 “draws samples” from it.
- the joint probability density function to be sampled is a complex multivariate function
- a Gibbs sampler is used which breaks down the problem into one of drawing samples from probability density functions of smaller dimensionality.
- the Gibbs sampler proceeds by drawing random variates from conditional densities as follows: first ⁇ ⁇ iteration p ⁇ ( a _ , k
- a sample can then be drawn from this standard Gaussian distribution to give a g (where g is the g th iteration of the Gibbs sampler) with the model order (k g ) being determined by a model order selection routine which will be described later.
- the drawing of a sample from this Gaussian distribution may be done by using a random number generator which generates a vector of random values which are uniformly distributed and then using a transformation of random variables using the covariance matrix and the mean value given in equations (22) and (23) to generate the sample.
- a random number generator is used which generates random numbers from a Gaussian distribution having zero mean and a variance of one.
- a sample is then drawn from this Inverse Gamma distribution by firstly generating a random number from a uniform distribution and then performing a transformation of random variables using the alpha and beta parameters given in equation (27), to give ( ⁇ e 2 ) g .
- the Gibbs sampler requires an initial transient period to converge to equilibrium (known as burn-in).
- burn-in the sample ( a L , k L , h L , r L , ( ⁇ e 2 ) L , ⁇ ⁇ 2 ) L , ( ⁇ a 2 ) L , ( ⁇ h 2 ) L , s(n) L ) is considered to be a sample from the joint probability density function defined in equation (19).
- the Gibbs sampler performs approximately one hundred and fifty (150) iterations on each frame of input speech and discards the samples from the first fifty iterations and uses the rest to give a picture (a set of histograms) of what the joint probability density function defined in equation (19) looks like. From these histograms, the set of AR coefficients ( a ) which best represents the observed speech samples ( y (n)) from the analogue to digital converter 17 are determined. The histograms are also used to determine appropriate values for the variances and channel model coefficients ( h ) which can be used as the initial values for the Gibbs sampler when it processes the next frame of speech.
- model order (k) of the AR filter and the model order (r) of the channel filter are updated using a model order selection routine.
- this is performed using a technique derived from “Reversible jump Markov chain Monte Carlo computation”, which is described in the paper entitled “Reversible jump Markov chain Monte Carlo computation and Bayesian model determination” by Peter Green, Biometrika, vol 82, pp 711 to 732, 1995.
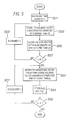
- FIG. 4 is a flow chart which illustrates the processing steps performed during this model order selection routine for the AR filter model order (k).
- a new model order (k 2 ) is proposed.
- a sample is drawn from a discretised Laplacian density function centred on the current model order (k 1 ) and with the variance of this Laplacian density function being chosen a priori in accordance with the degree of sampling of the model order space that is required.
- the ratio term is the ratio of the conditional probability given in equation (21) evaluated for the current AR filter coefficients (a) drawn by the Gibbs sampler for the current model order ((k 1 )) and for the proposed new model order (k 2 ).
- the matrix S must first be resized and then a new sample must be drawn from the Gaussian distribution having the mean vector and covariance matrix defined by equations (22) and (23) (determined for the resized matrix S), to provide the AR filter coefficients ( a ⁇ 1:k2> ) for the new model order (k 2 ). If k 2 ⁇ k 1 then all that is required is to delete the last (k 1 ⁇ k 2 ) samples from the a vector. If the ratio in equation (31) is greater than one, then this implies that the proposed model order (k 2 ) is better than the current model order whereas if it is less than one then this implies that the current model order is better than the proposed model order.
- the model order variable (MO) is compared, in step s 5 , with a random number which lies between zero and one. If the model order variable (MO) is greater than this random number, then the processing proceeds to step s 7 where the model order is set to the proposed model order (k 2 ) and a count associated with the value of k 2 is incremented.
- step s 9 the processing proceeds to step s 9 where the current model order is maintained and a count associated with the value of the current model order (k 1 ) is incremented. The processing then ends.
- This model order selection routine is carried out for both the model order of the AR filter model and for the model order of the channel filter model. This routine may be carried out at each Gibbs iteration. However, this is not essential. Therefore, in this embodiment, this model order updating routine is only carried out every third Gibbs iteration.
- the Simulation Smoother is run before the Gibbs Sampler. It is also run again during the Gibbs iterations in order to update the estimates of the raw speech samples. In this embodiment, the Simulation Smoother is run every fourth Gibbs iteration.
- the dimensionality of the raw speech vectors ( ⁇ (n)) and the process noise vectors ( ê (n)) do not need to be N ⁇ 1 but only have to be as large as the greater of the model orders—k and r.
- the channel model order (r) will be larger than the AR filter model order (k).
- the vector of raw speech samples ( ⁇ (n)) and the vector of process noise ( ê (n)) only need to be r ⁇ 1 and hence the dimensionality of the matrix ⁇ only needs to be r ⁇ r.
- the Simulation Smoother involves two stages—a first stage in which a Kalman filter is run on the speech samples in the current frame and then a second stage in which a “smoothing” filter is run on the speech samples in the current frame using data obtained from the Kalman filter stage.
- step s 25 the scalar values w(t) and d(t) are stored together with the r ⁇ r matrix L(t) (or alternatively the Kalman filter gain vector k f (t) could be stored from which L(t) can be generated).
- step s 27 the system determines whether or not all the speech samples in the current frame have been processed. If they have not, then the processing proceeds to step s 29 where the time variable t is incremented by one so that the next sample in the current frame will be processed in the same way. Once all N samples in the current frame have been processed in this way and the corresponding values stored, the first stage of the Simulation Smoother is complete.
- step s 31 the second stage of the Simulation Smoother is started in which the smoothing filter processes the speech samples in the current frame in reverse sequential order.
- the system runs the following set of smoothing filter equations on the current speech sample being processed together with the stored Kalman filter variables computed for the current speech sample being processed:
- C ( t ) ⁇ e 2 ( I ⁇ e 2 U ( t )) ⁇ ( t ) ⁇ N (0, C ( t ))
- the processing then proceeds to step s 33 where the estimate of the process noise ( ⁇ tilde over (e) ⁇ (t)) for the current speech sample being processed and the estimate of the raw speech sample ( ⁇ (t)) for the current speech sample being processed are stored.
- step s 35 the system determines whether or not all the speech samples in the current frame have been processed.
- step s 37 the time variable t is decremented by one so that the previous sample in the current frame will be processed in the same way.
- the matrix S and the matrix Y require raw speech samples s(n ⁇ N ⁇ 1) to s(n ⁇ N ⁇ k+1) and s(n ⁇ N ⁇ 1) to s(n ⁇ N ⁇ r+1) respectively in addition to those in s (n).
- These additional raw speech samples can be obtained either from the processing of the previous frame of speech or if there are no previous frames, they can be set to zero.
- the Gibbs sampler can be run to draw samples from the above described probability density functions.
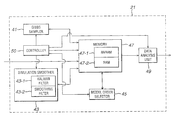
- FIG. 6 is a block diagram illustrating the principal components of the statistical analysis unit 21 of this embodiment. As shown, it comprises the above described Gibbs sampler 41 , Simulation Smoother 43 (including the Kalman filter 43 - 1 and smoothing filter 43 - 2 ) and model order selector 45 . It also comprises a memory 47 which receives the speech samples of the current frame to be processed, a data analysis unit 49 which processes the data generated by the Gibbs sampler 41 and the model order selector 45 and a controller 50 which controls the operation of the statistical analysis unit 21 .
- the memory 47 includes a non volatile memory area 47 - 1 and a working memory area 47 - 2 .
- the non volatile memory 47 - 1 is used to store the joint probability density function given in equation (19) above and the equations for the variances and mean values and the equations for the Inverse Gamma parameters given above in equations (22) to (24) and (27) to (30) for the above mentioned conditional probability density functions for use by the Gibbs sampler 41 .
- the non volatile memory 47 - 1 also stores the Kalman filter equations given above in equation (33) and the smoothing filter equations given above in equation 34 for use by the Simulation Smoother 43 .
- FIG. 7 is a schematic diagram illustrating the parameter values that are stored in the working memory area (RAM) 47 - 2 .
- the RAM includes a store 51 for storing the speech samples y f (1) to y f (N) output by the analogue to digital converter 17 for the current frame (f) being processed. As mentioned above, these speech samples are used in both the Gibbs sampler 41 and the Simulation Smoother 43 .
- the RAM 47 - 2 also includes a store 57 for storing the estimates of the raw speech samples ( ⁇ f (t)) and the estimates of the process noise ( ⁇ tilde over (e) ⁇ f (t)) generated by the smoothing filter 43 - 2 , as discussed above.
- the RAM 47 - 2 also includes a store 59 for storing the model order counts which are generated by the model order selector 45 when the model orders for the AR filter model and the channel model are updated.
- FIG. 8 is a flow diagram illustrating the control program used by the controller 50 , in this embodiment, to control the processing operations of the statistical analysis unit 21 .
- the controller 50 retrieves the next frame of speech samples to be processed from the buffer 19 and stores them in the memory store 51 .
- the processing then proceeds to step s 43 where initial estimates for the channel model, raw speech samples and the process noise and measurement noise statistics are set and stored in the store 53 . These initial estimates are either set to be the values obtained during the processing of the previous frame of speech or, where there are no previous frames of speech, are set to their expected values (which may be zero).
- the processing then proceeds to step s 45 where the Simulation Smoother 43 is activated so as to provide an estimate of the raw speech samples in the manner described above.
- step s 47 one iteration of the Gibbs sampler 41 is run in order to update the channel model, speech model and the process and measurement noise statistics using the raw speech samples obtained in step s 45 .
- These updated parameter values are then stored in the memory store 53 .
- step s 49 the controller 50 determines whether or not to update the model orders of the AR filter model and the channel model. As mentioned above, in this embodiment, these model orders are updated every third Gibbs iteration. If the model orders are to be updated, then the processing proceeds to step s 51 where the model order selector 45 is used to update the model orders of the AR filter model and the channel model in the manner described above. If at step s 49 the controller 50 determines that the model orders are not to be updated, then the processing skips step s 51 and the processing proceeds to step s 53 . At step s 53 , the controller 50 determines whether or not to perform another Gibbs iteration.
- step s 55 the controller 50 decides whether or not to update the estimates of the raw speech samples (s(t)). If the raw speech samples are not to be updated, then the processing returns to step s 47 where the next Gibbs iteration is run.
- the Simulation Smoother 43 is run every fourth Gibbs iteration in order to update the raw speech samples. Therefore, if the controller 50 determines, in step s 55 that there has been four Gibbs iterations since the last time the speech samples were updated, then the processing returns to step s 45 where the Simulation Smoother is run again to provide new estimates of the raw speech samples (s(t)). Once the controller 50 has determined that the required 150 Gibbs iterations have been performed, the controller 50 causes the processing to proceed to step s 57 where the data analysis unit 49 analyses the model order counts generated by the model order selector 45 to determine the model orders for the AR filter model and the channel model which best represents the current frame of speech being processed.
- step s 59 the data analysis unit 49 analyses the samples drawn from the conditional densities by the Gibbs sampler 41 to determine the AR filter coefficients ( a ), the channel model coefficients ( h ), the variances of these coefficients and the process and measurement noise variances which best represent the current frame of speech being processed.
- step s 61 the controller 50 determines whether or not there is any further speech to be processed. If there is more speech to be processed, then processing returns to step S 41 and the above process is repeated for the next frame of speech. Once all the speech has been processed in this way, the processing ends.
- the data analysis unit 49 initially determines, in step s 57 , the model orders for both the AR filter model and the channel model which best represents the current frame of speech being processed. It does this using the counts that have been generated by the model order selector 45 when it was run in step s 51 . These counts are stored in the store 59 of the RAM 47 - 2 . In this embodiment, in determining the best model orders, the data analysis unit 49 identifies the model order having the highest count.
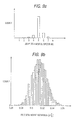
- FIG. 9 a is an exemplary histogram which illustrates the distribution of counts that is generated for the model order (k) of the AR filter model. Therefore, in this example, the data analysis unit 49 would set the best model order of the AR filter model as five.
- the data analysis unit 49 performs a similar analysis of the counts generated for the model order (r) of the channel model to determine the best model order for the channel model.
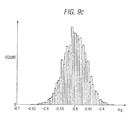
- the data analysis unit 49 analyses the samples generated by the Gibbs sampler 41 which are stored in the store 53 of the RAM 47 - 2 , in order to determine parameter values that are most representative of those samples. It does this by determining a histogram for each of the parameters from which it determines the most representative parameter value. To generate the histogram, the data analysis unit 49 determines the maximum and minimum sample value which was drawn by the Gibbs sampler and then divides the range of parameter values between this minimum and maximum value into a predetermined number of sub-ranges or bins. The data analysis unit 49 then assigns each of the sample values into the appropriate bins and counts how many samples are allocated to each bin.
- FIG. 9 b illustrates an example histogram which is generated for the variance ( ⁇ e 2 ) of the process noise, from which the data analysis unit 49 determines that the variance representative of the sample is 0.3149.
- the data analysis unit 49 determines and analyses a histogram of the samples for each coefficient independently.
- FIG. 9 c shows an exemplary histogram obtained for the third AR filter coefficient (a 3 ), from which the data analysis unit 49 determines that the coefficient representative of the samples is ⁇ 0.4977.
- the data analysis unit 49 only outputs the AR filter coefficients which are passed to the coefficient convertor 23 shown in FIG. 2 .
- the remaining parameter values determined by the data analysis unit 49 are stored in the RAM 47 - 2 for use during the processing of the next frame of speech.
- the AR filter coefficients output by the statistical analysis unit 21 are input to the coefficient convertor 23 which converts these coefficients into cepstral coefficients which are then compared with stored speech models 27 by the speech recognition unit 25 in order to generate a recognition result.
- a speech processing technique has been described above which uses statistical analysis techniques to determine sets of AR filter coefficients representative of an input speech signal.
- the technique is more robust and accurate than prior art techniques which employ maximum likelihood estimators to determine the AR filter coefficients.
- the statistical analysis of each frame uses knowledge obtained from the processing of the previous frame.
- the model order for the AR filter model is not assumed to be constant and can vary from frame to frame. In this way, the optimum number of AR filter coefficients can be used to represent the speech within each frame.
- the AR filter coefficients output by the statistical analysis unit 21 will more accurately represent the corresponding input speech.
- the AR filter coefficients that are determined will be more representative of the actual speech and will be less likely to include distortive effects of the channel.
- variance information is available for each of the parameters, this provides an indication of the confidence of each of the parameter estimates. This is in contrast to maximum likelihood and least square approaches, such as linear prediction analysis, where point estimates of the parameter values are determined.
- FIG. 10 is a schematic block diagram illustrating a speech recognition system which employs a statistical analysis unit embodying the present invention.
- the system has two microphones 7 - 1 and 7 - 2 which convert, in this embodiment, the speech from two speakers (not shown) into equivalent electrical signals which are passed to a respective filter circuit 15 - 1 and 15 - 2 .
- the filters 15 remove frequencies above 8 kHz since the filtered signals are then converted into corresponding digital signals at a sampling rate of 16 kHz by a respective analogue to digital converter 17 - 1 and 17 - 2 .
- the digitized speech samples from the analogue to digital converters 17 are then fed into the buffer 19 .
- the statistical analysis unit 21 analyses the speech within successive frames of the input speech signal from the two microphones.
- the two frame sequences are processed together so that the frame of speech from microphone 7 - 1 at time t is processed with the frame of speech received from the microphone 7 - 2 at time t.
- the frames of speech are non-overlapping and have a duration of 20 ms which, with the 16 kHz sampling rate of the analogue to digital converters 17 , results in the statistical analysis unit 21 processing blocks of 640 speech samples (corresponding to two frames of 320 samples).
- the analysis unit 21 assumes that there is an underlying process similar to that of the single speaker single microphone system described above.
- the particular model used in this embodiment is illustrated in FIG. 11 .
- each of the speech sources 31 is modelled by an auto aggressive (AR) process.
- AR auto aggressive
- there will be a respective equation (1) for each of the sources 31 - 1 and 31 - 2 thereby defining two unknown AR filter coefficient vectors a 1 and a 2 , each having a respective model order k 1 and k 2 .
- These source models will also have a respective process noise component e 1 (n) and e 2 (n).
- the model also assumes that the speech generated by each of the sources 31 is received by both microphones 7 . There is therefore a respective channel 33 - 11 to 33 - 22 between each source 31 and each microphone 7 . There is also a respective measurement noise component ⁇ 1 (n) and ⁇ 2 (n) added to the signal received by each microphone.
- r 21 is the model order of the channel between the second speech source 31 - 2 and the microphone 7 - 1 .
- a similar equation will exist to represent the signal received from the other microphone 7 - 2 .
- the statistical analysis unit 21 aims to determine values for the AR filter coefficients for the two speech sources, which best represent the observed signal samples from the two microphones in the current frame being processed. It does this, by determining the AR filter coefficients for the two speakers ( a 1 and a 2 ) that maximise the joint probability density function of the speech models, channel models, raw speech samples and the noise statistics given the observed signal samples output from the two analogue to digital converters 17 - 1 and 17 - 2 , i.e.
- ⁇ _ 1 ⁇ ( n ) q _ 1 ⁇ ( n ) - [ Y ⁇ Y 2 ] ⁇ [ h _ 11 ⁇ h _ 21 ] ( 37 )
- h _ 11 [ h 111 h 112 h 113 ⁇ h 11 ⁇ r 11 ]
- the joint probability density function for the speech samples ( y 1 (n)) output from the analogue to digital converter 17 - 1 is determined from the joint probability density function for the associated measurement noise ( ⁇ ⁇ 1 2 ) using equation (14) above.
- the Jacobean will be one and the resulting joint probability density function will have the following form: p ⁇ ( y _ 1 ⁇ ( n )
- s _ 1 ⁇ ( n ) , s _ 2 ⁇ ( n ) , h _ 11 , h _ 21 , r 11 , r 21 , ⁇ ⁇ 1 2 ) ( 2 ⁇ ⁇ ⁇ 1 2 ) - N 2 ⁇ exp ⁇ [ - 1 2 ⁇ ⁇ ⁇ 1 2 ⁇ ( q _ 1 ⁇ ( n ) T ⁇ q _ 1 ⁇ ( n ) - 2 ⁇ q _ 1 ⁇ ( n ) ⁇ [ Y 1 ⁇ Y 2 ] ⁇ [ h _ 11 ⁇ h _ 21 ] + [ h _ 11 T ⁇ h _ 21 T ] ⁇ [ Y 1 T ⁇ Y 1 Y 2 T ⁇ Y 1 Y 1
- the statistical analysis unit 21 assumes that the raw speech data which passes through the two channels to the microphone 7 - 1 are independent of each other. This allows the above Gaussian distribution to be simplified since the cross components Y 1 T Y 2 and Y 2 T Y 1 can be assumed to be zero.
- the Gibbs sampler is then used to draw samples from the combined joint probability density function in the same way as for the single speaker-single microphone system, except that there are many more parameters and hence conditional densities to be sampled from.
- the model order selector is used to adjust each of the model orders (k 1 ,K 2 and r 11 -r 22 ) during the Gibbs iterations.
- estimates of the raw speech samples from both the sources 31 - 1 and 31 - 2 are needed for the Gibbs sampling and again, these are estimated using the Simulation Smoother.
- the state space equations for the two speaker and two microphone system are slightly different to those of the single speaker single microphone system and are therefore reproduced below.
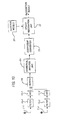
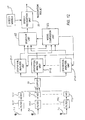
- FIG. 12 is a block diagram illustrating a multi-speaker multi-microphone speech recognition system.
- the system comprises a plurality of microphones 7 - 1 to 7 -j, each of which receives speech signals from an unknown number of speech sources (not shown).
- the corresponding electrical signals output by the microphones 7 are then passed through a respective filter 15 and then digitized by a respective analogue to digital converter 17 .
- the digitized speech signals from each of the microphones 7 are then stored in the buffer 19 as before.
- FIG. 12 is a block diagram illustrating a multi-speaker multi-microphone speech recognition system.
- the system comprises a plurality of microphones 7 - 1 to 7 -j, each of which receives speech signals from an unknown number of speech sources (not shown).
- the corresponding electrical signals output by the microphones 7 are then passed through a respective filter 15 and then digitized by a respective analogue to digital converter 17 .
- the digitized speech signals from each of the microphones 7 are then
- the speech stored within the buffer 19 is fed into a plurality (m) of statistical analysis units 21 .
- each of the analysis units 21 performs a similar analysis using the same input data (the speech samples from the microphones) but assumes that the input data was generated by a different number of speakers.
- statistical analysis unit 21 - 1 may be programmed to assume that there are three speakers currently speaking whereas statistical analysis unit 21 - 2 may be programmed to assume that there are five speakers currently speaking etc.
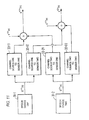
- the model comparison unit 64 determines the mean AR filter coefficients for the programmed number of speakers in the manner described above and outputs these to a selector unit 62 .
- the model comparison unit 64 After the model comparison unit 64 has determined the best analysis unit, it passes a control signal to the selector unit 62 which causes the AR filter coefficients output by this analysis unit 21 to be passed to the speech recognition unit 25 for comparison with the speech models 27 .
- the model comparison unit 64 is also arranged to reprogram each of the statistical analysis units 21 after the processing of each frame has been completed, so that the number of speakers that each of the analysis units is programmed to model is continuously adapted. In this way, the system can be used in, for example, a meeting where the number of participants speaking at any one time may vary considerably.
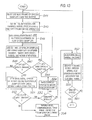
- FIG. 13 is a flow diagram illustrating the processing steps performed in this embodiment, by each of the statistical analysis units 21 .
- the processing steps employed are substantially the same as in the above embodiment, except for the additional steps S 52 , S 54 and S 56 . A description of these steps will now be given.
- step S 52 if step s 54 determines that another Gibbs iteration is to be run, then the processing proceeds to step S 52 where each of the statistical analysis units 21 - 1 determines whether or not to send the parameter samples from the last Gibbs iteration to the model comparison unit 64 .
- the model comparison unit 64 compares the samples generated by the analysis units every fifth Gibbs iteration.
- step S 54 each of the statistical analysis units 21 - 1 sends the current set of parameter samples to the model comparison unit 64 .
- the processing then proceeds to step S 55 as before.
- step S 56 each of the statistical analysis units 21 - 1 informs the model comparison unit 64 that it has completed the Gibbs iterations for the current frame before proceeding to step s 57 as before.
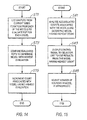
- FIG. 14 is a flow chart and illustrates the processing steps performed by the model comparison unit 64 when it receives the samples from each of the statistical analysis units 21 during the Gibbs iterations.
- the model comparison unit 64 uses the samples received from each of the statistical analysis units 21 to evaluate the probability density function given in equation (43).
- the processing then proceeds to step S 73 where the model comparison unit 64 compares the evaluated probability density functions to determine which statistical analysis unit gives the highest evaluation.
- the processing proceeds to step S 75 where the model comparison unit 64 increments a count associated with the statistical analysis unit 21 having the highest evaluation.
- the processing ends.
- the model comparison unit performs the processing steps shown in FIG. 15 .
- the model comparison unit 64 analyses the accumulated counts associated with each of the statistical analysis units, to determine the analysis unit having the highest count.
- the processing then proceeds to step S 83 where the model comparison unit 64 outputs a control signal to the selector unit 62 in order to cause the AR filter coefficients generated by the statistical analysis unit having the highest count to be passed through the selector 62 to the speech recognition unit 25 .
- the processing then proceeds to step S 85 where the model comparison unit 64 determines whether or not it needs to adjust the settings of each of the statistical analysis units 21 , and in particular to adjust the number of speakers that each of the statistical analysis units assumes to be present within the speech.
- a multi speaker multi microphone speech recognition has been described above.
- This system has all the advantages described above for the single speaker single microphone system. It also has the further advantages that it can simultaneously separate and model the speech from a number of sources. Further, there is no limitation on the physical separation of the sources relative to each other or relative to the microphones. Additionally, the system does not need to know the physical separation between the microphones and it is possible to separate the signals from each source even where the number of microphones is fewer than the number of sources.
- the statistical analysis unit was used as a pre-processor for a speech recognition system in order to generate AR coefficients representative of the input speech. It also generated a number of other parameter values (such as the process noise variances and the channel model coefficients), but these were not output by the statistical analysis unit. As those skilled in the art will appreciate, the AR coefficients and some of the other parameters which are calculated by the statistical analysis unit can be used for other purposes.
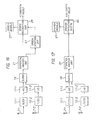
- FIG. 16 illustrates a speech recognition system which is similar to the speech recognition system shown in FIG. 10 except that there is no coefficient converter since the speech recognition unit 25 and speech models 27 are AR coefficient based. The speech recognition system shown in FIG.
- the 16 also has an additional speech detection unit 61 which receives the AR filter coefficients ( a ) together with the AR filter model order (k) generated by the statistical analysis unit 21 and which is operable to determine from them when speech is present within the signals received from the microphones 7 . It can do this, since the AR filter model orders and the AR filter coefficient values will be larger during speech than when there is no speech present. Therefore, by comparing the AR filter model order (k) and/or the AR filter coefficient values with appropriate threshold values, the speech detection unit 61 can determine whether or not speech is present within the input signal. When the speech detection unit 61 detects the presence of speech, it outputs an appropriate control signal to the speech recognition unit 25 which causes it to start processing the AR coefficients it receives from the statistical analysis unit 21 . Similarly, when the speech detection unit 61 detects the end of speech, it outputs an appropriate control signal to the speech recognition unit 25 which causes it to stop processing the AR coefficients it receives from the statistical analysis unit 21 .
- a speech recognition system having a particular speech pre-processing front end which performed a statistical analysis of the input speech.
- this pre-processing can be used in speech processing systems other than speech recognition systems.
- the statistical analysis unit 21 may form a front end to a speaker verification system 65 .
- the speaker verification system 65 compares the sequences of AR filter coefficients for the different speakers output by the statistical analysis unit 21 with pre-stored speaker models 67 to determine whether or not the received speech corresponds to known users.
- FIG. 18 illustrates another application for the statistical analysis unit 21 .
- FIG. 18 shows an acoustic classification system.
- the statistical analysis unit 21 is used to generate the AR filter coefficients for each of a number of acoustic sources (which may or may not be speech) in the manner described above.
- the coefficients are then passed to an acoustic classification system 66 which compares the AR coefficients of each source with pre-stored acoustic models 68 to generate a classification result.
- acoustic classification system may be used, for example, to distinguish and identify, for example, percussion sounds, woodwind sounds, brass sounds as well as speech.
- FIG. 19 illustrates another application for the statistical analysis unit 21 .
- FIG. 19 shows a speech encoding and transmission system.
- the statistical analysis unit 21 is used to generate the AR filter coefficients for each speaker in the manner described above. These coefficients are then passed to a channel encoder which encodes the sequences of AR filter coefficients so that they are in a more suitable form for transmission through a communications channel.
- the encoded AR filter coefficients are then passed to a transmitter 73 where the encoded data is used to modulate a carrier signal which is then transmitted to a remote receiver 75 .
- the receiver 75 demodulates the received signal to recover the encoded data which is then decoded by a decoder 76 .
- sequences of AR filter coefficients output by the decoder are then either passed to a speech recognition unit 77 which compares the sequences of AR filter coefficients with stored reference models (not shown) to generate a recognition result or to a speech synthesis unit 79 which re-generates the speech and outputs it via a loudspeaker 81 .
- the sequences of AR filter coefficients may also pass through an optional processing unit 83 (shown in phantom) which can be used to manipulate the characteristics of the speech that is synthesised.
- an optional processing unit 83 shown in phantom
- the optimum number of AR filter coefficients will be used to represent the speech from each speaker within each frame.
- the number of AR filter coefficients is assumed to be constant and hence the prior art techniques tend to over parameterise the speech in order to ensure that information is not lost.
- the amount of data which has to be transmitted from the transmitter to the receiver will be less than with the prior art systems which assume a fixed size of AR filter model.
- FIG. 20 shows another system which uses the statistical analysis unit 21 described above.
- the system shown in FIG. 20 automatically generates voice annotation data for adding to a data file.
- the system may be used, for example, to generate voice annotation data for a meeting involving a number of participants, with the data file 91 being a recorded audio file of the meeting.
- the speech signals received from the microphones is processed by the statistical analysis unit 21 to separate the speech signals from each of the participants.
- Each participant's speech is then tagged with an identifier identifying who is speaking and then passed to a speech recognition unit 97 , which generates words and/or phoneme data for each speaker.
- This word and/or phoneme data is then passed to a data file annotation unit 99 , which annotates the data file 91 with the word and/or phoneme data and then stores the annotated data file in a database 101 .
- a user can search the data file 91 for a particular topic that was discussed at the meeting by a particular participant.
- the statistical analysis unit 21 also outputs the variance of the AR filter coefficients for each of the speakers.
- This variance information is passed to a speech quality assessor 93 which determines from this variance data, a measure of the quality of each participant's speech.
- a speech quality assessor 93 determines from this variance data, a measure of the quality of each participant's speech.
- the speech quality assessor 93 then outputs this quality indicator to the data file annotation unit 99 which annotates the data file 91 with this speech quality information.
- these speech quality indicators which are stored with the data file are useful for subsequent retrieval operations.
- the user wishes to retrieve a data file 91 from the database 101 (using a voice query)
- it is useful to know the quality of the speech that was used to annotate the data file and/or the quality of the voice retrieval query used to retrieve the data file, since this will affect the retrieval performance.
- the voice annotation is of a high quality and the user's retrieval query is also of a high quality
- a stringent search of the database 101 can be performed, in order to reduce the amount of false identifications.
- the original voice annotation is of a low quality or if the user's retrieval query is of a low quality
- a less stringent search of the database 101 can be performed to give a higher chance of retrieving the correct data file 91 .
- the variance ( ⁇ e 2 ) of the process noise is also a good measure of the quality of the input speech, since this variance is also measure of the energy in the process noise. Therefore, the variance of the process noise can be used in addition to or instead of the variance of the AR filter coefficients to provide the measure of quality of the input speech.
- the statistical analysis unit 21 may be used solely for providing information to the speech detection unit 61 and a separate speech preprocessor may be used to parameterise the input speech for use by the speech recognition unit 25 .
- a separate speech preprocessor may be used to parameterise the input speech for use by the speech recognition unit 25 .
- such separate parameterisation of the input speech is not preferred because of the additional processing overhead involved.
- the above embodiments have described a statistical analysis technique for processing signals received from a number of microphones in response to speech signals generated by a plurality of speakers.
- the statistical analysis technique described above may be employed in fields other than speech and/or audio processing.
- the system may be used in fields such as data communications, sonar systems, radar systems etc.
- the AR filter coefficients output by the statistical analysis unit 21 were converted into cepstral coefficients since the speech recognition unit used in the first embodiment was a cepstral based system.
- the coefficient converter 23 may be arranged to convert the AR filter coefficients into the appropriate spectral parameters.
- the coefficient converter 23 is unnecessary.
- Gaussian and Inverse Gamma distributions were used to model the various prior probability density functions of equation (19).
- the reason these distributions were chosen is that they are conjugate to one another.
- each of the conditional probability density functions which are used in the Gibbs sampler will also either be Gaussian or Inverse Gamma. This therefore simplifies the task of drawing samples from the conditional probability densities.
- the noise probability density functions could be modelled by Laplacian or student-t distributions rather than Gaussian distributions.
- the probability density functions for the variances may be modelled by a distribution other than the Inverse Gamma distribution. For example, they can be modelled by a Rayleigh distribution or some other distribution which is always positive.
- the use of probability density functions that are not conjugate will result in increased complexity in drawing samples from the conditional densities by the Gibbs sampler.
- a Simulation Smoother was used to generate estimates for the raw speech samples.
- This Simulation Smoother included a Kalman filter stage and a smoothing filter stage in order to generate the estimates of the raw speech samples.
- the smoothing filter stage may be omitted, since the Kalman filter stage generates estimates of the raw speech (see equation (33)).
- these raw speech samples were ignored, since the speech samples generated by the smoothing filter are considered to be more accurate and robust. This is because the Kalman filter essentially generates a point estimate of the speech samples from the joint probability density function for the raw speech, whereas the Simulation Smoother draws a sample from this probability density function.
- a Simulation Smoother was used in order to generate estimates of the raw speech samples. It is possible to avoid having to estimate the raw speech samples by treating them as “ nuisance parameters” and integrating them out of equation (19). However, this is not preferred, since the resulting integral will have a much more complex form than the Gaussian and Inverse Gamma mixture defined in equation (19). This in turn will result in more complex conditional probabilities corresponding to equations (20) to (30). In a similar way, the other nuisance parameters (such as the coefficient variances or any of the Inverse Gamma, alpha and beta parameters) may be integrated out as well. However, again this is not preferred, since it increases the complexity of the density function to be sampled using the Gibbs sampler. The technique of integrating out nuisance parameters is well known in the field of statistical analysis and will not be described further here.
- the data analysis unit analysed the samples drawn by the Gibbs sampler by determining a histogram for each of the model parameters and then determining the value of the model parameter using a weighted average of the samples drawn by the Gibbs sampler with the weighting being dependent upon the number of samples in the corresponding bin.
- the value of the model parameter may be determined from the histogram as being the value of the model parameter having the highest count.
- a predetermined curve such as a bell curve
- the statistical analysis unit modelled the underlying speech production process with separate speech source models (AR filters) and channel models. Whilst this is the preferred model structure, the underlying speech production process may be modelled without the channel models. In this case, there is no need to estimate the values of the raw speech samples using a Kalman filter or the like, although this can still be done. However, such a model of the underlying speech production process is not preferred, since the speech model will inevitably represent aspects of the channel as well as the speech. Further, although the statistical analysis unit described above ran a model order selection routine in order to allow the model orders of the AR filter model and the channel model to vary, this is not essential. In particular, the model order of the AR filter model and the channel model may be fixed in advance, although this is not preferred since it will inevitably introduce errors into the representation.
- the speech that was processed was received from a user via a microphone.
- the speech may be received from a telephone line or may have been stored on a recording medium.
- the channel models will compensate for this so that the AR filter coefficients representative of the actual speech that has been spoken should not be significantly affected.
- the speech generation process was modelled as an auto-regressive (AR) process and the channel was modelled as a moving average (MA) process.
- AR auto-regressive
- MA moving average
- other signal models may be used. However, these models are preferred because it has been found that they suitably represent the speech source and the channel they are intended to model.
- a new model order was proposed by drawing a random variable from a predetermined Laplacian distribution function.
- the new model order may be proposed in a deterministic way (ie under predetermined rules), provided that the model order space is sufficiently sampled.
Abstract
Description
s(n)=a 1 s(n−1)+a 2 s(n−2)+ . . . +a k s(n−k)+e(n) (1)
where a1, a2 . . . ak are the AR filter coefficients representing the amount of correlation between the speech samples; k is the AR filter model order; and e(n) represents random process noise which is involved in the generation of the raw speech samples. As those skilled in the art of speech processing will appreciate, these AR filter coefficients are the same coefficients that the linear prediction (LP) analysis estimates albeit using a different processing technique.
y(n)=h 0 s(n)+h 1 s(n−1)+h 2 s(n−2)+ . . . +h r s(n−r)+ε(n) (2)
where y(n) represents the signal sample output by the analogue to
which can be written in vector form as:
s (n)=S·a+e (n) (4)
where
which can be written in vector notation as:
e (n)=Äs (n) (6)
where
(where q(n)=y(n)−s(n)) which can be written in vector form as:
q (n)=Y·h +ε(n) (8)
where
where σe 2 and σε 2 represent the process and measurement noise statistics respectively. As those skilled in the art will appreciate, this function defines the probability that a particular speech model, channel model, raw speech samples and noise statistics generated the observed frame of speech samples (y(n)) from the analogue to digital converter. To do this, the
where p(e(n)) is the joint probability density function for the process noise during a frame of the input speech and the second term on the right-hand side is known as the Jacobean of the transformation. In this case, the Jacobean is unity because of the triangular form of the matrix Ä (see equations (6) above).
p(y(n)|s(n), h, r, σε 2)
where p(ε(n)) is the joint probability density function for the measurement noise during a frame of the input speech and the second term on the right hand side is the Jacobean of the transformation which again has a value of one.
Gibbs Sampler
where (h0, r0, (σe 2)0, (σε 2)0, (σa 2)0, (σh 2)0, s(n)0) are initial values which may be obtained from the results of the statistical analysis of the previous frame of speech, or where there are no previous frames, can be set to appropriate values that will be known to those skilled in the art of speech processing.
which can be simplified to give:
which is in the form of a standard Gaussian distribution having the following covariance matrix:
from which a sample for h g can be drawn in the manner described above, with the channel model order (rg) being determined using the model order selection routine which will be described later.
where:
E=s (n)T s (n)−2 a T Ss (n)+ a T S T Sa
which can be simplified to give:
which is also an Inverse Gamma distribution having the following parameters:
where:
E*=q (n)T q (n)−2 h T q (n)+h T Y T Yh
where the ratio term is the ratio of the conditional probability given in equation (21) evaluated for the current AR filter coefficients (a) drawn by the Gibbs sampler for the current model order ((k1)) and for the proposed new model order (k2). If k2>k1, then the matrix S must first be resized and then a new sample must be drawn from the Gaussian distribution having the mean vector and covariance matrix defined by equations (22) and (23) (determined for the resized matrix S), to provide the AR filter coefficients (a <1:k2>) for the new model order (k2). If k2<k1 then all that is required is to delete the last (k1−k2) samples from the a vector. If the ratio in equation (31) is greater than one, then this implies that the proposed model order (k2) is better than the current model order whereas if it is less than one then this implies that the current model order is better than the proposed model order. However, since occasionally this will not be the case, rather than deciding whether or not to accept the proposed model order by comparing the model order variable (MO) with a fixed threshold of one, in this embodiment, the model order variable (MO) is compared, in step s5, with a random number which lies between zero and one. If the model order variable (MO) is greater than this random number, then the processing proceeds to step s7 where the model order is set to the proposed model order (k2) and a count associated with the value of k2 is incremented. If, on the other hand, the model order variable (MO) is smaller than the random number, then the processing proceeds to step s9 where the current model order is maintained and a count associated with the value of the current model order (k1) is incremented. The processing then ends.
ŝ (n)=÷ŝ (n−1)+ ê (n)
y(n)= h T ·ŝ (n−1)+ε(n) (32)
where
w(t)=y(t)− h T ŝ (t)
d(t)=h T P(t) h+σ ε 2
k f(t)=(ÃP(t) h )·d(t)−1
ŝ (t+1)=Ãŝ (t)+ k f(t)·w(t)
L(t)=Ã−k f(t)· h T
P(t+1)=ÃP(t)L(t)T+σe 2 ·I (33)
where the initial vector of raw speech samples (ŝ(1)) includes raw speech samples obtained from the processing of the previous frame (or if there are no previous frames then s(i) is set equal to zero for i<1); P(1) is the variance of ŝ(1) (which can be obtained from the previous frame or initially can be set to σe 2); h is the current set of channel model coefficients which can be obtained from the processing of the previous frame (or if there are no previous frames then the elements of h can be set to their expected values˜zero); y(t) is the current speech sample of the current frame being processed and I is the identity matrix. The processing then proceeds to step s25 where the scalar values w(t) and d(t) are stored together with the r×r matrix L(t) (or alternatively the Kalman filter gain vector kf(t) could be stored from which L(t) can be generated). The processing then proceeds to step s27 where the system determines whether or not all the speech samples in the current frame have been processed. If they have not, then the processing proceeds to step s29 where the time variable t is incremented by one so that the next sample in the current frame will be processed in the same way. Once all N samples in the current frame have been processed in this way and the corresponding values stored, the first stage of the Simulation Smoother is complete.
C(t)=σe 2(I−σ e 2 U(t))
η(t)˜N(0,C(t))
V(t)=σe 2 U(t)L(t)
r (t−1)= hd(t)−1 w(t)+L(t)T r (t)−V(t)T C(t)−1 η(t)
U(t−1)= hd(t)−1 h T +L(t)T U(t)L(t)+V(t)T C(t)−1 V(t)
{tilde over (e)} (t)=σe 2 r (t)+η(t) where {tilde over (e)} (t)=[{tilde over (e)}(t){tilde over (e)}(t−1){tilde over (e)}(t−2) . . . {tilde over (e)}(t−r+1)]T
ŝ (t)=Ãŝ (t−1)+ ê (t) where ŝ (t)=[ŝ(t)ŝ(t−1)ŝ(t−2) . . . ŝ(t−r+1)]T
and ê (t)=[{tilde over (e)}(t) 0 0 . . . 0]T (34)
where η(t) is a sample drawn from a Gaussian distribution having zero mean and covariance matrix C(t); the initial vector r(t=N) and the initial matrix U(t=N) are both set to zero; and s(0) is obtained from the processing of the previous frame (or if there are no previous frames can be set equal to zero). The processing then proceeds to step s33 where the estimate of the process noise ({tilde over (e)}(t)) for the current speech sample being processed and the estimate of the raw speech sample (ŝ(t)) for the current speech sample being processed are stored. The processing then proceeds to step s35 where the system determines whether or not all the speech samples in the current frame have been processed. If they have not, then the processing proceeds to step s37 where the time variable t is decremented by one so that the previous sample in the current frame will be processed in the same way. Once all N samples in the current frame have been processed in this way and the corresponding process noise and raw speech samples have been stored, the second stage of the Simulation Smoother is complete and an estimate of s(n) will have been generated.
y 1(n)=h 110 s 1(n)+h 111 s 1(n−1)+h 112 s 1(n−2)+ . . +h 11r
+h 210 s 2(n)+h 211 s 2(n−1)+h 212 s 2(n−2)+ . . . +h 21r
where, for example, h112 is the channel filter coefficient of the channel between the first source 31-1 and the microphone 7-1 at time t=2; and r21 is the model order of the channel between the second speech source 31-2 and the microphone 7-1. A similar equation will exist to represent the signal received from the other microphone 7-2.
-
- p(y 1(n)|s 1(n),s 2(n),h 11,h 21,r11,r21,σε1 2)
- p(y 2(n)|s 1(n),s 2(n),h 12,h 22,r12,r22,σε2 2)
- p(s 1(n)|a 1,k1,σe1 2), p(s 2(n)|a 2,k2,σe2 2)
- p(a 1|k1,σa1 2,μ a1) p(a 2|k2,σa2 2,μ a2)
- p(h 11|r11,σh11 2,μ h11) p(h 12|r12,σh12 2,μ h12)
- p(h 21|r21,σh21 2,μ h21) p(h 22|r22,σh22 2,μ h22)
- P(σa1 2|αa1,βa1) P(σa2 2|αa2,βa2) p(σe1 2) p(σe2 2)
- P(σh11 2|αh11,βh11) P(σh12 2|αh12,βh12) P(σh21 2|αh21,βh21)
- P(σh22 2|αh22,βh22) p(k1) p(k2) p(r11) p(r12) p(r21) p(r22)
where
and q1(n)=y1(n)−s1(n)−s2(n).
which is a product of two Gaussians, one for each of the two channels to the microphone 7-1. Note also that the initial term q 1(n)T q 1(n) has been ignored, since this is just a constant and will therefore only result in a corresponding scaling factor to the probability density function. This simplification is performed in this embodiment, since it is easier to draw a sample from each of the two Gaussians given in equation (39) individually rather than having to draw a single sample of both channels jointly from the larger Gaussian defined by equation (38).
where m is the larger of the AR filter model orders and the MA filter model orders. Again, this results in slightly more complicated Kalman filter equations and smoothing filter equations and these are given below for completeness.
Kalman Filter Equations
w (t)= y <1:2>(t)−H <1:2>
D(t)=H <1:2>
K f(t)=(Ã <1:2> P(t)H <1:2>)·D(t)−1
ŝ <1:2>(t+1)=Ã <1:2> ŝ <1:2>(t)+K f(t)· w (t)
L(t)=Ã <1:2> −K f(t)·H <1:2>
P(t+1)=Ã<1:2> P(t)L(t)T +D ε ·D ε T (41)
Smoothing Filter Equations
C(t)=B·B T −B·B T ·U(t)B·B T
η(t)˜N(0,C(t))
V(t)=B·B T U(t)L(t)
r(t−1)=H <1 2> D(t)−1 w (t)+L(t)T r (t)−V(t)T C(t)−1 η(t)
U(t−1)=H <1:2> D(t)−1 H <1:2>
{tilde over (e)} <1:2>(t)=B·B T r (t)+η(t)
where {tilde over (e)} <1:2>(t)=[{tilde over (e)} 1(t){tilde over (e)} 1(t−1) . . . {tilde over (e)} 1(t−r+1){dot over (:)}{tilde over (e)} 2(t){tilde over (e)} 2(t−1) . . . {tilde over (e)} 2(t−r+1)]T
ŝ <1:2>(t)=Ã<1.2> ŝ <1:2>(t−1)+ ê <1:2>(t)
where ê <1:2>(t)=[ê <1:2>(t) 0 . . . 0 {dot over (:)}ê <1:2>(t)=[ê <1:2>(t)0 . . . 0 ]T (42)
where NSEN is the number of
Claims (82)
Applications Claiming Priority (4)
| Application Number | Priority Date | Filing Date | Title |
|---|---|---|---|
| GB0013536A GB0013536D0 (en) | 2000-06-02 | 2000-06-02 | Signal processing system |
| GB0020311A GB0020311D0 (en) | 2000-06-02 | 2000-08-17 | Signal processing system |
| GB0020311.7 | 2000-08-17 | ||
| GB0013536.8 | 2000-08-17 |
Publications (2)
| Publication Number | Publication Date |
|---|---|
| US20020055913A1 US20020055913A1 (en) | 2002-05-09 |
| US6954745B2 true US6954745B2 (en) | 2005-10-11 |
Family
ID=26244418
Family Applications (1)
| Application Number | Title | Priority Date | Filing Date |
|---|---|---|---|
| US09/866,597 Expired - Fee Related US6954745B2 (en) | 2000-06-02 | 2001-05-30 | Signal processing system |
Country Status (3)
| Country | Link |
|---|---|
| US (1) | US6954745B2 (en) |
| EP (1) | EP1160772A3 (en) |
| JP (1) | JP2002140096A (en) |
Cited By (19)
| Publication number | Priority date | Publication date | Assignee | Title |
|---|---|---|---|---|
| US20030078936A1 (en) * | 2000-04-10 | 2003-04-24 | Brocklebank John C. | Method for selecting node variables in a binary decision tree structure |
| US20040039806A1 (en) * | 2001-10-26 | 2004-02-26 | Miras Bertrand | Methods and systems for the synchronized recording and reading of data coming from a plurality of terminal devices |
| US20060247900A1 (en) * | 2005-05-02 | 2006-11-02 | Sas Institute Inc. | Computer-implemented regression systems and methods for time series data analysis |
| US20070233632A1 (en) * | 2006-03-17 | 2007-10-04 | Kabushiki Kaisha Toshiba | Method, program product, and apparatus for generating analysis model |
| US7319959B1 (en) * | 2002-05-14 | 2008-01-15 | Audience, Inc. | Multi-source phoneme classification for noise-robust automatic speech recognition |
| US20090150152A1 (en) * | 2007-11-18 | 2009-06-11 | Nice Systems | Method and apparatus for fast search in call-center monitoring |
| US20100174540A1 (en) * | 2007-07-13 | 2010-07-08 | Dolby Laboratories Licensing Corporation | Time-Varying Audio-Signal Level Using a Time-Varying Estimated Probability Density of the Level |
| US8793717B2 (en) * | 2008-10-31 | 2014-07-29 | The Nielsen Company (Us), Llc | Probabilistic methods and apparatus to determine the state of a media device |
| US9380387B2 (en) | 2014-08-01 | 2016-06-28 | Klipsch Group, Inc. | Phase independent surround speaker |
| US9378754B1 (en) | 2010-04-28 | 2016-06-28 | Knowles Electronics, Llc | Adaptive spatial classifier for multi-microphone systems |
| US9437188B1 (en) | 2014-03-28 | 2016-09-06 | Knowles Electronics, Llc | Buffered reprocessing for multi-microphone automatic speech recognition assist |
| US9437180B2 (en) | 2010-01-26 | 2016-09-06 | Knowles Electronics, Llc | Adaptive noise reduction using level cues |
| US9508345B1 (en) | 2013-09-24 | 2016-11-29 | Knowles Electronics, Llc | Continuous voice sensing |
| US9692535B2 (en) | 2012-02-20 | 2017-06-27 | The Nielsen Company (Us), Llc | Methods and apparatus for automatic TV on/off detection |
| US9743141B2 (en) | 2015-06-12 | 2017-08-22 | The Nielsen Company (Us), Llc | Methods and apparatus to determine viewing condition probabilities |
| US9924224B2 (en) | 2015-04-03 | 2018-03-20 | The Nielsen Company (Us), Llc | Methods and apparatus to determine a state of a media presentation device |
| US9953634B1 (en) | 2013-12-17 | 2018-04-24 | Knowles Electronics, Llc | Passive training for automatic speech recognition |
| US10210459B2 (en) | 2016-06-29 | 2019-02-19 | The Nielsen Company (Us), Llc | Methods and apparatus to determine a conditional probability based on audience member probability distributions for media audience measurement |
| US10715913B2 (en) * | 2016-04-14 | 2020-07-14 | Harman International Industries, Incorporated | Neural network-based loudspeaker modeling with a deconvolution filter |
Families Citing this family (27)
| Publication number | Priority date | Publication date | Assignee | Title |
|---|---|---|---|---|
| AU777693B2 (en) | 1999-03-05 | 2004-10-28 | Canon Kabushiki Kaisha | Database annotation and retrieval |
| JP4560899B2 (en) * | 2000-06-13 | 2010-10-13 | カシオ計算機株式会社 | Speech recognition apparatus and speech recognition method |
| US20030171900A1 (en) * | 2002-03-11 | 2003-09-11 | The Charles Stark Draper Laboratory, Inc. | Non-Gaussian detection |
| US20040044765A1 (en) * | 2002-08-30 | 2004-03-04 | Microsoft Corporation | Method and system for identifying lossy links in a computer network |
| US7421510B2 (en) * | 2002-08-30 | 2008-09-02 | Microsoft Corporation | Method and system for identifying lossy links in a computer network |
| US7346679B2 (en) | 2002-08-30 | 2008-03-18 | Microsoft Corporation | Method and system for identifying lossy links in a computer network |
| US20040117186A1 (en) * | 2002-12-13 | 2004-06-17 | Bhiksha Ramakrishnan | Multi-channel transcription-based speaker separation |
| US7539617B2 (en) * | 2003-07-01 | 2009-05-26 | France Telecom | Method and system for analysis of vocal signals for a compressed representation of speakers using a probability density representing resemblances between a vocal representation of the speaker in a predetermined model and a predetermined set of vocal representations reference speakers |
| US7636651B2 (en) * | 2003-11-28 | 2009-12-22 | Microsoft Corporation | Robust Bayesian mixture modeling |
| GB2412997A (en) * | 2004-04-07 | 2005-10-12 | Mitel Networks Corp | Method and apparatus for hands-free speech recognition using a microphone array |
| GB0424737D0 (en) * | 2004-11-09 | 2004-12-08 | Isis Innovation | Method,computer program and signal processing apparatus for determining statistical information of a signal |
| US7552154B2 (en) * | 2005-02-10 | 2009-06-23 | Netzer Moriya | System and method for statistically separating and characterizing noise which is added to a signal of a machine or a system |
| US8315857B2 (en) * | 2005-05-27 | 2012-11-20 | Audience, Inc. | Systems and methods for audio signal analysis and modification |
| WO2006131959A1 (en) * | 2005-06-06 | 2006-12-14 | Saga University | Signal separating apparatus |
| JP4755555B2 (en) * | 2006-09-04 | 2011-08-24 | 日本電信電話株式会社 | Speech signal section estimation method, apparatus thereof, program thereof, and storage medium thereof |
| JP4673828B2 (en) * | 2006-12-13 | 2011-04-20 | 日本電信電話株式会社 | Speech signal section estimation apparatus, method thereof, program thereof and recording medium |
| JP5088030B2 (en) * | 2007-07-26 | 2012-12-05 | ヤマハ株式会社 | Method, apparatus and program for evaluating similarity of performance sound |
| WO2009038013A1 (en) * | 2007-09-21 | 2009-03-26 | Nec Corporation | Noise removal system, noise removal method, and noise removal program |
| US8947237B2 (en) | 2009-02-25 | 2015-02-03 | Xanthia Global Limited | Physiological data acquisition utilizing vibrational identification |
| US8994536B2 (en) | 2009-02-25 | 2015-03-31 | Xanthia Global Limited | Wireless physiology monitor |
| WO2010099268A1 (en) * | 2009-02-25 | 2010-09-02 | Xanthia Global Limited | Wireless physiology monitor |
| JP5172797B2 (en) * | 2009-08-19 | 2013-03-27 | 日本電信電話株式会社 | Reverberation suppression apparatus and method, program, and recording medium |
| US8725506B2 (en) * | 2010-06-30 | 2014-05-13 | Intel Corporation | Speech audio processing |
| HUP1200197A2 (en) * | 2012-04-03 | 2013-10-28 | Budapesti Mueszaki Es Gazdasagtudomanyi Egyetem | Method and arrangement for real time source-selective monitoring and mapping of enviromental noise |
| US9484033B2 (en) * | 2014-12-11 | 2016-11-01 | International Business Machines Corporation | Processing and cross reference of realtime natural language dialog for live annotations |
| EP3217399B1 (en) * | 2016-03-11 | 2018-11-21 | GN Hearing A/S | Kalman filtering based speech enhancement using a codebook based approach |
| CN112801065B (en) * | 2021-04-12 | 2021-06-25 | 中国空气动力研究与发展中心计算空气动力研究所 | Space-time multi-feature information-based passive sonar target detection method and device |
Citations (45)
| Publication number | Priority date | Publication date | Assignee | Title |
|---|---|---|---|---|
| US4386237A (en) | 1980-12-22 | 1983-05-31 | Intelsat | NIC Processor using variable precision block quantization |
| GB2137052A (en) | 1983-02-14 | 1984-09-26 | Stowbell | Improvements in or Relating to the Control of Mobile Radio Communication Systems |
| US4811399A (en) | 1984-12-31 | 1989-03-07 | Itt Defense Communications, A Division Of Itt Corporation | Apparatus and method for automatic speech recognition |
| US4905286A (en) | 1986-04-04 | 1990-02-27 | National Research Development Corporation | Noise compensation in speech recognition |
| US5012518A (en) | 1989-07-26 | 1991-04-30 | Itt Corporation | Low-bit-rate speech coder using LPC data reduction processing |
| WO1992022891A1 (en) | 1991-06-11 | 1992-12-23 | Qualcomm Incorporated | Variable rate vocoder |
| EP0554083A2 (en) | 1992-01-30 | 1993-08-04 | Ricoh Company, Ltd | Neural network learning system |
| US5315538A (en) * | 1992-03-23 | 1994-05-24 | Hughes Aircraft Company | Signal processing incorporating signal, tracking, estimation, and removal processes using a maximum a posteriori algorithm, and sequential signal detection |
| EP0631402A2 (en) | 1988-09-26 | 1994-12-28 | Fujitsu Limited | Variable rate coder |
| US5432884A (en) | 1992-03-23 | 1995-07-11 | Nokia Mobile Phones Ltd. | Method and apparatus for decoding LPC-encoded speech using a median filter modification of LPC filter factors to compensate for transmission errors |
| EP0674306A2 (en) | 1994-03-24 | 1995-09-27 | AT&T Corp. | Signal bias removal for robust telephone speech recognition |
| US5611019A (en) | 1993-05-19 | 1997-03-11 | Matsushita Electric Industrial Co., Ltd. | Method and an apparatus for speech detection for determining whether an input signal is speech or nonspeech |
| US5742694A (en) | 1996-07-12 | 1998-04-21 | Eatwell; Graham P. | Noise reduction filter |
| US5784297A (en) * | 1997-01-13 | 1998-07-21 | The United States Of America As Represented By The Secretary Of The Navy | Model identification and characterization of error structures in signal processing |
| US5799276A (en) | 1995-11-07 | 1998-08-25 | Accent Incorporated | Knowledge-based speech recognition system and methods having frame length computed based upon estimated pitch period of vocalic intervals |
| WO1998038631A1 (en) | 1997-02-26 | 1998-09-03 | Motorola Inc. | Apparatus and method for rate determination in a communication system |
| US5884269A (en) | 1995-04-17 | 1999-03-16 | Merging Technologies | Lossless compression/decompression of digital audio data |
| US5884255A (en) | 1996-07-16 | 1999-03-16 | Coherent Communications Systems Corp. | Speech detection system employing multiple determinants |
| GB2332055A (en) | 1997-12-04 | 1999-06-09 | Olivetti Res Ltd | Detection system for determining positional information about objects |
| GB2332054A (en) | 1997-12-04 | 1999-06-09 | Olivetti Res Ltd | Detection system for determining location information about objects |
| WO1999028761A1 (en) | 1997-12-04 | 1999-06-10 | At&T Laboratories-Cambridge Limited | Detection system for determining positional and other information about objects |
| WO1999028760A1 (en) | 1997-12-04 | 1999-06-10 | Olivetti Research Limited | Detection system for determining orientation information about objects |
| EP0952589A2 (en) | 1998-04-20 | 1999-10-27 | AT & T Laboratories - Cambridge Limited | Cables |
| WO1999064887A1 (en) | 1998-06-11 | 1999-12-16 | At & T Laboratories Cambridge Limited | Location system |
| US6018317A (en) * | 1995-06-02 | 2000-01-25 | Trw Inc. | Cochannel signal processing system |
| WO2000011650A1 (en) | 1998-08-24 | 2000-03-02 | Conexant Systems, Inc. | Speech codec employing speech classification for noise compensation |
| US6044336A (en) * | 1998-07-13 | 2000-03-28 | Multispec Corporation | Method and apparatus for situationally adaptive processing in echo-location systems operating in non-Gaussian environments |
| EP0996112A2 (en) | 1998-10-20 | 2000-04-26 | Nec Corporation | Silence compression coding/decoding method and device |
| WO2000038179A2 (en) | 1998-12-21 | 2000-06-29 | Qualcomm Incorporated | Variable rate speech coding |
| EP1022583A2 (en) | 1999-01-22 | 2000-07-26 | AT&T Laboratories - Cambridge Limited | A method of increasing the capacity and addressing rate of an ultrasonic location system |
| WO2000045375A1 (en) | 1999-01-27 | 2000-08-03 | Kent Ridge Digital Labs | Method and apparatus for voice annotation and retrieval of multimedia data |
| WO2000054168A2 (en) | 1999-03-05 | 2000-09-14 | Canon Kabushiki Kaisha | Database annotation and retrieval |
| US6134518A (en) | 1997-03-04 | 2000-10-17 | International Business Machines Corporation | Digital audio signal coding using a CELP coder and a transform coder |
| GB2349717A (en) | 1999-05-04 | 2000-11-08 | At & T Lab Cambridge Ltd | Low latency network |
| JP2001044926A (en) | 1999-07-12 | 2001-02-16 | Sk Telecom Kk | Device and method for measuring communication quality of mobile communication system |
| US6226613B1 (en) | 1998-10-30 | 2001-05-01 | At&T Corporation | Decoding input symbols to input/output hidden markoff models |
| GB2356106A (en) | 1999-07-06 | 2001-05-09 | At & T Lab Cambridge Ltd | Multimedia client-server system |
| GB2360670A (en) | 2000-03-22 | 2001-09-26 | At & T Lab Cambridge Ltd | Power management system where a power controller is coupled to each component in an apparatus and able to switch to high or low power state |
| EP1160768A2 (en) | 2000-06-02 | 2001-12-05 | Canon Kabushiki Kaisha | Robust features extraction for speech processing |
| GB2363557A (en) | 2000-06-16 | 2001-12-19 | At & T Lab Cambridge Ltd | Method of extracting a signal from a contaminated signal |
| US6377919B1 (en) | 1996-02-06 | 2002-04-23 | The Regents Of The University Of California | System and method for characterizing voiced excitations of speech and acoustic signals, removing acoustic noise from speech, and synthesizing speech |
| US6438513B1 (en) | 1997-07-04 | 2002-08-20 | Sextant Avionique | Process for searching for a noise model in noisy audio signals |
| US6516090B1 (en) | 1998-05-07 | 2003-02-04 | Canon Kabushiki Kaisha | Automated video interpretation system |
| US6549854B1 (en) * | 1999-02-12 | 2003-04-15 | Schlumberger Technology Corporation | Uncertainty constrained subsurface modeling |
| US6708146B1 (en) | 1997-01-03 | 2004-03-16 | Telecommunications Research Laboratories | Voiceband signal classifier |
-
2001
- 2001-05-30 US US09/866,597 patent/US6954745B2/en not_active Expired - Fee Related
- 2001-05-31 EP EP01304801A patent/EP1160772A3/en not_active Withdrawn
- 2001-06-04 JP JP2001168802A patent/JP2002140096A/en not_active Withdrawn
Patent Citations (51)
| Publication number | Priority date | Publication date | Assignee | Title |
|---|---|---|---|---|
| US4386237A (en) | 1980-12-22 | 1983-05-31 | Intelsat | NIC Processor using variable precision block quantization |
| GB2137052A (en) | 1983-02-14 | 1984-09-26 | Stowbell | Improvements in or Relating to the Control of Mobile Radio Communication Systems |
| US4811399A (en) | 1984-12-31 | 1989-03-07 | Itt Defense Communications, A Division Of Itt Corporation | Apparatus and method for automatic speech recognition |
| US4905286A (en) | 1986-04-04 | 1990-02-27 | National Research Development Corporation | Noise compensation in speech recognition |
| EP0631402A2 (en) | 1988-09-26 | 1994-12-28 | Fujitsu Limited | Variable rate coder |
| US5012518A (en) | 1989-07-26 | 1991-04-30 | Itt Corporation | Low-bit-rate speech coder using LPC data reduction processing |
| WO1992022891A1 (en) | 1991-06-11 | 1992-12-23 | Qualcomm Incorporated | Variable rate vocoder |
| EP0554083A2 (en) | 1992-01-30 | 1993-08-04 | Ricoh Company, Ltd | Neural network learning system |
| US5315538A (en) * | 1992-03-23 | 1994-05-24 | Hughes Aircraft Company | Signal processing incorporating signal, tracking, estimation, and removal processes using a maximum a posteriori algorithm, and sequential signal detection |
| US5432884A (en) | 1992-03-23 | 1995-07-11 | Nokia Mobile Phones Ltd. | Method and apparatus for decoding LPC-encoded speech using a median filter modification of LPC filter factors to compensate for transmission errors |
| US5611019A (en) | 1993-05-19 | 1997-03-11 | Matsushita Electric Industrial Co., Ltd. | Method and an apparatus for speech detection for determining whether an input signal is speech or nonspeech |
| EP0674306A2 (en) | 1994-03-24 | 1995-09-27 | AT&T Corp. | Signal bias removal for robust telephone speech recognition |
| US5884269A (en) | 1995-04-17 | 1999-03-16 | Merging Technologies | Lossless compression/decompression of digital audio data |
| US6018317A (en) * | 1995-06-02 | 2000-01-25 | Trw Inc. | Cochannel signal processing system |
| US5799276A (en) | 1995-11-07 | 1998-08-25 | Accent Incorporated | Knowledge-based speech recognition system and methods having frame length computed based upon estimated pitch period of vocalic intervals |
| US6377919B1 (en) | 1996-02-06 | 2002-04-23 | The Regents Of The University Of California | System and method for characterizing voiced excitations of speech and acoustic signals, removing acoustic noise from speech, and synthesizing speech |
| US5742694A (en) | 1996-07-12 | 1998-04-21 | Eatwell; Graham P. | Noise reduction filter |
| US5884255A (en) | 1996-07-16 | 1999-03-16 | Coherent Communications Systems Corp. | Speech detection system employing multiple determinants |
| US6708146B1 (en) | 1997-01-03 | 2004-03-16 | Telecommunications Research Laboratories | Voiceband signal classifier |
| US5784297A (en) * | 1997-01-13 | 1998-07-21 | The United States Of America As Represented By The Secretary Of The Navy | Model identification and characterization of error structures in signal processing |
| WO1998038631A1 (en) | 1997-02-26 | 1998-09-03 | Motorola Inc. | Apparatus and method for rate determination in a communication system |
| US6134518A (en) | 1997-03-04 | 2000-10-17 | International Business Machines Corporation | Digital audio signal coding using a CELP coder and a transform coder |
| US6438513B1 (en) | 1997-07-04 | 2002-08-20 | Sextant Avionique | Process for searching for a noise model in noisy audio signals |
| GB2332055A (en) | 1997-12-04 | 1999-06-09 | Olivetti Res Ltd | Detection system for determining positional information about objects |
| WO1999028760A1 (en) | 1997-12-04 | 1999-06-10 | Olivetti Research Limited | Detection system for determining orientation information about objects |
| EP1034441B1 (en) | 1997-12-04 | 2003-04-02 | AT&T Laboratories - Cambridge Limited | Detection system for determining positional and other information about objects |
| WO1999028761A1 (en) | 1997-12-04 | 1999-06-10 | At&T Laboratories-Cambridge Limited | Detection system for determining positional and other information about objects |
| GB2332054A (en) | 1997-12-04 | 1999-06-09 | Olivetti Res Ltd | Detection system for determining location information about objects |
| EP0952589A2 (en) | 1998-04-20 | 1999-10-27 | AT & T Laboratories - Cambridge Limited | Cables |
| US6516090B1 (en) | 1998-05-07 | 2003-02-04 | Canon Kabushiki Kaisha | Automated video interpretation system |
| WO1999064887A1 (en) | 1998-06-11 | 1999-12-16 | At & T Laboratories Cambridge Limited | Location system |
| US6044336A (en) * | 1998-07-13 | 2000-03-28 | Multispec Corporation | Method and apparatus for situationally adaptive processing in echo-location systems operating in non-Gaussian environments |
| WO2000011650A1 (en) | 1998-08-24 | 2000-03-02 | Conexant Systems, Inc. | Speech codec employing speech classification for noise compensation |
| EP0996112A2 (en) | 1998-10-20 | 2000-04-26 | Nec Corporation | Silence compression coding/decoding method and device |
| US6226613B1 (en) | 1998-10-30 | 2001-05-01 | At&T Corporation | Decoding input symbols to input/output hidden markoff models |
| WO2000038179A2 (en) | 1998-12-21 | 2000-06-29 | Qualcomm Incorporated | Variable rate speech coding |
| EP1022583A2 (en) | 1999-01-22 | 2000-07-26 | AT&T Laboratories - Cambridge Limited | A method of increasing the capacity and addressing rate of an ultrasonic location system |
| GB2345967A (en) | 1999-01-22 | 2000-07-26 | At & T Lab Cambridge Ltd | A method of increasing the capacity and addressing rate of an ultrasonic location system |
| GB2361339A (en) | 1999-01-27 | 2001-10-17 | Kent Ridge Digital Labs | Method and apparatus for voice annotation and retrieval of multimedia data |
| WO2000045375A1 (en) | 1999-01-27 | 2000-08-03 | Kent Ridge Digital Labs | Method and apparatus for voice annotation and retrieval of multimedia data |
| US6549854B1 (en) * | 1999-02-12 | 2003-04-15 | Schlumberger Technology Corporation | Uncertainty constrained subsurface modeling |
| WO2000054168A2 (en) | 1999-03-05 | 2000-09-14 | Canon Kabushiki Kaisha | Database annotation and retrieval |
| GB2349717A (en) | 1999-05-04 | 2000-11-08 | At & T Lab Cambridge Ltd | Low latency network |
| GB2356314A (en) | 1999-07-06 | 2001-05-16 | At & T Lab Cambridge Ltd | Multimedia client-server system |
| GB2356313A (en) | 1999-07-06 | 2001-05-16 | At & T Lab Cambridge Ltd | Multimedia client-server system for telephony |
| GB2356107A (en) | 1999-07-06 | 2001-05-09 | At & T Lab Cambridge Ltd | Multimedia communications |
| GB2356106A (en) | 1999-07-06 | 2001-05-09 | At & T Lab Cambridge Ltd | Multimedia client-server system |
| JP2001044926A (en) | 1999-07-12 | 2001-02-16 | Sk Telecom Kk | Device and method for measuring communication quality of mobile communication system |
| GB2360670A (en) | 2000-03-22 | 2001-09-26 | At & T Lab Cambridge Ltd | Power management system where a power controller is coupled to each component in an apparatus and able to switch to high or low power state |
| EP1160768A2 (en) | 2000-06-02 | 2001-12-05 | Canon Kabushiki Kaisha | Robust features extraction for speech processing |
| GB2363557A (en) | 2000-06-16 | 2001-12-19 | At & T Lab Cambridge Ltd | Method of extracting a signal from a contaminated signal |
Non-Patent Citations (13)
| Title |
|---|
| "An Introduction to the Kalman Filter", Welch, et al., Dept. of Computer Science, University of North Carolina at Chapel Hill, NC, Sep. 1997. |
| "Bayesian Separation and Recovery of Convolutively Mixed Autoregssive Sources", Godsill, et al., ICASSP, Mar. 1999. |
| "Fundamentals of Speech Recognition," Rabiner, et al., Prentice Hall, Englewood Cliffs, New Jersey, pp. 115 and 116, 1993. |
| "Probabilistic inference using Markov chain Monte Carlo methods" by R. Neal. Technical Report CRG-TR-93-1, Department of Computer Science, University of Toronto (1993). |
| "Reversible jump Markov chain Monte Carlo Computation and Bayesian model determination" by Peter Green, Biometrika, vol. 82, pp. 711-732 (1995). |
| "Statistical Properties of STFT Ratios for Two Channel Systems and Application to Blind Source Separation", Balan, et al., Siemens Corporate Research, Princeton, N, pp. 429-434. |
| "The Simulation Smoother For Time Series Models", Biometrika, vol. 82, 2, pp. 339-350 (1995). |
| Andrieu, et al., "Bayesian Blind Marginal Separation of Convolutively Mixed Discrete Sources," IEEE Proc., 1998, pp. 43-52. |
| Bayesian Approach to Parameter Estimation and Interpolation of Time-Varying Autoregressive Interpolation of Time-Varying Autoregressive Process Using the Gibbs Sampler, Rajan, et al., IEE Proc.-Vis. Image Signal Process., vol. 44, No. 4, Aug. 1997, pp. 249-256. |
| Couvreur, et al., "Wavelet-based Non-Parametric HMM's: Theory and Applications," Proc. International Conference Acoustics, Speech and Signal Processing, Istanbul, vol. 1, Jun. 5-9, 2000, pp. 604-607. |
| Hopgood, et al., "Bayesian Single Channel Blind Deconvolution Using Parametric Signal and Channel Models," Proc. IEEE Workshop on Applications of Signal Processing to Audio and Acoustics, New Paltz, NY, Oct. 17-20, 1999, pp. 151-154. |
| Numerical Recipes in C by W. Press, et al., Chapter 7, Cambridge University Press (1992). |
| Srinivasan, et al., "Query Expansion for Imperfect Speech: Applications in Distributed Learning," Proc. IEEE Workshop on Content-Based Access of Image and Video Libraries, 2000, pp. 50-54. |
Cited By (35)
| Publication number | Priority date | Publication date | Assignee | Title |
|---|---|---|---|---|
| US7809539B2 (en) | 2000-04-10 | 2010-10-05 | Sas Institute Inc. | Method for selecting node variables in a binary decision tree structure |
| US20030078936A1 (en) * | 2000-04-10 | 2003-04-24 | Brocklebank John C. | Method for selecting node variables in a binary decision tree structure |
| US20040039806A1 (en) * | 2001-10-26 | 2004-02-26 | Miras Bertrand | Methods and systems for the synchronized recording and reading of data coming from a plurality of terminal devices |
| US7319959B1 (en) * | 2002-05-14 | 2008-01-15 | Audience, Inc. | Multi-source phoneme classification for noise-robust automatic speech recognition |
| US20060247900A1 (en) * | 2005-05-02 | 2006-11-02 | Sas Institute Inc. | Computer-implemented regression systems and methods for time series data analysis |
| US7171340B2 (en) * | 2005-05-02 | 2007-01-30 | Sas Institute Inc. | Computer-implemented regression systems and methods for time series data analysis |
| US20070233632A1 (en) * | 2006-03-17 | 2007-10-04 | Kabushiki Kaisha Toshiba | Method, program product, and apparatus for generating analysis model |
| US7630951B2 (en) * | 2006-03-17 | 2009-12-08 | Kabushiki Kaisha Toshiba | Method, program product, and apparatus for generating analysis model |
| US20100174540A1 (en) * | 2007-07-13 | 2010-07-08 | Dolby Laboratories Licensing Corporation | Time-Varying Audio-Signal Level Using a Time-Varying Estimated Probability Density of the Level |
| US9698743B2 (en) * | 2007-07-13 | 2017-07-04 | Dolby Laboratories Licensing Corporation | Time-varying audio-signal level using a time-varying estimated probability density of the level |
| US20090150152A1 (en) * | 2007-11-18 | 2009-06-11 | Nice Systems | Method and apparatus for fast search in call-center monitoring |
| US7788095B2 (en) * | 2007-11-18 | 2010-08-31 | Nice Systems, Ltd. | Method and apparatus for fast search in call-center monitoring |
| US8793717B2 (en) * | 2008-10-31 | 2014-07-29 | The Nielsen Company (Us), Llc | Probabilistic methods and apparatus to determine the state of a media device |
| US9294813B2 (en) | 2008-10-31 | 2016-03-22 | The Nielsen Company (Us), Llc | Probabilistic methods and apparatus to determine the state of a media device |
| US9437180B2 (en) | 2010-01-26 | 2016-09-06 | Knowles Electronics, Llc | Adaptive noise reduction using level cues |
| US9378754B1 (en) | 2010-04-28 | 2016-06-28 | Knowles Electronics, Llc | Adaptive spatial classifier for multi-microphone systems |
| US11736681B2 (en) | 2012-02-20 | 2023-08-22 | The Nielsen Company (Us), Llc | Methods and apparatus for automatic TV on/off detection |
| US9692535B2 (en) | 2012-02-20 | 2017-06-27 | The Nielsen Company (Us), Llc | Methods and apparatus for automatic TV on/off detection |
| US10205939B2 (en) | 2012-02-20 | 2019-02-12 | The Nielsen Company (Us), Llc | Methods and apparatus for automatic TV on/off detection |
| US10757403B2 (en) | 2012-02-20 | 2020-08-25 | The Nielsen Company (Us), Llc | Methods and apparatus for automatic TV on/off detection |
| US11399174B2 (en) | 2012-02-20 | 2022-07-26 | The Nielsen Company (Us), Llc | Methods and apparatus for automatic TV on/off detection |
| US9508345B1 (en) | 2013-09-24 | 2016-11-29 | Knowles Electronics, Llc | Continuous voice sensing |
| US9953634B1 (en) | 2013-12-17 | 2018-04-24 | Knowles Electronics, Llc | Passive training for automatic speech recognition |
| US9437188B1 (en) | 2014-03-28 | 2016-09-06 | Knowles Electronics, Llc | Buffered reprocessing for multi-microphone automatic speech recognition assist |
| US9380387B2 (en) | 2014-08-01 | 2016-06-28 | Klipsch Group, Inc. | Phase independent surround speaker |
| US9924224B2 (en) | 2015-04-03 | 2018-03-20 | The Nielsen Company (Us), Llc | Methods and apparatus to determine a state of a media presentation device |
| US11363335B2 (en) | 2015-04-03 | 2022-06-14 | The Nielsen Company (Us), Llc | Methods and apparatus to determine a state of a media presentation device |
| US11678013B2 (en) | 2015-04-03 | 2023-06-13 | The Nielsen Company (Us), Llc | Methods and apparatus to determine a state of a media presentation device |
| US10735809B2 (en) | 2015-04-03 | 2020-08-04 | The Nielsen Company (Us), Llc | Methods and apparatus to determine a state of a media presentation device |
| US9743141B2 (en) | 2015-06-12 | 2017-08-22 | The Nielsen Company (Us), Llc | Methods and apparatus to determine viewing condition probabilities |
| US10715913B2 (en) * | 2016-04-14 | 2020-07-14 | Harman International Industries, Incorporated | Neural network-based loudspeaker modeling with a deconvolution filter |
| US11321623B2 (en) | 2016-06-29 | 2022-05-03 | The Nielsen Company (Us), Llc | Methods and apparatus to determine a conditional probability based on audience member probability distributions for media audience measurement |
| US11574226B2 (en) | 2016-06-29 | 2023-02-07 | The Nielsen Company (Us), Llc | Methods and apparatus to determine a conditional probability based on audience member probability distributions for media audience measurement |
| US10210459B2 (en) | 2016-06-29 | 2019-02-19 | The Nielsen Company (Us), Llc | Methods and apparatus to determine a conditional probability based on audience member probability distributions for media audience measurement |
| US11880780B2 (en) | 2016-06-29 | 2024-01-23 | The Nielsen Company (Us), Llc | Methods and apparatus to determine a conditional probability based on audience member probability distributions for media audience measurement |
Also Published As
| Publication number | Publication date |
|---|---|
| US20020055913A1 (en) | 2002-05-09 |
| EP1160772A2 (en) | 2001-12-05 |
| EP1160772A3 (en) | 2004-01-14 |
| JP2002140096A (en) | 2002-05-17 |
Similar Documents
| Publication | Publication Date | Title |
|---|---|---|
| US6954745B2 (en) | Signal processing system | |
| US7035790B2 (en) | Speech processing system | |
| US7072833B2 (en) | Speech processing system | |
| US7010483B2 (en) | Speech processing system | |
| JP3742236B2 (en) | Hidden Markov Model Adaptation Technology for Speech Recognition | |
| EP1995723B1 (en) | Neuroevolution training system | |
| US9208780B2 (en) | Audio signal section estimating apparatus, audio signal section estimating method, and recording medium | |
| JP5418223B2 (en) | Speech classification device, speech classification method, and speech classification program | |
| JP4880036B2 (en) | Method and apparatus for speech dereverberation based on stochastic model of sound source and room acoustics | |
| JP4531166B2 (en) | Speech recognition method using reliability measure evaluation | |
| JPH10512686A (en) | Method and apparatus for speech recognition adapted to individual speakers | |
| JPH0585916B2 (en) | ||
| JP6195548B2 (en) | Signal analysis apparatus, method, and program | |
| JP4382808B2 (en) | Method for analyzing fundamental frequency information, and voice conversion method and system implementing this analysis method | |
| CA3133283A1 (en) | Signal processor employing neural network trained using evolutionary feature selection | |
| US20020026253A1 (en) | Speech processing apparatus | |
| JP3987927B2 (en) | Waveform recognition method and apparatus, and program | |
| JPH08211889A (en) | Pattern adaptive system using tree structure | |
| Samui et al. | Deep Recurrent Neural Network Based Monaural Speech Separation Using Recurrent Temporal Restricted Boltzmann Machines. | |
| Cipli et al. | Multi-class acoustic event classification of hydrophone data | |
| JP2734828B2 (en) | Probability calculation device and probability calculation method | |
| GB2367729A (en) | Speech processing system | |
| Dong et al. | Rate-distortion analysis of discrete-HMM pose estimation via multiaspect scattering data | |
| Orphanidou et al. | Voice morphing using the generative topographic mapping | |
| JPH0822296A (en) | Pattern recognition method |
Legal Events
| Date | Code | Title | Description |
|---|---|---|---|
| AS | Assignment |
Owner name: CANON KABUSHIKI KAISHA, JAPAN Free format text: ASSIGNMENT OF ASSIGNORS INTEREST;ASSIGNOR:RAJAN, JEBU JACOB;REEL/FRAME:012191/0066 Effective date: 20010831 |
|
| FPAY | Fee payment |
Year of fee payment: 4 |
|
| FPAY | Fee payment |
Year of fee payment: 8 |
|
| REMI | Maintenance fee reminder mailed | ||
| LAPS | Lapse for failure to pay maintenance fees |
Free format text: PATENT EXPIRED FOR FAILURE TO PAY MAINTENANCE FEES (ORIGINAL EVENT CODE: EXP.) |
|
| STCH | Information on status: patent discontinuation |
Free format text: PATENT EXPIRED DUE TO NONPAYMENT OF MAINTENANCE FEES UNDER 37 CFR 1.362 |
|
| FP | Lapsed due to failure to pay maintenance fee |
Effective date: 20171011 |