US7036375B2 - QCM sensor and QCM sensor device - Google Patents
QCM sensor and QCM sensor device Download PDFInfo
- Publication number
- US7036375B2 US7036375B2 US10/811,394 US81139404A US7036375B2 US 7036375 B2 US7036375 B2 US 7036375B2 US 81139404 A US81139404 A US 81139404A US 7036375 B2 US7036375 B2 US 7036375B2
- Authority
- US
- United States
- Prior art keywords
- oscillating
- quartz crystal
- electrodes
- resonance
- pair
- Prior art date
- Legal status (The legal status is an assumption and is not a legal conclusion. Google has not performed a legal analysis and makes no representation as to the accuracy of the status listed.)
- Expired - Lifetime
Links
- 238000000034 method Methods 0.000 claims abstract description 120
- 230000008859 change Effects 0.000 claims abstract description 71
- 239000000126 substance Substances 0.000 claims abstract description 27
- 238000003380 quartz crystal microbalance Methods 0.000 claims description 87
- 239000000758 substrate Substances 0.000 claims description 49
- 238000005259 measurement Methods 0.000 claims description 46
- 238000004364 calculation method Methods 0.000 claims description 30
- 238000010408 sweeping Methods 0.000 claims description 8
- 238000001179 sorption measurement Methods 0.000 claims description 7
- 239000010453 quartz Substances 0.000 abstract description 188
- VYPSYNLAJGMNEJ-UHFFFAOYSA-N silicon dioxide Inorganic materials O=[Si]=O VYPSYNLAJGMNEJ-UHFFFAOYSA-N 0.000 abstract description 188
- 239000013078 crystal Substances 0.000 abstract description 166
- 230000008569 process Effects 0.000 description 46
- 239000000523 sample Substances 0.000 description 39
- 239000007853 buffer solution Substances 0.000 description 28
- 238000012937 correction Methods 0.000 description 23
- 239000000243 solution Substances 0.000 description 13
- 238000010586 diagram Methods 0.000 description 10
- 238000001514 detection method Methods 0.000 description 7
- 239000012488 sample solution Substances 0.000 description 7
- 238000006243 chemical reaction Methods 0.000 description 6
- 230000007423 decrease Effects 0.000 description 6
- 230000001965 increasing effect Effects 0.000 description 6
- 239000003990 capacitor Substances 0.000 description 5
- 230000010355 oscillation Effects 0.000 description 5
- 239000002184 metal Substances 0.000 description 4
- 238000011161 development Methods 0.000 description 3
- 238000005516 engineering process Methods 0.000 description 3
- 239000007788 liquid Substances 0.000 description 3
- 238000013178 mathematical model Methods 0.000 description 3
- 239000011159 matrix material Substances 0.000 description 3
- 230000001105 regulatory effect Effects 0.000 description 3
- 230000035945 sensitivity Effects 0.000 description 3
- 230000000087 stabilizing effect Effects 0.000 description 3
- NIXOWILDQLNWCW-UHFFFAOYSA-N acrylic acid group Chemical group C(C=C)(=O)O NIXOWILDQLNWCW-UHFFFAOYSA-N 0.000 description 2
- 239000000853 adhesive Substances 0.000 description 2
- 230000001070 adhesive effect Effects 0.000 description 2
- 238000004458 analytical method Methods 0.000 description 2
- 230000000694 effects Effects 0.000 description 2
- 238000003018 immunoassay Methods 0.000 description 2
- 238000002847 impedance measurement Methods 0.000 description 2
- 239000004816 latex Substances 0.000 description 2
- 229920000126 latex Polymers 0.000 description 2
- 239000000463 material Substances 0.000 description 2
- 102000004169 proteins and genes Human genes 0.000 description 2
- 108090000623 proteins and genes Proteins 0.000 description 2
- 238000001712 DNA sequencing Methods 0.000 description 1
- 230000003321 amplification Effects 0.000 description 1
- 239000012620 biological material Substances 0.000 description 1
- 238000010276 construction Methods 0.000 description 1
- 230000003247 decreasing effect Effects 0.000 description 1
- 238000007598 dipping method Methods 0.000 description 1
- 238000007876 drug discovery Methods 0.000 description 1
- 230000005672 electromagnetic field Effects 0.000 description 1
- 230000005674 electromagnetic induction Effects 0.000 description 1
- 230000003028 elevating effect Effects 0.000 description 1
- 238000000105 evaporative light scattering detection Methods 0.000 description 1
- 230000004907 flux Effects 0.000 description 1
- 230000003993 interaction Effects 0.000 description 1
- 238000004519 manufacturing process Methods 0.000 description 1
- 238000012067 mathematical method Methods 0.000 description 1
- 238000012986 modification Methods 0.000 description 1
- 230000004048 modification Effects 0.000 description 1
- 238000003199 nucleic acid amplification method Methods 0.000 description 1
- 150000002894 organic compounds Chemical class 0.000 description 1
- 239000002245 particle Substances 0.000 description 1
- 238000012545 processing Methods 0.000 description 1
- 239000005871 repellent Substances 0.000 description 1
- 239000012266 salt solution Substances 0.000 description 1
- 238000007789 sealing Methods 0.000 description 1
- 239000003566 sealing material Substances 0.000 description 1
- 229920002050 silicone resin Polymers 0.000 description 1
- 238000002791 soaking Methods 0.000 description 1
- 238000003756 stirring Methods 0.000 description 1
- 231100000331 toxic Toxicity 0.000 description 1
- 230000002588 toxic effect Effects 0.000 description 1
- 238000012800 visualization Methods 0.000 description 1
Images


Classifications
-
- G—PHYSICS
- G01—MEASURING; TESTING
- G01G—WEIGHING
- G01G3/00—Weighing apparatus characterised by the use of elastically-deformable members, e.g. spring balances
- G01G3/12—Weighing apparatus characterised by the use of elastically-deformable members, e.g. spring balances wherein the weighing element is in the form of a solid body stressed by pressure or tension during weighing
- G01G3/13—Weighing apparatus characterised by the use of elastically-deformable members, e.g. spring balances wherein the weighing element is in the form of a solid body stressed by pressure or tension during weighing having piezoelectric or piezoresistive properties
Definitions
- the present invention relates to a QCM (Quartz Crystal Microbalance) sensor that that detects an amount of a substance adsorbed on a piezoelectric transducer based on a change in resonance frequency of the piezoelectric transducer, such as an AT-cut quartz resonator, caused by adsorption (attachment) of a small amount of substance on the piezoelectric transducer.
- QCM Quadrat Crystal Microbalance
- a quartz crystal resonator is made to oscillate by an oscillating circuit and an output is measured by a frequency counter, it is possible to have simple and highly sensitive measurement of a change in the mass.
- the quartz crystal resonator is used in a liquid, the resonance frequency changes depending on the viscosity and the density of the liquid so that the viscosity and the density of the liquid can be determined from the resonance frequency.
- terminals of a plurality of resonators in which a quartz substrate is arranged in two-dimensions are connected in the form of a matrix.
- a wiring in the direction of X and a wiring in the direction of Y are switched by a switching circuit like a relay etc. and only a resonator at an intersection of the wiring selected is connected to the oscillating circuit.
- the number of wiring was reduced (refer to the technology disclosed in paragraphs 0048 to 0051 and FIG. 3 of Japanese Patent Application Laid-open Publication No. 2000-338022).
- reference numeral 51 denotes a multi-channel QCM sensor device provided with a plurality of oscillating domains on a quartz crystal substrate and A to I denote working electrodes and are oscillating domains for each electrode.
- Rear electrodes are disposed on a rear surface of the oscillating domains.
- the working electrodes are connected commonly in a vertical direction in the diagram to terminals 521, 522, and 523.
- the rear electrodes are connected commonly in a horizontal direction to terminals 531, 532, and 533.
- a vertical wiring is selected by a change-over switch 55 and a horizontal wiring is selected by a change-over switch 56.
- a working electrode and a rear electrode of an oscillating domain selected are connected to a oscillating circuit or an impedance-measurement circuit 54 and the resonance frequency is measured.
- a controller 57 specifies the vertical direction and the horizontal direction from a plurality of piezoelectric-transducer (piezoelectric-oscillating) fields and selects one piezoelectric transducer field.
- the measurement of the resonance frequency has to be repeated as many times as the number of the piezoelectric-transducer fields. Due to this, time required for one measurement point is long. Particularly, when the resonance frequency is measured by the oscillating frequency, it takes a long time for the stopped oscillations to reach stable oscillations. As a result, the time required for measurement becomes long which is a drawback. In addition, an operation of the change-over switch further complicates the measurement.
- a quartz crystal microbalance sensor detects a change in resonance frequency of a piezoelectric transducer caused by adsorption of a substance on a surface of the piezoelectric transducer.
- the quartz crystal microbalance sensor includes a plurality of piezoelectric transducers, each piezoelectric transducer having a pair of electrodes including a first electrode and a second electrode; a pair of connecting lines including a first connecting line that is commonly connected to each of the first electrodes of the piezoelectric transducers and a second connecting line that is commonly connected to each of the second electrodes of the piezoelectric transducers; and a pair of terminals including a first terminal that is connected to the first connecting line and a second terminal that is connected to the second connecting line.
- a quartz crystal microbalance sensor detects a change in resonance frequency of a piezoelectric transducer caused by adsorption of a substance on a surface of the piezoelectric transducer.
- the quartz crystal microbalance sensor includes a plurality of piezoelectric transducers, each piezoelectric transducer having a substrate, the substrate having a plurality of oscillating domains, one of the oscillating domains is used as a target oscillating domain and remaining oscillating domains are used for measurement of a sample; a plurality of pair of electrodes including a first electrode and a second electrode, each pair of electrodes corresponding to each oscillating domain on the substrate to drive the corresponding oscillating domain; a pair of connecting lines including a first connecting line that is commonly connected to each of the first electrodes of the piezoelectric transducers and a second connecting line that is commonly connected to each of the second electrodes of the piezoelectric transducers; and a pair of terminals including a first
- a quartz crystal microbalance sensor device includes a quartz crystal microbalance sensor.
- the quartz crystal microbalance sensor includes a plurality of piezoelectric transducers, each piezoelectric transducer having a pair of electrodes including a first electrode and a second electrode, each piezoelectric transducer oscillating at a predetermined resonance frequency; and a pair of terminals including a first terminal that is commonly connected to each of the first electrodes of the piezoelectric transducers and a second terminal that is commonly connected to each of the second electrodes of the piezoelectric transducers; and a resonance-frequency measuring unit that is connected to the pair of terminals of the quartz crystal microbalance sensor and that measures a change in resonance frequency of each of the piezoelectric transducers, wherein the change in resonance frequency of each of the piezoelectric transducers is caused by adsorption of a substance on a surface of the piezoelectric transducer, and calculates a mass of the substance deposited on the surface of the quartz crystal microbalance
- FIG. 1 is a diagram of a QCM sensor that is used in a QCM sensor device according to a first embodiment of the present invention
- FIG. 2 is a diagram of the QCM sensor device
- FIG. 3 is an equivalent circuit of a quartz crystal resonator in the QCM sensor
- FIG. 4 is a graph of admittance characteristics of the equivalent circuit shown in FIG. 3 ;
- FIG. 5 is an equivalent circuit in which four quartz crystal resonators are connected in parallel;
- FIG. 6 is a graph of admittance characteristics of the equivalent circuit shown in FIG. 5 ;
- FIG. 7 is a block diagram of an admittance measuring unit
- FIG. 8 is a flow chart of a process procedure for measuring a sample using the QCM sensor device
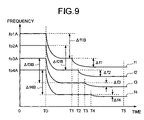
- FIG. 9 is a time chart of a change in the resonance frequency upon measurement by using a plurality of quartz crystal resonators having different resonance frequencies
- FIG. 10 is a flow chart of a process procedure for measuring when the quart crystal resonators have same or different resonance frequencies
- FIG. 11 is a flow chart of a process procedure for calculating the resonance frequency by using a method of least squares
- FIG. 12 is a flow chart of a process procedure for calculating initial values of equivalent circuit constants when there is one resonance point
- FIG. 13 is a flow chart of a process procedure for calculating initial values of equivalent circuit constants when there are a plurality of resonance points
- FIG. 14 is a graph of admittance characteristics illustrating each resonance status of a plurality of quartz crystal resonators X;
- FIG. 15 is a top view of a configuration of a QCM sensor according to the first embodiment
- FIG. 16 is a cross sectional view taken along line a–a′ shown in FIG. 15 ;
- FIG. 17 is a side cross sectional view of an oscillating domain of one of the quartz crystal resonators
- FIG. 18 is a view of a front surface (in contact with a solution) of the quartz crystal resonator
- FIG. 19 is a view of a rear surface of the quartz crystal resonator
- FIG. 20 is a view of a side surface of the quartz crystal resonator
- FIG. 21 is a time chart of a change in the resonance frequency when measured by using a plurality of the quartz crystal resonators in which the resonance frequencies in a second embodiment of the present invention are matched;
- FIG. 22 is a flow chart of a process procedure for measuring by using a plurality of quartz crystal resonators having same resonance frequencies
- FIG. 23 is a top view of a QCM sensor according to a third embodiment of the present invention.
- FIG. 24 is side view of the QCM sensor shown in FIG. 23 ;
- FIG. 25 is a QCM sensor device according to a fourth embodiment
- FIG. 26 is a side cross sectional view of the QCM sensor according to the fourth embodiment.
- FIG. 27 is a time chart of a change in the resonance frequency when the resonance frequency is measured by using a quartz crystal resonator according to the fourth embodiment
- FIG. 28 is a top view of a QCM sensor according to the fourth embodiment.
- FIG. 29 is a cross sectional view taken along line a–a′ shown in FIG. 28 ;
- FIG. 30 is a top view of the quartz crystal resonator according to the fourth embodiment.
- FIG. 31 is a wiring diagram of the quartz crystal resonator shown in FIG. 30 ;
- FIG. 32 is another example of structure of the quartz crystal resonator according to the fourth embodiment.
- FIG. 33 is still another example of structure of the quartz crystal resonator according to the fourth embodiment.
- FIG. 1 is a diagram of a QCM sensor in a QCM sensor device according to a first embodiment of the present invention.
- FIG. 2 is a diagram of structure of the QCM sensor device.
- a QCM sensor 1 includes a plurality of AT-cut quartz crystal resonators X (X 1 , X 2 , . . . , XN) which are piezoelectric transducers.
- the quartz crystal resonators X 1 , X 2 , . . . , XN have resonance frequencies fo 1 , fo 2 , . . . , foN, respectively.
- the quartz crystal resonators are connected in parallel with each other and one electrode of each quartz crystal resonator is connected to a connecting terminal TA and other electrode of each quartz crystal resonator is connected to a connecting terminal TB.
- the connecting terminals TA and TB are connected to two measuring terminals of an admittance measuring unit 2 (see FIG. 2 ). Because the quartz crystal resonators X 1 , X 2 , . . . , X 3 are connected in parallel, the admittance measured in the admittance measuring unit 2 is a combined admittance of all the quartz crystal resonators X 1 , X 2 , . . . , X 3 . Admittance data 4 of the admittance measured is transmitted to an information processor 3 .
- the information processor 3 calculates the resonance frequency of each quartz crystal resonator.
- the admittance-measurement unit 2 and the information processor 3 form a resonance-frequency measuring unit.
- the information processor 3 calculates the mass of a sample at the time of the measurement from the resonance frequencies.
- a display unit 3 A displays calculation results of the information processor 3 .
- FIG. 3 is an equivalent circuit of the quartz crystal resonator.
- the quartz crystal resonator X can be expressed as a series resonance circuit that includes an inductor Lx, a capacitor Cx, and a resistor Rx and as a parallel resonance circuit that includes a parallel-connected capacitor Cp that has capacitance of an electrode and capacitance of a wire that is connected to the electrode.
- FIG. 4 is a graph of the admittance characteristics of the equivalent circuit shown in FIG. 3 .
- frequency is plotted on the horizontal axis and a real part G (i.e., conductance) and an imaginary part B (i.e., susceptance) of the admittance are plotted on the vertical axis.
- the real part G of the admittance reaches the maximum value Gmax at the resonance frequency fo. If f 1 and f 2 are the frequencies at which the real part G falls to half it's value, then the difference fw in frequencies f 1 and f 2 is equal to a value that is obtained when fo is divided by a quality factor Q.
- the imaginary part B reaches the maximum value Bmax at the frequency f 1 and reaches the minimum value Bmin at the frequency f 2 .
- FIG. 5 is an equivalent circuit in which four quartz crystal resonators are connected in parallel.
- An equivalent circuit and admittance characteristics when four quartz crystal resonators having frequencies that differ by fw are connected in parallel are described below.
- Equivalent circuit constants have values Lx 1 to Lx 4 , Cx 1 to Cx 4 , Rx 1 to Rx 4 , and Cp 1 to Cp 4 corresponding to the quartz crystal resonators X 1 to X 4 .
- FIG. 6 are graphs of the admittance characteristics of the equivalent circuit shown in FIG. 5 .
- the graph (a) is a plot of the admittance characteristics when the sample is in the atmosphere
- the graph (b) is a plot of the admittance characteristics when the sample is in a buffer solution like physiological salt solution
- the graph (c) is a plot of the admittance characteristics when the sample is added drop wise to a buffer solution.
- represent frequency is plotted on the horizontal axes and admittance (rear part G and imaginary part B) is plotted on the vertical axes.
- the solid line GA corresponds to the real part G (conductance) of the combined admittance
- the dotted line BA corresponds to the imaginary part B (susceptance) of the combined admittance.
- Characteristics shown in FIG. 6 are visualization of the admittance data 4 that is output from the admittance measuring unit 2 (see FIG. 2 ).
- the resonance points P 1 , P 2 , P 3 , and P 4 of the four quartz crystal resonators are separated distinctly and sharply.
- the resonance frequency of each quartz crystal resonator decreases by about 20 MHz (change of ⁇ f 1 B, ⁇ f 2 B, ⁇ f 3 B, and ⁇ f 4 B in the resonance frequency).
- FIG. 7 is a block diagram of the admittance measuring unit 2 .
- the admittance measuring unit 2 includes a voltage controlled oscillator (VOC) 11 , an output amplifier 12 , an input amplifier 13 , a pair of phase detectors PD 1 ( 14 a ) and PD 2 ( 14 b ), a pair of A/D converters AD 1 ( 15 a ) and AD 2 ( 15 b ), and a control circuit (CONT) 16 .
- the VOC 11 performs sweeping drive of the quartz crystal resonator X in a desired frequency range.
- the input amplifier 13 amplifies an input signal which is a drive signal that is transmitted through the quartz crystal resonator X.
- the phase detector PD 1 ( 14 a ) detects the signal strength of a real part of the input signal and the phase detector PD 2 ( 14 b ) detects the signal strength of an imaginary part of the input signal.
- the CONT 16 performs the overall control.
- the quartz crystal resonator X (X 1 to XN shown in FIG. 1 ) which is provided as an element to be measured in the QCM sensor 1 , is connected to an output terminal 17 a and an input terminal 17 b .
- the VCO 11 performs sweeping oscillations of a sine wave with a desired frequency range in sweeping time by a control voltage SG 1 that is output from the CONT 16 .
- the output amplifier 12 performs power amplification of the sine wave signal and the sine wave signal is then output from the output terminal 17 a.
- a sine wave signal output that is output from the output terminal 17 a is supplied to the quartz crystal resonator X.
- An output from the quartz crystal resonator X is input to the input terminal 17 b .
- the input amplifier 13 amplifies an input signal to obtain an amplified signal SG 3 .
- the amplified signal SG 3 is input to the phase detectors PD 1 ( 14 a ) and PD 2 ( 14 b ).
- the VCO 11 outputs a real-part phase-signal SG 4 that is used for the phase detection by the phase detector PD 1 ( 14 a ).
- the real-part phase-signal SG 4 has the same phase as the input signal SG 3 .
- the VCO 11 outputs an imaginary-part phase-signal SG 5 that has a phase difference of 90 degrees from that of the amplified signal SG 3 to the phase detector PD 2 ( 14 b ) of the imaginary part.
- the phase detector PD 1 ( 14 a ) outputs an analog signal SG 6 that has undergone phase detection by the real-part phase-detection signal SG 4 and is proportional to the real part of the admittance.
- the phase detector PD 2 ( 14 b ) outputs an analog signal SG 7 that has undergone phase detection by the imaginary-part phase-detection signal SG 5 and is proportional to the imaginary part of the admittance.
- the A/D converters AD 1 ( 15 a ) and AD 2 ( 15 b ) converts the analog signals SG 6 and SG 7 to digital data SG 8 and SG 9 .
- the CONT 16 converts the digital signals SG 8 and SG 9 to a suitable format.
- the digital signals converted to the suitable format are output to the information processor 3 (see FIG. 2 ) via a digital interface 18 .
- the output is the admittance data 4 shown in FIG. 2 .
- a direct conversion type arrangement in which the input signal SG 3 is allowed to undergo phase detection directly by using the phase signals SG 4 and SG 5 having the same frequency as that of the input signal SG 3 , is used.
- a single conversion type arrangement in which the input signal SG 3 is converted to a signal having an intermediate frequency and then allowed to under go phase detection or a double conversion type arrangement in which the intermediate frequency is converted in two stages can also be used.
- the admittance measuring unit 2 sweeps the resonance frequency of the four quartz crystal resonators X 1 to X 4 in a range that covers the resonance frequency with a tolerance of about fw and measures the admittance characteristics shown in FIG. 6 .
- the resonance frequency is swept in one continuous frequency domain. There may be different frequency domains corresponding to the resonance frequencies of individual quartz crystal resonators.
- the admittance is measured by the admittance measuring unit 2 which is a resonance-frequency measuring circuit.
- the present invention is not limited to the measurement of admittance by the admittance measuring unit 2 and equivalent circuit constants for all the quartz crystal resonators can be calculated separately by the calculation of impedance measurement etc.
- the admittance measuring unit 2 can measure the admittance while sweeping the frequency and a general purpose network analyzer or an impedance analyzer can also be used as the admittance measuring unit.
- NETWORK ANALYZER E5100A manufactured by AGILENT CO. LTD. can be used as the admittance measuring unit 2 .
- the admittance data 4 that is output from the admittance measuring unit 2 is input to the information processor 3 .
- the information processor 3 may be a personal computer (PC), or a central processing unit (CPU) with specialized software assembled in it, or specialized hardware.
- the information processor 3 calculates equivalent circuit constants of a resonance circuit of the quartz crystal resonators X 1 , X 2 , . . . , XN by a calculation process using the method of least squares from the change in admittance at the frequencies acquired in (by) the admittance measuring unit 2 .
- the information processor 3 then calculates the resonance frequency by (from) the equivalent circuit constants.
- the information processor 3 by using mass sensitivity that is calculated in advance, performs calculation to convert the change in the resonance frequency to mass change and outputs to outputs of mass change OUT 1 to OUTN.
- the admittance measuring unit 2 and the information processor 3 can be connected to each other by a general purpose interface bus (GPIB) interface.
- GPS general purpose interface bus
- the equivalent circuit constants when the quartz crystal resonators X 1 to XN are connected in parallel is predicted by a mathematical method like the method of least squares.
- the resonance frequencies of the quartz crystal resonators are calculated independently from the equivalent circuit constants. An arrangement can be made such that the resonance frequency is calculated directly without calculating the equivalent circuit constants in the information processor 1 .
- the Q factor etc. can be calculated easily, thereby elevating the analyzing capability of the QCM sensor device.
- FIG. 8 is a flow chart of a process procedure for measuring a sample using the QCM sensor device and
- FIG. 9 is a time chart of a change in the resonance frequency upon measurement by using a plurality of quartz crystal resonators having different resonance frequencies. Time is plotted on the horizontal axis and frequency is plotted on the vertical axis. A change in the four resonance frequencies corresponding to situations shown in graphs (a) to (c) in FIG. 6 is indicated.
- quartz crystal parameters are measured in the atmosphere (air) (step S 1 ).
- the quartz crystal parameters include the equivalent circuit constants (Lx, Cx, Rx, and Cp), the resonance frequency f, the Q factor, the maximum value Gmax of the real part G (conductance) of the admittance, the maximum value Bmax of the imaginary part B (susceptance) of the admittance, the frequency f 1 at which the imaginary part B has the maximum value Bmax, the minimum value Bmin, the frequency f 2 at which the imaginary part B has the minimum value Bmin, and the resonance frequency fo at which the real part G has the maximum value Gmax.
- a period of measurement is from 0 to T 0 in FIG.
- the buffer solution is poured in a receptacle (like a well) (step S 2 ).
- the buffer solution is poured at time T 0 in FIG. 9 . Because of the dipping the quartz crystal resonator X to the buffer solution, the resonance frequency decreases by about 20 KHz and also the Q factor falls down to about 1000. The resonance frequency and the Q factor start decreasing as soon as the electrodes of the resonator come in contact with the buffer solution. Therefore after a rapid decrease in the resonance frequency, the frequency changes gradually and is then stabilized.
- the resonance frequency measuring unit displays measurement results in the form of values or a graph on the display unit 3 A.
- the resonance frequency of the quartz crystal resonator X in the buffer solution is measured (step S 3 ).
- the resonance frequency changes by an amount of ⁇ f 1 b , ⁇ f 2 b , ⁇ f 3 B, and ⁇ f 4 B shown in FIG. 9 (situation equivalent to that in graph (b) of FIG. 6 ).
- a sample solution that contains a substance to be measured is added (step S 4 ).
- the sample solution is added from time T 1 until time T 4 .
- the frequency of the resonator changes with the amounts of change ⁇ f 1 B, ⁇ f 2 B, ⁇ f 3 B, and ⁇ f 4 B corresponding to the sample.
- the mass of the sample can be calculated based on the amount of change ⁇ f 1 , ⁇ f 2 , ⁇ f 3 , and ⁇ f 4 (situation equivalent to that in graph (b) of FIG. 6 ).
- the measurement is ended (step S 5 ).
- the time at which each of the four samples is added i.e., T 1 to T 4 , is different; however, the four samples may be added at a time.
- FIG. 10 is a flow chart of a process procedure for the measurement when there the resonance frequencies of the quartz crystal resonators are same or different.
- the process procedure shown in FIG. 10 corresponds to the step S 3 in FIG. 8 .
- the measurement is ended by a command at step S 5 in FIG. 8 .
- a continuous measurement loop shown in FIG. 10 is a series of measurement process (SM 0 ) from step S 11 to step S 15 .
- the admittance measuring unit 2 measures the admittance characteristics of the quartz crystal resonator X (step S 11 ).
- the admittance is measured by frequency sweeping by (in) a predetermined frequency range and time. Concretely, the admittance is measured by sweeping a frequency range that covers the resonance frequencies f 1 to f 4 of the quartz crystal resonator during the time T 0 to T 5 in FIG. 9 .
- the information processor 3 acquires the admittance data 4 , which is digital data (step S 12 ). Then, the information processor 3 calculates the resonance frequency of the quartz crystal resonator X (X 1 to X 4 ) by using the method of least squares for the admittance data 4 (step S 13 ). Details of calculations by the method of least square are mentioned in latter.
- step S 14 it is decided whether the result of the method of least squares has converged. If the result has not converged, for example due to inability to obtain a normal value by calculation (“No” at step S 14 ), the measurement is stopped. The situation is displayed on the display unit 3 A of the information processor 3 and the continuous measurement by the series of measurements (SM 0 ) is ended. Moreover, since there is also a possibility of the process ending abnormally due to an accidental occurrence like measurement noise etc., if the values are not converged even after trying the process from steps S 11 through S 13 repeatedly (“No” at step S 14 ), the continuous measurement may be ended.
- step S 14 If the result has converged (“Yes” at step S 14 ) and normal values are obtained, the resonance frequency of each quartz crystal resonator X (X 1 to X 4 ) obtained by calculation by the method of least squares at step S 13 , the values are displayed in figures or graphically on the display unit 3 A (step S 15 ). Further, it is decided whether to end the measurement (step S 16 ). If an end measurement (step S 5 in FIG. 8 ) command is not there (“No” at step S 16 ), the measurement process SM 0 is repeated till the end measurement command is received. If the end measurement command is received (“Yes” at step S 16 ), the resonance frequency measuring unit ends the continuous measurement.
- the calculation of the resonance frequency by the method of list squares performed by the information processor 3 is described below.
- the information processor 3 performs calculation based on the admittance output from the admittance measuring unit 2 .
- a process to calculate the resonance frequencies of the quartz crystal resonators X are by (from) the admittance characteristics shown in the admittance data 4 is performed in two stages.
- a mathematical model of the quartz crystal resonator is decided and the method of least squares is applied.
- the mathematical model expresses by equation, the change in admittance at the frequency of the equivalent circuit. Since an unknown figure to be calculated is equivalent circuit constants, the admittance is considered as a function of the equivalent circuit constants.
- Lx, Cx, Rx, and Cp in the equivalent circuit denote series inductance, series capacitance, series resistance, and parallel capacitance respectively.
- the measured value of admittance in a frequency range is obtained as the admittance data 4 .
- the method of least squares is used to calculate the most reliable equivalent circuit constants corresponding to the measured value.
- initial values Lx 0 , Cx 0 , Rx 0 , and Cp 0 are set to linearize the mathematical model.
- the most reliable value is obtained by adding correction values ⁇ Lx, ⁇ Cx, ⁇ Rx, and ⁇ Cp to the initial values.
- the admittance function is linearized by Taylor expansion around the initial values in such a manner that, a difference ⁇ Yi, which is a difference between measured admittance and admittance obtained from the initial values, has a linear relationship with a correction value ⁇ Pj of the equivalent circuit. Further, by applying the method of least squares, the correction value ⁇ Pj ( ⁇ Lx, ⁇ Cx, ⁇ Rx, and ⁇ Cp) can be obtained.
- the most reliable value of the equivalent circuit constants of the quartz crystal resonator can be calculated by finding the initial value and applying the method of least squares. However, if the initial value differs from the theoretical value, applying the correction only once is not sufficient. Further, judgment of convergence and repetition process are performed. If the repetition process is not possible in the judgment of repetition, the process is ended abnormally. While performing the repetition process, the most reliable value obtained by the calculation is taken as initial value. The initial value is updated and the again correction-calculation is performed.
- the equivalent circuit constants are calculated.
- the equivalent circuit constants are obtained by adding the correction value to the initial value.
- the series inductance Lx, the series capacitance Cx, the series resistance Rx, and the parallel capacitance Cp is obtained by Lx+ ⁇ Lx, Cx+ ⁇ Cx, Rx+ ⁇ Rx, and Cp+ ⁇ Cp.
- the resonance frequency f and the Q factor can be obtained by the following equations.
- Resonance frequency f 1/(2 ⁇ square root over (( Lx ⁇ Cx ))) ⁇
- the resonance frequency f and the Q factor of the quartz crystal resonator X can be calculated from the admittance characteristics by a mathematical process using the method of nonlinear least-squares.
- FIG. 11 is a flow chart of a process procedure for calculation of the resonance frequency by using the method of least squares.
- the initial values to be used in the method of least squares are obtained based on the admittance characteristics shown in the admittance data 4 measured in the admittance measuring device 2 (step S 21 ).
- the amount of correction to the initial values is calculated by the method of least squares (step S 22 ).
- a judgment of convergence is made (step S 23 ).
- a judgment of whether the amount of correction compared to the initial value is small enough is made.
- step S 23 If the amount of correction is small enough, it is judged to be converged (“Yes” at step S 23 ) and if the amount of correction is large, it is judged not to be converged (“No” at step S 23 ). When it is not judged to be converged, the correction is continued further.
- the repetition judgment is made and a judgment of whether the correction is made for regulated number of times (“No” at step S 24 ) is made. If a judgment of no possibility (chances) of convergence even after repetition the correction is made, the process is ended abnormally. If the correction is not made for regulated number of times (“Yes” at step S 24 ), the correction is continued further. While the correction is continued, the initial values are updated (step S 25 ). Here, a value in which the correction value calculated at step S 22 is added to the initial value is used as a new initial value.
- step S 26 is executed to calculate the resonance frequency. If it is not converged (“No” at step S 23 ), the correction is repeated till the number of times of repetition that is regulated in advance in the judgment of repetition at step 24 .
- the equivalent circuit constants related to the required quartz crystal resonator X is obtained by calculating the value in which the correction value is added to the initial value at step S 26 as the equivalent circuit constants. Further, the resonance frequency f and the Q factor are calculated (step S 27 ) and the process is ended.
- a method for obtaining an initial value of the equivalent circuit constants in FIG. 11 is described below.
- a method for calculation of the initial value when the quartz crystal resonator X has one resonance point is different than that when the quartz crystal resonator X has two resonance points. To start with, the method for calculation of the initial value when the quartz crystal resonator X has one resonance point is described.
- frequencies at three characteristic locations from the admittance characteristics measured are selected.
- An initial value of the equivalent circuit constants can be obtained by calculation based on an admittance value at each point.
- the initial value is obtained by selecting resonance frequencies at three locations based on the admittance characteristics of the admittance data that is output from the admittance measuring unit 2 and by calculating from the value of admittance at each location.
- the initial value is obtained by selecting three frequencies fo, f 1 , and f 2 drawn on the admittance characteristics shown in FIG. 4 .
- FIG. 12 is a flow chart of a procedure for calculating the initial values of the equivalent circuit constants when there is one resonance point.
- the INITIAL VALUES are rough values of the equivalent circuit constants which are used for starting the calculation by the method of least squares.
- the initial values can be calculated irrespective of whether in the buffer solution or in the atmosphere.
- a real part G (conductance) of the admittance data measured is searched and the maximum value (peak value) of the real part G, the frequency fo at the maximum value, and an imaginary part (susceptance) B 0 are determined (step S 31 ). Further an imaginary part B (susceptance) of the admittance data is searched and frequencies f 1 and f 2 of peak values of a positive and negative peaks of the imaginary part B are determined (step S 32 ). Then, the resonance frequency f, the series resistance Rx, the Q factor, the series inductance Lx, the series capacitance Cx, and the parallel capacitance Cp are calculated according to the equations (4) to (9) (step S 33 ).
- FIG. 13 is a flow chart of a procedure for calculating initial values of the equivalent circuit constants when there is a plurality of resonance points.
- FIG. 14 is a graphical representation of admittance characteristics illustrating each resonance status of a plurality of the quartz crystal resonators.
- the equivalent circuit is the same as that shown in FIG. 5 . However, since the capacitors in parallel Cp 1 to Cp 4 can be combined into one capacitor, let the value (capacitance) of the combined capacitor be C. Parameters of individual quartz crystal resonator are express by suffices 1 to 4 .
- step S 41 maximum values of frequencies f 1 to f 4 of the resonance points and maximum values Gmax 1 to Gmax 4 of real part G (conductance) of admittance data at the frequencies f 1 to f 4 are determined. Further, Q factors Q 1 to Q 4 are calculated based on comparison of a maximum value of conductance at the resonance points which are measured in the atmosphere in advance and values of series resistances Rx 1 to Rx 4 (step S 42 ). In this case, since the Q factor of resonance in the atmosphere is sufficiently big and since the resonance points are separated, the conductance G and the Q factor of the resonance points can be obtained separately (individually).
- the series resistance in the buffer solution is inversely proportional to a ratio of maximum conductance at a resonance point in atmosphere and maximum conductance at a resonance point in the buffer solution.
- the values of the series inductance Lx and the series capacitance Cx are assumed to have no change even when the quartz crystal resonator is exposed to the buffer solution. Practically, though the series inductance Lx and the series capacitance Cx are considered to be different in the atmosphere and in, the buffer solution, the values may have accuracy such that the values are not so high as initial values.
- an average value of an imaginary part (susceptance) BA in a specific frequency domain of the admittance characteristics is obtained and the parallel capacitance Cp is calculated (step S 43 ).
- f is an average value of the resonance frequencies f 1 to f 4 and a domain that includes the four resonance points and is mainly around the four resonance points is selected as specific frequency domain.
- a domain that includes frequencies f 1 to f 4 in FIG. 4 is a specific frequency domain.
- the direct series inductance Lx and the direct capacitance Cx are calculated from the resonance frequencies F (f 1 to f 4 ), Rx (Rx 1 to Rx 4 ), and the Q factors (Q 1 to Q 4 ) in the buffer solution by using the following equations (12) and (13) (step S 44 ).
- the equation (12) corresponds to the calculation at the resonance point f 1 and similar equations can be prepared for the resonance points f 2 and f 3 .
- series inductance Lx 1 Q 1 ⁇ Rx 1/(2 ⁇ f 1)
- series capacitance Cx 1 1/(2 ⁇ f 1 ⁇ Q 1 ⁇ Rx 1) (13)
- the initial values to be used in the method of least square can be obtained even when the sample is in the buffer solution.
- a characteristic curve of the admittance characteristics (such as resonance frequencies f 1 to f 4 , real parts (conductance) G 1 to G 4 of admittance and imaginary parts (susceptance) B 1 to B 4 of admittance) related to the quartz crystal resonators X (X 1 to X 4 ) shown in FIG. 14 can be displayed upon calculation by the method of least squares on the display unit 3 A of the information processor 3 (see FIG. 2 ).
- the resonance frequencies of the quartz crystal resonators X 1 , X 2 , . . . , XN are different.
- a difference fw between the resonance frequencies of the quartz crystal resonators is reduced, even a greater number of quartz crystal resonators can be measured at a time. If the difference between the resonance frequencies is reduced, in the admittance characteristics, resonance curves are overlapped and it becomes difficult to separate.
- the minimum value of the difference between the resonance frequencies fw differs depending on the method of calculation to obtain the resonance frequencies from the admittance characteristics and the changing width of the resonance frequencies. In general, a difference of a full width at half maximum facilitates separating. If the Q factors of the quartz crystal resonators differ from each other, the difference can be reduced even further as compared to a case of same value. Consequently, it is desirable to set the resonance frequencies by anticipating the amount of change in the resonance frequencies such that the difference between the resonance frequencies fw is greater than the minimum value after the change in the resonance frequencies.
- FIG. 15 is a top view of a configuration of the QCM sensor according to the first embodiment.
- FIG. 16 is cross sectional view taken along the line a–a′ shown in FIG. 15 .
- a block 26 of thickness 10 mm which is made of acrylic is stuck on a substrate 25 on which four quartz crystal resonators X 1 to X 4 are mounted.
- Four holes of diameter of about 6 mm are made as sample holders 26 a 1 to 26 a 4 in the block 26 matching with the positions of quartz crystal resonators X 1 to X 4 (oscillating domain).
- the sample holders 26 a 1 to 26 a 4 function as wells which hold the samples.
- the quartz crystal resonators X 1 to X 4 are disposed at bases of the sample holders 26 a 1 to 26 a 4 .
- a substance to be detected which is included the samples (including the buffer solution) introduced in the sample holders 26 a 1 to 26 a 4 is detected by attaching (adsorbing) the to a sensing film (described in detail in the latter part) that is formed on surface electrodes of the quartz crystal resonators X 1 to X 4 .
- a metal wiring pattern is formed as a common line 27 on a surface of the substrate 25 .
- the common line 27 is connected to connecting terminals TA and TB.
- FIG. 17 is a side cross sectional view of an oscillating domain of one of the quartz crystal resonators.
- the quartz crystal resonator X 1 is fixed on pads 30 and 31 with a conductive adhesive 32 or an ACF (anisotropic conductive film), thereby having continuity.
- the pads 30 and 31 include metal wiring patterns.
- a rear electrode 29 b of the quartz crystal resonator X 1 faces the substrate 25 .
- An air hole 25 a is made on a part of the substrate 25 that is facing a rear electrode 29 b of the quartz crystal resonator X 1 so that a vibrating surface of the quartz crystal resonator does not come in contact with the substrate 25 .
- the pad 30 is a connecting pad that connects a front electrode 29 a and the rear electrode 29 b of the quartz crystal resonator electrically.
- the pad 31 is a dummy pad for adjusting the height of the quartz crystal resonator.
- the front electrode 29 a and the rear electrode 29 b are disposed such that they do not make a contact with each other.
- the pad 30 is connected to the connecting terminals TA and TB through the common line (metal wiring pattern) 27 .
- the conductive adhesive 32 it is necessary to insulate the sample electrically by sealing an area around the pads 30 and 31 by a sealing material like silicone resin 33 .
- FIG. 17 only one samples holder 26 a 1 (for quartz crystal resonator X 1 ) is shown.
- the remaining sample holders for the quartz crystal resonators X 2 to X 4 have same structure.
- FIG. 18 is a view of a front surface (in contact with a solution) of the quartz crystal resonator.
- FIG. 19 is a view of a rear surface of the quartz crystal resonator.
- FIG. 20 is a view of a side surface of the quartz crystal resonator as seen from a side shown by an arrow in FIG. 19 .
- the quartz crystal resonator X includes a front electrode 29 a and a rear electrode 29 b which are formed on a front surface of a quartz substrate 40 .
- the front electrode 29 a is connected to a connecting pad PA on a rear surface through a diagonal leading line 29 c .
- the rear electrode 29 b is connected to a connecting pad PB on a front surface of through a diagonal leading line 29 d .
- the connecting pads PA and PB are connected to the pad 30 shown in FIG. 17 .
- the rear electrode 29 b is not extended up to the front surface.
- the quartz crystal resonator is structured such that only the front electrode 29 a comes in contact with the sample.
- shorting (short-circuit) of the front electrode 29 a and the rear electrode 29 b due to a solution that includes the sample is prevented.
- An area covered by dotted line 41 in FIGS. 18 and 19 is an area that is stuck to the substrate 25 (see FIG. 17 ).
- An area outside the dotted line 41 is an area that is stuck to the substrate 25 .
- a second embodiment of the present invention is described below.
- the second embodiment differs from the first embodiment in that in the second embodiment the quartz crystal resonators X 1 to X 4 have almost same resonance frequency.
- the resonance frequency of each of the four quartz crystal resonators X 1 to X 4 is around 38.000 MHz.
- FIG. 21 is a time chart of a change in the resonance frequency when measured by using the quartz crystal resonators according to the second embodiment. Time is plotted on the horizontal axis and frequency is plotted on the vertical axis.
- the resonance frequency fo of each of the quartz crystal resonators X 1 to X 4 is same, as the time elapses, the number of resonance points changes as shown in FIG. 21 .
- a buffer solution is introduced at time T 0 in four wells (sa 1 to 26 a 4 ) shown in FIGS. 15 and 16 and the resonance frequency of the four quartz crystal resonators X 1 to X 4 is allowed to be stabilized. In this case, a change in the resonance frequency is ⁇ fB.
- the resonance can be separated every time the sample solution in introduced and the change in the resonance frequencies corresponding to the quartz crystal resonators X 1 to X 4 can be measured.
- the resonance frequency measuring unit (information processor 3) performs calculation to convert the change in resonance frequencies to mass change from the amounts of change ⁇ f 1 to ⁇ f 4 in the resonance frequencies by using mass sensitivity that is calculated in advance.
- FIG. 22 is a flow chart of a process procedure for measuring by using a plurality of quartz crystal resonators having resonance frequencies.
- a procedure for measurement when the number of resonance-points changes with time elapsed is illustrated in FIG. 22 and is equivalent to a process of using the method of least squares in steps S 13 and S 14 of procedure for measurement in FIG. 10 .
- step S 51 calculation process by using the method of least squares with one resonance point is performed. Further, a judgment of whether values of the results obtained are converged or not is made (step S 52 ). If the values are not converged upon performing the process with one resonance point (“No” at step S 52 ), the process ends abnormally. If the values are converged (“Yes” at step S 52 ), the process by the method of least squares with two resonance points is performed (step S 53 ).
- step S 55 a judgment of one resonance point is made (step S 55 ) and the process is ended by using the result obtained as resonance frequency at step 51 . If the values are converged (“Yes” at step S 54 ) by the process performed for the second time (step S 53 ), the process is repeated similarly while increasing the resonance point by one every time like three resonance points, then four resonance points etc. (step S 56 to step S 59 ). When the process is performed with four resonance points (step S 59 ) and if the values are converged (“Yes” at step S 60 ), without increasing the number of resonance point above four, the process is ended by using the result obtained as resonance frequency at step 59 .
- a method described in FIG. 11 can be used for processes at steps S 51 , S 53 , S 56 , and S 59 to obtain the resonance frequency by calculation using the method of least squares.
- a method described in FIG. 11 it is necessary to devise a method for acquisition of the initial values which are used for calculation by the method least squares.
- the procedure described by referring to FIG. 12 can be used for obtaining initial values for the process with one resonance points.
- the procedure described by referring to FIG. 13 the initial values for the process with more than two resonance points cannot be obtained.
- the method for calculation of the initial values described by referring to FIG. 13 is for a case where the resonance frequency in the atmosphere is separately distinctly in advance.
- the resonance frequencies of the quartz crystal resonators X 1 to X 4 match with each other.
- the initial value of the resonance frequency is obtained by the following method.
- the resonance frequency fitted (subjected to fitting) by the method of least squares with one resonance point is let to be fo and a frequency with a slight shift from fo can be used.
- a method in which the values are converged by employing the method of least squares after selecting the frequency with a slight shift where the quantity of slight shift is from a few Hz to a few KHz may be used.
- the accuracy of measurement of the resonance frequency depends on a capability to separate resonance. It is possible to improve the accuracy easily by devising a method of calculation for obtaining the equivalent circuit constants of the quartz crystal resonator from the admittance characteristics. According to the second embodiment, since the same resonance frequency for the quartz crystal resonator can be used, there is no need to arrange quartz crystal resonators of different resonance frequencies and the cost is reduced. Moreover, when a process for adjustment of resonance is omitted in a manufacturing process of the quartz crystal resonators, there is going to be variation in the resonance frequency of each quartz crystal resonator.
- the resonance frequencies can be separated in a range of measurement accuracy, the measurement accuracy can be applied in a tolerable range. In this case, the process for adjustment of resonance is not required and the cost is reduced to a great extent.
- FIG. 23 is a top view of a QCM sensor according to the third embodiment.
- FIG. 24 is a side view of the QCM sensor shown in FIG. 23 .
- four oscillating domains 53 a 1 to 53 a 4 are provided on a quartz substrate 40 .
- Electrodes to drive each of the oscillating domains 53 a 1 to 53 a 4 are provided on a front surface and a rear surface of resonators, thereby forming four quartz crystal resonators X 1 to X 4 on the substrate 40 .
- Front electrodes and rear electrodes of the quartz crystal resonators X 1 to X 4 are connected collectively (in parallel) by common lines 52 a and 52 b on the quartz substrate 40 and are led out to connecting terminals (connecting pads) PA and PB.
- the sample need not be necessarily held in the sample holders 26 a 1 to 26 a 4 shown in FIGS. 15 and 16 .
- samples 54 a 1 to 54 a 4 applied drop wise on the quartz crystal resonators X 1 to X 4 as shown in FIG. 24 can be held by using surface tension of the quartz substrate 40 . In this case, water-repellent process of a surface of the quartz substrate 40 is performed deliberately to hold the sample more reliably.
- quartz crystal resonators X 1 to X 4 according to the third embodiment are disposed in a straight line, they can also be disposed in a matrix form. Moreover, sensing film that is formed on the surface of the electrodes of the quartz crystal resonator X can be the same for all or sensing films that adsorb different object particles can be formed.
- the connecting terminals are formed by commonly connecting the electrodes of the quartz crystal resonators collectively on the side of the QCM sensor.
- the present invention is not limited to commonly connecting the electrodes collectively on the side of the sensor and the electrodes may be connected commonly and collectively on the side of the resonance-frequency measuring circuit.
- a fourth embodiment of the present invention is described below.
- one of a plurality of quartz crystal resonators (two quartz control resonators) X 1 and X 2 is used for a reference measurement.
- Resonance frequency of the quartz crystal resonator X described earlier changes not only due to a mass adsorbed (attached) on the electrodes of the quartz control resonator, but also due to temperature of the quartz crystal resonator, temperature of the solution, viscosity of the solution etc. Therefore, there are frequency fluctuations like noise and drift in the measurement result of the resonance frequency quite often. To get rid of these fluctuations, it is necessary to devise a way by maintaining constant the temperature of the solution that contains a sample solution and the temperature of the quartz crystal resonator X etc.
- quartz crystal resonator X that measures a substance to be measured (hereinafter, “target resonator”) and the resonator that is used as reference (hereinafter, “reference resonator”) are two different resonators, since the frequency fluctuation received by the two resonators is also different, in most of the cases it is not possible to overcome effect of the frequency fluctuation completely.
- oscillations are caused by using separate quartz oscillating circuits. Oscillating frequencies are measured by a frequency counter, and the measured frequencies are considered as resonance frequencies. In this method, it is difficult to overcome causes of fluctuation based on (due to) difference in characteristics of separate oscillating circuits.
- FIG. 25 is a QCM sensor device according to the fourth embodiment.
- a QCM sensor (quartz crystal resonator) 60 shown in FIG. 25 includes two (2 ch) oscillating domains formed on a single quartz substrate 40 . In this example, one of the oscillating domains is used as reference.
- XT denotes a target resonator (of a type that adsorbs a substance to be measured) for detecting a substance to be measured
- XR denotes a reference resonator.
- One sample holder (well) 26 a is provided for a pair of the target resonator XT and the reference resonator XR. Electrodes of the target resonator XT and the reference resonator XR are connected in parallel to lines XA and XB in a common line 27 and further connected to an admittance measuring unit 2 .
- the admittance measuring unit 2 measures admittance characteristics of the target resonator XT and the reference resonator XR and transmits admittance data 4 to the information processor.
- the target resonator XT and the reference resonator XR are regarded as resonance circuits which includes a plurality of resonance circuits each and equivalent circuit constants of the resonance circuits are calculated by using the method of least squares. From the equivalent circuit constants of the resonance circuits, equivalent circuit constants of the quartz crystal resonator like resonance frequency, Q factor etc. are calculated and displayed on the display unit 3 A.
- FIG. 26 is a side cross sectional view of the QCM sensor according to the fourth embodiment.
- a sensing film 61 that combines specifically with a substance to be measured is applied on a front electrode 29 a 1 of the target resonator XT.
- the reference resonator XR is without the sensing film 61 applied on it.
- the information processor 3 can extract only a change in the frequency based on a mass combined (attached (adsorbed)) with the sensing film 61 by calculating a difference of change in the resonance frequencies of the target resonator XT and the reference resonator XR.
- FIG. 27 is a time chart of a change in the resonance frequency when the resonance frequency is measured by using the quartz crystal resonator according to the fourth embodiment.
- a horizontal axis indicates time and a vertical axis indicates frequency.
- Frequency of about 38 MHz is used for the quartz crystal resonator X (the target resonator XT and the reference resonator XR).
- Resonance frequency of the reference resonator XR is foA 1 and that of the target resonator XT is fo 2 A.
- the information processor 3 performs correction by using the amount of change ⁇ f 2 in the resonance frequency f 2 of the target resonator XT and the amount of change ⁇ f 1 in the resonance frequency f 1 of the reference resonator XR.
- the information processor 3 calculates the difference in the amounts of change ⁇ f 2 ⁇ f 1 , a change in the resonance frequency due to a change in mass attached (adsorbed) to the target resonator XT can be calculated easily and precisely.
- the target resonator XT and the reference resonator XR are formed on the same quartz substrate.
- the target resonator XT and the reference resonator XR are connected commonly to the oscillating circuit in the admittance measuring unit by the common line 27 .
- the mass can be measured precisely by calculating the difference between the two resonance frequencies obtained.
- the quartz crystal resonators X (XT and XR) are driven by using a single oscillating circuit in the admittance measuring unit 2 and the two quartz crystal resonators XT and XR are driven via the common line 27 . Therefore, the fluctuations caused when the quartz crystal resonators are made to oscillate by a plurality of quartz oscillating circuits or the fluctuations caused due to switching of different wiring paths and different wiring circuits, can be prevented.
- FIG. 28 is a top view of the QCM sensor according to the fourth embodiment and FIG. 29 is a cross sectional view taken along line a–a′ shown in FIG. 28 .
- the pair of the quartz crystal resonators X i.e. the target quartz crystal resonator XT and the reference quartz crystal resonator X are mounted on a substrate 25 .
- a block 26 made of acrylic having thickness 10 mm is stuck on the substrate 25 .
- the block 26 includes a sample holder (well) 26 a such that the pair of the quartz crystal resonators X (XR and XT) are accommodated in the sample holder (well) 26 a .
- the pair of the quartz crystal resonators X detects a substance to be detected which is included in a sample (that includes a buffer solution) that is introduced in the sample holder 26 a .
- a metal line pattern is formed on a surface of the substrate 25 as common line 27 and is connected to connecting terminals TA and TB.
- FIG. 30 is a top view of the quartz crystal resonator according to the fourth embodiment.
- a quartz crystal resonator 60 includes a pair of a target resonator XT and a reference resonator XR which are formed on a single quartz substrate 40 .
- a front electrode 29 a 1 of the target resonator XT and a front electrode 29 a 2 of the reference resonator XR are formed on a front surface of the quartz substrate 40 .
- a rear electrode 29 b 1 of the target resonator XT and a rear electrode 29 b 2 of the reference resonator XT are formed on a rear surface of the quartz substrate 40 .
- the front electrodes 29 a 1 and 29 a 2 are connected to connecting pads PA 1 and PA 2 on the rear side by diagonal leading lines 29 c 1 and 29 c 2 respectively.
- the rear electrodes 29 b 1 and 29 b 2 are connected to connecting pads PB 1 and PB 2 on the rear side by diagonal leading lines 29 d 1 and 29 d 2 respectively.
- An area covered by a dotted line 41 in FIG. 30 is an area that is stuck to the substrate 25 shown in FIG. 17 and an area outside the dotted line 41 is an area that is stuck to the substrate 25 .
- FIG. 31 is a wiring diagram of the quartz crystal resonator shown in FIG. 30 .
- a common line 27 connects the connecting pads PA 1 and PA 2 of the front electrodes 29 a 1 and 29 a 2 commonly and leads to a connecting terminal TA and connects the connecting pads PB 1 and PB 2 of the rear electrodes 29 b 1 and 29 b 2 commonly and leads to a connecting terminal TB.
- FIG. 32 is another example of the structure of the quartz crystal resonator according to the fourth embodiment.
- a function of a common line performed by a common line 27 is formed on the quartz substrate 40 .
- a front electrode 29 a 1 of the target resonator XT and a front electrode 29 a 2 of the reference resonator XR are connected by a connecting section 29 a 3 which is formed by an electrode film same as that of the electrodes 29 a 1 and 29 a 2 .
- a rear electrode 29 b 1 of the target resonator XT and a rear electrode 29 b 2 of the reference resonator XR are connected by a connecting section 29 b 3 which is formed by an electrode film same as that of the electrodes 29 b 1 and 29 b 2 .
- the front electrodes 29 a 1 and 29 a 2 are connected to the connecting pad PA 1 on the rear surface by a leading line 29 c .
- the rear electrodes 29 b 1 and 29 b 2 are connected to the connecting pad PB 1 on the rear surface by a diagonal leading line 29 d .
- the connecting sections 29 a 3 and 29 b 3 are disposed in different positions sandwiching the quartz substrate 40 and the quartz substrate does not resonate. It is desirable to form the connecting sections 29 a 3 and 29 b 3 such that the two are separated as much as possible from each other.
- the connecting section 29 a 3 and 29 b 3 may be formed in the shape of circular arcs going away from each other.
- FIG. 33 is still another example of the structure of the quartz crystal resonator according to the fourth embodiment.
- the structure shown in FIG. 33 is almost similar to that of the quartz crystal resonator 60 described by referring to FIG. 30 .
- the target resonator XT and the reference resonator XR have different areas.
- the front electrode 29 a 1 and the rear electrode 29 b 1 of the target resonator XT are formed such that they have larger area than that of the front electrode 29 a 2 and the rear electrode 29 b 2 of the reference resonator XR.
- the resonance frequency of the quartz crystal resonator increases when the area of electrode decreases.
- the target electrode XT can be designed to have small area than that of the reference electrode XR.
- FIGS. 23 , 30 , 31 , 32 , and 33 the front electrode side and the rear electrode side are shown to be shifted for the sake of convenience. However, the front electrode side and the rear electrode side are formed in same positions on two sides of the quartz substrate 40 such that the quartz substrate 40 is sandwiched between the two.
- the present invention it is possible to obtain resonance frequencies of a plurality of resonators from admittance characteristics obtained by one sweep (sweeping once) in admittance measuring unit without increasing the number of wires connecting a piezoelectric transducer and the admittance measuring unit and without using a switching circuit to switch the piezoelectric transducer. Therefore, it is possible to realize a multi-channel QCM sensor device with the same system configuration and the same cost as that of a one-channel QCM sensor device. It is possible to obtain not only a change in the resonance frequency but also a change in the Q factor that affects a change in the viscosity of a sample solution simultaneously.
- the number of wires connecting with the external equipment can be reduced and the QCM sensor can be easily made to be a multi-channel sensor.
- the number of wires connecting the QCM sensor with the resonance-frequency measuring unit can be reduced, the multi-channeling can be achieved even with less number of wires, and a precise measurement can be done.
Abstract
Description
Δf=−K·f 2 ·Δm (1)
(where K is a constant depending on the area of an electrode, density, and an elastic constant of a material of the quartz crystal).
- 1. By using a method of nonlinear least-squares, equivalent circuit constants of the quartz crystal resonators X (X1 to X4) are calculated from the admittance characteristics, and
- 2. Resonance frequencies fo and Q factor of the quartz crystal resonators X (X1 to X4) are calculated from the equivalent circuit constants obtained in
stage 1.
1. A Method of Calculating the Equivalent Circuit Constants by the Method of Nonlinear Least-squares.
Resonance frequency f=1/(2π√{square root over ((Lx·Cx)))} (2)
Q factor=2π·f·Lx/Rx=1/(2π·f·Cx·Rx) (3)
- 1. Let a value of a real part of the frequency fo at which the real part G of the admittance is maximum, be Gmax, and imaginary part of the admittance, be B0.
- 2. Let a value of an imaginary part of the frequency f1 at which the imaginary part B of the admittance is maximum, be Bmax.
- 3. Let a value of an imaginary part of the frequency f2 at which the imaginary part B of the admittance is minimum, be Bmin.
resonance frequency f=fo or √{square root over ((f1·f2))} (4)
series resistance Rx=1/Gmax (5)
Q factor=f/(f2−f1) (6)
series inductance Lx=Q·Rx/(2π·f) (7)
series capacitance Cx=1/(2π·f·Q·Rx) (8)
- (2) Method for Calculation of the Initial Values of the Equivalent Circuit Constants in the Buffer Solution when the Quartz Crystal Resonator has a Plurality of Resonance Points (in this Case Four Resonance Points)
parallel capacitance Cp=B0/(2π·f) (10)
Cp=(Bmax+Bmin)/(4π·f) (11).
series inductance Lx1=Q1·Rx1/(2π·f1) (12)
series capacitance Cx1=1/(2π·f1·Q1·Rx1) (13)
Claims (27)
Applications Claiming Priority (4)
| Application Number | Priority Date | Filing Date | Title |
|---|---|---|---|
| JP2003089620 | 2003-03-28 | ||
| JP2003-89620 | 2003-03-28 | ||
| JP2004-61668 | 2004-03-05 | ||
| JP2004061668A JP4213061B2 (en) | 2003-03-28 | 2004-03-05 | QCM sensor and QCM sensor device |
Publications (2)
| Publication Number | Publication Date |
|---|---|
| US20040187580A1 US20040187580A1 (en) | 2004-09-30 |
| US7036375B2 true US7036375B2 (en) | 2006-05-02 |
Family
ID=32993052
Family Applications (1)
| Application Number | Title | Priority Date | Filing Date |
|---|---|---|---|
| US10/811,394 Expired - Lifetime US7036375B2 (en) | 2003-03-28 | 2004-03-29 | QCM sensor and QCM sensor device |
Country Status (2)
| Country | Link |
|---|---|
| US (1) | US7036375B2 (en) |
| JP (1) | JP4213061B2 (en) |
Cited By (22)
| Publication number | Priority date | Publication date | Assignee | Title |
|---|---|---|---|---|
| US20060196271A1 (en) * | 2002-10-28 | 2006-09-07 | Bela Jancsik | Acoustic array analytical system |
| US20080078233A1 (en) * | 2006-09-25 | 2008-04-03 | Larson John D | Apparatus and method for measuring an environmental condition |
| US20080129148A1 (en) * | 2004-12-15 | 2008-06-05 | Shunichi Wakamatsu | Component Measuring Device |
| US20080215245A1 (en) * | 2007-01-19 | 2008-09-04 | Baker Hughes Incorporated | System and method for determining producibility of a formation using flexural mechanical resonator measurements |
| US20090165560A1 (en) * | 2007-12-28 | 2009-07-02 | Tatung Company | Dual mode measurement system with quartz crystal microbalance |
| US20090183577A1 (en) * | 2005-12-14 | 2009-07-23 | The University Of Electro-Communications | Two dimensional load distribution center position detection sensor and two dimensional load distribution center position detection device |
| US20090217759A1 (en) * | 2006-03-27 | 2009-09-03 | Nissan Chemical Industries, Ltd. | Method of Determining Sublimate in Thermoset Film with Qcm Sensor |
| US20090288488A1 (en) * | 2008-05-20 | 2009-11-26 | Junichiro Yamakawa | Piezoelectric sensor and sensing instrument |
| US7750634B1 (en) * | 2006-05-22 | 2010-07-06 | Christensen Charles L | Methods and apparatus for detecting elements and compounds |
| US20100313636A1 (en) * | 2009-06-16 | 2010-12-16 | Nihon Dempa Kogyo Co., Ltd. | Sensing device and sensing method |
| US20100319736A1 (en) * | 2009-06-19 | 2010-12-23 | Nihon Dempa Kogyo Co., Ltd. | Sensing device |
| WO2010149811A1 (en) | 2009-06-23 | 2010-12-29 | Universidad Politécnica De Valencia | Method and device for nanogravimetry in fluid media using piezoelectric resonators |
| US20120081187A1 (en) * | 2010-09-30 | 2012-04-05 | Nihon Dempa Kogyo Co., Ltd. | Oscillator |
| WO2012129098A2 (en) * | 2011-03-18 | 2012-09-27 | Baker Hughes Incorporated | Method for analyzing fluid properties |
| US20130068025A1 (en) * | 2011-09-21 | 2013-03-21 | David Lawrence Medin | Detecting mass on a mems biooscillating resonator array |
| US8409875B2 (en) | 2010-10-20 | 2013-04-02 | Rapid Diagnostek, Inc. | Measurement of binding kinetics with a resonating sensor |
| US20130245158A1 (en) * | 2012-03-19 | 2013-09-19 | Kemira Oyj | Methods of measuring a characteristic of a creping adhesive film and methods of modifying the creping adhesive film |
| US8601859B2 (en) | 2009-06-22 | 2013-12-10 | Nihon Dempa Kogyo Co., Ltd. | Sensing device |
| US8718956B2 (en) | 2010-09-29 | 2014-05-06 | Phillip 66 Company | High-pressure quartz crystal microbalance |
| US20160061777A1 (en) * | 2013-05-24 | 2016-03-03 | Fujitsu Limited | Environment measuring device and environment measuring method |
| US20170370884A1 (en) * | 2016-06-28 | 2017-12-28 | Samsung Display Co., Ltd. | Quartz crystal microbalance sensor for deposition monitoring |
| WO2020053214A1 (en) | 2018-09-10 | 2020-03-19 | Otto-Von-Guericke-Universität Magdeburg Patentwesen | Fluidic qcm-pnc sensor |
Families Citing this family (29)
| Publication number | Priority date | Publication date | Assignee | Title |
|---|---|---|---|---|
| US7677087B2 (en) * | 2004-12-15 | 2010-03-16 | Nihon Dempa Kogyo Co., Ltd. | Quartz sensor and sensing device |
| WO2006064951A1 (en) | 2004-12-15 | 2006-06-22 | Nihon Dempa Kogyo Co., Ltd | Quartz sensor and sensing device |
| JP4134025B2 (en) | 2004-12-28 | 2008-08-13 | 日本電波工業株式会社 | Sensing device |
| CN100458425C (en) * | 2005-05-12 | 2009-02-04 | 复旦大学 | Frequency mixing type gas sensing unit with dual oscillation of crystal in very high frequency |
| WO2007015575A1 (en) | 2005-08-03 | 2007-02-08 | Nihon Dempa Kogyo Co., Ltd. | Concentration sensor and concentration detection device |
| JP4646813B2 (en) * | 2005-08-30 | 2011-03-09 | セイコーインスツル株式会社 | Biosensor measurement system, viscosity measurement method, and trace mass measurement method |
| JP5124761B2 (en) * | 2005-09-07 | 2013-01-23 | 国立大学法人東京工業大学 | Parameter measurement method for acoustic wave device |
| WO2008069247A1 (en) * | 2006-12-05 | 2008-06-12 | National University Corporation Gunma University | Mass measuring device and cantilever |
| WO2008068011A1 (en) * | 2006-12-07 | 2008-06-12 | Albert-Ludwigs-Universität Freiburg | Piezoelectric sensor arrangement comprising a thin layer shear wave resonator based on epitactically grown piezoelectric layers |
| KR100975010B1 (en) * | 2008-02-29 | 2010-08-09 | 성균관대학교산학협력단 | Physical sensor using piezoelectric microcantilever and manufacturing method thereof |
| JP4566252B2 (en) | 2008-05-21 | 2010-10-20 | 日本電波工業株式会社 | Sensing device |
| JP2009281822A (en) * | 2008-05-21 | 2009-12-03 | Nippon Dempa Kogyo Co Ltd | Alcohol detection device, and vehicle equipped with alcohol detection device |
| AT504958B1 (en) * | 2008-05-29 | 2009-08-15 | Avl List Gmbh | PIEZOELECTRIC SENSOR DEVICE |
| WO2010044394A1 (en) * | 2008-10-15 | 2010-04-22 | 株式会社シームス | Alcohol concentration detecting element, alcohol concentration detector, and alcohol concentration detection method |
| CN101769840B (en) * | 2008-12-29 | 2012-09-12 | 北京卫星环境工程研究所 | Split type temperature-control quartz crystal microbalance device |
| US8349611B2 (en) * | 2009-02-17 | 2013-01-08 | Leversense Llc | Resonant sensors and methods of use thereof for the determination of analytes |
| JP5292359B2 (en) * | 2009-06-22 | 2013-09-18 | 日本電波工業株式会社 | Sensing device |
| JP5826557B2 (en) * | 2011-08-19 | 2015-12-02 | 日本電波工業株式会社 | Sensing device and sensing method |
| US10704150B2 (en) * | 2013-10-03 | 2020-07-07 | Inficon, Inc. | Monitoring thin film deposition |
| CN103954521B (en) * | 2014-04-28 | 2016-04-20 | 国家电网公司 | Detect the method for active sulfur content in insulating oil |
| KR102309893B1 (en) | 2015-01-22 | 2021-10-07 | 삼성디스플레이 주식회사 | Deposition rate measuring apparatus |
| CN104713624B (en) * | 2015-03-02 | 2017-01-25 | 杭州四方称重系统有限公司 | Quartz weighing sensing device special for vehicle dynamic weighing and machining method |
| CN106253875B (en) * | 2016-10-09 | 2019-12-27 | 湖南农业大学 | High-flux piezoelectric resonance chip and measuring system |
| CN107063425A (en) * | 2017-05-17 | 2017-08-18 | 江西众加利高科技股份有限公司 | A kind of device for detecting failure respectively to axle group formula weighing sensor |
| CN107421618A (en) * | 2017-05-17 | 2017-12-01 | 江西众加利高科技股份有限公司 | A kind of device for detecting failure respectively to complete-vehicle-type weighing sensor |
| CN107741376A (en) * | 2017-12-08 | 2018-02-27 | 南昌大学 | A kind of piezo-electric resonance type PM2.5 monitoring systems |
| WO2021005834A1 (en) * | 2019-07-10 | 2021-01-14 | 株式会社村田製作所 | Analysis device |
| JP7036864B2 (en) * | 2020-05-26 | 2022-03-15 | 株式会社アルバック | Measurement abnormality detection device and measurement abnormality detection method |
| US20230236167A1 (en) * | 2020-06-17 | 2023-07-27 | Revorn Co., Ltd. | System, information processing device, and program |
Citations (6)
| Publication number | Priority date | Publication date | Assignee | Title |
|---|---|---|---|---|
| US4818959A (en) * | 1986-03-28 | 1989-04-04 | Tdk Corporation | Phase equalizer |
| US6111512A (en) * | 1997-03-13 | 2000-08-29 | Nippon Telegraph And Telephone Corporation | Fire detection method and fire detection apparatus |
| JP2000338022A (en) | 1999-05-25 | 2000-12-08 | Hokuto Denko Kk | Multi-channel qcm sensor device and multi-channel qcm measuring system |
| US6544478B1 (en) * | 1998-11-02 | 2003-04-08 | Kabushiki Kaisha Meidensha | QCM sensor |
| US6819203B2 (en) * | 2001-02-07 | 2004-11-16 | Murata Manufacturing Co., Ltd. | Surface acoustic wave filter device |
| US20050016276A1 (en) * | 2003-06-06 | 2005-01-27 | Palo Alto Sensor Technology Innovation | Frequency encoding of resonant mass sensors |
-
2004
- 2004-03-05 JP JP2004061668A patent/JP4213061B2/en not_active Expired - Fee Related
- 2004-03-29 US US10/811,394 patent/US7036375B2/en not_active Expired - Lifetime
Patent Citations (6)
| Publication number | Priority date | Publication date | Assignee | Title |
|---|---|---|---|---|
| US4818959A (en) * | 1986-03-28 | 1989-04-04 | Tdk Corporation | Phase equalizer |
| US6111512A (en) * | 1997-03-13 | 2000-08-29 | Nippon Telegraph And Telephone Corporation | Fire detection method and fire detection apparatus |
| US6544478B1 (en) * | 1998-11-02 | 2003-04-08 | Kabushiki Kaisha Meidensha | QCM sensor |
| JP2000338022A (en) | 1999-05-25 | 2000-12-08 | Hokuto Denko Kk | Multi-channel qcm sensor device and multi-channel qcm measuring system |
| US6819203B2 (en) * | 2001-02-07 | 2004-11-16 | Murata Manufacturing Co., Ltd. | Surface acoustic wave filter device |
| US20050016276A1 (en) * | 2003-06-06 | 2005-01-27 | Palo Alto Sensor Technology Innovation | Frequency encoding of resonant mass sensors |
Non-Patent Citations (2)
| Title |
|---|
| Acoustic Wave Sensors by Academic Press, 1997 (ISBM 0-12-077460-7) pp. 918-929. |
| Bunseki Kagaku The Japan Society for Analytical Chemistry 1997, No. 12, vol. 46, p. 917-930. |
Cited By (39)
| Publication number | Priority date | Publication date | Assignee | Title |
|---|---|---|---|---|
| US20060196271A1 (en) * | 2002-10-28 | 2006-09-07 | Bela Jancsik | Acoustic array analytical system |
| US20080129148A1 (en) * | 2004-12-15 | 2008-06-05 | Shunichi Wakamatsu | Component Measuring Device |
| US7554247B2 (en) * | 2004-12-15 | 2009-06-30 | Nihon Dempa Kogyo Co., Ltd | Component measuring device |
| US20090183577A1 (en) * | 2005-12-14 | 2009-07-23 | The University Of Electro-Communications | Two dimensional load distribution center position detection sensor and two dimensional load distribution center position detection device |
| US7784362B2 (en) * | 2005-12-14 | 2010-08-31 | The University Of Electro-Communications | Two dimensional load distribution center position detection sensor and two dimensional load distribution center position detection device |
| US20090217759A1 (en) * | 2006-03-27 | 2009-09-03 | Nissan Chemical Industries, Ltd. | Method of Determining Sublimate in Thermoset Film with Qcm Sensor |
| US7861590B2 (en) * | 2006-03-27 | 2011-01-04 | Nissan Chemical Industries, Ltd. | Method of determining sublimate in thermoset film with QCM sensor |
| US7750634B1 (en) * | 2006-05-22 | 2010-07-06 | Christensen Charles L | Methods and apparatus for detecting elements and compounds |
| US20080078233A1 (en) * | 2006-09-25 | 2008-04-03 | Larson John D | Apparatus and method for measuring an environmental condition |
| US7795997B2 (en) * | 2006-09-25 | 2010-09-14 | Avago Technologies Wireless Ip (Singapore) Pte. Ltd. | Apparatus and method for measuring an environmental condition |
| NO20092660L (en) * | 2007-01-19 | 2009-08-13 | Baker Hughes A Ge Co Llc | System and method for determining a formation using measurements with mechanical bending resonator |
| US20080215245A1 (en) * | 2007-01-19 | 2008-09-04 | Baker Hughes Incorporated | System and method for determining producibility of a formation using flexural mechanical resonator measurements |
| US7844401B2 (en) * | 2007-01-19 | 2010-11-30 | Baker Hushes Incorpated | System and method for determining producibility of a formation using flexural mechanical resonator measurements |
| NO343969B1 (en) * | 2007-01-19 | 2019-08-05 | Baker Hughes A Ge Co Llc | System and method for determining a formation using measurements with mechanical bending resonator |
| US20090165560A1 (en) * | 2007-12-28 | 2009-07-02 | Tatung Company | Dual mode measurement system with quartz crystal microbalance |
| US7814795B2 (en) | 2007-12-28 | 2010-10-19 | Tatung Company | Dual mode measurement system with quartz crystal microbalance |
| US20090288488A1 (en) * | 2008-05-20 | 2009-11-26 | Junichiro Yamakawa | Piezoelectric sensor and sensing instrument |
| US8176773B2 (en) * | 2008-05-20 | 2012-05-15 | Nihon Dempa Kogyo Co., Ltd. | Piezoelectric sensor and sensing instrument |
| US8601860B2 (en) * | 2009-06-16 | 2013-12-10 | Nihon Dempa Kogyo Co., Ltd. | Sensing device and sensing method |
| US20100313636A1 (en) * | 2009-06-16 | 2010-12-16 | Nihon Dempa Kogyo Co., Ltd. | Sensing device and sensing method |
| US20100319736A1 (en) * | 2009-06-19 | 2010-12-23 | Nihon Dempa Kogyo Co., Ltd. | Sensing device |
| US8646317B2 (en) * | 2009-06-19 | 2014-02-11 | Nihon Dempa Kogyo Co., Ltd. | Sensing device |
| US8601859B2 (en) | 2009-06-22 | 2013-12-10 | Nihon Dempa Kogyo Co., Ltd. | Sensing device |
| WO2010149811A1 (en) | 2009-06-23 | 2010-12-29 | Universidad Politécnica De Valencia | Method and device for nanogravimetry in fluid media using piezoelectric resonators |
| US8718956B2 (en) | 2010-09-29 | 2014-05-06 | Phillip 66 Company | High-pressure quartz crystal microbalance |
| US20120081187A1 (en) * | 2010-09-30 | 2012-04-05 | Nihon Dempa Kogyo Co., Ltd. | Oscillator |
| US8409875B2 (en) | 2010-10-20 | 2013-04-02 | Rapid Diagnostek, Inc. | Measurement of binding kinetics with a resonating sensor |
| WO2012129098A3 (en) * | 2011-03-18 | 2012-12-27 | Baker Hughes Incorporated | Method for analyzing fluid properties |
| GB2505768A (en) * | 2011-03-18 | 2014-03-12 | Baker Hughes Inc | Method for analyzing fluid properties |
| WO2012129098A2 (en) * | 2011-03-18 | 2012-09-27 | Baker Hughes Incorporated | Method for analyzing fluid properties |
| US20130068025A1 (en) * | 2011-09-21 | 2013-03-21 | David Lawrence Medin | Detecting mass on a mems biooscillating resonator array |
| US9354202B2 (en) * | 2011-09-21 | 2016-05-31 | David Lawrence Medin | Detecting mass on a MEMS biooscillating resonator array |
| US20130245158A1 (en) * | 2012-03-19 | 2013-09-19 | Kemira Oyj | Methods of measuring a characteristic of a creping adhesive film and methods of modifying the creping adhesive film |
| US9182271B2 (en) | 2012-03-19 | 2015-11-10 | Kemira Oyj | Methods of measuring a characteristic of a creping adhesive film and methods of modifying the creping adhesive film |
| US20160061777A1 (en) * | 2013-05-24 | 2016-03-03 | Fujitsu Limited | Environment measuring device and environment measuring method |
| US10444192B2 (en) * | 2013-05-24 | 2019-10-15 | Fujitsu Limited | Environment measuring device and environment measuring method |
| US20170370884A1 (en) * | 2016-06-28 | 2017-12-28 | Samsung Display Co., Ltd. | Quartz crystal microbalance sensor for deposition monitoring |
| US10663431B2 (en) * | 2016-06-28 | 2020-05-26 | Samsung Display Co., Ltd. | Quartz crystal microbalance sensor for deposition monitoring |
| WO2020053214A1 (en) | 2018-09-10 | 2020-03-19 | Otto-Von-Guericke-Universität Magdeburg Patentwesen | Fluidic qcm-pnc sensor |
Also Published As
| Publication number | Publication date |
|---|---|
| JP2004317493A (en) | 2004-11-11 |
| JP4213061B2 (en) | 2009-01-21 |
| US20040187580A1 (en) | 2004-09-30 |
Similar Documents
| Publication | Publication Date | Title |
|---|---|---|
| US7036375B2 (en) | QCM sensor and QCM sensor device | |
| EP2630479B1 (en) | Apparatus and method for measuring binding kinetics and concentration with a resonating sensor | |
| US6544478B1 (en) | QCM sensor | |
| US6626026B2 (en) | Acoustic wave based sensor | |
| JP2008502911A (en) | Analytical instrument with an array of sensors and calibration elements | |
| US8869617B2 (en) | Method and device for nanogravimetry in fluid media using piezoelectric resonators | |
| EP2529207B1 (en) | Bi-stable oscillator | |
| KR20040067661A (en) | Field emission device and manufacturing method thereof | |
| US20150177196A1 (en) | Differential Humidity Sensor | |
| TWI443338B (en) | And a sensing means for sensing the sensing object in the liquid | |
| CN104350373A (en) | Piezoelectric unit, piezoelectric device, piezoelectric determination device, and state determination method | |
| Lakshmanan et al. | Impedance change as an alternate measure of resonant frequency shift of piezoelectric-excited millimeter-sized cantilever (PEMC) sensors | |
| KR102011569B1 (en) | Device for measuring viscosity of minute volume liquids and method thereof | |
| JP2004294356A (en) | Qcm sensor unit | |
| JP4437022B2 (en) | Measuring method and biosensor device using a vibrator used for tracking chemical reactions and analyzing conditions in the fields of biochemistry, medicine and food | |
| JP4936921B2 (en) | Quartz crystal sensor device | |
| JP2004251873A (en) | Analytical method using oscillator | |
| Zhao et al. | A new impedance based sensitivity model of piezoelectric resonant cantilever sensor | |
| JP2006010431A (en) | Mass detector | |
| KR100336084B1 (en) | QCM Sensor | |
| Schaefer et al. | Single board impedance analyzer and transient analysis of QCR sensor response | |
| Baù et al. | Electromagnetic contactless interrogation technique for quartz resonator sensors | |
| CN202631471U (en) | Film bulk acoustic wave resonance biochemical sensor with direct-current electrodes | |
| Nordin | Label‐Free Biochips |
Legal Events
| Date | Code | Title | Description |
|---|---|---|---|
| AS | Assignment |
Owner name: CITIZEN WATCH CO., LTD., JAPAN Free format text: ASSIGNMENT OF ASSIGNORS INTEREST;ASSIGNOR:NOZAKI, TAKAAKI;REEL/FRAME:015160/0397 Effective date: 20040315 |
|
| FEPP | Fee payment procedure |
Free format text: PAYOR NUMBER ASSIGNED (ORIGINAL EVENT CODE: ASPN); ENTITY STATUS OF PATENT OWNER: LARGE ENTITY |
|
| STCF | Information on status: patent grant |
Free format text: PATENTED CASE |
|
| AS | Assignment |
Owner name: CITIZEN HOLDINGS CO., LTD., JAPAN Free format text: CHANGE OF NAME;ASSIGNOR:CITIZEN WATCH CO., LTD.;REEL/FRAME:019817/0701 Effective date: 20070402 |
|
| FPAY | Fee payment |
Year of fee payment: 4 |
|
| FPAY | Fee payment |
Year of fee payment: 8 |
|
| AS | Assignment |
Owner name: CITIZEN WATCH CO., LTD., JAPAN Free format text: CHANGE OF NAME;ASSIGNOR:CITIZEN HOLDINGS CO., LTD.;REEL/FRAME:041479/0804 Effective date: 20161005 |
|
| MAFP | Maintenance fee payment |
Free format text: PAYMENT OF MAINTENANCE FEE, 12TH YEAR, LARGE ENTITY (ORIGINAL EVENT CODE: M1553) Year of fee payment: 12 |