US7676333B2 - Method and apparatus for analyzing partial discharges in electrical devices - Google Patents
Method and apparatus for analyzing partial discharges in electrical devices Download PDFInfo
- Publication number
- US7676333B2 US7676333B2 US11/935,956 US93595607A US7676333B2 US 7676333 B2 US7676333 B2 US 7676333B2 US 93595607 A US93595607 A US 93595607A US 7676333 B2 US7676333 B2 US 7676333B2
- Authority
- US
- United States
- Prior art keywords
- electrical device
- max
- partial discharge
- data
- percentile
- Prior art date
- Legal status (The legal status is an assumption and is not a legal conclusion. Google has not performed a legal analysis and makes no representation as to the accuracy of the status listed.)
- Active, expires
Links
- 238000000034 method Methods 0.000 title claims abstract description 185
- 230000006870 function Effects 0.000 claims description 181
- 238000004891 communication Methods 0.000 claims description 62
- 229910052739 hydrogen Inorganic materials 0.000 claims description 41
- 239000001257 hydrogen Substances 0.000 claims description 41
- UFHFLCQGNIYNRP-UHFFFAOYSA-N Hydrogen Chemical compound [H][H] UFHFLCQGNIYNRP-UHFFFAOYSA-N 0.000 claims description 39
- 238000012546 transfer Methods 0.000 claims description 31
- 238000004422 calculation algorithm Methods 0.000 claims description 17
- 238000005259 measurement Methods 0.000 claims description 15
- 230000008569 process Effects 0.000 claims description 14
- 238000009530 blood pressure measurement Methods 0.000 claims description 8
- 238000012544 monitoring process Methods 0.000 claims description 8
- 230000001681 protective effect Effects 0.000 claims description 8
- 238000009529 body temperature measurement Methods 0.000 claims 2
- 125000004435 hydrogen atom Chemical group [H]* 0.000 claims 2
- 230000000694 effects Effects 0.000 description 43
- 238000004458 analytical method Methods 0.000 description 35
- 230000008859 change Effects 0.000 description 34
- 238000011156 evaluation Methods 0.000 description 18
- 238000009826 distribution Methods 0.000 description 13
- 238000004804 winding Methods 0.000 description 11
- 230000000977 initiatory effect Effects 0.000 description 9
- 238000009413 insulation Methods 0.000 description 9
- 230000003068 static effect Effects 0.000 description 9
- 238000007405 data analysis Methods 0.000 description 8
- 230000008878 coupling Effects 0.000 description 6
- 238000010168 coupling process Methods 0.000 description 6
- 238000005859 coupling reaction Methods 0.000 description 6
- 238000013480 data collection Methods 0.000 description 5
- 238000011157 data evaluation Methods 0.000 description 5
- 230000007547 defect Effects 0.000 description 5
- 230000007613 environmental effect Effects 0.000 description 5
- 238000007619 statistical method Methods 0.000 description 5
- CBENFWSGALASAD-UHFFFAOYSA-N Ozone Chemical compound [O-][O+]=O CBENFWSGALASAD-UHFFFAOYSA-N 0.000 description 3
- 238000004364 calculation method Methods 0.000 description 3
- 238000010276 construction Methods 0.000 description 3
- 230000032798 delamination Effects 0.000 description 3
- 238000013461 design Methods 0.000 description 3
- 230000014509 gene expression Effects 0.000 description 3
- 238000000819 phase cycle Methods 0.000 description 3
- 238000012545 processing Methods 0.000 description 3
- RYGMFSIKBFXOCR-UHFFFAOYSA-N Copper Chemical compound [Cu] RYGMFSIKBFXOCR-UHFFFAOYSA-N 0.000 description 2
- 101000919382 Rattus norvegicus Cytochrome P450 2C6 Proteins 0.000 description 2
- 229910052802 copper Inorganic materials 0.000 description 2
- 239000010949 copper Substances 0.000 description 2
- 230000007812 deficiency Effects 0.000 description 2
- 238000010586 diagram Methods 0.000 description 2
- 230000005672 electromagnetic field Effects 0.000 description 2
- 239000011810 insulating material Substances 0.000 description 2
- 239000000463 material Substances 0.000 description 2
- 230000035882 stress Effects 0.000 description 2
- 239000004215 Carbon black (E152) Substances 0.000 description 1
- 239000004593 Epoxy Substances 0.000 description 1
- 201000010273 Porphyria Cutanea Tarda Diseases 0.000 description 1
- 230000009471 action Effects 0.000 description 1
- 230000032683 aging Effects 0.000 description 1
- 230000005540 biological transmission Effects 0.000 description 1
- 230000015556 catabolic process Effects 0.000 description 1
- 230000000052 comparative effect Effects 0.000 description 1
- 230000003750 conditioning effect Effects 0.000 description 1
- 238000013500 data storage Methods 0.000 description 1
- 230000007423 decrease Effects 0.000 description 1
- 238000006731 degradation reaction Methods 0.000 description 1
- 238000001514 detection method Methods 0.000 description 1
- 238000010292 electrical insulation Methods 0.000 description 1
- 230000004907 flux Effects 0.000 description 1
- 229930195733 hydrocarbon Natural products 0.000 description 1
- 150000002430 hydrocarbons Chemical class 0.000 description 1
- 239000012212 insulator Substances 0.000 description 1
- 230000007246 mechanism Effects 0.000 description 1
- 239000010445 mica Substances 0.000 description 1
- 229910052618 mica group Inorganic materials 0.000 description 1
- 238000012986 modification Methods 0.000 description 1
- 230000004048 modification Effects 0.000 description 1
- 230000007935 neutral effect Effects 0.000 description 1
- 239000003921 oil Substances 0.000 description 1
- 230000002093 peripheral effect Effects 0.000 description 1
- 230000010363 phase shift Effects 0.000 description 1
- NUSQOFAKCBLANB-UHFFFAOYSA-N phthalocyanine tetrasulfonic acid Chemical compound C12=CC(S(=O)(=O)O)=CC=C2C(N=C2NC(C3=CC=C(C=C32)S(O)(=O)=O)=N2)=NC1=NC([C]1C=CC(=CC1=1)S(O)(=O)=O)=NC=1N=C1[C]3C=CC(S(O)(=O)=O)=CC3=C2N1 NUSQOFAKCBLANB-UHFFFAOYSA-N 0.000 description 1
- 238000012502 risk assessment Methods 0.000 description 1
- 239000000523 sample Substances 0.000 description 1
- 238000005070 sampling Methods 0.000 description 1
- 230000001932 seasonal effect Effects 0.000 description 1
- HBMJWWWQQXIZIP-UHFFFAOYSA-N silicon carbide Chemical compound [Si+]#[C-] HBMJWWWQQXIZIP-UHFFFAOYSA-N 0.000 description 1
- 229910010271 silicon carbide Inorganic materials 0.000 description 1
- 230000003595 spectral effect Effects 0.000 description 1
- 238000011426 transformation method Methods 0.000 description 1
- 238000013519 translation Methods 0.000 description 1
- 238000010200 validation analysis Methods 0.000 description 1
Images


Classifications
-
- G—PHYSICS
- G01—MEASURING; TESTING
- G01R—MEASURING ELECTRIC VARIABLES; MEASURING MAGNETIC VARIABLES
- G01R31/00—Arrangements for testing electric properties; Arrangements for locating electric faults; Arrangements for electrical testing characterised by what is being tested not provided for elsewhere
- G01R31/12—Testing dielectric strength or breakdown voltage ; Testing or monitoring effectiveness or level of insulation, e.g. of a cable or of an apparatus, for example using partial discharge measurements; Electrostatic testing
- G01R31/1227—Testing dielectric strength or breakdown voltage ; Testing or monitoring effectiveness or level of insulation, e.g. of a cable or of an apparatus, for example using partial discharge measurements; Electrostatic testing of components, parts or materials
-
- G—PHYSICS
- G01—MEASURING; TESTING
- G01R—MEASURING ELECTRIC VARIABLES; MEASURING MAGNETIC VARIABLES
- G01R31/00—Arrangements for testing electric properties; Arrangements for locating electric faults; Arrangements for electrical testing characterised by what is being tested not provided for elsewhere
- G01R31/34—Testing dynamo-electric machines
- G01R31/343—Testing dynamo-electric machines in operation
Definitions
- This invention relates generally to electrical device condition assessment analyzers and more particularly, to methods and analysis systems for assessing partial discharge (PD) in electrical machinery.
- Partial discharge events in an insulation system are pulsed releases of energy that propagate out from their site of origin. The propagation occurs according to the structure surrounding the partial discharge events.
- An internally generated partial discharge pulse appears and propagates at the end regions of an electrical device, such as a high or low voltage bushing and generator end windings, as specific pulse waves in accordance with the surrounding structure, the location of the origin of the pulse, and the pulse characteristics.
- partial discharge analysis has been used for many years on various electrical equipment, at least some data collections and data interpretations are performed substantially manually using labor-intensive techniques.
- most known methods of partial discharge data interpretation typically include using extensive analysis to interpret the data collected in conjunction with, and in reference to, data collected as a function of differing operating and environmental conditions associated with the electrical machine and/or the insulation system. Such extensive analysis typically requires obtaining subject matter experts in the form of highly specialized industry professionals which can be time-consuming and expensive. Moreover, such analyses are neither automated nor substantially close to a present time.
- a method of analyzing partial discharge data collected from an electrical device includes collecting partial discharge data from a first electrical device belonging to a group of electrical devices.
- the group of electrical devices is at least partially defined by at least one electrical device classification.
- the method also includes generating a comparison of at least a portion of the partial discharge data collected from the first electrical device with at least a portion of the partial discharge data collected from at least one second electrical device.
- the at least one second electrical device is selected from the group of electrical devices that includes the first electrical device.
- the method further includes transmitting the results.
- a partial discharge analyzer system in another aspect, includes at least one output device.
- the partial discharge analyzer system also includes a processor coupled in electronic data communication with the at least one output device.
- the processor is programmed with a plurality of percentile transfer function algorithms configured to generate a comparison of at least a portion of partial discharge data collected from a first electrical device with at least a portion of partial discharge data collected from at least one second electrical device.
- the processor is further programmed to generate and transmit the comparison to the at least one output device.
- the comparison is at least partially generated as a function of at least one of at least one electrical device classification and at least one electrical device operational parameter.
- an electrical device monitoring system includes a data acquisition system adapted to transmit a first signal substantially representative of a measurement received from at least one process parameter sensor.
- the electrical device monitoring system also includes a partial discharge analyzer system configured to receive the first signal and a second signal substantially representative of high frequency electromagnetic pulses.
- the partial discharge analyzer system includes a processor programmed with a plurality of percentile transfer function algorithms configured to generate a comparison of at least a portion of partial discharge data collected from a first electrical device with at least a portion of partial discharge data collected from at least one second electrical device.
- the processor is further programmed to generate and transmit the comparison.
- the comparison is at least partially generated as a function of at least one of at least one electrical device classification and at least one electrical device operational parameter.
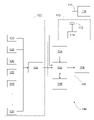
- FIG. 1 is a schematic block diagram of an exemplary on-line real-time partial discharge analyzer system
- FIG. 2 is a flow chart illustrating a portion of an exemplary method of operating the partial discharge analyzer system shown in FIG. 1 ;
- FIG. 3 is a graph of a partial discharge pulse amplitude vs. phase of occurrence for pulses that may be detected using the method shown in FIG. 2 ;
- FIG. 4 is a graph of an exemplary phase-resolved histogram that may be generated from the phase-resolved partial discharge pattern shown in FIG. 3 ;
- FIG. 5 is an exemplary classification map illustrating the results of the phase-resolved histogram shown in FIG. 4 transformed into the W-T domain;
- FIG. 6 is a flow chart illustrating a further portion of the method of operating the partial discharge analyzer system shown in FIG. 1 ;
- FIG. 7 is a graphical representation of NQN and Q max determinations made within the partial discharge analyzer system shown in FIG. 1 ;
- FIG. 8 is a flow chart illustrating an expanded portion of the method shown in FIG. 6 ;
- FIG. 9 is a flow chart illustrating a further portion of the method of operating the partial discharge analyzer system shown in FIG. 1 ;
- FIG. 10 is a continuation of the flow chart from FIG. 9 ;
- FIG. 11 is a continuation of the flow chart from FIG. 10 ;
- FIG. 12 is a flow chart illustrating trending and notification features that may be used with the partial discharge analyzer system shown in FIG. 1 ;
- FIG. 13 is a flow chart illustrating machine partial discharge source identification features that may be used with the partial discharge analyzer system shown in FIG. 1 ;
- FIG. 14 is a flow chart illustrating determination features for partial discharge levels as a function of operational real and reactive power data that may be used with the partial discharge analyzer system shown in FIG. 1 ;
- FIG. 15 is a continuation of the flow chart from FIG. 14 ;
- FIG. 16 is a flow chart illustrating determination features for partial discharge levels as a function of operational temperature data that may be used with the partial discharge analyzer system shown in FIG. 1 ;
- FIG. 17 is a flow chart illustrating determination features for partial discharge levels as a function of operational hydrogen pressure data that may be used with the partial discharge analyzer system shown in FIG. 1 ;
- FIG. 18 is a flow chart illustrating machine partial discharge protective relay and alarm features that may be used with the partial discharge analyzer system shown in FIG. 1 .
- FIG. 1 is a schematic block diagram of an exemplary on-line, real-time partial discharge (PD) analyzer system 100 .
- PD pulses are recorded using analyzer system 100 , which is configured to receive PD pulses with frequencies within a bandwidth that includes an upper limit of approximately 100 MHz.
- system 100 is configured to receive PD pulses within any frequency range.
- Analyzer system 100 includes a data analysis and diagnostics module 102 , a model/rules module 104 , and an output module 106 , wherein both modules 104 and 106 are coupled in electronic data communication with module 102 .
- modules 102 , 104 and 106 are configured within a first processor 107 .
- System 100 also includes a data history logger module 108 coupled in electronic data communication with module 102 .
- logger module 108 is a peripheral data logger directly associated with a process plant distributed control system (DCS) and does not form a portion of analyzer system 100 .
- DCS distributed control system
- data history logger module 108 is a dedicated module associated with analyzer system 100 .
- Data analysis and diagnostics module 102 is also coupled in electronic data communication with a partial discharge sensor 110 that includes a coupler 112 and a signal conditioning module 114 .
- Module 114 is coupled in electronic data communication with module 102 .
- coupler 112 is generally electrically coupled to an electric power supply lead or bus 116 that is in turn electrically coupled to a device of interest, such as an electrical machine 118 .
- other devices of interest include, but are not limited to, transformer bushings and electric power transmission cables and bus ducts.
- couplers that may be used include, but are not limited to, cable-type, epoxy mica couplers (EMC), antennas, and radio frequency current transformers (RFCT).
- EMC epoxy mica couplers
- RFCT radio frequency current transformers
- analyzer system 100 uses one sensor per phase.
- coupler 112 has a capacitive value of 1000 picoFarad (pF).
- coupler 112 has any capacitive value that facilitates operation of system 100 as described herein.
- Data analysis and diagnostics module 102 is also coupled in electronic data communication with a plurality of process parameter sensors 120 through a plant data acquisition system 122 that includes a second processor 124 .
- Process parameter sensors 120 are coupled to various process parameters and parameters associated with the environment surrounding machine 118 .
- Such process parameters include but are not limited to, bus voltage, bus current, machine real power, machine reactive power, temperature of windings, oil and/or hydrogen depending on the type of machine, machine vibration, a stator leak monitoring system (SLMS), flux probes, ozone, hydrocarbon concentration, protecting relaying device alarms, neutral current and voltage, field ground detector, hydrogen pressure, and combinations thereof.
- the environmental parameters include but are not limited to, ambient temperature, ambient humidity, atmospheric pressure, and combinations thereof.
- parameters derived or calculated from other parameters may also be transmitted to data analysis and diagnostics module 102 .
- ozone detected in a machine indicates the presence of external corona activity.
- An increase of PD with ozone levels indicates external PD.
- a finer interpretation of PD plots based on phase and pulse shape can help confirm surface or bulk PD.
- humidity can cause a seasonal variation in PD levels on air cooled generators. Knowing the relative humidity (RH) level facilitates interpreting trends over time and avoids false diagnostics.
- RH relative humidity
- winding temperature changes with load affect both bulk and surface PD. Knowing temperature/PD values and trends helps in identifying whether PD sources are located in the bulk of the insulation or at the surface of the winding bars.
- coupler 112 is configured to receive high frequency pulses transmitted through bus 116 .
- the high frequency pulses include noise pulses and PD pulses generated in machine 118 and other equipment coupled to bus 116 , for example, support insulators, a transformer or a motor (neither shown).
- PD sensor 110 When electrical machine 118 is in operation, high-frequency noise is generated by electrical machine 118 itself and surrounding devices, and pulses of the high-frequency noise are detected by PD sensor 110 .
- Partial discharges are pulse events with a sudden localized redistribution of charge in or on high voltage insulating materials at relatively high electric stress.
- the PD events are frequently an indicator of failure processes that are active within or on the insulation.
- a PD and the reversal of charge that occurs in connection with it show as a current pulse in the connectors of the insulating material. In practice, these current pulses also sum into the phase voltage of the system.
- Characteristics of PDs can be divided into two groups as follows: characteristics of a single PD pulse, such as shape and charge, and characteristics of a PD pulse group, such as pulse repetition frequency and pulse occurrence areas. Different PD types have different PD characteristics. Using these characteristics, it is possible to identify different PD types and the causes of the PD.
- the PD event itself is typically of a very short duration. That is, the redistribution of charge, and hence pulse currents, associated with PD events typically occur in the sub-microsecond time scale. Specifically, time duration values of 10 nanoseconds and less can occur.
- Data analysis and diagnostics module 102 receives the high frequency electromagnetic pulses, generated by the PD events, from partial discharge sensor 110 and receives a reference voltage signal indicative of the power signal on bus 116 .
- Data analysis and diagnostics module 102 analyzes the phase angle of the PD signals versus the reference voltage and the shape of the pulses from the PD events and noise.
- Data analysis and diagnostics module 102 separates the noise from the PD events and analyzes the pulses associated with the PD events to determine the pulse origination location and character by applying rules and model features stored in model/rules module 104 .
- Character of the PD events include an apparent severity of the PD events that may for example, be related to the charge dissipated during the event or to the local current flowing as a result of the PD event.
- the rules may include threshold ranges for characteristics associated with known pulses from various locations within similar machines in a fleet of machines, and may also include machine operating and environmental parameters that may affect the partial discharge pulse shape characteristics.
- the characteristics of known pulses from the fleet of similar machines are stored in, for example, data history logger module 108 .
- Analyzer system 100 acquires data and simultaneously time-stamps and stores the data in a memory such as data history logger module 108 .
- the time stamp is used to correlate data received at various times in the past and also to correlate data collected on a different analyzer system.
- Data files are transferred between different analyzer systems to facilitate establishing a large inventory of pulse characteristics that can then be used for comparison and validation.
- Rules are generated from the characteristics of known pulses and applied to the received pulses to determine the location and character of the partial discharge associated with the received pulses.
- modeled pulses may be determined and stored in data history logger module 108 for particular configurations of components in a machine that does not have a history of known pulses associated with partial discharge events. For example, a new model generator or transformer may not have sufficient operating history to develop a database of known partial discharge pulses. Rather, the configuration is modeled and characteristics of modeled pulses are used to determine partial discharge locations and character.
- Results of the analysis are transmitted to output module 106 , where it may be further processed and displayed to a user.
- Output module 106 displays results indicative of machine aging behavior including trends of machine 118 and comparisons to other machines (as discussed further below).
- Output module 106 also displays results indicative of service demand of machine 118 including recommended service to prolong the service life of machine 118 , risk assessment of continued operation with and without service, and action recommendations when analyzer system 100 determines that a failure is imminent or likely to occur before the next service interval.
- Such analysis results are determined automatically and are generated substantially close to a present time, or in real-time, as discussed further below.
- FIG. 2 is a flow chart illustrating a portion 201 of a method 200 of operating on-line real-time partial discharge (PD) analyzer system 100 (shown in FIG. 1 ).
- Method portion 201 includes a plurality of method steps for creating an electrical machine PD database (not shown).
- method portion 201 includes a method step 202 coupling at least one partial discharge analyzer system 100 to each of a plurality of electrical machines (not shown), wherein each of the plurality of electrical machines, hereon referred to as the other electrical machines, is an electrical machine exclusive of machine of interest 118 .
- such other machines include a fleet of machines, wherein each of such machines having at least some similar design, construction and operational classifications to other such machines, hereon referred to as machine classifications, are sorted into machine groups.
- each of such other machines is sorted into one of a plurality of groups that include, but are not limited to, water-cooled electric power generators, hydrogen-cooled electric power generators, and air-cooled electric power generators, and/or combinations thereof.
- groups may include, but not be limited to, air-cooled electric motors.
- step 202 includes permanently coupling one of system 100 to each of the other machines.
- method 202 includes temporarily coupling one of system 100 to each of the other machines.
- any method of collecting PD data that facilitates analysis as described herein is used.
- Method portion 201 also includes a method step 204 collecting PD data (including noise data) from each of the other electrical machines in the form of an original PD pattern with noise data as described further below.
- FIG. 3 is a graph 300 of partial discharge (PD) pulse amplitude vs. phase of occurrence for pulses that may be detected using method portion 201 (shown in FIG. 2 ).
- graph 300 represents at least a portion of PD data taken on one of the other machines during a predetermined period of time using method step 204 as stored within logger module 108 (shown in FIG. 1 ).
- PRPD pattern phase-resolved PD pattern
- PRPDA PRPD analysis
- Graph 300 includes an x-axis 302 graduated in units of degrees (referenced to a standard 360 degree electrical cycle) and a y-axis 304 graduated in units of charge, specifically, nano-columbs (nC), indicating a magnitude of received high frequency pulses.
- a trace 306 indicates a relative magnitude of supply/generated voltage to the other electrical machine.
- stresses build in the insulation (not shown) associated with the other electrical machine and partial discharge pulses 314 are generated based on conditions that include, but are not limited to, the material condition of the insulation, machine operating conditions, and environmental conditions proximate to the other machine.
- pulses 314 include PD pulses within the other machine, PD pulses from devices (not shown) electrically coupled to bus 116 that are external to the other machine, and noise pulses that originate from sources that include, but are not limited to, proximate electro-magnetic fields and commutation, radio frequency interference, and electrical power supply power quality deficiencies. Also, typically, determining PD pulses of interest from noise pulses and/or from partial discharges from sources external to the machine is difficult.
- method portion 201 further includes a method step 206 determining electrical machine classifications of interest.
- each of the plurality of other machines is sorted into a particular group based on machine classifications that include, but are not limited to, similar design, construction and operational classifications.
- Method step 206 includes determining which of these machine classifications will define the predetermined electrical machine operational classifications of interest.
- the primary machine classifications of interest are the electrical machines' voltage ratings.
- any machine classifications may be used as the classifications of interest including, but not limited to, real power rating (in Megawatts (MW)) and apparent power rating (in Kilovolt-amperes (KVA)).
- Method portion 201 also includes a method step 208 determining PD source identification classifications.
- Step 208 includes defining PD source classifications that may subsequently be used to facilitate determining a likely source of the PD activity in question as discussed further below.
- pulse characteristics that include, but are not limited to, magnitude, polarity, phase, and time of occurrence are used to facilitate determining PD source identification classifications.
- Potential sources of PD activity include, but are not limited to, corona discharges, surface discharges, internal discharges, invalid data, noise, and unknown causes.
- Method portion 201 further includes a method step 210 determining a database schema.
- the predetermined database schema for an electrical machine PD database includes, but is not limited to, predetermined PD pulse characteristics and electrical machine classifications of interest as described above and further below.
- Method portion 201 also includes a method step 212 generating the database schema wherein step 212 includes electronically forming the data storage and data relationship structure of the database within a database application.
- the database application and the database are electronically resident within logger module 108 .
- the database and database application are electronically resident in devices that include, but are not limited to, at least one dedicated database server, networked personal computers, and a distribution throughout a DCS.
- Method portion 201 further includes a method step 214 collecting electrical machine operational data via sensors 120 and processor 124 (both shown in FIG. 1 ).
- step 214 includes operational data collected substantially instantaneously with the PD data collected in step 204 as described above.
- Such operational data is transmitted to module 102 and includes, but is not limited to, machine voltage, machine MW, machine KVA, machine reactive power (in Megavolt-Amperes Reactive (MVAR)), machine temperatures and hydrogen pressure.
- MVAR Megavolt-Amperes Reactive
- Method portion 201 also includes a method step 216 forming a W-T classification map.
- Step 216 includes forming clusters of PD data (including noise data) by translating the PD data (including noise data) collected in step 204 .
- Step 216 includes one intermediate step (not shown), specifically, forming a phase-resolved, three-dimensional histogram as described further below.
- FIG. 4 is a graph 400 of an exemplary phase-resolved, three-dimensional histogram 402 that may be generated from phase-resolved, two-dimensional PD pattern 314 (shown in FIG. 3 ). Forming histogram 402 is included within step 216 (shown in FIG. 2 ). Step 216 is performed using modules 102 and 104 (both shown in FIG. 1 ).
- Graph 400 includes an abscissa (x-axis) 302 graduated in units of degrees (referenced to a standard 360 degree electrical cycle) and an ordinate (y-axis) 304 graduated in units of charge, specifically, nano-columbs (nC), indicating a magnitude of received high frequency pulses.
- Graph 400 also includes a z-axis 403 graduated in units of partial discharge counts. Therefore, histogram 402 illustrates the frequency of PD occurrence by sorting a plurality of pulses 404 with respect to pulse magnitude and phase in a 3-dimensional pattern. Histogram 403 is electronically stored within logger module 108 . Similar to the phase-resolved PD pattern shown in FIG. 3 , determining PD pulses of interest from noise pulses and/or from partial discharges from sources external to the machine is difficult.
- FIG. 5 is an exemplary classification map 500 illustrating the results of phase-resolved histogram 402 transformed into the W-T domain via mathematical transformation methods (described further below) that include, but are not limited to, fast Fourier transform (FFT) methods.
- Method step 216 includes forming classification map 500 using modules 102 and 104 (shown in FIG. 1 ). For each acquired signal represented in pattern 314 (shown in FIG. 4 ), the equivalent time-length (T) and bandwidth (W) are calculated and mapped in classification map 500 .
- T time-length
- W bandwidth
- Classification map 500 includes an abscissa (x-axis) 501 graduated in units of time, specifically, nanoseconds (ns), and an ordinate (y-axis) 502 graduated in units of frequency, specifically, megahertz (MHz).
- Each pixel 503 on classification map 500 corresponds to one of the plurality of pulses 404 (shown in FIG. 4 ).
- Pixels 503 represent both partial discharge pulses and noise pulses received by partial discharge sensor 110 and transmitted to data analysis and diagnostics module 102 (both shown in FIG. 1 ).
- pixels 503 tend to group into clusters of pixels due to pixels representing a particular condition having similar time and frequency features, wherein clusters 504 , 506 , 508 , and 510 tend to represent similar types of pulses.
- noise pulses tend to exhibit similar pulse characteristics as other noise pulses such that the associated noise pulse pixels tend to group in proximity to each other.
- Classification map 500 is electronically stored within logger module 108 .
- method portion 201 further includes a method step 218 sorting each of the plurality of clusters 504 , 506 , 508 , and 510 into pulse classifications.
- noise pulses tend to exhibit similar characteristics as other noise pulses such that the associated noise pulse pixels tend to group in proximity to each other.
- PD pulses having similar characteristics as other PD pulses tend to also group in proximity to each other, wherein PD pulses generated within the same defect tend to exhibit similar shapes. Therefore, clusters 504 , 506 , 508 , and 510 are classified by the characteristics of each type of pulse in received plurality of pulses 404 (shown in FIG. 4 ). Such classification is performed within module 102 using rules resident within module 104 , and such classification is stored within logger module 108 (all shown in FIG. 1 ).
- each of pulses 404 within each cluster of pulses 504 , 506 , 508 and 510 undergoes further analysis performed directly as a function of the associated cluster features (and, indirectly as a function of the associated pulse characteristics) such that pulse classification is facilitated.
- further analysis includes separating and extracting data associated with each of clusters 504 , 506 , 508 and 510 via at least one algorithm that determines cluster boundaries and features by examining, for example, but not being limited to, a centroid of the cluster shape, a standard deviation, a skewness, and a kurtosis of the pixels.
- kurtosis is a measure of the peakedness of the probability distribution of a real-valued random variable. Higher kurtosis means more of the variance is due to infrequent extreme deviations, as opposed to frequent modestly-sized deviations. Therefore, as a result of the analyses described above, classification of PD pulses 404 as a function of their clustering features is facilitated. Such further analysis is performed within module 102 using rules resident within module 104 , and the results of such further analysis are stored within logger module 108 .
- Method portion 201 further includes a method step 220 generating sub-patterns (including noise data) from the pulse classifications determined in step 218 .
- sub-patterns including noise data
- the pixels representing these signals are located near each other within the associated clusters in classification map 500 (shown in FIG. 5 ).
- Noise pulses also share similar characteristics and, therefore, are also similarly shaped to each other.
- each pulse 503 of each cluster 504 , 506 , 508 and 510 is translated to the time domain wherein a magnitude of each pulse (for example, in millivolts (mV)) may be examined individually as a function of time.
- a magnitude of each pulse for example, in millivolts (mV)
- Such time domain translation for each pulse 404 results in generation of a sub-pattern (not shown) for each pulse 404 .
- Sub-patterns of similar pulses will also have similar shapes and characteristics.
- Method step 220 is performed using modules 102 and 104 and the results are electronically stored within logger module 108 (all shown in FIG. 1 ).
- Processing sub-patterns of PD pulses that include substantially homogeneous features of PD-pulse shape may provide a first level defect classification of PD pulses.
- the pulses may be classified as internal, surface, or corona discharges.
- the pulses are then processed further using rules that determine the particular shape of each pulse and correlate the shapes to particular defect types, location, and/or character as discussed further below.
- Method portion 201 also includes a method step 222 determining pulse characteristics of collected PD data (including noise data) from the other electrical machines.
- each pulse 503 within plurality of received pulses 404 is analyzed to permit classification of each of pulses 404 directly with respect to similar clustering features (and, indirectly as a function of similar pulse characteristics).
- these clustering features include, but not limited to, a mean of amplitudes, a standard deviation of amplitudes, a skewedness of amplitudes, a kurtosis of amplitudes, a centroid of shape.
- Such clustering features are determined for pulses received during both the positive and negative portions of the supply voltage cycle.
- the associated sub-patterns are grouped such that the associated pulse characteristics of each sub-pattern are determined from such groupings.
- the associated pulse characteristics include, but are not limited to, phase angles and pulse magnitudes.
- overall features of pulses 404 are determined such as, but not limited to, rise time, pulse width, spectral density, a maximum positive PD magnitude, a maximum negative PD magnitude, an overall mean of positive PD magnitudes, an overall mean of negative PD magnitudes, and a correlation between positive and negative PDs.
- characteristics of pulses 404 such as, but not limited to an alpha value, a beta value, a maximum peak of pulses, a minimum peak of pulses, a mean peak of pulses, and a standard deviation of pulse peaks are determined.
- characteristics of pulses 404 as distributed within the W-T domain as illustrated in FIG. 5 are also determined. For example, but not being limited to, an overall mean, a mean in the T (or, time) dimension, mean in the W (or, frequency) dimension, a standard deviation in the T dimension, a standard deviation in the W dimension, a centroid of T distribution, and a centroid of W distribution may be determined.
- Method step 222 is performed using modules 102 and 104 and the results are electronically stored within logger module 108 (all shown in FIG. 1 ).
- Method portion 201 also includes a method step 224 populating the database formed per method step 212 as described above with the PD characteristics data determined in method step 222 as described above.
- PD data is sorted into the PD source identification classifications determined per method step 208 as described above and stored within logger module 108 (shown in FIG. 1 ). Such sorting effectively separates the noise data from the PD data.
- the database of other electrical machines' PD data is electronically stored for future use as discussed below.
- operation parameter data, including hydrogen pressure data, collected during collection of the PD data is also stored within the database for further use as described below.
- FIG. 6 is a flow chart illustrating a further portion 600 of method 200 (a portion of which is shown in FIG. 2 ) of operating on-line real-time PD analyzer system 100 (shown in FIG. 1 ).
- Method portion 600 includes a plurality of method steps for generating a PD comparison scheme.
- method portion 600 includes a method step 602 determining additional PD data evaluations.
- a variety of statistical analyses are available for evaluating the pulse data and a finite number of such analyses are selected for the exemplary pulse data.
- such analyses include, but are not limited to, determinations of values for maximum partial discharge charge (Q max ), normalized quantity number (NQN), counts-per-cycle (N w ), a Weibull distribution, and a kurtosis of phase distribution.
- analyses further include statistical analysis of amplitude and phase distributions, for example, but not limited to, a mean phase angle of a pulse pattern, a phase spread of a pulse pattern, and a variance of pulse amplitude distribution.
- Q max is the primary parameter used for further evaluation of pulse data.
- any parameter and any statistical analysis that facilitates operation of system 100 as described herein is used.
- Method portion 600 also includes a method step 604 performing additional PD data evaluations and generating additional PD evaluation data.
- Each group of PD pulse data previously recorded within the steps described above and stored within logger module 108 is further evaluated by performing calculations within module 102 using rules resident within module 104 .
- method step 604 determines Q max values as described further below in units of mV.
- FIG. 7 is a graphical representation, or graph 700 , of NQN and Q max determinations made within on-line real-time partial discharge analyzer system 100 (shown in FIG. 1 ) per method step 604 .
- Graph 700 includes an ordinate (y-axis) 702 graduated logarithmically in units of partial discharge pulses per second and an abscissa (x-axis) 704 graduated in units of pulse magnitude in millivolts (mV).
- a plurality of PD pulse data points 706 having a partial discharge rate and a corresponding pulse amplitude are plotted on graph 700 wherein a “best fit” line 708 is formed approximately through and/or adjacent to data 706 .
- Line 708 , x-axis 704 and y-axis 702 form a triangular area 710 that represents a normalized quantity number (NQN).
- a maximum partial discharge charge (Q max ) value 712 is defined as the pulse magnitude equivalent to 10 pulses per second (pps).
- Method portion 600 further includes a method step 606 populating database with additional PD evaluation data.
- the database electronically maintained within logger module 108 receives the Q max value data calculated in method step 604 for each data group for each machine in which partial discharge data was collected.
- Method portion 600 further includes a method step 608 further sorting the database of PD characteristics data and additional PD evaluation data as well as hydrogen pressure data with respect to electrical machine operational classifications.
- PD data has previously been sorted into predetermined PD source identification classifications as described above.
- the PD and hydrogen data are further sorted with respect to one electrical machine operational classification, that is, specifically, a plurality of ranges of the voltage ratings of the machines. More specifically, each of the machines sampled for partial discharge data as described above includes a voltage rating rounded to the nearest kilovolt (kV).
- the ranges of voltage ratings include 10-12 kV rms , 13-15 kV rms , 16-18 kV rms , and 19-30 kV rms , wherein the voltages are determined by root mean square (rms) calculations.
- any operational parameter of the machines partitioned into any range of parameters is used that facilitates operation of system 100 as described herein. Therefore, the PD and hydrogen data received and evaluated as well as the PD data calculated as described above is resident within the database sorted into the aforementioned electrical machine voltage ratings.
- Method portion 600 also includes a method step 610 generating a plurality of percentile transfer functions.
- at least one percentile transfer function is determined for each range of voltage ratings described above.
- each percentile transfer function is determined to calculate at least one Q max level as a function of the measured hydrogen pressure in the sampled machine while collecting the PD data.
- the hydrogen pressure measurements are collected via at least one of sensors 120 and processor 124 (both shown in FIG. 1 ) in conjunction with the PD data and stored within the database.
- seven percentile transfer functions are determined for each range of voltage ratings. Further, specifically, the seven percentile transfer functions that are determined include Q max Avg , Q max Max , Q max 25% , Q max 50% , Q max 75% , Q max 90% , and Q max 95% .
- Q max Avg is defined as the arithmetical average of the PD Q max data collected on all of the other machines within a particular range of voltage ratings.
- One purpose of calculating Q max Avg is to determine an average Q max value of all of the machines within a particular range of voltage ratings. Subsequently, a qualitative and quantitative comparison of PD data collected from machine of interest 118 (shown in FIG. 1 ) can be made with the PD data collected from all of the machines within the particular range of voltage ratings.
- a Q max value determined for machine of interest 118 is less than the Q max Avg value determined for machines in the particular range of voltage ratings in which machine 118 falls within, a qualitative assessment can be made that machine's 118 partial discharge activity is lower than average for that voltage rating.
- a Q max value determined for machine of interest 118 is greater than the Q max Avg value determined for machines in the particular range of voltage ratings in which machine 118 falls within, a qualitative assessment can be made that machine's 118 partial discharge activity is greater than average for that voltage rating.
- Q max Max is defined as the mathematical maximum value of the PD Q max data collected on all of the other machines within a particular range of voltage ratings.
- One purpose of calculating Q max Max is to determine a maximum Q max value of all of the machines within a particular range of voltage ratings.
- a qualitative and quantitative comparison of PD data collected from machine of interest 118 can be made with the PD data collected from all of the machines within the particular range of voltage ratings. For example, if a Q max value determined for machine of interest 118 is less than the Q max Max value determined for machines in the particular range of voltage ratings in which machine 118 falls within, a qualitative assessment can be made that machine's 118 partial discharge activity is lower than the maximum for that voltage rating.
- a Q max value determined for machine of interest 118 is greater than the Q max Max value determined for machines in the particular range of voltage ratings in which machine 118 falls within, a qualitative assessment can be made that machine's 118 partial discharge activity is greater than the maximum for that voltage rating.
- Q max 25% is defined as the mathematical maximum value of the PD Q max data collected from at least some of the other machines within the lowest quartile of all of the other machines within a particular range of voltage ratings.
- One purpose of calculating Q max 25% is to determine a Q max value associated with all of the machines within a particular range of voltage ratings that defines the lower quartile of such machines with respect to PD activity. Subsequently, a qualitative and quantitative comparison of PD data collected from machine of interest 118 can be made with the PD data collected from all of the machines within the particular range of voltage ratings.
- a Q max value determined for machine of interest 118 is less than the Q max 25% value determined for machines in the particular range of voltage ratings in which machine 118 falls within, a qualitative assessment can be made that machine's 118 partial discharge activity is within the lower quartile of machines within that range of voltage ratings.
- a Q max value determined for machine of interest 118 is greater than the Q max 25% value determined for machines in the particular range of voltage ratings in which machine 118 falls within, a qualitative assessment can be made that machine's 118 partial discharge activity is above the lower quartile of machines within that range of voltage ratings.
- Q max 50% , Q max 75% , Q max 90% , and Q max 95% are defined as the mathematical maximum value of the PD Q max data collected from at least some of the other machines for half, three quarters, 90%, and 95% of all of the other machines within a particular range of voltage ratings, respectively. Subsequently, a qualitative and quantitative comparison of PD data collected from machine of interest 118 can be made with the PD data collected from all of the machines within the particular range of voltage ratings.
- a Q max value determined for machine of interest 118 is less than the Q max 95% value determined for machines in the particular range of voltage ratings in which machine 118 falls within, a qualitative assessment can be made that machine's 118 partial discharge activity is within 95% of machines within that range of voltage ratings.
- a Q max value determined for machine of interest 118 is greater than the Q max 95% value determined for machines in the particular range of voltage ratings in which machine 118 falls within, a qualitative assessment can be made that machine's 118 partial discharge activity is above 95% of machines within that range of voltage ratings.
- all of the percentile transfer functions are determined by mathematically “backfitting” and/or “curve fitting” the Q max data collected for all of the machines within a particular range of voltage ratings, each machine having a measured hydrogen pressure at the time of PD data collection.
- any method of mathematically determining the percentile transfer function that facilitates operation of system 100 as described herein is used.
- Each determined percentile transfer function is programmed into module 104 for use within module 102 .
- the results of each of the Q max Avg , Q max Max , Q max 25% , Q max 50% , Q max 75% , Q max 90% , and Q max 95% determinations is stored within logger module 108 .
- FIG. 8 is a flow chart 800 illustrating an expanded portion of method portion 600 shown in FIG. 6 .
- flow chart 800 further illustrates method steps 606 , 608 , and 610 (shown in FIG. 6 ) described above.
- Flow chart 800 includes at least a portion of the database electronically maintained within logger module 108 (shown in FIG. 1 ).
- flow chart 800 includes Q max value data 802 calculated in method step 604 (shown in FIG. 6 ) and transmitted to the database in method step 608 for each data group for each machine in which partial discharge data was collected.
- Flow chart 800 also includes a plurality of database sorting criteria. Specifically, flow chart 800 includes a plurality of voltage rating range sorting criteria for each predetermined range of electrical machine voltage ratings. Specifically, flow chart 800 includes 10-12 kV rms voltage rating range sorting criteria 804 , 12-15 kV rms voltage rating range sorting criteria 806 , 16-18 kV rms voltage rating range sorting criteria 808 , and 19-30 kV rms voltage rating range sorting criteria 810 . Criteria 804 , 806 , 808 and 810 facilitate method step 608 wherein Q max value data 802 and hydrogen pressures (not shown) resident within the database are sorted into the aforementioned electrical machine voltage ratings.
- Flow chart 800 further includes a plurality of percentile transfer functions developed per method step 610 as described above. Specifically, a plurality of percentile transfer functions 812 are calculated for the 10-12 kV rms voltage rating range using the hydrogen pressure data recorded and stored as described above. Plurality of percentile transfer functions 812 includes a first percentile transfer function PTF 1 that is determined as described above in the form of at least one algorithm that substantially describes the behavior of Q max Avg values as a function of hydrogen pressure for machines with a voltage rating within the 10-12 kV rms range.
- plurality of percentile transfer functions 812 includes a second percentile transfer function PTF 2 that is determined as described above in the form of at least one algorithm that substantially describes the behavior of Q max Max values as a function of hydrogen pressure for machines with a voltage rating within the 10-12 kV rms range.
- plurality of percentile transfer functions 812 calculated for the 10-12 kV rms voltage rating range includes functions PTF 3 through PTF 7 representing mathematical expressions for Q max 25% , Q max 50% , Q max 75% , Q max 90% , and Q max 95% , respectively.
- flow chart 800 further includes additional pluralities of percentile transfer functions 814 , 816 and 818 calculated for the 12-15 kV rms , 15-18 kV rms , and 19-30 kV rms voltage rating ranges, respectively.
- Functions 814 include PTF 8 through PTF 14
- functions 816 include PTF 15 through PTF 21
- x is a variable representing hydrogen pressure measured at the time of PD data collection in units of kilopascal (kPa) and/or pounds per square inch (psi)
- K 1 through K 4 represent a set of constants uniquely determined for each of PTF 1 through PTF 28 .
- the values for Q max represented in mV tend to increase in value from lowest to greatest values in order of 25%, 50%, Ave, 75%, 90%, 95%, and Max.
- method portion 600 also includes a method step 612 calculating Q max levels as a function of hydrogen pressure.
- Method step 612 is accomplished using the plurality of percentile transfer functions determined in method step 610 as described above and the PD characteristics data and additional PD evaluation data determined in method steps 222 and 604 .
- the PD data is transmitted through the electrical machine operational classification sorting mechanism as described in method step 608 above via criteria 804 , 806 , 808 and 810 (all shown in FIG. 8 ) to the associated plurality of percentile transfer functions 812 , 814 , 816 and 818 , respectively, for the respective voltage rating range.
- the associated Q max values for Q max Avg , Q max Max , Q max 25% , Q max 50% , Q max 75% , Q max 90% , and Q max 95% are determined within module 102 and transmitted for storage within the database resident within logger module 108 .
- These Q max values form the basis for comparison of machine of interest 118 with other similar machines as described further below.
- An exemplary method of analyzing partial discharge data collected from an electrical device includes collecting partial discharge data from a first electrical device 118 belonging to a group of electrical devices.
- the group of electrical devices is at least partially defined by at least one electrical device classification.
- the method also includes generating a comparison of at least a portion of the partial discharge data collected from first electrical device 118 with at least a portion of the partial discharge data collected from at least one second electrical device.
- the at least one second electrical device is selected from the group of electrical devices that includes first electrical device 118 .
- the method further includes transmitting the results, which in the exemplary embodiment, is to at least one computer-readable medium, or specifically, output module 106 .
- FIG. 9 is a flow chart illustrating a further portion 900 of method 200 (portions shown in FIGS. 2 and 6 ) of operating on-line real-time partial discharge analyzer system 100 (shown in FIG. 1 ).
- FIG. 10 is a continuation of the flow chart from FIG. 9 and
- FIG. 11 is a continuation of the flow chart from FIG. 10 .
- Method portion 900 includes a plurality of method steps for performing automatic continuous PD analysis of electrical machine of interest 118 (shown in FIG. 1 ). As such, method portion 900 includes a method step 902 coupling at least one partial discharge analyzer system 100 to electrical machine of interest 118 .
- machine of interest 118 has at least some similar design, construction and operational classifications, hereon referred to as machine classifications, to at least some other machines within the machine groups as described in method step 202 above.
- machine classifications each of such other machines is sorted into one of a plurality of groups that include, but are not limited to, water-cooled electric power generators, hydrogen-cooled electric power generators, and air-cooled electric power generators, and/or combinations thereof.
- groups may include, but not be limited to, air-cooled electric motors.
- machine of interest 118 is a unique electrical device wherein qualitative assessments of similarity and dissimilarity of each of the unique features associated with machine 118 are conducted such that at least some of the PD data collected and determined in method portion 600 (shown in FIG. 6 ) as described above can be used to evaluate machine 118 .
- step 902 includes permanently coupling one of system 100 to machine 118 .
- method 902 includes temporarily coupling one of system 100 to machine 118 .
- any method of collecting PD data that facilitates analysis as described herein is used.
- Method portion 900 also includes a method step 904 collecting PD data (including noise data) from electrical machine of interest 118 in the form of an original PD pattern with noise data as described further below.
- Graph 300 shown in FIG. 3 ) as described above represents a typical PD pattern associated with machine 118 .
- Partial discharge pulses 314 are generated based on conditions that include, but are not limited to, the material condition of the insulation, operating conditions of machine 118 , and environmental conditions proximate to machine 118 .
- pulses 314 include PD pulses within machine 118 , PD pulses from devices (not shown) electrically coupled to bus 116 (shown in FIG. 1 ) that are external to machine 118 , and noise pulses that originate from sources that include, but are not limited to, proximate electro-magnetic fields and commutation, radio frequency interference, and electrical power supply power quality deficiencies.
- Method portion 900 further includes a method step 906 collecting electrical machine 118 operational data via sensors 120 and processor 124 (both shown in FIG. 1 ).
- step 906 includes operational data collected substantially instantaneously with the PD data collected in step 904 as described above.
- Such operational data is transmitted to module 102 and includes, but is not limited to, machine voltage, machine MW, machine KVA, machine reactive power (in Megavolt-Amperes Reactive (MVAR)), machine temperatures and hydrogen pressure.
- MVAR Megavolt-Amperes Reactive
- Method portion 900 also includes a method step 908 forming a W-T classification map.
- Step 908 includes forming clusters of PD data (including noise data) by translating the PD data (including noise data) collected in step 904 .
- Step 908 is substantially similar to method step 216 as described above.
- Associated histogram 403 (shown in FIG. 4 ) is electronically stored within logger module 108 .
- associated classification map 500 (shown in FIG. 5 ) is electronically stored within logger module 108 .
- Method portion 900 further includes a method step 910 sorting each of the plurality of clusters 504 , 506 , 508 , and 510 (shown in FIG. 5 ) into pulse classifications, derived as described above in method step 218 (shown in FIG. 2 ).
- noise pulses tend to exhibit similar characteristics as other noise pulses such that the associated noise pulse pixels tend to group in proximity to each other.
- PD pulses having similar characteristics as other PD pulses tend to also group in proximity to each other, wherein PD pulses generated within the same defect tend to exhibit similar shapes. Therefore, clusters 504 , 506 , 508 , and 510 are classified by the characteristics of each type of pulse in received plurality of pulses 404 (shown in FIG.
- Such classification is performed within module 102 using rules resident within module 104 , and such classification is stored within logger module 108 (all shown in FIG. 1 ). Further analysis is performed in a manner substantially similar to that described above for method step 218 within module 102 using rules resident within module 104 , and the results of such further analysis are stored within logger module 108 .
- Method portion 900 also includes a method step 912 generating sub-patterns (including noise data) from the pulse classifications determined in step 910 .
- Method step 912 is substantially similar to method step 220 (shown in FIG. 2 ) described above and is performed using modules 102 and 104 and the results are electronically stored within logger module 108 .
- Method portion 900 further includes a method step 914 determining pulse characteristics of collected PD data (including noise data) from electrical machine of interest 118 .
- Method step 914 is substantially similar to method step 222 (shown in FIG. 2 ) as discussed above.
- method step 914 is performed using modules 102 and 104 and the results are electronically stored within logger module 108 .
- Method portion 900 also includes a method step 916 populating the database with the PD characteristics data determined in method step 914 as described above.
- Method step 916 is substantially similar to method step 224 (shown in FIG. 2 ) as described above.
- Such PD data is sorted into the PD source identification classifications determined per method step 208 (shown in FIG. 2 ) as described above and stored within logger module 108 . Such sorting effectively separates the noise data from the PD data.
- operation parameter data, including hydrogen pressure data, collected during collection of the PD data is also stored within the database for further use as described below.
- Method portion 900 further includes a method step 918 performing additional PD data evaluations and generating additional PD evaluation data that is substantially similar to method step 604 (shown in FIG. 6 ) as discussed above.
- Each group of PD pulse data previously recorded within the steps described above and stored within logger module 108 is further evaluated by performing calculations within module 102 using rules resident within module 104 .
- method step 916 determines Q max values as described above in units of mV.
- Method portion 900 also includes a method step 920 populating the database with the additional PD evaluation data determined in method step 918 as described above. Specifically, the database electronically maintained within logger module 108 receives the Q max value data calculated in method step 918 .
- Method portion 900 further includes a method step 922 creating baseline data using the pulse characteristics and evaluation data.
- the data collected and the subsequent evaluations and determinations as described above thus far in portion 900 are stored within the database residing in logger module 108 . Moreover, such data may be designated baseline data by the operator for further analyses and comparisons as discussed further below.
- Method portion 900 also includes a method step 924 comparing Q max levels for machine of interest 118 with Q max levels for the other electrical machines.
- the Q max levels determined in method step 916 as described above are compared to the Q max Ave , Q max Max , Q max 25% , Q max 50% , Q max 75% , Q max 90% , and Q max 95% values determined for the other machines within the electrical machine operational classification (as described in method step 610 (shown in FIG. 6 ) above) that machine of interest 118 is grouped within.
- machine 118 is compared with the other machines having a similar voltage rating within one of the 10-12 kV rms , 12-15 kV rms , 16-18 kV rms , and 19-30 kV rms voltage rating ranges.
- the Q max levels determined in method step 916 for machine of interest 118 are compared to the existing Q max values for one of PTF 1 -PTF 7 , PTF 8 -PTF 14 , PTF 15 -PTF 21 , or PTF 22 -PTF 28 as determined in method step 610 , wherein these PCTs facilitates generation of the Q max Ave , Q max Max , Q max 25% , Q max 50% , Q max 75% , Q max 90% , and Q max 95% values for the associated voltage range rating.
- machine of interest 118 is ranked with the other similar machines as a function of placement within the predetermined percentiles (Q max Ave , Q max Max , Q max 25% , Q max 50% , Q max 75% , Q max 90% , and Q max 95% ).
- the Q max levels determined in method step 916 are approximately 150 mV
- the Q max Ave , Q max Max , Q max 25% , Q max 50% , Q max 75% , Q max 90% , and Q max 95% values for the associated voltage range rating are 155 mV, 750 mV, 45 mV, 169 mV, 375 mV, 500 mV, and 700 mV, respectively
- machine of interest is considered to be approximately average and just slightly within the top half of the other measured machines.
- Method portion 900 further includes a method step 926 trending PD levels in electrical machine of interest 118 as a function of time.
- FIG. 12 is a flow chart 1000 illustrating trending and notification features that may be used with partial discharge analyzer system 100 (shown in FIG. 1 ).
- Flow chart 1000 includes at least a portion of the database electronically maintained within logger module 108 (shown in FIG. 1 ).
- flow chart 1000 includes Q max value data 1002 calculated in method step 918 (shown in FIG. 10 ) and transmitted to the database in method step 920 for machine 118 .
- flow chart 1000 includes a trend determination function block 1004 that is coupled in electronic data communication with data 1002 .
- Function block 1004 is configured to receive data transmitted from data 1002 and includes at least one algorithm to calculate trends associated with Q max value data 1002 over a predetermined period of time. In the exemplary embodiment, function block 1004 calculates a rate of change of Q max value data 1002 over a six month period of time. Alternatively, any period of time that facilitates operation of system 100 as described herein is used.
- algorithm (4) is configured within system 100 to update on a substantially continuous basis automatically with the limitations being the scan rate of system 100 (typically measured in milliseconds) and the sampling rate of sensor 110 (shown in FIG. 1 ).
- Flow chart 1000 also includes a discrete functional logic block 1006 that is coupled in electronic data communication with function block 1004 .
- Logic block 1006 is configured to receive and compare the ratio determined and transmitted by algorithm (4) above with the number 2, wherein logic block 1006 determines if the Q max magnitude has doubled.
- Flow chart 1000 further includes a discrete “end” functional logic block 1008 that is coupled in electronic data communication with logic block 1006 .
- a discrete signal is transmitted to logic block 1008 and operation of the associated trending feature illustrated in flow chart 1000 is terminated via logic block 1008 for a predetermined period of time.
- the trending feature illustrated in flow chart 1000 is configured to operate continuously while machine 118 is in service.
- method portion 900 further includes a method step 928 determining and implementing operator notification criteria and set operator notifications.
- flow chart 1000 also includes a discrete notification function block 1010 that is coupled in electronic data communication with logic block 1006 wherein function block 1010 facilitates notification of an operator in the event that Q max magnitude has at least doubled over the last six months based on a discrete signal transmitted from logic block 1006 .
- Such notification may be facilitated by methods that include, but are not limited to, initiating pop-up alarms on operator consoles, energizing audible control room alarms, and energizing annunciator windows.
- Flow chart 1000 further includes an analog notification function block 1012 that is coupled in electronic data communication with logic block 1006 wherein function block 1012 facilitates display of information that includes current Q max magnitudes, percentile ranking, and rate of change of Q max that is transmitted as analog signals from logic block 1006 .
- function block 1012 is in continuous operation.
- function block 1012 is placed in service at a predetermined periodicity.
- Method portion 900 further includes a method step 930 determine and isolate PD sources internal to electrical machine of interest 118 .
- the data within the database resident in logger module 108 contains evaluated and analyzed data with sufficient rules within module 104 to facilitate determination of PD sources by module 102 (all shown in FIG. 1 ) as a function of the determined PD pulse characteristics.
- FIG. 13 is a flow chart 1100 illustrating machine partial discharge source identification features that may be used with partial discharge analyzer system 100 (shown in FIG. 1 ).
- Flow chart 1100 includes at least a portion of the database 1102 electronically maintained within logger module 108 (shown in FIG. 1 ).
- Flow chart 1100 also includes a data selection function block 1104 that is coupled in electronic data communication with database portion 1102 .
- Function block 1104 is configured to select, receive and transmit partial discharge data collected from machine 118 based on a predetermined sequence. For example, in operation, function block 1104 transmits a first selection of PD data collected with determined pulse characteristics that include, but are not limited to, magnitude, polarity, phase, and time of occurrence, as described in method steps 904 through 916 (all shown in FIG. 9 ) and that are used to facilitate determining PD source identification and type. Such first and subsequent selections of PD data are typically determined based on their classifications that include, but are not limited to, corona discharges, surface discharges, internal discharges, invalid data, noise, and unknown causes.
- Flow chart 1100 further includes a pulse characteristic function block 1106 coupled in electronic data communication with function block 1104 that is configured to receive the data transmitted from function block 1104 and determine magnitudes and/or values associated with the pulse characteristics described above. Such determinations are facilitated by using W-T domain analysis and PRPDA, both as described above.
- Flow chart 1100 also includes an additional PD data evaluation function block 1108 that is coupled in electronic data communication with function block 1106 .
- Function block 1108 is configured to receive classification data transmitted from function block 1106 and determine additional PD data evaluations in a manner substantially similar to that described for method step 918 (shown in FIG. 10 ).
- analyses include, but are not limited to, determinations of values for Q max , NQN, N w , a Weibull distribution, and a kurtosis of phase distribution.
- Such analyses further include statistical analysis of amplitude and phase distributions, for example, but not limited to, a mean phase angle of a pulse pattern, a phase spread of a pulse pattern, and a variance of pulse amplitude distribution.
- Q max is the primary parameter used for further evaluation of pulse data.
- Flow chart 1100 further includes a PD location and type function block 1110 that is coupled in electronic data communication with function block 1108 .
- Function block 1110 is configured to receive the plurality of data transmitted from function block 1108 and determine a location and type of the PD activity associated with the first selection of PD data collected from machine 118 .
- Function block 1110 is also configured to use rules programmed within module 104 (shown in FIG. 1 ) that are at least partially based on PRPDA pattern data published by the International Council on Large Electric Systems (CIGRE).
- CCGRE International Council on Large Electric Systems
- Flow chart 1100 also includes an additional identification analysis function block 1112 that is coupled in electronic data communication with function block 1110 .
- Function block 1112 is configured to receive location and type data transmitted from function block 1110 and is further configured to execute additional identification analysis.
- results of such additional analysis includes, but is not limited to, determining if the PD pulse occurrence has a positive predominance (wherein the occurrence of partial discharge activity is predominately found during positive phase portions of the electrical phase cycles of machine 118 ) which indicates possible slot (not shown) PD activity.
- additional analysis includes determining if such PD activity has a +/ ⁇ 30° phase shift indicating the associated PD activity is possibly originating in the end windings (not shown) of machine 118 .
- additional analysis includes determining if such PD activity is coincident with other PD activity, thereby forming crosstalk conditions.
- any analysis of the PD data that facilitates operation of system 100 as described herein is used.
- Flow chart 1100 further includes a discrete functional logic block 1114 that is coupled in electronic data communication with functional function block 1112 .
- Logic block 1114 is configured to determine if all of the classifications have been analyzed. If they have, a discrete signal is transmitted to a discrete “end” functional logic block 1116 that is coupled in electronic data communication with logic block 1114 .
- Logic block 1116 is substantially similar to logic block 1008 (shown in FIG. 12 ). If there are remaining classifications within data 1102 to be analyzed, a discrete signal is transmitted to data selection function block 1104 to select, receive and transmit the next set of partial discharge data collected from machine 118 .
- Method portion 900 also includes a method step 932 determine PD levels as a function of operational data parameters.
- Operational parameters of machine of interest 118 include, but are not limited to, voltage, MW, MVAR, hydrogen pressure, and temperature.
- FIG. 14 is a flow chart 1200 illustrating determination features for partial discharge levels as a function of operational real and reactive power data that may be used with partial discharge analyzer system 100 (shown in FIG. 1 ).
- FIG. 15 is a continuation of the flow chart from FIG. 14 .
- Flow chart 1200 includes at least a portion of the database 1202 electronically maintained within logger module 108 (shown in FIG. 1 ).
- Flow chart 1200 also includes a data selection and trending function block 1204 that is coupled in electronic data communication with database portion 1202 .
- Function block 1204 is configured to select, receive and transmit data from database portion 1202 that includes, but is not limited to, real power time-stamped data in units of MW collected from machine 118 based on a predetermined time period and time-stamped Q max data.
- Q max data may include classification and type data that is determined and evaluated as described above.
- the Q max data is pulled from the database as a function of its W-T classification.
- any Q max data that facilitates operation of system 100 as described herein is pulled from the database.
- a one year limit is placed on the time frame evaluated.
- any time period over the life cycle of machine 118 is used.
- a substantially similar configuration is used for reactive power data recorded in units of MVAR, wherein the real power trending features are discussed hereon. Trending both MW and MVAR and comparing with recorded Q max facilitates detection of loose windings within machine 118 .
- Flow chart 1200 further includes a percentage change in Q max function block 1206 that is coupled in electronic data communication with function block 1204 .
- Function block 1206 is configured to receive Q max data and MW data transmitted from function block 1204 .
- Function block 1206 is also configured to determine at least two instances wherein measurements of real power transients associated with machine 118 that exceed 50% within the range of 0% to 100% of the real power rating of machine 118 .
- function block 1206 is configured to receive temperature, and hydrogen pressure from database portion 1202 wherein function block 1206 evaluates if a predetermined set of measured parameters that are known to affect partial discharge activity are substantially static during the time period evaluated.
- function block 1206 makes a determination if the measured temperature data is substantially constant at 50 degrees Celsius (° C.) (122 degrees Fahrenheit (° F.)) within a range of +/ ⁇ 5° C. (9° F.). Also, specifically, in the exemplary embodiment, function block 1206 makes a determination if the measured hydrogen pressure remains substantially constant within a +/ ⁇ 10% range of a first hydrogen pressure measurement. Alternatively, any process measurements known to affect partial discharge activity are determined to be substantially static or permitted to vary in a limited, predetermined range, are used. If the substantially static conditions are satisfied, a percentage change in Q max for substantially the same time period associated with the MW data is calculated and a signal representative of such percentage change is transmitted from function block 1206 .
- Flow chart 1200 also includes a positive predominance functional logic block 1208 that is coupled in electronic data communication with function block 1206 and is configured to receive the Q max percentage change signal that is transmitted from function block 1206 . If the Q max data being evaluated via flow chart 1200 exhibits tendencies of positive predominance (wherein the occurrence of partial discharge activity is predominately found during positive phase portions of the electrical phase cycles of machine 118 ) a discrete “yes” signal is transmitted from logic block 1208 . Otherwise, a discrete “no” signal is transmitted from logic block 1208 .
- Flow chart 1200 further includes a first delta Q max comparison functional logic block 1210 that is coupled in electronic data communication with logic block 1208 and is configured to receive the discrete “yes” signal that is transmitted from logic block 1208 .
- Logic block 1210 is also configured to make a determination whether the percentage change in Q max signal transmitted from function block 1206 includes a value between 30% and 100%. If the percentage change in Q max falls within this range, a discrete “yes” signal is transmitted from logic block 1210 . Otherwise, a discrete “no” signal is transmitted from logic block 1210 .
- Flow chart 1200 also includes a first notification function block 1212 that is coupled in electronic data communication with logic block 1210 and is configured to receive the discrete “yes” signal is transmitted from logic block 1210 .
- function block 1212 Upon receipt of such signal, function block 1212 facilitates notification of an operator in the event that Q max magnitude has increased by 30% to 100% over the time period being evaluated.
- notification is indicative of potential slot-based partial discharge activity and may be facilitated by methods that include, but are not limited to, initiating pop-up alarms on operator consoles, energizing audible control room alarms, and energizing annunciator windows.
- Flow chart 1200 further includes a second delta Q max comparison functional logic block 1214 that is that is coupled in electronic data communication with logic block 1210 and is configured to receive the discrete “no” signal that is transmitted from logic block 1210 .
- Logic block 1214 is also configured to make a determination whether the percentage change in Q max signal transmitted from function block 1206 includes a value greater than 100%. If the percentage change in Q max has more than doubled, a discrete “yes” signal is transmitted from logic block 1214 . Otherwise, a discrete “no” signal is transmitted from logic block 1214 .
- Flow chart 1200 also includes a second notification function block 1216 that is coupled in electronic data communication with logic block 1214 and is configured to receive the discrete “yes” signal that is transmitted from logic block 1214 .
- function block 1216 facilitates notification of an operator in the event that Q max magnitude has at least doubled over the time period being evaluated.
- Such notification is indicative of a high risk of slot-based partial discharge activity and may be facilitated by methods that include, but are not limited to, initiating pop-up alarms on operator consoles, energizing audible control room alarms, and energizing annunciator windows.
- Flow chart 1200 further includes a discrete “end” functional logic block 1218 that is coupled in electronic data communication with logic block 1214 .
- Logic block 1218 is configured to end evaluation of this Q max data upon receipt of the discrete “no” signal transmitted by logic block 1214 .
- Flow chart 1200 also includes a negative predominance functional logic block 1220 that is coupled in electronic data communication with logic block 1208 and is configured to receive discrete “no” signal that is transmitted from logic block 1208 . If the Q max data being evaluated via flow chart 1200 exhibits tendencies of negative predominance (wherein the occurrence of partial discharge activity is predominately found during negative phase portions of the electrical phase cycles of machine 118 ) a discrete “yes” signal is transmitted from logic block 1220 . Otherwise, a discrete “no” signal is transmitted from logic block 1220 .
- flow chart further includes a third delta Q max comparison functional logic block 1222 that is coupled in electronic data communication with logic block 1220 and is configured to receive the discrete “yes” signal that is transmitted from logic block 1220 .
- Logic block 1222 is also configured to make a determination whether the percentage change in Q max signal transmitted from function block 1206 includes a value between 30% and 100%. If the percentage change in Q max falls within this range, a discrete “yes” signal is transmitted from logic block 1222 . Otherwise, a discrete “no” signal is transmitted from logic block 1222 .
- Flow chart 1200 also includes a third notification function block 1224 that is coupled in electronic data communication with logic block 1222 and is configured to receive the discrete “yes” signal is transmitted from logic block 1222 .
- function block 1224 Upon receipt of such signal, function block 1224 facilitates notification of an operator in the event that Q max magnitude has increased by 30% to 100% over the time period being evaluated.
- notification is indicative of potential copper insulation delamination-based partial discharge activity and may be facilitated by methods that include, but are not limited to, initiating pop-up alarms on operator consoles, energizing audible control room alarms, and energizing annunciator windows.
- Flow chart 1200 further includes a fourth delta Q max comparison functional logic block 1226 that is that is coupled in electronic data communication with logic block 1222 and is configured to receive the discrete “no” signal that is transmitted from logic block 1222 .
- Logic block 1226 is also configured to make a determination whether the percentage change in Q max signal transmitted from function block 1206 includes a value greater than 100%. If the percentage change in Q max has more than doubled, a discrete “yes” signal is transmitted from logic block 1226 . Otherwise, a discrete “no” signal is transmitted from logic block 1226 .
- Flow chart 1200 also includes a fourth notification function block 1228 that is coupled in electronic data communication with logic block 1226 and is configured to receive the discrete “yes” signal that is transmitted from logic block 1226 .
- function block 1228 Upon receipt of such signal, function block 1228 facilitates notification of an operator in the event that Q max magnitude has at least doubled over the time period being evaluated. Such notification is indicative of a high risk of copper insulation delamination-based partial discharge activity and may be facilitated by methods that include, but are not limited to, initiating pop-up alarms on operator consoles, energizing audible control room alarms, and energizing annunciator windows.
- Flow chart 1200 further includes a discrete “end” functional logic block 1230 that is coupled in electronic data communication with logic block 1226 .
- Logic block 1230 is configured to end evaluation of this Q max data upon receipt of the discrete “no” signal transmitted by logic block 1226 .
- Flow chart further includes a fifth delta Q max comparison functional logic block 1232 that is coupled in electronic data communication with logic block 1220 and is configured to receive the discrete “no” signal that is transmitted from logic block 1220 .
- Logic block 1232 is also configured to make a determination whether the percentage change in Q max signal transmitted from function block 1206 includes a value between 30% and 100%. If the percentage change in Q max falls within this range, a discrete “yes” signal is transmitted from logic block 1232 . Otherwise, a discrete “no” signal is transmitted from logic block 1232 .
- Flow chart 1200 also includes a fifth notification function block 1234 that is coupled in electronic data communication with logic block 1232 and is configured to receive the discrete “yes” signal is transmitted from logic block 1232 .
- function block 1234 facilitates notification of an operator in the event that Q max magnitude has increased by 30% to 100% over the time period being evaluated.
- notification is indicative of potential poor groundwall compactness-based partial discharge activity and may be facilitated by methods that include, but are not limited to, initiating pop-up alarms on operator consoles, energizing audible control room alarms, and energizing annunciator windows.
- Flow chart 1200 further includes a sixth delta Q max comparison functional logic block 1236 that is that is coupled in electronic data communication with logic block 1232 and is configured to receive the discrete “no” signal that is transmitted from logic block 1232 .
- Logic block 1236 is also configured to make a determination whether the percentage change in Q max signal transmitted from function block 1206 includes a value greater than 100%. If the percentage change in Q max has more than doubled, a discrete “yes” signal is transmitted from logic block 1236 . Otherwise, a discrete “no” signal is transmitted from logic block 1236 .
- Flow chart 1200 also includes a sixth notification function block 1238 that is coupled in electronic data communication with logic block 1236 and is configured to receive the discrete “yes” signal that is transmitted from logic block 1236 .
- function block 1238 facilitates notification of an operator in the event that Q max magnitude has at least doubled over the time period being evaluated.
- Such notification is indicative of a high risk of poor groundwall compactness-based partial discharge activity and may be facilitated by methods that include, but are not limited to, initiating pop-up alarms on operator consoles, energizing audible control room alarms, and energizing annunciator windows.
- Flow chart 1200 further includes a discrete “end” functional logic block 1240 that is coupled in electronic data communication with logic block 1236 .
- Logic block 1240 is configured to end evaluation of this Q max data upon receipt of the discrete “no” signal transmitted by logic block 1236 .
- FIG. 16 is a flow chart 1300 illustrating determination features for partial discharge levels as a function of operational temperature data that may be used with partial discharge analyzer system 100 (shown in FIG. 1 ).
- Flow chart 1300 includes at least a portion of the database 1302 electronically maintained within logger module 108 (shown in FIG. 1 ).
- Flow chart 1300 also includes a data selection and trending function block 1304 that is coupled in electronic data communication with database portion 1302 .
- Function block 1304 is configured to select, receive and transmit data from database portion 1302 that includes, but is not limited to, temperature time-stamped data in units of ° C. (° F.) collected from machine 118 based on a predetermined time period and time-stamped Q max data.
- Such Q max data may include classification and type data that is determined and evaluated as described above.
- the Q max data is pulled from the database as a function of its W-T classification.
- any Q max data that facilitates operation of system 100 as described herein is pulled from the database.
- Flow chart 1300 further includes a percentage change in Q max function block 1306 that is coupled in electronic data communication with function block 1304 .
- Function block 1306 is configured to receive Q max data and temperature data transmitted from function block 1304 .
- Function block 1306 is also configured to determine at least two instances wherein measurements of temperature transients associated with machine 118 that exceeds 50° C. within machine 118 .
- function block 1306 is configured to receive load and hydrogen pressure data from database portion 1302 wherein function block 1306 evaluates if a predetermined set of measured parameters that are known to affect partial discharge activity are substantially static during the time period evaluated.
- function block 1306 makes a determination if the measured load data is substantially constant within a +/ ⁇ 5% range of a first load measurement. Also, specifically, in the exemplary embodiment, function block 1306 makes a determination if the measured hydrogen pressure remains substantially constant within a +/ ⁇ 10% range of a first hydrogen pressure measurement. Alternatively, any process measurements known to affect partial discharge activity are determined to be substantially static or permitted to vary in a limited, predetermined range, are used. If the substantially static conditions are satisfied, a percentage change in Q max for substantially the same time period associated with the temperature data is calculated and a signal representative of such percentage change is transmitted from function block 1306 .
- Flow chart 1300 also includes a positive predominance functional logic block 1308 that is coupled in electronic data communication with function block 1306 and is configured to receive the Q max percentage change signal that is transmitted from function block 1306 . If the Q max data being evaluated via flow chart 1300 exhibits tendencies of positive predominance a discrete “yes” signal is transmitted from logic block 1308 . Otherwise, a discrete “no” signal is transmitted from logic block 1308 .
- Flow chart 1300 further includes a first delta Q max comparison functional logic block 1310 that is coupled in electronic data communication with logic block 1308 and is configured to receive the discrete “yes” signal that is transmitted from logic block 1308 .
- Logic block 1310 is also configured to make a determination whether the percentage change in Q max signal transmitted from function block 1306 includes a value greater than 30%. If the percentage change in Q max exceeds 30%, a discrete “yes” signal is transmitted from logic block 1310 . Otherwise, a discrete “no” signal is transmitted from logic block 1310 .
- Flow chart 1300 also includes a first notification function block 1312 that is coupled in electronic data communication with logic block 1310 and is configured to receive the discrete “yes” signal that is transmitted from logic block 1310 .
- function block 1312 Upon receipt of such signal, function block 1312 facilitates notification of an operator in the event that Q max magnitude has increased by at least 30% over the time period being evaluated.
- Such notification is indicative of a potential of partial discharge activity due to degradation of silicon carbide grading and may be facilitated by methods that include, but are not limited to, initiating pop-up alarms on operator consoles, energizing audible control room alarms, and energizing annunciator windows.
- Flow chart 1300 further includes a discrete “end” functional logic block 1314 that is coupled in electronic data communication with logic block 1310 .
- Logic block 1314 is configured to end evaluation of this Q max data upon receipt of the discrete “no” signal transmitted by logic block 1310 .
- Flow chart 1300 also includes a negative predominance functional logic block 1316 that is coupled in electronic data communication with logic block 1308 and is configured to receive the discrete “no” signal that is transmitted from logic block 1308 . If the Q max data being evaluated via flow chart 1300 exhibits tendencies of negative predominance a discrete “yes” signal is transmitted from logic block 1316 . Otherwise, a discrete “no” signal is transmitted from logic block 1316 .
- Flow chart 1300 further includes a discrete “end” functional logic block 1318 that is coupled in electronic data communication with logic block 1316 . Logic block 1318 is configured to end evaluation of this Q max data upon receipt of the discrete “no” signal transmitted by logic block 1316 .
- Flow chart 1300 further includes a second delta Q max comparison functional logic block 1320 that is coupled in electronic data communication with logic block 1316 and is configured to receive the discrete “yes” signal that is transmitted from function block 1316 .
- Logic block 1320 is also configured to make a determination whether the percentage change in Q max signal transmitted from function block 1306 includes a value greater than 30%. If the percentage change in Q max exceeds 30%, a discrete “yes” signal is transmitted from logic block 1320 . Otherwise, a discrete “no” signal is transmitted from logic block 1320 .
- Flow chart 1300 also includes a second notification function block 1322 that is coupled in electronic data communication with logic block 1320 and is configured to receive the discrete “yes” signal that is transmitted from logic block 1320 .
- function block 1322 Upon receipt of such signal, function block 1322 facilitates notification of an operator in the event that Q max magnitude has increased by at least 30% over the time period being evaluated. Such notification is indicative of a potential of partial discharge activity due to groundwall delamination and may be facilitated by methods that include, but are not limited to, initiating pop-up alarms on operator consoles, energizing audible control room alarms, and energizing annunciator windows.
- Flow chart 1300 further includes a discrete “end” functional logic block 1324 that is coupled in electronic data communication with logic block 1320 .
- Logic block 1324 is configured to end evaluation of this Q max data upon receipt of the discrete “no” signal transmitted by logic block 1320 .
- FIG. 17 is a flow chart 1400 illustrating determination features for partial discharge levels as a function of operational hydrogen pressure data that may be used with partial discharge analyzer system 100 (shown in FIG. 1 ).
- Flow chart 1400 includes at least a portion of the database 1402 electronically maintained within logger module 108 (shown in FIG. 1 ).
- Flow chart 1400 also includes a data selection and trending function block 1404 that is coupled in electronic data communication with database portion 1402 .
- Function block 1404 is configured to select, receive and transmit data from database portion 1402 that includes, but is not limited to, hydrogen pressure time-stamped data in units of kilopascal (kPa) (pounds per square inch (psi)) collected from machine 118 based on a predetermined time period and time-stamped Q max data.
- Q max data may include classification and type data that is determined and evaluated as described above.
- the Q max data is pulled from the database as a function of its W-T classification.
- any Q max data that facilitates operation of system 100 as described herein is pulled from the database.
- Flow chart 1400 further includes a change in Q max to change in hydrogen pressure ratio function block 1406 that is coupled in electronic data communication with function block 1404 .
- Function block 1406 is configured to receive Q max data and hydrogen pressure data transmitted from function block 1404 .
- function block 1306 is configured to receive load and temperature data from database portion 1304 wherein function block 1306 evaluates if a predetermined set of measured parameters that are known to affect partial discharge activity are substantially static during the time period evaluated.
- function block 1406 makes a determination if the measured load data is substantially constant within a +/ ⁇ 5% range of a first load measurement. Specifically, in the exemplary embodiment, function block 1406 makes a determination if the measured temperature data is substantially constant at 50° C. (122° F.) within a range of +/ ⁇ 5° C. (9° F.). Also, specifically, in the exemplary embodiment, function block 1406 makes a determination if the Q max data is predominately positive and/or negative. Alternatively, any process measurements known to affect partial discharge activity are determined to be substantially static or permitted to vary in a limited, predetermined range, are used.
- function block 1406 is configured to calculate a value for a ratio of the change of Q max data as compared to the change in hydrogen pressure within machine 118 for substantially the same time period associated with the hydrogen pressure data and a signal representative of such ratio is transmitted from function block 1406 .
- Flow chart 1400 further includes a comparative ratio functional logic block 1408 that is coupled in electronic data communication with function block 1406 .
- Logic block 1408 is configured to receive the ratio signal transmitted by function block 1406 and to compare the ratio to zero. If the partial discharge activity decreases as hydrogen pressure increases, the ratio is less than zero which is an indication that the PD activity is internal to machine 118 . If the partial discharge activity increases as hydrogen pressure increases, the ratio is greater than zero which is an indication that the PD activity is external to machine 118 .
- logic block 1408 is configured to transmit a discrete “yes” signal if the ratio is less than zero and a discrete “no” signal if the ratio is greater than zero.
- Flow chart 1400 also includes a first notification function block 1410 that is coupled in electronic data communication with logic block 1408 and is configured to receive the discrete “yes” signal transmitted from logic block 1408 .
- Function block 1410 is also configured to notify an operator that the PD data being evaluated originated from a source within machine 118 .
- flow chart 1400 also includes a second notification function block 1412 that is coupled in electronic data communication with logic block 1408 and is configured to receive the discrete “no” signal transmitted from logic block 1408 .
- Function block 1412 is also configured to notify an operator that the PD data being evaluated originated from a source external to machine 118 .
- Method portion 900 also includes a method step 934 determine protective scheme features for your electrical machine.
- FIG. 18 is a flow chart 1500 illustrating machine partial discharge protective relay and alarm features that may be used with partial discharge analyzer system 100 (shown in FIG. 1 ).
- Flow chart 1500 includes at least a portion of the database 1502 electronically maintained within logger module 108 (shown in FIG. 1 ).
- Flow chart 1500 also includes a data selection and trending function block 1504 that is coupled in electronic data communication with database portion 1502 .
- Function block 1504 is configured to select, receive and transmit data from database portion 1502 that includes, but is not limited to, time-stamped Q max data and time-stamped historical protective relay data is collected from machine 118 based on a predetermined time period.
- Such Q max data may include classification and type data that is determined and evaluated as described above.
- the Q max data is pulled from the database as a function of its W-T classification.
- any Q max data that facilitates operation of system 100 as described herein is pulled from the database.
- the protective relay data is associated with the discrete energizing and de-energizing events of a synchronization relay (not shown) as well as an analog synchronization angle signal recorded during electrical synchronization activities of machine 118 to an electric grid (not shown).
- any historical operational discrete or analog data associated with a protective scheme of machine 118 is used.
- Flow chart 1500 also includes a synchronization angle functional logic block 1506 that is coupled in electronic data communication with function block 1504 and is configured to receive the synchronization angle data and Q max data transmitted from function block 1504 .
- Logic block 1506 is also configured to compare such synchronization angle data with a predetermined value. In the exemplary embodiment, such value is 5°. Alternatively, any value for synchronization phase angle is used.
- Logic block is further configured to transmit a discrete “yes” signal if the phase angle data is less than 5° or a discrete “no” signal if the phase angle is not less than 5°.
- Flow chart 1500 further includes a discrete “end” functional logic block 1508 that is coupled in electronic data communication with logic block 1506 .
- Logic block 1508 is configured to end evaluation of this Q max data upon receipt of the discrete “no” signal transmitted by logic block 1506 .
- Flow chart 1500 further includes a delta Q max comparison functional logic block 1510 that is coupled in electronic data communication with logic block 1506 and is configured to receive the discrete “yes” signal that is transmitted from function block 1506 .
- Logic block 1510 is also configured to make a determination whether the percentage change in Q max signal transmitted from function block 1506 includes a value greater than 30%. If the percentage change in Q max exceeds 30%, a discrete “yes” signal is transmitted from logic block 1510 . Otherwise, a discrete “no” signal is transmitted from logic block 1510 .
- Flow chart 1500 also includes a discrete “end” functional logic block 1512 that is coupled in electronic data communication with logic block 15010 .
- Logic block 1512 is configured to end evaluation of this Q max data upon receipt of the discrete “no” signal transmitted by logic block 1510 .
- Flow chart 1500 further includes an end winding partial discharge functional logic block 1514 that is coupled in electronic data communication with logic block 1510 and is configured to receive the discrete “yes” signal from logic block 1510 .
- Logic block 1514 is further configured to determine if the change in Q max data is within a range typically associated with end winding partial discharge activity. Accordingly, logic block 1514 is configured to transmit a discrete “yes” signal if the end winding PD activity is indicated and a discrete “no” signal if end winding PD activity is not indicated.
- Flow chart 1500 also includes a first notification function block 1516 that is coupled in electronic data communication with logic block 1514 and is configured to receive the discrete “yes” signal transmitted from logic block 1514 . Function block 1516 is also configured to notify an operator that the PD data being evaluated indicates potential PD damage in the end windings or an associated support system within machine 118 .
- flow chart 1500 also includes a second notification function block 1518 that is coupled in electronic data communication with logic block 1514 and is configured to receive the discrete “no” signal transmitted from logic block 1514 .
- Function block 1518 is also configured to notify an operator that the PD data being evaluated indicates potential PD damage in stator bars at gradings or at slot exit regions within machine 118 .
- the above-described method and apparatus for analyzing electrical insulation of an electrical machine are cost-effective and highly reliable.
- the analyzer system receives process parameter information from plant sensors through a data acquisition system and partial discharge information that includes both partial discharge pluses and noise.
- the analyzer system separates the noise pulses from the partial discharge pulses and classifies the partial discharge pulses using the characteristics of each pulse. Similar pulse classes are evaluated using rules and/or a pulse model to determine a location and character of the partial discharge events. Data from a history of the electrical machine and/or other similar machines in a fleet of machines is used to facilitate the determination.
- the received process parameter information and partial discharge information are stored in a database for later analysis and/or processing. Such analysis and/or processing results are executed automatically and are generated substantially close to a present time, or in real-time.
Abstract
Description
Q max Avg(mV)=−0.0015*x 3+0.1894*x 2−8.2371*x+137.14 (1)
wherein x is a variable representing hydrogen pressure measured at the time of PD data collection in units of kilopascal (kPa) and/or pounds per square inch (psi).
Q max Max(mV)=−0.0115*x 3+1.3731*x 2−56.366*x+808.71 (2)
wherein, again, x is a variable representing hydrogen pressure measured at the time of PD data collection in units of kilopascal (kPa) and/or pounds per square inch (psi).
Q max abc(mV)=−K 1 *x 3 +K 2 *x 2 −K 3 *x+K 4 (3)
wherein the subscript “abc” is a variable for Ave, Max, 25%, 50%, 75%, 90% and 95%, x is a variable representing hydrogen pressure measured at the time of PD data collection in units of kilopascal (kPa) and/or pounds per square inch (psi), and K1 through K4 represent a set of constants uniquely determined for each of PTF1 through PTF28. In general, the values for Qmax represented in mV tend to increase in value from lowest to greatest values in order of 25%, 50%, Ave, 75%, 90%, 95%, and Max.
Q max(now)/Q max(six months ago)=Ratio of change of Q max data (4)
Wherein algorithm (4) is resident within
Claims (19)
Priority Applications (2)
| Application Number | Priority Date | Filing Date | Title |
|---|---|---|---|
| US11/935,956 US7676333B2 (en) | 2007-11-06 | 2007-11-06 | Method and apparatus for analyzing partial discharges in electrical devices |
| ITMI2008A001752A IT1391118B1 (en) | 2007-11-06 | 2008-10-01 | PROCEDURE AND EQUIPMENT FOR ANALYZING PARTIAL DISCHARGES IN ELECTRICAL DEVICES |
Applications Claiming Priority (1)
| Application Number | Priority Date | Filing Date | Title |
|---|---|---|---|
| US11/935,956 US7676333B2 (en) | 2007-11-06 | 2007-11-06 | Method and apparatus for analyzing partial discharges in electrical devices |
Publications (2)
| Publication Number | Publication Date |
|---|---|
| US20090119035A1 US20090119035A1 (en) | 2009-05-07 |
| US7676333B2 true US7676333B2 (en) | 2010-03-09 |
Family
ID=40589054
Family Applications (1)
| Application Number | Title | Priority Date | Filing Date |
|---|---|---|---|
| US11/935,956 Active 2028-01-22 US7676333B2 (en) | 2007-11-06 | 2007-11-06 | Method and apparatus for analyzing partial discharges in electrical devices |
Country Status (2)
| Country | Link |
|---|---|
| US (1) | US7676333B2 (en) |
| IT (1) | IT1391118B1 (en) |
Cited By (27)
| Publication number | Priority date | Publication date | Assignee | Title |
|---|---|---|---|---|
| US20110203276A1 (en) * | 2008-09-18 | 2011-08-25 | Boehringer Ingelheim International Gmbh | Method And Device For Tracking The Degradation Of Insulators In A Rotary Machine |
| US20110248721A1 (en) * | 2008-08-06 | 2011-10-13 | Eskom Holdings Limited | Partial discharge monitoring method and system |
| CN103389664A (en) * | 2013-07-11 | 2013-11-13 | 马友亮 | Intelligent electric motor protection and control device |
| US20140012523A1 (en) * | 2012-07-06 | 2014-01-09 | Hyundai Heavy Industries Co., Ltd. | Preventive diagnostic system for gis based on iec 61850 |
| US8779928B2 (en) | 2012-05-03 | 2014-07-15 | General Electric Company | Systems and methods to detect generator collector flashover |
| CN103954894A (en) * | 2014-05-12 | 2014-07-30 | 国家电网公司 | Partial discharge locating method for three-phase crossed and interconnected cables |
| US20140340096A1 (en) * | 2011-09-16 | 2014-11-20 | Olaf Rudolph | Method for Identifying One or More Simultaneously Occurring Partial Discharge Sources |
| RU2610823C1 (en) * | 2015-12-30 | 2017-02-15 | Частное образовательное учреждение высшего образования "Дальневосточный институт коммуникаций" (ЧОУВО "ДВИК") | Method of inspecting technical state of electric power generating equipment |
| US20170045596A1 (en) * | 2015-08-13 | 2017-02-16 | Prodrive Technologies B.V. | Electric power converter and mri system comprising such converter |
| US9689909B2 (en) | 2012-01-11 | 2017-06-27 | Cablewise Techimp Limited | System for analyzing and locating partial discharges |
| US9753080B2 (en) | 2014-12-09 | 2017-09-05 | Rosemount Inc. | Partial discharge detection system |
| US20170356945A1 (en) * | 2016-06-14 | 2017-12-14 | Lsis Co., Ltd. | Diagnostic system for electric power equipment |
| US20180241394A1 (en) * | 2015-08-13 | 2018-08-23 | Iee International Electronics & Engineering S.A. | Method of operating a capacitive sensor system for vehicle trunk opener and robust capacitive sensor system |
| US20180238716A1 (en) * | 2017-02-09 | 2018-08-23 | The University Of British Columbia | Capacitive bending sensors |
| US20180356458A1 (en) * | 2016-01-28 | 2018-12-13 | Samsung Electronics Co., Ltd. | Short circuit detecting device of stacked memory chips and method thereof |
| US20190257874A1 (en) * | 2017-09-21 | 2019-08-22 | Chengdu Boe Optoelectronics Technology Co., Ltd. | Printed circuit board, method for determining engagement state between printed circuit board and flexible printed circuit and display device |
| US10794736B2 (en) | 2018-03-15 | 2020-10-06 | Rosemount Inc. | Elimination of floating potential when mounting wireless sensors to insulated conductors |
| US10833531B2 (en) | 2018-10-02 | 2020-11-10 | Rosemount Inc. | Electric power generation or distribution asset monitoring |
| US10955477B2 (en) * | 2018-06-29 | 2021-03-23 | Hamilton Sundstrand Corporation | Power distribution health management and monitoring |
| US10969425B2 (en) * | 2018-07-25 | 2021-04-06 | Mitsubishi Electric Corporation | Semiconductor integrated circuit and rotation detection device |
| US11067639B2 (en) | 2017-11-03 | 2021-07-20 | Rosemount Inc. | Trending functions for predicting the health of electric power assets |
| US11181570B2 (en) | 2018-06-15 | 2021-11-23 | Rosemount Inc. | Partial discharge synthesizer |
| US11237200B2 (en) * | 2017-06-14 | 2022-02-01 | Mitsubishi Electric Corporation | Aging degradation diagnosis apparatus and aging degradation diagnosis method |
| US11313895B2 (en) | 2019-09-24 | 2022-04-26 | Rosemount Inc. | Antenna connectivity with shielded twisted pair cable |
| WO2022152339A1 (en) | 2021-01-18 | 2022-07-21 | Modemtec S.R.O. | Signal extraction method and device for its implementation |
| US11448682B2 (en) | 2017-03-02 | 2022-09-20 | Rosemount Inc. | Trending functions for partial discharge |
| US20220326293A1 (en) * | 2019-09-19 | 2022-10-13 | Siemens Aktiengesellschaft | Detection of a partial discharge |
Families Citing this family (32)
| Publication number | Priority date | Publication date | Assignee | Title |
|---|---|---|---|---|
| CN104614639B (en) * | 2010-03-05 | 2018-02-06 | 瑞典爱立信有限公司 | Assess the noise and excessively stream on power line |
| EP2579056A4 (en) * | 2010-05-31 | 2017-12-13 | Universidad Politécnica De Madrid (UPM) | Novel method for real time tests and diagnosis of the sources of partial discharge in high voltage equipment and installations, which are in service or not in service, and physical system for the practical use of the method |
| EP2395364A1 (en) * | 2010-06-14 | 2011-12-14 | Alstom Technology Ltd | Method for detecting the partial discharges generated in an electric system and electric system with a device for detecting the partial discharges generated therein |
| FR2961602B1 (en) | 2010-06-16 | 2015-06-05 | Areva T & D Sas | METHOD FOR LOCATING PARTIAL DISCHARGE TRANSMIT ZONE AND DEVICE THEREOF |
| US10209290B2 (en) * | 2010-12-30 | 2019-02-19 | Prysmian S.P.A. | Locating of partial-discharge-generating faults |
| US20130073231A1 (en) * | 2011-04-29 | 2013-03-21 | Utilx Corporation | In-situ data acquisition systems and methods |
| US9075115B2 (en) * | 2011-08-31 | 2015-07-07 | General Electric Company | Systems and methods for monitoring the health of an electrical system |
| GB201116088D0 (en) * | 2011-09-16 | 2011-11-02 | High Voltage Partial Discharge Ltd | Method and apparatus for measuring partial discharge |
| FR2980275B1 (en) | 2011-09-20 | 2014-07-04 | Alstom Grid Sas | METHOD FOR LOCATING AN EVENT EMITTING A SIGNAL |
| FR2987900B1 (en) * | 2012-03-09 | 2015-07-31 | Alstom Technology Ltd | METHOD FOR RECOGNIZING PARTIAL DISCHARGES ISSUED INSIDE AND OUTSIDE AN ELECTRICAL APPARATUS |
| JP5975333B2 (en) * | 2012-09-05 | 2016-08-23 | 国立大学法人九州工業大学 | Electromagnetic wave identification method and identification device |
| DE102013224573B3 (en) * | 2013-11-29 | 2014-10-02 | Hagenuk KMT Kabelmeßtechnik GmbH | Method and device for locating partial discharges in electrical cables |
| CN104267298B (en) * | 2014-10-23 | 2017-11-24 | 上海华群实业股份有限公司 | A kind of calculation method of parameters of double winding power transformer |
| WO2016151571A2 (en) * | 2015-03-25 | 2016-09-29 | Pdp-Technologies Ltd. | System for mapping electromagnetic discharge fields |
| WO2016151572A1 (en) * | 2015-03-25 | 2016-09-29 | Pdp-Technologies Ltd | System for detecting electromagnetic discharge fields |
| US9690648B2 (en) * | 2015-10-30 | 2017-06-27 | Netapp, Inc. | At-risk system reports delivery at site |
| US11245593B2 (en) * | 2016-04-25 | 2022-02-08 | Vmware, Inc. | Frequency-domain analysis of data-center operational and performance metrics |
| CN106156863A (en) * | 2016-07-06 | 2016-11-23 | 河北箱变电器有限公司 | A kind of power equipment real-time servicing system |
| US10928436B2 (en) * | 2017-01-30 | 2021-02-23 | General Electric Company | Evaluation of phase-resolved partial discharge |
| JP6821495B2 (en) * | 2017-04-26 | 2021-01-27 | 株式会社日立パワーソリューションズ | Partial discharge measurement system and partial discharge measurement method |
| KR20200135428A (en) * | 2018-03-20 | 2020-12-02 | 위스커 랩스 인코포레이티드 | Detection of electrical discharges preceding fires in electrical wiring |
| CN108776285A (en) * | 2018-05-03 | 2018-11-09 | 北京华电中试电力工程有限责任公司 | A kind of GIS online test methods |
| EP3588108B1 (en) * | 2018-06-29 | 2022-09-14 | ABB Schweiz AG | Method and device for use of multiple frequencies prpd pattern to reduce noise or select suitable frequency ranges for partial discharge measurements |
| CN109596911B (en) * | 2018-11-19 | 2021-05-18 | 中国科学院新疆天文台 | Control method for electromagnetic compatibility of radio astronomical site |
| CN110286302B (en) * | 2019-06-26 | 2021-08-17 | 全球能源互联网欧洲研究院 | Detection method and detection system for partial discharge signal |
| FR3101154B1 (en) * | 2019-09-25 | 2021-08-20 | Schneider Electric Ind Sas | Partial discharge monitoring system in electrical equipment via gaseous emissions |
| CN110793664B (en) * | 2019-11-01 | 2021-07-23 | 山东电工电气集团有限公司 | Installation and arrangement method of multi-parameter sensing transformer optical fiber sensor |
| CN111721834B (en) * | 2020-06-22 | 2023-08-08 | 南京南瑞继保电气有限公司 | Cable partial discharge on-line monitoring defect identification method |
| JP7443269B2 (en) * | 2021-01-08 | 2024-03-05 | 株式会社東芝 | Insulation diagnosis system and insulation diagnosis method |
| KR102621378B1 (en) * | 2021-07-06 | 2024-01-08 | 한국전력공사 | System and method for diagnosing partial discharge of high voltage direct current cable |
| CN114325274B (en) * | 2022-01-10 | 2023-06-27 | 西南交通大学 | Converter transformer valve side sleeve partial discharge detection system and method |
| CN115494359B (en) * | 2022-09-30 | 2023-04-07 | 上海格鲁布科技有限公司 | Partial discharge detection equipment for insulated circuit breaker |
Citations (16)
| Publication number | Priority date | Publication date | Assignee | Title |
|---|---|---|---|---|
| US5256976A (en) | 1990-03-09 | 1993-10-26 | Hitachi, Ltd. | Power apparatus and method of location of a fault in a power apparatus on the basis of attenuation coefficients of electromagnetic coefficients of fault generated electromagnetic waves |
| US5475312A (en) | 1994-06-07 | 1995-12-12 | Iris Power Engineering Inc. | Method and device for distinguishing between partial discharge and electrical noise |
| US5506511A (en) | 1994-09-09 | 1996-04-09 | Electric Power Research Institute Inc. | Method of electrically detecting on-site partial discharges in the insulating medium of an electrical power transformer and apparatus therefor |
| US5680059A (en) | 1994-02-25 | 1997-10-21 | The Kansai Electric Power Co., Inc. | Abnormality detecting method and apparatus for electric equipment, particularly for a rotating electric machine |
| US5982181A (en) | 1996-12-09 | 1999-11-09 | Hitachi, Ltd. | Insulated device diagnosing system for diagnosing device based upon partial discharge signal data analyzed by frequency |
| US6088658A (en) | 1997-04-11 | 2000-07-11 | General Electric Company | Statistical pattern analysis methods of partial discharge measurements in high voltage insulation |
| US6300768B1 (en) | 1999-01-28 | 2001-10-09 | Hitachi, Ltd. | Method of diagnosing partial discharge in gas-insulated apparatus and partial discharge diagnosing system for carrying out the same |
| US6313640B1 (en) | 1998-02-03 | 2001-11-06 | Abb Power T & D Company, Inc. | System and method for diagnosing and measuring partial discharge |
| US6445189B1 (en) | 1999-10-19 | 2002-09-03 | Abb Substation Automation Oy | Method and system for identifying cause of partial discharges |
| US6448782B1 (en) | 1999-10-19 | 2002-09-10 | Abb Substation Automation Oy | Arrangement and method for defining the location of source of partial discharges |
| US6469515B2 (en) | 2000-03-20 | 2002-10-22 | Siemens Aktiengesellschaft | Method for determining sources of interference |
| US6507181B1 (en) | 1999-10-19 | 2003-01-14 | Abb Substation Automation Oy | Arrangement and method for finding out the number of sources of partial discharges |
| US6809523B1 (en) | 1998-10-16 | 2004-10-26 | The Detroit Edison Company | On-line detection of partial discharge in electrical power systems |
| US20070063709A1 (en) | 2005-09-20 | 2007-03-22 | General Electric Company | Systems and methods for triggering a partial discharge acquisition |
| WO2007093861A2 (en) | 2006-02-17 | 2007-08-23 | Techimp Technologies S.A. | Method and apparatus for evaluating the level of superficial pollution of a medium/high voltage outdoor insulator |
| US20080088314A1 (en) * | 2006-10-13 | 2008-04-17 | Abdelkrim Younsi | Methods and apparatus for analyzing partial discharge in electrical machinery |
-
2007
- 2007-11-06 US US11/935,956 patent/US7676333B2/en active Active
-
2008
- 2008-10-01 IT ITMI2008A001752A patent/IT1391118B1/en active
Patent Citations (22)
| Publication number | Priority date | Publication date | Assignee | Title |
|---|---|---|---|---|
| US5256976A (en) | 1990-03-09 | 1993-10-26 | Hitachi, Ltd. | Power apparatus and method of location of a fault in a power apparatus on the basis of attenuation coefficients of electromagnetic coefficients of fault generated electromagnetic waves |
| US6114871A (en) | 1994-02-25 | 2000-09-05 | Mitsubishi Denki Kabushiki Kaisha | Abnormality detecting method and apparatus for electrical equipment, particularly for a rotating electric machine |
| US5680059A (en) | 1994-02-25 | 1997-10-21 | The Kansai Electric Power Co., Inc. | Abnormality detecting method and apparatus for electric equipment, particularly for a rotating electric machine |
| US5828227A (en) | 1994-02-25 | 1998-10-27 | The Kansai Electric Power Co., Inc. | Abnormality detecting apparatus for electric equipment, particularly for a rotating electric machine |
| US5475312A (en) | 1994-06-07 | 1995-12-12 | Iris Power Engineering Inc. | Method and device for distinguishing between partial discharge and electrical noise |
| US5506511A (en) | 1994-09-09 | 1996-04-09 | Electric Power Research Institute Inc. | Method of electrically detecting on-site partial discharges in the insulating medium of an electrical power transformer and apparatus therefor |
| US20020163344A1 (en) | 1996-12-09 | 2002-11-07 | Hitachi, Ltd. | Insulated device diagnosing system and partial discharge detecting method |
| US5982181A (en) | 1996-12-09 | 1999-11-09 | Hitachi, Ltd. | Insulated device diagnosing system for diagnosing device based upon partial discharge signal data analyzed by frequency |
| US6424162B1 (en) | 1996-12-09 | 2002-07-23 | Hitachi, Ltd. | Insulated device diagnosing system that prepares detection data from partial discharge signal such that periodic elements are given to different specific frequencies of the partial discharge signal |
| US6192317B1 (en) | 1997-04-11 | 2001-02-20 | General Electric Company | Statistical pattern analysis methods of partial discharge measurements in high voltage insulation |
| US6088658A (en) | 1997-04-11 | 2000-07-11 | General Electric Company | Statistical pattern analysis methods of partial discharge measurements in high voltage insulation |
| US6313640B1 (en) | 1998-02-03 | 2001-11-06 | Abb Power T & D Company, Inc. | System and method for diagnosing and measuring partial discharge |
| US6809523B1 (en) | 1998-10-16 | 2004-10-26 | The Detroit Edison Company | On-line detection of partial discharge in electrical power systems |
| US6483316B2 (en) | 1999-01-28 | 2002-11-19 | Hitachi, Ltd. | Method of diagnosing partial discharge in gas-insulated apparatus and partial discharge diagnosing system for carrying out the same |
| US6300768B1 (en) | 1999-01-28 | 2001-10-09 | Hitachi, Ltd. | Method of diagnosing partial discharge in gas-insulated apparatus and partial discharge diagnosing system for carrying out the same |
| US6448782B1 (en) | 1999-10-19 | 2002-09-10 | Abb Substation Automation Oy | Arrangement and method for defining the location of source of partial discharges |
| US6445189B1 (en) | 1999-10-19 | 2002-09-03 | Abb Substation Automation Oy | Method and system for identifying cause of partial discharges |
| US6507181B1 (en) | 1999-10-19 | 2003-01-14 | Abb Substation Automation Oy | Arrangement and method for finding out the number of sources of partial discharges |
| US6469515B2 (en) | 2000-03-20 | 2002-10-22 | Siemens Aktiengesellschaft | Method for determining sources of interference |
| US20070063709A1 (en) | 2005-09-20 | 2007-03-22 | General Electric Company | Systems and methods for triggering a partial discharge acquisition |
| WO2007093861A2 (en) | 2006-02-17 | 2007-08-23 | Techimp Technologies S.A. | Method and apparatus for evaluating the level of superficial pollution of a medium/high voltage outdoor insulator |
| US20080088314A1 (en) * | 2006-10-13 | 2008-04-17 | Abdelkrim Younsi | Methods and apparatus for analyzing partial discharge in electrical machinery |
Cited By (40)
| Publication number | Priority date | Publication date | Assignee | Title |
|---|---|---|---|---|
| US20110248721A1 (en) * | 2008-08-06 | 2011-10-13 | Eskom Holdings Limited | Partial discharge monitoring method and system |
| US9229042B2 (en) * | 2008-08-06 | 2016-01-05 | Eskom Holdings Soc Limited | Partial discharge monitoring method and system |
| US20110203276A1 (en) * | 2008-09-18 | 2011-08-25 | Boehringer Ingelheim International Gmbh | Method And Device For Tracking The Degradation Of Insulators In A Rotary Machine |
| US8766645B2 (en) * | 2008-09-18 | 2014-07-01 | L'air Liquide, Societe Anonyme Pour L'etude Et L'exploitation Des Procedes Georges Claude | Method and device for tracking the degradation of insulators in a rotary machine |
| US9835674B2 (en) * | 2011-09-16 | 2017-12-05 | Olaf Rudolph | Method for identifying one or more simultaneously occurring partial discharge sources |
| US20140340096A1 (en) * | 2011-09-16 | 2014-11-20 | Olaf Rudolph | Method for Identifying One or More Simultaneously Occurring Partial Discharge Sources |
| US9689909B2 (en) | 2012-01-11 | 2017-06-27 | Cablewise Techimp Limited | System for analyzing and locating partial discharges |
| US8779928B2 (en) | 2012-05-03 | 2014-07-15 | General Electric Company | Systems and methods to detect generator collector flashover |
| US9448286B2 (en) * | 2012-07-06 | 2016-09-20 | Hyundai Heavy Industries Co., Ltd. | Preventive diagnostic system for GIS based on IEC 61850 |
| US20140012523A1 (en) * | 2012-07-06 | 2014-01-09 | Hyundai Heavy Industries Co., Ltd. | Preventive diagnostic system for gis based on iec 61850 |
| CN103389664B (en) * | 2013-07-11 | 2015-07-01 | 马友亮 | Intelligent electric motor protection and control device |
| CN103389664A (en) * | 2013-07-11 | 2013-11-13 | 马友亮 | Intelligent electric motor protection and control device |
| CN103954894A (en) * | 2014-05-12 | 2014-07-30 | 国家电网公司 | Partial discharge locating method for three-phase crossed and interconnected cables |
| US9753080B2 (en) | 2014-12-09 | 2017-09-05 | Rosemount Inc. | Partial discharge detection system |
| US20170045596A1 (en) * | 2015-08-13 | 2017-02-16 | Prodrive Technologies B.V. | Electric power converter and mri system comprising such converter |
| US20180241394A1 (en) * | 2015-08-13 | 2018-08-23 | Iee International Electronics & Engineering S.A. | Method of operating a capacitive sensor system for vehicle trunk opener and robust capacitive sensor system |
| US10234519B2 (en) * | 2015-08-13 | 2019-03-19 | Prodrive Technologies B.V. | Electric power converter and MRI system comprising such converter |
| RU2610823C1 (en) * | 2015-12-30 | 2017-02-15 | Частное образовательное учреждение высшего образования "Дальневосточный институт коммуникаций" (ЧОУВО "ДВИК") | Method of inspecting technical state of electric power generating equipment |
| US20180356458A1 (en) * | 2016-01-28 | 2018-12-13 | Samsung Electronics Co., Ltd. | Short circuit detecting device of stacked memory chips and method thereof |
| US10509070B2 (en) * | 2016-01-28 | 2019-12-17 | Samsung Electronics Co., Ltd. | Short circuit detecting device of stacked memory chips and method thereof |
| CN107505540A (en) * | 2016-06-14 | 2017-12-22 | Ls 产电株式会社 | Diagnostic system for power equipment |
| US20170356945A1 (en) * | 2016-06-14 | 2017-12-14 | Lsis Co., Ltd. | Diagnostic system for electric power equipment |
| CN107505540B (en) * | 2016-06-14 | 2019-12-27 | Ls 产电株式会社 | Diagnostic system for electrical equipment |
| US10571504B2 (en) * | 2016-06-14 | 2020-02-25 | Lsis Co., Ltd. | Diagnostic system for electric power equipment |
| US20180238716A1 (en) * | 2017-02-09 | 2018-08-23 | The University Of British Columbia | Capacitive bending sensors |
| US10670429B2 (en) * | 2017-02-09 | 2020-06-02 | The University Of British Columbia | Capacitive bending sensors |
| US11448682B2 (en) | 2017-03-02 | 2022-09-20 | Rosemount Inc. | Trending functions for partial discharge |
| US11237200B2 (en) * | 2017-06-14 | 2022-02-01 | Mitsubishi Electric Corporation | Aging degradation diagnosis apparatus and aging degradation diagnosis method |
| US10884075B2 (en) * | 2017-09-21 | 2021-01-05 | Chengdu Boe Optoelectronics Technology Co., Ltd. | Printed circuit board, method for determining engagement state between printed circuit board and flexible printed circuit and display device |
| US20190257874A1 (en) * | 2017-09-21 | 2019-08-22 | Chengdu Boe Optoelectronics Technology Co., Ltd. | Printed circuit board, method for determining engagement state between printed circuit board and flexible printed circuit and display device |
| US11067639B2 (en) | 2017-11-03 | 2021-07-20 | Rosemount Inc. | Trending functions for predicting the health of electric power assets |
| US10794736B2 (en) | 2018-03-15 | 2020-10-06 | Rosemount Inc. | Elimination of floating potential when mounting wireless sensors to insulated conductors |
| US11181570B2 (en) | 2018-06-15 | 2021-11-23 | Rosemount Inc. | Partial discharge synthesizer |
| US10955477B2 (en) * | 2018-06-29 | 2021-03-23 | Hamilton Sundstrand Corporation | Power distribution health management and monitoring |
| US10969425B2 (en) * | 2018-07-25 | 2021-04-06 | Mitsubishi Electric Corporation | Semiconductor integrated circuit and rotation detection device |
| US10833531B2 (en) | 2018-10-02 | 2020-11-10 | Rosemount Inc. | Electric power generation or distribution asset monitoring |
| US20220326293A1 (en) * | 2019-09-19 | 2022-10-13 | Siemens Aktiengesellschaft | Detection of a partial discharge |
| US11579181B2 (en) * | 2019-09-19 | 2023-02-14 | Siemens Aktiengesellschaft | Detection of a partial discharge |
| US11313895B2 (en) | 2019-09-24 | 2022-04-26 | Rosemount Inc. | Antenna connectivity with shielded twisted pair cable |
| WO2022152339A1 (en) | 2021-01-18 | 2022-07-21 | Modemtec S.R.O. | Signal extraction method and device for its implementation |
Also Published As
| Publication number | Publication date |
|---|---|
| IT1391118B1 (en) | 2011-11-18 |
| US20090119035A1 (en) | 2009-05-07 |
| ITMI20081752A1 (en) | 2009-05-07 |
Similar Documents
| Publication | Publication Date | Title |
|---|---|---|
| US7676333B2 (en) | Method and apparatus for analyzing partial discharges in electrical devices | |
| US7579843B2 (en) | Methods and apparatus for analyzing partial discharge in electrical machinery | |
| Montanari et al. | Partial discharge diagnostics: from apparatus monitoring to smart grid assessment | |
| James et al. | Development of computer-based measurements and their application to PD pattern analysis | |
| US9689909B2 (en) | System for analyzing and locating partial discharges | |
| CN109029959B (en) | Method for detecting mechanical state of transformer winding | |
| US20150120218A1 (en) | Novel method for real time tests and diagnosis of partial discharge sources in high voltage equipment and installations, which are in service or out of service, and physical system for the practical use of the method | |
| JP2000512766A (en) | Statistical pattern analysis method for partial discharge measurement in high voltage insulation | |
| Aschenbrenner et al. | On line PD measurements and diagnosis on power transformers | |
| Hussain et al. | The smart solution for the prediction of slowly developing electrical faults in MV switchgear using partial discharge measurements | |
| Liu et al. | Prognosis of underground cable via online data-driven method with field data | |
| GB2518966A (en) | Diagnostic method for automatic discrimination of phase-to-ground partial discharge, phase-to-phase partial discharge and electromagnetic noise | |
| Wang et al. | Reflectometry-based cable insulation aging diagnosis and prognosis | |
| Zhao et al. | Experimental evaluation of detecting power transformer internal faults using FRA polar plot and texture analysis | |
| Huecker et al. | UHF partial discharge monitoring and expert system diagnosis | |
| Govindarajan et al. | A review on partial discharge diagnosis in cables: Theory, techniques, and trends | |
| Shahid et al. | Novel health diagnostics schemes analyzing corona discharge of operational aerial bundled cables in coastal regions | |
| Firuzi et al. | A hybrid transformer PD monitoring method using simultaneous IEC60270 and RF data | |
| Hussain et al. | Review on Partial Discharge Diagnostic Techniques for High Voltage Equipment in Power Systems | |
| Taki et al. | Soft fault diagnosis in wiring networks using reflectometry and Principal Component Analysis | |
| Rodríguez-Serna et al. | Partial discharges measurements for condition monitoring and diagnosis of power transformers: a review | |
| Binotto et al. | Partial discharge detection of transformer bushing based on acoustic emission and current analysis | |
| Kumar et al. | Classification of PD faults using features extraction and K-means clustering techniques | |
| Nelson et al. | A field assessment of PD and EMI methodology applied to large utility generators | |
| Lévesque et al. | The need for PD quantification based on the type of discharge sources |
Legal Events
| Date | Code | Title | Description |
|---|---|---|---|
| AS | Assignment |
Owner name: GENERAL ELECTRIC COMPANY, NEW YORK Free format text: ASSIGNMENT OF ASSIGNORS INTEREST;ASSIGNORS:YOUNSI, ABDELKRIM;SALEM, SAMEH RAMADAN;YAN, WEIZHONG;AND OTHERS;REEL/FRAME:020076/0050;SIGNING DATES FROM 20071018 TO 20071105 Owner name: GENERAL ELECTRIC COMPANY,NEW YORK Free format text: ASSIGNMENT OF ASSIGNORS INTEREST;ASSIGNORS:YOUNSI, ABDELKRIM;SALEM, SAMEH RAMADAN;YAN, WEIZHONG;AND OTHERS;SIGNING DATES FROM 20071018 TO 20071105;REEL/FRAME:020076/0050 |
|
| FEPP | Fee payment procedure |
Free format text: PAYOR NUMBER ASSIGNED (ORIGINAL EVENT CODE: ASPN); ENTITY STATUS OF PATENT OWNER: LARGE ENTITY |
|
| STCF | Information on status: patent grant |
Free format text: PATENTED CASE |
|
| FPAY | Fee payment |
Year of fee payment: 4 |
|
| MAFP | Maintenance fee payment |
Free format text: PAYMENT OF MAINTENANCE FEE, 8TH YEAR, LARGE ENTITY (ORIGINAL EVENT CODE: M1552) Year of fee payment: 8 |
|
| MAFP | Maintenance fee payment |
Free format text: PAYMENT OF MAINTENANCE FEE, 12TH YEAR, LARGE ENTITY (ORIGINAL EVENT CODE: M1553); ENTITY STATUS OF PATENT OWNER: LARGE ENTITY Year of fee payment: 12 |
|
| AS | Assignment |
Owner name: GE INFRASTRUCTURE TECHNOLOGY LLC, SOUTH CAROLINA Free format text: ASSIGNMENT OF ASSIGNORS INTEREST;ASSIGNOR:GENERAL ELECTRIC COMPANY;REEL/FRAME:065727/0001 Effective date: 20231110 |