US7791329B2 - Vector/signal analyzer equalization apparatus and method - Google Patents
Vector/signal analyzer equalization apparatus and method Download PDFInfo
- Publication number
- US7791329B2 US7791329B2 US11/944,076 US94407607A US7791329B2 US 7791329 B2 US7791329 B2 US 7791329B2 US 94407607 A US94407607 A US 94407607A US 7791329 B2 US7791329 B2 US 7791329B2
- Authority
- US
- United States
- Prior art keywords
- frequency
- signal
- analyzer
- test signal
- bursts
- Prior art date
- Legal status (The legal status is an assumption and is not a legal conclusion. Google has not performed a legal analysis and makes no representation as to the accuracy of the status listed.)
- Expired - Fee Related, expires
Links
- 238000000034 method Methods 0.000 title claims abstract description 26
- 238000012360 testing method Methods 0.000 claims abstract description 95
- 230000001143 conditioned effect Effects 0.000 claims abstract description 26
- 238000005259 measurement Methods 0.000 claims description 67
- 238000004364 calculation method Methods 0.000 claims description 10
- 230000008859 change Effects 0.000 claims description 7
- 230000007704 transition Effects 0.000 claims description 7
- 239000000969 carrier Substances 0.000 claims description 4
- 230000004044 response Effects 0.000 claims description 4
- 230000001360 synchronised effect Effects 0.000 claims description 3
- 239000012190 activator Substances 0.000 claims 1
- 238000010586 diagram Methods 0.000 description 8
- 238000006243 chemical reaction Methods 0.000 description 5
- 238000013459 approach Methods 0.000 description 2
- 230000003750 conditioning effect Effects 0.000 description 2
- 238000001514 detection method Methods 0.000 description 2
- 230000000694 effects Effects 0.000 description 2
- 238000012986 modification Methods 0.000 description 2
- 230000004048 modification Effects 0.000 description 2
- 230000006855 networking Effects 0.000 description 2
- 230000010363 phase shift Effects 0.000 description 2
- 230000008569 process Effects 0.000 description 2
- 238000001228 spectrum Methods 0.000 description 2
- 238000004891 communication Methods 0.000 description 1
- 238000004590 computer program Methods 0.000 description 1
- 238000012937 correction Methods 0.000 description 1
- 230000008030 elimination Effects 0.000 description 1
- 238000003379 elimination reaction Methods 0.000 description 1
- 230000006870 function Effects 0.000 description 1
- 230000008054 signal transmission Effects 0.000 description 1
- 230000009466 transformation Effects 0.000 description 1
Images


Classifications
-
- G—PHYSICS
- G01—MEASURING; TESTING
- G01R—MEASURING ELECTRIC VARIABLES; MEASURING MAGNETIC VARIABLES
- G01R35/00—Testing or calibrating of apparatus covered by the other groups of this subclass
-
- G—PHYSICS
- G01—MEASURING; TESTING
- G01R—MEASURING ELECTRIC VARIABLES; MEASURING MAGNETIC VARIABLES
- G01R27/00—Arrangements for measuring resistance, reactance, impedance, or electric characteristics derived therefrom
- G01R27/28—Measuring attenuation, gain, phase shift or derived characteristics of electric four pole networks, i.e. two-port networks; Measuring transient response
Definitions
- the present disclosure relates to the correction of the frequency response and especially of the phase frequency distortions in the vector/signal analyzers or in the similar devices, where the input and output signals are in different frequency ranges.
- Wireless networking systems have become a prevalent means in the communication industry. In such systems it is very important to measure/analyze with a high degree of accuracy the various properties of a transmitted/received modulation signal. Therefore a large and perpetually increasing demand exists for high precision RF vector/signal analyzers.
- FIG. 1 A typical block diagram of a vector/signal analyzer is shown in FIG. 1 .
- the input signal is conditioned by down converter 100 and analog to digital converter (ADC) 101 .
- the down converter 100 transfers the part of the input signal spectrum to be analyzed to the operational frequency range of the ADC 101 .
- the ADC 101 transforms incoming continuous signal into a sequence of digital samples.
- a processor 102 carries out the necessary analysis of the properties of the processed signal with the presentation of the received results at the display 103 .
- a conventional down converter contains usually several conversion stages (three or four) with an appropriate selection of the local oscillators frequencies. At each conversion stage a filter is used to separate out the desired frequency components. These filters inevitably introduce frequency distortions in the processed signal. To achieve a high degree of measurement accuracy in a vector/signal analyzer it is necessary to compensate the frequency distortions that emerge in the down converter 100 .
- the known methods of frequency responses measurement are based on a comparison of the output signal of the device under test with the input signal or with a duplicate of the input signal. Such an approach can be used to find the amplitude frequency distortions in a vector/signal analyzer.
- the input and the output frequency ranges of the down converter 100 are different, it is impossible to compare the phases of sine wave components in the input signal and output signal: the difference between the phases varies in time continuously.
- the inventors have realized that frequency distortion of a signal, introduced by the conditioning (e.g. down-conversion and/or analog to digital conversion) of the signal in a vector/signal analyzer, can be measured and equalized using methods and apparatuses of the type disclosed herein. Such measurement and equalization can improve the performance of vector/signal analyzers used in, for example, wireless networking applications.
- conditioning e.g. down-conversion and/or analog to digital conversion
- a method of equalization of a vector/signal analyzer including: (a) providing a structured test signal within a selected frequency range, the structured test signal including a plurality of frequency components each having a respective amplitude and phase; (b) inputting the test signal to the analyzer; the analyzer operating to condition the test signal; (c) determining information representative of frequency distortion of the conditioned test signal introduced by the analyzer; (d) generating a set of equalization coefficients based on the information representative of the frequency distortion, the set of coefficients corresponding to the selected frequency range; and (e) storing the set of equalization coefficients and the correspondence of the set of coefficients to the selected frequency range; where the determining information representative of frequency distortion of the conditioned test signal introduced by the analyzer includes evaluating variations in the phases and amplitudes of the frequency components of the conditioned test signal.
- the analyzer includes a down-converter and an analog to digital converter, and operates to condition the test signal by transferring the test signal from the selected frequency range to the operating range of the analog to digital converter.
- the selected frequency range is within the input frequency range of the down converter.
- the determining information representative of frequency distortion includes determining information representative of frequency distortion introduced by the down-converter.
- Some embodiments include for each of a plurality of selected frequency ranges, repeating steps (a)-(e), where the plurality of frequency ranges substantially spans the input frequency range of the down-converter.
- Some embodiments include inputting a measurement signal to the analyzer, the analyzer operating to condition the measurement signal; retrieving one of the stored sets of coefficients, the one of the stored sets of coefficients corresponding to a selected frequency range; correcting, based on the retrieved set of coefficient, at least a portion of a frequency distortion introduced into the measurement signal by the analyzer.
- the test signal includes a sequence of N bursts, each burst consisting of three sinusoidal waves with defined frequencies and phases.
- each burst occurs over a time interval short enough that any change in phase introduced by carriers within the down-converter is the same for each of the sinusoidal waves.
- the structured test signal includes an initial zero interval
- the determining information representative of frequency distortion of the conditioned test signal introduced by the analyzer includes: identifying a time position of a transition from the initial zero interval to the sequence of bursts; based on the identified time position of the transition, generating time grid information representative of the time positions of bursts in the sequence.
- each of the bursts includes at least one additional type of reference sinusoidal wave.
- the bursts in the structured test signal are arranged in such a way that each measurement burst has in the immediate vicinity a reference burst with the frequency f L as well as a reference burst with the frequency f H .
- the sinusoidal waves are sine waves.
- determining information representative of frequency distortion includes determining information representative of phase distortion of the conditioned signal introduced by the down-converter.
- an apparatus for equalization of a vector/signal analyzer including: a test signal generator; a measurement unit; and a memory unit.
- the test signal generator is configured to provide a structured test signal within a selected frequency range, the test signal including a plurality of frequency components each having an amplitude and phase, and to input the test signal to the analyzer;
- the measurement unit is configured to: determine information representative of frequency distortion of the test signal introduced by the analyzer, where the determining includes evaluating the variations in the phases and amplitudes of the frequency components of the test signal; and generate a set of equalization coefficients based on the information representative of the frequency distortion, the set of coefficients corresponding to the selected frequency range;
- the memory unit is configured to store the at least one set of equalization coefficients and the correspondence of the at least one set of coefficients to the selected frequency range.
- the analyzer includes a down converter and an analog to digital converter, and operates to condition the test signal by transferring the test signal from the selected frequency range to the operating range of the analog to digital converter, the selected frequency range is within the input frequency range of the down converter, and the information representative of frequency distortion includes information representative of frequency distortion introduced by the down-converter.
- Some embodiments include a compensation unit.
- the compensation unit is configured to: receive a measurement signal, the measurement signal input to and conditioned by the analyzer, receive a set of coefficients from the memory unit, the set of coefficients corresponding to a frequency range which contains the frequency range of the measurement signal, and compensate at least a portion of the frequency distortions introduced to the conditioned measurement signal by the analyzer based on the set of coefficients.
- the compensation unit includes at least one linear filter.
- the test signal includes a sequence of bursts consisting of sinusoidal waves with respective frequencies and phases
- the measurement unit includes a time grid generator unit configured to determine time grid information representative of time locations of the bursts.
- the measurement unit includes a frequency distortion measurement unit configured to determine information representative of frequency distortion of the conditioned test signal introduced by the analyzer based on information representative of the structure of the conditioned test signal and on the time grid information.
- the measurement unit includes a distortions to coefficients transformer unit configured to receive the information representative of the frequency distortions of the conditioned test signal introduced by the analyzer from the frequency distortions measurement unit, generate the set of equalization coefficients based on the information related to the frequency distortions, and send the set of coefficients to the memory unit for storage.
- a distortions to coefficients transformer unit configured to receive the information representative of the frequency distortions of the conditioned test signal introduced by the analyzer from the frequency distortions measurement unit, generate the set of equalization coefficients based on the information related to the frequency distortions, and send the set of coefficients to the memory unit for storage.
- the bursts contain sinusoidal waves including in-phase and quadrature components.
- the frequency distortion measurement unit includes: a synchronous detector unit configured to determine information related to the amplitudes and phases of the in-phase and quadrature components of the sinusoidal waves; an amplitude and phase calculator unit configured to determine, for a plurality of bursts, information representative of the amplitude and phase of each sinusoidal wave based on the information representative of the amplitudes of the in-phase and quadrature components of the sinusoidal waves and on the time grid information; and a distortions calculator unit configured to calculate information representative of the frequency distortion of the conditioned signal introduced by the analyzer based on the information representative of the sinusoidal waves' amplitudes and phases for each of the plurality of bursts.
- each of the bursts comprise:
- Some embodiments include a switch configured to, in the calibration mode, direct the test signal to an input of the analyzer and, in the operational mode, direct the measurement signal to the input of the analyzer.
- the apparatus includes the analyzer.
- Various embodiments may include any of the above described features, either alone or in combination.
- FIG. 1 is a typical block diagram of a prior art vector/signal analyzer.
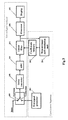
- FIG. 2 is a block diagram of a vector/signal analyzer according to the present invention.
- FIG. 2A is a representation of a test signal according to one embodiment of the present invention.
- FIG. 3 is a block diagram of a measurement and calculation unit according to the present invention.
- FIG. 4 is a block diagram of a phase and amplitude distortions measurer according to the present invention.
- FIG. 2 A block diagram of a basic embodiment of a vector/signal analyzer according to the present invention is shown at FIG. 2 .
- the vector/signal analyzer can work in one of two modes: a calibration mode or an operation mode.
- a calibration mode the switch 200 connects the input of the down converter 100 to the output of the test signal generator 202 .
- the switch 200 connects the input of the down converter 100 to the input of the vector/signal analyzer.
- the down converter 100 transfers the part of the input signal spectrum to the operational frequency range of the analog to digital converter (ADC) 101 .
- the ADC 101 transforms incoming continuous signal into a sequence of digital samples.
- the output of the ADC 101 is connected to the input of the linear filter 201 .
- the function of the linear filter 201 is to correct the frequency distortion that may emerge in the signal at the output of the ADC 101 .
- the operational features of the linear filter 201 are determined by the equalization coefficients that come to the linear filter 201 from the coefficients memory 203 .
- the processor 102 carries out the necessary analysis of the properties of the signal that comes from the linear filter 201 , with the presentation of the received results at the display 103 .
- the signal from the output of the linear filter 201 goes to the input of the measurement and calculation unit 204 as well.
- the measurement and calculation unit 204 performs the measurement of the frequency distortions in the input signal, calculates the change in the equalization coefficients that is necessary to correct the measured distortions and stores the changed coefficients into a coefficients memory 203 .
- the input signal of the vector/signal analyzer lies in the radio frequencies range (RF range, usually several GHz).
- the operational range of the analog to digital converter is in the intermediate frequencies range (IF range, usually about a hundred MHz). Since the input frequency range of the vector/signal analyzer is far in excess of the width of the operational range of the analog to digital converter, to receive a complete description of the distortions in the vector/signal analyzer the RF range is divided into chunks. The width of each chunk approximately equals the bandwidth of the IF range. The chunks together cover all the RF range of the vector/signal analyzer. The measurements in the calibration mode and the following calculations are repeated for each chunk. As a result a set of the equalization coefficients is obtained for each chunk, these coefficients being stored in the correspondent region of the coefficients memory.
- the input signal of the vector/signal analyzer is connected to the input of the down converter 100 .
- the parameters of the down converter 100 are set up accordingly to the RF range chunk that is occupied by the signal to be analyzed.
- the equalization coefficients located in the region of the coefficients memory 203 that corresponds to that chunk are loaded into the linear filter 201 .
- the transformation of the signal performed in the linear filter 201 corrects the frequency distortions that have emerged in the down converter.
- the test signal generator 202 produces a correspondent test signal for each chunk of the vector/signal analyzer RF input frequency range. There should be a part at the beginning of the test signal that makes it possible to detect the test signal start. It may be, for example, a short zero interval before the first burst.
- the test signal is a sequence of sine bursts.
- Each burst is a sum of at least three sine waves: (1) the measurement sine wave with a frequency f i , (2) the reference sine wave with a frequency f L that is close to the lowest frequency of the chunk and (3) the reference sine wave with a frequency f H that is close to the highest frequency of the chunk.
- the frequencies f i of the measurement sine waves cover the correspondent chunk.
- the number N of the measurement bursts frequencies f i is chosen to be big enough to provide a complete picture of all substantial details of the frequency distortions in one chunk. All the bursts have the same length and the same amplitude. The burst length should be long enough to get the measurement process stabilized and make it possible to exclude the burst border parts, where the transit from one burst to another causes phase fluctuations.
- the phase of a sine wave in each burst is fixed in relation to the burst borders.
- the test signal may be generated in such a way that the phase of each sine wave equals zero in the middle of the corresponding burst.
- the described structure of the test signal establishes a certain relationship between its components. This relationship makes it possible to find the phase distortions in the signal at the output of the analog to digital converter without comparing it to another signal.
- the number of reference sine waves in a test signal burst may be more than two, in some cases it elevates the distortions measurement accuracy.
- test signal as shown in FIG. 2A
- the test signal is composed with the use of three types of sine bursts: (1) the measurement bursts with frequencies f i , (2) the reference burst with a frequency f L , and (3) the reference burst with a frequency f H .
- the bursts in the test signal in that case should be arranged in such a way that each measurement burst has in the immediate vicinity a reference burst with the frequency f L , as well as a reference burst with the frequency f H .
- Such structure of the test signal permits to increase the sine waves amplitudes but it imposes more heavy demands on oscillator frequencies stability.
- FIG. 3 A block diagram of the measurement and calculation unit 204 according to the present invention is shown at FIG. 3 .
- the input of the unit is connected to the input of the time grid generator 302 and the input of the phase and amplitude distortions measurer 300 .
- the time grid generator 302 uses the transition from the initial zero interval to the first burst in the test signal to detect the test signal start. Since the length of different bursts is the same, the start detection makes it possible for the time grid generator 302 to generate a time grid that marks the borders of all bursts.
- the frequency distortions measurer 300 uses the time grid, received from the time grid generator 302 , while measuring the phase and the amplitude of each sine wave in the incoming burst with following calculation of the correspondent frequency distortions.
- the collection of the frequency distortions for different frequencies is transferred from the frequency distortions measurer 300 to the distortions to coefficients transformer 301 .
- the transformer 301 calculates the necessary change of the equalization coefficients, for example by the inverse discrete Fourier transform of the frequency distortions received from the measurer 300 .
- the new equalization coefficients are found as a convolution of the former equalization coefficients and the calculated necessary change.
- the new equalization coefficients are stored in the coefficients memory 203 , in the region that corresponds to the analyzed chunk of the vector/signal analyzer RF range.
- FIG. 4 A block diagram of the frequency distortions measurer 300 according to the present invention is shown at FIG. 4 .
- the synchronous detector 400 processes each burst of the test signal inside the borders designated by the time grid. It separates out the in-phase I and the quadrature Q components of each sine wave in the burst, the components being calculated in relation to the sine wave of the correspondent frequency with a zero phase in the middle of the burst. Then the values I and Q of the in-phase and the quadrature components are passed over to the amplitude and phase calculator 401 .
- the amplitude A and phase P are used to calculate the frequency distortions.
- the amplitude frequency distortions are calculated in the usual way by comparing the amplitudes of different sine waves in a burst.
- the calculation of the phase frequency distortions requires a more sophisticated approach.
- the frequency instability of local oscillators in the down converter 100 results in the permanent change of the carrier phases.
- the phase of a carrier in a signal frequency conversion is added to the phases of all signal frequency components alike. Because of the inevitable errors in test signal start detection and because of the frequency instability of the analog to digital converter clock oscillator the bursts borders specified by the time grid from grid generator 303 differ from real bursts borders with time error ⁇ . Therefore the signal component with the frequency f in a burst is phase shifted by a value f* ⁇ .
- the test signal according to present invention has such a structure that an arbitrary measurement sine wave with a frequency f i and two adjacent reference sine waves with frequencies f L and f H are located in the same short time interval.
- the initial phases of the carriers in the down converter for all practical purposes do not vary during such short time. Therefore the phases of the mentioned three sine waves are increased in the down converter by the same value ⁇ .
- the burst borders time error ⁇ is the same for all three sine waves.
- ⁇ I , ⁇ L and ⁇ H are total phase shifts in the filters of the down converter at the frequencies f i , f L and f H respectively.
- the distortions calculator 402 calculates the phase frequency distortions of the vector/signal analyzer from the phases at the output of the amplitude and phase calculator 401 using the equation (7).
- One or more or any part thereof of the equalization techniques described above can be implemented in computer hardware or software, or a combination of both.
- the method can be implemented in computer programs using standard programming techniques following the method and figures described herein.
- the program can run on dedicated integrated circuits preprogrammed for that purpose.
- bursts which include, it is to be understood that any suitable sinusoidal wave may be used.
- sinusoidal wave refers to any wave with a waveform whose shape does not deviate from that of a sine wave in an amount sufficient to inhibit the proper functioning of the analyzer/equalizer for the application at hand.
Abstract
Description
θi=P i −P L−(P L −P H)*(f i −f L)/(f L −f H).
A=√{square root over ((I 2 +Q 2))}; (1)
P=tan−1(Q/I); (2)
In the distortions calculator 402 the amplitude A and phase P are used to calculate the frequency distortions. The amplitude frequency distortions are calculated in the usual way by comparing the amplitudes of different sine waves in a burst. The calculation of the phase frequency distortions requires a more sophisticated approach.
P i =θ+f i*τ+θi; (4)
P L =θ+f L*τ+θL; (5)
P H =θ+f H*τ+θH; (6)
θi =P i −P L−(P L −P H)*(f i −f L)/(f L −f H) (7)
Claims (35)
θi=P i −P L−(P L −P H)*(f i −f L)/(f L −f H).
Priority Applications (1)
| Application Number | Priority Date | Filing Date | Title |
|---|---|---|---|
| US11/944,076 US7791329B2 (en) | 2007-11-21 | 2007-11-21 | Vector/signal analyzer equalization apparatus and method |
Applications Claiming Priority (1)
| Application Number | Priority Date | Filing Date | Title |
|---|---|---|---|
| US11/944,076 US7791329B2 (en) | 2007-11-21 | 2007-11-21 | Vector/signal analyzer equalization apparatus and method |
Publications (2)
| Publication Number | Publication Date |
|---|---|
| US20090128123A1 US20090128123A1 (en) | 2009-05-21 |
| US7791329B2 true US7791329B2 (en) | 2010-09-07 |
Family
ID=40641228
Family Applications (1)
| Application Number | Title | Priority Date | Filing Date |
|---|---|---|---|
| US11/944,076 Expired - Fee Related US7791329B2 (en) | 2007-11-21 | 2007-11-21 | Vector/signal analyzer equalization apparatus and method |
Country Status (1)
| Country | Link |
|---|---|
| US (1) | US7791329B2 (en) |
Cited By (2)
| Publication number | Priority date | Publication date | Assignee | Title |
|---|---|---|---|---|
| US20100156438A1 (en) * | 2008-12-19 | 2010-06-24 | Gorin Joseph M | Spectrum analyzers with dynamic range indicator and methods of use |
| US10122440B2 (en) * | 2015-06-24 | 2018-11-06 | Hughes Network Systems, Llc | Remote spectrum analysis |
Families Citing this family (3)
| Publication number | Priority date | Publication date | Assignee | Title |
|---|---|---|---|---|
| US8760176B2 (en) * | 2010-11-10 | 2014-06-24 | St-Ericsson Sa | Methods and systems for production testing of DCO capacitors |
| JP6255917B2 (en) * | 2013-11-07 | 2018-01-10 | 富士通株式会社 | Wireless device and wireless access system |
| CN106097942A (en) * | 2016-06-29 | 2016-11-09 | 昆山国显光电有限公司 | OLED display screen lights test system and method |
Citations (2)
| Publication number | Priority date | Publication date | Assignee | Title |
|---|---|---|---|---|
| US4287469A (en) * | 1978-06-22 | 1981-09-01 | Wandel & Goltermann | Process and circuit arrangement for the measuring of coefficients of message-transmission equipment |
| US4774454A (en) * | 1986-08-06 | 1988-09-27 | Advantest Corporation | Distortion measuring system method utilizing signal suppression |
-
2007
- 2007-11-21 US US11/944,076 patent/US7791329B2/en not_active Expired - Fee Related
Patent Citations (2)
| Publication number | Priority date | Publication date | Assignee | Title |
|---|---|---|---|---|
| US4287469A (en) * | 1978-06-22 | 1981-09-01 | Wandel & Goltermann | Process and circuit arrangement for the measuring of coefficients of message-transmission equipment |
| US4774454A (en) * | 1986-08-06 | 1988-09-27 | Advantest Corporation | Distortion measuring system method utilizing signal suppression |
Cited By (3)
| Publication number | Priority date | Publication date | Assignee | Title |
|---|---|---|---|---|
| US20100156438A1 (en) * | 2008-12-19 | 2010-06-24 | Gorin Joseph M | Spectrum analyzers with dynamic range indicator and methods of use |
| US8026728B2 (en) * | 2008-12-19 | 2011-09-27 | Agilent Technologies, Inc. | Spectrum analyzers with dynamic range indicator and methods of use |
| US10122440B2 (en) * | 2015-06-24 | 2018-11-06 | Hughes Network Systems, Llc | Remote spectrum analysis |
Also Published As
| Publication number | Publication date |
|---|---|
| US20090128123A1 (en) | 2009-05-21 |
Similar Documents
| Publication | Publication Date | Title |
|---|---|---|
| US8290032B2 (en) | Distortion identification apparatus, test system, recording medium and distortion identification method | |
| US7231311B2 (en) | Method for characterizing high-frequency mixers | |
| US8280667B2 (en) | Test apparatus, performance board and calibration board | |
| US7161511B2 (en) | Linearization system and method | |
| KR101294771B1 (en) | Filter equalization using magnitude measurement data | |
| US7791329B2 (en) | Vector/signal analyzer equalization apparatus and method | |
| US20030146743A1 (en) | Very fast swept spectrum analyzer | |
| US7061219B2 (en) | Independent measurement of complicated transfer functions | |
| EP2418500B1 (en) | Multi-channel frequency domain test and measurement instrument | |
| CN103795475B (en) | Amplitude and the phase response calibration of receiver | |
| US5117179A (en) | Swept signal analysis instrument and method | |
| US8744370B2 (en) | System for characterizing mixer or converter response | |
| CN111337746A (en) | Radio frequency signal detection positioning method | |
| US8358169B2 (en) | Systems and methods for distortion measurement using distortion-to-amplitude transformations | |
| EP0437034B1 (en) | I.F. calibration method | |
| US6995571B1 (en) | Vector network analyzer mixer calibration using the unknown thru calibration | |
| JP4923276B2 (en) | Method for characterizing frequency response of frequency converter | |
| CN114563769A (en) | Method and device for measuring phase nonlinearity of digital phased array receiving channel | |
| US10735036B1 (en) | Method for measuring frequency offset between an RF transmitter and a test receiver | |
| EP1367402A1 (en) | Method and arrangement for phase measurement of a modulated RF signal | |
| US7705609B2 (en) | Phase frequency distortion measurement system | |
| US11489599B1 (en) | Wideband frequency response characterization with a narrowband source or receiver | |
| CN109450566B (en) | Method and device for measuring phase noise of microwave receiver | |
| CN117665423A (en) | Phase noise measuring device and method | |
| JP2012198115A (en) | Spectrum analyzer and frequency characteristic correction method thereof |
Legal Events
| Date | Code | Title | Description |
|---|---|---|---|
| AS | Assignment |
Owner name: GUZIK TECHNICAL ENTERPRISES, CALIFORNIA Free format text: ASSIGNMENT OF ASSIGNORS INTEREST;ASSIGNORS:STEIN, ANATOLI B.;VOLFBEYN, SEMEN;KLIMOV, VLADISLAV;AND OTHERS;REEL/FRAME:020358/0053;SIGNING DATES FROM 20071211 TO 20071212 Owner name: GUZIK TECHNICAL ENTERPRISES, CALIFORNIA Free format text: ASSIGNMENT OF ASSIGNORS INTEREST;ASSIGNORS:STEIN, ANATOLI B.;VOLFBEYN, SEMEN;KLIMOV, VLADISLAV;AND OTHERS;SIGNING DATES FROM 20071211 TO 20071212;REEL/FRAME:020358/0053 |
|
| REMI | Maintenance fee reminder mailed | ||
| FPAY | Fee payment |
Year of fee payment: 4 |
|
| SULP | Surcharge for late payment | ||
| FEPP | Fee payment procedure |
Free format text: PAT HOLDER NO LONGER CLAIMS SMALL ENTITY STATUS, ENTITY STATUS SET TO UNDISCOUNTED (ORIGINAL EVENT CODE: STOL); ENTITY STATUS OF PATENT OWNER: LARGE ENTITY |
|
| FEPP | Fee payment procedure |
Free format text: MAINTENANCE FEE REMINDER MAILED (ORIGINAL EVENT CODE: REM.) |
|
| LAPS | Lapse for failure to pay maintenance fees |
Free format text: PATENT EXPIRED FOR FAILURE TO PAY MAINTENANCE FEES (ORIGINAL EVENT CODE: EXP.); ENTITY STATUS OF PATENT OWNER: LARGE ENTITY |
|
| STCH | Information on status: patent discontinuation |
Free format text: PATENT EXPIRED DUE TO NONPAYMENT OF MAINTENANCE FEES UNDER 37 CFR 1.362 |
|
| FP | Lapsed due to failure to pay maintenance fee |
Effective date: 20180907 |