US8042387B2 - Methods and apparatus to control a formation testing operation based on a mudcake leakage - Google Patents
Methods and apparatus to control a formation testing operation based on a mudcake leakage Download PDFInfo
- Publication number
- US8042387B2 US8042387B2 US12/122,077 US12207708A US8042387B2 US 8042387 B2 US8042387 B2 US 8042387B2 US 12207708 A US12207708 A US 12207708A US 8042387 B2 US8042387 B2 US 8042387B2
- Authority
- US
- United States
- Prior art keywords
- mudcake
- pressure
- determining
- formation
- fluid
- Prior art date
- Legal status (The legal status is an assumption and is not a legal conclusion. Google has not performed a legal analysis and makes no representation as to the accuracy of the status listed.)
- Expired - Fee Related, expires
Links
- 230000015572 biosynthetic process Effects 0.000 title claims abstract description 133
- 238000000034 method Methods 0.000 title claims abstract description 71
- 238000012360 testing method Methods 0.000 title claims abstract description 59
- 239000012530 fluid Substances 0.000 claims description 116
- 239000000706 filtrate Substances 0.000 claims description 90
- 238000005070 sampling Methods 0.000 claims description 90
- 230000009545 invasion Effects 0.000 claims description 34
- 230000035699 permeability Effects 0.000 claims description 32
- 238000011109 contamination Methods 0.000 claims description 30
- 238000005086 pumping Methods 0.000 claims description 5
- 230000000977 initiatory effect Effects 0.000 claims description 4
- 230000004048 modification Effects 0.000 claims 3
- 238000012986 modification Methods 0.000 claims 3
- 230000000149 penetrating effect Effects 0.000 claims 3
- 238000005755 formation reaction Methods 0.000 description 99
- 239000000523 sample Substances 0.000 description 38
- 238000005553 drilling Methods 0.000 description 37
- 238000005259 measurement Methods 0.000 description 25
- ZPUCINDJVBIVPJ-LJISPDSOSA-N cocaine Chemical compound O([C@H]1C[C@@H]2CC[C@@H](N2C)[C@H]1C(=O)OC)C(=O)C1=CC=CC=C1 ZPUCINDJVBIVPJ-LJISPDSOSA-N 0.000 description 23
- 230000037230 mobility Effects 0.000 description 14
- 230000003287 optical effect Effects 0.000 description 13
- 238000004519 manufacturing process Methods 0.000 description 12
- 230000010355 oscillation Effects 0.000 description 11
- 230000006870 function Effects 0.000 description 8
- 239000000356 contaminant Substances 0.000 description 6
- 239000003381 stabilizer Substances 0.000 description 6
- 238000009530 blood pressure measurement Methods 0.000 description 4
- 238000005520 cutting process Methods 0.000 description 4
- 230000000694 effects Effects 0.000 description 4
- 230000010363 phase shift Effects 0.000 description 4
- 238000012545 processing Methods 0.000 description 4
- 230000001902 propagating effect Effects 0.000 description 4
- 239000004576 sand Substances 0.000 description 4
- 230000000712 assembly Effects 0.000 description 3
- 238000000429 assembly Methods 0.000 description 3
- 230000006399 behavior Effects 0.000 description 2
- 238000004891 communication Methods 0.000 description 2
- 238000010586 diagram Methods 0.000 description 2
- 238000009792 diffusion process Methods 0.000 description 2
- NKZSPGSOXYXWQA-UHFFFAOYSA-N dioxido(oxo)titanium;lead(2+) Chemical compound [Pb+2].[O-][Ti]([O-])=O NKZSPGSOXYXWQA-UHFFFAOYSA-N 0.000 description 2
- 238000009826 distribution Methods 0.000 description 2
- 238000011065 in-situ storage Methods 0.000 description 2
- 238000002955 isolation Methods 0.000 description 2
- 239000000203 mixture Substances 0.000 description 2
- 239000002245 particle Substances 0.000 description 2
- 239000011148 porous material Substances 0.000 description 2
- 239000000047 product Substances 0.000 description 2
- 238000000926 separation method Methods 0.000 description 2
- 230000001052 transient effect Effects 0.000 description 2
- XOJVVFBFDXDTEG-UHFFFAOYSA-N Norphytane Natural products CC(C)CCCC(C)CCCC(C)CCCC(C)C XOJVVFBFDXDTEG-UHFFFAOYSA-N 0.000 description 1
- 230000003466 anti-cipated effect Effects 0.000 description 1
- 230000005540 biological transmission Effects 0.000 description 1
- 238000006243 chemical reaction Methods 0.000 description 1
- 230000007423 decrease Effects 0.000 description 1
- 238000006073 displacement reaction Methods 0.000 description 1
- 239000000284 extract Substances 0.000 description 1
- 230000002349 favourable effect Effects 0.000 description 1
- 239000012065 filter cake Substances 0.000 description 1
- 230000002452 interceptive effect Effects 0.000 description 1
- 239000012466 permeate Substances 0.000 description 1
- 238000002310 reflectometry Methods 0.000 description 1
- 238000007789 sealing Methods 0.000 description 1
- 230000035939 shock Effects 0.000 description 1
- 239000007787 solid Substances 0.000 description 1
- 230000001360 synchronised effect Effects 0.000 description 1
Images


Classifications
-
- E—FIXED CONSTRUCTIONS
- E21—EARTH DRILLING; MINING
- E21B—EARTH DRILLING, e.g. DEEP DRILLING; OBTAINING OIL, GAS, WATER, SOLUBLE OR MELTABLE MATERIALS OR A SLURRY OF MINERALS FROM WELLS
- E21B49/00—Testing the nature of borehole walls; Formation testing; Methods or apparatus for obtaining samples of soil or well fluids, specially adapted to earth drilling or wells
- E21B49/08—Obtaining fluid samples or testing fluids, in boreholes or wells
- E21B49/087—Well testing, e.g. testing for reservoir productivity or formation parameters
-
- E—FIXED CONSTRUCTIONS
- E21—EARTH DRILLING; MINING
- E21B—EARTH DRILLING, e.g. DEEP DRILLING; OBTAINING OIL, GAS, WATER, SOLUBLE OR MELTABLE MATERIALS OR A SLURRY OF MINERALS FROM WELLS
- E21B49/00—Testing the nature of borehole walls; Formation testing; Methods or apparatus for obtaining samples of soil or well fluids, specially adapted to earth drilling or wells
- E21B49/08—Obtaining fluid samples or testing fluids, in boreholes or wells
- E21B49/10—Obtaining fluid samples or testing fluids, in boreholes or wells using side-wall fluid samplers or testers
Definitions
- This disclosure relates generally to formation testing in a wellbore and, more particularly, to methods and apparatus to control a formation fluid sampling operation based on a mudcake leakage.
- a mudcake layer is created during drilling operations by a drilling fluid that is conveyed downhole through a drill string and expelled through ports in a drill bit to lubricate the drill bit during the drilling operations and to carry formation cuttings to the surface.
- the mudcake layer is formed as the drilling fluid mixes with the formation cuttings and/or other solids, and circulates upwardly through an annular region between the outer surface of the drill string and a borehole wall. This mixture coats the borehole wall to create the mudcake layer.
- One function of the mudcake layer is to hydraulically isolate a formation from the interior of a borehole.
- a mudcake layer is often referred to in the industry as a mudcake or filter cake.
- a disclosed example method for use with a downhole tool disposed in a wellbore, includes measuring a downhole property at a first location, the wellbore having a mudcake layer formed on a wall thereof, determining a value representative of an estimated leakage through the mudcake layer based on the property, and determining, based on the value, whether to initiate a formation testing operation.
- Another disclosed example method for use with a downhole tool disposed in a wellbore, includes initiating a formation testing operation, measuring a downhole property at a first location, the wellbore having a mudcake layer formed on a wall thereof, determining a value representative of an estimated leakage through the mudcake layer based on the property; and determining, based on the value, whether to terminate the formation testing operation.
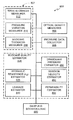
- a disclosed example apparatus for use with a downhole tool, includes a sensor to measure a property of a mudcake layer in a wellbore, a processor to determine, based on the property, a value representative of an estimated leakage through the mudcake layer; and sampling decision logic to determine, based on the value, whether to continue a formation testing operation.
- FIG. 1 illustrates an example wellsite drilling system.
- FIGS. 2 and 3 illustrate example manners of implementing either or both of the example logging while drilling (LWD) modules of FIG. 1 .
- LWD logging while drilling
- FIG. 4 is an illustration of a portion of an example borehole.
- FIG. 5 illustrates an example invasion zone formed by mud filtrate that has permeated a formation.
- FIGS. 6 and 7 illustrate example fluid flows resulting from a pumpout phase of a testing operation.
- FIG. 8 illustrates an example manner of implementing the example sampling control module of FIG. 3 .
- FIG. 9 is a graph illustrating example contamination levels versus fluid pumpout volume.
- FIG. 10 illustrates an example fluid flow model that may be used to estimate contamination due to mud filtrate leakage through a mudcake layer.
- FIG. 11 is a graph illustrating example pretest pressure buildup data.
- FIG. 12 is a table showing example properties of various testing probes.
- FIGS. 13A , 13 B, 14 , 15 and 16 illustrate example devices that may be used to measure one or more properties of a mudcake layer.
- FIGS. 17A and 17B are timing diagrams of example time-based relationships between ultrasonic signals in a two-layer media formed by a mudcake layer and a formation.
- FIGS. 18 , 19 and 20 are flowcharts representative of example processes that may be executed by, for example, a processor to implement the example sampling control module of FIG. 8 .
- FIG. 21 is a schematic illustration of an example processor platform that may be used and/or programmed to carry out the example processes of FIGS. 18 , 19 and/or 20 to implement any of all of the example methods and apparatus described herein.
- the quality of a mudcake layer is often deterministic of the ability to successfully perform a cleanup operation in order to recover an acceptably and/or substantially pristine formation fluid sample having acceptable and/or low levels of contaminants from a mud filtrate.
- MWD measurement-while-drilling
- LWD logging-while-drilling
- the mudcake layer can be thinner (e.g., due to damage by a portion of a drill string and/or a relatively shorter time between a drilling operation and a sampling operation), and the formation may be exposed to a pressure overbalance for a relatively shorter duration, as compared to sampling performed with a wireline tool.
- the quality of the mudcake layer e.g.
- the amount of mud filtrate leakage that occurs through the mudcake layer and the pumpout rate of a sampling tool determine the quality of a resultant formation fluid sample. For example the more leakage through the mudcake layer the greater the amount of fluid that must be pumped out before a fluid sample with a desired amount of filtrate contamination can be obtained. If the amount leakage through a mudcake layer is sufficiently low, it is relatively easy to pumpout a sufficient volume of fluid to reduce the amount of contamination due to mud filtrate contained in a formation fluid sample to an acceptable level (possibly zero). In contrast, an overly thin mudcake layer (e.g., one that allows a substantial amount of filtrate leakage through the mudcake) can lead to hydraulic shorting.
- an overly thin mudcake layer e.g., one that allows a substantial amount of filtrate leakage through the mudcake
- Such hydraulic shorting causes substantially greater quantities of drilling fluid and/or mud filtrate to leak through the mudcake layer during a fluid sample drawing operation, contaminating virtually all fluid samples drawn by a sampling tool, regardless of the volume of fluid pumped out of the formation by the sampling tool.
- the example methods and apparatus described herein can be used to estimate how much filtrate leakage may occur through a mudcake layer to determine whether it is expected that formation fluid samples having tolerable or acceptable contamination levels can be successfully extracted from a formation at a particular location of a borehole. Such determinations may be used to determine whether to initiate a sampling operation (e.g., to begin a pumpout process leading to a formation fluid sample being captured or obtained), and/or to determine whether to continue the pumpout process.
- a sampling operation e.g., to begin a pumpout process leading to a formation fluid sample being captured or obtained
- the example methods and apparatus described herein can be used to distinguish between a) when mudcake layer quality is insufficient to allow capturing of a formation fluid sample having an acceptable contamination level and b) when mudcake layer quality is sufficient to allow capturing of an acceptable formation fluid sample.
- drilling time can be used more efficiently by continuing with drilling operations instead of stopping to perform testing as would otherwise occur.
- the example methods and apparatus disclosed herein are described with reference to collecting of formation fluid samples, the example methods and apparatus may, additionally or alternatively, be used to estimate a property representative of the purity of a formation fluid. For instance, an example sampling operation could draw a sufficient amount of formation fluid to estimate the purity of a formation fluid without collecting an actual formation sample.
- While example methods and apparatus are described herein with reference to so-called “sampling-while-drilling,” “logging-while-drilling,” and/or “measuring-while drilling” operations, the example methods and apparatus may, additionally or alternatively, be used to determine whether to attempt to collect a formation fluid sample during a wireline sampling operation. Moreover, such while-drilling operations do not require that sampling, logging and/or measuring actually occur while drilling is actively taking place. For example, as commonly performed in the industry, a drill bit of a drill string drills for a period of time, drilling is paused, one or more formation measurements and/or formation fluid samples are taken by one or more sampling, measuring and/or logging devices of the drill string, and then drilling is resumed. Such activities are referred to as sampling, measuring and/or logging while drilling operations because they do not require the removal of a drill string from the borehole in order to perform formation measurements and/or to obtain formation fluid samples.
- FIG. 1 illustrates an example prior art wellsite drilling system that can be employed onshore and/or offshore.
- a borehole 11 is formed in one or more subsurface formations by rotary and/or directional drilling.
- a drill string 12 is suspended within the borehole 11 and has a bottom hole assembly (BHA) 100 having a drill bit 105 at its lower end.
- a surface system includes a platform and derrick assembly 10 positioned over the borehole 11 , the assembly 10 includes a rotary table 16 , a kelly 17 , a hook 18 and a rotary swivel 19 .
- the drill string 12 is rotated by the rotary table 16 , energized by means not shown, which engages the kelly 17 at the upper end of the drill string 12 .
- the example drill string 12 is suspended from the hook 18 , which is attached to a traveling block (not shown), and through the kelly 17 and the rotary swivel 19 , which permits rotation of the drill string 12 relative to the hook 18 .
- a top drive system could be used.
- the surface system further includes drilling fluid or mud 26 stored in a pit 27 formed at the well site.
- a pump 29 delivers the drilling fluid 26 to the interior of the drill string 12 via a port in the swivel 19 , causing the drilling fluid to flow downwardly through the drill string 12 as indicated by the directional arrow 8 .
- the drilling fluid 26 exits the drill string 12 via ports in the drill bit 105 , and then circulates upwardly through the annulus region between the outside of the drill string and the wall of the borehole, as indicated by the directional arrows 9 .
- the drilling fluid 26 lubricates the drill bit 105 , carries formation cuttings up to the surface as it is returned to the pit 27 for recirculation, and creates a mudcake layer on the walls of the borehole 11 .
- the example BHA 100 of FIG. 1 includes, among other things, any number and/or type(s) of logging-while-drilling (LWD) modules (two of which are designated at reference numerals 120 and 120 A) and/or measuring-while-drilling (MWD) modules (one of which is designated at reference numeral 130 ), a roto-steerable system and motor, and the example drill bit 105 .
- LWD logging-while-drilling
- MWD measuring-while-drilling
- the example LWD modules 120 and 120 A of FIG. 1 are each housed in a special type of drill collar, as it is known in the art, and each contain any number of logging tools and/or testing devices.
- the example LWD modules 120 , 120 A include capabilities for measuring, processing, and/or storing information, as well as for communicating with surface equipment, such as a logging and control computer 160 via, for example, the MWD module 130 .
- FIG. 9 An example manner of implementing a sampling control module for a LWD module 120 , 120 A, which makes formation testing decisions based on a mudcake quality (e.g., an estimated amount of leakage through a mudcake layer), is described below in connection with FIG. 9 .
- all or a portion of the example sampling control module of FIG. 8 may be implemented by the example logging and control computer 160 .
- measurements may be taken by one or more LWD modules 120 , 120 A and conveyed via, for example, telemetry to the logging and control computer 160 , which makes testing decisions based on the measurements performed by the LWD module(s) 120 , 120 A.
- two or more LWD modules 120 , 120 A may interact to make testing decisions.
- the example LWD module 200 of FIG. 2 may be used to obtain wellbore and sandface pressure measurements that are used by a sampling control module 330 of the example LWD module 300 of FIG. 3 to make testing decisions.
- the example MWD module 130 of FIG. 1 is also housed in a special type of drill collar and contains one or more devices for measuring characteristics of the drill string 120 and/or the drill bit 105 .
- the example MWD tool 130 further includes an apparatus (not shown) for generating electrical power for use by the downhole system.
- Example devices to generate electrical power include, but are not limited to, a mud turbine generator powered by the flow of the drilling fluid, and a battery system.
- Example measuring devices include, but are not limited to, a weight-on-bit measuring device, a torque measuring device, a vibration measuring device, a shock measuring device, a stick slip measuring device, a direction measuring device, and an inclination measuring device.
- FIG. 2 is a schematic illustration of an example manner of implementing either or both of the example LWD modules 120 and 120 A of FIG. 1 . While either of the example LWD modules 120 and 120 A of FIG. 1 may be implemented by the example device of FIG. 2 , for ease of discussion, the example device of FIG. 2 will be referred to as LWD module 120 .
- the example LWD module 120 of FIG. 2 may be used to take wellbore pressures and sand face pressures, which may be used by, for example, the example sampling control module 800 of FIG. 8 , a sampling control module of another LWD module 120 , 120 A (e.g., the example sampling control module 330 of FIG. 3 ), and/or the example surface computer 160 to make testing decisions.
- the example LWD module 120 of FIG. 2 is of a type disclosed in U.S. Pat. No. 6,986,282, which is incorporated herein by reference in its entirety, for determining downhole pressures including annular pressure, formation pressure, and pore pressure during a drilling operation.
- the example LWD module 120 is formed in a modified stabilizer collar or drill collar 200 , which has a passage 215 extending therethrough for drilling fluid. The flow of fluid through the module 120 creates an internal pressure PI.
- the exterior of the drill collar 200 is exposed to the wellbore and/or annular pressure PA of the surrounding wellbore.
- the differential pressure ⁇ P between the internal pressure PI and the annular pressure PA is used to activate pressure assemblies 210 .
- the example pressure assembly 210 a is used to monitor annular pressure PA in the borehole, and/or pressures of the surrounding formation when positioned in engagement with a borehole wall or surface 201 .
- the pressure assembly 210 a is not engaged with the borehole wall 201 and, therefore, may measure annular pressure PA, if desired.
- the pressure assembly 210 a may be used to measure a sandface and/or pore pressure of the surrounding formation. As also seen in FIG.
- the pressure assembly 210 b is extendable from a stabilizer blade 214 , using a hydraulic control 225 , for sealing engagement with a mudcake layer 205 and/or the wall 201 of the borehole for taking measurements of the surrounding formation.
- Circuitry (not shown in this view) couples pressure-representative signals to a processor/controller, an output of which is coupleable to telemetry circuitry, to other LWD modules 120 , 120 A, and/or to the example sampling control module 800 of FIG. 8 .
- the example pressure 1510 sensor of FIG. 15 may be used to measure wellbore and/or sandface pressures.
- FIG. 3 is a schematic illustration of an example manner of implementing either or both of the example LWD modules 120 and 120 A of FIG. 1 . While either of the example LWD modules 120 and 120 A of FIG. 1 may be implemented by the example device of FIG. 3 , for ease of discussion, the example device of FIG. 3 will be referred to as LWD module 300 .
- the example LWD module 300 of FIG. 3 may be used to obtain one or more measurements of a mudcake, which may be used by, for example, the example sampling control module 800 of FIG. 8 , a sampling control module of another LWD module 120 , 120 A, and/or the example surface computer 160 to make testing decisions. Additionally or alternatively, the example LWD module 300 may be used to obtain samples of formation fluids.
- the example LWD tool 300 of FIG. 3 is provided with a probe 305 for establishing fluid communication with a formation F and to draw a fluid 310 into the tool 300 , as indicated by the arrows.
- the example probe 305 may be positioned, for example, within a stabilizer blade 315 of the LWD tool 300 and extended from the stabilizer blade 315 to engage a borehole wall 320 .
- An example stabilizer blade 315 comprises one or more blades that are in contact with the borehole wall 320 .
- Fluid 310 drawn into the LWD tool 300 using the probe 305 may be measured to determine, for example, pretest and/or pressure parameters.
- the LWD tool 300 may be provided with devices, such as sample chambers (not shown), for collecting fluid samples for retrieval at the surface.
- Backup pistons 325 may also be provided to assist in applying force to push the sampling tool 300 and/or the probe 305 against the borehole wall 320 . Further, the example LWD tool 300 may be provided with one or more additional devices described below in connection with FIG. 8 to measure one or more properties of a mudcake layer.
- the example LWD module 300 of FIG. 3 includes a sampling control module 330 .
- the example sampling control module 330 includes one more measurement devices (e.g., sensors) to measure one or more properties of a mudcake layer, and sampling decision logic to determine whether to initiate and/or continue a formation testing operation based on measurements taken by the measurement devices.
- An example manner of implementing the example sampling control module 330 of FIG. 3 is described below in connection with FIG. 8 .
- FIG. 4 depicts a portion of the example borehole 11 of FIG. 1 shown in connection with structural features of a subsurface formation 405 during a drilling operation.
- the mudcake layer 205 is formed on the borehole wall 201 against a sand face 410 .
- the mud filtrate that forms the mudcake layer 205 invades the formation 405 through the sand face 410 to create an invasion zone 415 of the mud filtrate (e.g., a contaminant).
- the invasion zone 415 is formed when the drill bit 105 initially drills and/or crushes through the formation 405 to form the borehole 11 at which point the mudcake layer 205 is not yet formed and mud filtrate 505 is able to permeate into the formation 405 via the borehole 11 for a distance that defines the extent of the invasion zone 415 into the formation 405 .
- the mud filtrate 505 begins to build the mudcake layer 205 , as shown in FIG. 5 , as the filtrate is mixed with formation cuttings and is circulated upward through the annulus region between an outer surface of the drill string 12 and the borehole wall 201 .
- the fluid drawn during an initial portion of the pumpout phase contain contamination from the mud filtrate 505 in the invasion zone 415 .
- the drawn fluid may eventually deplete a substantial portion of the mud filtrate in a local portion of the formation 405 so that the mud filtrate contaminant 505 in the subsequently drawn fluid samples is progressively reduced.
- the mudcake layer 205 is substantially competent and/or has sufficient quality to resist mud filtrate leakage from the borehole into the formation 405 during a fluid pumpout operation.
- fluid drawn by the sampling tool 510 via the probe 515 is drawn from the formation 405 while the mudcake layer 205 substantially prevents mud filtrate from leaking into the formation 405 from the borehole 11 .
- mud filtrate contaminant in fluid samples drawn during an initial portion of a pumpout phase is limited to the contamination in the invasion zone 415 ( FIGS. 4 and 5 ), and over time the amount of mud filtrate contaminant in the drawn fluid samples is reduced because the mudcake layer 205 prevents replenishment of the mud filtrate 505 in the invasion zone 415 .
- the mudcake layer 205 has a relatively lower quality than the borehole portion 600 of FIG. 6 .
- mud filtrate from the borehole 11 leaks through the mudcake layer 205 causing a partial and/or complete hydraulic short 705 of mud filtrate around the probe 515 and the mud filtrate contaminant is drawn into the probe 515 along with and/or instead of fluid from the formation 405 .
- two pressure profile curves 420 and 421 corresponding to two different wellbore pressures p W1 and p W2 are shown.
- the wellbore pressures p W1 and p W2 and the corresponding sandface pressures p SF1 and p SF2 may be measured, for example by the example LWD module 120 of FIG. 2 and/or the example pressure sensor 1510 of FIG. 15 .
- the invading mud filtrate and the formation fluid may have different viscosities, for simplicity, the effect of viscosity on fluid mobility is neglected herein. However, the effect of viscosity on fluid mobility may be used to enhance the accuracy of the methods and apparatus described herein.
- mud filtrate continues to invade the formation 405 .
- the velocity v of the mud filtrate invasion can be computed (e.g., estimated) using, for example, Darcy's law, which may be expressed mathematically as:
- R m ⁇ ⁇ ⁇ p W - ⁇ ⁇ ⁇ p SF ⁇ ⁇ ⁇ p SF ⁇ R f , EQN ⁇ ⁇ ( 2 )
- ⁇ P w P W1 ⁇ P W2
- ⁇ p SF p SF2
- R f is the hydraulic resistance of the formation, for which a reasonable estimate is usually known a priori, or may be estimated in situ, as preferred.
- an estimate of the invasion velocity v can be computed using EQN (1) and EQN (2).
- the invasion velocity v can be used to estimate the amount of mud filtrate leakage that is predicted to occur through the mudcake 205 during a testing operation. As such, the invasion velocity v can be used to make testing decisions.
- EQN (2) care must be taken when applying EQN (2).
- the denominator of EQN (2) becomes small creating potential uncertainty in the computed hydraulic resistance R m .
- such instances typically correspond to conditions favorable to building high quality mudcake during drilling, albeit not necessarily corresponding to zero filtrate leakage through the mudcake 205 .
- EQN (2) uses two pairs of pressure measurements, the hydraulic resistance R m may be computed using additional pressure measurements to improve accuracy.
- sampling control module 800 an example manner of implementing the example sampling control module 330 of FIG. 3 is illustrated. Because the example device of FIG. 8 may be used to implement the example sampling control module 330 , and/or a part of the illustrated device of FIG. 8 may used to implement the example surface computer 160 of FIG. 1 , the example device of FIG. 8 will be referred to as sampling control module 800 .
- the example sampling control module 800 of FIG. 8 includes one or more measuring modules, three of which are designated at reference numerals 805 , 806 , and 807 .
- the example pressure data collector 805 of FIG. 8 measures wellbore pressures, sandface pressures and/or performs a pressure pretest prior to cleanup production.
- the example pressure data collector 805 may be implemented by the example LWD module 120 of FIG. 2 , the example pressure sensor 1510 of FIG. 15 , and/or the Schlumberger StethoscopeTM LWD module.
- the example optical density measurer 806 of FIG. 8 measures the optical density of sampled fluids, and may be implemented by, for example, the Sehlumberger Optical Fluid Analyzer (OFATM), the Schlumberger Live Fluid Analyzer (LFATM), the Schlumberger Composition Fluid Analyzer (CFATM) or any similar device(s).
- OFATM Sehlumberger Optical Fluid Analyzer
- LFATM Schlumberger Live Fluid Analyzer
- CFATM Schlumberger Composition Fluid Analyzer
- the optical density of the sampled fluid changes as the contamination of formation fluid by the mud filtrate 505 changes.
- mud filtrate is usually more transparent than formation fluid, which is darker in color.
- the example measuring module 807 of FIG. 8 includes a mudcake thickness measurer 810 to measure the thickness of the mudcake layer 205 , and a pressure variation measurer 815 to measure a pressure wave variation caused by the mudcake layer 205 , and a wave slowness measurer 817 to measure the compressional slowness and/or the shear slowness of pressure waves passing through the mudcake layer 205 .
- Example manners of implementing the example measuring module 807 of FIG. 8 are described below in connection with FIGS. 13A , 13 B, and 14 - 16 , 17 A and 1713 .
- the example sampling control module 800 of FIG. 8 includes a mudcake quality estimator 820 . Based on one or more properties of the mudcake 205 measured by one or more of the measuring modules 805 - 807 , the example mudcake quality estimator 820 computes a value that represents an estimate amount of mud filtrate that will leak through the mudcake 205 during a testing operation.
- the example mudcake quality estimator 820 of FIG. 8 includes a hydraulic resistance estimator 825 .
- the example hydraulic resistance estimator 825 computes (e.g., estimates) a mudcake hydraulic resistance R m using pressure and/or pressure pretest measurements taken by the example pressure data collector 805 by, for example, using EQN (2) described above. Additionally or alternatively, the example hydraulic resistance estimator 825 can compute a hydraulic resistance R m using a mudcake thickness ⁇ measured by the example measuring module 807 , and a mudcake permeability k m computed by a permeability estimator 830 . Mudcake hydraulic resistance R m can be mathematically expressed as:
- R m ⁇ f ⁇ ⁇ k m , EQN ⁇ ⁇ ( 3 )
- ⁇ f is the viscosity of the mud filtrate, which is usually known, at least approximately, a priori.
- the permeability estimator 830 may determine a mud filtrate mobility in the mudcake k m / ⁇ f .
- the example permeability estimator 830 of FIG. 8 computes (e.g., estimates) a mudcake permeability k, (or a mud filtrate mobility in the mudcake k m / ⁇ f ) based on the pressure variation measurements taken by the example pressure variation measurer 815 .
- the pressure variations are caused when a pressure wave passes through the mudcake layer 205 .
- the pressure wave received through the mudcake 205 is measured by the example pressure variation measurer 815 , as described below in connection with FIG. 15 .
- ⁇ is the thickness of the mudcake 205
- B m is the bulk modulus of the mudcake 205
- ⁇ m is the porosity of the mudcake 205
- k m is the mudcake permeability
- ⁇ f is the viscosity of the mud filtrate.
- more-complex models involving one or more partial differential equations describing pressure transmission through the mudcake 205 may be used to estimate the mudcake diffusivity ⁇ f .
- the mudcake permeability k m can be computed using EQN (4).
- the porosity ⁇ m which varies in a small range of values, can be assumed to be a constant, and mudcake thickness ⁇ can be measured, as described below in connection with FIGS. 16 and 17 .
- the bulk modulus B m can vary significantly and is affected by the differential pressure across the thickness of the mudcake 205 , and/or with one or more properties of the mud filtrate and/or mudcake 205 (e.g., a particle size distribution, a particle shape distribution, etc.). As described below in connection with FIG. 16 , the bulk modulus B m can be estimated using a high-frequency sensor operated in both compressional and shear modes of acoustic wave propagation.
- the example mudcake quality estimator 820 of FIG. 8 includes an invasion velocity estimator 835 .
- the example invasion velocity estimator 835 computes an expected invasion velocity v by, for example, using EQN (1) described above.
- the example mudcake quality estimator 820 includes a leakage estimator 840 .
- the example leakage estimator 840 estimates, as a function of pumpout time, the portion of a sampled fluid that will be mud filtrate.
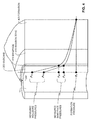
- FIG. 9 illustrates mud filtrate contamination levels as a function of pumpout volume and/or equivalently the time for which the sampling tool 510 pumps a fluid out the formation 405 . As shown in FIG.
- the sampling tool 510 extracts contaminated fluids as only fluid from the invasion zone 415 is being pumped by the sampling tool. As pumpout continues, both virgin fluid from the formation 405 and mud filtrate 505 that leaks through the mudcake 205 will be pumped.
- the contamination level of mud filtrate 505 in the sampled fluid depends upon the leakage rate of the mudcake 205 . The more leakage, the greater the minimum contamination level that can be achieved. If the leakage rate is great enough and/or the pumpout rate of the sampling tool 510 is insufficient, a fluid sample having an acceptable level of contamination may not be achievable. While mud filtrate contamination level curves are depicted in FIG. 9 , it should be appreciated that fluid property curves may be used alternatively. Indeed, methods for computing contamination level curves from fluid property curves are well known in the art. Trends and behaviors exhibited in contamination level curves usually correspond to equivalent trends and behaviors exhibited in fluid property curves.
- FIG. 10 a fluid flow model is shown that may be used to compute (e.g., estimate) the contribution to a sampled fluid of mud filtrate 505 leaking through the mudcake 205 .
- the example fluid flow model of FIG. 10 is based on a spherical flow to a point sink (e.g., the sampling tool 510 ).
- any geometrical flow model may be used to estimate the contamination of fluid samples by mud filtrate leakage through the mudcake 205 .
- the pumpout volume V of the sampling tool 510 is represented by a production sphere 1005 .
- the radius R of the sphere 1005 increases overtime time in proportion to the pumpout rate Q p of the sampling tool 510 .
- the radius R(t) of the production sphere 1005 has to become larger than the radius r i of the invasion zone 415 in order to start reducing the contamination of the sampled fluid by the mud filtrate 505 .
- the contamination of fluid produced by the sampling toot 510 can be expressed by the following ratio:
- a threshold e.g., 0.01
- testing operations need not be initiated. Instead, drilling could be restarted and/or the sampling tool 510 repositioned to an area having a better mudcake quality.
- a threshold e.g. 0.1
- both EQN (7) and EQN (8) could be used to make the sampling decisions.
- the example mudcake quality estimator 820 includes a drawdown pressure estimator 850 .
- the example drawdown pressure estimator 850 of FIG. 8 computes (e.g., estimates) a drawdown pressure that is expected to occur when pumpout is being performed by the sampling tool 510 .
- the example pressure data collector 805 e.g., the example pressure sensor 1510 of FIG. 15
- a graph of example pretest pressure buildup data is illustrated in FIG. 11 . As shown in FIG.
- the formation sandface pressure psi (a close approximation of the formation pressure p 0 ) and the drawdown mobility of the formation k D / ⁇ can be determined (e.g., estimated) from the pressure buildup data.
- the terminal pressure represents the formation sandface pressure p SF and the curve and/or slope 1105 of the pressure buildup curve can be used to determine the drawdown mobility k D / ⁇ .
- An example manner of estimating the drawdown mobility of the formation k D / ⁇ is described in U.S. Pat. No. 7,117,734.
- An estimated drawdown pressure ⁇ p E during cleanup production may be obtained from EQN (10) using an actual pumpout rate Q p and the drawdown mobility k D / ⁇ determined from pretest pressure buildup data as illustrated in FIG. 11 .
- the actual pumpout rate Q p may be measured and/or estimated by, for example, counting the strokes of a displacement unit of a Schlumberger MDTTM probe and/or counting roller screw rotations of a reciprocating pump.
- an actual drawdown pressure ⁇ p actual corresponding to the actual pumpout rate Q p is measured. If the estimated drawdown pressure ⁇ p E is approximately the same as the actual drawdown pressure ⁇ p actual , then severe mud filtrate leakage through the mudcake 205 is unlikely. However, if ⁇ p E is substantially higher than ⁇ p actual , then the likelihood of substantial leakage is high.
- the example sampling control module 800 of FIG. 8 includes sampling decision logic 860 .
- the example sampling decision logic 860 of FIG. 8 uses one or more values representative of mudcake leakage, as computed by the example mudcake quality estimator 820 , to make sampling decisions.
- the example permeability estimator 830 , the example hydraulic resistance estimator 825 and the example leakage estimator 850 compute a first leakage estimate based on measurements performed by the example pressure variation measurer 815 and the example mudcake thickness measurer 810 .
- the sampling decision logic 860 uses the first leakage estimate to determine whether to initiate a testing operation.
- the example drawdown pressure estimator 850 estimates a drawdown pressure based on pretest pressure build data collected by the pressure data collector 805 .
- the sampling decision logic 860 compares the estimated drawdown pressure to an actual drawdown pressure to determine a second leakage estimate. If the estimated and actual drawdown pressures differ by more than a threshold (i.e., signifying that significant mudcake leakage is likely), then the sampling decision logic 860 terminates the sampling operation. If the sampling operation is to continue, the sampling decision logic 860 monitors optical density data measured by the example optical density measurer 806 to detect fault conditions (e.g., a fracture and/or fissure in the formation 405 , a faulty sampling probe, etc.). For example, if the optical density does not change within a specific period of time, the sampling decision logic 860 terminates the sampling operation.
- fault conditions e.g., a fracture and/or fissure in the formation 405 , a faulty sampling probe, etc.
- FIG. 8 While an example manner of implementing a sampling control module 800 has been illustrated in FIG. 8 , one or more of the interfaces, data structures, elements, processes and/or devices illustrated in FIG. 8 may be combined, divided, re-arranged, omitted, eliminated and/or implemented in any other way.
- the example measurers 805 - 807 may be implemented in the example BHA 100 (e.g., by one or more of the LWD modules 120 , 120 A), and the example mudcake quality estimator 820 and the example sampling decision logic 860 implemented by the example surface computer 160 .
- the example measuring modules 805 - 807 , the example mudcake thickness measurer 810 , the example pressure variation measurer 815 , the example mudcake quality estimator 820 , the example hydraulic resistance estimator 825 , the example permeability estimator 830 , the example invasion velocity estimator 835 , the example leakage estimator 840 , the example drawdown pressure estimator 850 , the example sampling decision logic 860 and/or, more generally, the example sampling control module 800 of FIG. 8 may be implemented by hardware, software, firmware and/or any combination of hardware, software and/or firmware.
- any or all of the example measuring modules 805 - 807 , the example mudcake thickness measurer 810 , the example pressure variation measurer 815 , the example mudcake quality estimator 820 , the example hydraulic resistance estimator 825 , the example permeability estimator 830 , the example invasion velocity estimator 835 , the example leakage estimator 840 , the example drawdown pressure estimator 850 , the example sampling decision logic 860 and/or, more generally, the example sampling control module 800 may be implemented by one or more circuit(s), programmable processor(s), application specific integrated circuit(s) (ASIC(s)), programmable logic device(s) (PLD(s)) and/or field programmable logic device(s) (FPLD(s)), etc.
- ASIC application specific integrated circuit
- PLD programmable logic device
- FPLD field programmable logic device
- a sampling control module may include interfaces, data structures, elements, processes and/or devices instead of, or in addition to, those illustrated in FIG. 8 and/or may include more than one of any or all of the illustrated interfaces, data structures, elements, processes and/or devices.
- FIGS. 13A and 13B depict an example probe packer assembly 1300 than can be used to implement the example pressure variation measurer 815 of FIG. 8 .
- the example measurement pad 1600 of FIG. 16 can be used to measure a pressure variation through the mudcake 205 .
- the probe packer assembly 1300 includes a low-frequency acoustic sensor 1302 and a probe inlet 1304 .
- the probe packer assembly 1300 is configured to create and measure a transient differential pressure through the mudcake layer 205 .
- the distance between the acoustic sensor 1302 and the probe inlet 1304 is chosen such that the mudcake located between the sensor 1302 and the probe inlet 1304 would not be washed out during a pressure pretest.
- the transient pressure variation measured by the example probe packer assembly 1300 may be used, as describe above, to estimate a mudcake permeability k m .
- the example probe packer assembly 1300 may be implemented by any of the example LWD modules 120 , 120 A, 300 described herein.
- FIG. 14 depicts the example probe packer assembly 1300 of FIGS. 13A and 13B coupled to an example measuring apparatus 1400 that can be used to generate pressure waves 1502 that propagate through the mudcake layer 205 and the formation 302 as shown in FIG. 15 , and to detect the low-frequency pressure waves 1502 propagating back through the mudcake layer 205 .
- the example measuring apparatus 1400 of FIG. 14 includes a pressure oscillation or pressure pulsing device 1405 and an isolation valve 1410 .
- the pressure oscillation device 1405 is connected to a flowline 1415 of the probe packer 1300 .
- the example isolation valve 1410 of FIG. 14 prevents pressure waves created by the example pressure oscillation device 1405 from propagating back into other portions of the measuring apparatus 1400 , and/or to prevent other portions of the measuring apparatus 1400 from interfering with pressure variation measurements performed via the example sensor 1302 .
- the example measuring apparatus 1400 of FIG. 14 includes a receive electronics module 1425 .
- the example receive electronics module 1425 of FIG. 14 converts an analog signal received from the example sensor 1302 into a digital signal 1430 .
- the example receive electronics module 1425 includes an amplifier 1435 and an analog-to-digital converter (ADC) 1440 .
- the sensor 1302 comprises a lead titanate (PT) piezoelectric sensor.
- the example amplifier 1435 of FIG. 14 amplifies the analog output signal of the piezoelectric sensor 1302 to a voltage level suitable for conversion to a digital signal by the example ADC 1440 .
- the amplifier 1435 may include a low-pass filter to reduce the effects of aliasing that may be introduced by the ADC 1440 .
- Any number and/or type(s) of amplifier circuit(s) and/or ADC(s) may be used instead of, or in addition to, those shown in FIG. 14 .
- the pressure waves 1502 transmitted via the inlet 1304 propagate through the formation 302 . As shown in FIG. 15 , they will also propagate through the mudcake 205 and be detected by the low-frequency acoustic sensor 1302 .
- the example pressure waves 1502 and the example acoustic sensor 1302 are of a low-frequency type (e.g. a Biot slow compressional wave) in order to capture pressure waves propagating slowly through the formation 302 and the mudcake 205 .
- the low-frequency sensor 1302 is used to estimate pressure variations, which can be used as described above to determine a mudcake diffusivity ⁇ m using, for example, EQN (4).
- the example packer 1300 of FIG. 15 includes any type of pressure sensor 1510 .
- An example representation of a pressure signal measured by the pressure sensor 1510 is shown as pressure curve 1504 in FIG. 15 .
- the example pressure sensor 1510 may be used to measure wellbore pressures, sandface pressures, drawdown pressures and/or pretest pressure buildup data.
- the pressure wave 1502 is received at the acoustic sensor 1302 as a pressure curve 1505 .
- the pressure curve 1505 differs from a pressure curve 1506 that would be measured at the interface between the formation 302 and the mudcake 205 , in front of the acoustic sensor 1302 , in amplitude (e.g., magnitude) and/or time (e.g., phase).
- the difference in amplitude can be expressed as ⁇ p
- the difference in time can be expressed as ⁇ t.
- the pressure curve 1505 may differ from a pressure curve 1506 for other reasons, such as propagation in the structure sensor 1302 . However, it is assumed here for simplicity that these differences are negligible, or can be corrected for, using calibrations procedures for example.
- the pressure curve 1506 may be estimated using any number and/or type(s) of method(s), equation (s) and/or algorithm(s). For example it can be calculated by solving partial differential equations of pressure waves propagating in the formation 302 , using measured or estimated properties of the formation 302 and data related to the creation of the pressure waves by the pressure oscillation or pressure pulsing device 1405 . In other cases, such as when the formation pressure diffusivity ⁇ significantly larger than the mudcake diffusivity ⁇ m , it is possible to operate the pressure oscillation or pressure pulsing device 1405 in such a way that the pressure curve 1504 measured by the sensor 1510 and the pressure curve 1506 are almost identical, as further detailed below. Thus in this case, pressure variation measurements ⁇ p and ⁇ t may be determined from the differences (in magnitude and delay, respectively) between pressures measured by the example pressure sensor 1510 and the example acoustic sensor 1302 .
- the frequency of the pressure waves 1502 transmitted by the pressure oscillation device 1405 may be selected such that the pressure in the probe inlet 1304 is approximately equal to the pressure behind the mudcake opposite the acoustic sensor 1302 .
- a one-dimensional model of pressure diffusion across the thickness of the mudcake such as that shown in EQN (4) can be used to characterize the mudcake 205 based on pressure variations measured by the example acoustic sensor 1302 .
- the frequency may be selected or determined based on one or more parameters, such as the distance L between the inlet 1304 and the acoustic sensor 1302 , and the formation pressure diffusivity ⁇ .
- the propagation time t L can be used to choose an appropriate frequency for the pressure waves 1502 .
- the formation pressure diffusivity ⁇ is 0.5 m 2 s ⁇ 1 .
- the propagation time t L is approximately 5 milliseconds (ms), which corresponds to a pressure wave frequency of 200 cycles per second (Hz).
- the pressure wave frequency is proportional to the formation permeability.
- a pressure wave frequency of 2 Hz would be appropriate.
- FIG. 16 illustrates an example measurement pad 1600 than can be used to implement the example wave slowness measurer 817 and/or the example mudcake thickness measurer 810 of FIG. 8 .
- the example measurement pad 1600 of FIG. 16 can be used to determine wave slowness (i.e., inverse of wave velocity) and/or a mudcake thickness 6 .
- the example measurement pad 1600 can, for example, be integrated with the example probe packer assembly 1300 of FIG. 15 , and/or may be constructed similarly to the example packer assembly of FIGS. 13A , 13 B, 14 and/or 15 .
- the example measurement pad 1600 of FIG. 16 includes an oblique transmitter 1605 and two oblique receivers 1610 and 1611 spaced apart by a distance l.
- the example oblique transmitter 1605 and the example oblique receivers 1610 and 1611 of FIG. 16 can be operated to measure compressional wave slowness and/or shear wave slowness.
- the example oblique transmitter 1605 of FIG. 16 operates at ultrasonic frequencies, as discussed below in connection with EQN (13). While two receivers 1610 and 1611 are shown in FIG. 16 , three or more receivers may be used.
- the example transmitter 1605 is controlled by a transmit electronics module 1615 .
- the example receivers 1610 , 1611 are coupled to respective receive electronics modules 1620 and 1621 that, in some examples, are similar to the example receive electronics module 1425 of FIG. 14 .
- the transmitter 1605 emits a wave at a frequency high enough to generate refracted waves (e.g. compressional and shear waves) in the mudcake layer 205 , as indicated by arrows 1625 .
- Examples signals collected by the example receivers 1610 and 1611 are shown in FIG. 17A .
- the upper graph of FIG. 17A shows an example measured signal 1705 at the receiver 1610 .
- the example signal 1705 includes a refracted compressional wave 1710 and, in some cases, a refracted shear wave 1715 .
- the lower graph of FIG. 17A shows an example measured signal 1720 at the receiver 1611 , which is further away from the transmitter 1605 than the receiver 1610 .
- the example signal 1720 includes a refracted compressional wave 1725 and, in some cases, a refracted shear wave 1730 .
- the arrival time difference 1735 of the compressional waves 1710 and 1725 is equal to the product of the compressional wave slowness (i.e.
- the arrival time difference 1740 of the shear waves 1715 and 1730 is equal to the product of the shear wave slowness (i.e. the inverse of the shear wave velocity v s ) and the distance/between the two receivers 1610 and 1611 .
- the shear wave velocity v s can be determined from the compressional wave velocity v p , for example using an empirical correlation between shear wave velocity v s and compressional wave velocity v p .
- a bulk modulus B m can be computed using the compressional and shear wave slownesses.
- the bulk modulus B m may be computed using the following mathematical expression:
- B m ⁇ ⁇ ( v p 2 - 4 3 ⁇ v s 2 ) , EQN ⁇ ⁇ ( 12 )
- ⁇ mudcake density
- v p the compressional wave velocity
- v s the shear wave velocity measured by, for example the example wave slowness measurer 817 of FIG. 8 .
- the example measuring pad 1600 of FIG. 16 includes a high-frequency acoustic sensor 1630 .
- the high-frequency (e.g., ultrasonic) sensor 1630 is used to determine in situ mudcake thickness ⁇ .
- the example high-frequency sensor 1630 of FIG. 16 operates in a pulse-echo mode at high frequency and low amplitude.
- the example sensor 1630 transmits a pulse and listens for reflections. As illustrated in FIG. 17B , reflections will be received for each transmitted pulse. Time differences between the transmitted and received reflections can be used to determine mudcake thickness ⁇ by applying the principles of time-domain reflectometry.
- a time difference ⁇ t 1750 between reflections caused by the front and back faces of the mudcake 205 can be used to estimate the mudcake thickness ⁇ .
- the mudcake thickness ⁇ can be computed as the compressional wave velocity v p of the mudcake 205 multiplied by half of the time difference ⁇ t 1750 , where v p is determined, for example, using the example oblique transmitter 1606 and the example receivers 1610 and 1611 , as described above.
- the frequency(-ies) of the pulses transmitted by the example sensor 1630 and/or the example oblique transmitter 1605 are selected based on an expected thickness ⁇ of the mudcake 205 and the compressional wave velocity v p of the mudcake 205 .
- a mudcake thickness ⁇ of 1 millimeter (mm) and a compressional wave velocity v p of 1 kilometers (km) per second(s) (km/s) the pulse frequency needs to be at least 1 million cycles per second (MHz). Higher frequencies (e.g., 10 MHz) may be used to improve the resolution of the mudcake thickness measurement.
- lower frequencies e.g., 0.5 MHz or 1 MHz are used.
- FIGS. 13A , 13 B, and 14 - 16 While example manners of implementing packer assemblies have been illustrated in FIGS. 13A , 13 B, and 14 - 16 , one or more of the elements illustrated in FIGS. 13A , 13 B, 14 - 16 may be combined, divided, re-arranged, omitted, eliminated and/or implemented in any other way.
- the example sensor 1302 , the example measuring apparatus 1400 , the example pressure oscillation device 1405 , the example receive electronics module 1425 , the example amplifier 1435 , the example ADC 1440 , the example transmitter 1605 , the example receivers 1610 , the example transmit electronics module 1615 , the example receive electronics modules 1620 , 1621 , and/or the example sensor 1630 may be implemented by hardware, software, firmware and/or any combination of hardware, software and/or firmware.
- a packer assembly may include devices, sensors, pumps, sample containers, control elements, interfaces, data structures, and/or elements instead of, or in addition to, those illustrated in FIGS. 13A , 13 B, and 14 - 16 and/or may include more than one of any or all of the illustrated elements.
- FIGS. 18 , 19 and 20 illustrate example processes that may be carried out to implement any or all of the example sampling control modules described herein.
- the example processes of FIGS. 18 , 19 and/or 20 may be carried out by a processor, a controller and/or any other suitable processing device.
- the processes of FIGS. 18 , 19 and/or 20 may be embodied in coded instructions stored on a tangible medium such as a flash memory, a read-only memory (ROM) and/or random-access memory (RAM) associated with a processor (e.g., the example processor P 105 discussed below in connection with FIG. 21 ).
- ROM read-only memory
- RAM random-access memory
- FIGS. 18 , 19 and 20 illustrate example processes that may be carried out to implement any or all of the example sampling control modules described herein.
- FIGS. 18 , 19 and/or 20 may be carried out by a processor, a controller and/or any other suitable processing device.
- the processes of FIGS. 18 , 19 and/or 20 may
- FIGS. 18 , 19 and/or 20 may be implemented using any combination(s) of circuit(s), ASIC(s), PLD(s), FPLD(s), discrete logic, hardware, firmware, etc. Also, some or all of the example processes of FIGS. 18 , 19 and/or 20 may be implemented manually or as any combination of any of the foregoing techniques, for example, any combination of firmware, software, discrete logic and/or hardware. Further, although the example operations of FIGS. 18 , 19 and 20 are described with reference to the flowcharts of FIGS. 18 , 19 and 20 , many other methods of implementing the operations of FIGS. 18 , 19 and/or 20 may be employed.
- any or all of the example processes of FIGS. 18 , 19 and/or 20 may be carried out sequentially and/or carried out in parallel by, for example, separate processing threads, processors, devices, discrete logic, circuits, etc.
- the example process of FIG. 18 begins with the example pressure data collector 805 performing a pre-cleanup pressure test (block 1805 ).
- the example drawdown pressure estimator 850 estimates a drawdown pressure ⁇ p E that is expected to occur during a cleanup pumpout using, for example, EQN (10) (block 1810 ).
- a mudcake hydraulic resistivity R m is estimated by, for example carrying out the example process of FIG. 19 and/or the example process of FIG. 20 (block 1815 ).
- the example invasion velocity estimator 835 estimates a mud filtrate invasion velocity v through the mudcake leakage using, for example, EQN (1) (block 1820 ).
- An estimate of mud filtrate contamination versus virgin formation fluid is then computed using, for example, EQN (8) (block 1825 ).
- the sampling tool 510 is repositioned in the wellbore 11 (block 1835 ) and control returns to block 1805 to perform another pumpout pre-test.
- the example sampling decision logic 860 initiates a pumpout cleanup process (block 1840 ).
- the example pressure data collector 805 measures the actual drawdown pressure ⁇ p actual (block 1845 ).
- the example optical density measurer 806 measures an initial optical density (block 1850 ).
- a difference between the estimated and actual drawdown pressures is not less than a threshold (block 1855 )
- the sampling tool 510 is repositioned in the wellbore 11 (block 1835 ) and control returns to block 1805 to perform another pumpout pre-test.
- the sampling tool 510 continues the pumpout cleanup operation for a specified period of time (block 1860 ).
- the optical density measurer 806 measures another optical density (block 1865 ).
- the sampling tool 510 is repositioned in the wellbore 11 (block 1835 ) and control returns to block 1805 to perform another pumpout pre-test. Additionally or alternatively, a cleanup trend may be analyzed (see FIGS. 9 and 10 ) and mudcake leakage inferred from the same. For example, a reversal in clean-up trend may indicate high mudcake leakage.
- the sampling tool 510 collects one or more formation fluid samples (block 1875 ). The sampling tool 510 is then repositioned in the wellbore 11 (block 1835 ) and control returns to block 1805 to perform another pumpout pre-test.
- the example process of FIG. 19 may be carried out to estimate a mudcake hydraulic resistance R m .
- the example transmitter 1605 and the example receivers 1610 and 1611 of FIG. 1 perform a first ultrasonic measurement using oblique waves to determine compressional and/or shear wave slownesses (or velocities) of the mudcake 205 (block 1905 ).
- the bulk modulus B m is computed using, for example, EQN (12), assuming a mudcake density ⁇ ( 1910 ).
- the example mudcake thickness measurer 810 determines the thickness 6 of the mudcake 205 (block 1915 ).
- the example sensor 1630 can be used to perform a second ultrasonic measurement using non-oblique (i.e., normal) wave to measure the propagation time ⁇ t of an ultrasonic wave through the mudcake 205 .
- the propagation time ⁇ t and the compressional wave velocity v p can be used to determine the mudcake thickness ⁇ .
- the example pressure variation measurer 815 measures a pressure variation (e.g., ⁇ p and ⁇ t) across the mudcake 205 (block 1920 ) and the example permeability estimator 830 estimates a mudcake permeability k m (or a filtrate mobility k m / ⁇ f ) based on the measured pressure variation (block 1925 ).
- the low frequency measurement described above in connection with FIGS. 13-15 and the calculated mudcake thickness 6 can be used to compute the pressure diffusivity using, for example, the left portion of EQN (4).
- the filtrate mobility can be computed using, for example, the right portion EQN (4).
- the example hydraulic resistance estimator 825 computes a mudcake hydraulic resistance R m using, for example, EQN (3) (block 1930 ). Control then returns from the example process of FIG. 19 to, for example, block 1820 of FIG. 18 .
- the example process of FIG. 20 is another process that may be carried out to estimate a mudcake hydraulic resistance R m .
- the example process of FIG. 20 begins with the example pressure data collector 805 measuring a first sandface pressure p SF1 at a first wellbore pressure p W1 (block 2005 ) using a pretest (such as shown in FIG. 11 ).
- the pressure data collector 805 measures a second sandface pressure p SF2 at a second wellbore pressure p W2 (block 2010 ) using a pretest.
- the example hydraulic resistance estimator 825 computes a mudcake hydraulic resistance R m using, for example, EQN (2) (block 2015 ).
- the formation hydraulic resistance R m is assumed, or estimated from at least one of the two pretests, for example using one of the drawdown mobilities k D / ⁇ associated with one of the pretests. Control then returns from the example process of FIG. 20 to, for example, block 1820 of FIG. 18 .
- FIG. 21 is a schematic diagram of an example processor platform P 100 that may be used and/or programmed to implement all or a portion of any or all of the example measuring modules 805 - 807 , the example mudcake thickness measurer 810 , the example pressure variation measurer 815 , the example mudcake quality estimator 820 , the example hydraulic resistance estimator 825 , the example permeability estimator 830 , the example invasion velocity estimator 840 , the example leakage estimator 850 , the example drawdown pressure estimator 850 , the example sampling decision logic 860 and/or, more generally, the example sampling control modules disclosed herein.
- the processor platform P 100 can be implemented by one or more general purpose processors, processor cores, microcontrollers, etc.
- the processor platform P 100 of the example of FIG. 21 includes at least one general purpose programmable processor P 105 .
- the processor P 105 executes coded instructions P 110 and/or P 112 present in main memory of the processor P 105 (e.g., within a RAM P 115 and/or a ROM P 120 ).
- the processor P 105 may be any type of processing unit, such as a processor core, a processor and/or a microcontroller.
- the processor P 105 may execute, among other things, the example processes of FIG. 18 , 19 and/or 20 to implement the example methods and apparatus described herein.
- the processor P 105 is in communication with the main memory (including a ROM P 120 and/or the RAM P 115 ) via a bus P 125 ,
- the RAM P 115 may be implemented by dynamic random-access memory (DRAM), synchronous dynamic random-access memory (SDRAM), and/or any other type of RAM device, and ROM may be implemented by flash memory and/or any other desired type of memory device. Access to the memory P 115 and the memory P 120 may be controlled by a memory controller (not shown).
- the processor platform P 100 also includes an interface circuit P 130 .
- the interface circuit P 130 may be implemented by any type of interface standard, such as an external memory interface, serial port, general purpose input/output, etc.
- One or more input devices P 135 and one or more output devices P 140 are connected to the interface circuit P 130 .
Abstract
Description
where Rm is the hydraulic resistance of the mudcake. Using two pairs of wellbore pressures pW1 and pW2 and the sandface pressures pSF1 and pSF2, the hydraulic resistance of the mudcake Rm may be computed using the following mathematical expression:
where ΔPw=PW1−PW2, ΔpSF=pSF2, and Rf is the hydraulic resistance of the formation, for which a reasonable estimate is usually known a priori, or may be estimated in situ, as preferred.
where μf is the viscosity of the mud filtrate, which is usually known, at least approximately, a priori. Alternatively, the permeability estimator 830 may determine a mud filtrate mobility in the mudcake km/μf.
where δ is the thickness of the
Q p =Q 0(R(t))+Q f(R(t))+Q L)(R(t)), EQN (5)
where the second term represents contamination due to mud filtrate leakage through the
where rw is the wellbore radius. The amount of contamination due to mud filtrate leakage, as a function of time, can be estimated as:
where v is the estimated invasion velocity of the
For a constant pumpout rate Qp, the value of EQN (7) decreases as a function of V2/3, while the value of EQN (8) increases as function of V1/3. As such, the initial cleanup trends illustrated in
where Qp is the production rate of the
t L =L 2/η. EQN (11)
where ρ is mudcake density, vp is the compressional wave velocity and vs is the shear wave velocity measured by, for example the example
f H =v p/δ EQN (13)
For a mudcake thickness δ of 1 millimeter (mm) and a compressional wave velocity vp of 1 kilometers (km) per second(s) (km/s), the pulse frequency needs to be at least 1 million cycles per second (MHz). Higher frequencies (e.g., 10 MHz) may be used to improve the resolution of the mudcake thickness measurement. However, for thicker and/or more
where, the phase shift α can be computed as α=ωΔt, where ω is the frequency of the pressure wave generated in the formation by the pressure oscillation or
Claims (22)
Priority Applications (3)
| Application Number | Priority Date | Filing Date | Title |
|---|---|---|---|
| US12/122,077 US8042387B2 (en) | 2008-05-16 | 2008-05-16 | Methods and apparatus to control a formation testing operation based on a mudcake leakage |
| PCT/US2009/040065 WO2009139992A2 (en) | 2008-05-16 | 2009-04-09 | Methods and apparatus to control a formation testing operation based on a mudcake leakage |
| US13/229,348 US8429962B2 (en) | 2008-05-16 | 2011-09-09 | Methods and apparatus to control a formation testing operation based on a mudcake leakage |
Applications Claiming Priority (1)
| Application Number | Priority Date | Filing Date | Title |
|---|---|---|---|
| US12/122,077 US8042387B2 (en) | 2008-05-16 | 2008-05-16 | Methods and apparatus to control a formation testing operation based on a mudcake leakage |
Related Child Applications (1)
| Application Number | Title | Priority Date | Filing Date |
|---|---|---|---|
| US13/229,348 Division US8429962B2 (en) | 2008-05-16 | 2011-09-09 | Methods and apparatus to control a formation testing operation based on a mudcake leakage |
Publications (2)
| Publication Number | Publication Date |
|---|---|
| US20090282907A1 US20090282907A1 (en) | 2009-11-19 |
| US8042387B2 true US8042387B2 (en) | 2011-10-25 |
Family
ID=41314866
Family Applications (2)
| Application Number | Title | Priority Date | Filing Date |
|---|---|---|---|
| US12/122,077 Expired - Fee Related US8042387B2 (en) | 2008-05-16 | 2008-05-16 | Methods and apparatus to control a formation testing operation based on a mudcake leakage |
| US13/229,348 Active US8429962B2 (en) | 2008-05-16 | 2011-09-09 | Methods and apparatus to control a formation testing operation based on a mudcake leakage |
Family Applications After (1)
| Application Number | Title | Priority Date | Filing Date |
|---|---|---|---|
| US13/229,348 Active US8429962B2 (en) | 2008-05-16 | 2011-09-09 | Methods and apparatus to control a formation testing operation based on a mudcake leakage |
Country Status (2)
| Country | Link |
|---|---|
| US (2) | US8042387B2 (en) |
| WO (1) | WO2009139992A2 (en) |
Cited By (1)
| Publication number | Priority date | Publication date | Assignee | Title |
|---|---|---|---|---|
| US9399913B2 (en) | 2013-07-09 | 2016-07-26 | Schlumberger Technology Corporation | Pump control for auxiliary fluid movement |
Families Citing this family (18)
| Publication number | Priority date | Publication date | Assignee | Title |
|---|---|---|---|---|
| US8004421B2 (en) | 2006-05-10 | 2011-08-23 | Schlumberger Technology Corporation | Wellbore telemetry and noise cancellation systems and method for the same |
| US8060311B2 (en) * | 2008-06-23 | 2011-11-15 | Schlumberger Technology Corporation | Job monitoring methods and apparatus for logging-while-drilling equipment |
| US8960329B2 (en) * | 2008-07-11 | 2015-02-24 | Schlumberger Technology Corporation | Steerable piloted drill bit, drill system, and method of drilling curved boreholes |
| US9222352B2 (en) | 2010-11-18 | 2015-12-29 | Schlumberger Technology Corporation | Control of a component of a downhole tool |
| US8960330B2 (en) | 2010-12-14 | 2015-02-24 | Schlumberger Technology Corporation | System and method for directional drilling |
| RU2466273C2 (en) * | 2010-12-30 | 2012-11-10 | Шлюмберже Текнолоджи Б.В. | Method to determine thickness of clayey crust |
| WO2012103069A2 (en) * | 2011-01-28 | 2012-08-02 | Halliburton Energy Services, Inc. | Method and apparatus for evaluating fluid sample contamination by using multi sensors |
| US8757986B2 (en) | 2011-07-18 | 2014-06-24 | Schlumberger Technology Corporation | Adaptive pump control for positive displacement pump failure modes |
| US20130049983A1 (en) | 2011-08-26 | 2013-02-28 | John Rasmus | Method for calibrating a hydraulic model |
| US9228430B2 (en) | 2011-08-26 | 2016-01-05 | Schlumberger Technology Corporation | Methods for evaluating cuttings density while drilling |
| US9394783B2 (en) | 2011-08-26 | 2016-07-19 | Schlumberger Technology Corporation | Methods for evaluating inflow and outflow in a subterranean wellbore |
| RU2474688C1 (en) * | 2011-09-30 | 2013-02-10 | Шлюмберже Текнолоджи Б.В. | Method for determining acoustic characteristics of clay cake |
| RU2473805C1 (en) * | 2011-09-30 | 2013-01-27 | Шлюмберже Текнолоджи Б.В. | Method to determine acoustic characteristics of clayey crust |
| US20150159477A1 (en) * | 2013-12-11 | 2015-06-11 | Schlumberger Technology Corporation | Method of treating a subterranean formation |
| GB2541925B (en) * | 2015-09-04 | 2021-07-14 | Equinor Energy As | System and method for obtaining an effective bulk modulus of a managed pressure drilling system |
| CN106996291B (en) * | 2017-05-24 | 2018-08-17 | 中国矿业大学(北京) | Self-cleaning fluid level measuring instrument and its system |
| AU2019443517A1 (en) * | 2019-04-29 | 2021-09-23 | Halliburton Energy Services, Inc. | Method to measure and predict downhole rheological properties |
| NO20211213A1 (en) | 2019-06-20 | 2021-10-08 |
Citations (13)
| Publication number | Priority date | Publication date | Assignee | Title |
|---|---|---|---|---|
| US5233866A (en) | 1991-04-22 | 1993-08-10 | Gulf Research Institute | Apparatus and method for accurately measuring formation pressures |
| US5602334A (en) | 1994-06-17 | 1997-02-11 | Halliburton Company | Wireline formation testing for low permeability formations utilizing pressure transients |
| US5644076A (en) | 1996-03-14 | 1997-07-01 | Halliburton Energy Services, Inc. | Wireline formation tester supercharge correction method |
| US5703286A (en) | 1995-10-20 | 1997-12-30 | Halliburton Energy Services, Inc. | Method of formation testing |
| US6301959B1 (en) | 1999-01-26 | 2001-10-16 | Halliburton Energy Services, Inc. | Focused formation fluid sampling probe |
| US6769296B2 (en) | 2001-06-13 | 2004-08-03 | Schlumberger Technology Corporation | Apparatus and method for measuring formation pressure using a nozzle |
| US6832515B2 (en) | 2002-09-09 | 2004-12-21 | Schlumberger Technology Corporation | Method for measuring formation properties with a time-limited formation test |
| US20050171699A1 (en) * | 2004-01-30 | 2005-08-04 | Alexander Zazovsky | Method for determining pressure of earth formations |
| US20050235745A1 (en) * | 2004-03-01 | 2005-10-27 | Halliburton Energy Services, Inc. | Methods for measuring a formation supercharge pressure |
| US20060129365A1 (en) * | 2004-10-22 | 2006-06-15 | Schlumberger Technology Corporation | Method and system for estimating the amount of supercharging in a formation |
| US7234521B2 (en) | 2003-03-10 | 2007-06-26 | Baker Hughes Incorporated | Method and apparatus for pumping quality control through formation rate analysis techniques |
| US7331223B2 (en) * | 2003-01-27 | 2008-02-19 | Schlumberger Technology Corporation | Method and apparatus for fast pore pressure measurement during drilling operations |
| US20090165548A1 (en) * | 2007-12-31 | 2009-07-02 | Julian Pop | Systems and methods for well data analysis |
Family Cites Families (1)
| Publication number | Priority date | Publication date | Assignee | Title |
|---|---|---|---|---|
| JP3711752B2 (en) * | 1998-07-09 | 2005-11-02 | 株式会社日立製作所 | Packet communication device |
-
2008
- 2008-05-16 US US12/122,077 patent/US8042387B2/en not_active Expired - Fee Related
-
2009
- 2009-04-09 WO PCT/US2009/040065 patent/WO2009139992A2/en active Application Filing
-
2011
- 2011-09-09 US US13/229,348 patent/US8429962B2/en active Active
Patent Citations (16)
| Publication number | Priority date | Publication date | Assignee | Title |
|---|---|---|---|---|
| US5233866A (en) | 1991-04-22 | 1993-08-10 | Gulf Research Institute | Apparatus and method for accurately measuring formation pressures |
| US5602334A (en) | 1994-06-17 | 1997-02-11 | Halliburton Company | Wireline formation testing for low permeability formations utilizing pressure transients |
| US5703286A (en) | 1995-10-20 | 1997-12-30 | Halliburton Energy Services, Inc. | Method of formation testing |
| US5644076A (en) | 1996-03-14 | 1997-07-01 | Halliburton Energy Services, Inc. | Wireline formation tester supercharge correction method |
| US6301959B1 (en) | 1999-01-26 | 2001-10-16 | Halliburton Energy Services, Inc. | Focused formation fluid sampling probe |
| US6769296B2 (en) | 2001-06-13 | 2004-08-03 | Schlumberger Technology Corporation | Apparatus and method for measuring formation pressure using a nozzle |
| US6832515B2 (en) | 2002-09-09 | 2004-12-21 | Schlumberger Technology Corporation | Method for measuring formation properties with a time-limited formation test |
| US7331223B2 (en) * | 2003-01-27 | 2008-02-19 | Schlumberger Technology Corporation | Method and apparatus for fast pore pressure measurement during drilling operations |
| US7234521B2 (en) | 2003-03-10 | 2007-06-26 | Baker Hughes Incorporated | Method and apparatus for pumping quality control through formation rate analysis techniques |
| US20050171699A1 (en) * | 2004-01-30 | 2005-08-04 | Alexander Zazovsky | Method for determining pressure of earth formations |
| US7031841B2 (en) | 2004-01-30 | 2006-04-18 | Schlumberger Technology Corporation | Method for determining pressure of earth formations |
| US20050235745A1 (en) * | 2004-03-01 | 2005-10-27 | Halliburton Energy Services, Inc. | Methods for measuring a formation supercharge pressure |
| US7243537B2 (en) * | 2004-03-01 | 2007-07-17 | Halliburton Energy Services, Inc | Methods for measuring a formation supercharge pressure |
| US20060129365A1 (en) * | 2004-10-22 | 2006-06-15 | Schlumberger Technology Corporation | Method and system for estimating the amount of supercharging in a formation |
| US7558716B2 (en) * | 2004-10-22 | 2009-07-07 | Schlumberger Technology Corporation | Method and system for estimating the amount of supercharging in a formation |
| US20090165548A1 (en) * | 2007-12-31 | 2009-07-02 | Julian Pop | Systems and methods for well data analysis |
Non-Patent Citations (3)
| Title |
|---|
| Akram et al., "A Model to Predict Wireline Formation Tester Sample Contamination," SPE 48958, pp. 27-33, SPE Annual Technical Conference & Exh., New Orleans, LA (Sep. 27-30 1996). |
| Pop et al., "Operational Aspects of Formation Pressure Measurements while Drilling," SPE/IADC 92494, pp. 1-16, SPE/IADC Drilling Conference, Amsterdam, The Netherlands (Feb. 23-25 2005). |
| Proett, et al., "Formation Pressure Testing in the Dynamic Drilling Environment," IADC/SPE 87090, pp. 1-11, IADC/SPE Drilling Conference, Dallas, TX (Mar. 2-4 2004). |
Cited By (1)
| Publication number | Priority date | Publication date | Assignee | Title |
|---|---|---|---|---|
| US9399913B2 (en) | 2013-07-09 | 2016-07-26 | Schlumberger Technology Corporation | Pump control for auxiliary fluid movement |
Also Published As
| Publication number | Publication date |
|---|---|
| US20110320127A1 (en) | 2011-12-29 |
| US8429962B2 (en) | 2013-04-30 |
| WO2009139992A3 (en) | 2010-03-18 |
| US20090282907A1 (en) | 2009-11-19 |
| WO2009139992A2 (en) | 2009-11-19 |
Similar Documents
| Publication | Publication Date | Title |
|---|---|---|
| US8042387B2 (en) | Methods and apparatus to control a formation testing operation based on a mudcake leakage | |
| US8136395B2 (en) | Systems and methods for well data analysis | |
| US7032661B2 (en) | Method and apparatus for combined NMR and formation testing for assessing relative permeability with formation testing and nuclear magnetic resonance testing | |
| US9243493B2 (en) | Fluid density from downhole optical measurements | |
| US8788210B2 (en) | Job monitoring methods and apparatus for logging-while-drilling equipment | |
| CA2488475C (en) | Downhole fluid pumping apparatus and method | |
| US7711488B2 (en) | Methods and apparatus to monitor contamination levels in a formation fluid | |
| US7913556B2 (en) | Methods and apparatus to determine the compressibility of a fluid | |
| US9091150B2 (en) | Downhole formation tester apparatus and methods | |
| US9243628B2 (en) | Adaptive pump control for positive displacement pump failure modes | |
| US8757254B2 (en) | Adjustment of mud circulation when evaluating a formation | |
| US8397817B2 (en) | Methods for downhole sampling of tight formations | |
| US20110042071A1 (en) | Clean fluid sample for downhole measurements | |
| US20220403737A1 (en) | Determining Asphaltene Onset | |
| US9581019B2 (en) | Measurement pretest drawdown methods and apparatus | |
| US10295449B2 (en) | Determining resonance frequency and quality factor | |
| US20160053607A1 (en) | Detecting and Compensating for the Effects of Pump Half-Stroking | |
| CA2424112C (en) | A method and apparatus for combined nmr and formation testing for assessing relative permeability with formation testing and nuclear magnetic resonance testing |
Legal Events
| Date | Code | Title | Description |
|---|---|---|---|
| AS | Assignment |
Owner name: SCHLUMBERGER TECHNOLOGY CORPORATION, TEXAS Free format text: ASSIGNMENT OF ASSIGNORS INTEREST;ASSIGNORS:ZAZOVSKY, ALEXANDER;GARCIA-OSUNA, FERNANDO;VILLAREAL, STEVE G.;AND OTHERS;REEL/FRAME:021106/0443;SIGNING DATES FROM 20080521 TO 20080612 Owner name: SCHLUMBERGER TECHNOLOGY CORPORATION, TEXAS Free format text: ASSIGNMENT OF ASSIGNORS INTEREST;ASSIGNORS:ZAZOVSKY, ALEXANDER;GARCIA-OSUNA, FERNANDO;VILLAREAL, STEVE G.;AND OTHERS;SIGNING DATES FROM 20080521 TO 20080612;REEL/FRAME:021106/0443 |
|
| ZAAA | Notice of allowance and fees due |
Free format text: ORIGINAL CODE: NOA |
|
| ZAAB | Notice of allowance mailed |
Free format text: ORIGINAL CODE: MN/=. |
|
| STCF | Information on status: patent grant |
Free format text: PATENTED CASE |
|
| FPAY | Fee payment |
Year of fee payment: 4 |
|
| MAFP | Maintenance fee payment |
Free format text: PAYMENT OF MAINTENANCE FEE, 8TH YEAR, LARGE ENTITY (ORIGINAL EVENT CODE: M1552); ENTITY STATUS OF PATENT OWNER: LARGE ENTITY Year of fee payment: 8 |
|
| FEPP | Fee payment procedure |
Free format text: MAINTENANCE FEE REMINDER MAILED (ORIGINAL EVENT CODE: REM.); ENTITY STATUS OF PATENT OWNER: LARGE ENTITY |
|
| LAPS | Lapse for failure to pay maintenance fees |
Free format text: PATENT EXPIRED FOR FAILURE TO PAY MAINTENANCE FEES (ORIGINAL EVENT CODE: EXP.); ENTITY STATUS OF PATENT OWNER: LARGE ENTITY |
|
| STCH | Information on status: patent discontinuation |
Free format text: PATENT EXPIRED DUE TO NONPAYMENT OF MAINTENANCE FEES UNDER 37 CFR 1.362 |
|
| FP | Lapsed due to failure to pay maintenance fee |
Effective date: 20231025 |