US8098328B2 - Image signal processing apparatus, image display and image display method - Google Patents
Image signal processing apparatus, image display and image display method Download PDFInfo
- Publication number
- US8098328B2 US8098328B2 US11/810,962 US81096207A US8098328B2 US 8098328 B2 US8098328 B2 US 8098328B2 US 81096207 A US81096207 A US 81096207A US 8098328 B2 US8098328 B2 US 8098328B2
- Authority
- US
- United States
- Prior art keywords
- region
- measurement
- black band
- increment
- measurement region
- Prior art date
- Legal status (The legal status is an assumption and is not a legal conclusion. Google has not performed a legal analysis and makes no representation as to the accuracy of the status listed.)
- Expired - Fee Related, expires
Links
- 238000012545 processing Methods 0.000 title claims abstract description 71
- 238000000034 method Methods 0.000 title claims description 136
- 238000005259 measurement Methods 0.000 claims abstract description 282
- 230000008569 process Effects 0.000 claims description 119
- 238000001514 detection method Methods 0.000 claims description 113
- 230000000630 rising effect Effects 0.000 description 12
- FFBHFFJDDLITSX-UHFFFAOYSA-N benzyl N-[2-hydroxy-4-(3-oxomorpholin-4-yl)phenyl]carbamate Chemical compound OC1=C(NC(=O)OCC2=CC=CC=C2)C=CC(=C1)N1CCOCC1=O FFBHFFJDDLITSX-UHFFFAOYSA-N 0.000 description 10
- 239000002131 composite material Substances 0.000 description 6
- 239000011159 matrix material Substances 0.000 description 6
- 201000005569 Gout Diseases 0.000 description 4
- 230000008859 change Effects 0.000 description 4
- 238000000926 separation method Methods 0.000 description 4
- 230000014509 gene expression Effects 0.000 description 3
- 238000012937 correction Methods 0.000 description 2
- 238000010586 diagram Methods 0.000 description 2
- 230000009467 reduction Effects 0.000 description 2
- 101150081507 HBP1 gene Proteins 0.000 description 1
- 230000004075 alteration Effects 0.000 description 1
- 230000000903 blocking effect Effects 0.000 description 1
- 230000001413 cellular effect Effects 0.000 description 1
- 238000006243 chemical reaction Methods 0.000 description 1
- 239000003086 colorant Substances 0.000 description 1
- 230000003247 decreasing effect Effects 0.000 description 1
- 238000013461 design Methods 0.000 description 1
- 230000000694 effects Effects 0.000 description 1
- 238000005401 electroluminescence Methods 0.000 description 1
- 239000004973 liquid crystal related substance Substances 0.000 description 1
- 238000012986 modification Methods 0.000 description 1
- 230000004048 modification Effects 0.000 description 1
- 230000000750 progressive effect Effects 0.000 description 1
Images


Classifications
-
- H—ELECTRICITY
- H04—ELECTRIC COMMUNICATION TECHNIQUE
- H04N—PICTORIAL COMMUNICATION, e.g. TELEVISION
- H04N7/00—Television systems
- H04N7/01—Conversion of standards, e.g. involving analogue television standards or digital television standards processed at pixel level
- H04N7/0117—Conversion of standards, e.g. involving analogue television standards or digital television standards processed at pixel level involving conversion of the spatial resolution of the incoming video signal
- H04N7/0122—Conversion of standards, e.g. involving analogue television standards or digital television standards processed at pixel level involving conversion of the spatial resolution of the incoming video signal the input and the output signals having different aspect ratios
-
- G—PHYSICS
- G09—EDUCATION; CRYPTOGRAPHY; DISPLAY; ADVERTISING; SEALS
- G09G—ARRANGEMENTS OR CIRCUITS FOR CONTROL OF INDICATING DEVICES USING STATIC MEANS TO PRESENT VARIABLE INFORMATION
- G09G5/00—Control arrangements or circuits for visual indicators common to cathode-ray tube indicators and other visual indicators
- G09G5/003—Details of a display terminal, the details relating to the control arrangement of the display terminal and to the interfaces thereto
- G09G5/005—Adapting incoming signals to the display format of the display terminal
-
- G—PHYSICS
- G09—EDUCATION; CRYPTOGRAPHY; DISPLAY; ADVERTISING; SEALS
- G09G—ARRANGEMENTS OR CIRCUITS FOR CONTROL OF INDICATING DEVICES USING STATIC MEANS TO PRESENT VARIABLE INFORMATION
- G09G2340/00—Aspects of display data processing
- G09G2340/04—Changes in size, position or resolution of an image
- G09G2340/0442—Handling or displaying different aspect ratios, or changing the aspect ratio
-
- G—PHYSICS
- G09—EDUCATION; CRYPTOGRAPHY; DISPLAY; ADVERTISING; SEALS
- G09G—ARRANGEMENTS OR CIRCUITS FOR CONTROL OF INDICATING DEVICES USING STATIC MEANS TO PRESENT VARIABLE INFORMATION
- G09G2360/00—Aspects of the architecture of display systems
- G09G2360/16—Calculation or use of calculated indices related to luminance levels in display data
Definitions
- the present invention relates to an image signal processing apparatus and an image display each having a function of detecting a black band region included in an image signal, and an image display method performing such a black band detecting process.
- Image displays such as television receivers (TVs) typically have an image processing function which makes image quality correction to an input image (for example, functions such as luminance or contrast control, and contour correction).
- an image processing function is performed by acquiring, for example, the average peak level (APL) of an input image signal or the histogram distribution of a luminance level, and is effectively applied, because gradation is improved by preventing an image from appearing too dark or preventing poor reproduction of black.
- APL average peak level
- image signals from DVDs containing Cinemascope size images or image signals transmitted from broadcast stations there are a signal called a letterbox including black band regions above and below an image region, and a signal called a side panel including black band regions on the right and the left of an image region.
- a signal called a letterbox including black band regions above and below an image region there are a signal called a side panel including black band regions on the right and the left of an image region.
- an image signal processing apparatus an image display and an image display method capable of detecting a black band region included in an input image signal in a shorter time.
- a first image signal processing apparatus which may include a measuring means for measuring in a unit frame period whether each pixel in a designated measurement region of an input image signal has a signal level less than a threshold value; and a black band detecting means for detecting a black band region included in the input image signal on the basis of a measurement result from the measuring means.
- the above-described black band detecting means may detect the pixel number of pixels with a signal level less than a threshold value which continues from an end of the measurement region, and may perform the detecting process along an end of the measurement region to determine the minimum value of the detected pixel number as the width of a black band region.
- a unit frame may mean one or a few image frames or one or a few image fields.
- a first image display which may include a display means for displaying an image on the basis of a detection result from the black band detecting means in addition to the measuring means and the black band detecting means in the first image signal processing apparatus according to the embodiment of the invention.
- a first image display method which may include measuring in a unit frame period whether each pixel in a designated measurement region of an input image signal has a signal level less than a threshold value; detecting a black band region included in the input image signal on the basis of a measurement result; and displaying an image on the basis of a detection result of the black band region.
- the first image display and the first image display method according to the embodiment of the invention whether each pixel in a measurement region of an input image signal has a signal level less than a threshold value may be measured in a unit frame period, and on the basis of the measurement result, a black band region included in the input image signal is detected.
- a second image signal processing apparatus which may include a measuring means for measuring in a unit frame period whether each pixel in a designated measurement region of an input image signal has a signal level less than a threshold value; a basic region providing means for providing a basic region as a basic part to be measured; an increment/decrement value providing means for providing an increment/decrement value in the measurement region; a measurement region determining means for determining the measurement region on the basis of the basic region and the increment/decrement value; and a black band detecting means for detecting a black band region included in the input image signal on the basis of a measurement result from the measuring means, wherein the increment/decrement value providing means resets the increment/decrement value to half of the previous value, the measurement region determining means selectively resets a new measurement region by adding or subtracting the new increment/decrement value to or from the previous measurement region depending on whether the boundary between a black band region and an image region is detected by the black band detecting means,
- a second image display which may include a display means for displaying an image on the basis of a detection result from the black band detecting means in addition to the above-mentioned means.
- a second image display method which may include measuring in a unit frame period whether each pixel in a designated measurement region of an input image signal has a signal level less than a threshold value; providing a basic region as a basic part to be measured; providing an increment/decrement value in the measurement region; determining the measurement region on the basis of the basic region and the increment/decrement value; detecting a black band region included in the input image signal on the basis of a measurement result; and displaying an image on the basis of a detection result of the black band region, wherein the increment/decrement value is reset to half of the previous value, a new measurement region is selectively reset by adding or subtracting the new increment/decrement value to or from the previous measurement region depending on whether the boundary between a black band region and an image region is detected from the measurement result, and the measurement is performed on a new measurement region.
- the second image display and the second image display method according to the embodiment of the invention, whether each pixel in a measurement region of an input image signal has a signal level less than a threshold value may be measured in a unit frame period, and on the basis of the measurement result, a black band region included in the input image signal is detected.
- a basic region as a basic part to be measured and an increment/decrement value in the measurement region may be provided, and on the basis of the basic region and the increment/decrement value, the above-described measurement region may be determined.
- a new measurement region may be set by adding or subtracting 1 ⁇ 2 of the previous increment/decrement value as a new increment/decrement value to or from the previous measurement region. Then, the measurement may be performed on a new measurement region.
- the first image display or the first image display method in the first image signal processing apparatus, the first image display or the first image display method according to the embodiment of the invention, whether each pixel in a measurement region of an input image signal has a signal level less than a threshold value may be measured in a unit frame period, and on the basis of the measurement result, a black band region included in the input image signal may be detected, so compared to related arts, a black band region included in the input image signal may be detected in a shorter time.
- the second image display or the second image display method from a measurement result of whether each pixel in a measurement region of an input image signal has a signal level less than a threshold value, the boundary between a black band region and an image region may be detected, and a new measurement region may be determined by adding or subtracting 1 ⁇ 2 of the previous increment/decrement value to or from the previous measurement region depending on whether the boundary is detected, and a new measurement region may be repeatedly measured, and on the basis of the measurement result, a black band region may be detected, so compared to related arts, a black band region included in the input image signal may be detected in a shorter time.
- FIG. 1 is a block diagram showing the whole structure of an image display according to an embodiment of the invention.
- FIG. 2 is a block diagram showing a detailed structure of a black band detecting section shown in FIG. 1 ;
- FIGS. 3A and 3B are schematic views for describing an input image signal including black band regions
- FIGS. 4A and 4B are schematic views for describing a measuring process by a measuring section
- FIG. 5 is a schematic view for describing an increment/decrement value in a measurement region
- FIG. 6 is a schematic view for describing a lower limit value of the width of an image region
- FIG. 7 is a timing chart for describing a process of measuring a horizontal back porch length
- FIG. 8 is a timing chart for describing a process of measuring a horizontal front porch length
- FIG. 9 is a timing chart for describing a process of measuring a vertical back porch length
- FIG. 10 is a timing chart for describing a process of measuring a vertical front porch length
- FIG. 11 is a flowchart showing a black band detecting process
- FIGS. 12A and 12B are schematic views for describing the black band detecting process
- FIGS. 13A and 13B are schematic views for describing binary search of a black band region in a vertical direction
- FIGS. 14A and 14B are schematic views for describing binary search of a black band region in a horizontal direction
- FIG. 15 is a flowchart showing the details of a black band detection starting process in FIG. 11 ;
- FIG. 16 is a flowchart showing the details of a boundary determining process 1 in FIG. 11 ;
- FIG. 17 is a flowchart showing the details of the boundary determining process 1 following FIG. 16 ;
- FIGS. 18A and 18B are schematic views for describing the boundary determining process 1 ;
- FIG. 19 is a flowchart showing the details of a boundary determining process 2 in FIG. 11 ;
- FIG. 20 is a flowchart showing the details of the boundary determining process 2 following FIG. 19 ;
- FIGS. 21A and 21B are schematic views for describing the boundary determining process 2 ;
- FIG. 22 is a flowchart showing the details of a black band detection determining process in FIG. 11 ;
- FIG. 23 is a flowchart showing the details of the black band detection determining process following FIG. 22 ;
- FIG. 24 is a flowchart showing an aspect ratio adjustment process on an input image signal
- FIGS. 25A , 25 B and 25 C are schematic views for describing a process of determining whether only a black band is present in a measurement region
- FIG. 26 is a flowchart showing the details of a scaling ratio computing process in FIG. 24 ;
- FIG. 27 is a flowchart showing the details of the scaling ratio computing process following FIG. 26 ;
- FIG. 28 is a schematic view for describing a measurement result in the case where a black band region is not present.
- FIGS. 29A , 29 B and 29 C are schematic views for describing an input image signal scaling process.
- FIG. 1 shows the whole structure of an image display according to an embodiment of the invention.
- the image display includes a tuner 11 , a Y/C separation circuit 12 , a chroma decoder 13 , a switch 14 , a black band detecting section 2 , an image processing section 3 , a matrix circuit 41 , a driver 42 and a display section 5 .
- An image signal processing apparatus and an image display method according to an embodiment of the invention are embodied by the image display according to the embodiment, so they will be also described below.
- Image signals inputted into the image display may be outputs from a VCR (Video Cassette Recorder), a DVD or the like in addition to a TV signal from a TV. It has become common practice for recent televisions and personal computers (PCs) to obtain image information from a plurality of kinds of media and display an image corresponding to each of the media.
- VCR Video Cassette Recorder
- PCs personal computers
- the tuner 11 receives and demodulates the TV signal from the TV, and outputs the TV signal as a composite video burst signal (CVBS).
- CVBS composite video burst signal
- the Y/C separation circuit 12 separates the composite video burst signal from the tuner 11 or a composite video burst signal from a VCR or a DVD 1 into a luminance signal Y 1 and a chrominance signal C 1 to output them.
- the chroma decoder 13 outputs the luminance signal Y 1 and the chrominance signal C 1 separated by the Y/C separation circuit 12 as YUV signals (Y 1 , U 1 , V 1 ) including the luminance signal Y 1 and color-difference signals U 1 and
- the YUV signals are image data of a two-dimensional digital image, and a set of pixel values corresponding to a position on an image.
- a luminance signal Y represents a luminance level, and takes an amplitude value between a white level which is 100% white and a black level.
- a 100% white image signal is 100 (IRE) in a unit called IRE (Institute of Radio Engineers) representing a relative ratio of an image signal.
- the black level is 0 IRE.
- the color-difference signals U and V correspond to a signal B-Y produced by subtracting the luminance signal Y from blue (B), and a signal R-Y produced by subtracting the luminance signal Y from red (R), respectively, and when the signals U and V are combined with the luminance signal Y, colors (hue, chroma saturation, luminance) can be shown.
- the switch 14 switches YUV signals from a plurality of kinds of media (in this case, the YUV signals (Y 1 , U 1 , V 1 ) and YUV signals (Y 2 , U 2 , V 2 ) from a DVD 2 ) so as to output selected signals as YUV signals (Yin, Uin, Vin).
- a plurality of kinds of media in this case, the YUV signals (Y 1 , U 1 , V 1 ) and YUV signals (Y 2 , U 2 , V 2 ) from a DVD 2 ) so as to output selected signals as YUV signals (Yin, Uin, Vin).
- the black band detecting section 2 detects a black band region included in the YUV signals (Yin, Uin, Vin) as input image signals, and more specifically, the black band detecting section 2 detects the black band region on the basis of the luminance signal Yin so as to output a detection result Kout to the image processing section 3 which will be described later.
- the black band detecting section 2 includes a signal type identifying section 21 , a measuring section 22 and a detecting section 23 .
- FIG. 2 shows a detailed structure of the black band detecting section 2 .
- the signal type identifying section 21 identifies the type of the input image signal, and more specifically, the signal type identifying section 21 identifies signal types such as, for example, an NTSC 480i signal and a PAL (Phase Alternating Line) 576i signal.
- signal types such as, for example, an NTSC 480i signal and a PAL (Phase Alternating Line) 576i signal.
- the measuring section 22 includes a signal level comparing section 221 and a measurement result output section 222 , and performs predetermined measurement on a designated measurement region in the input image signals in a unit frame period. More specifically, the measuring section 22 measures whether the signal level of each pixel in the measurement region is less than a threshold value Vt set on the basis of the luminance signal Yin.
- FIGS. 3A and 3B schematically show each region in the case where black band regions are included in an input image signal 6 .
- FIG. 3A shows the case where black band regions 61 A and 61 B are arranged above and below an image region 62 , and corresponds to, for example, a Cinemascope size image signal.
- an OSD (On Screen Display) 63 A is inserted, and in the black band region 61 B, subtitles 63 B are inserted.
- a blanking region 60 is arranged around the image region 62 and the black band regions 61 A and 61 B.
- FIG. 3B shows the case where black band regions 65 A and 65 B are arranged on the right and the left of an image region 66 , and corresponds to, for example, a side panel image signal or the like.
- the blanking region 60 is arranged around the image region 66 and the black band regions 65 A and 65 B.
- an OSD or subtitles are inserted in black band regions or the case where an OSC or subtitles are not inserted in black band regions, and even in the case where an OSC or subtitles are inserted, the OSC or the subtitles may be inserted in either or both of black band regions above and below an image region or on the right and the left of an image region.
- the signal level comparing section 221 compares between the signal level of the luminance signal Yin in each pixel and the signal level of the set threshold value Vt in the designated measurement region 64 A of the input image signal 6 in the unit frame period, and outputs the pixel position with a signal level equal to or larger than the threshold value Vt.
- the threshold value Vt is set so that the pixel position of the image region 62 is outputted and the pixel positions of the blanking region 60 and the black band regions 61 A and 61 B are not outputted.
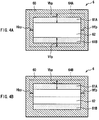
- the measurement result output section 222 determines and outputs a horizontal back porch length Hbp, a horizontal front porch length Hfp, a vertical back porch length Vbp and a vertical front porch length Vfp in the measurement region 64 A as shown in FIG. 4A on the basis of the pixel position with a signal level equal to or larger than the threshold value Vt which is outputted from the signal level comparing section 221 .
- the measurement region 64 A in FIG. 4A shows the case where the measurement region 64 A is a basic region as a basic part for detecting a black band; however, for example, like a measurement region 64 B shown in FIG. 4B , the zone of a measurement region can be freely determined. The increase or degrease in the zone of the measurement region will be described later.
- the detecting section 23 detects a black band region actually included in the input image signal 6 on the basis of the measurement results of the horizontal back porch length Hbp, the horizontal front porch length Hbp, the vertical back porch length Vbp and the vertical front porch length Vfp by the measuring section 22 and a signal type identifying result Sout by the signal type identifying section 21 .
- the detecting section 23 includes a black band determining section 230 , a basic region providing section 231 , an initial increment/decrement value setting section 232 , an increment/decrement value providing section 233 , a boundary determining section 234 , a redetection number setting section 235 , a lower limit value setting section 236 , a detection determining section 237 , a measurement region determining section 238 and a threshold value setting section 239 .
- the black band determining section 230 determines whether a measurement result Mout including the horizontal back porch length Hbp, the horizontal front porch length Hfp, the vertical back porch length Vbp and the vertical front porch length Vfp by the measuring section 22 is a measurement result of a black band.
- the basic region providing section 231 provides the basic region as a basic part for detecting a black band, and provides the basic region according to the signal type identifying result Sout by the signal type identifying section 21 , for example, as in the case of the basic region 64 A in the input image signal 6 shown in FIG. 5 .
- the initial increment/decrement value setting section 232 is a section setting an initial change amount (an initial increment/decrement value) at the time of changing the measurement zone by the measuring section 22 .
- the increment/decrement value is shown like an increment/decrement value 64 V in the case where the measurement zone is changed from the measurement region 64 A to the measurement region 64 B in a vertical direction as shown in FIG.
- the initial increment/decrement value setting section 232 sets an initial increment/decrement value to a power-of-two value (2 n (n: natural number)) according to the signal type identifying result Sout by the signal type identifying section 21 . More specifically, for example, in the case where the input image signal 6 is an NTSC 525i signal, the initial increment/decrement value is set to 64, and in the case where the input image signal 6 is a 525p signal converted into a progressive signal, the initial increment/decrement value is set to 128.
- the increment/decrement value providing section 233 provides the increment/decrement value in the measurement zone on the basis of the initial increment/decrement value set by the initial increment/decrement value setting section 232 and the determination result by the black band determining section 230 . More specifically, the absolute value of the increment/decrement value starts from the initial value set by the initial increment/decrement value setting section 232 , and resets a new increment/decrement value to 1 ⁇ 2 of the previous increment/decrement value in each measurement of one unit frame. Moreover, whether the absolute value of the increment/decrement value is added to or subtracted from the present measurement zone is determined on the basis of the determination result by the black band determining section 230 which will be described later.
- the boundary determining section 234 determines boundaries between the black band regions 61 A, 61 B, 65 A and 65 B and the image regions 62 and 66 on the basis of the determination result by the black band determining section 230 and the increment/decrement value in the measurement zone provided by the increment/decrement value providing section 233 .
- the redetection number setting section 235 sets the redetection number at the time of finally specifying a black band region in the detection determining section 237 which will be described later.
- the redetection number is represented by an integer of 0 or more.
- the lower limit value setting section 236 sets the lower limit value of the horizontal width or the vertical width of the image region 62 determined by calculation from the boundary of the black band region determined by the boundary determining section 234 on the basis of the signal type identifying result Sout by the signal type identifying section 21 .
- the vertical width of the image region 62 is represented by, for example, a vertical width 62 V shown in FIG.
- FIG. 6 shows the case where a black band region is not present in the input image signal 6 , and a dark scene or the like by an image signal 6 is displayed) is prevented.
- the detection determining section 237 finally determines the black band region included in the input image signal 6 on the basis of the boundary determination result of the black band region by the boundary determining section 234 , the redetection number set by the redetection number setting section 235 and the lower limit value of the image region width set by the lower limit value setting section 236 , and outputs the determined black band detection result Kout to the image processing section 3 .
- the measurement region determining section 238 determines a measurement region in the measuring section 22 on the basis of the increment/decrement value in the measurement zone provided by the increment/decrement value providing section 233 , and successively outputs the measurement region to the signal level comparing section 221 .
- the threshold value setting section 239 sets the threshold value Vt of the signal level used in the measurement in the measuring section 22 , and outputs the threshold value Vt to the signal level comparing section 221 .
- a region with a signal level less than the threshold value Vt in the measurement region may be a black band region.
- the image processing section 3 performs image processing on the YUV signals (Yin, Uin, Vin) as the input image signals on the basis of the black band detection result Kout by the black band detecting section 2 and the type identifying result Sout of the input image signal by the signal type identifying section 21 in the black band detecting section 2 .
- the image processing section 3 includes a computing section 31 computing the scaling ratio of the input image signal on the basis of the display size (pixel number) of the display section 5 , the black band detection result Kout and the type identifying result Sout, a scaling section 32 scaling the YUV signals (Yin, Uin, Vin) as the input image signals on the basis of a computing result Cout (the scaling ratio) by the computing section 31 , and a position adjusting section 33 performing position adjustment on the scaled image signals so as to prevent subtitles from being missed in the black band region by the scaling section 32 .
- the matrix circuit 41 reproduces RGB signals from the YUV signals (Yout, Uout, Vout) after image processing (aspect ratio adjustment process) by the image processing section 3 , and outputs the reproduced RGB signals (Rout, Gout, Bout) to the driver 42 .
- the driver 42 produces a driving signal for the display section 5 on the basis of the RGB signals (Rout, Gout, Bout) outputted from the matrix circuit 41 , and outputs the driving signal to the display section 5 .
- the display section 5 displays an image on the basis of the YUV signals (Yout, Uout, Vout) after the image processing (the aspect ratio adjustment process) by the image processing section 3 according to the driving signal outputted from the driver 42 .
- the display section 5 may be any kind of display device. For example, a CRT (Cathode-Ray Tube), a LCD (Liquid Crystal Display), a PDP (Plasma Display Panel), an organic or inorganic EL (ElectroLuminescence) display or the like is used.
- an image signal to be inputted into the image display is demodulated into the YUV signals. More specifically, a TV signal from the TV is demodulated into a composite video burst signal by the tuner 11 , and a composite video burst signal is directly inputted into the image display from the VCR or the DVD 1 . Then, the composite video burst signals are separated into the luminance signal Y 1 and the chrominance signal C 1 in the Y/C separation circuit 12 , and then the luminance signal Y 1 and the chrominance signal C 1 are decoded into the YUV signals (Y 1 , U 1 , V 1 ) in the chroma decoder 13 . On the other hand, YUV signals (Y 2 , U 2 , V 2 ) are directly inputted into the image display from the DVD 2 .
- either the YUV signals (Y 1 , U 1 , V 1 ) or the YUV signals (Y 2 , U 2 , V 2 ) are selected to be outputted as the YUV signals (Yin, Uin, Vin).
- the luminance signal Yin of the YUV signals (Yin, Uin, Vin) is outputted into the signal type identifying section 21 and the measuring section 22 in the black band detecting section 2 and the scaling section 32 in the image processing section 3 , and the color-difference signals Uin and Vin are outputted to the scaling section 32 in the image processing section 3 .
- the black band detecting section 2 the black band region included in the YUV signals (Yin, Uin, Vin) as the input image signals is detected. Specifically, the black band region is detected on the basis of the luminance signal Yin, and the detection result Kout is outputted to the image processing section 3 .
- the measuring section 22 measures in the unit frame period whether the luminance signal Yin in each pixel in the designated measurement region of the input image signals has a signal level less than the threshold value Vt, and the detecting section 23 detects the black band region included in the input image signal 6 on the measurement results of the horizontal back porch length Hbp, the horizontal front porch length Hfp, the vertical back porch length Vbp and the vertical front porch length Vfp by the measuring section 22 and the signal type identifying result Sout by the signal type identifying section 21 , and the black band detection result Kout is outputted to the image processing section 3 .
- the image processing section 3 performs image processing, more specifically a process of scaling the input image signal while maintaining the aspect ratio of the input image signal (the aspect ratio adjustment process) on the YUV signals (Yin, Uin, Vin) as the input image signals.
- the matrix circuit 41 reproduces RGB signals (Rout, Gout, Bout) from the YUV signals (Yout, Uout, Vout) after image processing, (the aspect ratio adjustment process) by the image processing section 3 , and the driver 42 produces a driving signal on the basis of the RGB signals (Rout, Gout, Bout), and an image is displayed on the display section 5 on the basis of the driving signal.
- FIGS. 7 through 10 show examples of a method of measuring the horizontal back porch length Hbp, the horizontal front porch length Hfp, the vertical back porch length Vbp and the vertical front porch length Vfp by the measuring section 22 with timing charts.
- Hsync indicates a horizontal synchronizing signal
- Vsync indicates a vertical synchronizing signal
- Clock indicates a clock (dot clock) signal corresponding to the period of each pixel
- H_act indicates a horizontal active signal corresponding to the pixel position with a signal level equal to or higher than the threshold value Vt in a horizontal direction
- V_act indicates a vertical active signal which becomes active in the case where the horizontal active signal H_act attains “H” level even in one pixel in each horizontal period
- Hbp_cnt indicates a horizontal back porch counter output
- Hfp_cnt indicates a horizontal front porch counter output
- Vbp_cnt indicates a vertical back porch counter output
- Vfp_cnt indicates a vertical
- the horizontal back porch length Hbp shown in FIG. 7 is measured as will be described below.
- the horizontal back porch counter output Hbp_cnt (refer to FIG. 7(F) ) is reset, and “0” is outputted.
- the value of the horizontal back porch counter output Hbp_cnt is incremented by one at each of the rising edges (timings t 1 , t 2 , . . . ) of the clock signal Clock (refer to FIG. 7(C) ).
- the horizontal active signal H_act (refer to FIG. 7(E) ) attains “H” level at a timing t 5 which is the next rising edge of the clock signal Clock.
- the horizontal active signal H_act is in “H” level (from the timing t 5 to a timing t 7 )
- the value of the horizontal back porch counter output Hbp_cnt is fixed (in FIG. 7 , the value is fixed at “4”).
- the value of the horizontal back porch counter output Hbp_cnt at this time is a fixing value in the horizontal period, and is updated and maintained as the horizontal back porch latch output Hbp_lat (refer to FIG. 7(G) ).
- the value (“6” in FIG. 7 ) of the horizontal back porch latch output Hbp_lat in the previous horizontal period (before updating) and the value (“10” in FIG. 7 ) of the horizontal back porch length output Hbp_out (refer to FIG. 7(H) ) corresponding to the minimum value of the horizontal back porch length Hbp in previous measurement are compared, and a smaller value is updated (in FIG. 7 , from “10” to “6”) as a new horizontal back porch length output Hbp_out.
- the horizontal back porch length Hbp determined by the minimum value of the number of pixels with a signal level less than the threshold value Vt which continues from the left end of the measurement region 64 A or 64 B is outputted from the measuring section 22 in a short time in the unit frame period.
- the horizontal front porch length Hfp shown in FIG. 8 is measured basically as in the case of the horizontal back porch length Hbp.
- the horizontal synchronizing signal Hsync attains “H” level at a timing t 10
- the luminance signal Yin has a signal level equal to or larger than the threshold value Vt at a timing t 11
- the horizontal active signal H_act attains “H” level at a timing t 12 which is the next rising edge of the clock signal Clock (refer to FIG. 8(C) ).
- the horizontal active signal H_act returns to “L” level at the timing t 14 which is the next rising edge of the clock signal Clock.
- the value of the horizontal front porch counter output Hfp_cnt at this time is a fixing value in the horizontal period, and is updated and maintained as the horizontal front porch latch output Hfp_lat (refer to FIG. 8(G) ).
- the value (“6” in FIG. 8 ) of the horizontal front porch latch output Hbp_lat in the previous horizontal period (before updating) and the value (“10” in FIG. 8 ) of the horizontal front porch length output Hfp_out (refer to FIG.
- the horizontal front porch length Hfp corresponding to the minimum value of the number of pixels with a signal level less than the threshold value Vt which continue from the right end of the measurement region 64 A or 64 B is outputted from the measuring section 22 in a short time in the unit frame period.
- the vertical back porch length Vbp shown in FIG. 9 is measured.
- the vertical back porch counter output Vbp_cnt (refer to FIG. 9(E) ) is reset, and “0” is outputted. Then, after the timing t 20 , the value of the vertical back porch counter output Vbp_cnt is incremented by one at each of the rising edges (timings t 21 , t 22 , . . . ) of the horizontal synchronizing signal Hsync (refer to FIG. 9(B) ).
- the luminance signal Yin has a signal level equal to or larger than the threshold value Vt, and the horizontal active signal H_act (refer to FIG. 9(C) ) attains “H” level, at the timing t 25 which is the next rising edge of the horizontal synchronizing signal Hsync, the vertical active signal V_act (refer to FIG. 9(D) ) attains “H” level.
- the value of the vertical back porch counter output Vbp_cnt is fixed (in FIG. 9 , the value is fixed to “2”).
- the value of the vertical back porch counter output Vbp_cnt at this time is a fixing value in the vertical period, and is updated and maintained as the vertical back porch length output Vbp_out (refer to FIG. 9(F) ).
- the vertical back porch length Vbp corresponding to the minimum value of the number of pixel with a signal level less than the threshold value Vt which continue from the top end of the measurement region 64 A or 64 B is outputted from the measuring section 22 in a short time in the unit frame period.
- the vertical front porch length Vfp shown in FIG. 10 is measured basically as in the case of the vertical back porch length Vbp.
- the vertical synchronizing signal Vsync attains “H” level at a timing t 30
- the luminance signal Yin has a signal level equal to or larger than the threshold value Vt so that the horizontal active signal H_act (refer to FIG. 10(C) ) attains “H” level from a timing t 31 to a timing t 32 , at a timing t 33 which is the next rising edge of the horizontal synchronizing signal Hsync (refer to FIG. 10 (B))
- the vertical active signal V_act attains “H” level.
- the value of the vertical front porch counter output Vfp_cnt at this time is a fixing value in the vertical period, and is updated and maintained as the vertical front porch length output Vfp_out (refer to FIG. 10(F) ).
- the measurement of one vertical period is completed.
- the vertical front porch length Vfp corresponding to the minimum value of the number of pixels with a signal level less than the threshold value Vt which continue from bottom end of the measurement region 64 A or 64 B is outputted from the measuring section 22 in a short time in the unit frame period.
- the horizontal back porch length Hbp, the horizontal front porch length Hfp, the vertical back porch length Vbp and the vertical front porch length Vfp by the measuring section 22 may be measured in order, or two or more of them may be measured concurrently. In the case where they are measured concurrently, all of the horizontal back porch length Hbp, the horizontal front porch length Hfp, the vertical back porch length Vbp and the vertical front porch length Vfp can be measured in the unit frame period, so the measurement can be performed at a higher speed.
- FIG. 11 shows a flowchart of the black band detecting process by the black band detecting section 2 .
- the horizontal back porch length H 1 A and the horizontal front porch length H 1 B of the input image signal 6 a length V 0 A from the top end of the input image signal 6 to the top end of the OSD 63 A and the vertical length V 1 A from the top of the input image signal 6 to the bottom of the black band region 61 A, a length V 0 B from the bottom end of the input image signal 62 to the bottom end of the subtitle 63 B and the vertical length V 1 B from the bottom of the input image signal 6 to the top of the black band region 61 B, the vertical width V 2 of the image region 62 and the like are detected.
- the vertical back porch length V 1 A and the vertical front porch length V 1 B of the input image signal 6 the horizontal length H 1 A from the left end of the input image signal 6 to the right end of the black band region 65 A, the horizontal length H 1 B from the right end of the input image signal 6 to the left end of the black band region 65 B, the horizontal width H 2 of the image region 62 and the like are detected.
- the black band detecting process for example, as shown by the measurement region 64 A (the basic region), measurement regions 64 B 1 through 64 B 3 and arrows P 21 , P 22 , P 31 , P 32 , P 41 , P 42 , P 51 and P 52 in FIGS. 13A , 13 B, 14 A and 14 B, while the increment/decrement values 64 V and 64 H of the measurement regions are reset to 1 ⁇ 2 of the previous increment/decrement values, black band detection is performed.
- the black band detecting process black band detection using binary search is performed, thereby, as will be described in detail later, the black band can be detected at a high speed (in the case where the initial increment/decrement value is set to 2 n , the black band detecting process is completed in (n+1) unit frame periods at the latest, and various parameters as shown in FIGS. 12A and 12B are outputted).
- a black band detection starting process is performed (step S 111 ).
- the threshold value setting section 239 sets the threshold value Vt of the signal level, and outputs the threshold value Vt to the signal level comparing section 221 (step S 111 in FIG. 15 ).
- the basic region providing section 231 provides the basic region (step S 112 ).
- the measurement region determining section 238 determines the basic region as the measurement region 64 A, and outputs the measurement region 64 A to the signal level comparing section 221 (step S 113 ).
- the black band determining section 230 acquires the measurement result Mout (the measurement results of the horizontal back porch length Hbp, the horizontal front porch length Hfp, the vertical back porch length Vbp and the vertical front porch length Vfp in the measurement region 64 A) from the measuring section 22 (step S 115 ). Then, the black band determining section 230 determines whether a black band region is present in the measurement region 64 A on the basis of the measurement result Mout (step S 116 ), and when the presence of the black band region is determined (step S 116 : Y), the black band detecting process moves into the next boundary determining process 1 (step S 12 in FIG. 11 ).
- the measurement result Mout the measurement results of the horizontal back porch length Hbp, the horizontal front porch length Hfp, the vertical back porch length Vbp and the vertical front porch length Vfp in the measurement region 64 A
- step S 117 determines whether the black band detection process is terminated. In the case where the termination of black band detecting process is determined (step S 117 : Y), the black band detecting process is terminated (“END” in FIG. 11 ). On the other hand, in the case where it is determined that the black band detection process is not terminated, and continues (step S 117 : N), the detection determining section 237 resets the value of the detection number counter showing the detection number of the black band region to 0 (step S 118 ), and the basic region 64 A is outputted to the image processing section 3 as the detection result Kout (step S 119 ). Then, the processes from step S 111 to step S 119 are repeated until the presence of the black band region or the termination of the black band detecting process is determined.
- step S 12 in FIG. 11 the boundary determining process 1 is performed. More specifically, processes shown in the flowcharts of FIGS. 16 and 17 are performed.
- a boundary position between the black band region 61 A on the top side or the black band region 65 A on the left side and the image region 62 or the image region 66 in the input image signal 6 is determined.
- the measurement region determining section 238 determines a first measurement region, and outputs the first measurement region to the signal level comparing section 221 (step S 121 in FIG. 16 ). More specifically, in the case of determining the boundary position of the black band region 61 A on the top side, the start position and the end position in a horizontal direction and the start position in a vertical direction in the basic region 64 A are assigned to the start position and the end position in a horizontal direction and the start position in a vertical direction, and a position determined by adding an increment/decrement value in a vertical direction which is set by the initial increment/decrement value setting section 232 to a vertical start position in the basic region 64 A is assigned to the end position in a vertical direction.
- the start position and the end position in a vertical direction and the start position in a horizontal direction in the basic region 64 A are assigned to the start position and the end position in a vertical direction and the start position in a horizontal direction, and a position determining by adding an initial increment/decrement value in a horizontal direction which is set by the initial increment/decrement value setting section 232 to a horizontal start position in the basic region 64 A is assigned to the end position in a horizontal direction.
- the initial increment/decrement values in a horizontal direction and a vertical direction are set on the basis of the signal type identifying result Sout, and in the boundary determining process 1 , the boundary position on the top side or the left side is determined, so it is desirable to set the initial increment/decrement values to 1 ⁇ 2 or less of the widths in a horizontal direction and a vertical direction of the basic region 64 A, because the boundary position of the black band region can be determined in a shorter time.
- the black band determining section 230 acquires the measurement result Mout from the measuring section 22 (step S 123 ). Then, the increment/decrement value providing section 233 reduces the increment/decrement value of the measurement region by half. In other words, the increment/decrement value is reset to 1 ⁇ 2 of the increment/decrement value of the previous measurement region as a new increment/decrement value.
- the increment/decrement value providing section 233 determines whether the new increment/decrement value set in such a manner is less than 1 (step S 125 ), and in the case where the increment/decrement value is less than 1 (step S 125 : Y), it is determined that it is not necessary to use the binary search technique any more, and the black band detecting process moves into the next process (step S 129 of FIG. 17 ).
- the black band determining section 230 determines whether only the black band region (the black band region including the blanking region 60 ) is present in the measurement region 64 B on the basis of the measurement result Mout (step S 126 ). Then, according to the determination result, the measurement region determining section 238 resets a new measurement region by adding or subtracting the increment/decrement value of a new measurement zone provided by the increment/decrement value providing section 233 in step S 124 to or from the previous measurement region (steps S 127 and S 128 ).
- a new measurement region 64 B 2 is reset by subtracting a new increment/decrement value from the end position of the previous measurement region 64 B 1 (step S 127 ).
- a new measurement region 64 B 2 is reset by subtracting a new increment/decrement value from the end position of the previous measurement region 64 B 1 (step S 127 ).
- a new measurement region 64 B 4 is reset by adding a new increment/decrement value to the end position of the previous measurement region 64 B 3 (step S 128 ).
- steps S 127 and S 128 until it is determined that a new increment/decrement value is less than 1 in step S 125 , that is, the boundary position between the black band region and the image region is detected (step S 125 : Y), the processes from step S 122 to step S 127 or S 128 are repeated.
- FIGS. 18A and 18B show the case of determining the boundary position of the black band region 61 A on the top side; however, the same processes are performed in the case of determining the boundary position of the black band region 65 A on the left side.
- the black band determining section 230 determines whether only the black band region is present in the measurement region 64 B (step S 129 in FIG. 17 ). In the case where it is determined that only the black band region is not present (step S 129 : N), as in the case of step S 127 , a new measurement region is reset by subtracting a new increment/decrement value from the end position of the previous measurement region (step S 130 ).
- step S 129 in the case where it is determined that only black band region is present (step S 129 : Y), as in the case of step S 128 , a new measurement region is reset by adding a new increment/decrement value to the end position of the previous measurement region (step S 131 ).
- the black band determining section 230 acquires the measurement result Mout from the measuring section 22 (step S 133 ). Then, the boundary determining section 234 determines the boundary position on the top side or the left side of the black band region at this time by calculation (step S 134 ), and outputs the boundary position to the detection determining section 237 , thereby the boundary determining process 1 is terminated, and the black band detecting process moves into the next process.
- a boundary determining process 2 is performed (step S 14 in FIG. 11 ). More specifically, processes shown in the flowcharts of FIGS. 19 and 20 are performed.
- the boundary position between the black band region 61 B on the bottom side or the black band region 65 B on the right side and the image region 62 or the image region 66 in the input image signal 6 is determined.
- the measurement region determining section 238 determines a first measurement region, and outputs the first measurement region to the signal level comparing section 221 (step S 141 in FIG. 19 ). More specifically, in the case of determining the boundary position of the black band region 61 B on the bottom side, the start position and the end position in a horizontal direction and the end position in a vertical direction in the basic region 64 A are assigned to the start position and the end position in a horizontal direction and the end position in a vertical direction, and a position determined by subtracting the initial increment/decrement value in a vertical direction which is set by the initial increment/decrement value setting section 232 from the vertical end position of the basic region 64 A is assigned to the start position in a vertical direction.
- the start position and the end position in a vertical direction and the end position in a horizontal direction in the basic region 64 A are assigned to the start position and the end position in a vertical direction and the end position in a horizontal direction, and a position determined by subtracting the initial increment/decrement value in a horizontal direction which is set by the initial increment/decrement value setting section 232 from the horizontal end position of the basic region 64 A is assigned to the start position in a horizontal direction.
- steps S 142 through S 153 the same processes as those in step S 122 through S 133 of the boundary determining process 1 are performed.
- steps S 147 and S 150 for example, as shown by an arrow P 71 in FIG. 21A , a new measurement region 64 B 2 is reset by subtracting a new increment/decrement value or 1 from the start position of the previous measurement region 64 B 1 (steps S 147 and S 150 ).
- steps S 148 and S 151 for example, as shown by an arrow P 72 in FIG. 21B , a new measurement region 64 B 4 is reset by adding a new increment/decrement value or 1 to the start position of the previous measurement region 64 B 3 (steps S 148 and S 151 ).
- FIGS. 21A and 21B show the case of determining the boundary position of the black band region 65 B on the right side; however, the same process is performed in the case of determining the boundary of the black band region 61 B on the bottom side.
- a black band detection determining process is performed (step S 16 in FIG. 11 ). More specifically, processes shown in flowcharts in FIGS. 22 and 23 are performed.
- the detection determining section 237 determines the width (the vertical width V 2 or the horizontal width H 2 ) of the image region 62 by calculation on the basis of the boundary positions of the black band regions 61 A and 61 B or the black band regions 65 A and 65 B determined in the boundary detecting processes 1 and 2 by the boundary determining section 234 , and the resolution of the input image signal 6 obtained by the signal type identifying result Sout (step S 161 in FIG. 22 ).
- the detection determining section 237 determines whether the width of the image region 62 is equal to or larger than the lower limit value set by the lower limit value setting section 236 (step S 162 ).
- step S 162 N
- step S 163 the value of the detection number counter of the black band region is reset to 0
- step S 18 the black band detecting process returns to the black band detection starting process (step S 11 ), and starts from the beginning.
- step S 165 the boundary positions of two detected black band regions (on the top and bottom sides or on the right and left sides) and the width of the image region 62 are maintained as it is (step S 165 ), and the value of the detection number counter is incremented by one, thereby except for the case where the black band detection determining process is terminated (“return”), and the whole black band detecting process is terminated in step S 18 in FIG. 11 (step S 18 : Y), the black band detecting process returns to the black band detection starting process (step S 11 ) and is performed again.
- step S 164 determines whether the redetection number is set to 0 (step S 167 in FIG. 23 ).
- step S 167 In the case where it is determined that the redetection number is set to 0 (step S 167 : Y), except for the case where it is determined that the black band detection is confirmed (step S 170 : Y), the boundary positions of two detected black band regions (on the top and bottom sides or on the right and left sides) and the width of the image region 62 are outputted to the image processing section 3 as it is as the black band detection result Kout (step S 172 ), and the value of the detection number counter is reset to 0 (step S 163 ), thereby except for the case where the black band detection determining process is terminated (“return”), and the whole black band detecting process is terminated in step S 18 in FIG. 11 (step S 18 : Y), the black band detecting process returns to the black band detecting starting process (step S 11 ), and is performed again.
- step S 170 determines whether the width of the black band region is changed, and in the case where the width is changed, the detection determining section 237 determines whether only either of the widths of two black band detection regions is largely changed (step S 171 ).
- step S 171 it is determined the image region 62 is a dark scene or the like, and to prevent false detection of the black band region, the value of the detection number counter of the black band region is reset to 0 (step S 163 ), thereby the black band detection determining process is terminated without outputting the black band detection result Kout (“return”).
- step S 171 N
- the process moves into step S 172 , and the black band detection result Kout is outputted (step S 172 ), and the value of the detection number counter of the black band region is set to 0 (step S 163 ), thereby the black band detection determining process is terminated (“return”).
- step S 167 In the case where it is determined in step S 167 that the redetection number is set to a value except for 0 (a value of 1 or more) (step S 167 : N), the detection number of the black band region is 1 or more, so the detection determining section 237 determines whether the width of the image region 62 in the previous detection matches the width of the image region 62 in this detection (step S 168 ). In the case where they do not match each other (step S 168 : N), there is high possibility of false detection, so to prevent such false detection, the value of the detection number counter of the black band region is reset to 0 (step S 163 ), thereby the black band detection determining process is terminated without outputting the black band detection result Kout (“return”).
- step S 168 determines whether the value of the detection number counter is less than the set redetection number (step S 169 ).
- step S 169 determines whether the value is less than the redetection number.
- step S 165 the boundary positions of two detected black band regions and the width of the image region 62 are maintained as it is (step S 165 ), and the value of the detection number counter is incremented by one, thereby the black band detection determining process is terminated (“return”), and except for the case where the whole black band detecting process is terminated in step S 18 in FIG. 11 (step S 18 : Y), the black band detecting process returns to the black band detection starting process (step S 11 ), and is performed again.
- step S 169 in the case where the value is not less than the redetection number (that is, the value is equal to the redetection number) in step S 169 (step S 169 : N), the process moves into steps S 170 through S 172 , and the black band detection result Kout is outputted as described above, and whether the black band detection determining process is terminated is determined.
- step S 18 determines whether the whole black band detecting process is terminated. If the black band detection determining process is terminated, whether the whole black band detecting process is terminated is determined in step S 18 , and in the case where the process is not terminated (step S 18 : N), processes of step S 11 through S 16 are repeated, and in the case where the process is terminated (step S 18 : Y), the whole black band detecting process is terminated.
- FIG. 24 shows a flowchart of the aspect adjustment process.
- the signal type identifying section 211 in the black band detecting section 2 identifies the type of the input image signal 6 (step S 0 ), and outputs the identifying result Sout to the detecting section 23 and the computing section 31 in the image processing section 3 .
- the black band detecting section 2 performs a series of black band detecting processes S 11 through S 18 shown in FIG. 11 (and FIGS. 12A and 12B through 23 ) on the basis of the signal type identifying result Sout and the luminance signal Yin of the input image signals (step S 11 ), and outputs the black band detection result Kout to the computing section 31 .
- the presence or absence of the image region 62 is determined depending on whether the horizontal back porch length Hbp and the horizontal front porch length Hfp by the measurement result match a preset horizontal back porch length Hbp 0 and a preset horizontal front porch length Hfp 0 . More specifically, when at least either the horizontal back porch length Hbp and the horizontal back porch length Hbp 0 , or the horizontal front porch length Hfp and the horizontal front porch length Hfp 0 match each other, it is determined that the image region 62 is present. As shown in FIG.
- the horizontal back porch length Hbp and the horizontal front porch length Hfp by the measurement result are large, compared to the preset horizontal back porch length Hbp 0 and the preset horizontal front porch length Hfp 0 , so it is basically determined that the image region 62 is not present. It is because when it is determined that an image region including the region of the subtitles 63 B is present, at the time of adjusting the aspect ratio which will be described later, the aspect ratio is wrongly adjusted.
- the positions of the subtitles 63 B are detected by using the vertical back porch length Vbp or the vertical front porch length Vfp by the measurement result (in the case of FIG. 25C , by using the vertical back porch length vbp) in addition to the horizontal back porch length Hbp and the horizontal front porch length Hfp by the measurement result.
- the subtitles 63 B are displayed or not depending on the unit frame, so the smallest value of the vertical back porch length Vbp or the vertical front porch length Vfp until confirming the detection by the black band detecting process is considered as the positions of the subtitles 63 B.
- the presence or absence of the subtitles 63 B in the black band region can be determined.
- the computing section 31 in the image processing section 3 performs a process (a scaling ratio computing process) of determining the expansion ratio or the reduction ratio of the YUV signals (Yin, Uin, Vin) as the input image signals by computation on the basis of the result (the black band detection result Kout) of the black band detecting process by the above-described black band detecting section 2 and the type identifying result Sout of the input image signals by the signal type identifying section 21 (step S 2 ). More specifically processes shown in flowcharts of FIGS. 26 and 27 are performed.
- the computing section 31 determines whether the black band region is present in the input image signals (Yin, Uin, Vin) on the basis of the results (step S 202 ). More specifically, whether the black band region is present is determined depending on whether the horizontal back porch length, the horizontal front porch length, the vertical back porch length and the vertical front porch length of the input image signals on the basis of the type identifying result Sout meet the horizontal back porch length H 1 A, the horizontal front porch length H 1 B, the vertical back porch length V 1 A and the vertical front porch length V 1 B on the basis of the black band detection result Kout. It is because, for example, in the case where the black band region is not present in the input image signal, for example, as shown in FIG. 28 , these values on the basis of the type identifying result Sout match the value on the basis of the black band detection result Kout.
- step S 202 the computing section 31 computes the scaling ratios in a horizontal direction and a vertical direction according to the display size of the image region on the basis of the signal type identifying result Sout (steps S 204 and S 205 ). Then, the computing result Cout is outputted to the scaling section 32 (step S 205 ), thereby the scaling ratio computing process is terminated.
- step S 202 determines whether the current black band detection result Kout is changed from the result in the previous unit frame (whether the values of the horizontal back porch length H 1 A, the horizontal front porch length H 1 B, the vertical back porch length V 1 A and the vertical front porch length V 1 B and the like are changed) (step S 206 ).
- step S 206 determines whether the current black band detection result Kout is changed from the previous result.
- step S 206 determines whether the image region is changed on the basis of the black band detection result Kout (for example, whether the widths H 2 and V 2 of the image region shown in FIGS. 12A and 12B are changed) (step S 207 ). In the case where it is determined that the image region is not changed (step S 207 : N), the computing section 31 determines whether a subtitle region is expanded on the basis of the black band detection result Kout (step S 209 ).
- the computing section 31 determines whether the length V 0 A from the top end of the input image signal 6 to the top end of the OSD 63 A or the length V 0 B from the bottom end of the input image signal 6 to the bottom end of the subtitle 63 B as shown in FIG. 12A is reduced. In the case where it is determined that the subtitle region is reduced or not changed by these values (step S 209 : N), it is not necessary to change the scaling ratio, and the scaling ratio is maintained as it is, so the scaling ratio computing process is terminated.
- step S 207 determines the aspect ratio of the image region except for the black band region in the input image signals (Yin, Uin, Vin) by calculation on the basis of the black band detection result Kout (more specifically the widths H 2 and V 2 of the image region and the like) (step S 208 ).
- the computing section 31 determines the scaling ratios in a horizontal direction and a vertical direction by computation so as not to miss the subtitles according to the display size while maintaining the aspect ratio of the image region in the input image signals (Yin, Uin, Vin) on the basis of the determined aspect ratio and the black band detection result Kout (steps S 210 and S 211 ). Thereby, the scaling ratio computing process is terminated.
- scaling is performed on the input image signal 6 so as to display only the image region 62 as a display region 7 on the whole display screen of the display section 5 .
- the position adjusting section 33 performs the position adjustment on the image signal, which is scaled so as not to miss the subtitles 63 B by the scaling section 32 , so as not to include the other black band region (in this case, the black band region 61 A on a top side) in the display region 7 .
- the image processing section 3 may perform the aspect ratio adjustment process so as to display an input image signal on the whole sub-window.
- the scaling section 32 scales the YUV signals (Yin, Uin, Vin) as the input image signals on the basis of the computing result Cout (the scaling ratio) by the computing section 31 (step S 3 ).
- the position adjusting section 33 performs position adjustment shown in, for example, FIG. 29C on the image signals which are scaled by the scaling section 32 so as not to miss the subtitles in the black band region (step S 4 ).
- step S 5 whether the aspect ratio adjustment process is terminated is determined (step S 5 ), and in the case where it is determined that the process is not terminated (step S 5 : N), the processes of step S 0 through S 4 are repeated, and in the case where it is determined that the process is terminated (step S 5 : Y), the aspect ratio adjustment process is terminated.
- the image processing section 3 performs the image processing (the aspect ratio adjustment process on the input image signal).
- the measuring section 22 measures in the unit frame period whether each pixel in the measurement regions 64 A and 64 B of the YUV signals (Yin, Uin, Vin) as the input image signal 6 has a signal level less than the threshold value Vt, and the detecting section 23 detects the black band region included in the input image signal 6 on the basis of the measurement result, so compared to related arts, the black band region included in the input image signal can be detected in a shorter time.
- the boundary between the black band region and the image region is detected from the measurement result whether each pixel has a signal level less than the threshold value Vt, and a new measurement region is determined by adding or subtracting 1 ⁇ 2 of the previous increment/decrement value as a new increment/decrement value to or from the previous measurement range depending on whether the boundary is detected, and the new measurement region is repeatedly measured, and the black band region is detected on the basis of the measurement result, so the black band region included in the input image signal 6 can be detected in a shorter time.
- the detection determining section 237 in the detecting section 23 determines whether the width of the black band region is changed, and in the case where the width is changed, whether only either of the widths of two black band detection regions is largely changed is determined, so in the case where only either of them is largely changed, it can be determined that the image signal is a dark scene or the like, and false detection of the black band region can be prevented. Therefore, such false detection can be prevented, and the black band detection can be performed with high precision.
- black band detection can be performed in a short time with high precision, so the image processing section 3 can perform optimum image processing through the use of the black band detection result Kout in a short time.
- the input image signal can be scaled. Therefore, when an image is displayed through the use of the scaled image signal, an easily viewable image can be displayed, compared to related arts.
- the expansion or reduction of the image signal is performed in consideration of the presence or absence of the subtitles in the black band region, so without missing the subtitles, an image including the black band region can be displayed.
- the display position of the image signal can be adjusted by the position adjusting section 33 depending on the presence or absence of the subtitles in the black band region. Therefore, a more easily viewable image can be provided.
- Image processing is performed through the use of the black band detection result Kout detected by the black band detecting section 2 at a high speed, so the scaling ratio can be determined by calculation again according to a change in the input image signal, and the aspect ratio can be adjusted in real time.
- black band detection on the Cinemascope image signal including the black band regions above and below the image region or the side panel image signal including the black band region on the right and the left of the image region is described; however, the black band region can be detected from four directions, that is, on the top, bottom, right and left sides of the image region by the combination of such black band detection.
- image processing section 3 performs the aspect ratio adjustment process on the input image signal through the use of the black band detection result Kout by the black band detecting section 2
- image processing through the use of the black band detection result Kout is not limited to the case, and the image processing can be applied to, for example, a contrast adjustment process, a luminance adjustment process or the like.
- optimum image processing can be performed in a short time by the black band detection performed by the black band detecting section 2 in a short time with high precision.
- the image display to which the YUV signals are inputted is described; however, the invention can be applied to an image display to which RGB signals are directly inputted such as a PC.
- the RGB signals are directly inputted in such a manner, matrix conversion is not necessary, so the matrix circuit 41 is not necessary.
- the invention is described referring the TV as a specific example of the image display; however, the image display of the invention can be applied to a PDA (Personal Digital Assistants), a cellular phone or the like.
- PDA Personal Digital Assistants
Abstract
Description
Claims (18)
Applications Claiming Priority (2)
| Application Number | Priority Date | Filing Date | Title |
|---|---|---|---|
| JPP2006-159316 | 2006-06-08 | ||
| JP2006159316A JP2007329700A (en) | 2006-06-08 | 2006-06-08 | Video signal processor, video display apparatus and video display method |
Publications (2)
| Publication Number | Publication Date |
|---|---|
| US20080007655A1 US20080007655A1 (en) | 2008-01-10 |
| US8098328B2 true US8098328B2 (en) | 2012-01-17 |
Family
ID=38918785
Family Applications (1)
| Application Number | Title | Priority Date | Filing Date |
|---|---|---|---|
| US11/810,962 Expired - Fee Related US8098328B2 (en) | 2006-06-08 | 2007-06-06 | Image signal processing apparatus, image display and image display method |
Country Status (3)
| Country | Link |
|---|---|
| US (1) | US8098328B2 (en) |
| JP (1) | JP2007329700A (en) |
| CN (1) | CN101087380B (en) |
Cited By (4)
| Publication number | Priority date | Publication date | Assignee | Title |
|---|---|---|---|---|
| US20130100349A1 (en) * | 2010-12-20 | 2013-04-25 | Texas Instruments Incorporated | Apparatus and Method for Black Bar Detection In Digital TVs and Set-Top Boxes |
| US20130155320A1 (en) * | 2011-12-09 | 2013-06-20 | Texas Instruments Incorporated | Perceptual video quality improvement for videos containing black bars |
| US9710161B2 (en) | 2014-12-29 | 2017-07-18 | Samsung Electronics Co., Ltd. | User terminal device and control method thereof |
| US20220292729A1 (en) * | 2021-03-10 | 2022-09-15 | The United States Of America, As Represented By The Secretary Of The Navy | Geospatial data abstraction library (gdal) conversion tool for data compression |
Families Citing this family (15)
| Publication number | Priority date | Publication date | Assignee | Title |
|---|---|---|---|---|
| TWI466093B (en) * | 2007-06-26 | 2014-12-21 | Apple Inc | Management techniques for video playback |
| TWI479891B (en) * | 2007-06-26 | 2015-04-01 | Apple Inc | Dynamic backlight adaptation |
| US8766902B2 (en) * | 2007-12-21 | 2014-07-01 | Apple Inc. | Management techniques for video playback |
| US20120013799A1 (en) * | 2009-03-30 | 2012-01-19 | Syuuji Murayama | Image display device and image processing method |
| KR20110024642A (en) * | 2009-09-02 | 2011-03-09 | 삼성전자주식회사 | Display apparatus and control method thereof |
| WO2011074073A1 (en) * | 2009-12-15 | 2011-06-23 | 三菱電機株式会社 | Display control device for an elevator |
| US9143767B2 (en) * | 2010-06-01 | 2015-09-22 | Intel Corporation | Method and apparatus for adaptive stable image timing in stereoscopic 3D systems |
| CN103369205B (en) * | 2012-03-26 | 2016-11-16 | 宇龙计算机通信科技(深圳)有限公司 | Mobile terminal and method of video image processing |
| CN104915944B (en) * | 2014-03-14 | 2018-08-07 | 北京风行在线技术有限公司 | A kind of method and apparatus for determining the black surround location information of video |
| TWI542211B (en) * | 2014-04-29 | 2016-07-11 | 瑞昱半導體股份有限公司 | Circuit for generating horizontal synchronous signal of display and associated method |
| CN104363505B (en) * | 2014-11-17 | 2017-05-31 | 天脉聚源(北京)传媒科技有限公司 | A kind of method and device for showing broadcast interface |
| CN105573747B (en) * | 2015-12-10 | 2018-11-06 | 小米科技有限责任公司 | The test method and device of user interface |
| JP7009489B2 (en) * | 2017-02-27 | 2022-01-25 | インターデジタル マディソン パテント ホールディングス, エスアーエス | Methods and equipment for reusing the black border area of digital TV screens |
| CN109005458B (en) * | 2018-09-27 | 2021-02-23 | 上海东方传媒技术有限公司 | Image screen-splash detection method and device |
| CN113053324A (en) * | 2021-03-15 | 2021-06-29 | 生迪智慧科技有限公司 | Backlight control method, device, equipment, system and storage medium |
Citations (35)
| Publication number | Priority date | Publication date | Assignee | Title |
|---|---|---|---|---|
| JPH0527736A (en) | 1991-07-18 | 1993-02-05 | Matsushita Electric Ind Co Ltd | Method and device for processing video signal |
| JPH06175641A (en) | 1992-12-04 | 1994-06-24 | Sony Corp | Character input display device |
| JPH0918797A (en) | 1995-06-28 | 1997-01-17 | Sanyo Electric Co Ltd | Television receiver |
| US5686970A (en) * | 1994-12-08 | 1997-11-11 | Matsushita Electric Industrial Co., Ltd. | Average luminance level detection apparatus and aspect ratio auto-discrimination apparatus for a television signal using the same |
| US5699123A (en) * | 1993-10-20 | 1997-12-16 | Victor Company Of Japan, Ltd. | Television receiver with an adjustable frame size |
| US5748257A (en) | 1994-04-15 | 1998-05-05 | Matsushita Electric Industrial Co., Ltd. | Picture information detecting apparatus for a video signal |
| US5760840A (en) * | 1994-03-31 | 1998-06-02 | Matsushita Electric Industrial Co., Ltd. | Apparatus for distinguishing between a plurality of video signal types, apparatus for automatic aspect ratio determination and television receiver |
| US5808697A (en) * | 1995-06-16 | 1998-09-15 | Mitsubishi Denki Kabushiki Kaisha | Video contrast enhancer |
| US6002797A (en) * | 1994-06-22 | 1999-12-14 | Hitachi, Ltd. | Apparatus for detecting position of featuring region of picture, such as subtitle or imageless part |
| US6163621A (en) * | 1997-02-27 | 2000-12-19 | Samsung Electronics Co., Ltd | Histogram equalization method and device in contrast enhancement apparatus for image processing system |
| US6208385B1 (en) * | 1996-10-17 | 2001-03-27 | Kabushiki Kaisha Toshiba | Letterbox image detection apparatus |
| US6262772B1 (en) * | 1998-11-23 | 2001-07-17 | Philips Electronics North America Corporation | Method and apparatus for preventing display screen burn-in |
| US6340992B1 (en) * | 1997-12-31 | 2002-01-22 | Texas Instruments Incorporated | Automatic detection of letterbox and subtitles in video |
| US6366706B1 (en) * | 1997-10-28 | 2002-04-02 | Deutsche Thomson-Brandt Gmbh | Method and apparatus for automatic aspect format detection in digital video pictures |
| US6463102B1 (en) * | 1998-09-11 | 2002-10-08 | Harmonic, Inc. | Digital video compressor with border processor |
| US6519006B1 (en) * | 1999-07-29 | 2003-02-11 | Japan Broadcasting Corp | Image aspect ratio converting apparatus |
| US6747671B1 (en) * | 1999-09-06 | 2004-06-08 | Sony Corporation | Video apparatus having function to change size of image and method thereof |
| US20040114049A1 (en) * | 2002-12-12 | 2004-06-17 | Jitesh Arora | System for detecting aspect ratio and method thereof |
| JP2004186803A (en) | 2002-11-29 | 2004-07-02 | Matsushita Electric Ind Co Ltd | Image display and method therefor |
| JP2005203933A (en) | 2004-01-14 | 2005-07-28 | Matsushita Electric Ind Co Ltd | Video-reproducing apparatus and video-reproducing method |
| US6947097B1 (en) * | 1999-05-06 | 2005-09-20 | Thomson Licensing S.A. | Process for detecting black bars in a video image |
| US7046302B2 (en) * | 2000-08-25 | 2006-05-16 | Sony Corporation | Picture processing apparatus and picture processing method |
| US7061552B1 (en) * | 2000-01-28 | 2006-06-13 | Sony Corporation | Method and apparatus to perform automatic digital convergence |
| US7129992B2 (en) * | 2002-10-03 | 2006-10-31 | Stmicroelectroniccs Sa | Method and system for video display with automatic reframing |
| US7209180B2 (en) * | 2002-11-06 | 2007-04-24 | Funai Electric Co., Ltd. | Video output device |
| US7262812B2 (en) * | 2004-12-30 | 2007-08-28 | General Instrument Corporation | Method for fine tuned automatic zoom |
| US7262811B2 (en) * | 2004-12-29 | 2007-08-28 | General Instrument Corporation | System and method for automatic zoom |
| US7339627B2 (en) * | 2003-10-30 | 2008-03-04 | Broadcom Corporation | Method and system for automatic detection and display of aspect ratio |
| US7349031B2 (en) * | 2003-04-25 | 2008-03-25 | Sanyo Electric Co., Ltd. | Television receiver |
| US7424148B2 (en) * | 2003-06-27 | 2008-09-09 | Stmicroelectronics Asia Pacific Pte. Ltd. | Method and system for contrast enhancement of digital video |
| US7440033B2 (en) * | 2004-03-30 | 2008-10-21 | Matsushita Electric Industrial Co., Ltd. | Vector based motion compensation at image borders |
| US7502513B2 (en) * | 2003-11-14 | 2009-03-10 | Lsi Corporation | Commercial detector with a start of active video detector |
| US7538821B2 (en) * | 2004-12-28 | 2009-05-26 | Samsung Electronics Co., Ltd | Display apparatus to detect letter-box boundary and method of displaying image using the same |
| US7612830B2 (en) * | 2005-01-19 | 2009-11-03 | Samsung Electronics Co., Ltd. | Apparatus and method for extracting aspect ratio of received broadcast content |
| US7643091B2 (en) * | 2004-05-18 | 2010-01-05 | Harris Technology, Llc | Aspect ratio enhancement |
-
2006
- 2006-06-08 JP JP2006159316A patent/JP2007329700A/en active Pending
-
2007
- 2007-06-06 US US11/810,962 patent/US8098328B2/en not_active Expired - Fee Related
- 2007-06-08 CN CN200710110277XA patent/CN101087380B/en not_active Expired - Fee Related
Patent Citations (40)
| Publication number | Priority date | Publication date | Assignee | Title |
|---|---|---|---|---|
| JPH0527736A (en) | 1991-07-18 | 1993-02-05 | Matsushita Electric Ind Co Ltd | Method and device for processing video signal |
| JPH06175641A (en) | 1992-12-04 | 1994-06-24 | Sony Corp | Character input display device |
| US5956092A (en) * | 1993-10-20 | 1999-09-21 | Victor Company Of Japan, Ltd. | Television receiver with adjustable frame size |
| US5699123A (en) * | 1993-10-20 | 1997-12-16 | Victor Company Of Japan, Ltd. | Television receiver with an adjustable frame size |
| US5760840A (en) * | 1994-03-31 | 1998-06-02 | Matsushita Electric Industrial Co., Ltd. | Apparatus for distinguishing between a plurality of video signal types, apparatus for automatic aspect ratio determination and television receiver |
| JP3429842B2 (en) | 1994-04-15 | 2003-07-28 | 松下電器産業株式会社 | Image information detection device for video signal |
| US5748257A (en) | 1994-04-15 | 1998-05-05 | Matsushita Electric Industrial Co., Ltd. | Picture information detecting apparatus for a video signal |
| US6621927B1 (en) * | 1994-06-22 | 2003-09-16 | Hitachi, Ltd. | Apparatus for detecting position of featuring region of picture, such as subtitle or imageless part |
| US6002797A (en) * | 1994-06-22 | 1999-12-14 | Hitachi, Ltd. | Apparatus for detecting position of featuring region of picture, such as subtitle or imageless part |
| US5686970A (en) * | 1994-12-08 | 1997-11-11 | Matsushita Electric Industrial Co., Ltd. | Average luminance level detection apparatus and aspect ratio auto-discrimination apparatus for a television signal using the same |
| US5808697A (en) * | 1995-06-16 | 1998-09-15 | Mitsubishi Denki Kabushiki Kaisha | Video contrast enhancer |
| JPH0918797A (en) | 1995-06-28 | 1997-01-17 | Sanyo Electric Co Ltd | Television receiver |
| US6208385B1 (en) * | 1996-10-17 | 2001-03-27 | Kabushiki Kaisha Toshiba | Letterbox image detection apparatus |
| US6163621A (en) * | 1997-02-27 | 2000-12-19 | Samsung Electronics Co., Ltd | Histogram equalization method and device in contrast enhancement apparatus for image processing system |
| US6366706B1 (en) * | 1997-10-28 | 2002-04-02 | Deutsche Thomson-Brandt Gmbh | Method and apparatus for automatic aspect format detection in digital video pictures |
| US6340992B1 (en) * | 1997-12-31 | 2002-01-22 | Texas Instruments Incorporated | Automatic detection of letterbox and subtitles in video |
| US6463102B1 (en) * | 1998-09-11 | 2002-10-08 | Harmonic, Inc. | Digital video compressor with border processor |
| US6262772B1 (en) * | 1998-11-23 | 2001-07-17 | Philips Electronics North America Corporation | Method and apparatus for preventing display screen burn-in |
| US6947097B1 (en) * | 1999-05-06 | 2005-09-20 | Thomson Licensing S.A. | Process for detecting black bars in a video image |
| US6519006B1 (en) * | 1999-07-29 | 2003-02-11 | Japan Broadcasting Corp | Image aspect ratio converting apparatus |
| US6747671B1 (en) * | 1999-09-06 | 2004-06-08 | Sony Corporation | Video apparatus having function to change size of image and method thereof |
| US7061552B1 (en) * | 2000-01-28 | 2006-06-13 | Sony Corporation | Method and apparatus to perform automatic digital convergence |
| US7046302B2 (en) * | 2000-08-25 | 2006-05-16 | Sony Corporation | Picture processing apparatus and picture processing method |
| US7129992B2 (en) * | 2002-10-03 | 2006-10-31 | Stmicroelectroniccs Sa | Method and system for video display with automatic reframing |
| US7209180B2 (en) * | 2002-11-06 | 2007-04-24 | Funai Electric Co., Ltd. | Video output device |
| JP2004186803A (en) | 2002-11-29 | 2004-07-02 | Matsushita Electric Ind Co Ltd | Image display and method therefor |
| US7212218B2 (en) * | 2002-11-29 | 2007-05-01 | Matsushita Electric Industrial Co., Ltd. | Video display apparatus and video display method |
| US20040114049A1 (en) * | 2002-12-12 | 2004-06-17 | Jitesh Arora | System for detecting aspect ratio and method thereof |
| US7187415B2 (en) * | 2002-12-12 | 2007-03-06 | Ati Technologies, Inc. | System for detecting aspect ratio and method thereof |
| US7349031B2 (en) * | 2003-04-25 | 2008-03-25 | Sanyo Electric Co., Ltd. | Television receiver |
| US7424148B2 (en) * | 2003-06-27 | 2008-09-09 | Stmicroelectronics Asia Pacific Pte. Ltd. | Method and system for contrast enhancement of digital video |
| US7339627B2 (en) * | 2003-10-30 | 2008-03-04 | Broadcom Corporation | Method and system for automatic detection and display of aspect ratio |
| US7502513B2 (en) * | 2003-11-14 | 2009-03-10 | Lsi Corporation | Commercial detector with a start of active video detector |
| JP2005203933A (en) | 2004-01-14 | 2005-07-28 | Matsushita Electric Ind Co Ltd | Video-reproducing apparatus and video-reproducing method |
| US7440033B2 (en) * | 2004-03-30 | 2008-10-21 | Matsushita Electric Industrial Co., Ltd. | Vector based motion compensation at image borders |
| US7643091B2 (en) * | 2004-05-18 | 2010-01-05 | Harris Technology, Llc | Aspect ratio enhancement |
| US7538821B2 (en) * | 2004-12-28 | 2009-05-26 | Samsung Electronics Co., Ltd | Display apparatus to detect letter-box boundary and method of displaying image using the same |
| US7262811B2 (en) * | 2004-12-29 | 2007-08-28 | General Instrument Corporation | System and method for automatic zoom |
| US7262812B2 (en) * | 2004-12-30 | 2007-08-28 | General Instrument Corporation | Method for fine tuned automatic zoom |
| US7612830B2 (en) * | 2005-01-19 | 2009-11-03 | Samsung Electronics Co., Ltd. | Apparatus and method for extracting aspect ratio of received broadcast content |
Non-Patent Citations (1)
| Title |
|---|
| Office Action from Japanese Application No. 2006-159316, dated May 10, 2011. |
Cited By (11)
| Publication number | Priority date | Publication date | Assignee | Title |
|---|---|---|---|---|
| US20130100349A1 (en) * | 2010-12-20 | 2013-04-25 | Texas Instruments Incorporated | Apparatus and Method for Black Bar Detection In Digital TVs and Set-Top Boxes |
| US8547481B2 (en) * | 2010-12-20 | 2013-10-01 | Texas Instruments Incorporated | Apparatus and method for black bar detection in digital TVs and set-top boxes |
| US20130155320A1 (en) * | 2011-12-09 | 2013-06-20 | Texas Instruments Incorporated | Perceptual video quality improvement for videos containing black bars |
| US8976292B2 (en) * | 2011-12-09 | 2015-03-10 | Texas Instruments Incorporated | Perceptual video quality improvement for videos containing black bars |
| US9710161B2 (en) | 2014-12-29 | 2017-07-18 | Samsung Electronics Co., Ltd. | User terminal device and control method thereof |
| US10331341B2 (en) | 2014-12-29 | 2019-06-25 | Samsung Electronics Co., Ltd. | User terminal device and control method thereof |
| US10747431B2 (en) | 2014-12-29 | 2020-08-18 | Samsung Electronics Co., Ltd. | User terminal device and control method thereof |
| US20200356265A1 (en) | 2014-12-29 | 2020-11-12 | Samsung Electronics Co., Ltd. | User terminal device and control method thereof |
| US11782595B2 (en) | 2014-12-29 | 2023-10-10 | Samsung Electronics Co., Ltd. | User terminal device and control method thereof |
| US20220292729A1 (en) * | 2021-03-10 | 2022-09-15 | The United States Of America, As Represented By The Secretary Of The Navy | Geospatial data abstraction library (gdal) conversion tool for data compression |
| US11869222B2 (en) * | 2021-03-10 | 2024-01-09 | The United States Of America, As Represented By The Secretary Of The Navy | Geospatial data abstraction library (GDAL) conversion tool for data compression |
Also Published As
| Publication number | Publication date |
|---|---|
| CN101087380A (en) | 2007-12-12 |
| CN101087380B (en) | 2011-08-03 |
| JP2007329700A (en) | 2007-12-20 |
| US20080007655A1 (en) | 2008-01-10 |
Similar Documents
| Publication | Publication Date | Title |
|---|---|---|
| US8098328B2 (en) | Image signal processing apparatus, image display and image display method | |
| US8111328B2 (en) | Image signal processing apparatus, image display, and image display method | |
| US7839455B2 (en) | Image processing apparatus, image display and image processing method | |
| JP4561482B2 (en) | Video display device | |
| US8369646B2 (en) | Image correction circuit, image correction method and image display | |
| US7450182B2 (en) | Image display apparatus and picture quality correction | |
| US20050168483A1 (en) | Device and method for processing video signal | |
| KR20050000956A (en) | Apparatus for converting video format | |
| US8369645B2 (en) | Image correction circuit, image correction method and image display | |
| KR20040015965A (en) | Apparatus for conversing format | |
| US8102473B2 (en) | Image correction circuit, image correction method and image display | |
| US7508449B1 (en) | Film mode judder elimination circuit and method | |
| US8279354B2 (en) | Apparatuses and methods for processing video signals | |
| CN101115202A (en) | Image processing apparatus, display apparatus and image processing method | |
| US8345156B2 (en) | Progressive scanning conversion apparatus and progressive scanning conversion method | |
| US20070046788A1 (en) | Image processing apparatus, image display and image processing method | |
| KR101347636B1 (en) | Image signal processor and method thereof | |
| KR100845866B1 (en) | Method for adjustment component signal and Image display apparatus thereof | |
| JP2010259084A (en) | Video display device |
Legal Events
| Date | Code | Title | Description |
|---|---|---|---|
| AS | Assignment |
Owner name: SONY CORPORATION, JAPAN Free format text: ASSIGNMENT OF ASSIGNORS INTEREST;ASSIGNORS:FUJISAWA, TOMOICHI;MIYAZAKI, SHINICHIRO;REEL/FRAME:019780/0259 Effective date: 20070820 |
|
| ZAAA | Notice of allowance and fees due |
Free format text: ORIGINAL CODE: NOA |
|
| ZAAB | Notice of allowance mailed |
Free format text: ORIGINAL CODE: MN/=. |
|
| ZAAA | Notice of allowance and fees due |
Free format text: ORIGINAL CODE: NOA |
|
| STCF | Information on status: patent grant |
Free format text: PATENTED CASE |
|
| FPAY | Fee payment |
Year of fee payment: 4 |
|
| AS | Assignment |
Owner name: SATURN LICENSING LLC, NEW YORK Free format text: ASSIGNMENT OF ASSIGNORS INTEREST;ASSIGNOR:SONY CORPORATION;REEL/FRAME:043177/0794 Effective date: 20170613 |
|
| MAFP | Maintenance fee payment |
Free format text: PAYMENT OF MAINTENANCE FEE, 8TH YEAR, LARGE ENTITY (ORIGINAL EVENT CODE: M1552); ENTITY STATUS OF PATENT OWNER: LARGE ENTITY Year of fee payment: 8 |
|
| FEPP | Fee payment procedure |
Free format text: MAINTENANCE FEE REMINDER MAILED (ORIGINAL EVENT CODE: REM.); ENTITY STATUS OF PATENT OWNER: LARGE ENTITY |
|
| LAPS | Lapse for failure to pay maintenance fees |
Free format text: PATENT EXPIRED FOR FAILURE TO PAY MAINTENANCE FEES (ORIGINAL EVENT CODE: EXP.); ENTITY STATUS OF PATENT OWNER: LARGE ENTITY |
|
| STCH | Information on status: patent discontinuation |
Free format text: PATENT EXPIRED DUE TO NONPAYMENT OF MAINTENANCE FEES UNDER 37 CFR 1.362 |
|
| FP | Lapsed due to failure to pay maintenance fee |
Effective date: 20240117 |