US8214177B2 - Optimized stochastic resonance signal detection method - Google Patents
Optimized stochastic resonance signal detection method Download PDFInfo
- Publication number
- US8214177B2 US8214177B2 US12/710,143 US71014310A US8214177B2 US 8214177 B2 US8214177 B2 US 8214177B2 US 71014310 A US71014310 A US 71014310A US 8214177 B2 US8214177 B2 US 8214177B2
- Authority
- US
- United States
- Prior art keywords
- noise
- detection
- stochastic resonance
- probability
- detector
- Prior art date
- Legal status (The legal status is an assumption and is not a legal conclusion. Google has not performed a legal analysis and makes no representation as to the accuracy of the status listed.)
- Active
Links
- 238000001514 detection method Methods 0.000 title claims abstract description 279
- 238000000034 method Methods 0.000 claims abstract description 127
- 230000003902 lesion Effects 0.000 claims abstract description 76
- 208000004434 Calcinosis Diseases 0.000 claims abstract description 59
- 230000006870 function Effects 0.000 claims description 65
- 238000009826 distribution Methods 0.000 claims description 39
- 239000013598 vector Substances 0.000 claims description 13
- 230000001965 increasing effect Effects 0.000 claims description 9
- 238000009607 mammography Methods 0.000 claims description 3
- 238000004422 calculation algorithm Methods 0.000 abstract description 46
- 238000013459 approach Methods 0.000 abstract description 25
- 230000002159 abnormal effect Effects 0.000 abstract description 18
- 230000009255 platelet function activity Effects 0.000 description 52
- 238000012360 testing method Methods 0.000 description 28
- 238000002474 experimental method Methods 0.000 description 25
- 230000008569 process Effects 0.000 description 17
- 238000012545 processing Methods 0.000 description 17
- 230000000875 corresponding effect Effects 0.000 description 13
- 239000000203 mixture Substances 0.000 description 11
- 239000000654 additive Substances 0.000 description 10
- 230000000996 additive effect Effects 0.000 description 10
- 230000006872 improvement Effects 0.000 description 10
- 238000004195 computer-aided diagnosis Methods 0.000 description 8
- 206010006187 Breast cancer Diseases 0.000 description 7
- 208000026310 Breast neoplasm Diseases 0.000 description 7
- 230000008901 benefit Effects 0.000 description 7
- 230000000694 effects Effects 0.000 description 7
- 230000002708 enhancing effect Effects 0.000 description 6
- 230000003044 adaptive effect Effects 0.000 description 5
- 206010028980 Neoplasm Diseases 0.000 description 4
- 238000004458 analytical method Methods 0.000 description 4
- 238000003745 diagnosis Methods 0.000 description 4
- 230000009467 reduction Effects 0.000 description 4
- 238000013528 artificial neural network Methods 0.000 description 3
- 230000003247 decreasing effect Effects 0.000 description 3
- 230000001419 dependent effect Effects 0.000 description 3
- 238000011161 development Methods 0.000 description 3
- 238000002059 diagnostic imaging Methods 0.000 description 3
- 238000013399 early diagnosis Methods 0.000 description 3
- 238000011156 evaluation Methods 0.000 description 3
- 230000004927 fusion Effects 0.000 description 3
- 238000005259 measurement Methods 0.000 description 3
- 238000012986 modification Methods 0.000 description 3
- 230000004048 modification Effects 0.000 description 3
- 238000000926 separation method Methods 0.000 description 3
- 238000003657 Likelihood-ratio test Methods 0.000 description 2
- 210000000481 breast Anatomy 0.000 description 2
- 201000011510 cancer Diseases 0.000 description 2
- 238000007635 classification algorithm Methods 0.000 description 2
- 230000007423 decrease Effects 0.000 description 2
- 238000013461 design Methods 0.000 description 2
- 230000014509 gene expression Effects 0.000 description 2
- 230000010354 integration Effects 0.000 description 2
- 230000003211 malignant effect Effects 0.000 description 2
- 238000003909 pattern recognition Methods 0.000 description 2
- 238000011160 research Methods 0.000 description 2
- 230000004083 survival effect Effects 0.000 description 2
- 238000000342 Monte Carlo simulation Methods 0.000 description 1
- 238000001574 biopsy Methods 0.000 description 1
- 230000002308 calcification Effects 0.000 description 1
- 230000015556 catabolic process Effects 0.000 description 1
- 230000008859 change Effects 0.000 description 1
- 230000000052 comparative effect Effects 0.000 description 1
- 238000010276 construction Methods 0.000 description 1
- 230000002596 correlated effect Effects 0.000 description 1
- 238000006731 degradation reaction Methods 0.000 description 1
- 230000006866 deterioration Effects 0.000 description 1
- 238000010586 diagram Methods 0.000 description 1
- 201000010099 disease Diseases 0.000 description 1
- 208000037265 diseases, disorders, signs and symptoms Diseases 0.000 description 1
- 229940079593 drug Drugs 0.000 description 1
- 239000003814 drug Substances 0.000 description 1
- 238000009472 formulation Methods 0.000 description 1
- 238000010191 image analysis Methods 0.000 description 1
- 238000012804 iterative process Methods 0.000 description 1
- 230000004807 localization Effects 0.000 description 1
- 238000013507 mapping Methods 0.000 description 1
- 239000000463 material Substances 0.000 description 1
- 238000013178 mathematical model Methods 0.000 description 1
- 230000007246 mechanism Effects 0.000 description 1
- 239000004033 plastic Substances 0.000 description 1
- 229920003023 plastic Polymers 0.000 description 1
- 238000012805 post-processing Methods 0.000 description 1
- 238000011084 recovery Methods 0.000 description 1
- 238000005070 sampling Methods 0.000 description 1
- 238000012216 screening Methods 0.000 description 1
- 238000013179 statistical model Methods 0.000 description 1
- 238000000528 statistical test Methods 0.000 description 1
- 208000024891 symptom Diseases 0.000 description 1
- 230000009897 systematic effect Effects 0.000 description 1
- 238000012795 verification Methods 0.000 description 1
- 230000000007 visual effect Effects 0.000 description 1
Images


Classifications
-
- G06T5/70—
-
- A—HUMAN NECESSITIES
- A61—MEDICAL OR VETERINARY SCIENCE; HYGIENE
- A61B—DIAGNOSIS; SURGERY; IDENTIFICATION
- A61B6/00—Apparatus for radiation diagnosis, e.g. combined with radiation therapy equipment
- A61B6/50—Clinical applications
- A61B6/502—Clinical applications involving diagnosis of breast, i.e. mammography
-
- G—PHYSICS
- G06—COMPUTING; CALCULATING OR COUNTING
- G06T—IMAGE DATA PROCESSING OR GENERATION, IN GENERAL
- G06T5/00—Image enhancement or restoration
- G06T5/20—Image enhancement or restoration by the use of local operators
-
- H—ELECTRICITY
- H04—ELECTRIC COMMUNICATION TECHNIQUE
- H04B—TRANSMISSION
- H04B17/00—Monitoring; Testing
- H04B17/20—Monitoring; Testing of receivers
- H04B17/26—Monitoring; Testing of receivers using historical data, averaging values or statistics
-
- G—PHYSICS
- G06—COMPUTING; CALCULATING OR COUNTING
- G06T—IMAGE DATA PROCESSING OR GENERATION, IN GENERAL
- G06T2207/00—Indexing scheme for image analysis or image enhancement
- G06T2207/10—Image acquisition modality
- G06T2207/10116—X-ray image
-
- G—PHYSICS
- G06—COMPUTING; CALCULATING OR COUNTING
- G06T—IMAGE DATA PROCESSING OR GENERATION, IN GENERAL
- G06T2207/00—Indexing scheme for image analysis or image enhancement
- G06T2207/30—Subject of image; Context of image processing
- G06T2207/30004—Biomedical image processing
- G06T2207/30068—Mammography; Breast
Definitions
- the present invention relates to signal detection and, more particularly, to a method for detecting micro-calcifications in mammograms using novel algorithms and stochastic resonance noise.
- Stochastic resonance is a nonlinear physical phenomenon in which the output signals of some nonlinear systems can be enhanced by adding suitable noise under certain conditions.
- the classic SR signature is the signal-to-noise ratio (SNR) gain of certain nonlinear systems, i.e., the output SNR is higher than the input SNR when an appropriate amount of noise is added.
- SNR signal-to-noise ratio
- SNR gain-based SR approaches have several limitations. First, the definition of SNR is not uniform and it varies from one application to another. Second, to optimize the performance, the complete a priori knowledge of the signal is required. Finally, for detection problems where the noise is non-Gaussian, SNR is not always directly related to detection performance; i.e., optimizing output SNR does not guarantee optimizing probability of detection.
- SR also plays a very important role in improving the signal detectability. For example, improvement of detection performance of a weak sinusoid signal has been reported.
- performance of the sign detector can be enhanced by adding some white Gaussian noise under certain circumstances.
- the suboptimal detector known as the locally optimal detector (LOD)
- LOD locally optimal detector
- detection performance is optimum when the noise parameters and detector parameters are matched.
- the stochastic resonance phenomenon in quantizers results in a better detection performance can be achieved by a proper choice of the quantizer thresholds. Detection performance can be further improved by using an optimal detector on the output signal.
- Simple and robust suboptimal detectors are used in numerous applications. To improve a suboptimal detector detection performance, two approaches are widely used. In the first approach, the detector parameters are varied. Alternatively, when the detector itself cannot be altered or the optimum parameter values are difficult to obtain, adjusting the observed data becomes a viable approach. Adding a dependent noise is not always possible because pertinent prior information is usually not available.
- detection performance can be improved by adding an independent noise to the data under certain conditions.
- the optimal amount of noise can be determined that maximizes the detection performance for a given suboptimal detector.
- the underlying mechanism of the SR phenomenon as it relates to detection problems has not fully been explored. For example, until now the “best” noise to be added in order to achieve the best achievable detection performance for the suboptimal detector was not known. Additionally, the optimal level of noise that should be used for enhanced performance was also unknown.
- breast cancer is a serious disease with high occurrence rate in women. There is clear evidence which shows that early diagnosis and treatment of breast cancer can significantly increase the chance of survival for patients.
- One of the important early symptoms of breast cancer in the mammograms is the appearance of micro-calcification clusters. An accurate detection of micro-calcifications is highly desirable to ensure early diagnosis of breast cancer.
- CAD computer-aided diagnosis
- Deepa and Tessamma used the deterministic fractal model to characterize breast background tissues. See Sankar Deepa and Thomas Tessamma, “Fractal modeling of mammograms based on mean and variance for the detection of micro-calcifications,” in Proc. International Conference on Computational Intelligence and Multimedia Applications, vol. 2, pp. 334-348, 13-15, December, 2007.
- the challenge for these model-based methods is that an accurate model is generally not easy to obtain and model mismatch is hard to avoid, so the detection results are deteriorated. There are also some methods that attempt to avoid the necessity of modeling during the detection process.
- RVM relevance vector machine
- ANN feed-forward artificial neural network
- Strickland et al., Lemaur et al. and Li and Dong proposed the wavelet domain thresholding techniques to obtain the information of interest for the detection of micro-calcifications. See R. N. Strickland, “Wavelet transform methods for objects detection and recovery,” IEEE Trans. Image Processing, vol. 6, pp. 724-735, May, 1997; G. Lemaur, K. Drouiche, and J. DeConinck, “Highly regular wavelets for the detection of clustered micro-calcifications in mammograms,” IEEE Trans. on Medical Imaging, vol. 22, no.
- the present invention provides a method for signal detection in observed sensor data for a broad range of electromagnetic or acoustic applications such as radar, sonar, as well as imagery such as visual, hyperspectral, and multi-spectral.
- the method of the present invention is applicable in applications involving non-linear processing of the data.
- the method of the present invention determines the stochastic resonance noise probability density function to be added to either the observed data process to optimize detection with no increase in the false alarm rate, or to an image to optimize the detection of signal objects from the background.
- the method of the present invention determines the conditions required for performance improvement using additive stochastic resonance noise.
- the method of the present invention also yields a constant false alarm rate (CFAR) receiver implementation, which is essential in operational conditions in which it is imperative to maintain false alarm rates without adjusting the detector threshold level.
- CFAR constant false alarm rate
- an apparatus and method for detecting micro-calcifications in mammograms using novel algorithms and stochastic resonance noise where a suitable dose of noise is added to the abnormal mammograms such that the performance of a suboptimal lesion detector is improved without altering the detector's parameters.
- a stochastic resonance noise-based detection approach is presented to improve some suboptimal detectors which suffer from model mismatch due to the Gaussian assumption.
- a stochastic resonance noise-based detection enhancement framework is presented to deal with more general model mismatch cases. The algorithms and the framework are tested on a set of 75 representative abnormal mammograms. The results show that they yield superior performance when compared with several other classification and detection approaches.
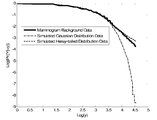
- FIG. 1 is a graph of the effect of additive noise according to the present invention.
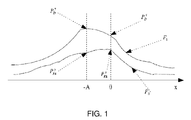
- FIG. 2 is a graph of the values of F 1 and F 0 as a function of x according to the present invention.
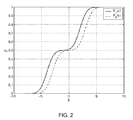
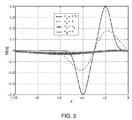
- FIG. 3 is a graph of the relationship between f 1 and f 0 according to the present invention.
- FIG. 10 is a schematic of an SR detection system according to the present invention.
- FIG. 11 is a schematic of an SR detection system according to the present invention.
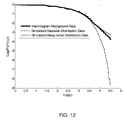
- FIG. 12 is a schematic of APD plots of the real-world mammogram background data, simulated Gaussian distribution and heavy tailed S ⁇ S distribution data on a log-log scale, in accordance with an embodiment of the present invention.
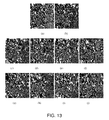
- FIG. 13 shows the detection results for abnormal mammogram type 1 using novel algorithms in accordance with an embodiment of the present invention.
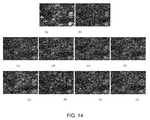
- FIG. 14 shows the detection results for abnormal mammogram type 2 using novel algorithms in accordance with an embodiment of the present invention.
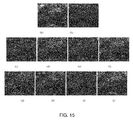
- FIG. 15 shows the detection results for abnormal mammogram type 3 using novel algorithms in accordance with an embodiment of the present invention.
- FIG. 1 a chart illustrating the effective of additive noise on a given signal.
- CFR constant false alarm rate
- false alarm refers to the decision that a signal is present when in fact it is not.
- false alarm rate refers to the rate at which a false alarm occurs.
- fixed detector refers to a detector comprised of a fixed test statistic and a fixed threshold.
- ROC receiver operating characteristic
- the optimal noise is equal to zero.
- the detector is fixed, i.e., the critical function ⁇ of y is the same as that for x, the probability of detection based on data y is given by,
- subscript ⁇ of F and C may be omitted and denotes as F 1 , F 0 , and C n , respectively.
- F 1 ( ⁇ 2) is the P D of this detection scheme with input x ⁇ 2.
- F 1 and F 0 values are known.
- F 1 and F 0 can be obtained from the data itself by processing it through the detector and recording the detection performance.
- the optimal SR noise definition may be formalized as follows.
- p n opt arg ⁇ ⁇ max p n ⁇ ⁇ R N ⁇ F 1 ⁇ ( x ) ⁇ p n ⁇ ( x ) ⁇ ⁇ d x ( 15 )
- Conditions 1) and 2) are fundamental properties of a pdf function.
- Condition 3) ensures that P y FA ⁇ P x FA , i.e., the P FA constraint specified under the Neyman-Pearson Criterion is satisfied. Further, if the inequality of condition 3) becomes equality, the Constant False Alarm Rate (CFAR) property of the original detector is maintained.
- CFAR Constant False Alarm Rate
- some additional restrictions on the noise may also be applied.
- the conditions 1), 2), and 3) are always valid and the optimum noise pdf can be determined for these conditions.
- the noise distribution in the f 0 domain can also be uniquely determined. Further, the conditions on the optimum noise can be rewritten in terms of f 0 equivalently as
- the relationship may be determined by Monte Carlo simulation using importance sampling.
- f 1 and f 0 are much easier to estimate and once the optimum p n,f 0 is found, the optimum p n (x) is determined as well by the inverse of the functions F 0 and F 1 .
- Improvability of a given detector when SR noise is added can be determined by computing and comparing P D,opt y and P D x .
- P D,opt y >P D x the given detector is improvable by adding SR noise.
- F 1 (•) and F 0 (•) significant computation.
- Theorem 1 (Improvability of Detection via SR): If J(P FA x )>P D x or J′′(P FA x )>0 when J(t) is second order continuously differentiable around P FA x , then there exists at least one noise process n with pdf p n (•) that can improve the detection performance.
- p n opt ⁇ ( n ) f 02 ⁇ ( k 0 ) - P FA x f 02 ⁇ ( k 0 ) - f 01 ⁇ ( k 0 ) ⁇ ⁇ ⁇ ( n - n 1 ) + P FA x - f 01 ⁇ ( k 0 ) f 02 ⁇ ( k 0 ) - f 01 ⁇ ( k 0 ) ⁇ ⁇ n - n 2 ) ( 34 )
- G is also continuously differentiable. Since f 01 and f 02 are at least local maxima, we have
- a suboptimal detector is considered with test statistic
- this detector is essentially a fusion of the decision results of N i.i.d. sign detectors.
- the critical function is given by
- ⁇ ⁇ ( x ) ⁇ 1 x > 0 0 x ⁇ 0 . ( 43 )
- FIG. 2 shows the values of f 1 and f 0 as a function of x, while the relationship between F 1 and F 0 is shown in FIG. 3 .
- V the convex hull of all possible P D and P FA after n is added and shown as the light and dark shadowed regions in FIG. 3 . Note that a similar non-concave ROC occurs in distributed detection systems and dependent randomization is employed to improve system performance. Taking the derivative of f 1 w.r.t. f 0 , we have
- ⁇ 1 2 ⁇ ⁇ ⁇ ⁇ A ln ⁇ ( ⁇ + A ⁇ - A ) .
- this detector is improvable by adding independent SR noise.
- the noise modified data processes are denoted as y s , y g and y u , respectively.
- the pdfs of these suboptimal SR noises may be found by using the C(x) functions.
- p 1 ⁇ ( - x ) 1 2 ⁇ ⁇ ⁇ ( x ; ⁇ - A , ⁇ 0 2 ) + 1 2 ⁇ ⁇ ⁇ ( x ; - ⁇ - A , ⁇ 0 2 ) .
- H(x) has only a single root x 0 for x ⁇ 0 and H(x) ⁇ 0, ⁇ x ⁇ x 0 , H(x)>0, ⁇ x (x 0 , 0) and detection performance can be improved by adding symmetric SR noise.
- Table 1 below is a comparison of detection performance for different SR noise enhanced detectors, and shows the values of P D,opt y for the different types of SR noise.
- P D X 0.5114
- the improvement of different detectors are 0.1811, 0.1593, 0.0897 and 0.0693 for optimum SR noise, optimum symmetric noise, optimum uniform noise and optimum Gaussian noise enhanced detectors, respectively.
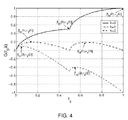
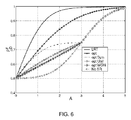
- FIG. 6 shows P D x as well as the maximum achievable P D y with different values of A.
- the detection performance is significantly improved by adding optimal SR noise.
- a ⁇ a certain degree of improvement is also observed by adding suboptimal SR noise.
- A is small, x 0 ⁇ and x 1 ⁇ , the detection performance of the optimum SR noise enhanced detector is close to the optimum symmetric noise enhanced one.
- A>0.6 the difference is significant.
- P D,opt y is still larger than P D x , i.e., the detection performance can still be improved.
- the P D improvement is not that significant because P D x >0.97 ⁇ 1 which is already a very good detector.
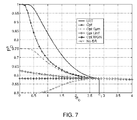
- P D x , P D,opt y u and P D,opt y g monotonically decrease when ⁇ increases.
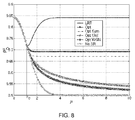
- An interesting observation from FIG. 8 is that the P D of the “optimum LRT” after the lowest value is reached, increases when ⁇ increases.
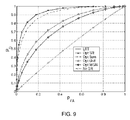
- the optimum SR detector and the optimum symmetric SR detector performance levels are superior to those of the uniform and Gaussian SR detectors and more closely approximate the LRT curve. For LRT, the performance is nearly perfect (P D ⁇ 1 for all P FA s).
- the present invention thus establishes a mathematical theory for the stochastic resonance (SR) noise modified detection problem, as well as several fundamental theorems on SR in detection theory.
- the detection performance of a SR noise enhanced detector is analyzed where, for any additive noise, the detection performance in terms of P D and P FA can be obtained by applying the expressions of the present invention.
- the present invention established the conditions of potential improvement of P D via the SR effect, which leads to the sufficient condition for the improvability/non-improvability of most suboptimal detectors.
- the present invention also established the exact form of the optimal SR noise pdf.
- the optimal SR noise is shown to be a proper randomization of no more than two discrete signals.
- the upper limit of the SR enhanced detection performance is obtained by the present invention.
- the present invention provides an approach to determine the optimal SR consisting of the two discrete signals and their corresponding weights. It should be pointed out that the present invention is applicable to a variety of SR detectors, e.g., bistable systems.
- the SR detectors that may be implemented with the present invention are shown in FIG. 10 .
- the nonlinear system block of FIG. 10 can depict the bistable system.
- the decision problem based on x′ can be described by decision function ⁇ 0 (•) as shown.
- the SR detectors can be viewed as the system in FIG. 10 without the additive SR noise n.
- the present invention admits conventional SR systems and allows improved detection system by adding n as shown in FIG. 10 .
- FIG. 11 illustrates a diagram of a SR detection system obtained by a modification of the observed data, x.
- the detection performance of six different detectors are compared, namely, the optimum LRT detector, optimum noise enhanced sign detector, optimum symmetric noise enhanced sign detector, optimum uniform noise enhanced sign detector, optimum Gaussian noise enhanced sign detector and the original sign detector.
- the noise type is predetermined
- much better detection performance is obtained by adding the proposed optimum SR noise to the observed data process.
- the present invention thus corresponds with the observed SR phenomenon in signal detection problems, and greatly advances the determination the applicability of SR in signal detection.
- the present invention can also be applied to many other signal processing problems such as distributed detection and fusion as well as pattern recognition applications.
- the present invention may thus be used to increase the probability of detecting signals embedded in non-Gaussian noise.
- the first step is to record data from an observed data process.
- stochastic resonance noise is added to said recorded.
- the appropriate stochastic resonance noise is controlled by determining the stochastic resonance noise probability density function (PDF) that does not increase the detector probability of false alarm.
- PDF stochastic resonance noise probability density function
- the SR noise may be determined for the case of a known data probability density function by determining from the known probability density function of the observed data process the stochastic resonance noise PDF that equals ⁇ (n ⁇ n 1 )+(1 ⁇ ) ⁇ (n ⁇ n 2 ), with values n 1 and n 2 equal to those of the two delta function locations, and with probabilities equal to ⁇ and (1 ⁇ ), respectively.
- ⁇ f 02 ⁇ ( k 0 ) - P FA x f 02 ⁇ ( k 0 ) - f 01 ⁇ ( k 0 ) .
- the SR noise for the case of a known data probability density function may be calculated by determining the stochastic resonance noise PDF that consists of a single delta function, ⁇ (n ⁇ n 0 ) with value n 0 equal to the delta function location with probability one.
- the minimum probability of error may be calculated from
- the next step is to determine the stochastic resonance noise consisting of two random variables n 1 and n 2 with values equal to those of the two delta function locations and with probabilities equal to those of said stochastic resonance noise probability density function; adding said stochastic resonance noise to said data; applying said fixed detector to the resulting data process.
- a test statistic for signal detection is calculated under a constant probability of false alarm rate (CFAR) constraint, such that the performance of suboptimal, nonlinear, fixed detectors operating in said non-Gaussian noise are improved.
- CFAR constant probability of false alarm rate
- Increasing the probability of detecting signals embedded in non-Gaussian noise comprises adding the stochastic resonance noise n 1 and n 2 with probability ⁇ and 1 ⁇ , respectively, to the data, and applying the fixed detector to the resulting data process.
- the present invention also provides a method for evaluating functions using f 1 , J(f 0 ), and
- f 1 F 1 ⁇ ( x )
- J ⁇ ( f 0 ) max f 1 ⁇ ( f 1 ⁇ ( f 0 ) )
- ⁇ and d J d f 0 lim ⁇ ⁇ 0 ⁇ J ⁇ ( f 0 + ⁇ ) - J ⁇ ( f 0 ) ⁇ .
- I ⁇ R I ⁇ R is called convex if f ( ⁇ x +(1 ⁇ ) y ) ⁇ f ( x )+(1 ⁇ ) f ( y ) (64) for all x, y ⁇ I and ⁇ in the open interval (0,1). It is called strictly convex provided that the inequality (64) is strict for x ⁇ y. Similarly, if ⁇ f: I ⁇ R is convex, then we say that f: I ⁇ R is concave.
- Theorem A-1 Suppose f′′ exists on (a,b). Then f is convex if and only if f′′(x) ⁇ 0. And if f′′(x)>0 on (a,b), then f is strictly convex on the interval.
- U be a subset of a linear space L.
- Theorem A-2 A set U ⁇ L is convex if and only if every convex combination of points of U lies in U.
- Theorem A-4 (Carathéodory's Theorem): If U ⁇ L, and its convex hull of H(U) has dimension m, then for each z ⁇ H(U), there exists m+1 points x 0 , x 1 , x m of U such that z is a convex combination of these points.
- SR noise-based detection algorithm and a general detection enhancement framework to improve the performance of the suboptimal detectors has been developed.
- the dependence of the determination of the optimum SR noise is reduced on the knowledge of the PDFs of the object (lesion) and background (normal tissues) by employing iterative learning procedures.
- An iterative SR noise-based detection enhancement scheme with memory to improve the efficiency and robustness of the SR noise-based detection systems is also developed.
- a more general SR noise-based detection enhancement framework is presented.
- Detection algorithms considered/developed in the following experiments include the Gaussian background assumption-based detector, General Gaussian detector, General Gaussian detector-based iterative detector, Gaussian assumption-based dynamic clustering algorithm, iterative mode separation algorithm, Gaussian mixture model-based clustering method, and higher order statistics method based on local maxima detection and adaptive wavelet transform.
- the descriptions of these algorithms are presented and discussed in the following Examples presented below. The equations referenced in the following Examples start with Equation No. 1.
- the mammograms used herein are from the Digital Database for Screening Mammography (DDSM), and the Mammographic Image Analysis Society (MIAS) Mini-mammographic Database.
- DDSM Digital Database for Screening Mammography
- MIAS Mammographic Image Analysis Society
- the majority of the mammograms used in the experiments are from DDSM, and only few of them are from the MIAS database, so the experimental parameters, such as the processing window size, are determined mainly based on DDSM.
- DDSM has 2620 cases available in 43 volumes.
- a case consists of between 6 and 10 mammograms, where the grey levels are quantized to 16 bits, and resolution of the images is 50 microns/pixel.
- the MIAS Database includes 330 mammograms with the resolution being 200 microns/pixel.
- the location and types (malignant or benign) of the mammogram lesions are identified by expert radiologists and used as the ground truth in our work. As discussed herein, the emphasis is on location detection based on the ground truth.
- Clusters Three types of representative abnormal mammograms with micro-calcifications (clusters) including one having homogeneous background with a small number of isolated micro-calcifications were chosen, one having homogeneous background with a large number of micro-calcifications (clusters) and one having inhomogeneous background with a moderate number of micro-calcifications (clusters), respectively. These three types of mammograms cover a broad spectrum of mammogram micro-calcification (cluster) cases. Seventy five images selected from the three types of mammograms, 25 for each type, are employed to test the algorithms.
- Micro-calcifications are very small, their sizes are in the range of 0.05-1.00 mm, and the average is 0.3 mm. Those smaller than 0.1 mm cannot be easily distinguished in the film-screen mammography from the high-frequency noise.
- the width of the majority of the micro-calcifications in these experiments is in the range between 0.25 and 0.5 mm.
- a micro-calcification cluster is considered to be a group of 3 to 5 or more micro-calcifications, 5 mm apart.
- the processing window size of 49 by 49 was chosen, which is based on experiments that were conducted as well as the characteristics and the size of the lesions. The experiments also indicated that the detection results were not very sensitive to the choice of window size provided that the window size was in the range between 31 and 61 when processing the data.
- micro-calcification is declared to be detected only if at least 4 by 4 positively detected pixels are in a clump.
- This Example develops three lesion detectors based on Gaussian assumption. As discussed in more detail below, it will be shown that the detectors are all suboptimal detectors, suffering from model mismatch.
- m is the pixel index corresponding to the pixel observation under consideration
- y[m] is the observed pixel intensity, larger than or equal to zero
- s[m] is the lesion signal
- w[m] is the background noise that is assumed to obey Gaussian distribution with mean ⁇ b and variance ⁇ b 2 .
- the noise is assumed to be additive, independently distributed and independent of the noise-free mammogram data.
- a processing window is employed with the pixel under consideration being at the center of the window. This window is employed to estimate the parameters of the detector by using the pixels included in it.
- GAD Gaussian Background Assumption-Based Detector
- the Gaussian background assumption leads to linear and tractable solutions.
- the micro-calcifications, the signals of interest here, are brighter spots than the surrounding normal background tissues. So the micro-calcification is modeled as a signal with constant amplitude, and the lesion detection problem is to detect a DC signal in Gaussian noise, which we refer to as the Gaussian background assumption-based detector (GBAD).
- GAD Gaussian background assumption-based detector
- the lesion signal s[m] in Eq. (1) is, therefore, a constant intensity.
- the optimal detector is a likelihood ratio test given as
- L ⁇ ( y _ ) p ⁇ ( y _ ; H 1 ) p ⁇ ( y _ ; H 0 ) ⁇ > decide ⁇ ⁇ H 1 ⁇ ⁇ ( 2 )
- y is the observation vector
- p( y ;H 1 ) and p( y ;H 0 ) are the PDFs under hypotheses H 1 and H 0 , respectively.
- T GBAD ⁇ ( y ) y - ⁇ b ⁇ > decide ⁇ ⁇ H 1 ⁇ ⁇ 1 ( 4 )
- y is the intensity of the pixel under consideration
- the threshold ⁇ 1 is determined from the desired P F and the statistical parameters, i.e., mean and variance, of the pixels in the processing window.
- an initial detection is first carried out in the processing window to perform a coarse detection, and the resulting detected negatives (H 0 ) and positives (H 1 ) are employed to estimate the parameters.
- Many methods such as a local maxima filter or adaptive thresholding techniques, can perform the initial detection. Local maxima filter is employed in this work because the lesion pixels generally have a higher intensity than the surrounding normal background tissues.
- miss For cancer diagnosis, the most serious mistake is to miss any lesions.
- P M the probability of miss (P M )
- a “safer” initial detection is used and an attempt is made to exclude all the lesion pixels from the background. It can be realized by using a local maxima filter with appropriate window size and local threshold, permitting more pixels having relatively higher intensities in the local regions to be classified into the lesion part.
- FIGS. 13 ( b ), 14 ( b ) and 15 ( b ), The detection results for GBAD are shown in FIGS. 13 ( b ), 14 ( b ) and 15 ( b ), corresponding to three types of mammograms with micro-calcifications, as discussed further below. From the figures, it can be seen that the micro-calcifications are completely detected but with a higher P F than the desired value, 0.01 used in the experiments. At this point, it suffices to say that the performance of the detector is not satisfactory. A detailed discussion of the experimental results is postponed to Example 5, infra.
- Micro-calcifications especially micro-calcification clusters, have a small size but generally do not have a constant intensity, so a Gaussian model as opposed to a constant signal model is proposed in this section to be a more reasonable model to represent the signal part.
- the problem can be considered to be the problem of detection of Gaussian signals in Gaussian noise.
- This detector is referred to as the general Gaussian detector (GGD).
- the lesion signal s[m] in Eq. (1) under this assumption obeys Gaussian distribution, i.e., s[m] ⁇ N( ⁇ s , ⁇ s 2 ).
- the detected positive pixels (corresponding to lesions) and negative pixels (corresponding to the background) in the initial detection are employed to coarsely estimate the means and variances of the lesion and background pixel intensity PDFs.
- p( y ; H 1 ) and p( y ; H 0 ) in Eq. (2) obey Gaussian distribution but with different variances, and the optimal test is still the likelihood ratio test given in Eq. (2).
- the optimum test can be expressed in terms of the GGD test statistic T GGD (y) as follows
- T GGD ⁇ ( y ) ⁇ s 2 ⁇ b 2 ⁇ ( y - ⁇ b ) 2 + 2 ⁇ ⁇ s ⁇ ( y - ⁇ b ) ⁇ > decide ⁇ ⁇ H 1 ⁇ ⁇ 2 ( 5 ) where the threshold ⁇ 2 is determined from the desired P F .
- the statistical parameters, namely the means and the variances, of the initially detected positive and negative pixels can be estimated using the processing window with the pixel under consideration at the center of the window.
- Eq. (5) is a detector with two thresholds because the test statistic is quadratic. Due to the nature of the abnormal mammograms, i.e., lesion pixels have intensities that are generally higher than the surrounding normal background tissues and the probability of the intensities of lesion pixels falling below the lower threshold is extremely small, thus, only the higher threshold is employed to classify the mammogram pixels into background and lesions. Therefore, the higher threshold of the test in Eq. (5) is used herein for the detection task.
- GGD_ID GGD-Based Iterative Detector
- an iterative method is proposed to further improve the performance of GGD by increasingly improving the estimation of statistical parameters in an iterative manner.
- the GGD is designed with the parameters, ⁇ s , ⁇ b , ⁇ s 2 and ⁇ b 2 , corresponding to the background and micro-calcifications, estimated from the detection result in the preceding iteration as opposed to keeping them fixed during all iterations, which results in different thresholds at each iteration.
- the presented GGD_ID algorithm is similar in spirit to Gaussian model-based dynamic clustering (GMDC), in which both background and lesions are assumed to obey Gaussian distributions, and the detection (or clustering) and parameter updating are performed in an iterative manner.
- GMDC Gaussian model-based dynamic clustering
- the method presented here incorporates an additional constraint in terms of the desired value of P F .
- P F is included in the algorithm is that at each step of the iteration, some detected negative pixels have intensities much larger than the mean of the detected background pixels and are close to that of the detected lesion pixels. In other words, some pixels have a non-negligible and, in fact, fairly high probability to belong to the lesion part.
- these pixels are classified into the lesion part by the desired P F value, such as the value 0.01 used herein. It is discussed in Example 5, infra, that the iterative detection method presented here performs better than the GMDC.
- FIG. 12 the amplitude probability distribution (APD) plots of real-world mammogram background data of a mammogram from the MIAS Mini-mammographic Database, and simulated Gaussian distribution and heavy-tailed S ⁇ S distribution data on a log-log scale (showing that the mammogram pixel intensities obey heavy-tailed S ⁇ S distribution more closely).
- APD amplitude probability distribution
- the simulated heavy-tailed S ⁇ S distribution is shown to be a better fit than the Gaussian one.
- the plots of the mammogram data and the simulated heavy-tailed S ⁇ S data decay linearly with a constant slope compared with that of the Gaussian data.
- One approach to the design of the optimal lesion detector is to derive the optimal test under the Neyman-Pearson formulation when the background is modeled as the S ⁇ S distribution.
- the difficulties in learning the parameters of the S ⁇ S distribution from the real-world data as well as the off-line integration when calculating the detection threshold constrains the practical application of the optimal S ⁇ S-based detectors.
- an alternate approach in accordance with an embodiment of the present invention is investigated, namely the application of SR noise, to the lesion detection problem.
- the suboptimal detectors designed based on the Gaussian noise background assumption will continue to be used. Admittedly there is a model mismatch.
- SR noise at the input will be added to the detector. It will be seen that the SR noise-based detector yields significant performance enhancement and is easy to implement.
- This Example presents the main results of work on SR noise-enhanced signal detection under Neyman-Pearson criterion, where the optimum form of the SR noise is determined.
- One of the main goals of an embodiment of the present invention is to develop SR noise-enhanced detection methods for lesion detection in mammograms.
- y is an N-dimensional data vector, i.e., y ⁇ R N .
- p 0 ( y ) and p 1 ( y ) are the pdfs of y under H 0 (background) and H 1 (lesion) hypotheses, respectively.
- Pixel by pixel detection is only considered herein, so y reduces to a scalar y.
- a test is necessary to choose between the two hypotheses, which can be completely characterized by a critical function, or decision function, ⁇ ( y ), 0 ⁇ ( y ) ⁇ 1, and
- T is the test statistic and a function of y .
- ⁇ is the threshold, and 0 ⁇ 1 is a suitable number.
- the detection performance of this test can be evaluated in terms of P D and P F ,
- P D y _ ⁇ R N ⁇ ⁇ ⁇ ( y _ ) ⁇ p 1 ⁇ ( y _ ) ⁇ d y _ ( 8 )
- P F y _ ⁇ R N ⁇ ⁇ ⁇ ( y _ ) ⁇ p 0 ⁇ ( y _ ) ⁇ d y _ ( 9 )
- P D y and P F y represent the P D and P F of the detector based on the input y , respectively.
- the SR noise-enhanced fixed detectors are considered herein whose parameters, such as the thresholds, are unchanged before and after adding the SR noise, so the critical function ⁇ of z is the same as that of y . Therefore,
- F i ⁇ ( y _ ) ⁇ R N ⁇ ⁇ ⁇ ( z _ ) ⁇ p i ⁇ ( z _ - y _ ) ⁇ d y _ . corresponds to hypothesis H i .
- Theorem 2 determines the form of the optimum SR noise when the detector is improvable.
- This Example relates to the development of a SR noise-based detection algorithm for lesion detection that attempts to improve the suboptimal detectors discussed in Example 1.
- An interative detection scheme involving the use of SR noise with memory is also presented.
- the SR noise-enhanced detection approach is employed for finding lesions and enhancing the previously discussed suboptimal detectors based on the Gaussian assumption. Pixel-by-pixel detection was performed.
- the suboptimal detectors to be improved result from the model mismatch and the lack of information about the mammogram statistics. These detectors are excellent candidates for the application of the SR noise-enhanced detection scheme.
- the basic idea of the SR noise-enhanced detection is to obtain the optimum additive SR noise based on the knowledge of the PDFs of the lesion and the background signals. Since these PDFs are not known, they need to be estimated from the given mammogram itself. The mammogram is modified with the optimum additive SR noise determined using the estimated pdf, and then the original suboptimal detector performs the detection. Two SR noise-based schemes are presented in this Example for improving lesion detection.
- the SR noise is first used to enhance the GBAD discussed in Example 1. To achieve this goal, the coarse detection of the lesion and background was performed using the local maxima filter mentioned in Example 1A. The detection threshold is calculated for the GBAD, which is suboptimum due to model mismatch. Then, the probability densities under H 1 and H 0 are obtained using the kernel density estimation method based on the detected positives and negatives. Kinosuke Fukunaga, Introduction to Statistical Pattern Recognition (second edition), Academic Press, September, 1990. The parameters of the SR noise are calculated from the suboptimum threshold and the estimated densities. The SR noise is added to the original mammogram. Detection is performed on the SR noise-modified data using the original detector.
- the difference is defined as the ratio of the number of differently labeled pixels in two successive detections to the total number of pixels in the mammogram.
- the labeled pixel here means a pixel classified as a positive (lesion) pixel or a negative (background) pixel.
- the iterative process is terminated when the ratio is smaller than a desired value.).
- a good initialization can be generated by schemes such as a maxima filter with an appropriate window size and threshold, such that satisfactory detection can still be obtained even when the threshold update procedure in Step 1 is not performed during the iterations.
- the critical function can remain fixed throughout the iterations if the initial detection is good enough.
- the threshold updating can also be performed every several iterations to improve the computation speed.
- the above procedure can be used to design the SR noise enhanced GGD test, i.e., 2SR GGD where the means, ⁇ s and ⁇ b , and variances, ⁇ s 2 and ⁇ b 2 , of the detected positives and negatives as well as the desired P F are used together to update the threshold in Step 1.
- the rest of the four steps of 2SR-GGD are the same as those of 2SR-GBAD. Since GGD is a more accurate model for abnormal mammograms, which can be seen in the comparison between the detection results of GBAD and GGD, 2SR-GGD yields better performance than 2SR-GBAD, according to the experiments.
- the 2SR-GGD method also shows improvement over GGD detection. What's more, the presented algorithm generally needs fewer iterations than GGD_ID discussed in Example 1 C to reach similar detection results. Also, the final results of the presented algorithm are better than GGD_ID.
- n * represents multiple-peak SR noises instead of a single two peak SR noise added to the original mammogram data in Step 4 of the algorithm presented in Example 3A, and
- PMF estimated probability mass function
- a larger weight i.e., higher probability is allocated to the SR noise calculated from the currently estimated PMFs, and the weights for the rest of the SR noises are inversely proportional to the distances between their corresponding PMFs and the currently estimated ones.
- the distance D between the PMFs obtained during the i th iteration and the latest estimated PMFs is defined as
- Example 3 A SR noise-based detection enhancement method was presented in Example 3 to reduce the model mismatch resulting from the Gaussian assumption. When models other than Gaussian models are used to fit data, there may still exist model mismatches, resulting in detector performance degradation, and SR noise may enhance the detector performance.
- the SR noise-based detection scheme is extended and a more general SR noise-based detection enhancement framework is presented. This framework provides much more flexibility and higher efficiency.
- the detectors (or classifiers) which are controlled are the ones that are considered herein, i.e., their thresholds can be changed.
- the framework is developed by modifying the first two steps of the detection procedure presented in Example 3 and is shown as follows.
- the two peak SR noise scheme with memory which yields multi peak SR noise, can also be used in Step 4.
- non-parametric methods such as kernel density estimation, k-nearest neighbor density estimation and Bootstrap methods, etc.
- kernel density estimation k-nearest neighbor density estimation
- Bootstrap methods etc.
- the kernel density estimation approach and threshold update using Eq. (18) is employed, same as those used in IMS. It is observed in Example 5 that the SR noise-based method can further improve the performance of IMS.
- This generates a suboptimal detector because the threshold is determined from the coarsely estimated a priori probabilities and PDFs by using the plug-in rule.
- Geoffrey Mclachlan and David Peel Finite Mixture Models, A Wiley-Interscience Publication, 2, October, 2000.
- the above iterative procedure includes a scheme for PDF estimation, but in the current detection (or clustering) application, the estimated PDFs are not of interest as an end in themselves. Instead, the detection results are the focus here which, of course, depend on the estimate. At the same time, an accurate PDF estimate can also be obtained from an accurate detection. So, the detection results are used in this paper as an alternative way to evaluate the performance of the PDF estimation algorithm. For comparison, a Gaussian mixture modeling (GMM)-based clustering method which performs the detection based on the GMM fitted pdf is employed with the detection results shown in Example 5, infra.
- GMM Gaussian mixture modeling
- This Example relates to the presentation of experimental results and the performance evaluation of several lesion detection and classification algorithms.
- the algorithms that are compared and analyzed include GBAD, GGD and GGD_ID discussed in Example 1, GADC, 2SR-GBAD-M, IMS, GMM-based clustering method, high order statistics method based on local maxima detection and adaptive wavelet transform (HOSLW) and the SR noise-based detection enhancement framework using a procedure similar to IMS, i.e., SR_IMS.
- the first four algorithms are based on the Gaussian distribution assumption and are parametric approaches.
- GMM is a semi-parametric technique for PDF estimation, in which the superposition of a number of parametric densities, e.g., Gaussian distribution, are used to approximate the underlying PDF. It offers a useful compromise between the non-parametric methods mentioned in Example 4, and the parametric estimation methods, such as those mentioned above.
- the GMM given in Eq. (19) is first fit by using the Expectation-maximization algorithm
- f(y) is the density of the observation y
- f i (y) are the component densities of the mixture.
- ⁇ circumflex over (P) ⁇ i and ⁇ circumflex over (f) ⁇ i (y) are the fitted values of P i and f i (y), respectively.
- the HOSLW algorithm is proved to have superior performance compared with other existing methods in terms of efficiency and reliability.
- local maxima of the mammogram are determined as the lesion candidates, and the adaptive wavelet transform is employed to generate subbands which permit the rank of these maxima in the subband mammogram using a higher order statistical test for lesion detection.
- the same initial detection is used for the algorithms compared in the experiments.
- the weights of the two peak SR noise calculated from the currently estimated pdfs are set to be 0.5.
- FIGS. 13 , 14 and 15 show the experimental results for the three ROIs cut from three representative mammograms, where the detected positive pixels are labeled with small dots.
- FIG. 13 shows original abnormal mammogram and the detection results (Abnormal mammogram type 1: homogeneous background with small number of isolated micro-calcifications).
- IMS IMS;
- H HOSLW;
- SR_IMS SR_IMS.
- FIG. 14 shows original abnormal mammogram and the detection results (Abnormal mammogram type 2: homogeneous background with large number of micro-calcifications (clusters)).
- SR_IMS SR_IMS.
- FIG. 15 shows original abnormal mammogram and the detection results (Abnormal mammogram type 3: inhomogeneous background with moderate number of micro-calcifications (clusters)).
- the advantage of the GADC is that it converges quickly, generally in no more than 8 iterations in these experiments, while IMS converge to local extrema.
- HOSLW method 13 ( h )
- HOSLW method 13 ( h )
- its detection performance depends on how accurately the number of lesion pixels can be estimated, which is generally not available or known in real-world cases.
- the GMM-based detector finds all the lesions but still does not avoid the high P F (see 2 ( i )), which is due to the inaccuracy when GMM is used to fit the mammogram data.
- the presented 2SR-GBAD-M and SR_IMS algorithms yield good detection results in terms of lesion localization, lesion contour exploration and P F reduction (see 13 ( f ) and 13 ( j )), which demonstrates the capability of the SR noise-based method for enhancing the detectors with model mismatch and parameter suboptimality. Comparing 13 ( f ) and 13 ( j ), it can be seen that SR_IMS performs a little better than 2SR-GBAD-M in reducing false alarms and determining lesion boundaries.
- FIG. 14 shows a more complex case, where both isolated micro-calcifications and crowded clusters exist and the number of lesions is large. It can be seen that still the 2SR-GBAD-M and SR_IMS algorithms yield better detections with clearer lesion contours and less false positives (see 14 ( f ) and 14 ( j )). Compared with GBAD and GGD in 14 ( b ) and 14 ( c ), GGD_ID and GADC method shown in 14 ( d ) and 14 ( e ) perform better but still with high P F 's. IMS fails to find some lesions (see 14 ( g )).
- HOSLW ( 14 ( h )) does not provide much useful information about the lesion positions in this crowded micro-calcifications (clusters) case. This is because its detection operation is performed in subband images which have a quarter of the size of the original mammogram, so the area of the detected positives will be four times of those in the subband images when the detection result is shown in the original mammogram. When the micro-calcifications (clusters) are close to each other, their boundaries and locations are hard to determine. GMM performs better than the rest of the methods (except for 14 ( f ) and 14 ( j )), but still generates many false alarms.
- FIG. 15 is the most complex case, where the background distribution is inhomogeneous and some background pixels have their intensities approaching the lesion pixels. It is hard to model the background using just a univariate probability distribution. Finite mixture models may be a choice, but to determine the model type and parameters is also a challenging task. Also, their performance could be deteriorated by the non-stationary nature of the images. Therefore, model mismatch in this type of images is more serious and unavoidable. In this experiment, univariate Gaussian distribution is still used to model the pixel intensity distributions of the background and lesion, respectively, through which the model mismatch is simulated. From FIG.
- TP and FPI are employed as the metrics.
- the means of TP and FPI represent the average performance of each method, and their standard deviations are used as a measure of the robustness of each method when applied to different types of images.
- a better method is identified to be one with higher mean TP value but lower mean FPI value as well as lower TP and FPI standard deviations.
- HOLSW requires the knowledge of the number of lesions, which is generally not available in real-world applications, the lesion number is adjusted manually, such that the TPs of HOLSW and SR_IMS for each image are the same, and then FPI is employed as a criterion for their performance comparison.
- the detection performance of the detectors may be further improved if image enhancement techniques are employed before detection and post-processing methods, such as pattern classifiers embedded with other lesion features, are used after the detection procedure.
- Optimizing the SR noise-based technique with memory described herein will be very useful to further improve the efficiency and robustness of the SR noise-based detection enhancement scheme, by determining the optimum weights for two-peak SR noises.
- Extension of the SR noise-based technique to enhancing fixed multiple threshold detectors is also contemplated.
- the performance of SR enhanced variable detectors has been shown to be superior than the fixed ones, where both the SR noise and the critical function can be jointly designed to enhance detection. So SR noise-based detectors incorporating variable critical function are likely to be promising.
- the case where signal and background noise are all independently distributed is considered. Additional embodiments covering the correlated signal and noise case may further improve the detection performance.
- SR noise-enhanced scheme may also be useful in color images, which could be an excellent extension of embodiments of the present invention to more real world applications.
Abstract
Description
p y(y)=p x(x)*p n(x)=∫R
Where
C n,φ(x)≡∫R
where
F i,φ(x)≡∫R
corresponding to hypothesis Hi. Ei(•), En(•) are the expected values based on distributions pi and pn, respectively, and Px FA=F0,φ(0), Px D=F1,φ(0). To simplify notation, subscript φ of F and C may be omitted and denotes as F1, F0, and Cn, respectively. Further, F1(x0) and F0(x0) are actually the probability of detection and probability of false alarm, respectively, for this detection scheme with input y=x+x0. For example, F1(−2) is the PD of this detection scheme with input x−2. Therefore, it is very convenient to obtain the F1 and F0 values by analytical computation if p0, p1 and φ are known. When they are not available, F1 and F0 can be obtained from the data itself by processing it through the detector and recording the detection performance. The optimal SR noise definition may be formalized as follows.
where
-
- 1) pn(x)≧0, x∈RN.
- 2) ∫R
N pn(x)dx=1. - 3) ∫R
N F0(x)pn(x)dx≦F0(0).
hence
p n opt=δ(x+A)
which means the optimal SR noise n=−A is a dc signal with value −A. In practical applications, some additional restrictions on the noise may also be applied. For example, the type of noise may be restricted, (e.g., n may be specified as Gaussian noise), or we may require a noise with even symmetric pdf pn(x)=pn(−x) to ensure that the mean value of y is equal to the mean value of x. However, regardless of the additional restrictions, the conditions 1), 2), and 3) are always valid and the optimum noise pdf can be determined for these conditions.
f 1 =F 1(x)=F 1(F 0 −1(f 0)) (16)
-
- 4) pn,f
0 (f0)≧0 - 5) ∫pn,f
0 (f0)df0=1 - 6) ∫f0pn,f
0 (f0)df0≦PFA x
and
P D y=∫0 1 f 1 p n,f0 (f 0)df 0, (17)
where pn,f0 (•) is the SR noise pdf in the f0 domain.
- 4) pn,f
P D y(p n)=∫0 1 J(f 0)p n,f
Therefore, the optimum PD y is attained when f1(f0)=J(f0) and PD,opt y=En(J).
Thus, detection performance can be improved via the addition of SR noise.
The third inequality of the Right Hand Side (RHS) of (19) is obtained using the concavity of the Ψ function. The detection performance cannot be improved via the addition of SR noise.
p n opt(n)=λδ(n−n 1)+(1−λ)δ(n−n 2) (20)
where 0≦λ≦1. In other words, to obtain the maximum achievable detection performance given the false alarm constraints, the optimum noise is a randomization of two discrete vectors added with the probability λ and 1−λ, respectively.
can be obtained by setting the SR noise pdf such that
V⊂W. It can also be shown that W⊂V. Otherwise, there would exist at least one element z such that z
S={(x,y)|∥(x,y)−z∥ 2 2<τ} and S∩V=‘{ }’
where ‘{ }’ denotes an empty set. However, since 0≦f1; f0≦1, by the well known property of integration, there always exists a finite set E with finite elements such that E⊂U and (x1; y1), a convex combination of the elements of E, such that
∥(x 1 ,y 1)−z∥ 2 2<τ
(P D,opt y ,P FA,opt y)=λ(f 11 ,f 01)+(1−λ)(f 12 ,f 02) (21)
where (f11; f01); (f12; f02)
p n,f
C n opt(x)=λφ(x+n 1)+(1−λ)φ(x+n 2) (24)
P D,opt y =λJ(f 01)+(1−λ)J(f 02) (25)
and
P FA,opt y =λf 01+(1−λ)f 02 ≦P FA x (26)
It follows that
p n opt(n)=δ(n−n 0) (27)
where F0(no)=to and F1(no)=F1M.
P FA,opt y =λf 01+(1−λ)f 02 =P FA x (28)
P D y=∫0 1 J(f 0)P n,f
and F1(n0)=F1M. Therefore the optimum detection performance is obtained when the noise is a DC signal with value n0 with PFA y=t0.
It is easy to verify that pn,fo(f0) is a valid pdf. Let y1=x+n1. We now have
G(f 0 ,k)=J(f 0)−kf 0, (29)
where k
p n,f
where IA(f0)=1 for f0
(33) is equivalent to (22).
P D,opt y =v+k 0 P FA x (37)
for i=0, 1, . . . , N−1, A>0 is a known dc signal, and w[i] are i.i.d noise samples with a symmetric Gaussian mixture noise pdf as follows
setting μ=3, A=1 and σ0=1. A suboptimal detector is considered with test statistic
respectively. The critical function is given by
where x=F0 −1(f0). Since
we have p′0(−x)|x=0 and
and, in this example, σ1 2=8.6562>σ0 2=1. From
the improvability cannot be determined by
given 2μ−A/2>3σ0. Thus, the roots n1; n2 of equation (49) can be approximately expressed as n1=−μ−A/2 and n2=μ−A/2.
p s(x)=p s(−x). (52)
C s(x 1)≧C s(x 0) for any x 1 ≧x 0, (54) and
C s(0)=½, C s(−∞)=0, and C s(∞)=2 (55)
where H(x)≡p1(x)−p1(−x).
and σ2 opt=σ2 2−σ2 0=7.6562, and correspondingly, PD,opt y
| SR Noise | Pn opt | Ps opt | Pu opt | Pg opt | No SR Noise | ||
| PD y | .6915 | .6707 | .6011 | .5807 | .5115 | ||
(iii) J(f02(k0))−J(f01(k0)=k0(f02(k0)−f01(k0)); and determining the probability of occurrence for n1 and n2 as λ and 1−λ, respectively, using the equation
where G(f0, k)=J(f0)−kf0=kf0=PD−kPFA. The single delta function located at n0 is calculated from n0=F0 −1(f0), where f0 is the value the maximizes
(iii) Ĵ({circumflex over (f)}02(k0))−Ĵ({circumflex over (f)}01(k0)=k0({circumflex over (f)}02(k0)−{circumflex over (f)}01(k0)); and determining the probability of occurrence for n1 and n2 as λ and 1−λ, respectively, using the equation
where for any f0, the equation x=F0 −1(f0) is solved, and the value of f1 is obtained by
f(λx+(1−λ)y)≦λf(x)+(1−λ)f(y) (64)
for all x, y∈I and λ in the open interval (0,1). It is called strictly convex provided that the inequality (64) is strict for x≠y. Similarly, if −f: I→R is convex, then we say that f: I→R is concave.
H 0 : y[m]=ω[m]
H 1 : y[m]=s[m]+ω[m] (1)
where m is the pixel index corresponding to the pixel observation under consideration, y[m] is the observed pixel intensity, larger than or equal to zero, s[m] is the lesion signal, and w[m] is the background noise that is assumed to obey Gaussian distribution with mean μb and variance σb 2. The noise is assumed to be additive, independently distributed and independent of the noise-free mammogram data. A processing window is employed with the pixel under consideration being at the center of the window. This window is employed to estimate the parameters of the detector by using the pixels included in it.
A. Gaussian Background Assumption-Based Detector (GBAD)
where
P F=∫{
where β is the desired value of the PF.
where y is the intensity of the pixel under consideration, and the threshold γ1 is determined from the desired PF and the statistical parameters, i.e., mean and variance, of the pixels in the processing window.
where the threshold γ2 is determined from the desired PF. The statistical parameters, namely the means and the variances, of the initially detected positive and negative pixels can be estimated using the processing window with the pixel under consideration at the center of the window.
- Step 1: Means and variances of the detected positive (lesion) and negative (background) pixels are calculated.
- Step 2: Detection is performed using the GGD (Eq. (5)) with the desired PF and the updated parameters, μs, μb, σs 2 and σb 2, calculated in
Step 1. If there are no differences in the detected positives and negatives between two successive detections, terminate the algorithm, else go toStep 1.
where
where T is the test statistic and a function of
where PD
where
where
corresponds to hypothesis Hi.
-
- Theorem 1: If J(PF
y )>PDy or J″(PFy )>0 when J(t) is second-order continuously differentiable around PFy , then there exists at least one noise processn with PDF pn (.) that can improve the detection performance, where J(t) is defined as the maximum value of f1 given f0, i.e., J(t)=sup(f1: f0=t). f0 and f1 are the given values of F0 and F1, respectively.
- Theorem 1: If J(PF
-
- Theorem 2: To maximize PD
z , under the constraint that PFz ≦PFy , the optimum noise can be expressed as pn opt(n )=λδ(n −n 1)+(1−λ)δ(n −n 2), where λ and 1−λ are the occurrence probabilities of the suitable N-dimensional vectorsn 1 andn 2, 0≦λ≦1.
- Theorem 2: To maximize PD
- Step 1: Mean μb and variance σb 2 of the background are estimated, based on the detected negative pixels. The detection threshold is updated based on the desired PF as well as μb and σb 2 using Eq. (3), where it is assumed that the background obeys Gaussian distribution (see GBAD in Example 1A).
- Step 2: The pixels are detected with the updated threshold found in
Step 1. The resulting detected positive and negative pixels are employed for estimating probability densities under the two hypotheses using the kernel density estimation method. - Step 3: The updated threshold in
Step 1 and the newly estimated probability densities inStep 2 are used to determine the SR noise with the method mentioned in Example 2. - Step 4: The mammogram data is modified by adding to the original pixel intensities the SR noise determined in
Step 3. - Step 5: Detection is performed with the detector updated in
Step 1 using the modified data fromStep 4. If the difference between two successive detection results is very small, terminate the algorithm else go toStep 1.
where
where wk is the weight or probability of occurrence of the kth two-peak SR noise, 0≦wk≦1 and
r is the number of the two-peak SR noises which in our current work equals the number of iterations already run plus 1 (i.e., the SR noise determined from the estimated probability mass function (PMF) and the updated threshold at current iteration is also included, where PMF is used as the specific form of the probability distribution for discrete digital mammogram data), and
p n
Of course, we can change the memory size by using different values of r, but in any case the latest r two-peak SR noises should be employed. When r=1, a single two-peak noise is used, and the scheme reduces to the scheme without memory.
where PMFlH
- Step 1: Probability density estimates are obtained under the two hypotheses using the detected positive (lesion) and negative (background) pixels. The detection threshold (or the classifier) is updated according to the estimated probability density information.
- Step 2: The pixels are classified (or detected) with the updated threshold or the classifier in
Step 1. The resulting detected positive and negative pixels are employed for estimating probability densities under the two hypotheses. - Step 3: The updated threshold or classifier in
Step 1 and the newly estimated probability densities inStep 2 are used to determine the SR noise with the method mentioned in Example 2. - Step 4: The mammogram data is modified by adding SR noise to the original pixel intensities.
- Step 5: Detection is performed with the detector or classifier updated in
Step 1 using the modified data fromStep 4. If the difference between two successive detection results is very small, terminate the algorithm else go toStep 1.
P 0 p 0(y*)=P 1 p 1(y*) (18)
where y* is the updated detection threshold during the current iteration. P0 and P1 are the a priori probabilities of the detected negatives and positives, which can be estimated by {circumflex over (P)}i=ni/n, where ni is the number of negatively detected pixels when i=0 and positively detected pixels when i=1, and n is the total number of pixels in the mammogram. This generates a suboptimal detector because the threshold is determined from the coarsely estimated a priori probabilities and PDFs by using the plug-in rule. Geoffrey Mclachlan and David Peel, Finite Mixture Models, A Wiley-Interscience Publication, 2, October, 2000.
where f(y) is the density of the observation y, and fi(y) are the component densities of the mixture. g is the number of components, which can be preset or automatically determined according to the data statistics. As discussed herein, we set g=2 to facilitate two-class clustering. Pi are the mixing proportions or weights, 0≦Pi≦1 (i=1, . . . , g) and
R(y)=i if {circumflex over (P)} i {circumflex over (f)} i(y)≧{circumflex over (P)} j {circumflex over (f)} j(y) (20)
for j=1, . . . , g, where R(y)=i denotes that the allocation rule R(y) assigns the observation y to the ith component of the mixture model. {circumflex over (P)}i and {circumflex over (f)}i(y) are the fitted values of Pi and fi(y), respectively.
| TABLE 2 |
| DETECTION PERFORMANCE OF FIVE ALGORITHMS |
| METHODS |
| RESULTS | GADC | IMS | 2SR-G | SR_I | HO |
| Range | [0.61, 1] | [0.58, 1] | [0.80, 1] | [0.81, 1] | [0.81, 1] | |
| TP | Mean | 0.89 | 0.90 | 0.93 | 0.94 | 0.94 |
| Standard | 0.25 | 0.28 | 0.12 | 0.11 | 0.11 | |
| deviation | ||||||
| Range | [0, 20] | [0, 17] | [0, 9] | [0, 7] | [0, 14] | |
| FPI | Mean | 8.16 | 7.89 | 4.91 | 3.12 | 5.22 |
| Standard | 6.18 | 7.08 | 3.94 | 2.95 | 4.82 | |
| deviation | ||||||
| 2SR-G: 2SR-GBAD-M; | ||||||
| SR_I: SR_IMS; | ||||||
| HO: HOLSW. | ||||||
Claims (14)
H 0 : y[m]=w[m]
H 1 : y[m]=s[m]+w[m]
p
Priority Applications (2)
| Application Number | Priority Date | Filing Date | Title |
|---|---|---|---|
| US12/710,143 US8214177B2 (en) | 2005-10-20 | 2010-02-22 | Optimized stochastic resonance signal detection method |
| US13/410,949 US9026404B2 (en) | 2005-10-20 | 2012-03-02 | Methods of improving detectors and classifiers using optimized stochastic resonance noise |
Applications Claiming Priority (3)
| Application Number | Priority Date | Filing Date | Title |
|---|---|---|---|
| US72850405P | 2005-10-20 | 2005-10-20 | |
| US11/551,473 US7668699B2 (en) | 2005-10-20 | 2006-10-20 | Optimized stochastic resonance method for signal detection and image processing |
| US12/710,143 US8214177B2 (en) | 2005-10-20 | 2010-02-22 | Optimized stochastic resonance signal detection method |
Related Parent Applications (1)
| Application Number | Title | Priority Date | Filing Date |
|---|---|---|---|
| US11/551,473 Continuation-In-Part US7668699B2 (en) | 2005-10-20 | 2006-10-20 | Optimized stochastic resonance method for signal detection and image processing |
Related Child Applications (1)
| Application Number | Title | Priority Date | Filing Date |
|---|---|---|---|
| US13/410,949 Continuation-In-Part US9026404B2 (en) | 2005-10-20 | 2012-03-02 | Methods of improving detectors and classifiers using optimized stochastic resonance noise |
Publications (2)
| Publication Number | Publication Date |
|---|---|
| US20100169051A1 US20100169051A1 (en) | 2010-07-01 |
| US8214177B2 true US8214177B2 (en) | 2012-07-03 |
Family
ID=42285961
Family Applications (1)
| Application Number | Title | Priority Date | Filing Date |
|---|---|---|---|
| US12/710,143 Active US8214177B2 (en) | 2005-10-20 | 2010-02-22 | Optimized stochastic resonance signal detection method |
Country Status (1)
| Country | Link |
|---|---|
| US (1) | US8214177B2 (en) |
Cited By (2)
| Publication number | Priority date | Publication date | Assignee | Title |
|---|---|---|---|---|
| US20160203589A1 (en) * | 2015-01-06 | 2016-07-14 | Mayo Foundation For Medical Education And Research | Enhancing the Detectability of Objects in Medical Images |
| CN107092582A (en) * | 2017-03-31 | 2017-08-25 | 江苏方天电力技术有限公司 | One kind is based on the posterior exceptional value on-line checking of residual error and method for evaluating confidence |
Families Citing this family (12)
| Publication number | Priority date | Publication date | Assignee | Title |
|---|---|---|---|---|
| EP1793243A1 (en) * | 2005-12-05 | 2007-06-06 | Leica Geosystems AG | Method for resolving a phase ambiguity |
| US8781672B2 (en) * | 2011-08-04 | 2014-07-15 | The United States Of America As Represented By The Secretary Of The Army | System and method for importance sampling based time-dependent reliability prediction |
| TWI573096B (en) * | 2013-12-31 | 2017-03-01 | 智原科技股份有限公司 | Method and apparatus for estimating image noise |
| WO2016085926A1 (en) * | 2014-11-25 | 2016-06-02 | Conocophillips Company | Bayesian updating method accounting for non-linearity between primary and secondary data |
| EP3091503A1 (en) * | 2015-05-05 | 2016-11-09 | BAE Systems PLC | Signal processing |
| CN104849701B (en) * | 2015-05-29 | 2017-06-27 | 桂林电子科技大学 | A kind of clutter suppression method of vehicle anti-collision radar system |
| JP6669397B2 (en) * | 2016-03-31 | 2020-03-18 | キヤノン株式会社 | Signal extraction processing device and signal extraction processing method |
| JP7054787B2 (en) * | 2016-12-22 | 2022-04-15 | パナソニックIpマネジメント株式会社 | Control methods, information terminals, and programs |
| CN110212976B (en) * | 2019-06-06 | 2020-11-10 | 苏州大学 | Optical signal-to-noise ratio monitoring method based on artificial neural network |
| CN110572344B (en) * | 2019-09-10 | 2021-06-11 | 西北工业大学 | Demodulation method for deep sea vertical underwater acoustic communication |
| CN111220386B (en) * | 2019-11-18 | 2022-06-21 | 南通大学 | Bearing fault early diagnosis method based on self-adaptive frequency shift variable-scale resonance technology |
| CN111797231B (en) * | 2020-06-11 | 2021-08-20 | 南京擎盾信息科技有限公司 | Three-level theory-based legal reasoning proposition representation method, legal event reasoning method and electronic equipment |
Citations (5)
| Publication number | Priority date | Publication date | Assignee | Title |
|---|---|---|---|---|
| US6137898A (en) * | 1997-08-28 | 2000-10-24 | Qualia Computing, Inc. | Gabor filtering for improved microcalcification detection in digital mammograms |
| US20020181797A1 (en) * | 2001-04-02 | 2002-12-05 | Eastman Kodak Company | Method for improving breast cancer diagnosis using mountain-view and contrast-enhancement presentation of mammography |
| US20060020452A1 (en) | 2004-07-26 | 2006-01-26 | Yoshiharu Yamamoto | Noise generation apparatus |
| US20060052828A1 (en) * | 2004-09-08 | 2006-03-09 | Kim Daniel H | Methods for stimulating a nerve root ganglion |
| US20060074558A1 (en) | 2003-11-26 | 2006-04-06 | Williamson Walton R | Fault-tolerant system, apparatus and method |
-
2010
- 2010-02-22 US US12/710,143 patent/US8214177B2/en active Active
Patent Citations (5)
| Publication number | Priority date | Publication date | Assignee | Title |
|---|---|---|---|---|
| US6137898A (en) * | 1997-08-28 | 2000-10-24 | Qualia Computing, Inc. | Gabor filtering for improved microcalcification detection in digital mammograms |
| US20020181797A1 (en) * | 2001-04-02 | 2002-12-05 | Eastman Kodak Company | Method for improving breast cancer diagnosis using mountain-view and contrast-enhancement presentation of mammography |
| US20060074558A1 (en) | 2003-11-26 | 2006-04-06 | Williamson Walton R | Fault-tolerant system, apparatus and method |
| US20060020452A1 (en) | 2004-07-26 | 2006-01-26 | Yoshiharu Yamamoto | Noise generation apparatus |
| US20060052828A1 (en) * | 2004-09-08 | 2006-03-09 | Kim Daniel H | Methods for stimulating a nerve root ganglion |
Non-Patent Citations (40)
| Title |
|---|
| Astley, et al., "Automation in mammography: Computer vision and human perception," Int. J. Pattern Recognition Artificial Intell., vol. 7, No. 6, pp. 1313-1338, 1993. |
| Available: http://marathon.csee.usf.edu/Mammography/Database.html. |
| Available: http://peipa.essex.ac.uk/info/mias.html. |
| Banerje et al., "Tumor detection in digital mammograms," in Proc. International Conference on Image Processing (ICIP '00), vol. 3, pp. 432-435, Vancouver, BC, Canada 2000. |
| Bazzani et al., "Automatic detection of clustered micro-calcifications in digital mammograms using an SVM classifier," in Proc. of European Symposium on Artificial Neural Networks Plastics, Bruges, Apr. 26-28, 2000. |
| Benzi, et al., "The mechanism of stochastic resonance," Journal of Physics A: Mathematical and General, vol. 14, pp. L453-L457, 1981. |
| Bezrukov, et al, "Stochastic resonance in non-dynamical systems without response thresholds," Nature, vol. 385, pp. 319-321, Jan. 1997. |
| Catanzariti, et al. "A CAD system for the detection of mammographyc micro-calcifications based on Gabor Transform," in Proc. Nuclear Science Symposium Conference Record, vol. 6, pp. 3599-3603, Oct. 16-22, 2004. |
| Chan, et al., "Improvement in radiologist's detection of clustered micro-calcifications on mammograms," Investigative Radiol. vol. 25, pp. 1102-1110, 1990. |
| Chen, et al., "Theory of the stochastic resonance effect in signal detection: Part 1-fixed detectors," IEEE Transaction on Signal Processing, vol. 55, No. 7, pp. 3172-3184, Jul. 2007. |
| Chen, et al., "Theory of the stochastic resonance effect in signal detection: Part II-variable detectors," to appear in IEEE Transaction on Signal Processing, 2008. |
| De La Rosa et al., "Boostrap Methods for a Measurement Estimation Problem," IEEE Trans. Instrumentation and Measurement, vol. 55, No. 3, pp. 820-827, Jun. 2006. |
| Deepa et al., "Fractal modeling of mammograms based on mean and variance for the detection of micro-calcifications," In Proc. International Conference on Computational Intelligence and Multimedia Applications, vol. 2, pp. 334-348, Dec. 13-15, 2007. |
| Devijver, et al., Pattern Recognition: A Statistical Approach, Prentice Hall, Englewood Cliffs, London, 1982. |
| Diyana, et al., "A comparison of clustered micro-calcifications automated detection methods in digital mammogram," in Proc. International Conference on Acoustics, Speech, and Signal Processing (ICASSP), vol. 2, pp. 11-385-8 Apr. 6-10, 2003. |
| Efron et al., An Introduction to the Bootstrap, Chapman & Hall, 1993. |
| Fukunaga, Kinosuke, Introduction to Statistical Pattern Recognition (second edition), Academic Press, Sep. 1990. |
| Gammaitoni, et al., "Stochastic resonance," Rev. Mod. Phys. vol. 70, No. 1, pp. 223-287, Jan. 1998. |
| Gurcan et al., "2-D adaptive prediction based Gaussianity tests in micro-calcification detection," Proceedings of SPIE, Visual Communications and Image Processing, vol. 3309, 1997. |
| Gurcan, et al., "Influence function based gaussianity tests for detection of micro-calcifications in mammogram images," In Proc. International Conference on Image Processing (ICIP), vol. 3, pp. 407-411, 1999. |
| Kai-Yang Li, et al., "A novel method of detecting calcifications from mammogram images based on wavelet and sobel detector," in Proc. 2006 IEEE International Conference on Mechatronics and Automation, pp. 1503-1508, Jun. 2006. |
| Karssemeijer, "Adaptive noise equalization and recognition of micro-calcification clusters in mammograms," Int. J. Pattern Recognit. Artificial Intell., vol. 7, No. 6, pp. 1357-1376, 1993. |
| Kay et al., "Reducing probability of error using stochastic resonance," IEEE Signal Processing Letters, vol. 13, No. 11, pp. 695-298, Nov. 2006. |
| Kay, Steven M., Fundamentals of Statistical Signal Processing-Detection Theory, Prentice Hall PTR (1998). |
| Kay, Steven, "Can Detectability Be Improved by Adding Noise?" IEEE Signal Processing Letters, vol. 7, No. 1, pp. 8-10, Jan. 2000. |
| Kittler, et al., "Minimum error thresholds," Pattern Recognition, vol. 19., No. 1, pp. 41-47, 1986. |
| Kolata, Gina, "Study questions computerized breast cancer detection," The New York Times National, Thur., Apr. 5, 2007. |
| Lemaur, et al., Highly regular wavelets for the detection of clustered micro-calcifications in mammograms, IEEE Trans. on Medical Imaging, vol. 22, No. 3, Mar. 2003. |
| Lin et al., "Two-dimensional LMS adaptive filter incorporating a local-mean estimator for image processing," IEEE Trans. on Circuits and Systems-11: Analog and digital signal processing, vol. 40, No. 1, Jul. 1993. |
| Loerincz et al, "A stochastic resonator is able to greatly improve signal-to-noise ratio," Physics Letters A, vol. 224, pp. 63-67, 1996. |
| Nakayaman, et al. "Computer-aided diagnosis scheme using a filter bank for detection of micro-calcification clusters in mammograms," IEEE Trans. on Biomedical Engineering, vol. 53, No. 2, pp. 273-283, Feb. 2006. |
| Nikias et al., Signal Processing with Alpha-Stable Distributions and Applications, John Wiley and Sons, Inc. 1995. |
| Poor, H. Vincent, An Introduction to Signal Detection and Estimation (second edition) Springer, 1994. |
| Rank, et al., "Estimation of image noise variance," IEE Proc.-Vis. Image Signal Process, vol. 146 No. 2, Apr. 1999. |
| Regentova, et al., "Detecting micro-calcifications in digital mammograms using wavelet domain hidden markov tree model," in Proc. 28th Annual International Conference of the IEEE Engineering in Medicine and Biology Society 2006 (EMBS '06), pp. 1972-1975, Aug. 30-Sep. 3, 2006. |
| Sezgin, et al., "Survey over image thresholding techniques and quantitative performance evaluation," Journal of Electronic Imaging, 13(1), pp. 146-165, Jan. 2004. |
| Stein et al., "Anomaly detection from hyperspectral imagery," IEEE Signal Processing Magazine, vol. 19, pp. 58-69, Jan. 2002. |
| Strickland, et al., "Wavelet transform for detecting micro-calcifications in mammograms," IEEE Trans. Med. Imag., vol. 15, pp. 218-299, Apr. 1996. |
| Strickland, R.N. , "Wavelet transform methods for objects detection and recovery," IEEE Trans. Image Processing, vol. 6, pp. 724-735, May 1997. |
| Wei et al., "Relevance vector machine for automatic detection of clustered micro-calcifications," IEEE Trans. on Medical Imaging, vol. 24, No. 10, pp. 1278-1285, Oct. 2005. |
Cited By (4)
| Publication number | Priority date | Publication date | Assignee | Title |
|---|---|---|---|---|
| US20160203589A1 (en) * | 2015-01-06 | 2016-07-14 | Mayo Foundation For Medical Education And Research | Enhancing the Detectability of Objects in Medical Images |
| US10068318B2 (en) * | 2015-01-06 | 2018-09-04 | Mayo Foundation For Medical Education And Research | Enhancing the detectability of objects in medical images |
| CN107092582A (en) * | 2017-03-31 | 2017-08-25 | 江苏方天电力技术有限公司 | One kind is based on the posterior exceptional value on-line checking of residual error and method for evaluating confidence |
| CN107092582B (en) * | 2017-03-31 | 2021-04-27 | 江苏方天电力技术有限公司 | Online abnormal value detection and confidence evaluation method based on residual posterior |
Also Published As
| Publication number | Publication date |
|---|---|
| US20100169051A1 (en) | 2010-07-01 |
Similar Documents
| Publication | Publication Date | Title |
|---|---|---|
| US8214177B2 (en) | Optimized stochastic resonance signal detection method | |
| US9026404B2 (en) | Methods of improving detectors and classifiers using optimized stochastic resonance noise | |
| US10192099B2 (en) | Systems and methods for automated screening and prognosis of cancer from whole-slide biopsy images | |
| US10839510B2 (en) | Methods and systems for human tissue analysis using shearlet transforms | |
| Venmathi et al. | A review of medical image classification and evaluation methodology for breast cancer diagnosis with computer aided mammography | |
| Ahmmed et al. | Classification of tumors and it stages in brain MRI using support vector machine and artificial neural network | |
| Kumar et al. | An automatic computer-aided diagnosis system for liver tumours on computed tomography images | |
| Naz et al. | Image segmentation using fuzzy clustering: A survey | |
| Punithavathy et al. | Analysis of statistical texture features for automatic lung cancer detection in PET/CT images | |
| Reddy et al. | Enhanced speckle noise reduction in breast cancer ultrasound imagery using a hybrid deep learning model | |
| Jardim et al. | Image thresholding approaches for medical image segmentation-short literature review | |
| Saien et al. | A unified methodology based on sparse field level sets and boosting algorithms for false positives reduction in lung nodules detection | |
| Mohana et al. | Lung cancer detection using nearest neighbour classifier | |
| Ancy et al. | An efficient CAD for detection of tumour in mammograms using SVM | |
| Thiruvenkadam et al. | Fully automatic method for segmentation of brain tumor from multimodal magnetic resonance images using wavelet transformation and clustering technique | |
| Song et al. | An extension Gaussian mixture model for brain MRI segmentation | |
| Padma et al. | Performance comparison of texture feature analysis methods using PNN classifier for segmentation and classification of brain CT images | |
| Jena et al. | Feature extraction and classification techniques for the detection of lung cancer: a detailed survey | |
| Kumar et al. | Contourlet transform based computer-aided diagnosis system for liver tumors on computed tomography images | |
| Peng et al. | Noise-enhanced detection of micro-calcifications in digital mammograms | |
| Lukin et al. | Improved minimal inter-quantile distance method for blind estimation of noise variance in images | |
| Rajalakshmi et al. | Automated classification of brain MRI using color converted K-means clustering segmentation and application of different kernel functions with multi-class SVM | |
| Vyshnavi et al. | Breast Density Classification in Mammogram Images | |
| Theresa et al. | CAD for lung nodule detection in chest radiography using complex wavelet transform and shearlet transform features | |
| Sangeeta | Brain tumor detection and classification with feature extraction and reduction using DWT and PCA |
Legal Events
| Date | Code | Title | Description |
|---|---|---|---|
| AS | Assignment |
Owner name: SYRACUSE UNIVERSITY,NEW YORK Free format text: ASSIGNMENT OF ASSIGNORS INTEREST;ASSIGNORS:PENG, RENBIN;CHEN, HAO;VARSHNEY, PRAMOD K.;SIGNING DATES FROM 20100224 TO 20100226;REEL/FRAME:024077/0168 Owner name: SYRACUSE UNIVERSITY, NEW YORK Free format text: ASSIGNMENT OF ASSIGNORS INTEREST;ASSIGNORS:PENG, RENBIN;CHEN, HAO;VARSHNEY, PRAMOD K.;SIGNING DATES FROM 20100224 TO 20100226;REEL/FRAME:024077/0168 |
|
| STCF | Information on status: patent grant |
Free format text: PATENTED CASE |
|
| FPAY | Fee payment |
Year of fee payment: 4 |
|
| FEPP | Fee payment procedure |
Free format text: MAINTENANCE FEE REMINDER MAILED (ORIGINAL EVENT CODE: REM.); ENTITY STATUS OF PATENT OWNER: SMALL ENTITY |
|
| FEPP | Fee payment procedure |
Free format text: 7.5 YR SURCHARGE - LATE PMT W/IN 6 MO, SMALL ENTITY (ORIGINAL EVENT CODE: M2555); ENTITY STATUS OF PATENT OWNER: SMALL ENTITY |
|
| MAFP | Maintenance fee payment |
Free format text: PAYMENT OF MAINTENANCE FEE, 8TH YR, SMALL ENTITY (ORIGINAL EVENT CODE: M2552); ENTITY STATUS OF PATENT OWNER: SMALL ENTITY Year of fee payment: 8 |
|
| FEPP | Fee payment procedure |
Free format text: MAINTENANCE FEE REMINDER MAILED (ORIGINAL EVENT CODE: REM.); ENTITY STATUS OF PATENT OWNER: SMALL ENTITY |