US8332018B2 - Method and arrangement to predict at least one system event and a corresponding computer program and a corresponding machine-readable storage medium - Google Patents
Method and arrangement to predict at least one system event and a corresponding computer program and a corresponding machine-readable storage medium Download PDFInfo
- Publication number
- US8332018B2 US8332018B2 US12/757,350 US75735010A US8332018B2 US 8332018 B2 US8332018 B2 US 8332018B2 US 75735010 A US75735010 A US 75735010A US 8332018 B2 US8332018 B2 US 8332018B2
- Authority
- US
- United States
- Prior art keywords
- event
- trend
- time windows
- primary parameters
- determining
- Prior art date
- Legal status (The legal status is an assumption and is not a legal conclusion. Google has not performed a legal analysis and makes no representation as to the accuracy of the status listed.)
- Expired - Fee Related, expires
Links
Images


Classifications
-
- G—PHYSICS
- G16—INFORMATION AND COMMUNICATION TECHNOLOGY [ICT] SPECIALLY ADAPTED FOR SPECIFIC APPLICATION FIELDS
- G16H—HEALTHCARE INFORMATICS, i.e. INFORMATION AND COMMUNICATION TECHNOLOGY [ICT] SPECIALLY ADAPTED FOR THE HANDLING OR PROCESSING OF MEDICAL OR HEALTHCARE DATA
- G16H50/00—ICT specially adapted for medical diagnosis, medical simulation or medical data mining; ICT specially adapted for detecting, monitoring or modelling epidemics or pandemics
- G16H50/20—ICT specially adapted for medical diagnosis, medical simulation or medical data mining; ICT specially adapted for detecting, monitoring or modelling epidemics or pandemics for computer-aided diagnosis, e.g. based on medical expert systems
-
- G—PHYSICS
- G16—INFORMATION AND COMMUNICATION TECHNOLOGY [ICT] SPECIALLY ADAPTED FOR SPECIFIC APPLICATION FIELDS
- G16H—HEALTHCARE INFORMATICS, i.e. INFORMATION AND COMMUNICATION TECHNOLOGY [ICT] SPECIALLY ADAPTED FOR THE HANDLING OR PROCESSING OF MEDICAL OR HEALTHCARE DATA
- G16H40/00—ICT specially adapted for the management or administration of healthcare resources or facilities; ICT specially adapted for the management or operation of medical equipment or devices
- G16H40/60—ICT specially adapted for the management or administration of healthcare resources or facilities; ICT specially adapted for the management or operation of medical equipment or devices for the operation of medical equipment or devices
- G16H40/67—ICT specially adapted for the management or administration of healthcare resources or facilities; ICT specially adapted for the management or operation of medical equipment or devices for the operation of medical equipment or devices for remote operation
Definitions
- the present invention is directed towards predicting system events in complex systems.
- the object of the invention is a method and arrangement to predict at least one system event and a corresponding computer program and a corresponding machine-readable storage medium, where the event is predictable because of trends in observables over a certain period of time before the occurrence of the events.
- the invention can be used in particular for patient-specific monitoring of patho-physiological changes.
- the method can be used both in linear and non-linear sequences as well as disjunctions in the observables.
- An event may be, for example, the failure of a system, because the abnormal behavior of a certain component is expressed in the irregularities of one or more observables or the early recognition or pre-acute prediction of a particular critical condition of a patient, for example.
- the systems themselves may also represent geophysical or abstract units such as population or economic systems in which the deviation from a defined normal condition is predicted.
- a method and system for the prediction of system events that captures measured values s j of at least one primary parameter S j within at least one time window.
- the length of the time windows can be preset L ⁇ N within a range of a minimum length L min ⁇ N to a maximum length L max ⁇ N, and begin at presettable times H ⁇ N.
- the variable H describes the delay time between the time of the prediction and the occurrence of the predicted event, e.g., the time until the actual or expected occurrence of the upcoming system event, and runs from H min ⁇ N to H max ⁇ N. For at least one part of such time windows and for at least one part of the primary parameters S j , the probability of the existence of a trend is determined.
- a value is determined for the relevance (relevance value) of that window for prediction.
- at least the discriminatory power of the time window for the primary parameters S j will be determined.
- at least one feature will then be constructed, where the construction of at least one such feature will at least take into account part of the probabilities of a trend p j and the relevance values. Such probabilities may be taken into account in such a way that the probabilities of a trend p j are correlated with the relevance values through appropriate arithmetic operations.
- a weighting of the probabilities of a trend p j as a function of the relevance values and/or a summation of the (weighted) probabilities of a trend p j may be provided.
- the relevance value takes into account the discriminatory power of the time window for the primary parameter S j .
- the feature undergoes a classification method that yields an indicator for the occurrence or non-occurrence of a system event. As a function of that indicator, the system event is signaled and/or system-event-related measures are initiated.
- Embodiments of the invention use a multiple parameter set for which trend analysis is used to determine features for individual primary parameters S j , which then undergo a classification method. Each feature is based on at least one primary parameter S j .
- all probabilities of a trend p j are used for identification of areas with maximal discriminatory power. That is then used to derive all the relevant window lengths and positions. In such windows, it is preferable that all probabilities be combined (rather than only the probabilities above a certain threshold value). That combination then represents a feature for a classification method from which each primary parameter S j can then be formed in turn.
- a system's signal progression is checked for a certain form of variability within a limited period of time before an event that is to be detected, while the probability of existence of trends is calculated from time windows that begin a certain time before the time of prediction and have a given length. Those probabilities of selected time windows are combined. Such a combination should preferably be calculated for all measurands.
- a suitable synthesis of the combinations can then be made, if need be, and features can be constructed.
- the classification method used in that case will either be optimized with the help of data with known properties or else used on unfamiliar data and the result of the process will be analyzed with the aid of an automatically or manually determined decision boundary.
- an indicator is supplied by means of which it can be concluded that an event will (or will not) occur.
- Such an indicator signals an upcoming event.
- Such events may be a critical system event, for example.
- Such critical system events may be, but are not limited to, for example, arrhythmias, pulmonary embolisms, cerebro-vascular accident, myocardial infarction, angina pectoris, syncope, transient ischemic attack and/or acute peripheral arteriosclerotic disorders.
- Various courses of action may be deduced from the result, such as triggering an alarm that indicates the malfunctioning of a system or deviations from normal behavior, sets automated maintenance or substitution processes in motion, reports deterioration of an illness to the doctor or patient, initiates a supporting therapy, e.g., a shock or change of the pacing scheme (stimulation scheme) or permits the initiation of similar urgent measures, in order to avoid damage to the system, failure of the system or the death of the patient.
- a supporting therapy e.g., a shock or change of the pacing scheme (stimulation scheme) or permits the initiation of similar urgent measures, in order to avoid damage to the system, failure of the system or the death of the patient.
- the invention provides a method and system for the prediction of future system events.
- the predictions are then made on the basis of primary parameters that were captured within a limited time period before the time of prediction, while the primary parameters that characterize the system in a certain time period are used to form features that reflect the change of the system.
- the prediction time period may be limited before and after and does not necessarily have to begin at the time of prediction.
- At least one time window of length L is observed within the observation period.
- measured values s j of at least one primary parameters S j are captured.
- the measured values at the points of measurement of the primary parameters before the time of prediction are applied in chronological order.
- a combination of the probabilities of a trend is determined for at least one part of at least one primary parameter S j .
- Upward or downward trends may be considered together or separately.
- Embodiments of the invention therefore provide for signaling a system event and/or initiating one or more system-event-related measures based on the probabilities of a trend of time windows. That may be achieved, for example, by analyzing the combination of probabilities of a trend of time windows in a classification method and predicting at least one system event based on the classification.
- Such measures may involve system-stabilizing measures, for example, such as a change of medicines and/or other therapeutic support measures, automated maintenance and/or substitution processes.
- One advantageous embodiment provides for optimizing the classification method by using classified event data and/or control data.
- determination of a trend includes testing a hypothesis for the existence of a trend. It is preferable to perform the Mann trend test in that respect. Other trend test methods may be used, but the Mann test is more robust in coping with outliers than many other methods.
- the units of the time intervals may be seconds, minutes, hours, days, weeks, months or years, with the possibility of using various time intervals for the various primary parameters.
- the invention can be used, for example, to analyze heterogeneous signal progressions.
- the signal progressions may be linear or non-linear or contain disjunctions.
- a further advantage of the invention is that the method is robust in coping with data gaps.
- Examples of possible primary parameters include, but are not limited to:
- all primary parameters that include the patient's heart rate such as the heart rate over a predetermined time period, the heart rate during a specified phase of rest, the variability of the heart rate, and so on;
- biomedical primary parameters such as stimulation thresholds, electrode configurations, sensor amplifications or offset values
- One arrangement according to the invention has at least one chip and/or processor and is configured in such a way that a method for the prediction of at least one system event is feasible, where the method includes at the least the following steps:
- the chip and/or processor may include memory coupled to the chip and/or processor that has coding or software stored thereon for executing the method.
- a computer program for prediction of system events enables a data processing installation, after said program has been loaded into the memory of the data processing installation, to carry out a method for predicting at least one system event, where the method includes at least the following steps:
- the computer program according to the invention has a modular design, with individual modules installed on different data processing installations.
- Such computer programs might be downloadable, for example (for a fee or free of charge, freely accessible or password-protected), from a data or communication network.
- the computer programs made available in that manner can be made useable through a method in which a computer program is downloaded from an electronic data network, such as the Internet, to a data processing installation connected to a network.
- a machine-readable storage medium on which a program is stored that enables a data processing installation, after said program has been loaded into the memory of the data processing installation, to carry out a method for predicting at least one system event, where the method includes at least the following steps:
- a data processing installation is a computer device for running a computer program.
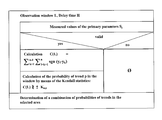
- FIG. 1 is a description of the parameters L min , L max , H min and H max ;
- FIG. 2A is a probability of a trend for an event patient as a function of L and H;
- FIG. 2B is a probability of a trend for a control patient as a function of L and H;
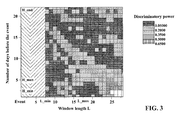
- FIG. 3 is a discriminatory power of a primary parameter for a group of patients
- FIG. 4 is an incoherent area of high discriminatory power with a primary parameter
- FIG. 5 is a Nassi-Shneiderman diagram for calculating the probabilities of a trend
- the incoming test signals s j of the measurand S j are filtered.
- the number of primary parameters is designated as N S (superscripted signs and numerals are indices, unless noted otherwise).
- a check is performed to determine, among other things, whether the values of the measurands lie within a valid range of values.
- the time sequence of the test signals generally depends on two parameters whose meaning is illustrated in FIG. 1 .
- the variable L ⁇ N represents an observation window between the lengths L min ⁇ N and L max ⁇ N, in the course of which the variability of a test signal is checked.
- the variable H ⁇ N describes the delay time between the time of the prediction and the occurrence of the predicted event, e.g., the time until the actual expected occurrence of the upcoming decompensation process and runs from H min ⁇ N to H max ⁇ N.
- a suitable criterion should then be used to check the validity of the window.
- One possibility would be, for example, to demand at least 50% valid test signal values, but the precise choice typically always depends on the problem at hand and/or the nature of the input signals.
- the trend tests that may be used for valid windows include, without being limited to, the Mann trend test, for example. In that case, for each window, the quantity
- K n,p is the p quantile of Kendall's K statistics.
- the trend result is calculated individually for each parameter-tuple (L, H).
- each probability of a trend p for various lengths L of the time windows and for various intervals H between the end of the time window and the event is shown in FIG. 2 by example for an event patient ( FIG. 2A ) and a control patient ( FIG. 2B ) for a primary parameter on the L ⁇ H level of the so-called observation plane.
- a positive or negative sign can used to show whether it is an upward or downward trend (+p or ⁇ p).
- L min and L max designated the minimal and maximal lengths of the time windows, H min and H max the minimal and maximal intervals between time of prediction and the event.
- the shape, length and size of those areas depend on the relevant primary parameter S j .
- the Fischer Score method may be used, among other methods.
- FIG. 3 shows the discriminatory power of the primary parameters from FIGS. 2A and 2B for a group of patients.
- the structure with the areas of high discriminatory power is clearly recognizable here.
- the quality of the separation between event patients and control patients is higher when special consideration is given to the time windows from the areas of high discriminatory power. They are taken into consideration by weighting the probabilities of a trend from FIG. 2 .
- Those weights may also be represented, among other ways, by a Fischer score function, i.e., by f(F(L,H)). Such weights may vary for different primary parameters.
- the weighted probabilities are combined, e.g., through summation.
- the area of high discriminatory power for a primary parameter S j is not necessarily coherent, as can be seen from FIG. 4 .
- FIG. 5 shows a Nassi-Shneiderman diagram for the general calculation of combinations of the probabilities of a trend.
- M ⁇ L , H ⁇ p ⁇ ( L , H ) ⁇ f ⁇ ( F ⁇ ( L , H ) ) and are therefore suitable for use as input values for classification methods ⁇ (M). It is sometimes an advantage to input k incoherent areas as features M in the classification. It is likewise sometimes advantageous to include upward and downward trends as special features in the classification. The same is also true of features formed from a combination of several primary parameters. Optimization Method:
- At least one feature M is determined.
- Features classified in that way are suitable for automated learning as a function of the number of event datasets and control datasets. In that respect, methods such as artificial neuronal networks, support vector machines, hidden Markov models and the like have proved effective. Due to the high number of sets of free parameters during the training process, a large number of classified features are needed during the training process.
- the result of that scalar multiplication is a value for the occurrence of an event.
- the initial value is set to a fixed value c Event Train or c Control Train that lies above or below the training threshold value c 0,Train .
- it is necessary to find a c 0,Class such that the method achieves a predetermined degree of specificity and/or sensitivity.
- discrete values e.g., ⁇ 1, 0, +1 or a finer grid
- a maximal interval between c event and c control can be achieved through systematic variation of the components of ⁇ right arrow over ( ⁇ ) ⁇ . That classification function in this example is in the form
- the classification method can be used to predict an event for the time period to H min to H max that lies in the future relative to the time of prediction.
- the above-defined features M can be used as input for a selected classification method ⁇ .
- a system can now be monitored over time, the method is applied anew each time a new measured value occurs or at larger intervals, in order to make a prediction about the system's deviations from the norm. If the result is greater or less than the threshold value determined in the course of the optimization method c 0,Class , then, depending on the threshold value, predetermined measures will be launched, such as a therapeutic chain of actions.
- the measured values of the measurands used to calculate the features are checked for validity. Certain individual measured values may either be discarded, e.g., because they are shown to be invalid by the validity check, e.g., because they fall outside a predetermined range of values, or they may be missing, because they are lost in some way on the transmission path.
- the method can deal with invalid and missing measured values in the following manner, for example:
- One example of an embodiment is an apparatus to predict so-called decompensation in patients who suffer from chronic/congestive heart failure (CHF).
- CHF chronic/congestive heart failure
- the invention is not limited to the field of medicine. Rather, it can also be used to predict events in other complex systems, such as meteorological or geophysical systems or even in economic systems. Such actions may permit an early action on a problem and resolve an issue at a much lower cost or may permit the early action to be much more effective or much more likely to be effective relative to taking similar actions after the predicted event actually occurs.
- CRT Cardiac Resynchronization Therapy
- an automatic defibrillator can also be implanted.
- home monitoring to achieve early recognition of impending decompensation would be desirable.
- the methodology explained here could also be used for applications unrelated to implants.
- the sensors could contain electrodes to record intracranial electrograms, to determine impedances, pressure and other measured values.
- the measured values could undergo optional intermediate processing or else lead directly to an analysis regarding the diagnosis of a patient.
- the process of achieving sound diagnostic statements is fraught with a number of difficulties, however.
- CHF The basic disease CHF describes a complex patho-physiological process with numerous underlying causes. Ischemic, non-ischemic, cardiomyopathic, toxic and idiopathic causes of CHF are distinguished, for example. Factors such as the patient's failure to take medications as directed or non-adherence to a diet, acute respiratory diseases, infections or other co-morbidities further complicate the description of CHF.
- the measured patient signals are heterogeneous prior to the occurrence of the events to be observed. That means that different signal behavior can be expected from different patients, and the course of two different decompensation events may turn out differently for one and the same patient. In both cases, gaps in the series of measurement may appear. The cause of such gaps may be that certain measured values were discarded following a validity check or that certain measured values were lost on the telemetry transmission path.
- the primary parameters may be selected, for example, from the following quantity:
Landscapes
- Engineering & Computer Science (AREA)
- Health & Medical Sciences (AREA)
- Biomedical Technology (AREA)
- Medical Informatics (AREA)
- Public Health (AREA)
- Epidemiology (AREA)
- Primary Health Care (AREA)
- General Health & Medical Sciences (AREA)
- Data Mining & Analysis (AREA)
- Pathology (AREA)
- Databases & Information Systems (AREA)
- Business, Economics & Management (AREA)
- General Business, Economics & Management (AREA)
- Measuring And Recording Apparatus For Diagnosis (AREA)
Abstract
Description
-
- Capture of measured values sj of at least one primary parameter Sj within at least one time window of a length that can be set in advance,
- for at least one part of the captured primary parameters Sj, determining the probability of a trend pj for a number of time windows that can be set in advance,
- for at least one part of the captured primary parameters Sj, determining a value for the relevance of the time window for the prediction of at least one system event,
- for at least one part of the captured primary parameters Sj and for at least one part of the time windows, constructing at least one feature M to describe the system through analysis of the probability of a trend pj and of the value for the relevance of the time window,
- classification of at least one feature M, and
- signaling of a system event and/or initiation of system-event-related measures according to the results of the classification.
-
- Capture of measured values sj of at least one primary parameter Sj within at least one time window of a length that can be set in advance,
- for at least one part of the captured primary parameters Sj, determining the probability of a trend pj for a number of time windows that can be set in advance,
- for at least one part of the captured primary parameters Sj, determining a value for the relevance of the time window for the prediction of at least one system event,
- for at least one part of the captured primary parameters Sj and for at least one part of the time windows, constructing at least one feature M to describe the system through analysis of the probability of a trend pj and of the value for the relevance of the time windows,
- Classification of at least one feature M and
- Signaling of a system event and/or initiation of system-event-related measures according to the results of the classification.
-
- Capture of measured values sj of at least one primary parameter Sj within at least one time window of a length that can be set in advance,
- for at least one part of the captured primary parameter Sj, determining the probability of a trend pj for a number of time windows that can be set in advance,
- for at least one part of the captured primary parameters Sj, determining a value for the relevance of the time window for the prediction of at least one system event,
- for at least one part of the captured primary parameters Sj and for at least one part of the time windows, constructing at least one feature M to describe the system through analysis of the probability of a trend pj and of the value for the relevance of the time windows,
- classification of at least one feature M, and
- signaling of a system event and/or initiation of system-event-related measures according to the results of the classification.
is calculated, where
describes the signum function.
C<−K n,p,
the hypothesis of a positive trend is confirmed, if
C>K n,p.
where Kn,p is the p quantile of Kendall's K statistics. The trend result is calculated individually for each parameter-tuple (L, H).
with the average of the whole (
and are therefore suitable for use as input values for classification methods Δ(M). It is sometimes an advantage to input k incoherent areas as features M in the classification. It is likewise sometimes advantageous to include upward and downward trends as special features in the classification. The same is also true of features formed from a combination of several primary parameters.
Optimization Method:
{right arrow over (M)}=(M 1 , M 2 , . . . , M q)
which then undergoes scalar multiplication with a classification vector
{right arrow over (α)}=(α1, α2, . . . , αq).
In general, there is no limitation in this example on a scalar threshold value, so that a hyperplane should be used in Rn as the decision boundary.
Application of the Method:
-
- In the case of the Mann trend test according to equation (1), such measured values are ignored by reducing the effective window length by the number of such measured values in such a case.
- Void and/or invalid measured values are replaced by corresponding values from an interpolation process.
- Probabilities p that cannot be calculated because of void and/or invalid measured values are replaced by a mean value (mean value of the range, mean value of the observation plane, mean value of the group, etc.).
- Another possibility of dealing with missing values is used.
-
- First of all, differences occur regarding which measured values reflect the changes. Thus, it may be the case that the first signs of decompensation appear in the mean heart rate while impedance changes do not appear until the actual decompensation has occurred, but in other cases just the opposite occurs.
- Secondly, the patient's reaction to an incipient decompensation depends on behavior to a certain extent. That means that certain measured values may increase in a certain group of patients but decrease in another group; for example, one group becomes more active due to nervousness, whereas another group becomes more withdrawn when anxious.
- Third, the time course of disease progression prior to decompensation will generally differ, depending on individual constitution, behavior or other factors. In particular, further unknown, immeasurable, uncontrollable and specific factors may appear in the basic population of CHF patients.
- Observation windows: Lmin=8, Lmax=28
- Delay time of the prediction: Hmin=1, Hmax=3, Hend=20
- Number of primary parameters: 8
- Weighting function:
- Number of features: q=10 (because of two primary parameters with two disjunctive areas)
- Required discriminatory powers: F0,1=F0,2= . . . =F0,10=0.5
-
- All measured values that include the patient's heart rate, such as the heart rate over a predetermined time period, the heart rate during a specified phase of rest, the variability of the heart rate, and so on.
- All measured values that determine impedances in the patient, whether through intracranial (bipolar and multipolar) or intrathoracic measurements or by determination using external sensors.
- All measured values that determine the patient's activity in any way.
- All measured values that receive as input the percentage of left- or right-ventricular events, whether stimulated, perceived or otherwise.
- All measured values that record implant-dependent signals.
- All measured values that determine extrasystoles, irrespective of their place of origin.
- All measured values that register a patient's hemodynamics or other compliance, pressures, volumes or intervals.
- All measured values that are determined outside an implanted electronic device, such as measured quantities that are acquired from radio-linked sensors, or measured quantities from devices that record data external to the body and communicate such data telemetrically to the evaluation unit.
- All biomedical measured values such as stimulation thresholds, electrode configurations, sensor amplifications or offset values.
- All measured values such as blood sugar levels, other biomarkers or similar quantities.
- All measured values that determine biometric information about the patient.
- All measured values that record additional information about medication.
- All measured values that are determined by electrophysiological or biochemical processes.
- All measured values that record signals from imaging, acoustic or mechanical processes.
- All of the aforementioned measured values that are normalized and/or scaled in advance.
- Possible combinations of several of the aforementioned measured values.
Claims (17)
Priority Applications (1)
| Application Number | Priority Date | Filing Date | Title |
|---|---|---|---|
| US12/757,350 US8332018B2 (en) | 2009-04-09 | 2010-04-09 | Method and arrangement to predict at least one system event and a corresponding computer program and a corresponding machine-readable storage medium |
Applications Claiming Priority (8)
| Application Number | Priority Date | Filing Date | Title |
|---|---|---|---|
| DE102009002307 | 2009-04-09 | ||
| DE102009002307.0 | 2009-04-09 | ||
| DE102009002307 | 2009-04-09 | ||
| US23201209P | 2009-08-07 | 2009-08-07 | |
| DE102010000103.1 | 2010-01-18 | ||
| DE102010000103 | 2010-01-18 | ||
| DE102010000103 | 2010-01-18 | ||
| US12/757,350 US8332018B2 (en) | 2009-04-09 | 2010-04-09 | Method and arrangement to predict at least one system event and a corresponding computer program and a corresponding machine-readable storage medium |
Publications (2)
| Publication Number | Publication Date |
|---|---|
| US20100262027A1 US20100262027A1 (en) | 2010-10-14 |
| US8332018B2 true US8332018B2 (en) | 2012-12-11 |
Family
ID=42145145
Family Applications (1)
| Application Number | Title | Priority Date | Filing Date |
|---|---|---|---|
| US12/757,350 Expired - Fee Related US8332018B2 (en) | 2009-04-09 | 2010-04-09 | Method and arrangement to predict at least one system event and a corresponding computer program and a corresponding machine-readable storage medium |
Country Status (2)
| Country | Link |
|---|---|
| US (1) | US8332018B2 (en) |
| EP (1) | EP2239676A1 (en) |
Cited By (1)
| Publication number | Priority date | Publication date | Assignee | Title |
|---|---|---|---|---|
| US20130116991A1 (en) * | 2011-11-08 | 2013-05-09 | International Business Machines Corporation | Time series data analysis method, system and computer program |
Families Citing this family (4)
| Publication number | Priority date | Publication date | Assignee | Title |
|---|---|---|---|---|
| US8661431B2 (en) * | 2012-01-03 | 2014-02-25 | International Business Machines Corporation | Accurately estimating install time |
| US10552746B2 (en) * | 2014-09-25 | 2020-02-04 | International Business Machines Corporation | Identification of time lagged indicators for events with a window period |
| CN109598364B (en) * | 2018-09-29 | 2022-10-28 | 创新先进技术有限公司 | Prediction method and device |
| CN117688505B (en) * | 2024-02-04 | 2024-04-19 | 河海大学 | Prediction method and system for vegetation large-range regional negative abnormality |
Citations (1)
| Publication number | Priority date | Publication date | Assignee | Title |
|---|---|---|---|---|
| US20080188763A1 (en) * | 2006-03-01 | 2008-08-07 | Michael Sasha John | System and methods for sliding-scale cardiac event detection |
Family Cites Families (2)
| Publication number | Priority date | Publication date | Assignee | Title |
|---|---|---|---|---|
| AU5900299A (en) * | 1998-08-24 | 2000-03-14 | Emory University | Method and apparatus for predicting the onset of seizures based on features derived from signals indicative of brain activity |
| US20060025931A1 (en) * | 2004-07-30 | 2006-02-02 | Richard Rosen | Method and apparatus for real time predictive modeling for chronically ill patients |
-
2010
- 2010-03-19 EP EP10157116A patent/EP2239676A1/en not_active Withdrawn
- 2010-04-09 US US12/757,350 patent/US8332018B2/en not_active Expired - Fee Related
Patent Citations (1)
| Publication number | Priority date | Publication date | Assignee | Title |
|---|---|---|---|---|
| US20080188763A1 (en) * | 2006-03-01 | 2008-08-07 | Michael Sasha John | System and methods for sliding-scale cardiac event detection |
Cited By (1)
| Publication number | Priority date | Publication date | Assignee | Title |
|---|---|---|---|---|
| US20130116991A1 (en) * | 2011-11-08 | 2013-05-09 | International Business Machines Corporation | Time series data analysis method, system and computer program |
Also Published As
| Publication number | Publication date |
|---|---|
| US20100262027A1 (en) | 2010-10-14 |
| EP2239676A1 (en) | 2010-10-13 |
Similar Documents
| Publication | Publication Date | Title |
|---|---|---|
| US9629548B2 (en) | Within-patient algorithm to predict heart failure decompensation | |
| KR20220005456A (en) | Visualization of Arrhythmia Detection by Machine Learning | |
| KR20220006080A (en) | Arrhythmia detection by feature description and machine learning | |
| US20180192894A1 (en) | Risk stratification based heart failure detection algorithm | |
| AU2007342523B2 (en) | Between-patient comparisons for risk stratification | |
| US9022930B2 (en) | Inter-relation between within-patient decompensation detection algorithm and between-patient stratifier to manage HF patients in a more efficient manner | |
| US20080162183A1 (en) | Method and system to enable physician labels on a remote server and use labels to verify and improve algorithm results | |
| EP1608434B1 (en) | Apparatus for gauging cardiac status using post premature heart rate turbulence | |
| US8332018B2 (en) | Method and arrangement to predict at least one system event and a corresponding computer program and a corresponding machine-readable storage medium | |
| US9538919B2 (en) | System and method for improved ischemia and acute myocardial infarction detection | |
| US8712518B2 (en) | Determining phase-specific parameters of a physiological variable | |
| US20220265219A1 (en) | Neural network based worsening heart failure detection | |
| EP2340084B1 (en) | Systems and methods for collecting patient event information | |
| US9183352B2 (en) | Method and arrangement for predicting at least one system event, corresponding computer program, and corresponding computer-readable storage medium | |
| CN116504398A (en) | Methods and systems for arrhythmia prediction using a transducer-based neural network | |
| CN116724361A (en) | Detection of patient health changes based on sleep activity | |
| EP2948217B1 (en) | Systems to identify cardiac dysynchrony | |
| EP4088652A1 (en) | Management of information from active implantable medical device | |
| US20230034970A1 (en) | Filter-based arrhythmia detection | |
| WO2023016736A1 (en) | Method for iegm-based monitoring of an electrode status of an implantable device | |
| WO2023089437A1 (en) | Networked system configured to improve accuracy of health event diagnosis | |
| CN114680857A (en) | Parameter determination method, parameter determination device, storage medium, and electronic apparatus | |
| CN117377432A (en) | Dynamic and modular cardiac event detection | |
| WO2024035530A1 (en) | Health event prediction using heartbeat intervals from electrocardiogram data | |
| CN116018086A (en) | Detection of patient health changes based on peak patient activity data and off-peak patient activity data |
Legal Events
| Date | Code | Title | Description |
|---|---|---|---|
| AS | Assignment |
Owner name: BIOTRONIK CRM PATENT AG, SWITZERLAND Free format text: ASSIGNMENT OF ASSIGNORS INTEREST;ASSIGNORS:EBERT, MANUEL;BAST, DANIEL;KRAEMER, THOMAS;AND OTHERS;REEL/FRAME:024428/0634 Effective date: 20100329 |
|
| STCF | Information on status: patent grant |
Free format text: PATENTED CASE |
|
| FPAY | Fee payment |
Year of fee payment: 4 |
|
| AS | Assignment |
Owner name: BIOTRONIK SE & CO. KG, GERMANY Free format text: ASSIGNMENT OF ASSIGNORS INTEREST;ASSIGNOR:BIOTRONIK CRM PATENT AG;REEL/FRAME:045995/0948 Effective date: 20170926 |
|
| FEPP | Fee payment procedure |
Free format text: MAINTENANCE FEE REMINDER MAILED (ORIGINAL EVENT CODE: REM.); ENTITY STATUS OF PATENT OWNER: LARGE ENTITY |
|
| LAPS | Lapse for failure to pay maintenance fees |
Free format text: PATENT EXPIRED FOR FAILURE TO PAY MAINTENANCE FEES (ORIGINAL EVENT CODE: EXP.); ENTITY STATUS OF PATENT OWNER: LARGE ENTITY |
|
| STCH | Information on status: patent discontinuation |
Free format text: PATENT EXPIRED DUE TO NONPAYMENT OF MAINTENANCE FEES UNDER 37 CFR 1.362 |
|
| FP | Lapsed due to failure to pay maintenance fee |
Effective date: 20201211 |