US8649855B2 - Burst suppression monitor for induced coma - Google Patents
Burst suppression monitor for induced coma Download PDFInfo
- Publication number
- US8649855B2 US8649855B2 US11/865,727 US86572707A US8649855B2 US 8649855 B2 US8649855 B2 US 8649855B2 US 86572707 A US86572707 A US 86572707A US 8649855 B2 US8649855 B2 US 8649855B2
- Authority
- US
- United States
- Prior art keywords
- burst
- suppression
- interval
- onset
- amplitude
- Prior art date
- Legal status (The legal status is an assumption and is not a legal conclusion. Google has not performed a legal analysis and makes no representation as to the accuracy of the status listed.)
- Expired - Fee Related, expires
Links
Images


Classifications
-
- A—HUMAN NECESSITIES
- A61—MEDICAL OR VETERINARY SCIENCE; HYGIENE
- A61B—DIAGNOSIS; SURGERY; IDENTIFICATION
- A61B5/00—Measuring for diagnostic purposes; Identification of persons
- A61B5/24—Detecting, measuring or recording bioelectric or biomagnetic signals of the body or parts thereof
- A61B5/316—Modalities, i.e. specific diagnostic methods
- A61B5/369—Electroencephalography [EEG]
-
- A—HUMAN NECESSITIES
- A61—MEDICAL OR VETERINARY SCIENCE; HYGIENE
- A61B—DIAGNOSIS; SURGERY; IDENTIFICATION
- A61B5/00—Measuring for diagnostic purposes; Identification of persons
- A61B5/48—Other medical applications
- A61B5/4821—Determining level or depth of anaesthesia
-
- A—HUMAN NECESSITIES
- A61—MEDICAL OR VETERINARY SCIENCE; HYGIENE
- A61B—DIAGNOSIS; SURGERY; IDENTIFICATION
- A61B5/00—Measuring for diagnostic purposes; Identification of persons
- A61B5/24—Detecting, measuring or recording bioelectric or biomagnetic signals of the body or parts thereof
- A61B5/316—Modalities, i.e. specific diagnostic methods
-
- A—HUMAN NECESSITIES
- A61—MEDICAL OR VETERINARY SCIENCE; HYGIENE
- A61B—DIAGNOSIS; SURGERY; IDENTIFICATION
- A61B5/00—Measuring for diagnostic purposes; Identification of persons
- A61B5/48—Other medical applications
- A61B5/4836—Diagnosis combined with treatment in closed-loop systems or methods
- A61B5/4839—Diagnosis combined with treatment in closed-loop systems or methods combined with drug delivery
-
- A—HUMAN NECESSITIES
- A61—MEDICAL OR VETERINARY SCIENCE; HYGIENE
- A61B—DIAGNOSIS; SURGERY; IDENTIFICATION
- A61B5/00—Measuring for diagnostic purposes; Identification of persons
- A61B5/72—Signal processing specially adapted for physiological signals or for diagnostic purposes
- A61B5/7235—Details of waveform analysis
- A61B5/7264—Classification of physiological signals or data, e.g. using neural networks, statistical classifiers, expert systems or fuzzy systems
Definitions
- the present invention relates to methods and/or systems and/or apparatuses for analysis of electroencephalogram (EEG) or related data sets and presenting clinically relevant information or taking actions based on the analysis.
- EEG electroencephalogram
- the invention involves methods for monitoring and/or maintaining subjects in an induced coma state. In other embodiments, the invention involves methods for determining a burst interval in a clinically relevant setting, whether artificially induced or otherwise occurring. In other embodiments, the invention involves a system and/or method that can be used in clinical or research settings to maintain a subject at a desired state of sedation by analysis of a digital data signal representing one or more EEG signals. In further embodiments, the invention provides a device that presents a user with a measure of burst suppression that is simple to understand and does not require interpretation of EEG data.
- FIG. 1 is a portion of an example of EEG signal from 12 lead pairs organized by a conventional montage showing a characteristic burst suppression pattern.
- FIG. 2 is a portion of an example of EEG signal from 12 lead pairs organized by a conventional montage showing a characteristic burst suppression pattern.
- FIG. 3 is a flow chart illustrating a method of adjusting a patient's or subject's sedation according to specific embodiments of the invention.
- FIG. 4A-D illustrate in simple block diagram an example display according to specific embodiments of the present invention wherein the only data displayed is a value indicating the mean interburst interval with this value displayed in black text (A) when the statistical confidence level is above a threshold and in a different text (e.g., grey, a different color, flashing, etc.) text (B) when statistical confidence level is below a designated threshold.
- A black text
- B text
- C and D likewise show displays indicating the mean burst per minute value.
- FIG. 5 illustrates an alternative example display according to the invention wherein a number of optional values in addition to mean calculation may be displayed.
- FIG. 6A-D provide an example flow chart of a user interface operation according to specific embodiments of the invention.
- FIG. 7A-G illustrate example graphical user interfaces showing an initial menu screen and other user data input screens as may be displayed on special purpose or general purpose persona computers, tablet computers, or information laboratory equipment according to specific embodiments of the invention.
- FIG. 8 illustrates an example graphical user interface showing a novel display generated as a single curve from a monitoring of a live subject plotting a dosage of a anesthetic agent on the horizontal axis and a response in terms of an inter-burst interval or the vertical axis according to specific embodiments of the invention with individual points clustered at the center (and indicated in green, for example) indicating appropriate suppression and outlining points (for example colored red) at the top and bottom of the graph indicating over or under sedation.
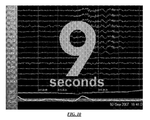
- FIG. 9 illustrates as an example illustrating that using a computer to monitor burst interval according to specific embodiments of the invention is advantageous: to the right is shown an example dose/response curve which, as is typically the case, indicates that near the desired dose range, the response varies widely depending on the dose; to the right is show a peak curve with a steep fall-off on either side indicating that the desired interburst interval (e.g., about 10 seconds) is quickly deviated from when the dosage changes from optimum.
- the present invention provides a more effective means for managing the dose/response relationship.
- FIG. 10 illustrates an example graphical user display according to specific embodiments of the present invention wherein the most prominent data displayed is a value indicating the mean interburst interval, for example in a color or with flashing indicating if a desired confidence interval has been achieved; optional additional data according to various embodiments of the invention include an BS history graph (in this case for 12 previous hours) showing an initial period when not enough data has been gathered to determine a BI with the desired confidence, a green indication then the BI is in the desired range and is calculated with the desired confidence, a red jagged period near the center of the graph indicating a period when the confidence interval falls out of a desired threshold; an ICP history is also provided, along with a bar indicating a range of target ICP and wherein exceeding the targeted ICP corresponds to the exceeding of confidence for the BI calculation.
- BS history graph in this case for 12 previous hours
- FIG. 11 illustrates an example graphical user display according to specific embodiments of the present invention wherein, in addition to other data displayed, the display includes an indication of detected seizure events that persist on the screen for a period of time or optionally until cleared by a staff person according to specific embodiments of the invention
- a heavy (e.g., red) bar is displayed at the bottom of the screen to indicate that a detected seizure event is taking place.
- This data can optionally be displayed along with some or all of the data shown in FIG. 10 /
- FIG. 12 illustrates an example graphical user interface allowing for input of titration values either for titration display calculation or optionally for automatic titration control according to specific embodiments of the invention.
- FIG. 13 is a block diagram showing a representative example logic device in which various aspects of the present invention may be embodied.
- Burst-suppression is an electroencephalographic (EEG) pattern typically described in the relevant literature as characterized by alternating segments of high amplitude burst followed by relative suppression of EEG activity. This pattern is observed in a number of clinical or research situations and is observed in human as well as in animal subjects.
- EEG allows sensitive, accurate, and constant monitoring of a patient's electrophysiology and depth of consciousness (Rampil, 1998), which is significant, but the amount of information generally provided makes it difficult for human review, particularly in clinical settings, such as a hospital.
- Automated computerized analysis of EEG has been a long felt need of neuroscientists and physicians. This problem is especially serious for EEG Burst-Suppression treatment where a patient may be monitored for days at a time and where improper levels of sedation may hinder recovery.
- EEG burst suppression was first observed in animals and much current understanding comes from an animal model (Akrawi et al., 1996). In humans, non-induced BS is associated with epileptic encephalopathy in infancy or childhood, severe anoxia, and rare cerebral tumors which undercut the cortex and produce regional BS.
- IFSECN The International Federation of Societies for Electroencephalography and Clinical Neurophysiology (IFSECN) defines burst suppression as a “pattern characterized by theta and/or delta waves at times intermixed with faster waves, and intervening periods of relative quiescence” (Chatrian et al., 1974). However, this definition fails to capture the nature of neuropharmacologically-induced BS clearly. Neuropharmacologically-induced BS is generally characterized as primarily consisting of spikes or grouped spikes with usually one spike of immense amplitude.
- patients with convulsive status epilepticus or with high intracranial pressure (ICP) are often put into an induced BS coma by administering hypnotics or other anesthetics in order to achieve sufficient sedation to help resolve a clinical problem.
- the depth of anesthesia is often assessed by monitoring an interburst interval on an EEG trace, although other EEG parameters have also proven to be of clinical value including BS rate and dominant frequency of the burst.
- EEG bursts are best characterized as rapid voltage change followed by modest voltage change (i.e., suppression) instead of activity and inactivity cycles. Conceiving bursts as states of high amplitude instead of states of high variability have led some researchers to analyze absolute amplitude instead of amplitude differences. Similarly, the use of Fourier analysis is common, but this approach involves prerequisites that may be unsuited for accurate timing of burst-suppression boundaries.
- a classification scheme independent of the agent used to induce the coma is obviously preferred, but these attempts determined that isoflurane, thiopental, etomidate, and propofol all differ significantly from each other, except etomidate from propofol, in burst duration, maximum peak-to-peak voltage, and area under the curve (Akrawi et al., 1996).
- Most techniques use a single bipolar site-pair for measuring the EEG signal, often frontal pole to central strip (e.g., Sarkela et al., 2002; Bruhn et al., 2000; Leistritz et al., 1999), as well as sliding data windows.
- the rate of slide also called window saturation, directly limits the accuracy of any classification scheme.
- Sarkela et al (2002) utilized 1 second data windows that slid 100 ms, which results in a boundary detection error of +/ ⁇ 50 ms.
- researchers who use only tiled windows (minimal contiguous saturation) are further disadvantaged (e.g., Bruhn et al., 2000).
- the BSR (burst suppression rate) detector in the Bispectral Index (BIS) monitor appears to rely on a time domain threshold detection scheme smoothed for 60 seconds and bolstered by a slow wave filter ( ⁇ 1 Hz) in order to identify bursts (Rampil, 1998).
- Bispectral Index the most well known BS detection system
- Sarkela et al. (2002) developed an automatic segmentation and classification technique based on EEG spectral characteristics with an error rate of 7%, comparable to the sensitivity and specificity of Liestritz et al. (1999).
- Lipping et al. (1995) reported a 2% error rate but their data contained very little artifact and was poor in detecting actual artifact, making it impractical as a real-world application.
- the present invention utilizes a novel characterization of burst-suppression activity as one of voltage variability rather than primarily voltage amplitude.
- Methodological considerations also improve boundary detection (i.e., burst offset, burst onset) by avoiding spectral analysis and utilizing time-domain analysis with maximal window saturation.
- boundary detection i.e., burst offset, burst onset
- time-domain analysis with maximal window saturation.
- maximal window saturation e.g., a data window begun at every digitized sample
- artifacts management can also be improved by relying on multiple electrode positions using common mode rejection of electrical artifacts.
- the present invention involves an automatic computer-aided burst detection algorithm to relieve hospital or other staff of the task of estimating burst suppression intervals and to improve patient care by providing information enabling more appropriate titration of sedatives.
- a method or system of the invention provides a display of a more accurate interburst interval mean along with statistical confidence of this mean.
- burst suppression interval also referred to as interburst interval
- computation of the burst suppression interval involves identification of burst from suppression. Such identification is attained by timing the presence of bursts in an otherwise isoelectric or noisy signal and subjecting this sample to statistical analysis.
- burst onset is identified by computing changes in amplitude at every data sample point with appropriate smoothing and proper threshold differentiation.
- the invention provides an algorithm, a specific example of which is described below, that provides, with statistical confidence, a mean BS (or interburst) interval practically for any desired point in time.
- BS interval according to specific embodiments of the invention is defined as the time between burst offset and subsequent burst onset, regardless of burst duration.
- the algorithm calculates and displays with statistical accuracy the mean BS interval in patients placed into induced coma. In typical current practice, this interval is not calculated at all and a guess or visual estimate of one or a few interburst intervals is made.
- FIG. 3 is a flow chart illustrating a method of adjusting a patient's or subject's sedation according to specific embodiments of the invention.
- This figure illustrates a general embodiment.
- EEG signal data is received (Step A 1 )
- changes in amplitude are determined (Step A 2 )
- an ongoing interburst interval is calculated (Step A 3 ).
- an ongoing mean of the interburst interval is computed (Step A 4 ) and a statistical confidence value is computed (Step A 5 ).
- the medical staff user is presented with the computed ongoing mean along with an indication of confidence (Step A 6 ) and uses that information to adjust application of sedatives or hypnotics (Step A 7 ).
- indications of burst suppression calculations can be presented to a staff member using a graphical or numeric or textual interface and/or using various audio indications.
- EEG segmentation where EEG is segmented into fixed intervals (e.g., 1 second data windows) with no or insufficient overlap, it is generally not possible to localize the exact onset of a burst or suppression.
- Data windows generally smear onset detection as a function equal to the rate of overlap or the segmentation interval (when tiling/no overlap is used).
- the present invention avoids this problem by not segmenting the EEG signal EEG signals but instead analyzing each and every digitized EEG sample for a burst or suppression onset.
- the invention achieves instantaneous detection, which has proven far superior to windowed detection.
- Burst-suppression has also been conceptualized poorly in prior algorithm detection literature as a state of EEG silence followed by a state of discharge. This description misses the aspect of the signal that is most indicative of the difference between bursts and suppression. While EEG silence is a state of modest voltages, it more importantly is a state of modest voltage change, whereas a burst is a state of large voltages, but more importantly it is a state of large voltage change. This difference is subtle but critical in identifying exact burst or suppression onset or offset. Other algorithms that use temporal detection schemes look for differences in voltages across time. In the present invention, the detection algorithm identifies voltage differences in real time. In other words, the invention uses the constant change in positivity to negativity to advantage in its detection scheme whereas absolute voltage detection schemes smear across such chatter.
- the interval calculation and display is a statistical event with a confidence interval of e.g., 95%. That is, an assumption employed by the invention is that at any dose of hypnotic, the brain will be bursting around a statistical mean or median. By reporting and/or utilizing this estimate of the phenomenon's central tendency, the invention allows for stabilizing titration or other administration of an anesthetic agent. In other schemes, if an ongoing average without statistical confidence is reported the patient may be subject to under- and over-dosing based on the sample's average interval as the true (population) interburst interval is not known.
- the invention is embodied in a single application (e.g., only burst-suppression) device that is portable hardware and for example that may involve two or more leads attached to the head of the patient.
- a single application e.g., only burst-suppression
- the only display will be interburst interval in a format understood by staff, although in alternative embodiments, full EEG charting is possible but not necessary.
- Pre-processing of an EEG signal to minimize noise is normally achieved by application of a low-pass digital filter or mathematical smoothing and this can be performed before a signal is outputted from the EEG recording device.
- a high pass digital filter of 3 Hz may be applied to remove slow drifts due to poor electrode contact, sweat, slow cortical potentials, or related artifact.
- physiological and equipment artifact may be minimized by numerous artifact detection schemes, including elimination from further computation any short segment of EEG (e.g., 100 ms) with an absolute amplitude average of 100 microvolts or above.
- further noise reduction is achieved by appropriate amplitude comparisons as described below.
- computations are for the most part performed for every digitized sample with ongoing updating of histories as described in further detailed examples below.
- a 3-sample-skip comparison provides noise reduction comparable to a 4-sample smooth or 32 Hz low pass filter.
- a 3-sample skip requires that amplitude at time 0 is compared to amplitude at time 3 , amplitude at time 1 to amplitude at time 4 , and so on, consecutively across the signal.
- a 1-sample skip may also be used to capture rare low-amplitude bursts in some patients, though interval estimation should not change appreciably and in specific embodiments, a 2-sample skip is used.
- data from multiple EEG channels may be used to detect variance in BS generation across scalp recordings, which in some situations may strengthen the reliability of the detection scheme.
- a single EEG channel or bipolar pairing can be used for analysis, preferably one with the greatest measured amplitudes.
- Anterior or lateral sites referenced to vertex such as F3-Cz or T3-Cz work well.
- generally at least two and typically four channels are analyzed.
- absolute amplitude difference (d i ) in microvolts is calculated continuously across the signal, with a 1 second history (i.e., smoothed 1000 ms). Smoothing minimizes the effect of signal variation on onset detection. modest history (e.g., 500 to 1000 ms smoothed).
- the invention can be further understood by considering the equation:
- burst onset is detected when the smoothed absolute amplitude difference (d i ) exceeds a criterion based on median (m) absolute amplitude times a specified factor.
- the multiplication factor is the cube root of burst-suppression duration ratio, with extreme values truncated (e.g., values above 2 reduced to 2). For instance, an interval with 5:1 burst-suppression duration ratio has 1.71 as its multiplication factor, so that detection occurs at 1.71 times median. This factor is be defaulted to an appropriate goal interburst interval (e.g., 1.5 seconds) at the start of computation.
- Suppression onset occurs whenever the smoothed absolute amplitude difference (d i ) drops below 1 ⁇ median (m) absolute amplitude.
- the median absolute amplitude is calculated for a long running history consisting of at least two interburst intervals. Initial median absolute amplitude is computed for 10 seconds and may be updated periodically, e.g., every 30 or 60 seconds, until multiple interburst intervals have been detected. Median computation occurs at each burst offset (i.e., start of suppression). Median absolute amplitude is mean median and computed in such a way as to be moderately intolerant of outliers, i.e., significant deviations from past median values on the part are eliminated and current or past intervals are eliminated and/or weighted accordingly.
- the current interval's median is more than 2 standard deviations away from the mean of the median distribution, it does not contribute to the mean median and if the current median is within 2 standard deviations of the mean median, it contributes to the mean median.
- the median-based criterion is made more sensitive to the current moment by weighing all contributions to the mean median based on temporal distance from current moment using either a linear, exponential, or logarithmic decay function. For instance, to compute the representative median for the current interval using exponential decay, each median contributes twice the weight of the previous median.
- 2 ⁇ median was chosen empirically as the threshold value to determine burst onset.
- this value can be adjusted in various embodiments or situations, including utilizing a per patient analysis.
- the value is learned by an algorithm that analyzes either initial data or training data.
- P determines how the BSMBS interval is presented to a staff member or used.
- the BSM can be displayed in different colors based on the value of P, or the BSMBS interval can flash or blink until P rises above a predetermined value.
- medical staff can determine whether the BSMBS interval displayed is the “true” value or a value accurate (statistically speaking), with sufficient statistical confidence and can thereby more accurately make any necessary adjustments to perform a necessary adjustment of the anesthetics.
- an additional smoothing factor may be applied to minimize the detection of rapid consecutive burst onsets. Suppression onset is ignored whenever a burst onset occurs less than 500 or 1000 ms after the suppression onset. This smoothing factor is optional and generally unnecessary for modestly-delineated delineated BS.
- burst onsets are tallied and presented after a period of time (e.g., the first minute) in units of Bursts per Minute.
- a history of this measure can also be set by the user, e.g., to 5 minutes throughout the recording or longer (e.g., 10 minutes, 30 minutes) or if empirically derived depending upon a designated state of statistical confidence desired by a user.
- time count (e.g., number of digitized samples (e.g., typically such as 128 samples per second) since last burst onset) is be reset to zero at each burst onset. In this situation, time count immediately prior to reset can be used to compute current BS interval.
- Mean Burst Suppression Interval ( b /R) is displayed in units of seconds (e.g., 8.5), along with a statistical confidence of this estimate for the unit range. Generally, the time count of the first burst onset of any record is ignored.
- n number of intervals collected
- b refers to number of digitized samples from burst offset to burst onset and R equals sample rate.
- Number of digitized samples may be represented linearly, logarithmically, or exponentially.
- confidence is indicated at 95% if
- the algorithm characterizes burst-suppression intervals with statistical confidence and with minimal conceptual or procedural complexity.
- the possibility of burst or suppression onset, offset, and duration are determined for each and every digital sample. Smoothing and threshold factors are empirically validated in specific embodiments for a large patient sample. Adjustments may be made to increase or decrease specificity or selectivity for specific cases or populations.
- FIG. 4A-D illustrate in simple block diagram an example display according to specific embodiments of the present invention wherein the only data displayed is a value indicating the mean interburst interval with this value displayed in black text (A) when the statistical confidence level is above a threshold and in a different text (e.g., grey, a different color, flashing, etc.) text (B) when statistical confidence level is below a designated threshold.
- a and D likewise show displays indicating the mean burst per minute value.
- such displays are particularly useful to staff in a patient care setting as the display succinctly and accurately provides staff with the essential information needed to monitor burst suppression activity.
- Alternate example displays discussed herein provide further functionality.
- FIG. 5 illustrates an alternative example display according to the invention wherein a number of optional values in addition to mean calculation may be displayed. Different levels of detail can be displayed according to specific embodiments of the invention and in some embodiments a monitoring system of the invention may provide options allowing a user to select which portions of data are displayed.
- FIG. 6A-D provide an example flow chart of a user interface operation according to specific embodiments of the invention. This chart is provided for illustrative purposes only and it will be apparent to those of skill in the art that other user interactions steps may be used to effect the present invention.
- FIG. 7A-G illustrate example graphical user interfaces showing an initial menu screen and other user data input screens as may be displayed on special purpose or general purpose persona computers, tablet computers, or information laboratory equipment according to specific embodiments of the invention.
- a number of different screens are optionally included according to specific embodiments of the invention for various user interface tasks such as patient information management and other data and file information management.
- FIG. 8 illustrates an example graphical user interface showing a novel display generated as a single curve from a monitoring of a live subject plotting a dosage of a anesthetic agent on the horizontal axis and a response in terms of an inter-burst interval on the vertical axis according to specific embodiments of the invention with individual points clustered at the center (and indicated in green, for example) indicating appropriate suppression and outlining points (for example colored red) at the top and bottom of the graph indicating over or under sedation.
- This display provides information allowing a staff person to either administer and monitor titration of sedatives and burst suppression according to specific embodiments of the invention or this display represents data that can be used for automatic titration according to specific embodiments of the invention.
- green dots indicate a patient time sample where the sedation is correct.
- FIG. 10 illustrates an example graphical user display according to specific embodiments of the present invention wherein the most prominent data displayed is a value indicating the mean interburst interval, for example in a color or with flashing indicating if a desired confidence interval has been achieved; optional additional data according to various embodiments of the invention include an BS history graph (in this case for 12 previous hours) showing an initial period when not enough data has been gathered to determine a BI with the desired confidence, a green indication then the BI is in the desired range and is calculated with the desired confidence, a red jagged period near the center of the graph indicating a period when the confidence interval falls out of a desired threshold; an ICP history is also provided, along with a bar indicating a range of target ICP and wherein exceeding the targeted ICP corresponds to the exceeding of confidence for the BI calculation.
- BS history graph in this case for 12 previous hours
- the BS trace is a trending history of the BSI in time. That time is selectable by a user, such as 4, 6, 8, 10, or 12 hours, or some other time.
- FIG. 11 illustrates an example graphical user display according to specific embodiments of the present invention wherein, in addition to other data displayed, the display includes an indication of detected seizure events that persist on the screen for a period of time or optionally until cleared by a staff person according to specific embodiments of the invention
- a heavy (e.g., red) bar is displayed at the bottom of the screen to indicate that a detected seizure event is taking place.
- FIG. 12 illustrates an example graphical user interface allowing for input of titration values either for titration display calculation or optionally for automatic titration control according to specific embodiments of the invention.
- the invention may be incorporated in a device designed to maintain induced coma with statistical accuracy.
- the device reports the burst-suppression interval with statistical confidence to the staff in order to aid them in proper titration of hypnotics.
- such a device will allow for controlled study of such issues as the maintenance of different interburst intervals (e.g., shorter such as 4 seconds versus longer, such as 12 seconds) as a test of patient outcome and the effectiveness of different hypnotics with accurate maintenance of the interval.
- Various embodiments of the present invention provide methods and/or systems for burst suppression monitoring that can be implemented on a general purpose or special purpose information handling appliance using a suitable programming language such as Java, C++, Cobol, C, Pascal, Fortran., PL1, LISP, assembly, etc., and any suitable data or formatting specifications, such as HTML, XML, dHTML, TIFF, JPEG, tab-delimited text, binary, etc.
- a suitable programming language such as Java, C++, Cobol, C, Pascal, Fortran., PL1, LISP, assembly, etc.
- any suitable data or formatting specifications such as HTML, XML, dHTML, TIFF, JPEG, tab-delimited text, binary, etc.
- FIG. 13 is a block diagram showing a representative example logic device in which various aspects of the present invention may be embodied.
- the invention can be implemented in hardware and/or software.
- different aspects of the invention can be implemented in either a stand-alone device that includes just the BS monitoring functions described herein or in systems or devices that include any number of medical functions.
- the invention or components thereof may be embodied in a fixed media program component containing logic instructions and/or data that when loaded into an appropriately configured information processing device cause that device to perform according to the invention.
- a fixed media containing logic instructions may be delivered to a user on a fixed media for physically loading into a user's computer or a fixed media containing logic instructions may reside on a remote server that a user accesses through a communication medium in order to download a program component.
- FIG. 13 shows an information appliance (or digital device) 700 that may be understood as a logical apparatus that can read instructions from media 717 and/or network port 719 , which can optionally be connected to server 720 having fixed media 722 .
- Apparatus 700 can thereafter use those instructions to direct server or client logic, as understood in the art, to embody aspects of the invention.
- One type of logical apparatus that may embody the invention is a computer system as illustrated in 700 , containing CPU 707 , optional input devices 709 and 711 , disk drives 715 and optional monitor 705 .
- Fixed media 717 , or fixed media 722 over port 719 may be used to program such a system and may represent a disk-type optical or magnetic media, magnetic tape, solid state dynamic or static memory, etc.
- the invention may be embodied in whole or in part as software recorded on this fixed media.
- Communication port 719 may also be used to initially receive instructions that are used to program such a system and may represent any type of communication connection.
- the invention also may be embodied in whole or in part within the circuitry of an application specific integrated circuit (ASIC) or a programmable logic device (PLD).
- ASIC application specific integrated circuit
- PLD programmable logic device
- the invention may be embodied in a computer understandable descriptor language, which may be used to create an ASIC, or PLD that operates as herein described.
Abstract
Description
- 1. Principal Component Analysis and Gabortransform in analysing burst-suppression EEG under propofol anaesthesia, Laeven, R., Gielen, C. C. A. M., Coenen, A. M. L., and Van Rijn, C. M. (2001) Sleep-wake Research in the Netherlands, 12, 75-80.
- 2. Anesthesia monitoring system based on electroencephalographic signals, U.S. Pat. No. 6,317,627
- 3. An effective correlation dimension and burst suppression ratio of the EEG in rat. Correlation with sevoflurane induced anaesthetic depth. (2006) P. L. C. van den Broek, C. M. van Rijn, J. van Egmond, A. M. L. Coenen, L. H. D. J. Booij, European Journal of Anaesthesiology, May, 23 (5) 391-402.
- 4. Automatic analysis and monitoring of burst suppression in anesthesia. (2002), Mika Sarkela MSc, Seppo Mustola MD, Tapio Seppanen PhD, Miika Koskinen MSc, Pasi Lepola MSc, Kalervo Suominen PhD Tatu Juvonen MD PhD, HeliTolvanen-Laakso MSc and Ville Jantti MD PhD, J Clin Monit Comput. February, 17(2) 125-134.
- 5. The Narcotrend Index: Classification algorithm, correlation with propofol effect-site concentrations and comparison with spectral parameters. (2004) Schultz A, Grouven U, Berger F A, Schultz B, Biomed Tech (Berl), March, 49(3) 38-42.
- 6. Sundt T M, Sharbrough F W, Piepgras D G, Kearns T P, Correlation of cerebral blood flow and electroencephalographic changes during carotid endarterectomy with results of surgery and hemodynamics of cerebral ischemia., Mayo Clin Proc. 1981 September; 56(9):533-43.
- 7. Messick J M, O'Fallon W M: Correlation of cerebral blood flow and electroencephalographic changes during carotid endarterectomy with results of surgery and hemodynamics of cerebral ischemia. Mayo Clinic proceedings 1981: 56:533-43
- 8. Gibbs F A, Gibbs E L, Lennox W G: Effect on the electroencephalogram of certain drugs which influence nervous activity. Arch Intern Med 1937: 60:154-66
- 9. J. Derbyshire, B. Rempel, A. Forbes, and E. F. Lambert (1936). The Effects of Anesthetics on Action Potentials in the Cerebral Cortex of the Cat. Am J Physiol 116: 577-596.
- 10. Henrey, C E, Scoville, W B. (1952). Suppression-burst activity from isolated cerebral cortex in man. Electroencephalogr Clin Neurophysiol. 4: 1-22.
- 11. Akrawi W P, Drummond J C, Kalkman C J, Patel P M. (1996). A comparison of the electrophysiologic characteristics of EEG burst-suppression as produced by isoflurane, thiopental, etomidate, and propofol. Journal of Neurosurgical Anesthesiology, 8: 40-6.
- 12. Bruhn J, Ropcke H, Rehberg B, Bouillon T, Hoeft A. (2000). Electroencephalogram approximate entropy correctly classifies the occurrence of burst suppression pattern as increasing anesthetic drug effect. Anesthesiology, 93: 981-5.
- 13. Leistritz L, Jager H, Schelenz C, Witte H, Putsche P, Specht M, Reinhart K. (1999). New approaches for the detection and analysis of electroencephalographic burst-suppression patterns in patients under sedation. Journal of Clinical Monitoring and Computing, 15: 357-67.
- 14. Lipping T, Jantti V, Yli-Hankala A, & Hartikainen K. (1995). Adaptive segmentation of burst-suppression pattern in isoflurane and enflurane anesthesia. International Journal of Clinical Monitoring and Computing, 12: 161-7.
- 15. Muthuswamy J, Sherman D L, Thakor N V. (1999). Higher-order spectral analysis of burst patterns in EEG. IEEE Transactions on Biomedical Engineering, 4: 92-9.
- 16. Sarkela M, Mustola S, Seppanen T, Koskinen M, Lepola P, Suominen K, Juvonen T, Tolvanen-Laakso H, Jantti V. (2002). Automatic analysis and monitoring of burst suppression in anesthesia. Journal of Clinical Monitoring and Computing, 17: 125-34.
- 17. Bodenstein, G., Praetorius, H. M., 1977. Feature extraction from the electroencephalogram by adaptive segmentation. Proc. IEEE. 65: 642-652.
where A=amplitude of sample i, R=sample rate/sec, which typically is about 128 samples/sec. In one example embodiment, 4 was selected as best smoothing/skip parameter for the 128 sampling rate. However, this number can be adjusted in various applications. In this equation, both the sample skip difference and the smoothed 1 second summation over the previous R samples are indicated.
if d i/2>m i , c i=1,
if d i <m i , c i=0.
else c i =c i−1
if c i =c i−1+1 then if t i−1 <R, c i =c i−1
if t i−1 ≧R, b j =b j+1 , b j =t i−1 , t i=0
for 1 minute for a designated degree, such as 95% if
given the standard deviation of burst intervals and number of intervals, see below. This produces a confidence interval of approximately 1 second around
where s=standard deviation; n=number of intervals
Claims (23)
Priority Applications (2)
| Application Number | Priority Date | Filing Date | Title |
|---|---|---|---|
| US11/865,727 US8649855B2 (en) | 2006-09-29 | 2007-10-01 | Burst suppression monitor for induced coma |
| US14/177,090 US9597006B2 (en) | 2006-09-29 | 2014-02-10 | Burst suppression monitor for induced coma |
Applications Claiming Priority (2)
| Application Number | Priority Date | Filing Date | Title |
|---|---|---|---|
| US82743306P | 2006-09-29 | 2006-09-29 | |
| US11/865,727 US8649855B2 (en) | 2006-09-29 | 2007-10-01 | Burst suppression monitor for induced coma |
Related Child Applications (1)
| Application Number | Title | Priority Date | Filing Date |
|---|---|---|---|
| US14/177,090 Continuation US9597006B2 (en) | 2006-09-29 | 2014-02-10 | Burst suppression monitor for induced coma |
Publications (2)
| Publication Number | Publication Date |
|---|---|
| US20080249431A1 US20080249431A1 (en) | 2008-10-09 |
| US8649855B2 true US8649855B2 (en) | 2014-02-11 |
Family
ID=39827585
Family Applications (2)
| Application Number | Title | Priority Date | Filing Date |
|---|---|---|---|
| US11/865,727 Expired - Fee Related US8649855B2 (en) | 2006-09-29 | 2007-10-01 | Burst suppression monitor for induced coma |
| US14/177,090 Expired - Fee Related US9597006B2 (en) | 2006-09-29 | 2014-02-10 | Burst suppression monitor for induced coma |
Family Applications After (1)
| Application Number | Title | Priority Date | Filing Date |
|---|---|---|---|
| US14/177,090 Expired - Fee Related US9597006B2 (en) | 2006-09-29 | 2014-02-10 | Burst suppression monitor for induced coma |
Country Status (5)
| Country | Link |
|---|---|
| US (2) | US8649855B2 (en) |
| EP (1) | EP2076173B1 (en) |
| DK (1) | DK2076173T3 (en) |
| ES (1) | ES2531254T3 (en) |
| WO (1) | WO2009004403A2 (en) |
Cited By (1)
| Publication number | Priority date | Publication date | Assignee | Title |
|---|---|---|---|---|
| US10953192B2 (en) | 2017-05-18 | 2021-03-23 | Advanced Brain Monitoring, Inc. | Systems and methods for detecting and managing physiological patterns |
Families Citing this family (16)
| Publication number | Priority date | Publication date | Assignee | Title |
|---|---|---|---|---|
| US8914115B2 (en) * | 2009-12-03 | 2014-12-16 | Medtronic, Inc. | Selecting therapy cycle parameters based on monitored brain signal |
| US20130310422A1 (en) | 2010-09-01 | 2013-11-21 | The General Hospital Corporation | Reversal of general anesthesia by administration of methylphenidate, amphetamine, modafinil, amantadine, and/or caffeine |
| US8565886B2 (en) | 2010-11-10 | 2013-10-22 | Medtronic, Inc. | Arousal state modulation with electrical stimulation |
| WO2012103224A1 (en) | 2011-01-25 | 2012-08-02 | Medtronic, Inc. | Target therapy delivery site selection |
| US11559237B1 (en) * | 2011-08-24 | 2023-01-24 | Neurowave Systems Inc. | Robust real-time EEG suppression detection device and method |
| US20140194769A1 (en) * | 2011-09-19 | 2014-07-10 | Persyst Development Corporation | Multiple Patient EEG Monitoring |
| US20130072809A1 (en) * | 2011-09-19 | 2013-03-21 | Persyst Development Corporation | Method And System For Analyzing An EEG Recording |
| EP2906112B1 (en) | 2012-10-12 | 2023-03-15 | The General Hospital Corporation | System and method for monitoring and controlling a state of a patient during and after administration of anesthetic compound |
| US20140316218A1 (en) * | 2013-04-23 | 2014-10-23 | Patrick L. Purdon | Systems and methods for monitoring brain metabolism and activity using electroencephalogram and optical imaging |
| EP3014290A4 (en) | 2013-06-27 | 2017-03-08 | The General Hospital Corporation | Systems and methods for tracking non-stationary spectral structure and dynamics in physiological data |
| US10383574B2 (en) * | 2013-06-28 | 2019-08-20 | The General Hospital Corporation | Systems and methods to infer brain state during burst suppression |
| JP6586093B2 (en) | 2013-09-13 | 2019-10-02 | ザ ジェネラル ホスピタル コーポレイション | System for improved brain monitoring during general anesthesia and sedation |
| CN105193409B (en) * | 2015-08-07 | 2018-01-16 | 深圳大学 | A kind of brain electricity suppression level appraisal procedure and system |
| WO2018102402A1 (en) | 2016-11-29 | 2018-06-07 | The General Hospital Corporation | Systems and methods for analyzing electrophysiological data from patients undergoing medical treatments |
| CN109009089B (en) * | 2018-05-08 | 2021-06-15 | 南京伟思医疗科技股份有限公司 | Electroencephalogram signal outbreak inhibition detection method suitable for neonates |
| CN109259764B (en) * | 2018-07-27 | 2021-05-14 | 昆明理工大学 | Method for determining dynamic brain function network threshold |
Citations (25)
| Publication number | Priority date | Publication date | Assignee | Title |
|---|---|---|---|---|
| US4566464A (en) * | 1981-07-27 | 1986-01-28 | Piccone Vincent A | Implantable epilepsy monitor apparatus |
| US4788982A (en) | 1986-01-23 | 1988-12-06 | Icor Ab | Device for determining depth of anaesthesia |
| US4846190A (en) | 1983-08-23 | 1989-07-11 | John Erwin R | Electroencephalographic system data display |
| US4869264A (en) | 1985-07-30 | 1989-09-26 | Swineburn Limited | Electroencephalographic consciousness and anesthetic monitor |
| US5010891A (en) | 1987-10-09 | 1991-04-30 | Biometrak Corporation | Cerebral biopotential analysis system and method |
| US5195531A (en) | 1991-03-01 | 1993-03-23 | Bennett Henry L | Anesthesia adequacy monitor and method |
| US5320109A (en) | 1991-10-25 | 1994-06-14 | Aspect Medical Systems, Inc. | Cerebral biopotential analysis system and method |
| US5792069A (en) | 1996-12-24 | 1998-08-11 | Aspect Medical Systems, Inc. | Method and system for the extraction of cardiac artifacts from EEG signals |
| US6011990A (en) | 1995-10-19 | 2000-01-04 | Arthur Schultz | Method and device for evaluating an EEG carried out in the context of anaesthesia or intensive care |
| US6016444A (en) * | 1997-12-10 | 2000-01-18 | New York University | Automatic control of anesthesia using quantitative EEG |
| US6067467A (en) | 1994-02-07 | 2000-05-23 | New York University | EEG operative and post-operative patient monitoring method |
| US6224549B1 (en) | 1999-04-20 | 2001-05-01 | Nicolet Biomedical, Inc. | Medical signal monitoring and display |
| US6231560B1 (en) | 1999-02-10 | 2001-05-15 | Baxter International Inc | Method and apparatus for automatically controlling the level of medication |
| US6317627B1 (en) * | 1999-11-02 | 2001-11-13 | Physiometrix, Inc. | Anesthesia monitoring system based on electroencephalographic signals |
| US6748263B2 (en) | 2000-02-17 | 2004-06-08 | The University Of Bristol | Monitoring electrical activity |
| US20050137494A1 (en) * | 2003-10-22 | 2005-06-23 | Viertio-Oja Hanna E. | Method and apparatus for determining the cerebral state of a patient using generalized spectral entropy of the EEG signal |
| US20060009709A1 (en) | 2004-07-07 | 2006-01-12 | Rautee Riina A | Detection of encephalopathy |
| US20060167722A1 (en) | 2004-01-27 | 2006-07-27 | Aspect Medical Systems, Inc. | System and method for adaptive drug delivery |
| US7089927B2 (en) | 2002-10-23 | 2006-08-15 | New York University | System and method for guidance of anesthesia, analgesia and amnesia |
| US20060190044A1 (en) | 2005-02-22 | 2006-08-24 | Cardiac Pacemakers, Inc. | Cell therapy and neural stimulation for cardiac repair |
| US20070276609A1 (en) * | 2006-03-31 | 2007-11-29 | Aspect Medical Systems, Inc. | System and method of assessing analgesic adequacy using biopotential variability |
| US7373198B2 (en) | 2002-07-12 | 2008-05-13 | Bionova Technologies Inc. | Method and apparatus for the estimation of anesthetic depth using wavelet analysis of the electroencephalogram |
| US7395292B2 (en) | 2003-10-08 | 2008-07-01 | Johnson Mark W | Method for displaying spectral trends in complex signals |
| US20090048530A1 (en) | 2007-08-15 | 2009-02-19 | The General Electric Company | Monitoring of epileptiform activity |
| US7957793B2 (en) * | 2004-12-22 | 2011-06-07 | Wisconsin Alumni Research Foundation | Methods for identifying neuronal spikes |
-
2007
- 2007-10-01 EP EP07875122.9A patent/EP2076173B1/en not_active Not-in-force
- 2007-10-01 WO PCT/IB2007/004703 patent/WO2009004403A2/en active Application Filing
- 2007-10-01 US US11/865,727 patent/US8649855B2/en not_active Expired - Fee Related
- 2007-10-01 DK DK07875122.9T patent/DK2076173T3/en active
- 2007-10-01 ES ES07875122T patent/ES2531254T3/en active Active
-
2014
- 2014-02-10 US US14/177,090 patent/US9597006B2/en not_active Expired - Fee Related
Patent Citations (25)
| Publication number | Priority date | Publication date | Assignee | Title |
|---|---|---|---|---|
| US4566464A (en) * | 1981-07-27 | 1986-01-28 | Piccone Vincent A | Implantable epilepsy monitor apparatus |
| US4846190A (en) | 1983-08-23 | 1989-07-11 | John Erwin R | Electroencephalographic system data display |
| US4869264A (en) | 1985-07-30 | 1989-09-26 | Swineburn Limited | Electroencephalographic consciousness and anesthetic monitor |
| US4788982A (en) | 1986-01-23 | 1988-12-06 | Icor Ab | Device for determining depth of anaesthesia |
| US5010891A (en) | 1987-10-09 | 1991-04-30 | Biometrak Corporation | Cerebral biopotential analysis system and method |
| US5195531A (en) | 1991-03-01 | 1993-03-23 | Bennett Henry L | Anesthesia adequacy monitor and method |
| US5320109A (en) | 1991-10-25 | 1994-06-14 | Aspect Medical Systems, Inc. | Cerebral biopotential analysis system and method |
| US6067467A (en) | 1994-02-07 | 2000-05-23 | New York University | EEG operative and post-operative patient monitoring method |
| US6011990A (en) | 1995-10-19 | 2000-01-04 | Arthur Schultz | Method and device for evaluating an EEG carried out in the context of anaesthesia or intensive care |
| US5792069A (en) | 1996-12-24 | 1998-08-11 | Aspect Medical Systems, Inc. | Method and system for the extraction of cardiac artifacts from EEG signals |
| US6016444A (en) * | 1997-12-10 | 2000-01-18 | New York University | Automatic control of anesthesia using quantitative EEG |
| US6231560B1 (en) | 1999-02-10 | 2001-05-15 | Baxter International Inc | Method and apparatus for automatically controlling the level of medication |
| US6224549B1 (en) | 1999-04-20 | 2001-05-01 | Nicolet Biomedical, Inc. | Medical signal monitoring and display |
| US6317627B1 (en) * | 1999-11-02 | 2001-11-13 | Physiometrix, Inc. | Anesthesia monitoring system based on electroencephalographic signals |
| US6748263B2 (en) | 2000-02-17 | 2004-06-08 | The University Of Bristol | Monitoring electrical activity |
| US7373198B2 (en) | 2002-07-12 | 2008-05-13 | Bionova Technologies Inc. | Method and apparatus for the estimation of anesthetic depth using wavelet analysis of the electroencephalogram |
| US7089927B2 (en) | 2002-10-23 | 2006-08-15 | New York University | System and method for guidance of anesthesia, analgesia and amnesia |
| US7395292B2 (en) | 2003-10-08 | 2008-07-01 | Johnson Mark W | Method for displaying spectral trends in complex signals |
| US20050137494A1 (en) * | 2003-10-22 | 2005-06-23 | Viertio-Oja Hanna E. | Method and apparatus for determining the cerebral state of a patient using generalized spectral entropy of the EEG signal |
| US20060167722A1 (en) | 2004-01-27 | 2006-07-27 | Aspect Medical Systems, Inc. | System and method for adaptive drug delivery |
| US20060009709A1 (en) | 2004-07-07 | 2006-01-12 | Rautee Riina A | Detection of encephalopathy |
| US7957793B2 (en) * | 2004-12-22 | 2011-06-07 | Wisconsin Alumni Research Foundation | Methods for identifying neuronal spikes |
| US20060190044A1 (en) | 2005-02-22 | 2006-08-24 | Cardiac Pacemakers, Inc. | Cell therapy and neural stimulation for cardiac repair |
| US20070276609A1 (en) * | 2006-03-31 | 2007-11-29 | Aspect Medical Systems, Inc. | System and method of assessing analgesic adequacy using biopotential variability |
| US20090048530A1 (en) | 2007-08-15 | 2009-02-19 | The General Electric Company | Monitoring of epileptiform activity |
Non-Patent Citations (17)
| Title |
|---|
| "VIASYS Announces NicoletOne Modular Neurodiagnostic System; New Neurodiagnostic System Utilizes Proven EEG Technology" Business Wire , Jul. 30, 2004. |
| 190-NicoletOne-Amplitude-Integrated-Brochure.pdf, published after Dec. 22, 2005. |
| 190-NicoletOne-Burst-Supression-Brochure.pdf, published after Dec. 22, 2005. |
| Beydoun, "Variance of interburst intervals in burst suppression" 1991, Electroencephalography and clinical Neurophysiology, 79: 435-439. * |
| EP Search Report, dated May 7, 2012 from EP Application No. 07875122.9. |
| ESCORT Vision-Central Station-Web-CP460.pdf Dec. 26, 2001 http://web.archive.org/web/20011226133537/viasyshealthcare.com/mde/Products/Central-Stations/Default.htm. |
| Hughes (2004) "Neurological Emergencies passage." Neurological Emergencies, pp. 1-492. |
| Leistritz et al. (1999) "New Approaches for the Detection and Analysis of Electroencephalographic Burst-Suppression Patterns in Patients Under Sedation." Journal of Clinical Monitoring and Computing, 15: 357-367. |
| Leistritz et al., "New Approaches for the Detection and Analysis of Electroencephalographic Burst-Suppression Patterns in Patients under Sedation" 1999, Journal of Clinical Monitoring and Computing, vol. 15, No. 6, pp. 357-367. * |
| Lipping et al. "Adaptive segmentation of burst-suppression pattern in isoflurane and enflurane anesthesia," 1995, International Journal of Clinical Monitoring and Computing 12: 161-167. * |
| NicoletOne Monitor ICU Webpage http://web.archive.org/web/20051211052422/http://www.viasyshealthcare.com/prod-serv/prodDetail.aspx?config=ps-prodDtl&prodID=188, available after Dec. 11, 2005 according to wayback. Earliest indicated date for this URL is Oct. 29, 2005. |
| Rae-Grant et al. (Type III intermittency: a nonlinear dynamic model of EEG burst suppression. Electroencephalography and clinical neurophysiology, 90(1): 17-23. |
| Särkelä et al., "Automatic Analysis and Monitoring of Burst Suppression in Anesthesia" 2002, Journal of Clinical Monitoring and Computing, vol. 17, No. 2, pp. 125-134. * |
| Schack et al. (2001) "Time-variant non-linear phase-coupling analysis of EEG burst patterns in sedated patients during electroencephalic burst suppression period." Clinical Neurophysiology, 112(8): 1388-1399. |
| Schwab et al. (2005) "Time-variant Parametric Estimation of Transient Quadratic Phase Couplings during Electroencephalographic Burst Activity." Methods of Information in Medicine, 44(3): 374-383. |
| Van Gils et al. (1997) "Signal Processing in Prolonged EEG Recordings During Intensive CareMethods for Analyzing and Displaying EEG Signals." IEEE Engineering in Medicine and Biology, 56-63. |
| Vijn and Sneyd, "I.v. Anaesthesia and EEG burst suppression in rats: bolus injections and closed-loop infusions" 1998; British Journal of Anaesthesia 81: 415-421. * |
Cited By (2)
| Publication number | Priority date | Publication date | Assignee | Title |
|---|---|---|---|---|
| US10953192B2 (en) | 2017-05-18 | 2021-03-23 | Advanced Brain Monitoring, Inc. | Systems and methods for detecting and managing physiological patterns |
| US11850060B2 (en) | 2017-05-18 | 2023-12-26 | Advanced Brain Monitoring, Inc. | Systems and methods for detecting and managing physiological patterns |
Also Published As
| Publication number | Publication date |
|---|---|
| DK2076173T3 (en) | 2015-02-09 |
| WO2009004403A2 (en) | 2009-01-08 |
| EP2076173A4 (en) | 2012-06-06 |
| ES2531254T3 (en) | 2015-03-12 |
| US20080249431A1 (en) | 2008-10-09 |
| EP2076173B1 (en) | 2014-12-17 |
| WO2009004403A3 (en) | 2009-08-27 |
| EP2076173A2 (en) | 2009-07-08 |
| US9597006B2 (en) | 2017-03-21 |
| US20140249444A1 (en) | 2014-09-04 |
Similar Documents
| Publication | Publication Date | Title |
|---|---|---|
| US9597006B2 (en) | Burst suppression monitor for induced coma | |
| JP4910095B2 (en) | Seizure warning and prediction | |
| US5775330A (en) | Neurometric assessment of intraoperative anesthetic | |
| US20210000362A1 (en) | Monitoring the effects of sleep deprivation using neuronal avalanches | |
| JP4987338B2 (en) | System and method for predicting cognitive decline | |
| US7433732B1 (en) | Real-time brain monitoring system | |
| US6442421B1 (en) | Method for the medical monitoring in real time of a patient from the analysis of electroencephalograms to characterize and differentiate between physiological or pathological conditions, and a method for anticipating epileptic seizures | |
| US7725173B2 (en) | Measurement of responsiveness of a subject with lowered level of consciousness | |
| Schneider et al. | Monitoring depth of anesthesia utilizing a combination of electroencephalographic and standard measures | |
| US20040127810A1 (en) | Multi-dimensional multi-parameter time series processing for seizure warning and prediction | |
| CN107530023B (en) | Apparatus and method for electroencephalography | |
| US20040122335A1 (en) | Optimization of multi-dimensional time series processing for seizure warning and prediction | |
| US20090247893A1 (en) | Method and apparatus for measuring responsiveness of a subject | |
| US7630758B2 (en) | Separation of natural and drug-induced sleep of a subject | |
| EP1880667B1 (en) | Detection of focal epileptiform activity | |
| US20110251985A1 (en) | Detection and Prediction of Physiological Events in People with Sleep Disordered Breathing Using a LAMSTAR Neural Network | |
| US7625340B2 (en) | Identification of a dominant signal component in a biosignal | |
| WO2009079384A1 (en) | Qeeg statistical low resolution tomographic analysis | |
| US20220022809A1 (en) | Systems and methods to detect and treat obstructive sleep apnea and upper airway obstruction | |
| US20080234597A1 (en) | Monitoring Neuronal Signals | |
| An et al. | Spatial variation in automated burst suppression detection in pharmacologically induced coma | |
| CN112587796A (en) | Method and device for quantifying wake-up promotion effect of deep brain electric stimulation | |
| RU2781740C1 (en) | Method for detecting the state of deep sleep | |
| EP3915478A1 (en) | Consciousness level determination method and computer program | |
| Kangas et al. | Neurometric assessment of adequacy of intraoperative anesthetic |
Legal Events
| Date | Code | Title | Description |
|---|---|---|---|
| AS | Assignment |
Owner name: THE REGENTS OF THE UNIVERSITY OF CALIFORNIA, CALIF Free format text: ASSIGNMENT OF ASSIGNORS INTEREST;ASSIGNOR:BIER, MICHAEL J.;REEL/FRAME:020680/0384 Effective date: 20080318 Owner name: WAVESTATE, INC., CALIFORNIA Free format text: ASSIGNMENT OF ASSIGNORS INTEREST;ASSIGNOR:KAISER, DAVID A., PH.D;REEL/FRAME:020680/0403 Effective date: 20080318 |
|
| FEPP | Fee payment procedure |
Free format text: PAYOR NUMBER ASSIGNED (ORIGINAL EVENT CODE: ASPN); ENTITY STATUS OF PATENT OWNER: SMALL ENTITY |
|
| STCF | Information on status: patent grant |
Free format text: PATENTED CASE |
|
| FPAY | Fee payment |
Year of fee payment: 4 |
|
| FEPP | Fee payment procedure |
Free format text: MAINTENANCE FEE REMINDER MAILED (ORIGINAL EVENT CODE: REM.); ENTITY STATUS OF PATENT OWNER: SMALL ENTITY |
|
| LAPS | Lapse for failure to pay maintenance fees |
Free format text: PATENT EXPIRED FOR FAILURE TO PAY MAINTENANCE FEES (ORIGINAL EVENT CODE: EXP.); ENTITY STATUS OF PATENT OWNER: SMALL ENTITY |
|
| STCH | Information on status: patent discontinuation |
Free format text: PATENT EXPIRED DUE TO NONPAYMENT OF MAINTENANCE FEES UNDER 37 CFR 1.362 |
|
| FP | Lapsed due to failure to pay maintenance fee |
Effective date: 20220211 |