US8713141B1 - System and method for monitoring network activity - Google Patents
System and method for monitoring network activity Download PDFInfo
- Publication number
- US8713141B1 US8713141B1 US11/288,795 US28879505A US8713141B1 US 8713141 B1 US8713141 B1 US 8713141B1 US 28879505 A US28879505 A US 28879505A US 8713141 B1 US8713141 B1 US 8713141B1
- Authority
- US
- United States
- Prior art keywords
- data
- entropy
- network
- distribution function
- steady state
- Prior art date
- Legal status (The legal status is an assumption and is not a legal conclusion. Google has not performed a legal analysis and makes no representation as to the accuracy of the status listed.)
- Active, expires
Links
Images


Classifications
-
- H—ELECTRICITY
- H04—ELECTRIC COMMUNICATION TECHNIQUE
- H04L—TRANSMISSION OF DIGITAL INFORMATION, e.g. TELEGRAPHIC COMMUNICATION
- H04L63/00—Network architectures or network communication protocols for network security
- H04L63/14—Network architectures or network communication protocols for network security for detecting or protecting against malicious traffic
- H04L63/1408—Network architectures or network communication protocols for network security for detecting or protecting against malicious traffic by monitoring network traffic
- H04L63/1425—Traffic logging, e.g. anomaly detection
-
- H—ELECTRICITY
- H04—ELECTRIC COMMUNICATION TECHNIQUE
- H04L—TRANSMISSION OF DIGITAL INFORMATION, e.g. TELEGRAPHIC COMMUNICATION
- H04L43/00—Arrangements for monitoring or testing data switching networks
- H04L43/04—Processing captured monitoring data, e.g. for logfile generation
- H04L43/045—Processing captured monitoring data, e.g. for logfile generation for graphical visualisation of monitoring data
Definitions
- IP Internet Protocol
- security violations can include activities such as reconnaissance, exploits, denial of service (“DoS”), and misuse of the network.
- DoS denial of service
- the security violations are often only detected after the security violations have begun. By the time the security violations are detected, damage (e.g., slowed traffic, corrupted data, stolen data, etc.) may have already occurred.
- a method for receiving first data corresponding to usage of a network receiving second data corresponding to usage of the network, comparing the first data to the second data and providing an indication of a network event when the second data varies from the second data greater than a predetermined threshold.
- a system having a data collection module to receive first data corresponding to usage of a network, a data collection module to receive second data corresponding to usage of the network, a comparison module to compare the first data and the second data and an output module to provide an indication of a network event when the second data varies from the first data greater than a predetermined threshold.
- a computer system comprising a memory for storing a set of instructions and a processor for executing the set of instructions.
- the set of instructions being operable to receive first data corresponding to usage of a network, receive second data corresponding to usage of the network, compare the first data and the second data and provide an indication of a network event when the second data varies from the first data greater than a predetermined threshold.
- FIG. 1 shows an exemplary embodiment of a grid corresponding to a network graph according to the present invention.
- FIG. 2 shows an exemplary embodiment of an IP address usage graph according to the present invention.
- FIG. 3 shows an exemplary embodiment of another IP address usage graph according to the present invention.
- FIG. 4A shows an exemplary embodiment of an IP address usage graph before scanning activity is recorded according to the present invention.
- FIG. 4B shows an exemplary embodiment of the IP address usage graph of FIG. 4A after scanning activity is recorded according to the present invention.
- FIG. 5 shows an exemplary embodiment of a method according to the present invention.
- FIG. 6 shows an exemplary embodiment of a graph of a first statistic, which shows potential scanning activity according to the present invention.
- FIG. 7 shows an exemplary embodiment of a graph of a second statistic, which shows potential scanning activity according to the present invention.
- FIG. 8 shows an exemplary embodiment of a graph of the first statistic, which does not show scanning activity according to the present invention.
- FIG. 9 shows an exemplary embodiment of a graph of the second statistic, which does not show scanning activity according to the present invention.
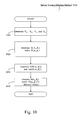
- FIG. 10 shows an exemplary embodiment of another method according to the present invention.
- FIG. 11 shows an exemplary embodiment of a graph of a third statistic, which shows potential scanning activity according to the present invention.
- FIG. 12 shows an exemplary embodiment of a graph of a fourth statistic, which shows potential scanning activity according to the present invention.
- FIG. 13 shows an exemplary embodiment of a graph of the third statistic, which does not show scanning activity according to the present invention.
- FIG. 14 shows an exemplary embodiment of yet another method according to the present invention.
- FIG. 15 shows an exemplary embodiment of a data record according to the present invention.
- the present invention may be further understood with reference to the following description and the appended drawings, wherein like elements are referred to with the same reference numerals.
- the exemplary embodiment of the present invention describes a method for monitoring network activity and detecting scanning activity within a network. A method for visualizing network activity will be described below, followed by a discussion of exemplary methods for detecting scanning activity.
- the methods described herein may be performed, either partially or entirely on one or more computing devices.
- the computing device(s) may include components such as a processor (e.g., a microprocessor, an application-specific integrated circuit (“ASIC”), etc.) for executing instructions, a memory (e.g., a hard drive, a random-access memory (‘RAM”), etc.) for storing the instructions and data, an input device (e.g., a keyboard, a mouse, etc.), an output device (e.g., a monitor), and a network communications arrangement (e.g., a network interface card, a wireless adapter, etc.).
- a processor e.g., a microprocessor, an application-specific integrated circuit (“ASIC”), etc.
- ASIC application-specific integrated circuit
- memory e.g., a hard drive, a random-access memory (‘RAM”), etc.
- an input device e.g., a keyboard, a mouse, etc.
- a method for visualizing network activity utilizes NetFlow data.
- NetFlow refers to a technology and applications utilizing this technology, which are available from Cisco Systems, Inc.
- NetFlow allows measurements to be made for applications such as network traffic accounting and network monitoring.
- scanning activities are often used by would-be assailants of the network to identify network topology, operating systems, and/or network services running on potential target systems residing in the network.
- IP Internet Protocol
- IP Graph is software developed by AT&T Corp. (“AT&T”) to graphically represent IP addresses.
- IP Graph utilizes a two-dimensional grid 100 of coordinate values corresponding to a network graph, as illustrated in an exemplary embodiment shown in FIG. 1 .
- the grid 100 is a 16 by 16 square formed by blocks numbered from 0 to 255. Each block may be used to represent part or all of an IP address whose 32 bits are denoted as A.B.C.D.
- the block number 255 may be marked (e.g., colored or highlighted) to indicate this.
- the next 8 bits of the IP address may also be represented by dividing each of the 256 A blocks into 256 smaller B blocks. For example, if B is 11111111, then A.B may be represented by marking a B block number 255, which is located in the lower right-hand corner of the A block number 255.
- the grid 100 In the exemplary embodiment of the grid 100 , only the first 16 bits of the IP address (i.e., A.B) are represented. However, in other embodiments, additional bits of the IP address may be represented through further subdivision of the grid 100 , changing the dimensions of the grid 100 , etc. In addition, the grid 100 may be used to display other information. For example, a third dimension may be used to represent traffic volume (e.g., the number of flows, packets, bytes, etc.) for each IP address.
- traffic volume e.g., the number of flows, packets, bytes, etc.
- the number and size of the dimensions of the grid 100 may therefore be customized to a user's specification as well as for compatibility with hardware on which IP Graph is run (e.g., sizing the grid 100 so that the total number of blocks is less than or equal to a maximum number of pixels a video monitor is capable of displaying).
- FIG. 2 shows an exemplary embodiment of an IP address usage graph 200 , which illustrates the number of unique 16-bit portions of destination IP addresses observed from NetFlow data during a predetermined time interval (e.g., 10 minutes).
- a predetermined time interval e.g. 10 minutes.
- FIG. 3 shows an exemplary embodiment of a network graph 300 , which illustrates the number of unique 16-bit portions of destination IP addresses announced by AT&T's Internet Gateway Routers (“IGRs”) belonging to the network.
- IGRs Internet Gateway Routers
- the destination IP addresses depicted in the network graph 300 include addresses that are owned and/or managed by an owner of the network.
- the network graph 300 shows several blocks 310 , 320 , 330 , 340 and 350 , which are substantially filled-in, indicating that the blocks 310 - 350 represent large blocks of destination IP addresses owned or managed by AT&T.
- the task of monitoring the network may be greatly simplified by focusing only on those areas of the network graph 300 which are owned and/or managed by the network provider.
- the network graph 300 also defines disallowed space. That is, destination IP addresses outside of the ones represented in the network graph 300 may indicate routing and/or security problems.
- FIG. 4A shows an exemplary embodiment of a network graph 400 before scanning activity is recorded.
- the network graph 400 may represent the network at any point in time. If additional network graphs were recorded prior to the network graph 400 , a comparison between the network graph 400 and the previous network graphs may be made using a method according to the present invention (which will be described below) to confirm that no scanning activity has occurred.
- FIG. 4B shows an exemplary embodiment of a network graph 410 after scanning activity is recorded.
- the network graph 410 was recorded during a time interval following that of the network graph 400 .
- the network graph 410 may have been recorded ten minutes after the network graph 400 .
- scanning activity occurred over the network.
- the scanning activity is represented by a block 444 , which is substantially filled-in, indicating that most of the destination IP addresses of the block 444 have been targeted. Referring to FIG. 1 , it may be seen that the block 444 corresponds to the A block number 32 (00100000 in base two). Therefore, most of the destination IP addresses with A equal to 00100000 were targeted.
- FIG. 5 shows an exemplary embodiment of a method 500 for detecting scanning activity using the Kolmogorov-Smirnov (“K-S”) test.
- K-S Kolmogorov-Smirnov
- the K-S test may be used to determine if two datasets differ significantly.
- the K-S test may be used to perform a goodness-of-fit test between an empirical distribution function, F(x) and a hypothesized distribution function, F 0 (x).
- F(x) an empirical distribution function
- F 0 (x) a hypothesized distribution function
- step 510 empirical and hypothesized distribution functions, ⁇ circumflex over (F) ⁇ n (k) and ⁇ circumflex over (F) ⁇ n-1 (k) are determined from data recorded during an nth and an (n ⁇ 1)th time interval, respectively.
- the (n ⁇ 1)th time interval may correspond to that of an earlier network graph (e.g., network graph 400 ), while the nth time interval may correspond to a later network graph (e.g., network graph 410 ).
- H 1 is ⁇ circumflex over (F) ⁇ n (k) ⁇ circumflex over (F) ⁇ n-1 (k) for some k.
- the distribution functions ⁇ circumflex over (F) ⁇ n (k) and ⁇ circumflex over (F) ⁇ n-1 (k) may be determined according to the formula
- ⁇ ⁇ I j is a numerical value corresponding to the number of unique Bs in a recorded sample where A equals j.
- a and B represent the first and second set of eight bits, respectively, in a 32-bit IP address).
- the distribution functions ⁇ circumflex over (F) ⁇ n (k) and ⁇ circumflex over (F) ⁇ n-1 (k) represent the sum of the number of unique Bs for each A up to j as a fraction of the total number of unique Bs for all As.
- step 520 two statistics, D n and D′ are determined according to the formulas
- D n may be used to identify increases in the number of prefixes within a given A block and is effective in detecting scans which target individual A blocks, whereas D′ is useful for detecting scans which target multiple A blocks. It should be noted that the distribution functions shown for D n and D′ are the same, even though the notation is shown differently.
- D n and D′ are compared to threshold values in order to detect scanning activity.
- the threshold values may be determined based on empirical data.
- the threshold values may be a moving average values of D n and D′ observed under normal conditions for some interval, plus some standard deviations. If the threshold values are exceeded, this may indicate that scanning activity has occurred.
- FIG. 6 an exemplary data graph 600 shows D n plotted over various time intervals.
- a threshold value 610 is shown as a line and is determined from empirical data.
- the threshold value 610 may be determined by adding 3.5 times the standard deviation to an average D′ value, which is calculated from a set of time intervals that are relatively free of scanning activity.
- a majority of the data points are below the threshold value 610 , however there are also a substantial number of data points above the threshold value 610 . These latter data points are referred to as outliers, and indicate that scanning activity may have occurred.
- FIG. 7 an exemplary data graph 700 is shown in FIG. 7 , which plots D′ over various time intervals and includes a threshold value 710 .
- the threshold value 710 may be determined in a manner similar to that of the threshold 710 .
- the data graph 700 corroborates the results of the data graph 600 .
- FIGS. 8 and 9 show exemplary embodiments of data graphs 800 and 900 , which plot D n and D′, respectively, when excluding the block that was scanned. In contrast to the data graphs 600 and 700 , few or no data points are above the threshold values 610 , 710 .
- the method 500 only the A.B portion of the destination IP address was used. However, in other embodiments it may be possible to perform the method 500 using additional portions of the destination IP address. How much of the destination IP address is used may depend on, among other things, the size/dimensions of the grid 100 . In addition, it may also be possible to perform the method 500 multiple times on different portions of the destination IP address. For example, the user may initially wish to use only the A.B portion. If potential scanning activity was detected after doing so, the user may then wish to repeat the method 500 using the A.B.C portion in order to analyze the potential scanning activity in more detail and determine if specific prefixes within a C block are being targeted.
- FIG. 10 shows an exemplary embodiment of a method 1000 for detecting scanning activity using an entropy test.
- the entropy test is not based on a cumulative distribution, and is therefore effective in detecting sudden increases in the number of prefixes over a time interval.
- one drawback to the entropy test is that it does not provide any information regarding which blocks are being targeted. Therefore, it may be desirable, but not required, to use both the methods 500 , 1000 to detect scanning activity.
- the method 1000 will be described with reference to the A.B portion of the destination IP address. However, other embodiments may use other portions of the destination IP address.
- step 1010 four entropy factors, N 00 , N 01 , N 10 and N 11 are determined. Given two sets of destination IP addresses, where the second of the two sets is recorded after the first set, such as in the network graphs 400 , 410 , N 00 is the number of unique A.Bs that appear in both sets, N 01 is the number of unique A.Bs in the first set, but not the second, N 10 is the number of unique A.Bs that appear in the second set, but not the first, and N 11 is the number of unique A.Bs that do not appear in either set.
- step 1020 an entropy, H is determined where
- the entropy H indicates the difference between the two sets. When the sets are identical, H equals zero. As the difference between the two sets increases (indicating possible scanning activity), the entropy H correspondingly increases.
- ⁇ represents the probability of remaining in the second set during the next time interval
- ⁇ represents the probability of remaining out of the second set during the next time interval.
- the steady-state entropy H′ is a function of ⁇ and ⁇ , and is determined according to the formula
- H ′ ⁇ ( ⁇ , ⁇ ) - ( 1 - ⁇ ) ⁇ ( ⁇ ⁇ ⁇ ln ⁇ ⁇ ⁇ + ( 1 - ⁇ ) ⁇ ln ⁇ ( 1 - ⁇ ) ) + ( 1 - ⁇ ) ⁇ ( ⁇ ⁇ ⁇ ln ⁇ ⁇ ⁇ + ( 1 - ⁇ ) ⁇ ⁇ ln ⁇ ( 1 - ⁇ ) ) 2 - ⁇ - ⁇ .
- the steady-state entropy H′ may be approximated using smoothed values of ⁇ and ⁇ , which are obtained after applying exponential smoothing with a smoothing constant, w where 0 ⁇ w ⁇ 1.
- ⁇ n - 1 N 00 n - 1 N 00 n - 1 + N 01 n - 1
- ⁇ n - 1 N 11 n - 1 N 10 n - 1 + N 11 n - 1 .
- step 1030 a mean, E and a variance, Var of the entropy H are determined according to the formulas
- the mean E and the variance Var are used to determine a threshold value for the steady-state entropy H′ at the nth time interval.
- the threshold value for the steady-state entropy H′ is determined according to the formula
- a threshold value for the entropy H may also be determined using empirical data.
- the entropy H and/or the steady-state entropy H′ are compared to their respective threshold values. If the respective threshold values are exceeded, this may indicate that scanning activity has occurred.
- an exemplary data graph 1100 shows the entropy H plotted over various time intervals. As seen from the outliers above a threshold value 112 , scanning activity may have occurred.
- the threshold value 112 may be determined in a manner similar to that of the threshold value 610 (e.g., an average value plus 3.5 times a standard deviation).
- FIG. 12 shows an exemplary data graph 1200 plotting the steady-state entropy H′.
- the data graph 1200 shows two threshold lines 122 and 124 , which are calculated using w values of 0.8 and 0.2, respectively.
- the threshold line When w is close to 1, as is the case with the threshold line 122 , the threshold line has a tendency to follow the original data.
- the threshold line When w is close to 0, as is the case with the threshold line 124 , the threshold line is smoother and does not follow the original data as closely.
- using the threshold line 122 results in fewer outliers.
- FIG. 13 shows an exemplary data graph 1300 which plots the entropy H over various data values. In contrast to the data graph 1100 , few or none of the data points are above the threshold value 112 , indicating that scanning activity has not occurred.
- FIG. 14 shows an exemplary embodiment of a method 1400 for monitoring network activity.
- the method 1400 may be performed automatically at scheduled intervals, or at the request of the user.
- network data e.g., NetFlow data
- the collection and/or graphing of the network data may be performed whenever the method 1400 is initiated, or the network data could be retrieved from a database which is continually updated with new network data. This may be performed using IP graph as discussed above.
- NetFlow data is retrieved from routers in the network, and destination IP addresses are plotted on a network graph.
- the graphing of the network data allows the user to visualize traffic rather than relying solely on the output of a scanning activity analysis. Graphing the network data also facilitates the detection of trends in and/or substantial changes to the network activity.
- the network graph is analyzed for potential scanning activity.
- Data points on the network graph may be analyzed, for example, using one or both of the methods 500 , 1000 .
- the user may choose to monitor for scanning activity using the method 500 and then confirm the results of the method 500 by performing the method 1000 or a visual inspection.
- Data graphs of the D n and D′ statistics and/or the entropy H and/or the steady-state entropy H′ may be generated depending on which method(s) are used to analyze the network graph. Accordingly, in step 1430 , a determination is made as to whether potential scanning activity has been detected.
- step 1440 if potential scanning activity was detected, the source(s) of the potential scanning activity are determined. This may be done by first locating the time intervals at which outliers are located. For example, in FIG. 6 , the k values for each outlier may be used to locate the block(s) targeted by the outlier. This may be done for all the time intervals at once, or the time intervals may be split and evaluated separately. In the exemplary embodiment of the data graph 600 , splitting the time intervals and evaluating only the first 1440 minutes (i.e., one day) yields 7 groups of outliers beginning at the 20 th 10-minute interval and whose k values indicate that the block number 32 was targeted.
- FIG. 15 shows an exemplary data record 1500 , which lists NetFlow records for the time intervals corresponding to the data graph 600 . For brevity, only the records for the 20 th 10-minute interval are shown. These records indicate that for the first scan, a single Ping packet was sent to every other address in the second (i.e., B) portion of the destination IP addresses with the form 32.x.0.53. The sizes of the Ping packets varied from 66 to 70 bytes, and the average time between scans was approximately 1.5 seconds. For each destination IP address targeted, the source IP address was 209.12.44.46. The scanning source corresponding to the source IP address may then be identified by, for example, performing a reverse Domain Name System (“DNS”) lookup.
- DNS reverse Domain Name System
- a response procedure is performed.
- the system administrator may be alerted to the potential scanning activity.
- no further action may be required.
- the scanning source is a server (e.g., DNS, Network Time Protocol (“NTP”), web, mail, Netnews, etc.) which communicates with many clients.
- NTP Network Time Protocol
- Potential scanning activity from other sources would likely raise suspicion and therefore would require investigation.
- Such investigation may include communicating with system administrators who manage the network on which the scanning source is located. This may enable the scanning source to be further identified (e.g., a particular computer or group of computers).
- the response procedure may also include preventative measures, such as blocking requests from the scanning source. This may be performed automatically (e.g., when a predetermined number of packets and/or Pings have been sent from the scanning source) or performed at the discretion of the system administrator.
- time intervals of different durations may be used, either alone or together. If the time interval is substantially longer that the duration of the potential scanning activity, the potential scanning activity is unlikely to be noticed because it is small in duration compared to the duration of normal activities. If the time interval is too short, the potential scanning activity may be hard to distinguish from the normal activities. It may therefore be desirable to perform the methods of the present invention using multiple time intervals of various durations. The number and/or length of these multiple time intervals may be affected by considerations such as the amount of time required to execute the methods using the multiple time intervals.
- the methods described above may also be used to detect IP spoofing.
- the user may be able to monitor changes in the number and/or distribution of the source IP addresses. Sudden changes in the number of unique source IP addresses, or changes to the distribution thereof, may indicate that spoofing techniques are being used to impersonate legitimate source IP addresses.
- the present invention may be capable of detecting current security violations in addition to anticipating future security violations.
Abstract
Description
is a numerical value corresponding to the number of unique Bs in a recorded sample where A equals j. (A and B represent the first and second set of eight bits, respectively, in a 32-bit IP address). Thus, the distribution functions {circumflex over (F)}n(k) and {circumflex over (F)}n-1(k) represent the sum of the number of unique Bs for each A up to j as a fraction of the total number of unique Bs for all As.
represents the maximum difference between the distribution functions {circumflex over (F)}n(k) and {circumflex over (F)}n-1(k) at corresponding values of k, and D′ represents the sum of the absolute differences between the two distribution functions {circumflex over (F)}n(k) and {circumflex over (F)}n-1(k). Dn may be used to identify increases in the number of prefixes within a given A block and is effective in detecting scans which target individual A blocks, whereas D′ is useful for detecting scans which target multiple A blocks. It should be noted that the distribution functions shown for Dn and D′ are the same, even though the notation is shown differently.
The entropy H indicates the difference between the two sets. When the sets are identical, H equals zero. As the difference between the two sets increases (indicating possible scanning activity), the entropy H correspondingly increases.
The steady-state entropy H′ is a function of α and β, and is determined according to the formula
In order to simplify computations, the steady-state entropy H′ may be approximated using smoothed values of α and β, which are obtained after applying exponential smoothing with a smoothing constant, w where 0<w<1. The smoothed values, which are denoted by the symbols {circumflex over (α)}n,{circumflex over (β)}n, correspond to α and β when evaluated at an nth time interval and may be determined according to the formulas {circumflex over (α)}n=wαn-1+(1+w){circumflex over (α)}n-1, {circumflex over (β)}n=wβn-1+(1−w){circumflex over (β)}n-1 where
Having determined the smoothed values {circumflex over (α)}n, {circumflex over (β)}n, it is now possible to approximate H′ according to the formula
A threshold value for the entropy H may also be determined using empirical data.
Claims (22)
Priority Applications (1)
| Application Number | Priority Date | Filing Date | Title |
|---|---|---|---|
| US11/288,795 US8713141B1 (en) | 2005-11-29 | 2005-11-29 | System and method for monitoring network activity |
Applications Claiming Priority (1)
| Application Number | Priority Date | Filing Date | Title |
|---|---|---|---|
| US11/288,795 US8713141B1 (en) | 2005-11-29 | 2005-11-29 | System and method for monitoring network activity |
Publications (1)
| Publication Number | Publication Date |
|---|---|
| US8713141B1 true US8713141B1 (en) | 2014-04-29 |
Family
ID=50514379
Family Applications (1)
| Application Number | Title | Priority Date | Filing Date |
|---|---|---|---|
| US11/288,795 Active 2034-06-15 US8713141B1 (en) | 2005-11-29 | 2005-11-29 | System and method for monitoring network activity |
Country Status (1)
| Country | Link |
|---|---|
| US (1) | US8713141B1 (en) |
Cited By (6)
| Publication number | Priority date | Publication date | Assignee | Title |
|---|---|---|---|---|
| US20140304390A1 (en) * | 2011-06-03 | 2014-10-09 | John Bates | Predictive Analysis of Network Analytics |
| US20170104724A1 (en) * | 2015-10-09 | 2017-04-13 | Disney Enterprises, Inc. | Secure Network Matchmaking |
| US20170206354A1 (en) * | 2016-01-19 | 2017-07-20 | International Business Machines Corporation | Detecting anomalous events through runtime verification of software execution using a behavioral model |
| US9961100B2 (en) * | 2016-07-29 | 2018-05-01 | Accenture Global Solutions Limited | Network security analysis system |
| US10326787B2 (en) | 2017-02-15 | 2019-06-18 | Microsoft Technology Licensing, Llc | System and method for detecting anomalies including detection and removal of outliers associated with network traffic to cloud applications |
| US10708302B2 (en) * | 2015-07-27 | 2020-07-07 | Swisscom Ag | Systems and methods for identifying phishing web sites |
Citations (15)
| Publication number | Priority date | Publication date | Assignee | Title |
|---|---|---|---|---|
| US5764740A (en) * | 1995-07-14 | 1998-06-09 | Telefonaktiebolaget Lm Ericsson | System and method for optimal logical network capacity dimensioning with broadband traffic |
| US6405318B1 (en) | 1999-03-12 | 2002-06-11 | Psionic Software, Inc. | Intrusion detection system |
| US6745333B1 (en) | 2002-01-31 | 2004-06-01 | 3Com Corporation | Method for detecting unauthorized network access by having a NIC monitor for packets purporting to be from itself |
| US6802009B1 (en) | 1999-12-17 | 2004-10-05 | International Business Machines Corporation | Operating system security checking system, method, and program |
| US6873600B1 (en) * | 2000-02-04 | 2005-03-29 | At&T Corp. | Consistent sampling for network traffic measurement |
| US20050068961A1 (en) * | 2003-09-29 | 2005-03-31 | Satish Raghunath | Method and apparatus of providing resource allocation and admission control support in a VPN |
| US20050125195A1 (en) * | 2001-12-21 | 2005-06-09 | Juergen Brendel | Method, apparatus and sofware for network traffic management |
| US6928554B2 (en) | 2002-10-31 | 2005-08-09 | International Business Machines Corporation | Method of query return data analysis for early warning indicators of possible security exposures |
| US6944673B2 (en) * | 2000-09-08 | 2005-09-13 | The Regents Of The University Of Michigan | Method and system for profiling network flows at a measurement point within a computer network |
| US6948070B1 (en) | 1995-02-13 | 2005-09-20 | Intertrust Technologies Corporation | Systems and methods for secure transaction management and electronic rights protection |
| US20050223089A1 (en) * | 2004-04-05 | 2005-10-06 | Lee Rhodes | Network usage analysis system and method for detecting network congestion |
| US6963983B2 (en) | 1999-05-11 | 2005-11-08 | Cylant, Inc. | Method of and system for detecting an anomalous operation of a computer system |
| US20070150949A1 (en) * | 2005-12-28 | 2007-06-28 | At&T Corp. | Anomaly detection methods for a computer network |
| US7342923B2 (en) * | 2001-02-28 | 2008-03-11 | Corvil Limited | Method and system for bandwidth estimation |
| US7594260B2 (en) * | 1998-11-09 | 2009-09-22 | Sri International | Network surveillance using long-term and short-term statistical profiles to determine suspicious network activity |
-
2005
- 2005-11-29 US US11/288,795 patent/US8713141B1/en active Active
Patent Citations (15)
| Publication number | Priority date | Publication date | Assignee | Title |
|---|---|---|---|---|
| US6948070B1 (en) | 1995-02-13 | 2005-09-20 | Intertrust Technologies Corporation | Systems and methods for secure transaction management and electronic rights protection |
| US5764740A (en) * | 1995-07-14 | 1998-06-09 | Telefonaktiebolaget Lm Ericsson | System and method for optimal logical network capacity dimensioning with broadband traffic |
| US7594260B2 (en) * | 1998-11-09 | 2009-09-22 | Sri International | Network surveillance using long-term and short-term statistical profiles to determine suspicious network activity |
| US6405318B1 (en) | 1999-03-12 | 2002-06-11 | Psionic Software, Inc. | Intrusion detection system |
| US6963983B2 (en) | 1999-05-11 | 2005-11-08 | Cylant, Inc. | Method of and system for detecting an anomalous operation of a computer system |
| US6802009B1 (en) | 1999-12-17 | 2004-10-05 | International Business Machines Corporation | Operating system security checking system, method, and program |
| US6873600B1 (en) * | 2000-02-04 | 2005-03-29 | At&T Corp. | Consistent sampling for network traffic measurement |
| US6944673B2 (en) * | 2000-09-08 | 2005-09-13 | The Regents Of The University Of Michigan | Method and system for profiling network flows at a measurement point within a computer network |
| US7342923B2 (en) * | 2001-02-28 | 2008-03-11 | Corvil Limited | Method and system for bandwidth estimation |
| US20050125195A1 (en) * | 2001-12-21 | 2005-06-09 | Juergen Brendel | Method, apparatus and sofware for network traffic management |
| US6745333B1 (en) | 2002-01-31 | 2004-06-01 | 3Com Corporation | Method for detecting unauthorized network access by having a NIC monitor for packets purporting to be from itself |
| US6928554B2 (en) | 2002-10-31 | 2005-08-09 | International Business Machines Corporation | Method of query return data analysis for early warning indicators of possible security exposures |
| US20050068961A1 (en) * | 2003-09-29 | 2005-03-31 | Satish Raghunath | Method and apparatus of providing resource allocation and admission control support in a VPN |
| US20050223089A1 (en) * | 2004-04-05 | 2005-10-06 | Lee Rhodes | Network usage analysis system and method for detecting network congestion |
| US20070150949A1 (en) * | 2005-12-28 | 2007-06-28 | At&T Corp. | Anomaly detection methods for a computer network |
Non-Patent Citations (1)
| Title |
|---|
| Gu et al., "Detecting Anomalies in Network Traffic using Maximum Entropy Estimation", Oct. 2005. * |
Cited By (10)
| Publication number | Priority date | Publication date | Assignee | Title |
|---|---|---|---|---|
| US20140304390A1 (en) * | 2011-06-03 | 2014-10-09 | John Bates | Predictive Analysis of Network Analytics |
| US9413559B2 (en) * | 2011-06-03 | 2016-08-09 | Adobe Systems Incorporated | Predictive analysis of network analytics |
| US10708302B2 (en) * | 2015-07-27 | 2020-07-07 | Swisscom Ag | Systems and methods for identifying phishing web sites |
| US20170104724A1 (en) * | 2015-10-09 | 2017-04-13 | Disney Enterprises, Inc. | Secure Network Matchmaking |
| US9877197B2 (en) * | 2015-10-09 | 2018-01-23 | Disney Enterprises, Inc. | Secure network matchmaking |
| US20170206354A1 (en) * | 2016-01-19 | 2017-07-20 | International Business Machines Corporation | Detecting anomalous events through runtime verification of software execution using a behavioral model |
| US10152596B2 (en) * | 2016-01-19 | 2018-12-11 | International Business Machines Corporation | Detecting anomalous events through runtime verification of software execution using a behavioral model |
| US9961100B2 (en) * | 2016-07-29 | 2018-05-01 | Accenture Global Solutions Limited | Network security analysis system |
| US10305924B2 (en) | 2016-07-29 | 2019-05-28 | Accenture Global Solutions Limited | Network security analysis system |
| US10326787B2 (en) | 2017-02-15 | 2019-06-18 | Microsoft Technology Licensing, Llc | System and method for detecting anomalies including detection and removal of outliers associated with network traffic to cloud applications |
Similar Documents
| Publication | Publication Date | Title |
|---|---|---|
| Jiang et al. | Identifying suspicious activities through dns failure graph analysis | |
| Oprea et al. | Detection of early-stage enterprise infection by mining large-scale log data | |
| US10027694B1 (en) | Detecting denial of service attacks on communication networks | |
| US20200358792A1 (en) | Artificial intelligence (ai) based cyber threat analyst to support a cyber security appliance | |
| US8856360B2 (en) | Automatically identifying dynamic internet protocol addresses | |
| Giroire et al. | Exploiting temporal persistence to detect covert botnet channels | |
| US9467462B2 (en) | Traffic anomaly analysis for the detection of aberrant network code | |
| RU2495486C1 (en) | Method of analysing and detecting malicious intermediate nodes in network | |
| US20160226902A1 (en) | Detection of malicious network connections | |
| US20100058165A1 (en) | Method and system for displaying network security incidents | |
| US8713141B1 (en) | System and method for monitoring network activity | |
| Vaarandi et al. | Using security logs for collecting and reporting technical security metrics | |
| US11606377B1 (en) | Device classification for identifying anomolous activity | |
| EP3660719A1 (en) | Method for detecting intrusions in an audit log | |
| Bou-Harb et al. | A systematic approach for detecting and clustering distributed cyber scanning | |
| US11689554B2 (en) | Machine learned network vulnerability assessment | |
| US10320823B2 (en) | Discovering yet unknown malicious entities using relational data | |
| Ma et al. | Accurate DNS query characteristics estimation via active probing | |
| Weaver et al. | Fishing for phishes: Applying capture-recapture methods to estimate phishing populations | |
| EP3647982B1 (en) | Cyber attack evaluation method and cyber attack evaluation device | |
| Yang | A study on attack information collection using virtualization technology | |
| Qin et al. | A new connection degree calculation and measurement method for large scale network monitoring | |
| Tang et al. | Efficient identification of TOP-K heavy hitters over sliding windows | |
| US11522886B2 (en) | Multi-stage scanning of computer devices from different geographic locations | |
| US20220278999A1 (en) | Real-time detection of malicious activity through collaborative filtering |
Legal Events
| Date | Code | Title | Description |
|---|---|---|---|
| AS | Assignment |
Owner name: AT&T CORP., NEW YORK Free format text: ASSIGNMENT OF ASSIGNORS INTEREST;ASSIGNORS:LIU, DANIELLE;HOEFLIN, DAVID A.;SPARRELL, DUNCAN;SIGNING DATES FROM 20060224 TO 20060303;REEL/FRAME:017650/0279 |
|
| STCF | Information on status: patent grant |
Free format text: PATENTED CASE |
|
| FEPP | Fee payment procedure |
Free format text: PAYOR NUMBER ASSIGNED (ORIGINAL EVENT CODE: ASPN); ENTITY STATUS OF PATENT OWNER: LARGE ENTITY |
|
| MAFP | Maintenance fee payment |
Free format text: PAYMENT OF MAINTENANCE FEE, 4TH YEAR, LARGE ENTITY (ORIGINAL EVENT CODE: M1551) Year of fee payment: 4 |
|
| MAFP | Maintenance fee payment |
Free format text: PAYMENT OF MAINTENANCE FEE, 8TH YEAR, LARGE ENTITY (ORIGINAL EVENT CODE: M1552); ENTITY STATUS OF PATENT OWNER: LARGE ENTITY Year of fee payment: 8 |
|
| AS | Assignment |
Owner name: AT&T INTELLECTUAL PROPERTY II, L.P., GEORGIA Free format text: ASSIGNMENT OF ASSIGNORS INTEREST;ASSIGNOR:AT&T PROPERTIES, LLC;REEL/FRAME:062724/0888 Effective date: 20230215 Owner name: AT&T PROPERTIES, LLC, NEVADA Free format text: ASSIGNMENT OF ASSIGNORS INTEREST;ASSIGNOR:AT&T CORP.;REEL/FRAME:062723/0411 Effective date: 20230215 |