US8770029B2 - Method and apparatus for ultrasonic testing - Google Patents
Method and apparatus for ultrasonic testing Download PDFInfo
- Publication number
- US8770029B2 US8770029B2 US13/252,435 US201113252435A US8770029B2 US 8770029 B2 US8770029 B2 US 8770029B2 US 201113252435 A US201113252435 A US 201113252435A US 8770029 B2 US8770029 B2 US 8770029B2
- Authority
- US
- United States
- Prior art keywords
- gating
- display
- electrical signals
- mode image
- ultrasonic
- Prior art date
- Legal status (The legal status is an assumption and is not a legal conclusion. Google has not performed a legal analysis and makes no representation as to the accuracy of the status listed.)
- Expired - Fee Related, expires
Links
Images


Classifications
-
- G—PHYSICS
- G01—MEASURING; TESTING
- G01N—INVESTIGATING OR ANALYSING MATERIALS BY DETERMINING THEIR CHEMICAL OR PHYSICAL PROPERTIES
- G01N29/00—Investigating or analysing materials by the use of ultrasonic, sonic or infrasonic waves; Visualisation of the interior of objects by transmitting ultrasonic or sonic waves through the object
- G01N29/36—Detecting the response signal, e.g. electronic circuits specially adapted therefor
- G01N29/38—Detecting the response signal, e.g. electronic circuits specially adapted therefor by time filtering, e.g. using time gates
-
- G—PHYSICS
- G01—MEASURING; TESTING
- G01N—INVESTIGATING OR ANALYSING MATERIALS BY DETERMINING THEIR CHEMICAL OR PHYSICAL PROPERTIES
- G01N29/00—Investigating or analysing materials by the use of ultrasonic, sonic or infrasonic waves; Visualisation of the interior of objects by transmitting ultrasonic or sonic waves through the object
- G01N29/04—Analysing solids
- G01N29/043—Analysing solids in the interior, e.g. by shear waves
-
- G—PHYSICS
- G01—MEASURING; TESTING
- G01N—INVESTIGATING OR ANALYSING MATERIALS BY DETERMINING THEIR CHEMICAL OR PHYSICAL PROPERTIES
- G01N29/00—Investigating or analysing materials by the use of ultrasonic, sonic or infrasonic waves; Visualisation of the interior of objects by transmitting ultrasonic or sonic waves through the object
- G01N29/04—Analysing solids
- G01N29/06—Visualisation of the interior, e.g. acoustic microscopy
- G01N29/0609—Display arrangements, e.g. colour displays
- G01N29/0645—Display representation or displayed parameters, e.g. A-, B- or C-Scan
-
- G—PHYSICS
- G01—MEASURING; TESTING
- G01N—INVESTIGATING OR ANALYSING MATERIALS BY DETERMINING THEIR CHEMICAL OR PHYSICAL PROPERTIES
- G01N29/00—Investigating or analysing materials by the use of ultrasonic, sonic or infrasonic waves; Visualisation of the interior of objects by transmitting ultrasonic or sonic waves through the object
- G01N29/22—Details, e.g. general constructional or apparatus details
- G01N29/26—Arrangements for orientation or scanning by relative movement of the head and the sensor
- G01N29/262—Arrangements for orientation or scanning by relative movement of the head and the sensor by electronic orientation or focusing, e.g. with phased arrays
-
- G—PHYSICS
- G01—MEASURING; TESTING
- G01N—INVESTIGATING OR ANALYSING MATERIALS BY DETERMINING THEIR CHEMICAL OR PHYSICAL PROPERTIES
- G01N2291/00—Indexing codes associated with group G01N29/00
- G01N2291/04—Wave modes and trajectories
- G01N2291/044—Internal reflections (echoes), e.g. on walls or defects
Definitions
- the subject matter described herein relates to methods for ultrasonic testing of an object, to ultrasonic testing devices, and to methods for testing an object with an ultrasonic testing device.
- Known ultrasonic testing devices for material testing include an ultrasonic transducer.
- the ultrasonic transducer is used to generate ultrasonic waves that are transmitted into the material.
- the transducer is also used for receiving echoes of ultrasonic waves propagating through the material.
- the echoes include reflections of flaws or other discontinuities in the material.
- the echo is converted into an electrical signal by a transducer. By presenting this signal in a so-called “A-mode image” or “A-scan”, a user is able to identify flaws and discontinuities in the material.
- At least some known ultrasonic testing devices are capable of generating and presenting a so-called “B-mode-image” or “B-scan”.
- the B-mode image represents a two-dimensional echogram of the tested material.
- a special type of a B-mode image is the so-called “sector scan” or “S-Scan”, hereinafter referred to as the “S-mode image”.
- S-mode image A S-mode image with inclined scans of the material is usually generated in case a phased array transducer is used.
- Time-controlled gating is used for cutting off regions of the material which are not of interest for the actual investigation.
- the gating start time or the gating finish time is set in one of the A-mode images.
- the gating times are then used for all electrical signals when generating the B-mode image individually.
- Such a method encounters specific challenges when it comes to flaws with a general geometry, for instance, a geometry not aligned parallel to the surface of the material.
- a method for ultrasonic testing of an object includes ultrasonic scanning of a plurality of scan regions of the object and converting ultrasonic echoes of the ultrasonic scanning into a plurality of electrical signals. After the conversion step, the electrical signals are gated to provide gated signals, wherein different gating times are used for the electrical signals.
- an ultrasonic testing device for testing an object in another aspect, includes an ultrasonic transducer for scanning a plurality of scan regions of the object and for converting ultrasonic echoes into electrical signals. Furthermore, a gating unit configured for gating the electrical signals with a gating time to provide gated signals is provided, wherein the gating time depends on the respective scan region.
- a method for testing an object comprising a display, the method including scanning a plurality of scan regions of the object to obtain a plurality of electrical signals; and processing the electrical signals to obtain a B-mode image.
- An input from a user is received to set a boundary in the B-mode image; and, the electrical signals are processed, wherein the processing includes a gating of the electrical signals depending on the coordinates of the boundary in the B-mode image.
- FIG. 1 is a schematic view of an ultrasonic scanning device according to embodiments
- FIG. 2 is a schematic view of an ultrasonic scanning device according to embodiments
- FIG. 3 shows schematically a detail of an ultrasonic scanning device according to embodiments described herein;
- FIG. 4 shows schematically a detail of the ultrasonic scanning device according to the embodiment of FIG. 2 ;
- FIG. 5 shows schematically a detail of the embodiment of FIG. 2 in case the phased array probe of FIG. 3 is used;
- FIG. 6 shows schematically the application of a free form surface in the ultrasonic scanning device of the embodiment of FIG. 2 ;
- FIG. 7 shows a method according to embodiments in a schematic flow chart.
- the embodiments described herein include an ultrasonic testing device that may be used for testing materials.
- Typical embodiments provide an A-mode image or a B-mode image of a region of the tested object including the material.
- objects is intended to be representative of objects of materials, e.g., blocks of metal or ceramic, pipes, particularly steel pipes, or aluminum billets. Typical objects include any bodies made of steel, aluminum, copper alloys, and compounds including carbon compounds and ceramic compounds.
- FIG. 1 is a schematic view of an exemplary ultrasonic testing device 100 used for testing an object 110 .
- the object 110 is part of a wall of a steel pipe and comprises an exemplary flaw 120 .
- the flaw 120 is situated in an inner region of the object 110 and is not visible from outside of the object 110 .
- a transducer 130 which is part of the exemplary ultrasonic testing device 100 , is used for sending ultrasonic pulses into the object 110 , for receiving echo signals, and for converting the echo signals into electrical signals.
- the transducer 130 converts electric energy into ultrasonic waves, transmits the ultrasonic waves to the object, receives ultrasonic waves from the object, and converts the received ultrasonic waves into an electric signal.
- Ultrasonic waves reflected from an inner region of the object to which the ultrasonic waves have been transmitted are received in order to produce an echo signal.
- the echo signal is converted into an electrical signal by the transducer 130 .
- This method is known as “pulse-echo method”.
- a method used in further typical embodiments is, for example, “through—transmission” ultrasound, where two probes are used: one as transmitter and one as receiver.
- the exemplary transducer 130 of FIG. 1 is movable along a direction indicated by an arrow 140 .
- the transducer 130 may be mounted to a rail (not shown) allowing a movement in the direction of the arrow 140 .
- a robot having some degrees of freedom, e.g., 4, 5, or 6 degrees of freedom, for moving the transducer. Thereby, a free moving path for the transducer may be programmed.
- different scan regions 150 - 161 of the object 110 can be scanned with the transducer 130 .
- the scan regions 150 - 161 are situated in a scanning plane side by side in the object 110 .
- the scanning plane lies along the lines of the scan regions 150 - 161 depicted in FIG. 1 .
- the flaw 120 lays within the scan regions 155 - 159 . Every one of the scan regions 150 - 161 is scanned with ultrasound by the transducer 130 .
- Typical embodiments include the transducer 130 being movable along one direction for scanning different scan regions situated side by side in a scanning plane of the scanned object.
- the transducer 130 can be movable to a further direction providing a scan of further regions of the object.
- Transducers 130 being moveable in two directions, for example, two orthographic directions, make a scanning of the whole object possible.
- the scan regions are situated side by side in a number of scanning planes being parallel to each other.
- the transducer 130 produces electrical signals that are representative for the received ultrasonic waves.
- the electrical signals are transmitted to a gating unit 170 .
- the gating unit 170 is configured for gating the electrical signals with a gating time to provide gated signals.
- the gating time of the gating process differs for the different scan regions 150 - 161 , i.e., at least two of the scans or electrical signals of the respective two of the scan regions 150 - 161 are gated with different gating times. However, scans of some of the scan regions 150 - 161 can be gated with the same gating time.
- Different gating times for different scan regions provide electrical signals being adapted to represent a defined sub-region of all scan regions. By doing so, the investigation is restricted to the sub-region providing clearer results in a C-mode image.
- Typical embodiments provide a C-mode image using the gated signals.
- the B-mode image is typically a B-mode live image. A fast analysis of data is possible using a B-mode live image. Further embodiments use fixed B-mode images. Fixed B-mode images use less computing time.
- the different gating times are typically adjustable to sub-regions of interest of the object, e.g. a sub-region with a flaw. The resulting C-mode image is easier to be read by a user.
- B-scan and “B-mode image” are used as a term for B-mode images having parallel lines.
- S-mode images (“S-scan”) is used for scans or images having lines being tilted. The principles disclosed in connection with B-mode images may also be used for S-mode images.
- FIG. 2 a partly sectional schematic view of a typical ultrasonic testing device 100 used for testing an object 110 is shown.
- the embodiment of the ultrasonic testing device 100 of FIG. 2 corresponds to the ultrasonic testing device 100 of FIG. 1 .
- the embodiment of the ultrasonic testing device 100 of FIG. 2 includes some additional features.
- the gating unit 170 shown in FIG. 2 comprises a storage device 175 .
- the storage device 175 is used to store the gating times used for the different scan regions 150 - 161 .
- the gating unit 170 applies the different gating times depending on the respective scan regions 150 - 161 .
- the gating times would typically be adjusted to include the flaw 120 . According to embodiments, it's the vicinity but not all of the rest of the scanned volume of the object 110 would also be included by the gating times.
- the gating unit and eventually the storage device are part of a computer, e.g. a personal computer, a desktop computer or an embedded system, wherein the computer is typically additionally used for further processing of the gated signals produced by the gating unit.
- a stand-alone gating unit which is not necessarily part of a computer.
- a computer may be used as an output device, e.g. for a B-mode image or a C-mode image.
- a stand-alone gating unit is more flexible to use in connection with an ultrasonic scanner working in real time.
- the electrical signals are transferred to a signal processor 180 .
- the signal processor 180 is configured to generate a B-mode image using the electrical signals.
- the electrical signals are represented by lines that are color coded.
- the lines are restricted to the area given by the gating times used in the gating unit 170 .
- a gating threshold is applied by the signal processor 180 .
- the gating threshold can be used to trigger an evaluation of the object in a further processing step after the scanning. For instance, the evaluation can be triggered in case the amplitude of the electrical signal between the gating times gets higher than the gating threshold.
- A-mode images are representations over time of the ultrasonic echoes received by the probe.
- the amplitude of the received signal, i.e., of the electrical signal, is depicted over time.
- the B-mode image produced by the signal processor 180 is displayed on a display 190 .
- A-mode images or B-mode images are displayed as a live curve on the display 190 .
- the display 190 is capable of displaying a C-mode image using the gated signals of the gating unit 170 .
- the gating times are used to confine the electrical signal to an area of interest. Only the part of the electrical signal between the two gating times is used for an evaluation process or for processing a C-mode image.
- a number of A-mode images can be used to generate a B-mode image by depicting the several A-mode images as color coded lines. Thereby, the color can represent the amplitude. By arranging several of such lines one next to the other, the B-mode image is generated.
- the gating times may be represented by gating lines or gating areas, wherein fixed gating times for all electrical signals of all scan regions lead to gating lines which are perpendicular to the lines of the A-mode images.
- different gating times can be set for different scan regions or different electrical signals.
- the gating times represent the boundary of the object or a boundary between two layers of material of the object.
- Such boundaries produce echoes.
- echoes produced by these boundaries do not necessarily represent damages or flaws but may be used for geometry monitoring or other evaluations. In this case, these echoes are part of a gating time.
- the gating threshold is a fixed value. Thereby, flaws may be reliably detected.
- the gating threshold may be different for different scans, scanning regions, electrical signals, or A-mode images. Gating thresholds being different for different scan regions allow a more confined analysis of the object. By way of example, the gating threshold can be adjusted to different materials in different layers of the material.
- a fixed gating time for all electrical signals is depicted in the B-mode image as a line being perpendicular to the several lines representing the A-mode images.
- the curve may be tilted or may even have jumps or be curved.
- curve and gating line are used for curves or straight lines representing the gating times in the B-mode image.
- the display 190 is part of a computer 200 .
- a mouse 210 and a keyboard 220 or other kinds of Human Interface devices like trackballs are connected to the computer.
- An input is received from a user by using the mouse 210 and the keyboard 220 .
- the gating time or the several gating times are adjusted depending on the input. These adjusted gating times are displayed on the display, e.g., by adjusting the curve representing the gating times.
- Receiving the input from a user typically includes detecting at least one position of a cursor on the display.
- the position of the cursor may be altered by a user using the mouse or the keyboard.
- the curve is calculated depending on the at least one cursor position and subsequently, the curve is drawn on the display. Thereby, the user can easily see which areas are gated by the gating times.
- the gating threshold can be input by a user. Thereby, the user may adjust the gating threshold for different regions of the object, e.g., in case the object comprises several layers including different materials. Moreover, known flaws may be gated out by adjusting the gating times or the gating threshold. Further exemplary embodiments described herein include a threshold which can vary over the scanned area. By doing so, known local areas producing a high amplitude ultrasonic echo can be ruled out.
- a free form surface is calculated based on the at least one cursor position.
- the free form surface is drawn on the display.
- the free form surface may be used to calculate the gating times or the threshold based on the coordinates of the free form surface. This allows a free definition of the threshold using the free form surface defined by the input of the user. An adequate visualization for this may also be done by a three dimensional B-scan or a three-dimensional B-mode image.
- a graphic user interface is used for receiving the input of the user.
- a graphic user interface allows information to be input into the computer used for displaying the B-mode image with the curve representing the gating times.
- a free form surface can easily be input using a graphic user interface.
- FIG. 3 embodiments of a transducer 230 are shown.
- the transducer 230 shown in FIG. 3 uses a phased array ultrasonic probe and is intended to be used in connection with the ultrasonic devices described herein.
- the transducer 230 replaces the transducer 130 .
- the phased array technique of the transducer 230 allows a scanning of a region of the object 110 by using overlapping fields. The overlapping fields are produced with different phasing for scanning different regions of the object 110 . Therefore, a movement of the transducer 230 along a longitudinal moving direction is not necessary to scan a 2D-region of the object 110 .
- the scan regions 150 - 161 may be tilted when using a phased array ultrasonic probe with the transducer 230 .
- the tilted scan regions 150 - 161 are shown in FIG. 3 .
- the flaw 120 can clearly be detected.
- the tilted scan regions 150 - 161 are typically considered by plotting the several lines not in a parallel manner.
- the several lines representing color coded A-mode images are plotted with the tilting angle which has been used in scanning the object with the phased array ultrasonic probe.
- phased array ultrasonic probes scanning a 2D region, as well as phased array ultrasonic probes scanning a 3D region, may be applied.
- the scanning of a 2D or a 3D region with a phased array ultrasonic probe may be faster.
- a phased array probe may be more comfortable for the user or provide an increased level of test-information.
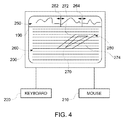
- the computer 200 with the display 190 of FIG. 3 is shown in FIG. 4 in more detail.
- an A-mode image 250 and a B-mode image 260 having parallel lines are shown on the display 190 in FIG. 4 .
- the A-mode image 250 is in the upper part of the display 190 .
- the shown graph is the amplitude of the ultrasonic echo depicted over time. It should be noted that the time corresponds to the depth in the object 110 , since the running time of the ultrasonic signal is proportional to the depth.
- Two vertical lines represent the gating times, namely a gating start time 262 and a gating finish time 264 .
- the gating times 262 , 264 can be adjusted for different A-mode images or different electrical signals.
- the B-mode image 260 is displayed on the display 190 .
- the B-mode image 260 is an addition of multiple A-mode images, one of which is the A-mode image 250 depicted in the upper part of the display 190 .
- the B-mode image 260 is a classical B-mode image having parallel lines and has gating times which are confined to the flaw 120 . It should be noted that the flaw 120 is only shown for the sake of clarity in FIG. 4 . Typically, the flaw 120 cannot be seen on the display 190 but the position of the flaw 120 is identifiable by the color coding of the B-mode image 260 . In the black and white depiction of FIG. 4 , the flaw 120 is explicitly shown in FIG. 4 .
- a polygon 270 is shown in the B-mode image 260 .
- a left boundary 272 and a right boundary 274 of the polygon 270 represent the gating times applied to the electrical signals in the B-mode image 260 .
- a cursor 280 is shown in FIG. 4 .
- the cursor 280 can be moved by moving the mouse 210 as known from a personal computer.
- a user may alter the position of the polygon 270 .
- the lines or boundaries 272 and 274 of the polygon 270 correspond to the curve, based on which in typical embodiments the gating times are calculated. Hence, by altering the position or the form of the polygon 270 , a user may adjust the gating times.
- a polygon can be shown in the B-mode image or S-mode image representing the boundaries which are used for the calculation of the gating times. This means, that the gating of the electrical signals depends on the coordinates of the boundaries in the B-mode image or S-mode image.
- the boundaries represent the above mentioned “curves”.
- FIG. 5 shows the same setup as FIG. 4 , wherein the display 190 is used to display an S-mode image 290 as a special, “scan—geometry correlated”, form of a B-mode image.
- the S-mode image is based on a scan using the phased array probe 230 of FIG. 3 .
- the difference to the B-mode 260 image shown in FIG. 4 is a presentation of the A-scans in the correct angle.
- the signal processing must be able to identify the angles used by the phased array probe during scanning of the object 110 . All other features shown in FIG. 4 apply to the setup shown in FIG. 4 as well, especially the polygon 270 being used for identifying gated region of the object 110 .
- the gating times are calculated based on the lines or boundaries of the polygon 270 .
- a free form surface 300 in connection with a detail of FIG. 2 is shown.
- a free form surface may be used to set gating times and thresholds depending on the region of interest of the object 110 .
- the free form surface 300 may be drawn by a use of the cursor 280 using the mouse 210 . By doing so the adjustment of a varying threshold over a region of interest is facilitated.
- FIG. 7 a method of a typical embodiment described herein is shown in a schematic diagram. After the method starts ( 410 ), a first scan of multiple scan regions of the object is carried out ( 420 ).
- the method gates the different electrical signals of the different scans with gating times ( 440 ) for the testing process. Thereby, different gating times are used for every electrical signal.
- the results are gated signals.
- every electrical signal can be depicted as an A-mode image.
- the respective A-mode images are representations of the respective scan regions.
- the gating times depend on the respective scan region. Hence, different gating times are used for the different scan regions.
- gating times are defined, e.g., a gate start time and a gate finish time.
- Typical embodiments use identical gating times for more than one scan region. However, at least one of all of the scan regions has different gating times. Thereby, the computing time for calculating the gating times may be reduced.
- a B-mode image is generated by a signal processor ( 450 ). Subsequently, the B-mode image is displayed on a display for a user. Furthermore, at least one curve is shown on the display ( 460 ). Typically, more than one curve is shown, e.g., a polygon. The curve or boundary represents the gating times in the B-mode image. Thereby, the gating times are displayed for a user together with the B-mode image making recognition of data easy for a user.
- the user may alter the position of the curve or the boundary by using, a cursor ( 470 ). Thereby, the gating times may be adjusted by the User. Gating times are calculated based on the altered positions of the curve ( 480 ). The method jumps back to again to receive data of a new scan and gate the electrical signals of the ultrasonic scan with the newly calculated gating times based on the altered positions of the curve. The method may be stopped by the user in case the user does not alter the position of the curve, i.e. the Rating times.
- the method starts with producing a B-mode image.
- the B-mode image is shown on the display with preliminary boundaries for gating times to enable the user to set the curves representing the boundaries for an area of interest. These boundaries or curves are used to calculate gating times.
- a C-mode image may be produced or other processing may be carried out.
- Typical embodiments allow a further alteration of the at least one boundary in the B-mode image.
- the gating times are recalculated.
- the B-mode image is typically a live image, wherein the scanning of the object is repeated.
- Typical embodiments present a classical B-mode image having parallel lines to the user. All features named with the presentation or processing of a B-mode image may be applied to S-mode images as well.
- an S-mode image is a special form of a B-mode image, wherein the only difference is a presentation of the data with the angles used during scanning, e.g., by a phased array probe.
Abstract
Description
Claims (17)
Priority Applications (1)
| Application Number | Priority Date | Filing Date | Title |
|---|---|---|---|
| US13/252,435 US8770029B2 (en) | 2011-10-04 | 2011-10-04 | Method and apparatus for ultrasonic testing |
Applications Claiming Priority (1)
| Application Number | Priority Date | Filing Date | Title |
|---|---|---|---|
| US13/252,435 US8770029B2 (en) | 2011-10-04 | 2011-10-04 | Method and apparatus for ultrasonic testing |
Publications (2)
| Publication Number | Publication Date |
|---|---|
| US20130081468A1 US20130081468A1 (en) | 2013-04-04 |
| US8770029B2 true US8770029B2 (en) | 2014-07-08 |
Family
ID=47991374
Family Applications (1)
| Application Number | Title | Priority Date | Filing Date |
|---|---|---|---|
| US13/252,435 Expired - Fee Related US8770029B2 (en) | 2011-10-04 | 2011-10-04 | Method and apparatus for ultrasonic testing |
Country Status (1)
| Country | Link |
|---|---|
| US (1) | US8770029B2 (en) |
Families Citing this family (4)
| Publication number | Priority date | Publication date | Assignee | Title |
|---|---|---|---|---|
| CN105102975B (en) * | 2013-04-02 | 2017-08-15 | 杰富意钢铁株式会社 | Defect detection on ultrasonic basis and ultrasonic flaw detecting device |
| DE102014106005A1 (en) * | 2014-04-29 | 2015-10-29 | Ge Sensing & Inspection Technologies Gmbh | Method for non-destructive testing of a workpiece by means of ultrasound and device for this purpose |
| CN106568842B (en) * | 2016-10-14 | 2019-02-26 | 陕西师范大学 | A kind of ware ultrasonic wave anti-counterfeiting identification method based on weighted euclidean distance |
| CN111855809B (en) * | 2020-07-20 | 2022-07-26 | 大连理工大学 | Crack morphology reconstruction method based on compound mode full focusing |
Citations (36)
| Publication number | Priority date | Publication date | Assignee | Title |
|---|---|---|---|---|
| US3610820A (en) * | 1967-01-13 | 1971-10-05 | Akad Tekn Videnskaber | Method and system for recording, reproducing and analyzing picture information by ultrasonic-pulse-echo sectional view examinations |
| US3857052A (en) * | 1972-04-28 | 1974-12-24 | Rockwell International Corp | Inspection and analysis system |
| US3999422A (en) * | 1974-05-17 | 1976-12-28 | Krautkramer-Branson, Incorporated | Ultrasonic test method and apparatus for testing thick-walled workpieces |
| US4106346A (en) * | 1977-03-23 | 1978-08-15 | Terrance Matzuk | Grey-level ultrasonic imaging |
| US4312229A (en) * | 1979-04-24 | 1982-01-26 | Westinghouse Electric Corp. | Detection, characterization, and study of flaws in work with acoustic energy |
| US4372323A (en) * | 1979-07-20 | 1983-02-08 | Tokyo Shibaura Denki Kabushiki Kaisha | Ultrasonic diagnosing apparatus |
| US4437348A (en) * | 1981-06-08 | 1984-03-20 | Tokyo Shibaura Denki Kabushiki Kaisha | Ultrasonic imaging apparatus |
| US4457178A (en) * | 1981-06-23 | 1984-07-03 | Matix Industries, Inc. | Process and apparatus for testing of rails by ultrasound |
| US4471449A (en) * | 1980-11-03 | 1984-09-11 | Hewlett-Packard Company | Scan converter system |
| US4608868A (en) * | 1985-03-22 | 1986-09-02 | Sri International | Ultrasonic reflex transmission imaging method and apparatus |
| US4653328A (en) * | 1985-04-24 | 1987-03-31 | North American Philips Corporation | Method and apparatus for echo-ultrasound imaging using compound AM-FM detection with increased dynamic range |
| US4730495A (en) * | 1985-03-22 | 1988-03-15 | Sri International | Ultrasonic reflex transmission imaging method and apparatus |
| US4768155A (en) * | 1985-01-19 | 1988-08-30 | Hitachi Construction Machinery Co., Ltd. | Supersonic flaw detecting system |
| US4836026A (en) * | 1984-06-01 | 1989-06-06 | Science Applications International Corporation | Ultrasonic imaging system |
| US4862892A (en) * | 1988-07-18 | 1989-09-05 | Sri International | Ultrasonic reflex transmission imaging method and apparatus with artifact removal |
| US4894806A (en) * | 1986-04-03 | 1990-01-16 | Canadian Patents & Development Ltd. | Ultrasonic imaging system using bundle of acoustic waveguides |
| US4947351A (en) * | 1988-05-06 | 1990-08-07 | The United States Of America As Represented By The Secretary Of The Air Force | Ultrasonic scan system for nondestructive inspection |
| US5119678A (en) * | 1989-12-26 | 1992-06-09 | General Electric Company | Pulse echo and through transmission ultra-sound |
| US5203335A (en) * | 1992-03-02 | 1993-04-20 | General Electric Company | Phased array ultrasonic beam forming using oversampled A/D converters |
| US5230340A (en) * | 1992-04-13 | 1993-07-27 | General Electric Company | Ultrasound imaging system with improved dynamic focusing |
| US5235982A (en) * | 1991-09-30 | 1993-08-17 | General Electric Company | Dynamic transmit focusing of a steered ultrasonic beam |
| US5313947A (en) * | 1985-02-08 | 1994-05-24 | University Patents, Inc. | CW and pulsed doppler diagnostic system |
| US5381693A (en) * | 1991-04-26 | 1995-01-17 | Canon Kabushiki Kaisha | Ultrasonic imaging apparatus with synthesized focus and setting range markings |
| US5481917A (en) * | 1993-01-06 | 1996-01-09 | Hitachi Construction Machinery Co., Ltd. | Ultrasonic inspection and imaging instrument |
| US5750895A (en) * | 1995-07-12 | 1998-05-12 | The United States Of America As Represented By The Administrator Of The National Aeronautics And Space Administration | Method and apparatus for dual amplitude dual time-of-flight ultrasonic imaging |
| US6443896B1 (en) * | 2000-08-17 | 2002-09-03 | Koninklijke Philips Electronics N.V. | Method for creating multiplanar ultrasonic images of a three dimensional object |
| US20030167849A1 (en) * | 2002-03-11 | 2003-09-11 | Noboru Yamamoto | Ultrasonic inspection apparatus |
| US20040118210A1 (en) * | 2002-10-31 | 2004-06-24 | Masahiro Tooma | Ultrasonic array sensor, ultrasonic inspection instrument and ultrasonic inspection method |
| US20070266790A1 (en) * | 2006-05-16 | 2007-11-22 | Natarajan Gunasekaran | Ultrasonic testing system and method for ceramic honeycomb structures |
| US7617730B2 (en) * | 2006-06-28 | 2009-11-17 | The Boeing Company | Ultrasonic inspection and repair mode selection |
| US20100101326A1 (en) * | 2007-02-28 | 2010-04-29 | Jfe Steel Corporation | Ultrasonic flaw detection apparatus and ultrasonic flaw detection method for pipe |
| US7753847B2 (en) * | 2003-10-03 | 2010-07-13 | Mayo Foundation For Medical Education And Research | Ultrasound vibrometry |
| US7779694B2 (en) * | 2005-11-21 | 2010-08-24 | Jfe Steel Corporation | Ultrasonic testing system and ultrasonic testing technique for pipe member |
| US7849747B2 (en) * | 2008-03-07 | 2010-12-14 | Umicore Ag & Co. Kg | Flaw detection in exhaust system ceramic monoliths |
| US7917317B2 (en) * | 2006-07-07 | 2011-03-29 | Sonix, Inc. | Ultrasonic inspection using acoustic modeling |
| US8286467B2 (en) * | 2007-06-07 | 2012-10-16 | Mayo Foundation For Medical Education And Research | Method for imaging surface roughness using acoustic emissions induced by ultrasound |
-
2011
- 2011-10-04 US US13/252,435 patent/US8770029B2/en not_active Expired - Fee Related
Patent Citations (36)
| Publication number | Priority date | Publication date | Assignee | Title |
|---|---|---|---|---|
| US3610820A (en) * | 1967-01-13 | 1971-10-05 | Akad Tekn Videnskaber | Method and system for recording, reproducing and analyzing picture information by ultrasonic-pulse-echo sectional view examinations |
| US3857052A (en) * | 1972-04-28 | 1974-12-24 | Rockwell International Corp | Inspection and analysis system |
| US3999422A (en) * | 1974-05-17 | 1976-12-28 | Krautkramer-Branson, Incorporated | Ultrasonic test method and apparatus for testing thick-walled workpieces |
| US4106346A (en) * | 1977-03-23 | 1978-08-15 | Terrance Matzuk | Grey-level ultrasonic imaging |
| US4312229A (en) * | 1979-04-24 | 1982-01-26 | Westinghouse Electric Corp. | Detection, characterization, and study of flaws in work with acoustic energy |
| US4372323A (en) * | 1979-07-20 | 1983-02-08 | Tokyo Shibaura Denki Kabushiki Kaisha | Ultrasonic diagnosing apparatus |
| US4471449A (en) * | 1980-11-03 | 1984-09-11 | Hewlett-Packard Company | Scan converter system |
| US4437348A (en) * | 1981-06-08 | 1984-03-20 | Tokyo Shibaura Denki Kabushiki Kaisha | Ultrasonic imaging apparatus |
| US4457178A (en) * | 1981-06-23 | 1984-07-03 | Matix Industries, Inc. | Process and apparatus for testing of rails by ultrasound |
| US4836026A (en) * | 1984-06-01 | 1989-06-06 | Science Applications International Corporation | Ultrasonic imaging system |
| US4768155A (en) * | 1985-01-19 | 1988-08-30 | Hitachi Construction Machinery Co., Ltd. | Supersonic flaw detecting system |
| US5313947A (en) * | 1985-02-08 | 1994-05-24 | University Patents, Inc. | CW and pulsed doppler diagnostic system |
| US4608868A (en) * | 1985-03-22 | 1986-09-02 | Sri International | Ultrasonic reflex transmission imaging method and apparatus |
| US4730495A (en) * | 1985-03-22 | 1988-03-15 | Sri International | Ultrasonic reflex transmission imaging method and apparatus |
| US4653328A (en) * | 1985-04-24 | 1987-03-31 | North American Philips Corporation | Method and apparatus for echo-ultrasound imaging using compound AM-FM detection with increased dynamic range |
| US4894806A (en) * | 1986-04-03 | 1990-01-16 | Canadian Patents & Development Ltd. | Ultrasonic imaging system using bundle of acoustic waveguides |
| US4947351A (en) * | 1988-05-06 | 1990-08-07 | The United States Of America As Represented By The Secretary Of The Air Force | Ultrasonic scan system for nondestructive inspection |
| US4862892A (en) * | 1988-07-18 | 1989-09-05 | Sri International | Ultrasonic reflex transmission imaging method and apparatus with artifact removal |
| US5119678A (en) * | 1989-12-26 | 1992-06-09 | General Electric Company | Pulse echo and through transmission ultra-sound |
| US5381693A (en) * | 1991-04-26 | 1995-01-17 | Canon Kabushiki Kaisha | Ultrasonic imaging apparatus with synthesized focus and setting range markings |
| US5235982A (en) * | 1991-09-30 | 1993-08-17 | General Electric Company | Dynamic transmit focusing of a steered ultrasonic beam |
| US5203335A (en) * | 1992-03-02 | 1993-04-20 | General Electric Company | Phased array ultrasonic beam forming using oversampled A/D converters |
| US5230340A (en) * | 1992-04-13 | 1993-07-27 | General Electric Company | Ultrasound imaging system with improved dynamic focusing |
| US5481917A (en) * | 1993-01-06 | 1996-01-09 | Hitachi Construction Machinery Co., Ltd. | Ultrasonic inspection and imaging instrument |
| US5750895A (en) * | 1995-07-12 | 1998-05-12 | The United States Of America As Represented By The Administrator Of The National Aeronautics And Space Administration | Method and apparatus for dual amplitude dual time-of-flight ultrasonic imaging |
| US6443896B1 (en) * | 2000-08-17 | 2002-09-03 | Koninklijke Philips Electronics N.V. | Method for creating multiplanar ultrasonic images of a three dimensional object |
| US20030167849A1 (en) * | 2002-03-11 | 2003-09-11 | Noboru Yamamoto | Ultrasonic inspection apparatus |
| US20040118210A1 (en) * | 2002-10-31 | 2004-06-24 | Masahiro Tooma | Ultrasonic array sensor, ultrasonic inspection instrument and ultrasonic inspection method |
| US7753847B2 (en) * | 2003-10-03 | 2010-07-13 | Mayo Foundation For Medical Education And Research | Ultrasound vibrometry |
| US7779694B2 (en) * | 2005-11-21 | 2010-08-24 | Jfe Steel Corporation | Ultrasonic testing system and ultrasonic testing technique for pipe member |
| US20070266790A1 (en) * | 2006-05-16 | 2007-11-22 | Natarajan Gunasekaran | Ultrasonic testing system and method for ceramic honeycomb structures |
| US7617730B2 (en) * | 2006-06-28 | 2009-11-17 | The Boeing Company | Ultrasonic inspection and repair mode selection |
| US7917317B2 (en) * | 2006-07-07 | 2011-03-29 | Sonix, Inc. | Ultrasonic inspection using acoustic modeling |
| US20100101326A1 (en) * | 2007-02-28 | 2010-04-29 | Jfe Steel Corporation | Ultrasonic flaw detection apparatus and ultrasonic flaw detection method for pipe |
| US8286467B2 (en) * | 2007-06-07 | 2012-10-16 | Mayo Foundation For Medical Education And Research | Method for imaging surface roughness using acoustic emissions induced by ultrasound |
| US7849747B2 (en) * | 2008-03-07 | 2010-12-14 | Umicore Ag & Co. Kg | Flaw detection in exhaust system ceramic monoliths |
Also Published As
| Publication number | Publication date |
|---|---|
| US20130081468A1 (en) | 2013-04-04 |
Similar Documents
| Publication | Publication Date | Title |
|---|---|---|
| EP2948766B1 (en) | Transforming a-scan data samples into a three-dimensional space for facilitating visualization of flaws | |
| CN107028623B (en) | Determination of material stiffness using porous ultrasound | |
| JP5090315B2 (en) | Ultrasonic flaw detection apparatus and ultrasonic flaw detection method | |
| JP4776707B2 (en) | Ultrasonic imaging device | |
| US20090293621A1 (en) | Ultrasonic inspection equipment and ultrasonic inspection method | |
| US20130172743A1 (en) | M-mode ultrasound imaging of arbitrary paths | |
| US9140670B2 (en) | Ultrasonic inspection method and ultrasonic inspection device | |
| JP4634336B2 (en) | Ultrasonic flaw detection method and ultrasonic flaw detection apparatus | |
| US8770029B2 (en) | Method and apparatus for ultrasonic testing | |
| McKee et al. | Volumetric imaging through a doubly-curved surface using a 2D phased array | |
| JP2011141124A (en) | Ultrasonic flaw detection device and ultrasonic flaw detection method | |
| JP5814556B2 (en) | Signal processing device | |
| JP5968114B2 (en) | Ultrasonic flaw detection method and ultrasonic flaw detection apparatus | |
| JP2015230227A (en) | Ultrasonic inspection device and ultrasonic inspection method | |
| CN111735526B (en) | Ultrasonic elastography device and shear wave velocity measurement method for elasticity measurement | |
| KR101698746B1 (en) | Phased Array Ultrasonic Testing Device And Testing Method Using Thereof | |
| JP5910641B2 (en) | Ultrasonic imaging method and ultrasonic imaging apparatus | |
| KR20200030463A (en) | Angles for ultrasound-based shear wave imaging | |
| JP6290748B2 (en) | Ultrasonic inspection method and ultrasonic inspection apparatus | |
| US20220341885A1 (en) | Free-encoder positioning system using acoustic features and imu | |
| JP5235028B2 (en) | Ultrasonic flaw detection method and ultrasonic flaw detection apparatus | |
| JP2014149156A (en) | Method and device for ultrasonography | |
| JP2011229708A (en) | Ultrasonograph apparatus and method for calculating the medium sonic speed | |
| JP2017500553A (en) | How to rebuild the surface of a fragment | |
| Baba et al. | DEVELOPMENT OF 3D PHASED ARRAY SYSTEM “3D FOCUS‐UT” |
Legal Events
| Date | Code | Title | Description |
|---|---|---|---|
| AS | Assignment |
Owner name: GE SENSING & INSPECTION TECHNOLOGIES GMBH, GERMANY Free format text: ASSIGNMENT OF ASSIGNORS INTEREST;ASSIGNORS:FALTER, STEPHAN;KOCH, ROMAN;SIGNING DATES FROM 20110817 TO 20110922;REEL/FRAME:027020/0306 Owner name: GENERAL ELECTRIC COMPANY, NEW YORK Free format text: ASSIGNMENT OF ASSIGNORS INTEREST;ASSIGNOR:GE SENSING & INSPECTION TECHNOLOGIES GMBH;REEL/FRAME:027020/0346 Effective date: 20110929 |
|
| STCF | Information on status: patent grant |
Free format text: PATENTED CASE |
|
| CC | Certificate of correction | ||
| MAFP | Maintenance fee payment |
Free format text: PAYMENT OF MAINTENANCE FEE, 4TH YEAR, LARGE ENTITY (ORIGINAL EVENT CODE: M1551) Year of fee payment: 4 |
|
| FEPP | Fee payment procedure |
Free format text: MAINTENANCE FEE REMINDER MAILED (ORIGINAL EVENT CODE: REM.); ENTITY STATUS OF PATENT OWNER: LARGE ENTITY |
|
| LAPS | Lapse for failure to pay maintenance fees |
Free format text: PATENT EXPIRED FOR FAILURE TO PAY MAINTENANCE FEES (ORIGINAL EVENT CODE: EXP.); ENTITY STATUS OF PATENT OWNER: LARGE ENTITY |
|
| STCH | Information on status: patent discontinuation |
Free format text: PATENT EXPIRED DUE TO NONPAYMENT OF MAINTENANCE FEES UNDER 37 CFR 1.362 |
|
| FP | Lapsed due to failure to pay maintenance fee |
Effective date: 20220708 |