US8886477B2 - Reserve capacity calculating apparatus and method therefor, and computer readable medium - Google Patents
Reserve capacity calculating apparatus and method therefor, and computer readable medium Download PDFInfo
- Publication number
- US8886477B2 US8886477B2 US13/234,528 US201113234528A US8886477B2 US 8886477 B2 US8886477 B2 US 8886477B2 US 201113234528 A US201113234528 A US 201113234528A US 8886477 B2 US8886477 B2 US 8886477B2
- Authority
- US
- United States
- Prior art keywords
- power consumption
- sequence
- period
- time
- predicted
- Prior art date
- Legal status (The legal status is an assumption and is not a legal conclusion. Google has not performed a legal analysis and makes no representation as to the accuracy of the status listed.)
- Expired - Fee Related, expires
Links
Images


Classifications
-
- H—ELECTRICITY
- H02—GENERATION; CONVERSION OR DISTRIBUTION OF ELECTRIC POWER
- H02J—CIRCUIT ARRANGEMENTS OR SYSTEMS FOR SUPPLYING OR DISTRIBUTING ELECTRIC POWER; SYSTEMS FOR STORING ELECTRIC ENERGY
- H02J3/00—Circuit arrangements for ac mains or ac distribution networks
-
- H—ELECTRICITY
- H02—GENERATION; CONVERSION OR DISTRIBUTION OF ELECTRIC POWER
- H02J—CIRCUIT ARRANGEMENTS OR SYSTEMS FOR SUPPLYING OR DISTRIBUTING ELECTRIC POWER; SYSTEMS FOR STORING ELECTRIC ENERGY
- H02J3/00—Circuit arrangements for ac mains or ac distribution networks
- H02J3/003—Load forecast, e.g. methods or systems for forecasting future load demand
-
- H—ELECTRICITY
- H02—GENERATION; CONVERSION OR DISTRIBUTION OF ELECTRIC POWER
- H02J—CIRCUIT ARRANGEMENTS OR SYSTEMS FOR SUPPLYING OR DISTRIBUTING ELECTRIC POWER; SYSTEMS FOR STORING ELECTRIC ENERGY
- H02J3/00—Circuit arrangements for ac mains or ac distribution networks
- H02J3/004—Generation forecast, e.g. methods or systems for forecasting future energy generation
-
- H—ELECTRICITY
- H02—GENERATION; CONVERSION OR DISTRIBUTION OF ELECTRIC POWER
- H02J—CIRCUIT ARRANGEMENTS OR SYSTEMS FOR SUPPLYING OR DISTRIBUTING ELECTRIC POWER; SYSTEMS FOR STORING ELECTRIC ENERGY
- H02J2310/00—The network for supplying or distributing electric power characterised by its spatial reach or by the load
- H02J2310/10—The network having a local or delimited stationary reach
- H02J2310/12—The local stationary network supplying a household or a building
- H02J2310/14—The load or loads being home appliances
-
- Y—GENERAL TAGGING OF NEW TECHNOLOGICAL DEVELOPMENTS; GENERAL TAGGING OF CROSS-SECTIONAL TECHNOLOGIES SPANNING OVER SEVERAL SECTIONS OF THE IPC; TECHNICAL SUBJECTS COVERED BY FORMER USPC CROSS-REFERENCE ART COLLECTIONS [XRACs] AND DIGESTS
- Y02—TECHNOLOGIES OR APPLICATIONS FOR MITIGATION OR ADAPTATION AGAINST CLIMATE CHANGE
- Y02B—CLIMATE CHANGE MITIGATION TECHNOLOGIES RELATED TO BUILDINGS, e.g. HOUSING, HOUSE APPLIANCES OR RELATED END-USER APPLICATIONS
- Y02B70/00—Technologies for an efficient end-user side electric power management and consumption
- Y02B70/30—Systems integrating technologies related to power network operation and communication or information technologies for improving the carbon footprint of the management of residential or tertiary loads, i.e. smart grids as climate change mitigation technology in the buildings sector, including also the last stages of power distribution and the control, monitoring or operating management systems at local level
- Y02B70/3225—Demand response systems, e.g. load shedding, peak shaving
-
- Y—GENERAL TAGGING OF NEW TECHNOLOGICAL DEVELOPMENTS; GENERAL TAGGING OF CROSS-SECTIONAL TECHNOLOGIES SPANNING OVER SEVERAL SECTIONS OF THE IPC; TECHNICAL SUBJECTS COVERED BY FORMER USPC CROSS-REFERENCE ART COLLECTIONS [XRACs] AND DIGESTS
- Y04—INFORMATION OR COMMUNICATION TECHNOLOGIES HAVING AN IMPACT ON OTHER TECHNOLOGY AREAS
- Y04S—SYSTEMS INTEGRATING TECHNOLOGIES RELATED TO POWER NETWORK OPERATION, COMMUNICATION OR INFORMATION TECHNOLOGIES FOR IMPROVING THE ELECTRICAL POWER GENERATION, TRANSMISSION, DISTRIBUTION, MANAGEMENT OR USAGE, i.e. SMART GRIDS
- Y04S20/00—Management or operation of end-user stationary applications or the last stages of power distribution; Controlling, monitoring or operating thereof
- Y04S20/20—End-user application control systems
- Y04S20/222—Demand response systems, e.g. load shedding, peak shaving
Definitions
- Embodiments of the present invention relate to a reserve capacity calculating apparatus and a reserve capacity calculating method, and a computer readable medium for storing a computer program, for example, and relate to, in a demand response (DR) system that requests a customer to restrain power consumption, a reserve capacity calculating apparatus that calculates reducible reserve power (reserve capacity) of the customer before the DR is carried out.
- DR demand response
- Standardization organizations such as OASIS (OpenADR) and ZigBee are promoting automated processing systems for reducing power consumption during critical periods of peak power demand, in which a DRAS (a demand response automated server) located at an electric power company side transmits a power consumption reduction signal (a DR signal) to an EMS (energy managing system) installed at a customer side.
- a DRAS a demand response automated server located at an electric power company side transmits a power consumption reduction signal (a DR signal) to an EMS (energy managing system) installed at a customer side.
- a method has conventionally been proposed, in which determination is made to how equipment of each customer should be controlled, on the basis of indicators such as comfort and an electric power rate, and a daily load curve is calculated to schedule the total amount of demand to be restrained.
- a method of changing a plan on the basis of each customer's activity of a particular day has not been proposed.
- a method of calculating reducible reserve power (reserve capacity) of each customer when a plan is changed has not been proposed.
- FIG. 1 illustrates an electric power managing system including a reserve capacity calculating apparatus according to an embodiment
- FIG. 2 illustrates an example of a temperature history DB
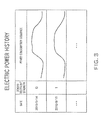
- FIG. 3 illustrates an example of an electric power history DB
- FIG. 4 illustrates an example of a predicted parameter DB
- FIG. 5 illustrates an example of a hardware configuration of the reserve capacity calculating apparatus
- FIG. 6 illustrates an example of a communication procedure performed between components of the reserve capacity calculating apparatus
- FIG. 7 illustrates an example of a procedure of a power consumption distribution calculator
- FIG. 8 illustrates an example of identifying a similar outdoor temperature sequence
- FIG. 9 illustrates an example of identifying a similar power consumption sequence
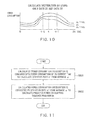
- FIG. 10 illustrates an example of calculating an average value and a standard deviation
- FIG. 11 illustrates an example of a procedure of a power consumption predicting unit
- FIG. 12 schematically illustrates an example of calculating a deviation rate and a predicted value
- FIG. 13 illustrates an example of a procedure of a predicted parameter learning unit
- FIG. 14 is a diagram for explaining processing of the predicted parameter learning unit
- FIG. 15 is a diagram for explaining processing of a reserve capacity calculating unit
- FIG. 16 illustrates a reserve capacity calculating apparatus according to a second embodiment of the present invention
- FIG. 17 illustrates a reserve capacity calculating apparatus according to a third embodiment of the present invention.
- FIG. 18 illustrates an example of a living information history DB.
- a reserve capacity calculating apparatus According to an aspect of embodiments, there is provided a reserve capacity calculating apparatus.
- the apparatus includes a reference power consumption receiver, an electric power history database, a temperature history database, a power consumption distribution calculator, a power consumption predicting unit and a reserve capacity calculating unit.
- the reference power consumption receiver receives from a demand restraint calculating apparatus a reference power consumption sequence being a power consumption sequence of a first date planned for a customer.
- the electric power history database stores therein a power consumption sequence of the customer and demand restraint strength with each date, the power consumption sequence being measured by a power measuring instrument.
- the temperature history database stores therein an outdoor temperature sequence of a customer house with each date, the outdoor temperature sequence being measured by a temperature sensor.
- the power consumption distribution calculator uses a predicted outdoor temperature sequence given previously of the customer house for a prediction period at the first date from a first time to a second time being later than the first time, (b) identifies, in the temperature history database, dates having a sequence part similar to the predicted outdoor temperature sequence in the prediction period, (c) identifies, with identified dates, in the electric power history database, power consumption sequences having same demand restraint strength as that of the first date, and (d) calculates a statistical distribution or a representative value of identified power consumption sequences for a whole period from a third time to the second time, the third time being earlier than the first time.
- the power consumption predicting unit calculates a predicted power consumption sequence in the prediction period using the power consumption sequence measured for a history used period from the third time to the first time at the first date and the statistical distribution or the representative value.
- the reserve capacity calculating unit calculates reserve capacity being a difference between a predicted power consumption sequence and a sequence part in the prediction period of the reference power consumption sequence, and to transmit the reserve capacity to the demand restraint calculating apparatus.
- FIG. 1 illustrates an electric power managing system including a reserve capacity calculating apparatus 101 according to an embodiment.
- the electric power managing system includes the reserve capacity calculating apparatus 101 , a temperature sensor 102 , and a power measuring instrument 104 which are located at a customer 100 side.
- the electric power managing system also includes a supply-and-demand controlling server 130 located at an electric power company side and a temperature predicting server 120 located at a wide area network such as the Internet.
- the temperature predicting server 120 includes a temperature predicting apparatus 121 .
- the temperature predicting apparatus 121 predicts outdoor temperature and stores therein the predicted outdoor temperature. The prediction may be carried out on a regional basis, an address basis, or a division of land basis.
- the temperature predicting apparatus 121 transmits, in response to a request from the reserve capacity calculating apparatus 101 , the predicted outdoor temperature data to the customer (an address of the customer or an area including the customer). Specifically, the temperature predicting apparatus 121 transmits outdoor temperature data such as transition data of the outdoor temperature of this whole day or transition data of the outdoor temperature in a period between the time at which the request is made and the end of this day.
- the supply-and-demand controlling server 130 includes a demand restraint calculating apparatus 131 . While a demand restraint plan or a supply-and-demand plan is implemented, the demand restraint calculating apparatus 131 calculates a power consumption sequence (a reference power consumption sequence) of each customer and notifies each customer of the calculated sequence.
- the reference power consumption is calculated on the basis of temperature or some other influence.
- the reference power consumption is represented as a transition of demand for power consumed on a day-to-day basis (24 hours), for example. As described later, FIG. 15 illustrates an example of the reference power consumption.
- the reserve capacity calculating apparatus 101 includes a temperature history DB (database) 103 , an electric power history DB 105 , a power consumption distribution calculator 106 , a predicted parameter DB 107 , a power consumption predicting unit 108 , a reference power consumption receiver 109 , a reserve capacity calculating unit 110 , and a predicted parameter learning unit 111 .
- the reserve capacity calculating apparatus 101 communicates with the temperature sensor 102 , the power measuring instrument 104 , the temperature predicting apparatus 121 , and the demand restraint calculating apparatus 131 to receive data from and exchange data with them.
- the temperature sensor 102 measures the outdoor temperature of the customer house at constant intervals and transmits the measured values to the reserve capacity calculating apparatus 101 .
- the temperature sensor 102 may include an internal memory unit that stores the measured values.
- the temperature history DB 103 stores the sequence of the outdoor temperature measured by the temperature sensor 102 for each date.
- FIG. 2 illustrates an example of the temperature history DB 103 .
- the temperature history DB 103 stores the transitions of the outdoor temperature on a day-to-day basis (every 24 hours).
- the history of the stored outdoor temperatures is used by the power consumption distribution calculator 106 .
- the power measuring instrument 104 measures the power consumed in the customer house by the customer (e.g., equipment in the house) at constant intervals.
- the electric power history DB 105 stores the sequence of the power consumption measured by the power measuring instrument 104 for each date with a demand restraint strength (including “no demand restraint”). That is, the electric power history DB 105 stores the power consumption sequences of the customer on a day-to-day basis (every 24 hours).
- a value of the demand restraint strength represents a degree of requested demand restraint. It should be noted that it is not essential that the demand restraint strength should be used.
- FIG. 3 illustrates an example of the electric power history DB 105 .
- the history of the stored power consumption sequences is used in the power consumption distribution calculator 106 , the power consumption predicting unit 108 , and the predicted parameter learning unit 111 .
- the predicted parameter DB 107 stores a parameter (a history used period length) with each set of a time (a current time) and a predicted period length, the parameters being used by the power consumption distribution calculator 106 and the power consumption predicting unit 108 .
- FIG. 4 illustrates an example of the predicted parameter DB 107 .
- the demand restraint strength may further be included in the predicted parameter DB 107 .
- the predicted period length is a length of period for which consumption of electric power will be predicted.
- the time (current time) is a time at which the prediction processing is executed.
- the history used period length is an interval length in past data, and when the power consumption distribution calculator 106 performs matching between power consumption sequences or between temperature sequences, this interval length of the past data gone back from the current time is used (as described in detail later).
- the predicted parameter learning unit 111 predicts a parameter (a history used period length) of each time using the electric power history DB 105 for each of all variations of the predicted period lengths notified by the demand restraint calculating apparatus 131 .
- the predicted parameter learning unit 111 stores the parameter (the history used period length) calculated for each time and each predicted period length in the predicted parameter DB 107 .
- the power consumption distribution calculator 106 identifies past days on which the transition of the outdoor temperature is similar to that in this day by waveform matching on the basis of the predicted parameter DB 107 , the temperature history DB 103 , and the predicted period length notified by the demand restraint calculating apparatus 131 . Then, the power consumption distribution calculator 106 identifies, in the electric power history DB 105 from the power consumption sequences in the identified past days, power consumption sequences having the same demand restraint strength as that of the day and electric power consumption transitions similar to the power consumption transition in this day by waveform matching. If the demand restraint strength is not used, similar sequences may be identified by only waveform matching. Incidentally, demand restraint strength may be received from the demand restraint calculating apparatus 131 or the demand restraint strength may given by another arbitrary method.
- the period of matching is determined as follows. First, a history used period length is obtained from the predicted parameter DB 107 . At this time, a predicted period length and a demand restraint strength are obtained from the demand restraint calculating apparatus 131 , and a history used period length is obtained from the predicted parameter DB 107 with the current time, and the obtained predicted period length and the demand restraint strength used as a key. It should be noted that it is not essential that the demand restraint strength should be used.
- a period from a time before the history used period length (a third time) with respect to a current time (a first time) to the current time is defined as a history used period. It is also assumed that a period (interval) from the current time “t” to a time after the predicted period length (a second time) is defined as a prediction period. Furthermore, it is also assumed that a period obtained by adding the history used period and the prediction period together is defined as a whole period. Where the current time is “t,” the history used period length is “S,” and the predicted period length is “T,” the third time and the second time can be expressed as “t ⁇ S” and “t+T,” respectively.
- the matching of the temperature sequences is performed, for example, in the total period (“t ⁇ S” to “t+T”) and the matching of the power consumption sequences is performed, for example, in the history used period.
- the temperature sequence of this day in the prediction period of the total period data from the temperature predicting apparatus is used.
- the power consumption distribution calculator 106 transmits the information of the calculated averages and standard deviations to the power consumption predicting unit 108 .
- the power consumption predicting unit 108 predicts power consumption in the prediction period (the current time “t” to “t+T”) on the basis of the averages and standard deviations calculated by the power consumption distribution calculator 106 , the predicted parameter DB 107 , and the electric power history DB 105 . Specifically, the power consumption predicting unit 108 uses the average values and standard deviations calculated for the past history used period (the time “t ⁇ S” to the current time “t”) to calculate a deviation rate from the average values with respect to the power consumption sequence of this day.
- the deviation rate and the standard deviations in the prediction period are used to correct the average values of this day calculated at constant intervals from the current time “t” to the time “t+T.”
- the sequence of the corrected values is obtained as a predicted sequence of the power consumption.
- the power consumption predicting unit 108 transmits the obtained predicted power consumption sequence to the reserve capacity calculating unit 110 .
- the reference power consumption receiver 109 obtains, from the demand restraint calculating apparatus 131 , a power consumption sequence (a reference power consumption sequence) planned for a customer of interest.
- the reference power consumption receiver 109 transmits the obtained reference power consumption sequence to the reserve capacity calculating unit 110 .
- the reserve capacity calculating unit 110 calculates as reserve capacity, a difference between the predicted power consumption sequence calculated by the power consumption predicting unit 108 and the reference power consumption sequence received by the reference power consumption receiver 109 in the interval from the current time “t” and the predicted period length T.
- the reserve capacity calculating unit 110 transmits the calculated reserve capacity to the demand restraint calculating apparatus 131 .
- FIG. 5 illustrates an example of a hardware configuration of the reserve capacity calculating apparatus 101 .
- the same reference numerals are used for denoting the same components in FIG. 1 , and a redundant description thereof is omitted.
- the reserve capacity calculating apparatus 101 can be realized by using a computer apparatus as basic hardware.
- the computer apparatus includes, as illustrated in FIG. 5 , a CPU 203 , an input unit 204 , a display unit 205 , a communication unit 206 , a main memory unit 207 , and an external memory unit 208 . These components are connected and communicated with each other via a bus 202 .
- the input unit 204 includes an input device such as a keyboard and a mouse and outputs an operation signal generated from the input device to the CPU 203 .
- the display unit 205 is composed of a display such as an LCD (Liquid Crystal Display) and a CRT (Cathode Ray Tube).
- LCD Liquid Crystal Display
- CRT Cathode Ray Tube
- the communication unit 206 includes communication means such as Ethernet (registered trademark), a wireless LAN (Local Area Network), Bluetooth (registered trademark), and ZigBee (registered trademark), and communicates with the temperature sensor 102 , the power measuring instrument 104 , the temperature predicting server 120 , and the supply-and-demand controlling server 130 .
- communication means such as Ethernet (registered trademark), a wireless LAN (Local Area Network), Bluetooth (registered trademark), and ZigBee (registered trademark), and communicates with the temperature sensor 102 , the power measuring instrument 104 , the temperature predicting server 120 , and the supply-and-demand controlling server 130 .
- the external memory unit 208 is composed of a storage medium such as a hard disk drive or a CD-R, a CD-RW, a DVD-RAM, and a DVD-R, and stores a controlling program to cause the CPU 203 to execute the processing of the power consumption distribution calculator 106 , the power consumption predicting unit 108 , the reference power consumption receiver 109 , and the reserve capacity calculating unit 110 .
- the storage medium stores as data the temperature history DB 103 , the electric power history DB 105 , the predicted parameter DB 107 , and the like.
- the main memory unit 207 is composed of memory or the like.
- the main memory unit 207 deploys the controlling program stored in the external memory unit 208 under the control of the CPU 203 , and stores data required when the program is executed, data generated as a result of the execution of the program, and the like.
- the controlling program may be realized by being installed in the computer apparatus beforehand or by being stored in a storage medium such as a CD-ROM. Alternatively, the controlling program may be distributed via a network and installed in the computer apparatus as needed.
- FIG. 6 illustrates an example of a communication procedure performed when the temperature predicting apparatus 121 , the demand restraint calculating apparatus 131 , the power receiver 109 in the reserve capacity calculating apparatus, the power consumption distribution calculator 106 , the power consumption predicting unit 108 , and the reserve capacity calculating unit 110 interact with each other to operate.
- step S 301 the demand restraint calculating apparatus 131 transmits a reserve capacity calculation request including a predicted period length and a demand restraint strength to the power consumption distribution calculator 106 , thereby starting the reserve capacity calculation processing by the reserve capacity calculating apparatus 101 .
- the temperature predicting apparatus 121 transmits a predicted temperature sequence to the power consumption distribution calculator 106 in response to a request from the power consumption distribution calculator 106 .
- the transmitted predicted temperature sequence is a sequence of at least a current time (first time) “t” or later.
- the current time (first time) “t” is a time at which the reserve capacity calculating apparatus carries out the calculation.
- the current time (first time) “t” is a time at which the reserve capacity calculation request is received or a designated time if the reserve capacity calculation request includes time designation.
- the power consumption distribution calculator 106 calculates a power consumption distribution (averages and standard deviations as a statistical distribution or representative values, described later in detail). In step S 303 , the power consumption distribution calculator 106 transmits the calculated power consumption distribution to the power consumption predicting unit 108 .
- the power consumption predicting unit 108 uses the power consumption distribution to predict a power consumption sequence in a prediction period. In step S 304 , the power consumption predicting unit 108 transmits the predicted power consumption sequence to the reserve capacity calculating unit 110 .
- step S 305 the demand restraint calculating apparatus 131 transmits a reference power consumption sequence to the reference power consumption receiver 109 .
- the timing of the step S 305 may be the same as that of the step S 301 or may be the timing at which the demand restraint calculating apparatus 131 receives a request from the reference power consumption receiver 109 .
- the step S 305 is carried out a fixed period of time after the step S 301 .
- step S 306 the reference power consumption receiver 109 transmits the reference power consumption sequence received from the demand restraint calculating apparatus 131 to the reserve capacity calculating unit 110 .
- the reserve capacity calculating unit 110 calculates reserve capacity on the basis of the predicted power consumption sequence and the reference power consumption sequence. In step S 307 , the reserve capacity calculating unit 110 transmits the calculated reserve capacity to the demand restraint calculating apparatus 131 .
- FIG. 7 illustrates an example of a procedure of the power consumption distribution calculator 106 in FIG. 1 .
- step S 401 in FIG. 7 is carried out.
- a history used period length (a predicted parameter) S is obtained from the predicted parameter DB 107 (see FIG. 4 ) with the current time “t” and the predicted period length “T” used as a key.
- step S 402 on the basis of the power consumption sequence in the history used period of this day (the day on which the reserve capacity calculation request is received), the outdoor temperature sequence in the history used period of this day, the predicted temperature sequence in the prediction period obtained from the temperature predicting apparatus 121 , and the demand restraint strength obtained from the demand restraint calculating apparatus 131 , past days having patterns of the outdoor temperature and the power consumption that are similar to those patterns of this day is identified, and the power consumption sequences of the identified days are obtained from the electric power history DB 105 in FIG. 3 .
- step S 402 will be described in detail.
- an outdoor temperature waveform (a current outdoor temperature waveform) of this day
- an outdoor temperature sequence in the history used period is connected with a predicted temperature sequence in the prediction period, and in the period of the history used period and the prediction period (the total period), temperature sequences having a waveform (a sequence part) similar to the connected temperature sequence are identified in the temperature history DB 103 .
- data an outdoor temperature sequence
- data K 4 are identified.
- the temperature sequences of the history have a time length of 0 to 24 hours, in the similarity determination, only the data in the total period (the history used period and the prediction period) is used.
- a distance measure for measuring similarity between data items there is a method in which simply a Euclidean distance is used or a method in which broken line approximation is performed on sequence data before a Euclidean distance of each interval is used. A plurality of closest sequences may be adopted or sequences having a distance equal to or smaller than a threshold value may be adopted.
- All the past power consumption sequences having the same date as the date of the temperature sequence detected as similar one (and the same demand restraint strength) are read out from the electric power history DB 105 . Then, as illustrated in FIG. 9 , the sequence in the history used period of the power consumption sequence of this day is compared to read-out past power consumption sequences (here, sequences D 1 , D 2 , D 3 , and D 4 are read out) in the history used period, and all the similar past power consumption sequences are identified. For example, the data items (power consumption sequences) D 1 and D 2 are identified as similar data (assume that the demand restraint strengths are identical). Similarity determination processing is carried out in accordance with the foregoing description.
- the number to be identified may be designated beforehand, and in this case, only a designated number of past power consumption sequences are identified. It should be noted that if the number of read-out power consumption sequences is already smaller than the designated number “N,” the process flow may return to the above-described similarity determination of the outdoor temperature sequences and the processing may start again with a looser similarity criterion. Further, the number of power consumption sequences may not necessarily be complemented.
- the similarity determination of the temperature sequences is made in the total period, but the determination may be made in at least a period including the prediction period. The determination may be made in a period from a start time (at midnight) of this day to the time “t+T.”
- the reason why the similarity determination is made with the temperature sequences in the processing is that the outdoor temperature significantly influences the power consumption of the customer (in particular, the power consumption of an air conditioner).
- the past temperature sequences are obtained from the temperature history DB 103 .
- the past temperature sequences are stored in an external server such as the temperature predicting server 120 , the past temperature sequence may be obtained from the external server.
- the temperature sensor 102 and the temperature history DB may be removed from the customer house.
- step S 403 all the power consumption sequences identified in step S 402 are used to calculate an average value “ ⁇ t ” and a standard deviation “ ⁇ t ” at constant intervals, respectively. As illustrated in FIG. 10 , the calculation is performed at least in the above-described whole period (the history used period and the prediction period). Specifically, starting with the time “t ⁇ S” and ending at the time “t+T,” an average value and a standard deviation are calculated between the identified power consumption sequences at constant intervals, respectively.
- FIG. 11 illustrates an example of a procedure of the power consumption predicting unit 108 in FIG. 1 .
- step S 303 in FIG. 6 When the step S 303 in FIG. 6 is carried out, a step S 801 in FIG. 11 is carried out.
- step S 801 in the data from the time “t ⁇ S” to the current time “t” of the power consumption sequence of this day (data of the history used period), a deviation rate “n” from the average value “ ⁇ t ” is calculated at constant intervals.
- n ′ ( ⁇ ( y t ⁇ t )/ ⁇ t )/ S Equation 1
- y t denotes the power consumption in the time “t.”
- ⁇ t denotes the average value and the standard deviation in the time “t,” respectively.
- S denotes the history used period length.
- step S 802 the deviation rate “n” calculated in the equation 1, the average value “ ⁇ t ” and the standard deviation “ ⁇ t ” of each of the constant intervals in the prediction period (the times “t” to “t+T”) are used to calculate the predicted power consumption sequence “z t ” in the prediction period.
- the predicted power consumption sequence “z t ” is calculated in the following equation 2.
- z t ⁇ t +n′ ⁇ t Equation 2
- FIG. 12 schematically illustrates an example of calculating the deviation rate “n′” and the predicted values in this step.
- FIG. 13 illustrates an example of a procedure of the predicted parameter learning unit 111 in FIG. 1 .
- the processing calculates a history used period length in each time for each of all the variations of the predicted period lengths.
- FIG. 14 schematically illustrates a procedure of this processing. This example shows the case where the demand restraint strength is not used, but the case where the demand restraint strength is used may be carried out in the same manner.
- step S 901 of FIG. 13 initial values of the calculation time (the current time) “t,” the predicted period length “T,” and the history used period length “S” are given. For example, it is assumed that the calculation time “t” is “00:00:00,” the predicted period length “T” is 60 minutes, and the history used period length “S” is 60 minutes.
- the step S 901 may be carried out at constant intervals or when a certain amount of data is stored in the electric power history DB 105 . Alternatively, the step S 901 may be carried out when all the variations of the predicted times obtained from the demand restraint calculating apparatus 131 in FIG. 1 are changed.
- step S 902 the power consumption distribution calculation processing shown by the flow in FIG. 7 is executed to calculate an average value “ ⁇ t ” and a standard deviation “ ⁇ t ” of the power consumption in each of the constant time intervals in the whole period (from the time “t ⁇ S” to the time “t+T”). Specifically, the processing is executed on the power consumption sequences of the dates before a target date to calculate the average values “ ⁇ t ” and the standard deviations “ ⁇ t .” Any target date may be designated when the processing is executed. For example, the most recent date in the past history or some other date may be designated.
- step S 903 the power consumption prediction processing shown by the flow in FIG. 11 is executed to calculate predicted power consumption sequence of the target date.
- step S 904 the predicted power consumption sequence calculated in step S 903 is compared with the power consumption sequences used for the power consumption distribution calculation processing of the step S 902 to calculate an error in the prediction period. Specifically, the error is calculated using the following equation 3.
- D denotes a set of the power consumption sequences used for the power consumption distribution calculation processing and “
- step S 905 it is determined whether or not the error E calculated in step S 904 is equal to or smaller than a threshold value. If the error E is equal to or smaller than the threshold value (if the error E has converged), a step S 907 is carried out and if the error E is larger than the threshold value, a step S 906 is carried out.
- step S 906 the history used period length “S” is updated with “S+ ⁇ S.”
- the parameter “ ⁇ S” is given beforehand (for example, 15 minutes).
- step S 907 information of the calculation time, the predicted period length, and the history used period length is written in the predicted parameter DB 107 in FIG. 1 .
- step S 908 it is determined whether all the variations of the predicted period lengths have ended. If all the variations have ended, a step S 909 is carried out, and if not, the processing returns to the step S 901 , and the processing is executed with a next variation of the predicted period lengths. All the variations of the predicted period lengths are given beforehand. All the variations of the predicted period lengths may be designated by the demand restraint calculating apparatus 131 .
- step S 909 it is determined whether the processing has ended for all the calculation times. If the processing has ended, the predicted parameter calculation processing comes to end, and if not, the processing returns to step S 901 . Then, the processing is executed with the calculation time (the current time) shifted to a next time (for example, set forward 15 minutes).
- FIG. 15 is a diagram for explaining processing of the reserve capacity calculating unit 110 .
- the reserve capacity calculating unit 110 calculates, as reserve capacity, a difference between the predicted power consumption sequence in the prediction period (from the current time “t” to the time “t+T”) and a prediction period part of the reference power consumption sequence from the demand restraint calculating apparatus 131 .
- a hatched part in the drawing corresponds to the reserve capacity.
- the reference power consumption sequence represents each customer's demand (electric power consumption) planned by the supply-and-demand controlling server with influences such as temperature taken into consideration.
- a supply-and-demand controlling server of an electric power company performs the power consumption prediction of a customer before carrying out a DR, and thereby the reserve capacity of the customer is allowed to be estimated.
- the calculation of the reserve capacity of the customer can increase the calculation accuracy of a requested amount of power consumption restraint in the supply-and-demand controlling server, the possibility of paying excessive incentives to the customer can be reduced.
- FIG. 16 illustrates a reserve capacity calculating apparatus 101 A according to a second embodiment.
- the reserve capacity calculating apparatus 101 A is installed in a supply-and-demand controlling server 130 A and connected with the power measuring instrument 104 installed in the customer 100 via a network. Because the other components are same as those in the first embodiment, a description thereof is omitted.
- FIG. 17 illustrates a reserve capacity calculating apparatus 101 B according to a third embodiment.
- the reserve capacity calculating apparatus 101 B is configured by further including a living information history DB 1102 in addition to the components of the first embodiment.
- a household electrical appliance 1101 is installed in the customer house.
- the living information history DB 1102 regularly stores a household electrical appliance state obtained from the household electrical appliance 1101 and a history from a sensor in the customer house.
- FIG. 18 illustrates an example of the living information history DB 1102 .
- the number of persons in each room, outdoor temperature, room temperature of each room, set temperature of an air conditioner, an on/off state of a TV and the like are shown in minutes.
- the data of the living information history DB 1102 is used by the power consumption distribution calculator 106 .
- the power consumption distribution calculator 106 determines the similarity of the outdoor temperature sequences as described in the first embodiment as well as determines similarity between a past living information history and living information of this day in the period from the time “t ⁇ S” to the time “t.”
- the similarity determination may be made by, for example, in a comparison interval for each field in FIG. 18 , calculating an average value, taking a mode, taking a value at a current time, and so on, to obtain vectors constituted by arranging a representative value of each field, and then performing comparison between the vectors. Then, a date at which a distance between the vectors is equal to or smaller than a threshold value may be detected.
- the present embodiment identifies a similar past day in terms of a living information history, a temperature history, and a power consumption history to carry out prediction by using a power consumption sequence of a particular day. Since a specific method is evident from the description of the first embodiment, a description thereof is omitted.
- the present invention is not limited to the exact embodiments described above and can be embodied with its components modified in an implementation phase without departing from the scope of the invention. Also, arbitrary combinations of the components disclosed in the above-described embodiments can form various inventions. For example, some of the all components shown in the embodiments may be omitted. Furthermore, components from different embodiments may be combined as appropriate.
Abstract
Description
n′=(Σ(y t−μt)/σt)/
The parameter “yt” denotes the power consumption in the time “t.” The parameters “μt” and “σt” denote the average value and the standard deviation in the time “t,” respectively. The parameter “S” denotes the history used period length.
z t=μt +n′σ t Equation 2
Claims (10)
Applications Claiming Priority (2)
| Application Number | Priority Date | Filing Date | Title |
|---|---|---|---|
| JP2011067346A JP5025807B1 (en) | 2011-03-25 | 2011-03-25 | Reserve power calculation device and method, and computer program |
| JP2011-67346 | 2011-03-25 |
Publications (2)
| Publication Number | Publication Date |
|---|---|
| US20120245868A1 US20120245868A1 (en) | 2012-09-27 |
| US8886477B2 true US8886477B2 (en) | 2014-11-11 |
Family
ID=46878050
Family Applications (1)
| Application Number | Title | Priority Date | Filing Date |
|---|---|---|---|
| US13/234,528 Expired - Fee Related US8886477B2 (en) | 2011-03-25 | 2011-09-16 | Reserve capacity calculating apparatus and method therefor, and computer readable medium |
Country Status (2)
| Country | Link |
|---|---|
| US (1) | US8886477B2 (en) |
| JP (1) | JP5025807B1 (en) |
Cited By (5)
| Publication number | Priority date | Publication date | Assignee | Title |
|---|---|---|---|---|
| US8963353B1 (en) * | 2013-09-19 | 2015-02-24 | General Electric Company | System and method to minimize grid spinning reserve losses by pre-emptively sequencing power generation equipment to offset wind generation capacity based on geospatial regional wind conditions |
| US20150081124A1 (en) * | 2013-09-19 | 2015-03-19 | General Electric Company | System And Method To Minimize Grid Spinning Reserve Losses By Pre-Emptively Sequencing Power Generation Equipment To Offset Solar Generation Capacity Based On Geospatial Regional Solar And Cloud Conditions |
| US20160033949A1 (en) * | 2013-03-15 | 2016-02-04 | Kabushiki Kaisha Toshiba | Power demand estimating apparatus, method, program, and demand suppressing schedule planning apparatus |
| US11056882B2 (en) * | 2017-08-09 | 2021-07-06 | Sumitomo Electric Industries, Ltd. | Power management device, power management system, power management method, and control program |
| USRE49731E1 (en) * | 2016-11-23 | 2023-11-21 | Swell Energy Inc. | Method and apparatus for facilitating the operation of an on-site energy storage system to co-optimize battery dispatch |
Families Citing this family (11)
| Publication number | Priority date | Publication date | Assignee | Title |
|---|---|---|---|---|
| JP2015011374A (en) * | 2013-06-26 | 2015-01-19 | 京セラ株式会社 | Power management device, power management method and power management program |
| JP6193400B2 (en) * | 2013-11-20 | 2017-09-06 | 株式会社東芝 | Electric power demand prediction system, electric power demand prediction method, customer profiling system, and customer profiling method |
| US10353349B2 (en) * | 2015-05-04 | 2019-07-16 | Energate Inc. | Load control by adaptive duty cycling |
| JP6004042B1 (en) * | 2015-05-19 | 2016-10-05 | ダイキン工業株式会社 | Management device for multiple air conditioners |
| WO2016208319A1 (en) | 2015-06-22 | 2016-12-29 | 三菱電機株式会社 | Storage-battery control device, storage-battery charge/discharge system, photovoltaic generation system, and storage-battery control method |
| JP6631870B2 (en) * | 2015-08-03 | 2020-01-15 | パナソニックIpマネジメント株式会社 | Power management system, power management device, power management method, and program |
| WO2017090172A1 (en) * | 2015-11-27 | 2017-06-01 | 三菱電機株式会社 | Information collection unit, information processing method and program |
| US10941950B2 (en) * | 2016-03-03 | 2021-03-09 | Kabushiki Kaisha Toshiba | Air conditioning control device, air conditioning control method and non-transitory computer readable medium |
| JP6759867B2 (en) * | 2016-08-31 | 2020-09-23 | 富士通株式会社 | Consumer identification program, extraction program, consumer identification method, and consumer identification device |
| US11397020B2 (en) * | 2019-07-05 | 2022-07-26 | Lg Electronics Inc. | Artificial intelligence based apparatus and method for forecasting energy usage |
| CN114742263B (en) | 2022-03-02 | 2024-03-01 | 北京百度网讯科技有限公司 | Load prediction method, device, electronic equipment and storage medium |
Citations (28)
| Publication number | Priority date | Publication date | Assignee | Title |
|---|---|---|---|---|
| US5963457A (en) * | 1994-03-18 | 1999-10-05 | Hitachi, Ltd. | Electrical power distribution monitoring system and method |
| US6301674B1 (en) * | 1996-09-13 | 2001-10-09 | Kabushiki Kaisha Toshiba | Power control method, power control system and computer program product for supplying power to a plurality of electric apparatuses connected to a power line |
| US20030204759A1 (en) * | 2002-04-26 | 2003-10-30 | Singh Jitendra K. | Managing system power |
| US20040024483A1 (en) * | 1999-12-23 | 2004-02-05 | Holcombe Bradford L. | Controlling utility consumption |
| US6774506B2 (en) * | 2001-09-17 | 2004-08-10 | Mitsubishi Denki Kabushiki Kaisha | Electric power demand adjusting system |
| US6885914B2 (en) * | 2000-09-26 | 2005-04-26 | Hitachi, Ltd. | Green power supply system and green power supply method |
| US6912889B2 (en) * | 2001-02-19 | 2005-07-05 | Rosemount Analytical Inc. | Generator monitoring, control and efficiency |
| US7321810B2 (en) * | 2003-05-13 | 2008-01-22 | Siemens Power Transmission & Distribution, Inc. | Method of dynamic economic dispatch |
| US20090195349A1 (en) * | 2008-02-01 | 2009-08-06 | Energyhub | System and method for home energy monitor and control |
| JP2010166636A (en) | 2009-01-13 | 2010-07-29 | Hitachi Ltd | Power demand-supply management server and power demand-supply management system |
| US20100222934A1 (en) * | 2009-03-02 | 2010-09-02 | Yutaka Iino | System for managing energy at loads |
| US7844366B2 (en) * | 2002-10-31 | 2010-11-30 | Emerson Retail Services, Inc. | System for monitoring optimal equipment operating parameters |
| US20100318227A1 (en) * | 2009-05-08 | 2010-12-16 | Ecofactor, Inc. | System, method and apparatus for just-in-time conditioning using a thermostat |
| US20110029655A1 (en) * | 2007-08-28 | 2011-02-03 | Forbes Jr Joseph W | Apparatus and Method for Controlling Communications to and from Utility Service Points |
| US20110040550A1 (en) * | 2009-07-24 | 2011-02-17 | Honeywell International Inc. | Energy resource allocation including renewable energy sources |
| US20110077896A1 (en) * | 2007-09-17 | 2011-03-31 | Ecofactor, Inc. | System and method for calculating the thermal mass of a building |
| US20110106321A1 (en) * | 2009-11-03 | 2011-05-05 | Spirae, Inc. | Dynamic distributed power grid control system |
| US20110161250A1 (en) * | 2009-12-31 | 2011-06-30 | Koeppel Adam R | Distributed energy generator monitor and method of use |
| US20110166828A1 (en) * | 2007-08-03 | 2011-07-07 | Ecofactor, Inc. | System and method for using a network of thermostats as tool to verify peak demand reduction |
| US20110172841A1 (en) * | 2007-08-28 | 2011-07-14 | Forbes Jr Joseph W | Method and Apparatus for Actively Managing Consumption of Electric Power Supplied by One or More Electric Utilities |
| US20110239013A1 (en) * | 2007-08-28 | 2011-09-29 | Muller Marcus S | Power management of data processing resources, such as power adaptive management of data storage operations |
| US20110251732A1 (en) * | 2010-04-10 | 2011-10-13 | Schweitzer Iii Edmund O | Systems and method for obtaining a load model and related parameters based on load dynamics |
| US20110251731A1 (en) * | 2010-04-12 | 2011-10-13 | Samsung Electronics Co., Ltd. | Demand response method and demand response system |
| US8046110B2 (en) * | 2007-08-21 | 2011-10-25 | Ingeteam Energy, S.A. | Control of active power reserve in a wind-farm |
| US20110304475A1 (en) * | 2010-06-10 | 2011-12-15 | Hach Company | Server monitoring of flow and sampling apparatus and/or logger |
| US20120116600A1 (en) * | 2010-11-08 | 2012-05-10 | General Electric Company | Demand response load reduction estimation |
| US8450995B2 (en) * | 2007-06-01 | 2013-05-28 | Powerkuff, Llc | Method and apparatus for monitoring power consumption |
| US8515588B2 (en) * | 2011-03-09 | 2013-08-20 | General Electric Company | Generator reserve capacity control system and network |
Family Cites Families (1)
| Publication number | Priority date | Publication date | Assignee | Title |
|---|---|---|---|---|
| JP2010183760A (en) * | 2009-02-06 | 2010-08-19 | Toshiba Corp | Load distribution system and method of power generator |
-
2011
- 2011-03-25 JP JP2011067346A patent/JP5025807B1/en active Active
- 2011-09-16 US US13/234,528 patent/US8886477B2/en not_active Expired - Fee Related
Patent Citations (29)
| Publication number | Priority date | Publication date | Assignee | Title |
|---|---|---|---|---|
| US6061609A (en) * | 1994-03-18 | 2000-05-09 | Hitachi, Ltd. | Electrical power distribution monitoring system and method |
| US5963457A (en) * | 1994-03-18 | 1999-10-05 | Hitachi, Ltd. | Electrical power distribution monitoring system and method |
| US6301674B1 (en) * | 1996-09-13 | 2001-10-09 | Kabushiki Kaisha Toshiba | Power control method, power control system and computer program product for supplying power to a plurality of electric apparatuses connected to a power line |
| US20040024483A1 (en) * | 1999-12-23 | 2004-02-05 | Holcombe Bradford L. | Controlling utility consumption |
| US6885914B2 (en) * | 2000-09-26 | 2005-04-26 | Hitachi, Ltd. | Green power supply system and green power supply method |
| US6912889B2 (en) * | 2001-02-19 | 2005-07-05 | Rosemount Analytical Inc. | Generator monitoring, control and efficiency |
| US6774506B2 (en) * | 2001-09-17 | 2004-08-10 | Mitsubishi Denki Kabushiki Kaisha | Electric power demand adjusting system |
| US20030204759A1 (en) * | 2002-04-26 | 2003-10-30 | Singh Jitendra K. | Managing system power |
| US7844366B2 (en) * | 2002-10-31 | 2010-11-30 | Emerson Retail Services, Inc. | System for monitoring optimal equipment operating parameters |
| US7321810B2 (en) * | 2003-05-13 | 2008-01-22 | Siemens Power Transmission & Distribution, Inc. | Method of dynamic economic dispatch |
| US8450995B2 (en) * | 2007-06-01 | 2013-05-28 | Powerkuff, Llc | Method and apparatus for monitoring power consumption |
| US20110166828A1 (en) * | 2007-08-03 | 2011-07-07 | Ecofactor, Inc. | System and method for using a network of thermostats as tool to verify peak demand reduction |
| US8046110B2 (en) * | 2007-08-21 | 2011-10-25 | Ingeteam Energy, S.A. | Control of active power reserve in a wind-farm |
| US20110029655A1 (en) * | 2007-08-28 | 2011-02-03 | Forbes Jr Joseph W | Apparatus and Method for Controlling Communications to and from Utility Service Points |
| US20110172841A1 (en) * | 2007-08-28 | 2011-07-14 | Forbes Jr Joseph W | Method and Apparatus for Actively Managing Consumption of Electric Power Supplied by One or More Electric Utilities |
| US20110239013A1 (en) * | 2007-08-28 | 2011-09-29 | Muller Marcus S | Power management of data processing resources, such as power adaptive management of data storage operations |
| US20110077896A1 (en) * | 2007-09-17 | 2011-03-31 | Ecofactor, Inc. | System and method for calculating the thermal mass of a building |
| US20090195349A1 (en) * | 2008-02-01 | 2009-08-06 | Energyhub | System and method for home energy monitor and control |
| JP2010166636A (en) | 2009-01-13 | 2010-07-29 | Hitachi Ltd | Power demand-supply management server and power demand-supply management system |
| US20100222934A1 (en) * | 2009-03-02 | 2010-09-02 | Yutaka Iino | System for managing energy at loads |
| US20100318227A1 (en) * | 2009-05-08 | 2010-12-16 | Ecofactor, Inc. | System, method and apparatus for just-in-time conditioning using a thermostat |
| US20110040550A1 (en) * | 2009-07-24 | 2011-02-17 | Honeywell International Inc. | Energy resource allocation including renewable energy sources |
| US20110106321A1 (en) * | 2009-11-03 | 2011-05-05 | Spirae, Inc. | Dynamic distributed power grid control system |
| US20110161250A1 (en) * | 2009-12-31 | 2011-06-30 | Koeppel Adam R | Distributed energy generator monitor and method of use |
| US20110251732A1 (en) * | 2010-04-10 | 2011-10-13 | Schweitzer Iii Edmund O | Systems and method for obtaining a load model and related parameters based on load dynamics |
| US20110251731A1 (en) * | 2010-04-12 | 2011-10-13 | Samsung Electronics Co., Ltd. | Demand response method and demand response system |
| US20110304475A1 (en) * | 2010-06-10 | 2011-12-15 | Hach Company | Server monitoring of flow and sampling apparatus and/or logger |
| US20120116600A1 (en) * | 2010-11-08 | 2012-05-10 | General Electric Company | Demand response load reduction estimation |
| US8515588B2 (en) * | 2011-03-09 | 2013-08-20 | General Electric Company | Generator reserve capacity control system and network |
Cited By (8)
| Publication number | Priority date | Publication date | Assignee | Title |
|---|---|---|---|---|
| US20160033949A1 (en) * | 2013-03-15 | 2016-02-04 | Kabushiki Kaisha Toshiba | Power demand estimating apparatus, method, program, and demand suppressing schedule planning apparatus |
| US10345770B2 (en) * | 2013-03-15 | 2019-07-09 | Kabushiki Kaisha Toshiba | Power demand estimating apparatus, method, program, and demand suppressing schedule planning apparatus |
| US8963353B1 (en) * | 2013-09-19 | 2015-02-24 | General Electric Company | System and method to minimize grid spinning reserve losses by pre-emptively sequencing power generation equipment to offset wind generation capacity based on geospatial regional wind conditions |
| US20150076821A1 (en) * | 2013-09-19 | 2015-03-19 | General Electric Company | System And Method To Minimize Grid Spinning Reserve Losses By Pre-Emptively Sequencing Power Generation Equipment To Offset Wind Generation Capacity Based On Geospatial Regional Wind Conditions |
| US20150081124A1 (en) * | 2013-09-19 | 2015-03-19 | General Electric Company | System And Method To Minimize Grid Spinning Reserve Losses By Pre-Emptively Sequencing Power Generation Equipment To Offset Solar Generation Capacity Based On Geospatial Regional Solar And Cloud Conditions |
| US9280797B2 (en) * | 2013-09-19 | 2016-03-08 | General Electric Company | System and method to minimize grid spinning reserve losses by pre-emptively sequencing power generation equipment to offset solar generation capacity based on geospatial regional solar and cloud conditions |
| USRE49731E1 (en) * | 2016-11-23 | 2023-11-21 | Swell Energy Inc. | Method and apparatus for facilitating the operation of an on-site energy storage system to co-optimize battery dispatch |
| US11056882B2 (en) * | 2017-08-09 | 2021-07-06 | Sumitomo Electric Industries, Ltd. | Power management device, power management system, power management method, and control program |
Also Published As
| Publication number | Publication date |
|---|---|
| JP5025807B1 (en) | 2012-09-12 |
| US20120245868A1 (en) | 2012-09-27 |
| JP2012205385A (en) | 2012-10-22 |
Similar Documents
| Publication | Publication Date | Title |
|---|---|---|
| US8886477B2 (en) | Reserve capacity calculating apparatus and method therefor, and computer readable medium | |
| US10635055B2 (en) | Building control system with break even temperature uncertainty determination and performance analytics | |
| US9058569B2 (en) | System and method for maintenance planning and failure prediction for equipment subject to periodic failure risk | |
| US9092832B2 (en) | Resource cost optimization system, method, and program | |
| US9262718B2 (en) | Systems and methods to predict a reduction of energy consumption | |
| JP4584056B2 (en) | Electricity supply and demand forecast and control system | |
| US20120316914A1 (en) | Scheduling of energy consuming activities for buildings | |
| US20150149130A1 (en) | Power consumption prediction apparatus, method, and non-transitory computer readable storage medium thereof | |
| US10324118B2 (en) | Apparatus and method for correcting power usage measurements | |
| US11193984B2 (en) | Method and device for the service life-optimized usage of an electrochemical energy store | |
| CN114529086A (en) | Medicine data processing method, device and equipment | |
| US9563193B2 (en) | Information processing method, program development device, recording medium, and method | |
| US11507074B2 (en) | Method for asset management of substation | |
| US10423201B2 (en) | Method and apparatus for demand estimation for energy management of client systems | |
| US9523588B2 (en) | Method and apparatus for predicting and correcting metering data in non-metered section | |
| JP7010674B2 (en) | Power Demand Forecasting Device, Power Demand Forecasting Method and Program | |
| US9915928B2 (en) | Availability prediction apparatus for electric power storage device | |
| JP2017194863A (en) | Demand prediction device | |
| US10733331B2 (en) | Information processing apparatus, information processing method, and recording medium | |
| JP2022189386A (en) | Information processing apparatus, information processing method, and program | |
| US8996329B2 (en) | Sensor node and control method thereof | |
| JP2021131627A (en) | DR activation prediction system | |
| JP6236110B2 (en) | Gas consumption forecasting system and forecasting method | |
| JP2020160932A (en) | Power prediction method and power prediction system | |
| KR102604907B1 (en) | System and method for managing power demand using charger of electric vehicle |
Legal Events
| Date | Code | Title | Description |
|---|---|---|---|
| AS | Assignment |
Owner name: KABUSHIKI KAISHA TOSHIBA, JAPAN Free format text: ASSIGNMENT OF ASSIGNORS INTEREST;ASSIGNORS:IMAHARA, SHUICHIRO;KUBOTA, KAZUTO;SIGNING DATES FROM 20111020 TO 20111024;REEL/FRAME:027315/0354 |
|
| STCF | Information on status: patent grant |
Free format text: PATENTED CASE |
|
| FEPP | Fee payment procedure |
Free format text: PAYOR NUMBER ASSIGNED (ORIGINAL EVENT CODE: ASPN); ENTITY STATUS OF PATENT OWNER: LARGE ENTITY |
|
| MAFP | Maintenance fee payment |
Free format text: PAYMENT OF MAINTENANCE FEE, 4TH YEAR, LARGE ENTITY (ORIGINAL EVENT CODE: M1551) Year of fee payment: 4 |
|
| FEPP | Fee payment procedure |
Free format text: MAINTENANCE FEE REMINDER MAILED (ORIGINAL EVENT CODE: REM.); ENTITY STATUS OF PATENT OWNER: LARGE ENTITY |
|
| LAPS | Lapse for failure to pay maintenance fees |
Free format text: PATENT EXPIRED FOR FAILURE TO PAY MAINTENANCE FEES (ORIGINAL EVENT CODE: EXP.); ENTITY STATUS OF PATENT OWNER: LARGE ENTITY |
|
| STCH | Information on status: patent discontinuation |
Free format text: PATENT EXPIRED DUE TO NONPAYMENT OF MAINTENANCE FEES UNDER 37 CFR 1.362 |
|
| FP | Lapsed due to failure to pay maintenance fee |
Effective date: 20221111 |