US9035972B2 - Intelligent axis labels - Google Patents
Intelligent axis labels Download PDFInfo
- Publication number
- US9035972B2 US9035972B2 US13/446,460 US201213446460A US9035972B2 US 9035972 B2 US9035972 B2 US 9035972B2 US 201213446460 A US201213446460 A US 201213446460A US 9035972 B2 US9035972 B2 US 9035972B2
- Authority
- US
- United States
- Prior art keywords
- labels
- label
- sequence
- overlap
- alternate
- Prior art date
- Legal status (The legal status is an assumption and is not a legal conclusion. Google has not performed a legal analysis and makes no representation as to the accuracy of the status listed.)
- Active, expires
Links
Images


Classifications
-
- G—PHYSICS
- G06—COMPUTING; CALCULATING OR COUNTING
- G06T—IMAGE DATA PROCESSING OR GENERATION, IN GENERAL
- G06T11/00—2D [Two Dimensional] image generation
- G06T11/20—Drawing from basic elements, e.g. lines or circles
- G06T11/206—Drawing of charts or graphs
-
- G—PHYSICS
- G09—EDUCATION; CRYPTOGRAPHY; DISPLAY; ADVERTISING; SEALS
- G09G—ARRANGEMENTS OR CIRCUITS FOR CONTROL OF INDICATING DEVICES USING STATIC MEANS TO PRESENT VARIABLE INFORMATION
- G09G5/00—Control arrangements or circuits for visual indicators common to cathode-ray tube indicators and other visual indicators
-
- G—PHYSICS
- G09—EDUCATION; CRYPTOGRAPHY; DISPLAY; ADVERTISING; SEALS
- G09G—ARRANGEMENTS OR CIRCUITS FOR CONTROL OF INDICATING DEVICES USING STATIC MEANS TO PRESENT VARIABLE INFORMATION
- G09G2340/00—Aspects of display data processing
- G09G2340/04—Changes in size, position or resolution of an image
- G09G2340/0464—Positioning
-
- G—PHYSICS
- G09—EDUCATION; CRYPTOGRAPHY; DISPLAY; ADVERTISING; SEALS
- G09G—ARRANGEMENTS OR CIRCUITS FOR CONTROL OF INDICATING DEVICES USING STATIC MEANS TO PRESENT VARIABLE INFORMATION
- G09G2340/00—Aspects of display data processing
- G09G2340/14—Solving problems related to the presentation of information to be displayed
Definitions
- Diagrams, graphs and charts can be used to more effectively display information to a viewer.
- labels are used on sides of the diagrams, graphs or charts to provide details about the information being displayed. Specifically, labels are used on axes of diagrams, graphs or charts to identify the information being displayed.
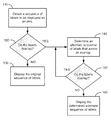
- FIG. 1 shows a block diagram of an exemplary embodiment.
- FIG. 2 shows an exemplary display of a sequence of labels that does not overlap in a portrait view of a diagram.
- FIG. 3 shows an exemplary display of a sequence of labels that includes an overlapping label in a landscape view of a diagram.
- FIG. 4 shows an exemplary display of labels in a sequence that includes all of the labels in the display.
- FIGS. 5 and 6 show exemplary displays of labels with alternate sequences of labels being displayed.
- FIG. 7 shows a flow diagram of an exemplary method of the present invention.
- FIG. 8 shows an exemplary display of labels with an alternate sequence of labels being displayed.
- FIG. 9 shows an exemplary architecture of a computing device having a display device according to an exemplary embodiment.
- FIG. 1 shows a block diagram of an exemplary embodiment.
- the exemplary embodiment may include steps to determine whether a sequence of labels to be displayed along an axis can be displayed without the labels overlapping adjacent labels or whether an alternate sequence of labels should be used for displaying the labels to avoid overlap of the adjacent labels.
- a sequence of labels to be displayed is obtained in step 110 .
- the labels may represent information that is being displayed or will be displayed on the diagram, graph or chart.
- the labels may include one or more of numbers, letters, symbols or a combination thereof.
- the labels may be obtained from the information that is to be displayed on the display device or from a source that is associated with the information that is to be displayed.
- the information that is to be displayed may be any information that can be displayed on a display with labels.
- the information that is to be displayed may be obtained from a storage device associated with the display device, from an external source or input by a user.
- the labels may also be generated by the display device or another external device from the data that is to be displayed on the display device.
- the display device may include any one of a variety of displays such as an LCD device, a field emission display device, a plasma display panel, an organic light emitting display and other forms of displays.
- the displays may be employed on portable apparatuses, such as cellular phones, smart phones, personal digital assistants (PDA's) and tablets, or stationary apparatuses such as televisions, monitors and projectors.
- the labels may be placed in the vicinity of an axis which is part of the diagram, graph or chart.
- labels can be placed on the X-axis, immediately below or above the X-axis, on the Y-axis, or to the left or right of the Y-axis.
- the exemplary embodiments will be described with reference to displaying labels along the X-axis it is to be understood that the exemplary embodiments can be applied to labels along the Y-axis if the labels on the Y-axis are displayed vertically.
- Display of labels according to the exemplary embodiment may also include displaying labels along an axis on a multi dimensional diagraph, graph or chart displayed in three dimensions. Reference to placing the labels along the axis will be understood to include placing the labels on the axis, and to either side of the axis.
- the display of the characters or symbols of each label may be restricted to displaying the characters or symbols along the axis in a single line. For example, if the characters or symbols are displayed along the X-axis, all of the characters or symbols of each label will be displayed in a single row. The characters or symbols may also be displayed in multiple rows. However, because displaying each label using multiple rows may clutter the display or make the display more difficult to easily read the label, it is better to use a lower number of rows to display the label and preferable to use a single line.
- All of the labels that are determined to be displayed along the axis may be displayed in a single line along the axis.
- all of the labels determined to be displayed may be displayed along the X-axis in a single row.
- the labels determined to be displayed may also be displayed in multiple rows, such that the labels are staggered or offset from each other.
- staggering or offsetting the labels may clutter the display or make the display more difficult to read the label, it is preferable to display all of the labels along the axis in a single line.
- step 120 it can be determined whether the labels in the original sequence of labels overlap.
- the determination can be made by analyzing the placement of the labels along the axis with reference to the data that the labels represent in the diagram, graph or chart.
- the data that each label represents may be a data point, a bar, a bubble or any other symbol or combination of symbols on the diagram, graph or chart.
- the placement of each label along the axis with reference to the data that the label represents may include placing the same reference point of each label to the corresponding data.
- the center of each label can be placed at the position that the label represents.
- the right side, left side or a predetermined point on each of the labels may be placed at the position that the label represents.
- the predetermined point on each label may be any reference point on the labels and may include a point that is a certain distance to the left or right of the center of the label or a position of certain character or symbol in the label.
- each label along the axis with reference to the data that the labels represent, allows a determination to be made as to whether each label in the sequence overlaps the adjacent labels. Labels on the ends of the sequence of labels will have only one adjacent label. In making the determination whether adjacent labels overlap, additional space may be included between the labels to allow a viewer to easily distinguish between the labels that may otherwise be too close to each other.
- FIG. 2 shows an exemplary display of a sequence of labels that does not overlap in a portrait view of a diagram.
- FIG. 3 shows an exemplary display of a sequence of labels that includes an overlapping label in a landscape view of a diagram.
- “Long Label 2” overlaps with Label 3
- “Long Label 2” is truncated.
- step 130 all of the labels in the original sequence of labels may be displayed along the axis.
- FIG. 4 shows an exemplary display of labels in a sequence that includes all of the labels in the display. Because none of the labels in FIG. 4 which are centered on the vertical line that the label represents overlap adjacent labels, all of the labels in the sequence may be displayed.
- step 140 it may be determined what kind of an alternate sequence of labels may be displayed that avoids an overlap of the labels.
- Alternate sequence of labels may include an arithmetic sequence, geometric sequence or any other sequence that avoids the overlap. Examples of alternate sequences include: “Label 1, Label 3, Label 5 . . . ;” “Label 1, Label 4, Label 7 . . . ;” “Label 1, Label 5, Label 10 . . . ;” and “Label 2, Label 4, Label 8, Label 16 . . . ”.
- Step 150 may be included to determine whether the labels in the determined alternate sequence of labels avoid the overlap of an adjacent label. Approach to determine whether the labels overlap discussed in step 120 may be applied in step 150 . If in step 150 it is determined that the labels in the alternate sequence overlap then step 140 may be repeated to determine an alternate sequence of labels that avoids an overlap. If in step 150 it is determined that the labels in the alternate sequence do not overlap then step 150 may be performed to display the determined alternate sequence of labels.
- Which alternate sequence should be used can be determined based on which labels overlap and which alternate sequence will avoid the overlap. For example, if each of the labels is about the same length and the labels only slightly overlap each of the adjacent labels then omitting every other label and using alternate sequence “Label 1, Label 3, Label 5 . . . ,” may avoid the overlap. However, if the labels are of varying sizes and the overlap varies for the adjacent labels, alternate sequence “Label 2, Label 4, Label 8, Label 16 . . . ” may be the alternate sequence that avoids the overlap.
- one option is to test each alternate sequence in a predefined set of sequences until an alternate sequence is found that avoids the overlap.
- the predefined set of sequences may be arranged in an order such that more labels are removed from the alternate sequence.
- Another option is to determine which labels overlap and fit one of the predefined set of sequences.
- Other methods may include measuring parameters such as the amount of overlap, distance between data points on the graph, size of the labels and desired space between the labels to determine which alternate sequence of labels will avoid the overlap.
- FIGS. 5 and 6 show exemplary displays of labels with alternate sequences of labels being displayed.
- FIG. 5 shows alternate sequence “Label 1, Label 3, Label 5 . . . ”
- FIG. 6 shows alternate sequence “Label 1, Label 4, Label 7 . . . ”.
- the labels in FIGS. 5 and 6 are centered to the vertical line that the label represents.
- FIG. 7 shows a flow diagram of an exemplary method of the present invention.
- the exemplary embodiment may be used in combination with other exemplary embodiments, such as the exemplary embodiment shown in FIG. 1 .
- a determination may be made as to which label from a sequence of labels can be displayed as the first label.
- the first label in the sequence of labels may not always be the label that should be displayed first along the axis.
- the first label in the sequence of labels may need more space than a space that is available for the first label. For example, if the labels are displayed on the X-axis and the labels are centered to the data that the label represents, due to the amount of text in the label the space needed for the first label may extend beyond the starting point of the X-axis.
- the first label in an area that extends beyond the bounds of the diagram, graph or chart, it may be beneficial to not display the first label in the displayed sequence of labels. In addition, it may be beneficial to not display more than one of the first labels in the sequence of labels if these labels do not fit within the available space on the diagram, graph or chart or go outside the bounds of the axis.
- the determination as to which label from the sequence of labels can be displayed as the first label may be made by comparing the available space and the space needed for each of the labels aligned with the data point that the label represents. The comparison may be made one at a time for each of the labels in the sequence of labels until a label is found that is centered to the data that it represents and has enough space without extending beyond the bounds of the diagram, graph or chart. If the determination as to which label from the sequence of labels can be displayed as the first label determines that the first label in the sequence of labels can be displayed as the first label along the axis, then no other comparisons need to be made.
- step 720 it may be determined whether all of the labels in the original sequence of labels following the label that is determined to be displayed as the first label can be displayed without overlap.
- step 730 it may be determined whether one or more of the last labels to be displayed along the axis fit within the space that is available for the last labels. The determination may be made for each label, starting with the last label, by comparing the space needed to display the label and the available space for the label in the space that is aligned with the data that the label represents. The amount of available space may be the space that is available for the label without going outside the bounds of the axis or the diagram, graph or chart. If it is determined that the last label in the sequence of labels does not fit within the available space then it may be determined whether the next label will fit within the available space. The process may continue until it is determined which label can be displayed within the available space.
- step 740 the label that is determined to be displayed first and all of the labels following the label that is determined to be displayed first can be displayed along the axis.
- the display may omit displaying the one or more of the last labels that are determined to not fit within the available space.
- step 750 it may be determined which alternate sequence of labels can be used to display the labels following the label that is determined to be displayed first.
- the determination as to which alternate sequence of labels should be used may include the label to be displayed as the first label or may omit the label to be displayed as the first label from determining the alternate sequence of labels that should be displayed.
- Approach to determine an alternate sequence of labels discussed with respect to steps 140 and 150 in FIG. 1 may be applied in step 750 .
- step 760 it may be determined whether one or more of the last labels to be displayed along the axis from the alternate sequence of labels fit within the space that is available for the last labels. The determination may be made for each label, starting with the last label in the alternate sequence, by comparing the space needed to display the label and the available space for the label in the space that is aligned with the data that the label represents. The amount of available space may be the space that is available for the label without going outside the bounds of the axis or the diagram, graph or chart. If it is determined that the last label in the alternate sequence of labels does not fit within the available space then it may be determined whether the next label in the alternate sequence will fit within the available space. The process may continue until it is determined which label can be displayed within the available space.
- step 770 the label determined to be displayed first and the alternate sequence of the labels following the first label to be displayed may be displayed along the axis.
- FIG. 8 shows an exemplary display of labels with an alternate sequence of labels being displayed.
- the first label “Really Very Very Long Label 1” is omitted because such a label would extend beyond the bounds of the axis or diagram.
- label “Really Very Very Long Label 2” is displayed as the first label on the diagram because this is the first label in the sequence of labels that can be displayed without extending beyond the bounds of the axis or diagram.
- the sequence of “Label 2, Label 5, Label 8 . . . ” is used to display the labels on the diagram because displaying all of the labels following label “Really Very Very Long Label 2” would cause at least labels “Really Very Very Long Label 3” and “Really Very Very Long Label 4” to overlap.
- Steps 730 and 760 do not have to be performed immediately after steps 720 and 750 , respectively.
- the determination as to which of the last labels should be omitted or not displayed along the axis may be made before or after determining which of the labels in the sequence of labels should be displayed first in step 710 .
- the determination as to which of the last labels should be omitted or not displayed along the axis may also be performed after the sequences of labels have been displayed in steps 740 and 770 by removing the labels that should not be displayed.
- the display of the labels may include indicia to indicate the location that each of the labels represents on the diagram, graph or chart.
- the first label in each of the figures includes a cross shaped indicia under the label and going through the label to indicate the location on the diagram that the label represents.
- the indicia to indicate the location that each of the labels represents on the diagram may include a variety of marks such as lines, arrows, dots, squares or other symbols.
- An exemplary embodiment may include step 780 , in which it may be determined whether the information to be displayed or the size of the display changed. If information to be displayed has changed then some of the labels may need to be removed or added. Similarly, if the size of the display has changed the available space for the labels may increase or decrease. Thus, the labels already displayed may become cluttered or additional space may become available to display new labels. Change in the information to be displayed or change in the size of display may change the size of the axes available to display the labels.
- the information to be displayed may be changed by the viewer inputting additional information, removing existing information, or requesting that more or less of the information be displayed on the diagram.
- the information to be displayed may also be changed by the system if instructions are received to add new data or remove existing data, or if information to be displayed is updated.
- the change in the information to be displayed may also influence the size of display if the size of the diagram is linked to the amount of data or range of values being displayed.
- the size of the display may be changed by the user zooming in or out on the whole display, zooming in or out on the diagram, selecting a portion of the diagram already being displayed to be displayed, or changing the orientation of the display or diagram.
- the orientation of the display or diagram may be caused automatically by user operations such as rotating the display device.
- step 780 it is determined that the information to be displayed or the size of the display changed, then the steps of the exemplary embodiment may be repeated to determine the sequence of labels that should be displayed. However, if no change is detected then the system may maintain the current display of the labels along the axis.
- the above described embodiments may be an automated process to display the labels on the axes.
- the automated process does not require a viewer to manually select the desired view of the labels out of the available options.
- the automated process may update the display of the labels along the axis if the information to be displayed or the size of the display or axis changes.
- the automated process allows for information to be clearly presented to the viewer without cluttering the display with unnecessary labels and presenting labels that are easy to read.
- the viewer can quickly review the diagram, graph or chart using the displayed labels and decide whether additional information is needed. If additional information is needed, the viewer can make changes to the diagram, graph or chart to display new information with a newly determined set of labels. For example, by zooming in on a portion of the diagram for which more information is desired, the labels to be displayed may be regenerated according to one of the above discussed embodiments to get rid of labels that do not fit the display and to display additional labels that previously may not have fit without overlapping. If a user wants to expand the view of the diagram, graph or chart, the labels can be regenerated to fit within the available space along the axis without overlapping adjacent labels according to the above discussed exemplary embodiments.
- FIG. 9 shows an exemplary architecture of a computing device 900 having a display device according to an exemplary embodiment.
- the computing device 900 may include a touch-sensitive surface 901 , a processing device 902 , a memory 903 storing structured data 905 , an input/output device 904 , and a display 906 .
- Each of these components 901 to 906 may be interconnected via a system bus.
- a surface of the display 906 may be the touch-sensitive surface 901 , though in other instances the two may be separate. Additionally, in some instances the computing device 900 may be a tablet 970 , smart phone 980 , or other type of portable computing device, though the computing device 700 need not be portable.
- Communications input/output device 904 may enable connectivity between the computing device 900 and other computing systems, peripherals, and devices by encoding and/or transmitting data to be sent to the external devices and receiving and/or decoding data received from the external devices.
- memory 903 may contain different components for retrieving, presenting, changing, and saving data.
- Memory 903 may include a variety of memory devices, for example, Dynamic Random Access Memory (DRAM), Static RAM (SRAM), flash memory, cache memory, and other memory devices.
- DRAM Dynamic Random Access Memory
- SRAM Static RAM
- flash memory volatile and non-volatile memory
- cache memory volatile and non-volatile memory
- Processing device 902 may perform computation and control functions of a system and comprises a suitable central processing unit (CPU).
- Processing device 902 may include a single integrated circuit, such as a microprocessing device, or may include any suitable number of integrated circuit devices and/or circuit boards working in cooperation to accomplish the functions of a processing device.
- Processing device 902 may execute computer programs, such as object-oriented computer programs, within memory 903 .
Abstract
Description
Claims (21)
Priority Applications (1)
| Application Number | Priority Date | Filing Date | Title |
|---|---|---|---|
| US13/446,460 US9035972B2 (en) | 2012-04-13 | 2012-04-13 | Intelligent axis labels |
Applications Claiming Priority (1)
| Application Number | Priority Date | Filing Date | Title |
|---|---|---|---|
| US13/446,460 US9035972B2 (en) | 2012-04-13 | 2012-04-13 | Intelligent axis labels |
Publications (2)
| Publication Number | Publication Date |
|---|---|
| US20130271493A1 US20130271493A1 (en) | 2013-10-17 |
| US9035972B2 true US9035972B2 (en) | 2015-05-19 |
Family
ID=49324675
Family Applications (1)
| Application Number | Title | Priority Date | Filing Date |
|---|---|---|---|
| US13/446,460 Active 2033-03-07 US9035972B2 (en) | 2012-04-13 | 2012-04-13 | Intelligent axis labels |
Country Status (1)
| Country | Link |
|---|---|
| US (1) | US9035972B2 (en) |
Cited By (1)
| Publication number | Priority date | Publication date | Assignee | Title |
|---|---|---|---|---|
| US10825214B2 (en) | 2017-10-30 | 2020-11-03 | Microsoft Technology Licensing, Llc | Priority based automatic placement of labels on charts |
Families Citing this family (3)
| Publication number | Priority date | Publication date | Assignee | Title |
|---|---|---|---|---|
| US9557726B2 (en) * | 2012-11-26 | 2017-01-31 | Mitsubishi Electric Corporation | Ladder program display device and ladder program display method |
| US9389777B2 (en) * | 2013-11-08 | 2016-07-12 | Business Objects Software Ltd. | Gestures for manipulating tables, charts, and graphs |
| US10482635B2 (en) * | 2014-09-29 | 2019-11-19 | Adp, Llc | Chart labeling system |
Citations (5)
| Publication number | Priority date | Publication date | Assignee | Title |
|---|---|---|---|---|
| US5414838A (en) * | 1991-06-11 | 1995-05-09 | Logical Information Machine | System for extracting historical market information with condition and attributed windows |
| US20050162423A1 (en) * | 2004-01-20 | 2005-07-28 | Goggin David E. | Method and apparatus for time series graph display |
| US7146374B1 (en) * | 2001-02-21 | 2006-12-05 | Oracle Corporation | Automated multi-line labeling of a time axis |
| US20110227946A1 (en) * | 2010-03-19 | 2011-09-22 | Casio Computer Co., Ltd. | Graph display apparatus, recording medium on which program is recorded and graph display method |
| US20110305668A1 (en) * | 2008-08-15 | 2011-12-15 | The United States of America, as represented by the Secretary, Dept.of Health and Human Services | Methods for using interferon gamma to absorb fluid from the subretinal space |
-
2012
- 2012-04-13 US US13/446,460 patent/US9035972B2/en active Active
Patent Citations (5)
| Publication number | Priority date | Publication date | Assignee | Title |
|---|---|---|---|---|
| US5414838A (en) * | 1991-06-11 | 1995-05-09 | Logical Information Machine | System for extracting historical market information with condition and attributed windows |
| US7146374B1 (en) * | 2001-02-21 | 2006-12-05 | Oracle Corporation | Automated multi-line labeling of a time axis |
| US20050162423A1 (en) * | 2004-01-20 | 2005-07-28 | Goggin David E. | Method and apparatus for time series graph display |
| US20110305668A1 (en) * | 2008-08-15 | 2011-12-15 | The United States of America, as represented by the Secretary, Dept.of Health and Human Services | Methods for using interferon gamma to absorb fluid from the subretinal space |
| US20110227946A1 (en) * | 2010-03-19 | 2011-09-22 | Casio Computer Co., Ltd. | Graph display apparatus, recording medium on which program is recorded and graph display method |
Cited By (1)
| Publication number | Priority date | Publication date | Assignee | Title |
|---|---|---|---|---|
| US10825214B2 (en) | 2017-10-30 | 2020-11-03 | Microsoft Technology Licensing, Llc | Priority based automatic placement of labels on charts |
Also Published As
| Publication number | Publication date |
|---|---|
| US20130271493A1 (en) | 2013-10-17 |
Similar Documents
| Publication | Publication Date | Title |
|---|---|---|
| US20230394429A1 (en) | Information processing apparatus, control method, and program | |
| US9582612B2 (en) | Space constrained ordered list previews | |
| CN104063489A (en) | Method and device for determining webpage image relevancy and displaying retrieved result | |
| US9035972B2 (en) | Intelligent axis labels | |
| CN113190781B (en) | Page layout method, device, equipment and storage medium | |
| JP6416210B2 (en) | System and method for resolving item selection ambiguity | |
| CN103593171A (en) | Multi-zone screenshot method and device | |
| US9620086B1 (en) | Dynamic contrast adjustments for glyph rendering | |
| US20170090723A1 (en) | Widgets in digital dashboards | |
| CN103500332B (en) | Character displaying method and device in picture | |
| CN113920117B (en) | Panel defect area detection method and device, electronic equipment and storage medium | |
| US10198147B2 (en) | Object management and visualization using a computing device | |
| US20120131450A1 (en) | Apparatus and method for providing electronic book service | |
| WO2018228001A1 (en) | Electronic device, information query control method, and computer-readable storage medium | |
| US11410333B2 (en) | Method, device, and storage medium for providing visual representation of set of objects | |
| JP6252296B2 (en) | Data identification method, data identification program, and data identification apparatus | |
| US9229608B2 (en) | Character display apparatus, character display method, and computer readable medium | |
| US20120062589A1 (en) | System and program for enumerating local alignments from a pair of documents | |
| CN113297313B (en) | Table data display method and device, electronic equipment and storage medium | |
| CN114885202A (en) | Character string display processing method, device, terminal and storage medium | |
| US20150296034A1 (en) | Read determination device, read determination method, and read determination program | |
| CN114611031A (en) | Digital scrolling display method, device, equipment and medium | |
| CN113766312A (en) | Method, device, equipment and storage medium for calculating response delay between equipment | |
| WO2012051771A1 (en) | Image copying method and device | |
| WO2016184162A1 (en) | Method and apparatus for processing calling card information |
Legal Events
| Date | Code | Title | Description |
|---|---|---|---|
| AS | Assignment |
Owner name: SAP AG, GERMANY Free format text: ASSIGNMENT OF ASSIGNORS INTEREST;ASSIGNOR:SHIROOR, KEDAR;REEL/FRAME:028438/0129 Effective date: 20120521 |
|
| AS | Assignment |
Owner name: SAP SE, GERMANY Free format text: CHANGE OF NAME;ASSIGNOR:SAP AG;REEL/FRAME:033625/0223 Effective date: 20140707 |
|
| FEPP | Fee payment procedure |
Free format text: PAYOR NUMBER ASSIGNED (ORIGINAL EVENT CODE: ASPN); ENTITY STATUS OF PATENT OWNER: LARGE ENTITY |
|
| STCF | Information on status: patent grant |
Free format text: PATENTED CASE |
|
| FEPP | Fee payment procedure |
Free format text: PAYOR NUMBER ASSIGNED (ORIGINAL EVENT CODE: ASPN); ENTITY STATUS OF PATENT OWNER: LARGE ENTITY Free format text: PAYER NUMBER DE-ASSIGNED (ORIGINAL EVENT CODE: RMPN); ENTITY STATUS OF PATENT OWNER: LARGE ENTITY |
|
| MAFP | Maintenance fee payment |
Free format text: PAYMENT OF MAINTENANCE FEE, 4TH YEAR, LARGE ENTITY (ORIGINAL EVENT CODE: M1551); ENTITY STATUS OF PATENT OWNER: LARGE ENTITY Year of fee payment: 4 |
|
| MAFP | Maintenance fee payment |
Free format text: PAYMENT OF MAINTENANCE FEE, 8TH YEAR, LARGE ENTITY (ORIGINAL EVENT CODE: M1552); ENTITY STATUS OF PATENT OWNER: LARGE ENTITY Year of fee payment: 8 |