US9395357B2 - Method of detecting sparse particles in a solution using a light-emitting probe - Google Patents
Method of detecting sparse particles in a solution using a light-emitting probe Download PDFInfo
- Publication number
- US9395357B2 US9395357B2 US13/746,968 US201313746968A US9395357B2 US 9395357 B2 US9395357 B2 US 9395357B2 US 201313746968 A US201313746968 A US 201313746968A US 9395357 B2 US9395357 B2 US 9395357B2
- Authority
- US
- United States
- Prior art keywords
- light
- particle
- emitting probe
- probe
- emitting
- Prior art date
- Legal status (The legal status is an assumption and is not a legal conclusion. Google has not performed a legal analysis and makes no representation as to the accuracy of the status listed.)
- Active
Links
- 239000002245 particle Substances 0.000 title claims abstract description 473
- 239000000523 sample Substances 0.000 title claims abstract description 431
- 238000000034 method Methods 0.000 title claims description 152
- 239000012488 sample solution Substances 0.000 claims abstract description 168
- 238000001514 detection method Methods 0.000 claims abstract description 156
- 230000003287 optical effect Effects 0.000 claims abstract description 70
- 238000004204 optical analysis method Methods 0.000 claims abstract description 32
- 108020004707 nucleic acids Proteins 0.000 claims description 160
- 102000039446 nucleic acids Human genes 0.000 claims description 160
- 150000007523 nucleic acids Chemical group 0.000 claims description 160
- 239000000126 substance Substances 0.000 claims description 51
- 238000012546 transfer Methods 0.000 claims description 46
- 238000009499 grossing Methods 0.000 claims description 14
- 238000006243 chemical reaction Methods 0.000 claims description 12
- 102000044158 nucleic acid binding protein Human genes 0.000 claims description 3
- 108700020942 nucleic acid binding protein Proteins 0.000 claims description 3
- 238000005259 measurement Methods 0.000 description 66
- 239000000370 acceptor Substances 0.000 description 57
- 239000000243 solution Substances 0.000 description 37
- 239000007850 fluorescent dye Substances 0.000 description 34
- 238000004458 analytical method Methods 0.000 description 32
- 238000002474 experimental method Methods 0.000 description 32
- 230000005284 excitation Effects 0.000 description 29
- 239000000975 dye Substances 0.000 description 28
- 238000002060 fluorescence correlation spectroscopy Methods 0.000 description 28
- 238000010791 quenching Methods 0.000 description 27
- 230000000171 quenching effect Effects 0.000 description 25
- 230000008569 process Effects 0.000 description 24
- 108091093037 Peptide nucleic acid Proteins 0.000 description 22
- 230000008859 change Effects 0.000 description 18
- 230000006870 function Effects 0.000 description 16
- 108090000623 proteins and genes Proteins 0.000 description 12
- 108020004414 DNA Proteins 0.000 description 11
- 102000004169 proteins and genes Human genes 0.000 description 11
- 230000005653 Brownian motion process Effects 0.000 description 10
- 238000005537 brownian motion Methods 0.000 description 10
- 238000010586 diagram Methods 0.000 description 8
- 238000009826 distribution Methods 0.000 description 8
- 238000000926 separation method Methods 0.000 description 8
- 238000004364 calculation method Methods 0.000 description 7
- 238000000354 decomposition reaction Methods 0.000 description 7
- 230000023077 detection of light stimulus Effects 0.000 description 7
- 238000000746 purification Methods 0.000 description 7
- 239000012088 reference solution Substances 0.000 description 7
- 230000009471 action Effects 0.000 description 6
- 230000000295 complement effect Effects 0.000 description 6
- 239000000356 contaminant Substances 0.000 description 6
- 238000009792 diffusion process Methods 0.000 description 6
- 230000033001 locomotion Effects 0.000 description 6
- QKNYBSVHEMOAJP-UHFFFAOYSA-N 2-amino-2-(hydroxymethyl)propane-1,3-diol;hydron;chloride Chemical compound Cl.OCC(N)(CO)CO QKNYBSVHEMOAJP-UHFFFAOYSA-N 0.000 description 5
- 239000010419 fine particle Substances 0.000 description 5
- 230000007246 mechanism Effects 0.000 description 5
- 238000012109 statistical procedure Methods 0.000 description 5
- 239000000758 substrate Substances 0.000 description 5
- 238000012360 testing method Methods 0.000 description 5
- FAPWRFPIFSIZLT-UHFFFAOYSA-M Sodium chloride Chemical compound [Na+].[Cl-] FAPWRFPIFSIZLT-UHFFFAOYSA-M 0.000 description 4
- 239000007983 Tris buffer Substances 0.000 description 4
- 230000029918 bioluminescence Effects 0.000 description 4
- 238000005415 bioluminescence Methods 0.000 description 4
- 238000004587 chromatography analysis Methods 0.000 description 4
- 230000004069 differentiation Effects 0.000 description 4
- 230000000694 effects Effects 0.000 description 4
- UYTPUPDQBNUYGX-UHFFFAOYSA-N guanine Chemical compound O=C1NC(N)=NC2=C1N=CN2 UYTPUPDQBNUYGX-UHFFFAOYSA-N 0.000 description 4
- 230000002209 hydrophobic effect Effects 0.000 description 4
- 238000005286 illumination Methods 0.000 description 4
- 238000001179 sorption measurement Methods 0.000 description 4
- LENZDBCJOHFCAS-UHFFFAOYSA-N tris Chemical compound OCC(N)(CO)CO LENZDBCJOHFCAS-UHFFFAOYSA-N 0.000 description 4
- MGKOJZBNNSRXRO-UHFFFAOYSA-N 6-(n-methylanilino)naphthalene-2-sulfonic acid Chemical compound C=1C=C2C=C(S(O)(=O)=O)C=CC2=CC=1N(C)C1=CC=CC=C1 MGKOJZBNNSRXRO-UHFFFAOYSA-N 0.000 description 3
- FWEOQOXTVHGIFQ-UHFFFAOYSA-N 8-anilinonaphthalene-1-sulfonic acid Chemical compound C=12C(S(=O)(=O)O)=CC=CC2=CC=CC=1NC1=CC=CC=C1 FWEOQOXTVHGIFQ-UHFFFAOYSA-N 0.000 description 3
- VYPSYNLAJGMNEJ-UHFFFAOYSA-N Silicium dioxide Chemical compound O=[Si]=O VYPSYNLAJGMNEJ-UHFFFAOYSA-N 0.000 description 3
- 241000700605 Viruses Species 0.000 description 3
- 150000001413 amino acids Chemical class 0.000 description 3
- 238000000137 annealing Methods 0.000 description 3
- 230000015572 biosynthetic process Effects 0.000 description 3
- 239000007853 buffer solution Substances 0.000 description 3
- 239000000084 colloidal system Substances 0.000 description 3
- 230000007423 decrease Effects 0.000 description 3
- 239000000835 fiber Substances 0.000 description 3
- 239000000138 intercalating agent Substances 0.000 description 3
- 150000002632 lipids Chemical class 0.000 description 3
- 238000000691 measurement method Methods 0.000 description 3
- 239000012528 membrane Substances 0.000 description 3
- 108090000765 processed proteins & peptides Proteins 0.000 description 3
- 239000000741 silica gel Substances 0.000 description 3
- 229910002027 silica gel Inorganic materials 0.000 description 3
- 238000010183 spectrum analysis Methods 0.000 description 3
- 238000003860 storage Methods 0.000 description 3
- 238000005406 washing Methods 0.000 description 3
- UDGUGZTYGWUUSG-UHFFFAOYSA-N 4-[4-[[2,5-dimethoxy-4-[(4-nitrophenyl)diazenyl]phenyl]diazenyl]-n-methylanilino]butanoic acid Chemical compound COC=1C=C(N=NC=2C=CC(=CC=2)N(C)CCCC(O)=O)C(OC)=CC=1N=NC1=CC=C([N+]([O-])=O)C=C1 UDGUGZTYGWUUSG-UHFFFAOYSA-N 0.000 description 2
- WCKQPPQRFNHPRJ-UHFFFAOYSA-N 4-[[4-(dimethylamino)phenyl]diazenyl]benzoic acid Chemical compound C1=CC(N(C)C)=CC=C1N=NC1=CC=C(C(O)=O)C=C1 WCKQPPQRFNHPRJ-UHFFFAOYSA-N 0.000 description 2
- IRLPACMLTUPBCL-KQYNXXCUSA-N 5'-adenylyl sulfate Chemical group C1=NC=2C(N)=NC=NC=2N1[C@@H]1O[C@H](COP(O)(=O)OS(O)(=O)=O)[C@@H](O)[C@H]1O IRLPACMLTUPBCL-KQYNXXCUSA-N 0.000 description 2
- 108060002716 Exonuclease Proteins 0.000 description 2
- QIVBCDIJIAJPQS-VIFPVBQESA-N L-tryptophane Chemical compound C1=CC=C2C(C[C@H](N)C(O)=O)=CNC2=C1 QIVBCDIJIAJPQS-VIFPVBQESA-N 0.000 description 2
- 229920001213 Polysorbate 20 Polymers 0.000 description 2
- 241000239226 Scorpiones Species 0.000 description 2
- QIVBCDIJIAJPQS-UHFFFAOYSA-N Tryptophan Natural products C1=CC=C2C(CC(N)C(O)=O)=CNC2=C1 QIVBCDIJIAJPQS-UHFFFAOYSA-N 0.000 description 2
- 238000001042 affinity chromatography Methods 0.000 description 2
- 230000002776 aggregation Effects 0.000 description 2
- 238000004220 aggregation Methods 0.000 description 2
- 238000000149 argon plasma sintering Methods 0.000 description 2
- 230000004888 barrier function Effects 0.000 description 2
- 238000007796 conventional method Methods 0.000 description 2
- 150000004696 coordination complex Chemical class 0.000 description 2
- 239000006185 dispersion Substances 0.000 description 2
- 238000001962 electrophoresis Methods 0.000 description 2
- 230000007613 environmental effect Effects 0.000 description 2
- 102000013165 exonuclease Human genes 0.000 description 2
- 238000000605 extraction Methods 0.000 description 2
- 102000034287 fluorescent proteins Human genes 0.000 description 2
- 108091006047 fluorescent proteins Proteins 0.000 description 2
- 230000003993 interaction Effects 0.000 description 2
- 238000004255 ion exchange chromatography Methods 0.000 description 2
- 239000003446 ligand Substances 0.000 description 2
- 239000007788 liquid Substances 0.000 description 2
- 238000002156 mixing Methods 0.000 description 2
- 239000013307 optical fiber Substances 0.000 description 2
- 230000002093 peripheral effect Effects 0.000 description 2
- 238000005191 phase separation Methods 0.000 description 2
- 239000008363 phosphate buffer Substances 0.000 description 2
- 239000000256 polyoxyethylene sorbitan monolaurate Substances 0.000 description 2
- 235000010486 polyoxyethylene sorbitan monolaurate Nutrition 0.000 description 2
- 238000002360 preparation method Methods 0.000 description 2
- 238000012545 processing Methods 0.000 description 2
- 230000009467 reduction Effects 0.000 description 2
- 108091008146 restriction endonucleases Proteins 0.000 description 2
- 230000035945 sensitivity Effects 0.000 description 2
- 239000011780 sodium chloride Substances 0.000 description 2
- 238000000638 solvent extraction Methods 0.000 description 2
- ABZLKHKQJHEPAX-UHFFFAOYSA-N tetramethylrhodamine Chemical compound C=12C=CC(N(C)C)=CC2=[O+]C2=CC(N(C)C)=CC=C2C=1C1=CC=CC=C1C([O-])=O ABZLKHKQJHEPAX-UHFFFAOYSA-N 0.000 description 2
- 238000000108 ultra-filtration Methods 0.000 description 2
- LLTDOAPVRPZLCM-UHFFFAOYSA-O 4-(7,8,8,16,16,17-hexamethyl-4,20-disulfo-2-oxa-18-aza-6-azoniapentacyclo[11.7.0.03,11.05,9.015,19]icosa-1(20),3,5,9,11,13,15(19)-heptaen-12-yl)benzoic acid Chemical compound CC1(C)C(C)NC(C(=C2OC3=C(C=4C(C(C(C)[NH+]=4)(C)C)=CC3=3)S(O)(=O)=O)S(O)(=O)=O)=C1C=C2C=3C1=CC=C(C(O)=O)C=C1 LLTDOAPVRPZLCM-UHFFFAOYSA-O 0.000 description 1
- SJQRQOKXQKVJGJ-UHFFFAOYSA-N 5-(2-aminoethylamino)naphthalene-1-sulfonic acid Chemical compound C1=CC=C2C(NCCN)=CC=CC2=C1S(O)(=O)=O SJQRQOKXQKVJGJ-UHFFFAOYSA-N 0.000 description 1
- NJYVEMPWNAYQQN-UHFFFAOYSA-N 5-carboxyfluorescein Chemical compound C12=CC=C(O)C=C2OC2=CC(O)=CC=C2C21OC(=O)C1=CC(C(=O)O)=CC=C21 NJYVEMPWNAYQQN-UHFFFAOYSA-N 0.000 description 1
- VTRBOZNMGVDGHY-UHFFFAOYSA-N 6-(4-methylanilino)naphthalene-2-sulfonic acid Chemical compound C1=CC(C)=CC=C1NC1=CC=C(C=C(C=C2)S(O)(=O)=O)C2=C1 VTRBOZNMGVDGHY-UHFFFAOYSA-N 0.000 description 1
- 238000012935 Averaging Methods 0.000 description 1
- 102000053602 DNA Human genes 0.000 description 1
- 102000016928 DNA-directed DNA polymerase Human genes 0.000 description 1
- 108010014303 DNA-directed DNA polymerase Proteins 0.000 description 1
- KCXVZYZYPLLWCC-UHFFFAOYSA-N EDTA Chemical compound OC(=O)CN(CC(O)=O)CCN(CC(O)=O)CC(O)=O KCXVZYZYPLLWCC-UHFFFAOYSA-N 0.000 description 1
- 238000002965 ELISA Methods 0.000 description 1
- 108090000790 Enzymes Proteins 0.000 description 1
- 102000004190 Enzymes Human genes 0.000 description 1
- -1 OllGreen Chemical compound 0.000 description 1
- ZYFVNVRFVHJEIU-UHFFFAOYSA-N PicoGreen Chemical compound CN(C)CCCN(CCCN(C)C)C1=CC(=CC2=[N+](C3=CC=CC=C3S2)C)C2=CC=CC=C2N1C1=CC=CC=C1 ZYFVNVRFVHJEIU-UHFFFAOYSA-N 0.000 description 1
- CGNLCCVKSWNSDG-UHFFFAOYSA-N SYBR Green I Chemical compound CN(C)CCCN(CCC)C1=CC(C=C2N(C3=CC=CC=C3S2)C)=C2C=CC=CC2=[N+]1C1=CC=CC=C1 CGNLCCVKSWNSDG-UHFFFAOYSA-N 0.000 description 1
- 238000010521 absorption reaction Methods 0.000 description 1
- DPKHZNPWBDQZCN-UHFFFAOYSA-N acridine orange free base Chemical compound C1=CC(N(C)C)=CC2=NC3=CC(N(C)C)=CC=C3C=C21 DPKHZNPWBDQZCN-UHFFFAOYSA-N 0.000 description 1
- 239000007864 aqueous solution Substances 0.000 description 1
- 238000005311 autocorrelation function Methods 0.000 description 1
- 230000008901 benefit Effects 0.000 description 1
- DZBUGLKDJFMEHC-UHFFFAOYSA-N benzoquinolinylidene Natural products C1=CC=CC2=CC3=CC=CC=C3N=C21 DZBUGLKDJFMEHC-UHFFFAOYSA-N 0.000 description 1
- 230000000975 bioactive effect Effects 0.000 description 1
- 238000002306 biochemical method Methods 0.000 description 1
- VYXSBFYARXAAKO-WTKGSRSZSA-N chembl402140 Chemical compound Cl.C1=2C=C(C)C(NCC)=CC=2OC2=C\C(=N/CC)C(C)=CC2=C1C1=CC=CC=C1C(=O)OCC VYXSBFYARXAAKO-WTKGSRSZSA-N 0.000 description 1
- 238000003759 clinical diagnosis Methods 0.000 description 1
- 125000001295 dansyl group Chemical group [H]C1=C([H])C(N(C([H])([H])[H])C([H])([H])[H])=C2C([H])=C([H])C([H])=C(C2=C1[H])S(*)(=O)=O 0.000 description 1
- 238000013461 design Methods 0.000 description 1
- 230000006866 deterioration Effects 0.000 description 1
- 238000011161 development Methods 0.000 description 1
- 230000018109 developmental process Effects 0.000 description 1
- 238000006073 displacement reaction Methods 0.000 description 1
- 208000018459 dissociative disease Diseases 0.000 description 1
- 239000003814 drug Substances 0.000 description 1
- ZMMJGEGLRURXTF-UHFFFAOYSA-N ethidium bromide Chemical compound [Br-].C12=CC(N)=CC=C2C2=CC=C(N)C=C2[N+](CC)=C1C1=CC=CC=C1 ZMMJGEGLRURXTF-UHFFFAOYSA-N 0.000 description 1
- 229960005542 ethidium bromide Drugs 0.000 description 1
- VYXSBFYARXAAKO-UHFFFAOYSA-N ethyl 2-[3-(ethylamino)-6-ethylimino-2,7-dimethylxanthen-9-yl]benzoate;hydron;chloride Chemical compound [Cl-].C1=2C=C(C)C(NCC)=CC=2OC2=CC(=[NH+]CC)C(C)=CC2=C1C1=CC=CC=C1C(=O)OCC VYXSBFYARXAAKO-UHFFFAOYSA-N 0.000 description 1
- GNBHRKFJIUUOQI-UHFFFAOYSA-N fluorescein Chemical compound O1C(=O)C2=CC=CC=C2C21C1=CC=C(O)C=C1OC1=CC(O)=CC=C21 GNBHRKFJIUUOQI-UHFFFAOYSA-N 0.000 description 1
- MHMNJMPURVTYEJ-UHFFFAOYSA-N fluorescein-5-isothiocyanate Chemical compound O1C(=O)C2=CC(N=C=S)=CC=C2C21C1=CC=C(O)C=C1OC1=CC(O)=CC=C21 MHMNJMPURVTYEJ-UHFFFAOYSA-N 0.000 description 1
- TWYVVGMYFLAQMU-UHFFFAOYSA-N gelgreen Chemical compound [I-].[I-].C1=C(N(C)C)C=C2[N+](CCCCCC(=O)NCCCOCCOCCOCCCNC(=O)CCCCC[N+]3=C4C=C(C=CC4=CC4=CC=C(C=C43)N(C)C)N(C)C)=C(C=C(C=C3)N(C)C)C3=CC2=C1 TWYVVGMYFLAQMU-UHFFFAOYSA-N 0.000 description 1
- JGBUYEVOKHLFID-UHFFFAOYSA-N gelred Chemical compound [I-].[I-].C=1C(N)=CC=C(C2=CC=C(N)C=C2[N+]=2CCCCCC(=O)NCCCOCCOCCOCCCNC(=O)CCCCC[N+]=3C4=CC(N)=CC=C4C4=CC=C(N)C=C4C=3C=3C=CC=CC=3)C=1C=2C1=CC=CC=C1 JGBUYEVOKHLFID-UHFFFAOYSA-N 0.000 description 1
- PCHJSUWPFVWCPO-UHFFFAOYSA-N gold Chemical compound [Au] PCHJSUWPFVWCPO-UHFFFAOYSA-N 0.000 description 1
- 239000010931 gold Substances 0.000 description 1
- 229910052737 gold Inorganic materials 0.000 description 1
- 238000010438 heat treatment Methods 0.000 description 1
- 238000011534 incubation Methods 0.000 description 1
- 230000009878 intermolecular interaction Effects 0.000 description 1
- 239000000693 micelle Substances 0.000 description 1
- AJUXDFHPVZQOGF-UHFFFAOYSA-N n,n-dimethyl-1-naphthylamine Chemical class C1=CC=C2C(N(C)C)=CC=CC2=C1 AJUXDFHPVZQOGF-UHFFFAOYSA-N 0.000 description 1
- PSZYNBSKGUBXEH-UHFFFAOYSA-N naphthalene-1-sulfonic acid Chemical class C1=CC=C2C(S(=O)(=O)O)=CC=CC2=C1 PSZYNBSKGUBXEH-UHFFFAOYSA-N 0.000 description 1
- 239000003960 organic solvent Substances 0.000 description 1
- 239000013618 particulate matter Substances 0.000 description 1
- 229920001992 poloxamer 407 Polymers 0.000 description 1
- 238000011160 research Methods 0.000 description 1
- 238000012827 research and development Methods 0.000 description 1
- 238000012216 screening Methods 0.000 description 1
- 238000013179 statistical model Methods 0.000 description 1
- MPLHNVLQVRSVEE-UHFFFAOYSA-N texas red Chemical compound [O-]S(=O)(=O)C1=CC(S(Cl)(=O)=O)=CC=C1C(C1=CC=2CCCN3CCCC(C=23)=C1O1)=C2C1=C(CCC1)C3=[N+]1CCCC3=C2 MPLHNVLQVRSVEE-UHFFFAOYSA-N 0.000 description 1
- ANRHNWWPFJCPAZ-UHFFFAOYSA-M thionine Chemical group [Cl-].C1=CC(N)=CC2=[S+]C3=CC(N)=CC=C3N=C21 ANRHNWWPFJCPAZ-UHFFFAOYSA-M 0.000 description 1
Images


Classifications
-
- G—PHYSICS
- G01—MEASURING; TESTING
- G01N—INVESTIGATING OR ANALYSING MATERIALS BY DETERMINING THEIR CHEMICAL OR PHYSICAL PROPERTIES
- G01N33/00—Investigating or analysing materials by specific methods not covered by groups G01N1/00 - G01N31/00
- G01N33/48—Biological material, e.g. blood, urine; Haemocytometers
- G01N33/50—Chemical analysis of biological material, e.g. blood, urine; Testing involving biospecific ligand binding methods; Immunological testing
- G01N33/53—Immunoassay; Biospecific binding assay; Materials therefor
- G01N33/5308—Immunoassay; Biospecific binding assay; Materials therefor for analytes not provided for elsewhere, e.g. nucleic acids, uric acid, worms, mites
-
- C—CHEMISTRY; METALLURGY
- C12—BIOCHEMISTRY; BEER; SPIRITS; WINE; VINEGAR; MICROBIOLOGY; ENZYMOLOGY; MUTATION OR GENETIC ENGINEERING
- C12Q—MEASURING OR TESTING PROCESSES INVOLVING ENZYMES, NUCLEIC ACIDS OR MICROORGANISMS; COMPOSITIONS OR TEST PAPERS THEREFOR; PROCESSES OF PREPARING SUCH COMPOSITIONS; CONDITION-RESPONSIVE CONTROL IN MICROBIOLOGICAL OR ENZYMOLOGICAL PROCESSES
- C12Q1/00—Measuring or testing processes involving enzymes, nucleic acids or microorganisms; Compositions therefor; Processes of preparing such compositions
- C12Q1/68—Measuring or testing processes involving enzymes, nucleic acids or microorganisms; Compositions therefor; Processes of preparing such compositions involving nucleic acids
- C12Q1/6813—Hybridisation assays
- C12Q1/6816—Hybridisation assays characterised by the detection means
- C12Q1/6818—Hybridisation assays characterised by the detection means involving interaction of two or more labels, e.g. resonant energy transfer
-
- G—PHYSICS
- G01—MEASURING; TESTING
- G01N—INVESTIGATING OR ANALYSING MATERIALS BY DETERMINING THEIR CHEMICAL OR PHYSICAL PROPERTIES
- G01N15/00—Investigating characteristics of particles; Investigating permeability, pore-volume, or surface-area of porous materials
- G01N15/10—Investigating individual particles
- G01N15/14—Electro-optical investigation, e.g. flow cytometers
- G01N15/1456—Electro-optical investigation, e.g. flow cytometers without spatial resolution of the texture or inner structure of the particle, e.g. processing of pulse signals
-
- G—PHYSICS
- G01—MEASURING; TESTING
- G01N—INVESTIGATING OR ANALYSING MATERIALS BY DETERMINING THEIR CHEMICAL OR PHYSICAL PROPERTIES
- G01N21/00—Investigating or analysing materials by the use of optical means, i.e. using sub-millimetre waves, infrared, visible or ultraviolet light
- G01N21/62—Systems in which the material investigated is excited whereby it emits light or causes a change in wavelength of the incident light
- G01N21/63—Systems in which the material investigated is excited whereby it emits light or causes a change in wavelength of the incident light optically excited
- G01N21/64—Fluorescence; Phosphorescence
- G01N21/645—Specially adapted constructive features of fluorimeters
- G01N21/6456—Spatial resolved fluorescence measurements; Imaging
- G01N21/6458—Fluorescence microscopy
-
- G—PHYSICS
- G01—MEASURING; TESTING
- G01N—INVESTIGATING OR ANALYSING MATERIALS BY DETERMINING THEIR CHEMICAL OR PHYSICAL PROPERTIES
- G01N5/00—Analysing materials by weighing, e.g. weighing small particles separated from a gas or liquid
- G01N5/04—Analysing materials by weighing, e.g. weighing small particles separated from a gas or liquid by removing a component, e.g. by evaporation, and weighing the remainder
- G01N5/045—Analysing materials by weighing, e.g. weighing small particles separated from a gas or liquid by removing a component, e.g. by evaporation, and weighing the remainder for determining moisture content
-
- G—PHYSICS
- G02—OPTICS
- G02B—OPTICAL ELEMENTS, SYSTEMS OR APPARATUS
- G02B21/00—Microscopes
- G02B21/0004—Microscopes specially adapted for specific applications
- G02B21/002—Scanning microscopes
- G02B21/0024—Confocal scanning microscopes (CSOMs) or confocal "macroscopes"; Accessories which are not restricted to use with CSOMs, e.g. sample holders
- G02B21/0036—Scanning details, e.g. scanning stages
- G02B21/0048—Scanning details, e.g. scanning stages scanning mirrors, e.g. rotating or galvanomirrors, MEMS mirrors
-
- G—PHYSICS
- G02—OPTICS
- G02B—OPTICAL ELEMENTS, SYSTEMS OR APPARATUS
- G02B21/00—Microscopes
- G02B21/0004—Microscopes specially adapted for specific applications
- G02B21/002—Scanning microscopes
- G02B21/0024—Confocal scanning microscopes (CSOMs) or confocal "macroscopes"; Accessories which are not restricted to use with CSOMs, e.g. sample holders
- G02B21/0052—Optical details of the image generation
- G02B21/0076—Optical details of the image generation arrangements using fluorescence or luminescence
-
- G—PHYSICS
- G01—MEASURING; TESTING
- G01N—INVESTIGATING OR ANALYSING MATERIALS BY DETERMINING THEIR CHEMICAL OR PHYSICAL PROPERTIES
- G01N15/00—Investigating characteristics of particles; Investigating permeability, pore-volume, or surface-area of porous materials
- G01N15/10—Investigating individual particles
- G01N15/14—Electro-optical investigation, e.g. flow cytometers
- G01N2015/1486—Counting the particles
Definitions
- This invention relates to an optical analysis method capable of acquiring useful information in an analysis of conditions (interaction, binding or dissociating condition, etc.) of a particulate object, e.g. an atom, a molecule or an aggregate thereof (Hereafter, these are called a “particle”.) such as a biological molecule, for example, protein, peptide, nucleic acid, lipid, sugar chain, amino acid or these aggregate, virus and cell, etc., or a non-biological particle, dispersed or dissolved in a solution, by using an optical system, such as the optical system of a confocal microscope or a multiphoton microscope, which can detect light from a micro region in a solution, and more specifically, relates to a method of performing a detection of a particulate object in a solution, a measurement of its concentration or its number density, etc.
- a particulate object e.g. an atom, a molecule or an aggregate thereof (Hereafter, these are called a “particle
- a “light-emitting probe” is a substance which emits light by fluorescence, phosphorescence, chemiluminescence, bioluminescence, light scattering, etc., and binds to a particle to be an observed object to enable the observation of the particle.
- patent documents 1 and 2 and non-patent documents 1-3 by means of the optical system of a laser confocal microscope and a photon counting technique, there is performed the measurement of fluorescence intensity of fluorescence molecules or fluorescently labeled molecules (fluorescent molecules, etc.), entering into and exiting out of a micro region in a sample solution (the focal region to which the laser light of the microscope is condensed, called a “confocal volume”), and based on the average dwell time (translational diffusion time) of the fluorescent molecules, etc.
- a sample solution the focal region to which the laser light of the microscope is condensed, called a “confocal volume”
- patent document 4 there is generated a histogram of fluorescence intensity of fluorescent molecules, etc., entering into and exiting out of a confocal volume, measured similarly to FCS, and the average value of the characteristic brightness of the fluorescent molecules, etc. and the average number of molecules dwelling in the confocal volume are calculated by fitting a statistical model formula to the distribution of the histogram, so that, based on the information thereof, the structure or size change, binding or dissociative conditions or dispersion and aggregation conditions of molecules can be estimated.
- Patent documents 5 and 6 there are proposed methods of detecting fluorescent substances based on a time progress of fluorescence signals of a sample solution measured using the optical system of a confocal microscope.
- Patent document 7 has proposed a signal calculation processing technique for measuring faint light from fluorescent fine particles flowing through a flow cytometer or fluorescent fine particles fixed on a substrate by a photon counting technique to detect the existences of the fluorescent fine particles in the flow or on the substrate.
- a sample amount required for the measurement may be extremely small (an amount used in one measurement is at most several tens of ⁇ L), and its concentration is extremely low as compared with the prior art, and the measuring time is also shortened extremely (In one measurement, a measuring process for time of order of seconds are repeated several times).
- those techniques are expected to be a strong tool enabling an experiment or a test at low cost and/or quickly in comparison with conventional biochemical methods, especially in conducting an analysis of rare or expensive samples often used in the field of the medical or biological research and development or in conducting tests of a large number of specimens, such as sick clinical diagnosis or the screening of bioactive substances.
- the magnitude of time fluctuation of measured fluorescence intensity is computed by a statistical procedure, and then various characteristics of fluorescent molecules, etc., entering in and exiting out of a micro region in a sample solution, are determined based on the magnitude of the fluctuation.
- concentration or number density of fluorescent molecules, etc. it is preferable to prepare the concentration or number density of fluorescent molecules, etc. to be the observation objects in the sample solution so that fluorescent molecules, etc. of the number enabling a statistical process will enter in and exit from a micro region in one measuring term of a length of order of seconds in an equilibrium, preferably so that about one fluorescent molecule, etc.
- the concentration of fluorescent molecules, etc. is about 1 nM or more.
- the concentration or number density of particles to be observed in a sample solution is much lower than the level enabling a statistical process (for example, much lower than 1 nM)
- the measuring result of fluorescence intensity would include a long period of a condition in which no object to be observed exists at all in the micro region and also the amount of observation of significant fluorescence intensity would decrease, and thus no significant or accurate analysis result could be expected in the optical analysis technique based on the statistical fluctuation of the fluorescence intensity as described above.
- the presence or absence of a fluorescent molecule, etc. to be observed in a sample can be determined from the presence or absence of generation of a fluorescence signal having a significant intensity in the measuring term over several seconds and it is disclosed that a correlation between the frequency of fluorescence signals having significant intensity and the number of the fluorescent molecules, etc. in a sample is obtained.
- patent document 6 it is suggested that the generation of a random flow agitating the inside of a sample solution improves the detection sensitivity.
- the technique described in patent document 7 is to detect individual existences of fluorescent fine particles in the flow in a flow cytometer or fluorescent fine particles fixed on a substrate, not a technique for detecting particles, such as molecules and colloids, being dissolved or dispersed in a normal condition in a sample solution, i.e. particles moving at random in a sample solution, and thus, it has not been achieved to quantitatively compute out the concentration or number density of particles dissolved or dispersed in a sample solution.
- the technique of patent document 7 includes processes, such as the measurement in a flow cytometer or the treatment of fixing fluorescence particles on a substrate, the sample amount necessary for the test increases substantially as compared with the cases of the optical analysis techniques, such as FCS, FIDA and PCH, and complicated and advanced operational techniques may be requested to a person conducting the test.
- the optical analysis techniques such as FCS, FIDA and PCH
- Applicant of the present application has proposed an optical analysis technique of observing a particle to be observed based on a new principle in Japanese patent application No. 2010-044714 and PCT/JP2011/53481.
- an optical system which can detect light from a micro region in a solution, such as an optical system of a confocal microscope or a multiphoton microscope, similarly to FCS, FIDA, etc., and additionally, the position of the micro region, i.e.
- a light detection region is moved in the sample solution, namely, the inside of the sample solution is scanned with the micro region, and when a particle which emits light (called as a “light-emitting particle” in the followings), dispersed and moving at random in the sample solution, crosses the inside of a micro region, the light emitted from the light-emitting particle in the micro region is detected, and thereby each of the light-emitting particles in the sample solution is detected individually such that it becomes possible to perform the counting of light-emitting particles and the acquisition of the information about the concentration or number density of the light-emitting particle in the sample solution.
- a particle which emits light called as a “light-emitting particle” in the followings
- a sample amount necessary for measurement may be small (for example, about several 10 ⁇ L) and the measuring time is short similarly to optical analysis techniques, such as FCS, FIDA and PCH, and also, it becomes possible to quantitatively detect characteristics, such as a concentration or a number density, of a light-emitting particle at a lower concentration or number density, as compared with the case of optical analysis techniques, such as FCS, FIDA and PCH.
- the main object of the present invention is to propose a method that advantageously employs the scanning molecule counting method especially for observing a particle dispersed and moving at random in a sample solution by means of a light-emitting probe.
- an optical analysis method of detecting light from a light-emitting probe binding to a particle dispersed and moving at random in a sample solution by using an optical system of a confocal microscope or a multiphoton microscope to detect the particle characterized by comprising steps of: preparing the sample solution containing the particle and the light-emitting probe; moving a position of a light detection region of the optical system in the sample solution by changing an optical path of the optical system; detecting light from the light detection region during moving the position of the light detection region in the sample solution; and detecting individually a light signal from each light-emitting probe binding to the particle in the detected light to detect the particle individually.
- a particle dispersed and moving at random in a sample solution is a particle, such as an atom, a molecule or an aggregate of these being dispersed or dissolved in a sample solution, (which particle may be either one emitting light or one not emitting light), and it may be an arbitrary particulate matter making the Brownian motion freely in a solution without being fixed on a substrate, etc.
- a “light-emitting probe” is a substance having a characteristic which binds to or associates with the particle to be the observed object and emits light (usually, molecules or those aggregates), and typically, it is a fluorescent particle, but may be a particle which emits light by phosphorescence, chemiluminescence, bioluminescence, light scattering, etc.
- the “light detection region” of the optical system of the confocal microscope or multiphoton microscope is the micro region where light is detected in those microscopes, which region corresponds to the region to which illumination light is condensed when the illumination light is given from an objective. In this connection, especially in a confocal microscope, this region is determined in accordance with the spatial relationship of an objective and a pinhole.
- a light signal means “a signal expressing light from a light-emitting probe having bound to a particle” unless noted otherwise.
- the detection of light is sequentially performed while the position of a light detection region is moved in the sample solution, namely, while the inside of the sample solution is scanned with the light detection region. Then, when the moving light detection region includes a randomly moving light-emitting probe having bound to or associating with a particle, the light from the light-emitting probe is detected by the light detecting portion, and thereby, the existence of one particle will be detected.
- a light-emitting probe has been dissociated from a particle to which the light-emitting probe had bound once.
- a light signal from a light-emitting probe is individually detected, and thereby, the individual existences of particles (having bound to a light-emitting probe) are sequentially detected one by one, and accordingly, diverse information on the condition of the particle in the solution will be acquired.
- the number of the particles detected during the moving of the position of the light detection region may be counted by counting the number of the individually detected particles (The Counting of particles).
- the information on the number density or concentration of the particle in the sample solution will be acquired.
- the number density or concentration of the particle can be concretely computed.
- the relative ratio of the number density or concentration to a plurality of sample solutions or a standard sample solution to be a reference of a concentration or a number density may be computed.
- the position of the light detection region is moved by changing the optical path of an optical system, the movement of the light detection region is quick without substantial generation of mechanical vibration and hydrodynamic effect in the sample solution, and therefore, the measurement of light can be performed under a stable condition without dynamic action affecting the particle to be detected (vibration and flow acting in a sample solution might change the properties of the particles). Further, since no structure for flowing a sample solution is required, the measurement and analysis can be conducted with a small amount of the sample solution (at the level of one to several tens of ⁇ L) similarly to FCS and FIDA, etc.
- the judgment, from the sequentially detected light signal, of whether or not a light-emitting probe having bound to one particle may be conducted based on the shape of the light signal detected in time series.
- it may be designed such that, when a light signal having the intensity larger than a predetermined threshold value is detected, it is detected that one light-emitting probe having bound to a particle has entered into the light detection region.
- the moving speed of the position of the light detection region in the sample solution is appropriately changed based on the characteristic or the number density or concentration of the light-emitting probe having bound to a particle in the sample solution.
- the condition of detected light from the light-emitting probe having bound to a particle may change in accordance with its characteristic, number density or concentration in a sample solution.
- the moving speed of the light detection region becomes quick, the amount of light obtained from one light-emitting probe having bound to a particle will be reduced, and therefore it is preferable that the moving speed of the light detection region can be changed appropriately so that the light from one light-emitting probe having bound to a particle can be measured precisely or with sufficient sensitivity.
- the moving speed of the position of the light detection region in the sample solution is preferably set to be higher than the diffusional moving velocity (the average moving speed of a particle owing to the Brownian motion) of a light-emitting probe having bound to a particle to be a detected object (namely, a particle and light-emitting probe combination, or a light-emitting probe which has dissociated from a particle after having bound to the particle, depending on an experimental manner).
- the inventive method when the light detection region passes through the position where a light-emitting probe having bound to a particle exists, the light emitted from the light-emitting probe is detected, so that the light-emitting probe will be detected individually.
- a light-emitting probe having bound to a particle moves at random owing to the Brownian motion to move into and out of the light detection region multiple times, the light signal from one light-emitting probe having bound to a particle (showing the existence of the particle to be detected) will be detected multiple times, and therefore it would become difficult to make the existence of one particle to be detected associate with the detected light signal.
- the moving speed of the light detection region is set higher than the diffusional moving velocity of the light-emitting probe having bound to a particle, and thereby it becomes possible to make one light-emitting probe having bound to a particle correspond to one light signal (indicating the existence of a particle).
- the diffusional moving velocity differs depending upon a light-emitting probe having bound to a particle
- the changing of the optical path of the optical system for moving the position of the light detection region may be done in an arbitrary way.
- the position of the light detection region may be changed by changing the optical path using a galvanomirror employed in the laser scan type optical microscope.
- the movement track of the position of the light detection region may be set arbitrarily, for example, which is selectable from circular, elliptical, rectangular, straight and curvilinear ones.
- the existence of a particle to be detected is found by detecting light from a light-emitting probe having bound to or associating with the particle.
- a structure for preventing the detection of light from a light-emitting probe having not bound to a particle in a sample solution may be preferably included.
- the step of separating the light-emitting probe having not bound to a particle from a sample solution may be performed.
- a concrete technique for separating a light-emitting probe having not bound to a particle there may be selected an arbitrary method of separating two or more substances physically by utilizing the difference in characteristics, for example, the difference in size or molecular weight, affinity to an arbitrary substance, electrically charged condition, etc., between a single light-emitting probe or a light-emitting probe having not bound to a particle, and a particle and light-emitting probe combination or a light-emitting probe having bound to a particle.
- a single light-emitting probe or a light-emitting probe having not bound to a particle may be eliminated from a sample solution by separating the single light-emitting probe or light-emitting probe having not bound to a particle from a particle and light-emitting probe combination or a light-emitting probe having bound to a particle, using an arbitrary method of operations including adsorption and extraction or washing through chromatography (hydrophilic/hydrophobic chromatography, affinity chromatography, an ion exchange chromatography, etc.), ultrafiltration, electrophoresis, phase separation, centrifugal separation, solvent extraction, filter adsorption, etc.
- the method may be designed such that the differentiation between a single light-emitting probe or a light-emitting probe having not bound to a particle and a particle and light-emitting probe combination or a light-emitting probe having bound to a particle becomes possible by choosing a light-emitting probe or other components in a sample solution so as to provide a difference in the light-emitting characteristics between a single light-emitting probe or a light-emitting probe having not bound to a particle and a particle and light-emitting probe combination or a light-emitting probe having bound to a particle in a sample solution, or so as to avoid the emission (from a sample solution) of light of a single light-emitting probe or a light-emitting probe having not bound to a particle.
- This structure is advantageous in that no operation of separating physically a single light-emitting probe or a light-emitting probe having not bound to a particle from a particle and light-emitting probe combination or a light-emitting probe having bound to a particle is required.
- a substance whose light-emitting characteristic changes when it binds to a particle to be detected may be chosen as a light-emitting probe so that the light from the light-emitting probe having bound to a particle to be detected can be selectively detected in the step of detecting light.
- an intercalator fluorescent dye which exhibits increase of fluorescence intensity and/or change of fluorescence wavelength when it binds to a nucleic acid or a nucleic acid analogue, will be chosen as a light-emitting probe
- a dye fluorescent dyes, e.g. hydrophobic probes: ANS, MANS, TNS
- ANS, MANS, TNS a dye whose fluorescence intensity and/or fluorescence wavelength changes owing to its peripheral environmental change when it binds to the protein
- a substance consisting of at least two components, in which fluorescence will be emitted owing to the mutual positional change of the above-mentioned at least two components when the substance binds to a particle to be detected.
- a fluorescent protein which will emit strong fluorescence owing to structural change when it binds to a particular particle and a molecule which will assemble to form a fluorescent metal complex when it binds to a particular particle (a ligand of a complex).
- a single light-emitting probe or a light-emitting probe having not bound to a particle hardly emits light, or even if it emits light, its wavelength is different from that of the particle and light-emitting probe combination, and therefore it is possible to detect selectively the light from the particle and light-emitting probe combination.
- a fluorescence energy transfer phenomenon may be used advantageously.
- the step of preparing a sample solution there may be conducted a step of binding a light-emitting probe having not bound to a particle with an acceptor which absorbs the light which the light-emitting probe emits.
- the acceptor is an arbitrary substance which binds to or associates with only a single light-emitting probe or a light-emitting probe having not bound to a particle, and (immediately) absorbs the light which a light-emitting probe emits by a fluorescence energy transfer (quencher or energy acceptor).
- this light-emitting probe even when a light-emitting probe having not bound to a particle to be detected enters into the light detection region, this light-emitting probe has bound to the acceptor, and thus, it emits no light or only the light of different wavelength from that emitted from a particle and light-emitting probe combination or a light-emitting probe having bound to a particle, and thereby it becomes possible to detect only the light of a particle and light-emitting probe combination or a light-emitting probe having bound to a particle.
- a particle to be detected is a nucleic acid or a nucleic acid analogue and a light-emitting probe is a fluorescently labeled nucleic acid or nucleic acid analogue
- a particle and light-emitting probe combination is formed by making the particle to be detected and light-emitting probe react in a sample solution, and subsequently when a nucleic acid or nucleic acid analogue to which an acceptor for the light of the fluorescent label of the light-emitting probe has been attached is added into the sample solution, the nucleic acid or nucleic acid analogue to which the acceptor has been attached binds to the light-emitting probe which has not bound to a particle to be detected, and thereby, it becomes possible to detect selectively the light only from the particle and a light-emitting probe combination.
- a substance which has an energy donor site and an energy acceptor site producing a fluorescence energy transfer phenomenon when those are close mutually, wherein the distance between the energy donor site and energy acceptor site changes when the substance binds to a particle to be detected (Molecular beacon method, Scorpion method, etc.).
- a single light-emitting probe since the extent of the occurrence of the fluorescence energy transfer phenomenon varies depending upon whether or not the light-emitting probe has bound to a particle to be detected, a single light-emitting probe does not emit light or the emission wavelength of a single light-emitting probe and the emission wavelength of a particle and light-emitting probe combination differ from one another, and thereby it becomes possible to detect selectively the light from the particle and light-emitting probe combination.
- the light-emitting probe for the light-emitting probe, there are prepared a first probe used for an energy donor in a fluorescence energy transfer phenomenon and a second probe used for an energy acceptor in the fluorescence energy transfer phenomenon, and those are mixed with a particle to be detected. Then, from the combination that both the first and second probes bind to the particle to form, the light of the second probe is emitted through a fluorescence energy transfer phenomenon, and thus, only the light from the combination can be selectively detected, being distinguished from the light from the first probe (In this case, the second probe having not bound to a particle hardly emits light).
- a particle to be detected has a site which becomes an energy acceptor of the light emitted by a light-emitting probe
- a light-emitting probe it may be achieved to selectively detect only the light from the particle and light-emitting probe combination by choosing, as a light-emitting probe, a substance having a site to be an energy acceptor of the light emitted by the light-emitting site of the particle and detecting the light emitted from the light-emitting probe through the fluorescence energy transfer phenomenon which occurs when the light-emitting probe binds to the particle.
- the particle detected by the inventive method may be a biological particulate object, such as a biological molecule, e.g. a protein, a peptide, a nucleic acid, a lipid, a sugar chain, an amino acid or an aggregate of these, etc., a virus or a cell, or a non-biological particle (for example, an atom, a molecule, a micelle, a metallic colloid, etc.), and the light-emitting probe may be an arbitrary substance which specifically or nonspecifically binds or adheres to a particle as described above.
- the probe may be a dye molecule, a nucleic-acid binding protein, etc. that binds with a nucleic acid.
- the above-mentioned inventive method is usable in an experiment of detecting an arbitrary particle using various light-emitting probes.
- the inventive method is applicable to an experiment, in which a substance having an energy donor site and an energy acceptor site between which a fluorescence energy transfer phenomenon occurs and capable of being decomposed by a predetermined decomposition reaction when the substance has bound to a certain particle is employed as a light-emitting probe; this light-emitting probe is added in a sample solution to be tested; the light from the sample solution is detected; and whether or not the light-emitting probe having bound to the above-mentioned particle, namely whether or not the above-mentioned particle exists in the sample solution is checked in accordance with the presence or absence of a fluorescence energy transfer phenomenon.
- the optical analysis technique realized by the above-mentioned inventive method employs, for its light detecting mechanism itself, a structure to detect light from a light detection region in a confocal microscope or a multiphoton microscope similarly to the cases of optical analysis techniques, such as FCS, FIDA and PCH, and thus the amount of a sample solution may be similarly small.
- the inventive optical analysis technique is applicable to a sample solution in which the number density or concentration of a particle is substantially lower than the level required for the optical analysis techniques, such as FCS, FIDA and PCH.
- each particle dispersed or dissolved in a solution is individually detected in this invention, it becomes quantitatively possible by using the information thereof to conduct the counting of particles, the computation of the concentration or number density of a particle in a sample solution or the acquisition of the information on the concentration or number density.
- patent documents 5 and 6 could acquire the correlation between the aggregate in the frequency of fluorescence signals having an intensity beyond a predetermined threshold value within a predetermined time and the number of particles of fluorescent molecules, etc.
- a particle passing through a light detection region is made associated with a detected light signal in 1 to 1 manner so that one particle will be detected at one time, the counting of particles dispersed and moving at random in a solution becomes possible, and it becomes possible to determine the concentration or number density of the particle in a sample solution precisely as compared with the conventional art.
- the inventive method of detecting individually particles in a sample solution using a light-emitting probe; counting those number and determining the particle concentration it is possible to determine a concentration much lower than the concentration which can be determined based upon the fluorescence intensity measured by a fluoresce spectrometer or a plate reader.
- the reliability of a quantitatively detected result is improved as compared with e.g., the case in which a flow is made generated in a sample (When a flow is given, it is difficult to give an always uniform flow speed and the device structure becomes complicated, and also, the required sample amount increases substantially, and the particles, light-emitting probes, their combinations or other substances in the solution may deteriorate or be denaturalized by the hydrodynamic action owing to the flow), and it becomes possible to perform a measurement under a condition without influences or artifacts due to dynamic action against a particle to be a detected object in a sample solution.
- FIG. 1A is a schematic diagram of the internal structure of the optical analysis device according to the present invention.
- FIG. 1B is a schematic diagram of a confocal volume (an observation region of a confocal microscope).
- FIG. 1C is a schematic diagram of the mechanism for changing the direction of the mirror 7 to move the position of a light detection region in a sample solution.
- FIGS. 2A and 2B are a schematic diagram explaining the principle of the light detection by the optical analysis technique according to the present invention and a schematic diagram of the variation of the measured light intensity with time, respectively.
- FIGS. 3A-3H are drawings showing schematically examples of structures for preventing the detection of light of a light-emitting probe having not bound to a particle.
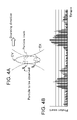
- FIGS. 4A and 4B are a drawing of a model in the case that a particle to be observed crosses a light detection region owing to Brownian motion and a diagram showing the example of the variation of the photon counts (light intensity) with time in this case, respectively.
- FIGS. 5A and 5B are a drawing of a model in the case that a particle to be observed crosses a light detection region by moving the position of the light detection region in a sample solution at a velocity quicker than the diffusional moving velocity of the particle to be observed, and a diagram showing the example of the variation of the photon counts (light intensity) with time in this case, respectively.
- FIG. 6 is a drawing showing the procedures in the form of a flow chart for the counting of particles from the time variation of photon counts (light intensity) measured by the inventive method.
- FIGS. 7A and 7B are drawings explaining one example of a signal processing step of the detected signals in the procedure for conducting the counting of particles from the time variation of the photon counts (light intensity) measured by the inventive method.
- FIG. 8 shows examples of photon count data measured by the inventive method (bar graph); curve obtained by carrying out the smoothing of the data (dotted line); and gauss functions fitted on the pulse existing regions (solid line).
- the signals attached with “noise” are disregarded as signals due to noises or contaminants.
- FIGS. 9A, 9B and 9C each show results of nucleic acid concentration detection experiments in accordance with the inventive method, results of nucleic acid concentration detection experiments using a plate reader and schematic diagrams of the condition of molecules in the nucleic acid concentration detection experiments.
- FIGS. 10A and 10B each show experimental results of detecting a nucleic acid having a certain base sequence using a molecular beacon in accordance with the inventive method, and experimental results of detecting a nucleic acid having a certain base sequence using a molecular beacon with a plate reader.
- FIG. 11 shows results of experiments of detecting a particle to be observed in a sample solution from which unreacted fluorescence-labeled probes have been removed by a physical purification in accordance with the inventive method.
- a bar graph is an average, and an error bar is a standard deviation.
- FIG. 12A is a drawing showing schematically the conditions of molecules in experiments of detecting a nucleic acid using a fluorescence energy transfer (FRET) in accordance with the inventive method
- FIG. 12B shows results of the detected pulse numbers in the experiments.
- a bar graph is an average
- an error bar is a standard deviation.
- FIG. 13A is a drawing showing schematically the conditions of molecules in experiments of detecting a nucleic acid (a particle to be observed) using the fluorescence quenching method in accordance with the inventive method
- FIG. 13B shows results of the detected pulse numbers in the experiments.
- a bar graph is an average
- an error bar is a standard deviation.
- FIG. 14A is a drawing showing schematically the conditions of molecules in experiments of detecting a nucleic acid using a QUAL reaction in accordance with inventive method
- FIG. 14B shows results of the detected pulse numbers in the experiments.
- a bar graph is an average and an error bar is a standard deviation.
- FIG. 15 shows examples of the time variation of the photon count (light intensity) obtained in a conventional optical analysis technique computing fluorescence intensity fluctuation, where FIG. 15A shows a case that the particle concentration is at a level providing a sufficient precision in the measurement, and FIG. 15 B shows a case that the particle concentration in a sample is significantly lower than the case of (A).
- the inventive method can be realized with an optical analysis device formed by combining an optical system of a confocal microscope and a photodetector as schematically illustrated in FIG. 1A , with which FCS, FIDA, etc. can be performed.
- the optical analysis device 1 consists of an optical system 2 - 17 and a computer 18 for acquiring and analyzing data together with controlling the operation of each part in the optical system.
- the optical system of the optical analysis device 1 may be the same as the optical system of a usual confocal microscope, where laser light emitted from a light source 2 and transmitted through the inside of a single mode fiber 3 (Ex) forms light diverging to be radiated at the angle decided by an inherent NA at the emitting end of the fiber; and after forming a parallel beam with a collimator 4 , the light is reflected on a dichroic mirror 5 and reflective mirrors 6 and 7 , entering into an objective 8 .
- the objective 8 typically, there is placed a sample container or a micro plate 9 having wells 10 arranged thereon, to which one to several tens of ⁇ L of a sample solution is dispensed, and the laser light emitted from the objective 8 is focused in the sample solution in the sample container or well 10 , forming a region having strong light intensity (excitation region).
- particles to be observed objects and light-emitting probes binding to the particles which probes are molecules to which a light emitting label such as a fluorescent dye is attached, are dispersed or dissolved, and when a particle which has bound to or associated with a light-emitting probe (a light-emitting probe dissociated from a particle after once binding to the particle, depending on an experimental manner) enters into the excitation region, the light-emitting probe is excited and emits light during dwelling in the excitation region.
- a light-emitting probe a light-emitting probe dissociated from a particle after once binding to the particle, depending on an experimental manner
- a barrier filter 14 where light components only in a specific wavelength band region are selected
- the pinhole 13 is located at a conjugate position of the focal position of the objective 8 , and thereby only the light emitted from the focal region of the laser light, i.e., the excitation region, as schematically shown in FIG. 1B , passes through the pinhole 13 while the light from regions other than the excitation region is blocked.
- the focal region of the laser light illustrated in FIG. 1B is a light detection region in this optical analysis device, whose effective volume is usually about 1-10 fL (Typically, the light intensity is spread in accordance with a Gaussian type or Lorentz type distribution having the peak at the center of the region.
- the effective volume is a volume of an approximate ellipsoid bordering a surface where the light intensity reduced to 1/e 2 of the peak intensity), which is called as “confocal volume”.
- confocal volume a volume of an approximate ellipsoid bordering a surface where the light intensity reduced to 1/e 2 of the peak intensity
- a super high sensitive photodetector usable for the photon counting, is used for the photodetector 16 .
- a stage position changing apparatus 17 a for moving the horizontal position of the micro plate 9 , in order to change the well 10 to be observed.
- the operation of the stage position changing apparatus 17 a may be controlled by the computer 18 . According to this structure, quick measurement can be achieved even in the presences of two or more specimens.
- a mechanism for changing the optical path of the optical system to scan the inside of the sample solution with the light detection region namely to move the position of the focal region i.e., the light detection region, within the sample solution.
- a mechanism for moving the position of the light detection region for example, as schematically illustrated in FIG. 1C , there may be employed a mirror deflector 17 which changes the direction of the reflective mirror 7 .
- This mirror deflector 17 may be the same as that of a galvanomirror device equipped on a usual laser scan type microscope.
- the mirror deflector 17 is driven in harmony with the light detection of the photodetector 16 under the control of the computer 18 .
- the movement track of the position of the light detection region may be arbitrarily selected from circular, elliptical, rectangular, straight and curvilinear ones, or a combination of these (The program in the computer 18 may be designed so that various moving patterns can be selected).
- the position of the light detection region may be moved in the vertical direction by moving the objective 8 up and down.
- the above-mentioned optical system is used as a multiphoton microscope. In that case, since the light is emitted only from the focal region of the excitation light (light detection region), the pinhole 13 may be removed. Further, in the case that a particle and light-emitting probe combination or a light-emitting probe emits light owing to a chemiluminescence or bioluminescence phenomenon without excitation light, the optical system 2 - 5 for generating excitation light may be omitted.
- the above-mentioned optical system of the confocal microscope is used as it is.
- two or more excitation light sources 2 may be provided so that the wavelength of the excitation light can be selected appropriately in accordance with the excitation wavelength of a particle and light-emitting probe combination or a light-emitting probe.
- two or more photodetectors 16 may also be provided so that, when the sample contains two or more kinds of particle and light-emitting probe combinations or light-emitting probes whose wavelengths differ from one another, the respective lights from them can be detected separately in accordance with the wavelengths.
- Spectral analysis techniques such as FCS and FIDA
- FCS and FIDA are advantageous in that the required sample amount is extremely small and a test can be performed promptly as compared with the conventional biochemical analytical techniques.
- concentration and characteristics of a particle to be observed are principally computed based on the fluorescence intensity fluctuation, and therefore, in order to obtain accurate measurement results, the concentration or number density of the particle to be observed in a sample solution should be at a level where about one particle to be observed always exists in a light detection region CV during the fluorescence intensity measurement as schematically drawn in FIG. 15A so that significant light intensity (photon count) can be always detected in the measuring term as shown in the right-hand side of the drawing.
- the concentration or number density of the particle to be observed is lower than that, for example, at the level where the particle to be observed rarely enters into the light detection region CV as drawn on FIG. 15B , no significant light intensity (photon count) would appear in a part of the measuring term as illustrated on the right-hand side of the drawing, and thus, accurate computation of light intensity fluctuation would become difficult. Also, when the concentration of the particle to be observed is significantly lower than the level where about one particle to be observed always exists in the inside of the light detection region during the measurement, the calculation of light intensity fluctuation would become subject to the influence of the background, and the measuring term should be made long in order to obtain the significant quantity of the light intensity data (photon count), sufficient for the calculation.
- an optical analysis technique based on a new principle which enables the detection of characteristics of a particle to be observed, such as its number density or concentration, even when the concentration of the particle to be observed is lower than the level requested in the above-mentioned spectral analysis techniques, such as FCS and FIDA.
- the light detection is performed together with moving the position of the light detection region CV in a sample solution, namely, scanning the inside of the sample solution with the light detection region CV by driving the mechanism (mirror deflector 17 ) for moving the position of the light detection region to change the optical path as schematically drawn in FIG. 2 .
- the mechanism mirror deflector 17
- FIG. 2A during the moving of the light detection region CV (in the drawing, time to-t 2 ), when the light detection region CV passes through a region where one particle (In the drawing, a fluorescent dye is attached as a light-emitting probe) exists (t 1 ), a significant pulsed light intensity (Em) will be detected as drawn in FIG. 2B .
- the particle bound to the light-emitting probe are detected individually, and by counting the number thereof, the information about the number, concentration or number density of the particles existing in the measured region can be acquired.
- no statistical calculation processes such as the calculation of the fluorescence intensity fluctuation, are conducted and the particles are one by one detected, and therefore, the information about the concentration or number density of the particle is acquirable even in a sample solution with a low particle concentration at the level where no sufficiently precise analysis is available in FCS and FIDA.
- noise signals are eliminated from the detected result in the step of detecting the signals corresponding to the respective particles from the detected light signals, and the concentration is computed by counting only the signals corresponding to the respective particles, and therefore, it becomes possible to detect a lower concentration than in a case that a concentration of a particle is detected under the assumption that fluorescence intensity is proportional to a concentration of a fluorescently labeled particle.
- the accuracy of measurement of the particle concentration on the side of higher particle concentration is also improved in comparison with the conventional method in which the concentration is determined under the assumption that fluorescence intensity is proportional to a concentration of a fluorescently labeled particle.
- the influence due to the reduction of the fluorescence intensity per particle is small in the step of detecting the signals corresponding to the respective particles from the detected light signals, and the concentration is computed from the particle count, and thereby, it becomes possible to detect a concentration to the level higher than in the case of detecting a concentration under the assumption that fluorescence intensity is proportional to a concentration of a fluorescently labeled particle.
- the particle to be observed in the inventive method may be an arbitrary particle as long as it is dispersed and moving at random in a sample solution, such as a dissolved molecule, and the particle may be, for instance, a biological molecule, i.e. a protein, a peptide, a nucleic acid, a lipid, a sugar chain, an amino acid, etc. or an aggregate thereof, a virus, a cell, a metallic colloid or other non-biological molecule.
- a biological molecule i.e. a protein, a peptide, a nucleic acid, a lipid, a sugar chain, an amino acid, etc. or an aggregate thereof, a virus, a cell, a metallic colloid or other non-biological molecule.
- the particles to be observed are typically mixed with light-emitting probes, provided with a light emitting label (a fluorescent molecule, a phosphorescent molecule, a chemiluminescent or bioluminescent molecule) in an arbitrary manner, in a sample solution (Typically, it is an aqueous solution, but not limited to this, and it may be an organic solvent or other arbitrary liquids), in which a light-emitting probe binds to or associates with a particle to be observed to form a combination so that the light emitted by the light-emitting probe will serve as the mark of the existence of the particle to be observed, thereby enabling the detection of the particle to be observed (As stated later, in some experimental ways, a particle to be observed is detected by detecting a light-emitting probe which had bound to the particle to be observed once and then has been dissociated from the particle to be observed through a predetermined treatment).
- a light emitting label a fluorescent molecule, a phosphorescent molecule,
- a particle-to-be-observed and light-emitting probe combination when a particle to be observed is a nucleic acid, there will be employed for a light-emitting probe a nucleic acid or a nucleic acid analogue having the base sequence complementary to the nucleic acid to be the particle to be observed, a nucleic-acid binding protein, a nucleic-acid binding antibody, etc.
- a fluorescently labeled antibody discriminating a DNA-RNA hybrid is used as a light-emitting probe when the particle to be observed is an association of DNA-RNA (hybrid capture method).
- the light-emitting probes neither binding to nor associating with a particle to be observed become present in the sample solution, and, if the light from a light-emitting probe having not bound to the particle to be observed or a single light-emitting probe is detected without being distinguished from the light from the particle and light-emitting probe combination, the accuracy in the detection of the particle to be observed would deteriorate, also.
- a structure for preventing the detection of the light of a light-emitting probe having not bound to a particle to be observed or a single light-emitting probe namely, a structure which eliminates from the detected result the light from a light-emitting probe having not bound to a particle to be observed or a single light-emitting probe.
- the following structures may be employed.
- a light-emitting probe having not bound to a particle to be observed or a single light-emitting probe may be separated and removed from a sample solution by an arbitrary method of separating two or more substances physically through utilizing the difference in characteristics, such as the difference in size or molecular weight, an affinity to an arbitrary substance, electrically charged condition, etc., between the light-emitting probe having not bound to the particle to be observed or the single light-emitting probe and the particle and light-emitting probe combination or the light-emitting probe having bound to the particle to be observed.
- a physical separation technique of substances usually performed in this field such as operations including adsorption, extraction or washing through chromatography (hydrophilic/hydrophobic chromatography, affinity chromatography, ion exchange chromatography etc.), ultrafiltration, electrophoresis, phase separation, centrifugal separation, solvent extraction, filter adsorption, etc.
- a method of eliminating single light-emitting probes from a sample solution as ELISA method, in which, into a sample solution where particles to be observed and light-emitting probes have been mixed, different probes binding to particles to be observed (probe for separation) are further mixed to bind to the particles to be observed; and then the sample solution is exposed to a carrier which binds to the probes for separation so that only the combination consisting of the particle to be observed, light-emitting probe and the probe for separation will be held, while the single light-emitting probes are separated and removed from a sample solution (for example, by washing).
- ELISA method in which, into a sample solution where particles to be observed and light-emitting probes have been mixed, different probes binding to particles to be observed (probe for separation) are further mixed to bind to the particles to be observed; and then the sample solution is exposed to a carrier which binds to the probes for separation so that only the combination consisting of the particle to be observed, light-emitting probe and
- Such a fluorescent dye may be a dye whose excitation and/or emission wavelength changes when it binds to a particle to be observed or a dye whose fluorescence intensity notably increases when it binds to a particle to be observed.
- a particle to be observed is a nucleic acid or a nucleic acid analogue
- intercalator fluorescent dyes of nucleic acid Ethidium bromide, Acridine orange, SYTOX Orange, SYTOX Red, SYBR Green I, SYBR Green II, SYBR Gold, Picogreen, OllGreen, Gel Red, Gel Green, Ribo Green, EvaGreen and a dye having a cyanine skeleton, etc.
- a particle to be observed is a protein
- a dye whose fluorescence intensity and fluorescence wavelength change owing to peripheral environmental change when it binds with a protein is employable as a light-emitting probe.
- the following fluorescent dyes are useable: e.g. Naphthalene sulfonic acids, which is a hydrophobic probe, such as 1-anilinonaphthalene-8-sulfonic acid (ANS), N-methyl-2-anilinonaphthalene-6-sulfonic acid (MANS), 2-p-toluidinylnaphthalene-6-sulfonic acid (TNS), Dimethylamino naphthalenes (dansyl), dyes liable to be affected by the influence of local pH or dielectric constant, such as TAMRA, Fluorescein, 6-joe, BODIPY, TMR, BODIPY TR, Alexa 488, Alexa 532, BODIPY FL, BODIPY FL/C3, BODIPY FL/C6, FITC, EDANS, Rhodamine 6G, TMR, TMRITC, x-rhodamine, Texas Red, BODIPY 5-FAM, BODIPY R6G
- ANS 1-
- a substance consisting of at least two components, which emits fluorescence when the mutual position of the at least two components changes when the substance binds to a particle to be observed, can be employed as a light-emitting probe whose wavelength characteristic changes if it binds to a particle to be observed.
- a fluorescent protein which structurally changes to emit strong fluorescence when it binds to a certain particle or a molecule which assembles to form a fluorescent metal complex when it binds with a certain particle (Ligand of a complex).
- a method of detecting with the device 1 only the light from a particle-to-be-observed and light-emitting probe combination or a light-emitting probe having bound to a particle to be observed by utilizing the effect of a fluorescence energy transfer phenomenon using at least two kinds of fluorescent dyes so that the emission of light from the light-emitting probe has not bound to a particle to be observed will be prevented, or so that the wavelength of the light from a particle-to-be-observed and light-emitting probe combination or a light-emitting probe having bound to a particle to be observed and the wavelength of the light from a single light-emitting probe or a light-emitting probe having not bound to a particle to be observed will be made different from one another.
- the manners using the fluorescence energy transfer phenomenon may be as follows:
- the fluorescence quenching may be used.
- a substance binding to a single light-emitting probe or a light-emitting probe having not bound to a particle to be observed, but not binding to a particle and light-emitting probe combination, and also absorbing the light emitted by the light-emitting probe through the fluorescence energy transfer (Light acceptor) is added in a sample solution, and the substance is made bind only to the light-emitting probe having not bound to the particle to be observed or the single light-emitting probe in a sample solution.
- the light is emitted from the light-emitting probe in the particle and light-emitting probe combination, which light is detected with a photodetector, and the light emitted from the single light-emitting probe or the light-emitting probe having not bound to the particle to be observed, to which probe the light acceptor has bound, is absorbed by the light acceptor, and accordingly, the light from the single light-emitting probe or the light-emitting probe having not bound to the particle to be observed is quenched so that the light will not be reflected in a detected result.
- a fluorescently labeled nucleic acid or nucleic acid analogue is used as a light-emitting probe for a particle to be observed of a nucleic acid or a nucleic acid analogue
- a light-emitting probe there may be employed a substance having an energy donor site and an energy acceptor site, which substance is designed so that the distance between the energy donor site and the energy acceptor site will change when the light-emitting probe binds a particle to be observed.
- Molecular beacon namely, a nucleic acid molecule, as schematically drawn on FIG. 3D , to which two dyes each to be an energy donor and an energy acceptor in the fluorescence energy transfer phenomenon are attached.
- FIG. 3D Molecular beacon
- the added dyes are close to one another so that the fluorescence energy transfer phenomenon will occur in the irradiation of the excitation light for the energy donor, and accordingly, the light emitted by the energy donor is transferred to the energy acceptor and quenched, or the light of the emission wavelength of the dye of the energy acceptor (the light of wavelength 2 ) is emitted; but, when the molecular beacon binds to a particle to be observed (nucleic acid or nucleic acid analogue) ( FIG.
- the distance between the two dyes becomes long, and thus, no fluorescence energy transfer phenomenon occurs in the irradiation of the excitation light for the energy donor, resulting in the emission of the light of the emission wavelength of the energy donor (the light of wavelength 1 ). Therefore, in observation, by detecting selectively only the light of the emission wavelength of the energy donor of the molecular beacon, it becomes possible to detect a particle to be observed even in the presence of a single molecular beacon in a sample solution. Moreover, as a similar principle, a scorpion probe may be used.
- a light-emitting probe which is designed such that no fluorescence energy transfer phenomenon occurs in a single light-emitting probe (or a light-emitting probe having not bound to a particle to be observed) while a fluorescence energy transfer phenomenon occurs in a particle and light-emitting probe combination (In that case, the light of the emission wavelength of an energy acceptor is detected selectively).
- a light-emitting probe may be not only a nucleic acid or a nucleic acid analogue, but also, a substance having at least two light-emitting sites in which the distance between the at least two light-emitting sites changes when the substance binds to or associates with a particle to be observed, resulting in the change of the wavelength of the emitted light.
- a first probe (light-emitting probe 1 ) to be an energy donor and a second probe (light-emitting probe 2 ) to be an energy acceptor are each prepared as light-emitting probes, and added into a sample solution. Then, both the light-emitting probe 1 and the light-emitting probe 2 bind to a particle to be observed to form a combination, and when the light which excites the light-emitting probe 1 is irradiated in this condition, the fluorescence energy transfer phenomenon occurs within the combination so that the light of the emission wavelength (wavelength 2 ) of the light-emitting probe 2 will be emitted from the combination.
- the light-emitting probe 1 having not bound to a particle to be observed the light of its emission wavelength (wavelength 1 ) is emitted, and the light-emitting probe 2 having not bound to a particle to be observed, not substantially excited, emits no light. Accordingly, in the system of FIG. 3E , through making the light-emitting probe 1 emit light, the light of the emission wavelength of the light-emitting probe 2 is emitted only from the combination, and therefore, by detecting selectively the light of the emission wavelength of the light-emitting probe 2 , it becomes possible to detect a particle to be observed with high accuracy, without removing a light-emitting probe physically out of a sample solution.
- a substance which functions as an energy donor to the light-emitting site of the particle to be observed may be chosen as a light-emitting probe.
- the light (wavelength 1 ) of the emission wavelength is emitted from a single light-emitting probe, the light emitted from the light-emitting probe is absorbed by the light-emitting site of the particle to be observed in the particle to be observed to which the light-emitting probe bound, and then the light (wavelength 2 ) of the emission wavelength of the light-emitting site of the particle to be observed is emitted.
- a light-emitting probe emit light and detecting selectively the light of the emission wavelength of the light-emitting site of the particle to be observed, it becomes possible to detect the particle to be observed with high accuracy without removing a light-emitting probe physically out of a sample solution.
- a particle to be observed is a nucleic acid
- an arbitrary fluorescently labeled substance which gives energy to guanine in the nucleic acid (guanine becomes the energy acceptor) when it binds to nucleic acid may be chosen as a light-emitting probe.
- a particle to be observed is a protein
- an arbitrary labeled substance which gives energy to a tryptophan in the protein i.e., the tryptophan becomes the energy acceptor
- the tryptophan becomes the energy acceptor
- a substance which functions as an energy acceptor for the light-emitting site of the particle to be observed may be chosen as a light-emitting probe.
- the light-emitting probe absorbs the light emitted from the light-emitting site of the particle to be observed so that the light of the emission wavelength (wavelength 2 ) of the light-emitting probe will be emitted, while the single light-emitting probe emits no light.
- the light-emitting site of a particle to be observed emit light and detecting the light of the emission wavelength of the light-emitting probe selectively, it becomes possible to detect the particle to be observed with high accuracy, without removing a light-emitting probe physically out of a sample solution.
- nucleic acid in the field of research of the base sequence, structure or characteristics of nucleic acid, there is known an experimental method using, as a probe for searching for a base sequence of a nucleic acid, a nucleic acid molecule having an energy donor site and an energy acceptor site where a fluorescence energy transfer phenomenon occurs, and being designed to be decomposed by a predetermined decomposition reaction in a condition that it has bound to a nucleic acid having the complementary base sequence.
- the above-mentioned probe is added to a sample to be tested, and if a nucleic acid including a base sequence complementary to the base sequence of the probe is present in the sample, the probe will bind to the nucleic acid (see the left drawing of FIG. 3H ).
- a predetermined decomposition reaction is progressed, only the probe having bound to the nucleic acid, or both the probe and the nucleic acid are decomposed, so that the energy donor site and energy acceptor site on the probe will separate apart (see the right drawing of FIG. 3H ), and accordingly, no fluorescence energy transfer phenomenon will occur, resulting in that the light (wavelength 1 ) from the energy donor site becomes observable.
- the probe does not bind to a nucleic acid, and the probe is not discomposed even if the predetermined decomposition reaction is conducted, and therefore, on the probe, the light from the energy donor site is absorbed by the energy acceptor site and not emitted to the outside. Namely, in the above-mentioned experiment, in accordance with whether or not the light from an energy donor site is detected, it can be detected whether or not a nucleic acid to be observed is present in a sample.
- the inventive method may be used in an experiment which uses a light-emitting probe in which a fluorescence energy transfer phenomenon occurs as described above, and which will be decomposed by a predetermined decomposition reaction when it has bound to a particle to be observed (for example, a nucleic acid).
- a particle to be observed for example, a nucleic acid
- the light detected in the device is light emitted from the light-emitting probe decomposed after binding to the particle to be observed.
- a sample solution in each experiment may be prepared in an usual manner.
- the wavelength of the light which should be detected in Measurement of light intensity is the wavelength of the light emitted after the decomposition of the light-emitting probe.
- the detected particle count is primarily the number of the decomposed light-emitting probes, which number will be equal to the number of the molecules of the nucleic acids or nucleic acid analogues to which the light-emitting probes have bound.
- the measurement of the light intensity in the inventive optical analysis may be performed in the same manner as the measurement process of the light intensity in FCS or FIDA except driving the mirror deflector 17 to move the position of the light detection region within the sample solution (to scan in the sample solution) during the measurement.
- the computer 18 executes programs memorized in a storage device (not shown)(the process of changing the optical path in order to move the position of the light detection region in the sample solution, and the process of detecting light from the light detection region during the moving of the position of the light detection region), and then illuminating the light detection region in the sample solution with the excitation light and measuring light intensity will be started.
- the mirror deflector 17 drives the mirror 7 (galvanomirror) to move the position of the light detection region in the well 10 , and simultaneously with this, the photodetector 16 sequentially converts the detected light into an electric signal and transmits it to the computer 18 , which generates the time series light intensity data from the transmitted light signals and store it in an arbitrary manner.
- the photodetector 16 is typically a super high sensitive photodetector which can detect an arrival of a single photon, and thus the detection of light may be the photon counting performed in the manner of measuring sequentially the number of photons which arrive at the photodetector for every predetermined unit time (BIN TIME), for example, every 10 ⁇ s, during a predetermined time, where the time series light intensity data will be a time series photon count data.
- BIN TIME predetermined unit time
- the moving speed of the position of the light detection region during the measurement of the light intensity may be a predetermined velocity set arbitrarily, for example, experimentally or in order to meet the purpose of an analysis.
- the region size or volume through which the light detection region has passed is required, and therefore, the moving of the position of the light detection region is performed in a manner enabling the grasping of the moving distance.
- the moving speed is constant, although not limited thereto.
- the moving speed of the position of the light detection region in order to perform quantitatively precisely individual detection of a particle to be observed from the measured time series light intensity data or the counting of the number of particles to be observed, it is preferable that the moving speed is set to a value quicker than the moving speed in the random motion, i.e., Brownian motion of a particle to be observed (more strictly, a particle and light-emitting probe combination or a light-emitting probe having been decomposed and liberated after the binding to a particle). Since the particle to be observed in the inventive optical analysis technique is a particle dispersed or dissolved in a solution and moving at random freely, its position moves with time owing to the Brownian motion.
- the particle moves at random in the region as schematically drawn in FIG. 4A , whereby the light intensity changes at random as shown in FIG. 4B (As already noted, the excitation light intensity in the light detection region is reduced from the peak at the center of the region toward its outside), so that it becomes difficult to determine a significant light intensity change corresponding to each particle to be observed. Then, preferably, as drawn in FIG.
- the moving speed of the position of the light detection region is set to be quicker than the average moving speed of a particle by the Brownian motion (diffusional moving velocity) so that a particle will cross the light detection region in an approximately straight line and thereby the profile of the change of the light intensity corresponding to each particle becomes almost uniform in the time series light intensity data as illustrated in FIG. 5B (When a light-emitting particle passes through the light detection region in an approximately straight line, the profile of the light intensity change is similar to the excitation light intensity distribution) and the correspondence between each particle to be observed and light intensity can be easily determined.
- the moving speed of the position of the light detection region may be set to its 10 times or more, e.g. 15 mm/s, etc.
- an appropriate moving speed of the position of the light detection region may be determined by repeating the executions of a preliminary experiment with setting various moving speeds of the position of the light detection region in order to find the condition that the profile of a light intensity variation becomes an expected profile (typically, similar to the excitation light intensity distribution).
- the light intensity variation corresponding to the particle to be observed in the time series light intensity data has a profile reflecting the light intensity distribution in the light detection region (determined by the optical system) (usually approximately bell shape) as schematically drawn in FIG. 7A .
- a threshold value Io is set for the light intensity, and when the time width ⁇ for which the light intensity exceeding the threshold value continues is in a predetermined range, the profile of the light intensity may be judged to correspond to one particle having passed through the light detection region, and thereby one particle to be observed is detected.
- the threshold value Io for the light intensity and the predetermined range for the time width ⁇ are determined based on a profile expected in the intensity of the light emitted from a particle-to-be-observed and light-emitting probe combination (or a light-emitting probe having been decomposed and separating after the binding to a particle) moving relatively to the light detection region at a predetermined speed, and their concrete values may be set arbitrarily or experimentally, and also may be selectively determined depending upon the characteristics of a particle-to-be-observed and light-emitting probe combination (or a light-emitting probe having been decomposed and separating after the binding to a particle).
- the counting of particles to be observed may be done by counting in an arbitrary way the number of the particles detected by the above-mentioned method of detection of a particle to be observed. However, for the large number of particles, for example, it may be accomplished by the processes illustrated in FIG. 6 and FIG. 7B .
- step 110 in one example of ways of performing the counting of particles from the time series light intensity (photon counts) data, after the measurement of the light intensity as explained above, namely, performing the scanning in the sample solution with the light detection region and the photon counting to acquire time series light signal data (photon count data)(Step 100 ), to these time series light signal data ( FIG. 7B , the upper row “detected result (unsettled)”), a smoothing treatment is performed (step 110 , FIG. 7B mid-upper row “smoothing”).
- the smoothing treatment may be done for example by the moving average method.
- parameters in performing the smoothing treatment e.g., the number of datum points in one time of the averaging, the number of times of a moving average, etc. in the moving average method, may be suitably set in accordance with the moving speed (scanning speed) of the position of the light detection region and/or BIN TIME in the light signal data acquisition.
- the first differentiation value with time of the time series light signal data after the smoothing treatment is computed (step 120 ).
- the mid-low row “time differential”, in the time differential value of time series light signal data the variation of the value increases at the time of the signal value change, and thereby, the start point and the end point of a significant signal (pulse signal) can be determined advantageously by referring to the time differential value.
- a significant signal (pulse signal) is detected sequentially on the time series light signal data, and it is judged whether or not the detected pulse signal is a signal corresponding to a particle to be observed.
- pulse signal a significant signal
- the starting point and the end point of one pulse signal are searched and determined by referring to the time differential value sequentially, so that a pulse existing region will be specified (step 130 ).
- the fitting of a bell-shaped function is applied to the smoothed time series light signal data in the pulse existing region ( FIG.
- the bell-shaped function to be used in the fitting is typically Gauss function, it may be Lorentz type function.
- Step 160 a pulse signal, whose computed parameters of the bell-shaped function are not within the assumed ranges, as shown in FIG. 8 right, is disregarded as noise.
- the search and the judgment of a pulse signal in the processes of the above-mentioned steps 130 - 160 are repetitively carried out in the whole region of the time series light signal data, and whenever one particle to be observed is detected, it is counted as one particle. And, when the search of the pulse signal in the whole region of the time series light signal data is completed (step 170 ), the count value of particles obtained till then is considered as the number of particles to be observed which have been detected in the time series light signal data.
- the number density or concentration of the particle to be observed can be determined using the volume of the whole region which the light detection region has passed through during the acquisition of the time series light signal data.
- the effective volume of the light detection region varies depending on the wavelength of excitation light or detected light, the numerical aperture of lenses and the adjustment condition of the optical system, and therefore, it is generally difficult to compute the effective volume of the light detection region from the design parameter values, and it is not easy to compute the whole volume which the light detection region has passed through, either.
- the light intensity measurement, the detection of light-emitting particles and the counting thereof are performed as explained above with a solution having a known particle concentration (reference solution) under the same condition as that for the measurement of a sample solution to be tested, and then, from the detected number of particles and the concentration of particle in the reference solution, the volume of the whole region which the light detection region has passed through, i.e., the relation between the detected number and the concentration of the particle to be observed, may be determined.
- the particle of a reference solution may be a light emitting label (fluorescent dye etc.) having the same wavelength characteristic as a particle and light-emitting probe combination that a particle to be observed forms (or light-emitting probe having been separated from a particle to be observed after having bound thereto).
- a light emitting label fluorescent dye etc.
- the plurality of solutions of different concentrations are prepared as reference solutions and the measurement is performed for each of the solutions, and then, the average value of the computed Vt is determined as the volume Vt of the whole region which the light detection region has passed through.
- the volume of the light detection region and the volume of the whole region which the light detection region has passed through may be given by an arbitrary method, for instance, using FCS and FIDA, instead of the above-mentioned method.
- the optical analysis device of this embodiment there may be previously memorized in a storage apparatus of the computer 18 the information on the relations (expression (5)) between concentrations C and particle numbers N of various standard particles for assumed moving patterns of the light detection region, so that a user of the device can appropriately use the memorized information on the relation in conducting an optical analysis.
- SYTOX Orange which is an intercalator fluorescent dye of DNA (a dye of which fluorescence intensity increases notably when it binds to DNA) as a light-emitting probe
- SYTOX Orange which is an intercalator fluorescent dye of DNA (a dye of which fluorescence intensity increases notably when it binds to DNA)
- sample solutions by dissolving DNA (pbr322, Takara Bio, Inc., Cat. No. 3035) as the particle to be observed, into a phosphate buffer (including 0.05% Tween20) containing SYTOX Orange (Invitrogen Corp., Cat. No. S-11368) at 10 nM such that the DNA molecule concentration was to be 0M (reference solution), 100 fM, 1 pM, 10 pM or 100 pM.
- SYTOX Orange is a fluorescent dye whose fluorescence intensity increases about 500 times when it binds to DNA (an example of a fluorescent dye whose wavelength characteristic changes in FIG. 3C ).
- a single molecule fluorescence measuring apparatus MF-20 (Olympus Corporation), equipped with the optical system of a confocal fluorescence microscope and a photon counting system, was used as the optical analysis device, and time series photon count data were acquired for the above-mentioned respective sample solutions in accordance with the manner explained in the above-mentioned “(2) Measurement of the light intensity of a sample solution”.
- a 633 nm laser light was used for excitation light
- the detected light wavelength was set from 660 to 710 nm using a band pass filter.
- the moving speed of the position of the light detection region in the sample solution was set to 15 mm/second; BIN TIME was set to 10 ⁇ sec.; and the measurement time duration was set to 2 seconds.
- the light intensity measurement in accordance with the procedures described in the above-mentioned “(3) (ii) The counting of particles to be observed”, the light signals detected in the time series data from the time series photon count data acquired for each sample solution were counted.
- the data points averaged at once was nine, and the moving average process was repeated 5 times.
- step 140 the fitting of Gauss function to the time series data was carried out by the least square method, and a peak intensity, a pulse width (full width at half maximum) and a correlation coefficient (in the gauss function) were determined. Furthermore, in the decision process of step 150 , only the pulse signal satisfying the following conditions: 20 ⁇ sec. ⁇ pulse width ⁇ 400 ⁇ sec.
- Peak intensity>1 (photon/10 ⁇ sec.) Correlation coefficient>0.95 (A) was judged as a light signal corresponding to a particle to be observed, while a pulse signal which did not satisfy the above-mentioned conditions was disregarded as noise, and then, the number of the signals judged as a light signal corresponding to a particle to be observed was counted as the “pulse number”.
- fluorescence intensity was measured for each of the above-mentioned sample solutions using a plate reader SH-8000lab (Corona).
- the excitation light wavelength was set to 543 nm; the detected light wavelength, to 570 nm; and both the band widths of the excitation and detection sides, to 12 nm.
- 3 times of measurement where 50 times of excitation light flash were applied were performed, and their average was used as the final fluorescence intensity value.
- FIGS. 9A and 9B each show the measurement results (pulse number) by the above-mentioned inventive method and the measurement results (fluorescent intensity) in the control experiment, detected in the sample solutions of the respective concentrations.
- the pulse number measured by the inventive method the number of the light signals counted
- the inventive method enables detecting individual nucleic acids (particle to be observed) one by one, and that, by counting individual particles to be observed according to the inventive method, its concentration can be determined quantitatively.
- the number density or concentration of a particle can be determined to the concentration range lower than the limit of the number density or concentration measurable by conventional methods using fluorescence intensity. Further, while the lower limit of the particle concentration measurable in optical analysis techniques, such as FCS, FIDA, and PCH, including statistical procedures, e.g.
- the nucleic acid concentration is lower than the fluorescent dye concentration, a plenty of dyes are present, and thus the number of dyes having bound to one nucleic acid is stable, but when the nucleic acid concentration is higher, the number of the dyes becomes relatively short and the number of dyes having bound to one nucleic acid is reduced as illustrated in FIG. 9C right, and therefore it can be considered that the fluorescence intensity did not easily increase following the nucleic acid concentration.
- the present invention is designed so that the number of light signals corresponding to a particle to be observed may be counted, the influence due to the reduction of the number of dyes having bound to one nucleic acid is small, and thus, it can be considered that the pulse number expectedly increased to the higher concentration range.
- the number density or concentration of the particle can be determined up to a concentration range higher than the upper limit of the number density or concentration measurable under the assumption that the fluorescence intensity is proportional to the number density or concentration of light-emitting particles in the prior art.
- the molecular beacon is a nucleic acid molecule in which a donor dye and an acceptor dye have been added to its both ends, respectively, and the molecule is designed such that, in a single molecule, the distance between the donor dye and acceptor dye are so close that a fluorescence energy transfer phenomenon from the donor dye to the acceptor dye can occur, but, when it binds to a nucleic acid or a nucleic acid analogue having a base sequence complementary to its own base sequence, the distance between the donor dye and acceptor dye increases so that no fluorescence energy transfer phenomenon will occur (see FIG. 3D ).
- the molecular beacon there was used a nucleic acid having the following base sequence in which TAMRA (donor dye) was attached to 5′ end, and BHQ-2 (acceptor dye, in this case, fluorescence was hardly emitted) was added to 3′ end:
- nucleic acids were compounded by requesting Sigma genosis, Inc. Then, to prepare the sample solution, the above-mentioned molecular beacon and particle to be observed (nucleic acid) were dissolved at 500 pM and 100 nM, respectively, in a phosphate buffer (Tween 20 including 0.05%). For a control solution, there was prepared a solution containing only a molecular beacon at 500 ⁇ M without the particle to be observed (nucleic acid).
- Measurements for the sample solution and control solution by the inventive method were conducted on the same conditions as the case of Embodiment 1. Also, as a control experiment, the fluorescence intensities of the sample solution and control solution were measured similarly to the case of Embodiment 1, using the plate reader, where the excitation light wavelength was set to 550 nm, and the detected light wavelength was set to 576 nm.
- FIGS. 10A and 10B each show the measurement results (pulse number) detected by the above-mentioned inventive method and the measurement results (fluorescence intensity) by a control experiment for the sample solution (MB+Target) and the reference solution (only MB).
- the pulse number of the sample solution containing the particle to be observed of the nucleic acid notably increased as compared with the case of the control solution (6 times difference), and the variances were also small.
- the difference was seen in the averages of the fluorescence intensity between the sample solution and the control solution, but the variances were large.
- the concentration of the molecular beacon in the present embodiment was 500 pM as noted, and considering that that concentration is close to the lower limit of the concentration measurable from the fluorescence intensity using a plate reader as understood from the result of Embodiment 1, the results of FIG. 10 shows that, according to the inventive method, the detection of a nucleic acid having a certain specific base sequence using a molecular beacon can be achieved also in a solution of a low light-emitting probe concentration in better accuracy, as compared with the case of the conventional detection method based on fluorescence intensity.
- the base sequences of the used target nucleic acid and fluorescence-labeled probe are as follows:
- Target nucleic acid 5′-gaaacagctatgaccatgattacgccaagcttgcatgcctgcagg tcgactctagaggatccccgggtaccgagctcgaattcactggccgtc gttttac-3′
- Fluorescence-labeled probe ATTO647N-ggggatcctctagagtcgacc (ATTO647N is a fluorescent dye.)
- FIG. 11 shows the average (bar graph) and standard deviation (error bar) of the pulse number detected in each specimen.
- the pulse number in the case containing no target nucleic acids (Probe) was substantially reduced as compared with the case containing the target nucleic acids (Probe-Target) in the purified specimens (purified). That is, this shows that, by removing unreacted light-emitting probes through physical purification (purification with silica gel membrane), it becomes possible to detect a particle to be observed selectively.
- FRET Fluorescence Energy Transfer
- the target nucleic acid was selectively detectable by detecting the light from the acceptor peptide nucleic acid (the light-emitting probe used as an energy acceptor) and the concentration of the target nucleic acid was determinable (see FIGS. 3B and 3E ) when a fluorescence energy transfer phenomenon between the donor peptide nucleic acid and accept
- sample solutions (10 mM Tris-HCl (pH 8.0)) containing 0.1% Pluronic F-127, where fluorescence energy donor peptide nucleic acid (PANAGENE) and acceptor peptide nucleic acid (PANAGENE) were added so as to be at 200 pM, respectively, and target nucleic acids (SIGMA GENOSYS) were added to be 1 pM, 10 pM or 100 pM.
- target nucleic acids SIGMA GENOSYS
- the temperature lowering speed was set to 0.1° C./sec., and the temperature lowering treatment were performed at 90° C. for 5 minutes; at 80° C. for 10 minutes; at 70° C. for 10 minutes; at 60° C. for 10 minutes; at 50° C. for 10 minutes; at 40° C. for 10 minutes; and at 30° C. for 10 minutes).
- quenching probes for the donor peptide nucleic acid (SIGMA GENOSYS) and quenching probes for the acceptor peptide nucleic acid (SIGMA GENOSYS) were added to be at 1 nM, respectively, and the incubation was carried out for 30 minutes at 20° C.
- the base sequences of the donor peptide nucleic acid, acceptor peptide nucleic acid, nucleic acid for quenching the donor peptide nucleic acid, nucleic acid for quenching the acceptor peptide nucleic acid, and target nucleic acid are as follows, respectively:
- Donor peptide nucleic acid Alexa488-OO-cctacgccaccagctccaac
- Acceptor peptide nucleic acid agctgtatcgtcaaggcact-O-Lys-Alexa594 Quenching probe for donor peptide nucleic acid: ggagctggtggcg-BHQ1-dT-agg-BHQ1 Quenching probe for acceptor peptide nucleic acid: BHQ2-ag-BHQ2-dT-gccttgacgataca
- Target nucleic acid atgactgaatataaacttgtggta gttggagctggtggcgtagg caa ga gtgccttgacgatacagct aattcagaat
- the left underline is a sequence binding to the donor peptide nucleic acid
- the right underline is a sequence binding to acceptor peptide nucle
- the measurement of light, the detection and counting of the pulse signals were performed in accordance with the inventive method.
- a single molecule fluorescence measuring apparatus MF20 equipped with an optical system of a confocal fluorescence microscope and a photon counting system (Olympus, Inc.) was used as the optical analysis device to acquire the time series photon count data for each of the above-mentioned sample solutions.
- a 1-mW laser light of 488 nm (corresponding to the excitation wavelength of the fluorescent dye Alexa488 of the donor peptide nucleic acid) was used and the detected light wavelength was set to 615 nm—(corresponding to the emission wavelength of the fluorescent dye Alexa594 of the acceptor peptide nucleic acid) with a long pass filter.
- the moving speed of the position of the light detection region in the sample solution was set to 67.5 mm/sec.
- BIN TIME was set to 10 ⁇ sec.
- the measuring time was set to 2 seconds. Also, the measurement was performed five times for each sample.
- the detection and counting of pulse signals were performed on the time series photon count data acquired for each sample solution, similarly to the embodiment 1. And, the averages and standard deviations of those detected pulse numbers were computed.
- FIG. 12B shows the averages (bar graphs) and standard deviations (error bars) of the pulse numbers, detected in the sample solutions of the target nucleic acid of the above-mentioned respective concentrations.
- the pulse number increased with increase of the target nucleic acid concentration in the concentration of 1 pM or more.
- a target nucleic acid was detectable in a sample solution in which, after making fluorescently labeled short nucleic acid (fluorescently labeled probe) as a light-emitting probe bind to a particle to be observed of a nucleic acid (target nucleic acid), a nucleic acid labeled with a fluorescence quenching molecule (quenching probe) was applied to an unreacted fluorescently labeled probe (see FIG. 3B ).
- a single strand nucleic acid whose 5′ end was modified with a fluorescent dye, Alexa488 (fluorescent probe), and a single strand nucleic acid whose 3′ end was modified with a quenching molecule, BHQ1 (quenching probe), were dissolved to be at 5 nM and 2 ⁇ M, respectively, in a 100 mM Tris-HCl (pH 8.0) solution (Tris buffer). Also, similarly, a double strand nucleic acid (target nucleic acid) was dissolved to be at 100 pM, 1 nM and 10 nM in the Tris buffer.
- the temperature of these solutions was raised to 95° C. and then lowered to 20° C. over 90 minutes with a thermal cycler, such that the fluorescent probe was made hybridize with the target nucleic acid.
- the base sequences of the fluorescent probe, quenching probe, and target nucleic acid are as follows: (described in the direction of 5′ ⁇ 3′).
- Fluorescent probe aaacttgtggtagttggagctgttggcgtagg Quenching probe: aacagctccaactaccacaagttt Target nucleic acid: gaagtacagttcattacgatacacgtctgcagtcaactggaattttcatga ttgaattttgtaaggtattttgaaataatttttgaaataatttttcatataaaggtgagtttg tattaaaaggtactggtggagtatttgatagtgtattaaccttatgtgtga catgttctaatatagtcacattttcattattttattataaggcctgctga aatgactgaaatataaacttgtggtagttggagctggtggcgtaggcaaga gtgccttg
- the measurement of light, the detection and counting of pulse signals were performed using the above-mentioned sample solution.
- a single molecule fluorescence measuring apparatus MF20 equipped with an optical system of a confocal fluorescence microscope and a photon counting system (Olympus, Inc.) was used as the optical analysis device to acquire the time series light intensity data (photon count data) for each of the above-mentioned sample solutions.
- a 200 ⁇ W laser light of 488 nm was used and the light of the wavelength band of 510 to 560 nm was measured with a band pass filter, and the time series light intensity data were generated.
- the light detection region in the sample solution was rotated with the moving speed of 15 mm/second, BIN TIME was set to 10 ⁇ sec. and the measurement for 2 seconds was conducted 5 times. Then, similarly to the embodiment 1, after smoothing the time series light intensity data obtained by the measurements, the detection of the peak was done through the differentiation. Among the regions which could be regarded to be a pulse signal, the pulses which could be approximated with a gauss function and had the intensity of 1 or more were counted.
- the pulse number (the average of the five measurements) obtained from each sample solution is shown in FIG. 13B .
- the pulse number increased with the increase of the target nucleic acid concentration.
- the E probe and N probe bind to each other (in the drawing, the site designated X) while the quenching molecule on the 5′ end is liberated ( FIG. 14A the lower row) so that the fluorescence molecule of the 5′ end will emit light, and thereby an existence of the nucleic acid having the specific base sequence becomes detectable. That is, this is an example of a reaction in which light-emitting efficiency changes depending on the kind of a particle to be observed (see FIG. 3H ).
- a single strand nucleic acid which was modified with a quenching molecule Dabcyl at 5′ end and with a fluorescence molecule Alexa 488 at t of the third base from the 5′ end (E probe, Japan bio-service), and a single strand nucleic acid, which was modified with phosphosulfate at the 3′ end (N probe, Japan bio-service), were dissolved in a 100 mM Tris-HCl (pH 8.0) solution to be at 10 nM and 100 nM, respectively.
- a single strand nucleic acid (a target nucleic acid) was dissolved in a 100 mM Tris-HCl (pH 8.0) solution to be at 10 pM, 100 pM, 1 nM, and 10 nM, respectively. Then, 3 ⁇ L of the E probe solution, 3 ⁇ L of the N probe solution, 3 ⁇ L of each of the target nucleic acid solutions and 21 ⁇ L of the 100 mM Tris-HCl (pH 8.0) solution containing 400 mM NaCl were mixed, and the temperature of these solutions was raised to 95° C. using a thermal cycler, and subsequently, the reaction was made at 50° C. for 1 hour.
- the base sequences of the E probe, N probe and target nucleic acid are as follows:
- E probe tcttgcctacgccaccagctccaac
- N probe ttctgaattagctgtatcgtcaaggcac
- Target nucleic acid gttggagctggtggcgtaggcaagagtgccttgacgatacagctaattc agaa
- the measurement of light, the detection and counting of pulse signals were performed using the above-mentioned sample solutions.
- a single molecule fluorescence measuring apparatus MF20 equipped with an optical system of a confocal fluorescence microscope and a photon counting system (Olympus, Inc.) was used as the optical analysis device to acquire the time series light intensity data (photon count data) for each of the above-mentioned sample solutions.
- a 200 ⁇ W laser light of 488 nm was used and the light of the wavelength band of 510 to 560 nm was measured with a band pass filter, and the time series light intensity data were generated.
- the light detection region in the sample solution was rotated with the moving speed of 15 mm/second, BIN TIME was set to 10 ⁇ sec. and the measurement for 2 seconds was conducted 5 times. Then, similarly to the embodiment 1, after smoothing the time series light intensity data obtained by the measurements, the detection of the peak was done through the differentiation. Among the regions which could be regarded to be a pulse signal, the pulses which could be approximated with a gauss function and had the intensity of 1 or more were counted.
- the pulse number increased with the increase of the target nucleic acid concentration.
- the inventive optical analysis technique basically uses the same optical system as FCS, FIDA, etc. it may be performed together with FCS, FIDA, etc.
- FCS optical analysis technique
- the concentration difference between substances is large, for example, when the concentration of one substance is nM order and that of the other substance is pM order, there can be conducted a manner that measurement and analysis are conducted by FCS or FIDA for the substance of the higher concentration while measurement and analysis are conducted by the inventive optical analysis technique for the substance of the lower concentration.
- FCS or FIDA for the substance of the higher concentration
- measurement and analysis technique for the substance of the lower concentration.
Abstract
Description
- Patent document 1: Japanese Patent laid-open publication No. 2005-098876
- Patent document 2: Japanese Patent laid-open publication No. 2008-292371
- Patent document 3: Japanese Patent No. 4023523
- Patent document 4: WO 2008-080417
- Patent document 5: Japanese Patent laid-open publication No. 2007-20565
- Patent document 6: Japanese Patent laid-open publication No. 2008-116440
- Patent document 7: Japanese Patent laid-open publication No. 4-337446 Non-patent documents
- Non-patent document 1: Masataka Kaneshiro; “Protein, Nucleic acid, Enzyme” Vol. 44, No. 9, pages 1431-1438, 1999.
- Non-patent document 2: F. J. Meyer-Alms; “Fluorescence Correlation Spectroscopy” edt. R. Rigler, Springer, Berlin, pages 204-224, 2000.
- Non-patent document 3: Noriko Kato, et al. “Gene medicine”, Vol. 6, No. 2, pages 271-277.
- Non-patent document 4: S. Sando and E. T. Kool, J. Amer. Chem. Soc, 2002, Vol. 124, pages 2096-2097
- 1 - - - Optical analysis device (confocal microscope)
- 2 - - - Light source
- 3 - - - Single mode optical fiber
- 4 - - - Collimating lens
- 5, 14 a - - - Dichroic mirror
- 6, 7, 11 - - - Reflective mirror
- 8 - - - Objective
- 9 - - - Micro plate
- 10 - - - Well (sample solution container)
- 12 - - - Condenser lens
- 13 - - - Pinhole
- 14 - - - Barrier filter
- 15 - - - Multi-mode optical fiber
- 16 - - - Photodetector
- 17 - - - Mirror deflector
- 17 a - - - Stage position changing apparatus
- 18 - - - Computer
(b) A method in which a light-emitting probe of a DNA having an energy donor site and an energy acceptor site in which a fluorescence energy transfer phenomenon occurs and partially including RNA is added to a sample solution containing a nucleic acid or a nucleic acid analogue to be tested (a particle to be observed), and it is detected whether or not the light-emitting probe is decomposed by an RNaseH (Cycleave method);
(c) A method in which a light-emitting probe of a DNA having an energy donor site and an energy acceptor site in which a fluorescence energy transfer phenomenon occurs and partially including a restriction enzyme identifying region is added to a sample solution containing a nucleic acid or a nucleic acid analogue to be tested (a particle to be observed), and it is detected whether or not the light-emitting probe is decomposed by a restriction enzyme;
(d) A method in which a light-emitting probe of a DNA having an energy donor site and an energy acceptor site in which a fluorescence energy transfer phenomenon occurs is added to a sample solution containing a nucleic acid or a nucleic acid analogue to be tested (a particle to be observed), and it is detected whether or not the light-emitting probe is decomposed by an exonuclease which decomposes specifically a double strand nucleic acid.
(2Wo)2=6D·Δt (1)
as:
Δt=(2Wo)2/6D (2),
and thus, the velocity of the particle to be observed moving by Brownian motion (diffusional moving velocity) Vdif, becomes approximately
Vdif=2Wo/Δt=3D/Wo (3)
Then, with reference to this, the moving speed of the position of the light detection region may be set to a value sufficiently quicker than Vdif. For example, when the diffusion coefficient of a particle to be observed is expected to be about D=2.0×10⁻¹⁰ m2/s, Vdif will be 1.0×10⁻³ m/s, supposing Wo is about 0.62 μm, and therefore, the moving speed of the position of the light detection region may be set to its 10 times or more, e.g. 15 mm/s, etc. In this regard, when the diffusion coefficient of a particle to be observed is unknown, an appropriate moving speed of the position of the light detection region may be determined by repeating the executions of a preliminary experiment with setting various moving speeds of the position of the light detection region in order to find the condition that the profile of a light intensity variation becomes an expected profile (typically, similar to the excitation light intensity distribution).
(3) Analysis of Light Intensity
I=A·exp(−2t 2 /a 2) (4),
and when the intensity A and the width a, computed by fitting the expression (4) to the profile of a significant light intensity (a profile which can be clearly judged not to be a background), are within the respective predetermined ranges, the profile of the light intensity may be judged to correspond to one particle to be observed having passed through the light detection region, and thereby the detection of one particle to be observed will be done. However, the profile with the intensity A and the width a out of the predetermined ranges may be ignored as a noise or a contaminant in the analysis.
(ii) The Counting of Particles to be Observed
Vt=N/C (5).
Alternatively, the plurality of solutions of different concentrations are prepared as reference solutions and the measurement is performed for each of the solutions, and then, the average value of the computed Vt is determined as the volume Vt of the whole region which the light detection region has passed through. Thus, when Vt is given, the number density c of the particle of the sample solution, whose counting result of the particles is n, is given by:
c=n/Vt (6)
In this regard, the volume of the light detection region and the volume of the whole region which the light detection region has passed through may be given by an arbitrary method, for instance, using FCS and FIDA, instead of the above-mentioned method. Further, in the optical analysis device of this embodiment, there may be previously memorized in a storage apparatus of the
20 μsec.<pulse width<400 μsec.
Peak intensity>1 (photon/10 μsec.)
Correlation coefficient>0.95 (A)
was judged as a light signal corresponding to a particle to be observed, while a pulse signal which did not satisfy the above-mentioned conditions was disregarded as noise, and then, the number of the signals judged as a light signal corresponding to a particle to be observed was counted as the “pulse number”.
| TAMRA-cctacgccaacagctccaactacgtagg-BHQ2 |
Also, for the particle to be observed, the nucleic acid having the following base sequence was used:
| gtagttggagctgttggcgtaggcaagagtgccttgacgatacagctaa |
| ttcag |
The above-mentioned nucleic acids were compounded by requesting Sigma genosis, Inc. Then, to prepare the sample solution, the above-mentioned molecular beacon and particle to be observed (nucleic acid) were dissolved at 500 pM and 100 nM, respectively, in a phosphate buffer (Tween 20 including 0.05%). For a control solution, there was prepared a solution containing only a molecular beacon at 500 μM without the particle to be observed (nucleic acid).
| Target nucleic acid: |
| 5′-gaaacagctatgaccatgattacgccaagcttgcatgcctgcagg |
| tcgactctagaggatccccgggtaccgagctcgaattcactggccgtc |
| gttttac-3′ |
| Fluorescence-labeled probe: |
| ATTO647N-ggggatcctctagagtcgacc |
| (ATTO647N is a fluorescent dye.) |
| Donor peptide nucleic acid: |
| Alexa488-OO-cctacgccaccagctccaac |
| Acceptor peptide nucleic acid: |
| agctgtatcgtcaaggcact-O-Lys-Alexa594 |
| Quenching probe for donor peptide nucleic acid: |
| ggagctggtggcg-BHQ1-dT-agg-BHQ1 |
| Quenching probe for acceptor peptide nucleic acid: |
| BHQ2-ag-BHQ2-dT-gccttgacgataca |
| Target nucleic acid: |
| atgactgaatataaacttgtggtagttggagctggtggcgtaggcaaga |
| gtgccttgacgatacagctaattcagaat |
In the target nucleic acid, the left underline is a sequence binding to the donor peptide nucleic acid, and the right underline is a sequence binding to acceptor peptide nucleic acid. Alexa488 and Alexa594 are fluorescent dyes, and BHQ1 and BHQ2 are the quenching molecules for Alexa488 and Alexa594, respectively.
| Fluorescent probe: |
| aaacttgtggtagttggagctgttggcgtagg |
| Quenching probe: |
| aacagctccaactaccacaagttt |
| Target nucleic acid: |
| gaagtacagttcattacgatacacgtctgcagtcaactggaattttcatga |
| ttgaattttgtaaggtattttgaaataatttttcatataaaggtgagtttg |
| tattaaaaggtactggtggagtatttgatagtgtattaaccttatgtgtga |
| catgttctaatatagtcacattttcattatttttattataaggcctgctga |
| aaatgactgaatataaacttgtggtagttggagctggtggcgtaggcaaga |
| gtgccttgacgatacagctaattcagaatcattttgtggacgaatatgatc |
| caacaatagaggtaaatcttgttttaatatgcatattactggtgcaggacc |
| attctttgatacagataaaggtttctctgaccattttcatgagtacttatt |
| acaagataattatgctgaaagttaagttatctgaaatgtaccttgggtttc |
| aagttatatgtaaccattaatatgggaactttact |
In the above-mentioned sample solution, since a large amount of the quenching probes was present, all the fluorescent probes not binding to the target nucleic acids bound to the quenching probes so that the fluorescence from the fluorescent probe bound to the quenching probe was to be substantially quenched (see
| E probe: |
| tcttgcctacgccaccagctccaac |
| N probe: |
| ttctgaattagctgtatcgtcaaggcac |
| Target nucleic acid: |
| gttggagctggtggcgtaggcaagagtgccttgacgatacagctaattc |
| agaa |
Thus, only when the E probe and N probe bind to the target nucleic acid and the quenching molecule Dabcyl on the E probe is liberated, the light of Alexa488 on the E probe will be detected.
Claims (17)
Applications Claiming Priority (3)
| Application Number | Priority Date | Filing Date | Title |
|---|---|---|---|
| JP2010-167338 | 2010-07-26 | ||
| JP2010167338 | 2010-07-26 | ||
| PCT/JP2011/066576 WO2012014778A1 (en) | 2010-07-26 | 2011-07-21 | Method for detecting dilute particles in solution using luminescent probe |
Related Parent Applications (1)
| Application Number | Title | Priority Date | Filing Date |
|---|---|---|---|
| PCT/JP2011/066576 Continuation WO2012014778A1 (en) | 2010-07-26 | 2011-07-21 | Method for detecting dilute particles in solution using luminescent probe |
Publications (2)
| Publication Number | Publication Date |
|---|---|
| US20130122488A1 US20130122488A1 (en) | 2013-05-16 |
| US9395357B2 true US9395357B2 (en) | 2016-07-19 |
Family
ID=45529990
Family Applications (1)
| Application Number | Title | Priority Date | Filing Date |
|---|---|---|---|
| US13/746,968 Active US9395357B2 (en) | 2010-07-26 | 2013-01-22 | Method of detecting sparse particles in a solution using a light-emitting probe |
Country Status (5)
| Country | Link |
|---|---|
| US (1) | US9395357B2 (en) |
| EP (1) | EP2584343B1 (en) |
| JP (1) | JP5877155B2 (en) |
| CN (1) | CN103026205B (en) |
| WO (1) | WO2012014778A1 (en) |
Cited By (2)
| Publication number | Priority date | Publication date | Assignee | Title |
|---|---|---|---|---|
| US20140179023A1 (en) * | 2011-08-30 | 2014-06-26 | Olympus Corporation | Method for detecting a target particle in biosample containing pancreatic juice |
| US10732113B2 (en) * | 2016-02-26 | 2020-08-04 | Single Technologies Ab | Method and device for high throughput imaging |
Families Citing this family (37)
| Publication number | Priority date | Publication date | Assignee | Title |
|---|---|---|---|---|
| JP5856983B2 (en) | 2011-01-20 | 2016-02-10 | オリンパス株式会社 | Optical analysis method and optical analysis apparatus using light detection from single luminescent particles |
| CN103328956B (en) | 2011-01-26 | 2015-08-12 | 奥林巴斯株式会社 | Differentiate the method for polymorphic nucleic acid molecule |
| CN103339256B (en) | 2011-01-26 | 2016-03-16 | 奥林巴斯株式会社 | Differentiate the method for polymorphic nucleic acid molecule |
| JP5904996B2 (en) | 2011-03-29 | 2016-04-20 | オリンパス株式会社 | Optical analyzer using single luminescent particle detection, optical analysis method, and computer program for optical analysis |
| JP5885738B2 (en) | 2011-04-13 | 2016-03-15 | オリンパス株式会社 | Optical analysis apparatus using single luminescent particle detection, optical analysis method, and computer program for optical analysis |
| EP2700935A4 (en) * | 2011-04-18 | 2014-10-22 | Olympus Corp | Quantitative determination method for target particles, photometric analysis device, and computer program for photometric analysis |
| CN103608663B (en) * | 2011-04-20 | 2016-01-13 | 奥林巴斯株式会社 | The detection method of the nucleic acid molecules in biological sample |
| CN103620388B (en) * | 2011-06-27 | 2016-05-11 | 奥林巴斯株式会社 | The detection method of intended particle |
| CN103733047B (en) | 2011-08-11 | 2016-03-30 | 奥林巴斯株式会社 | The detection method of intended particle |
| EP2743684B1 (en) * | 2011-08-12 | 2017-09-06 | Olympus Corporation | Method for detecting fluorescent particles |
| CN103733049B (en) | 2011-08-15 | 2016-01-20 | 奥林巴斯株式会社 | The light analytical equipment utilizing single incandescnet particle to detect, light analytical approach and light analysis computer program |
| WO2013031439A1 (en) | 2011-08-26 | 2013-03-07 | オリンパス株式会社 | Optical analyzer using single light-emitting particle detection, optical analysis method, and computer program for optical analysis |
| JP6010035B2 (en) | 2011-08-30 | 2016-10-19 | オリンパス株式会社 | Optical analysis apparatus using single luminescent particle detection, optical analysis method, and computer program for optical analysis |
| CN103765194B (en) | 2011-08-30 | 2016-02-17 | 奥林巴斯株式会社 | The detection method of intended particle |
| ES2755934T3 (en) * | 2011-10-31 | 2020-04-24 | Eiken Chemical | Method for detecting target nucleic acid |
| CN104115003B (en) * | 2012-02-22 | 2016-03-23 | 奥林巴斯株式会社 | The detection method of intended particle |
| EP2829614A4 (en) | 2012-03-21 | 2016-03-16 | Olympus Corp | Method for detecting target nucleic acid molecule |
| CN104136915B (en) | 2012-04-18 | 2016-07-13 | 奥林巴斯株式会社 | The detection method of intended particle |
| JP6010114B2 (en) | 2012-04-18 | 2016-10-19 | オリンパス株式会社 | Single particle detection apparatus using optical analysis, single particle detection method, and computer program for single particle detection |
| WO2014064971A1 (en) | 2012-10-25 | 2014-05-01 | オリンパス株式会社 | Method for detecting target particles |
| KR102126032B1 (en) * | 2013-07-31 | 2020-07-08 | 삼성전자주식회사 | Multi-channel fluorescence detecting module and nucleic acid analysis system having the same |
| GB2520491A (en) * | 2013-11-20 | 2015-05-27 | Malvern Instr Ltd | Improvements in or relating to calibration of instruments |
| US10266828B2 (en) | 2013-12-16 | 2019-04-23 | Syddansk Universitet | RAS exon 2 skipping for cancer treatment |
| JP6225798B2 (en) * | 2014-03-31 | 2017-11-08 | 株式会社Jvcケンウッド | Analysis apparatus and analysis method |
| JP6237417B2 (en) | 2014-03-31 | 2017-11-29 | 株式会社Jvcケンウッド | Analysis apparatus and analysis method |
| JPWO2017098597A1 (en) * | 2015-12-09 | 2018-10-11 | オリンパス株式会社 | Optical analysis method and optical analysis apparatus using single luminescent particle detection |
| CN106404642B (en) * | 2016-11-01 | 2019-01-04 | 北京信息科技大学 | A kind of fluidic cell system fluorescence lifetime Gauss curve fitting measurement method |
| CN106841135B (en) * | 2017-01-06 | 2019-05-31 | 东南大学 | A method of a variety of miRNA are detected by fluorescence method simultaneously |
| CN109900536B (en) * | 2017-12-07 | 2020-10-30 | 浙江大学 | Light mirror-transmission electron microscope combined sample processing reagent and CLEM detection method |
| CN108444876B (en) * | 2018-03-09 | 2020-06-16 | 国家纳米科学中心 | Method for determining state of protein ligand adsorbed on surface of nanoparticle |
| JP7000998B2 (en) * | 2018-06-06 | 2022-01-19 | 株式会社Jvcケンウッド | Analytical threshold generator and analytical threshold generation method |
| JP6953632B2 (en) * | 2018-07-09 | 2021-10-27 | オリンパス株式会社 | Optical analyzers, optical analysis methods and trained models |
| JP7183899B2 (en) * | 2019-03-25 | 2022-12-06 | 株式会社Jvcケンウッド | Analysis device and analysis method |
| CN110376105B (en) * | 2019-07-10 | 2022-06-03 | 赛莱克斯(深圳)科技有限公司 | Method and device for determining characteristics and concentration of small particles in clinical sample |
| CN110283697A (en) * | 2019-07-12 | 2019-09-27 | 暨南大学 | It separates, the mini optical fibre probe and method of transport cells and particle |
| CN114341627A (en) * | 2019-11-13 | 2022-04-12 | 李峰 | Nucleic acid detection method and device |
| CN111999225A (en) * | 2019-12-19 | 2020-11-27 | 瑞芯智造(深圳)科技有限公司 | Method for detecting concentration of micro-nano particles |
Citations (47)
| Publication number | Priority date | Publication date | Assignee | Title |
|---|---|---|---|---|
| US4251733A (en) | 1978-06-29 | 1981-02-17 | Hirleman Jr Edwin D | Technique for simultaneous particle size and velocity measurement |
| JPH04337446A (en) | 1991-05-15 | 1992-11-25 | Hitachi Ltd | Method and device for measuring fine grain and constant quantity method |
| WO1998016814A1 (en) | 1996-10-12 | 1998-04-23 | Evotec Biosystems Ag | Method of analysis of samples by determination of a function of specific brightness |
| US5866336A (en) * | 1996-07-16 | 1999-02-02 | Oncor, Inc. | Nucleic acid amplification oligonucleotides with molecular energy transfer labels and methods based thereon |
| WO1999047963A1 (en) | 1998-03-16 | 1999-09-23 | Praelux Incorporated | Confocal microscopy imaging system |
| WO2000066985A1 (en) | 1999-04-29 | 2000-11-09 | Evotec Biosystems Ag | A method of characterizing fluorescent molecules or other particles using generating functions |
| US6280960B1 (en) | 1997-06-13 | 2001-08-28 | Robert Carr | Optical detection and analysis of sub-micron particles |
| US20010035954A1 (en) | 2000-03-10 | 2001-11-01 | Rahn John Richard | Method and apparatus for measuring particle size distributions using light scattering |
| US20020008211A1 (en) | 2000-02-10 | 2002-01-24 | Peet Kask | Fluorescence intensity multiple distributions analysis: concurrent determination of diffusion times and molecular brightness |
| WO2002012864A1 (en) | 2000-08-08 | 2002-02-14 | Carl Zeiss Jena Gmbh | Method and assembly for increasing the spectral and spatial resolution of a detector |
| US20020036775A1 (en) | 2000-08-08 | 2002-03-28 | Carl Zeiss Jena Gmbh | Method for increasing the spectral and spatial resolution of detectors |
| US6376843B1 (en) | 1999-06-23 | 2002-04-23 | Evotec Oai Ag | Method of characterizing fluorescent molecules or other particles using generating functions |
| US6388788B1 (en) | 1998-03-16 | 2002-05-14 | Praelux, Inc. | Method and apparatus for screening chemical compounds |
| US6388746B1 (en) | 1998-02-06 | 2002-05-14 | Cellectricon Ab | Method, apparatus and flow cell for high-sensitivity detection of fluorescent molecules |
| US6403338B1 (en) | 1997-04-04 | 2002-06-11 | Mountain View | Microfluidic systems and methods of genotyping |
| US20030036855A1 (en) | 1998-03-16 | 2003-02-20 | Praelux Incorporated, A Corporation Of New Jersey | Method and apparatus for screening chemical compounds |
| US20030218746A1 (en) | 2002-05-21 | 2003-11-27 | Sampas Nicholas M. | Imaging systems for signals on a surface |
| US20040022684A1 (en) | 2000-07-20 | 2004-02-05 | Katrin Heinze | Method and device for multicolour 2-photon fluorescence coincidence analysis |
| US20040051051A1 (en) | 2000-12-14 | 2004-03-18 | Olympus Optical Co., Ltd. | Fluorescence analysis apparatus and fluorescence analysis method |
| US6710871B1 (en) | 1997-06-09 | 2004-03-23 | Guava Technologies, Inc. | Method and apparatus for detecting microparticles in fluid samples |
| US20040150880A1 (en) | 2002-12-27 | 2004-08-05 | Olympus Corporation | Confocal microscope |
| US6782297B2 (en) * | 2001-05-24 | 2004-08-24 | Eric Paul Tabor | Methods and apparatus for data smoothing |
| US6856391B2 (en) | 2000-11-17 | 2005-02-15 | Garab Gyozo | Method and apparatus for determining the polarization properties of light emitted, reflected or transmitted by a material using a laser scanning microscope |
| JP2005099662A (en) | 2002-12-27 | 2005-04-14 | Olympus Corp | Confocal microscope |
| JP2005098876A (en) | 2003-09-25 | 2005-04-14 | Institute Of Physical & Chemical Research | Analytical method of analyzing interaction between two components |
| US20050260660A1 (en) * | 2002-11-07 | 2005-11-24 | Erasmus Universiteit Rotterdam | FRET probes and methods for detecting interacting molecules |
| US20060078998A1 (en) * | 2004-09-28 | 2006-04-13 | Singulex, Inc. | System and methods for sample analysis |
| WO2006084283A2 (en) | 2005-01-31 | 2006-08-10 | The Board Of Trustees Of The University Of Illinois | Methods and devices for characterizing particles in clear and turbid media |
| JP2006333739A (en) | 2005-05-31 | 2006-12-14 | Hitachi High-Technologies Corp | Method for analyzing nucleic acid by monomolecular measurement |
| WO2007010803A1 (en) | 2005-07-15 | 2007-01-25 | Olympus Corporation | Light measuring instrument |
| JP2007020565A (en) | 2005-06-13 | 2007-02-01 | Kansai Bunri Sogo Gakuen | Method and system for detecting virus in specimen |
| WO2007118209A2 (en) | 2006-04-07 | 2007-10-18 | Kim Laboratories | Apparatus and method for rapid detection of analytes |
| WO2007147159A2 (en) * | 2006-06-16 | 2007-12-21 | Cornell Research Foundation, Inc. | Functional nucleic acid ligands to fluorescent proteins |
| WO2008007580A1 (en) | 2006-07-13 | 2008-01-17 | Olympus Corporation | Method for analyzing fine particles |
| US20080052009A1 (en) | 2006-08-23 | 2008-02-28 | Washington, University Of | Method for deconvolving single-molecule intensity distributions for quantitative biological measurements |
| JP2008116440A (en) | 2006-10-13 | 2008-05-22 | Shiga Pref Gov | Method and system for detecting fluorescent substance in sample |
| WO2008080417A1 (en) | 2006-12-28 | 2008-07-10 | Flult Biosystems Gmbh | A method of determining characteristic properties of a sample containing particles |
| JP2008292371A (en) | 2007-05-25 | 2008-12-04 | Institute Of Physical & Chemical Research | Method for analyzing interaction by a plurality of components by fluorescence correlated spectroscopy and method for screening compound for controlling interaction |
| US20090159812A1 (en) * | 2007-12-19 | 2009-06-25 | Singulex, Inc | Scanning analyzer for single molecule detection and methods of use |
| JP2009145242A (en) | 2007-12-14 | 2009-07-02 | Olympus Corp | Light measuring device |
| JP2009281831A (en) | 2008-05-21 | 2009-12-03 | Hamamatsu Photonics Kk | Fluorescence analyzer and analysis method |
| JP2009288161A (en) | 2008-05-30 | 2009-12-10 | Olympus Corp | Optical measurement apparatus and optical measurement method |
| US20100033718A1 (en) | 1999-05-28 | 2010-02-11 | Yokogawa Electric Corporation | Biochip reader and electrophoresis system |
| US20100177190A1 (en) | 2008-12-16 | 2010-07-15 | Ann-Shyn Chiang | Microscopy system with revolvable stage |
| US20100202043A1 (en) | 2007-02-14 | 2010-08-12 | Nikon Corporation | Slit-scanning confocal microscope |
| JP2011002415A (en) | 2009-06-22 | 2011-01-06 | Olympus Corp | Fluorescence correlation spectroscopic device |
| US8284484B2 (en) | 2006-09-14 | 2012-10-09 | PerkinElmer Singapore PTE, Ltd. | Relating to scanning confocal microscopy |
Family Cites Families (3)
| Publication number | Priority date | Publication date | Assignee | Title |
|---|---|---|---|---|
| US6595071B1 (en) * | 2000-01-06 | 2003-07-22 | Transoma Medical, Inc. | Estimation of error angle in ultrasound flow measurement |
| CN101115985A (en) * | 2004-09-28 | 2008-01-30 | 神谷来克斯公司 | System and method for spectroscopic analysis of single particles |
| WO2011108369A1 (en) * | 2010-03-01 | 2011-09-09 | オリンパス株式会社 | Optical analysis device, optical analysis method, and computer program for optical analysis |
-
2011
- 2011-07-21 EP EP11812369.4A patent/EP2584343B1/en active Active
- 2011-07-21 CN CN201180036710.4A patent/CN103026205B/en active Active
- 2011-07-21 WO PCT/JP2011/066576 patent/WO2012014778A1/en active Application Filing
- 2011-07-21 JP JP2012526460A patent/JP5877155B2/en active Active
-
2013
- 2013-01-22 US US13/746,968 patent/US9395357B2/en active Active
Patent Citations (59)
| Publication number | Priority date | Publication date | Assignee | Title |
|---|---|---|---|---|
| US4251733A (en) | 1978-06-29 | 1981-02-17 | Hirleman Jr Edwin D | Technique for simultaneous particle size and velocity measurement |
| JPH04337446A (en) | 1991-05-15 | 1992-11-25 | Hitachi Ltd | Method and device for measuring fine grain and constant quantity method |
| US5866336A (en) * | 1996-07-16 | 1999-02-02 | Oncor, Inc. | Nucleic acid amplification oligonucleotides with molecular energy transfer labels and methods based thereon |
| JP4023523B2 (en) | 1996-10-12 | 2007-12-19 | オリンパス株式会社 | How to analyze samples by determining specific brightness function |
| WO1998016814A1 (en) | 1996-10-12 | 1998-04-23 | Evotec Biosystems Ag | Method of analysis of samples by determination of a function of specific brightness |
| US6403338B1 (en) | 1997-04-04 | 2002-06-11 | Mountain View | Microfluidic systems and methods of genotyping |
| US6710871B1 (en) | 1997-06-09 | 2004-03-23 | Guava Technologies, Inc. | Method and apparatus for detecting microparticles in fluid samples |
| US6280960B1 (en) | 1997-06-13 | 2001-08-28 | Robert Carr | Optical detection and analysis of sub-micron particles |
| US6388746B1 (en) | 1998-02-06 | 2002-05-14 | Cellectricon Ab | Method, apparatus and flow cell for high-sensitivity detection of fluorescent molecules |
| US6400487B1 (en) | 1998-03-16 | 2002-06-04 | Praelux, Inc. | Method and apparatus for screening chemical compounds |
| JP2002507762A (en) | 1998-03-16 | 2002-03-12 | プリーラックス・インコーポレイテッド | Confocal microscope imaging system |
| US6388788B1 (en) | 1998-03-16 | 2002-05-14 | Praelux, Inc. | Method and apparatus for screening chemical compounds |
| WO1999047963A1 (en) | 1998-03-16 | 1999-09-23 | Praelux Incorporated | Confocal microscopy imaging system |
| US20030036855A1 (en) | 1998-03-16 | 2003-02-20 | Praelux Incorporated, A Corporation Of New Jersey | Method and apparatus for screening chemical compounds |
| US6927401B1 (en) | 1999-04-29 | 2005-08-09 | Evotec Oai Ag | Method of characterizing fluorescent molecules or other particles using generating functions |
| WO2000066985A1 (en) | 1999-04-29 | 2000-11-09 | Evotec Biosystems Ag | A method of characterizing fluorescent molecules or other particles using generating functions |
| JP2002543414A (en) | 1999-04-29 | 2002-12-17 | エボテック オーアーイー アクチェンゲゼルシャフト | Method of characterizing fluorescent molecules or other particles using generation functions |
| US20100033718A1 (en) | 1999-05-28 | 2010-02-11 | Yokogawa Electric Corporation | Biochip reader and electrophoresis system |
| US6376843B1 (en) | 1999-06-23 | 2002-04-23 | Evotec Oai Ag | Method of characterizing fluorescent molecules or other particles using generating functions |
| US20020008211A1 (en) | 2000-02-10 | 2002-01-24 | Peet Kask | Fluorescence intensity multiple distributions analysis: concurrent determination of diffusion times and molecular brightness |
| US20010035954A1 (en) | 2000-03-10 | 2001-11-01 | Rahn John Richard | Method and apparatus for measuring particle size distributions using light scattering |
| US20040022684A1 (en) | 2000-07-20 | 2004-02-05 | Katrin Heinze | Method and device for multicolour 2-photon fluorescence coincidence analysis |
| JP2004506192A (en) | 2000-08-08 | 2004-02-26 | カール ツァイス イエナ ゲゼルシャフト ミット ベシュレンクテル ハフツング | Method for increasing the spectroscopic and spatial resolution of a detector |
| US20020036775A1 (en) | 2000-08-08 | 2002-03-28 | Carl Zeiss Jena Gmbh | Method for increasing the spectral and spatial resolution of detectors |
| WO2002012864A1 (en) | 2000-08-08 | 2002-02-14 | Carl Zeiss Jena Gmbh | Method and assembly for increasing the spectral and spatial resolution of a detector |
| US6856391B2 (en) | 2000-11-17 | 2005-02-15 | Garab Gyozo | Method and apparatus for determining the polarization properties of light emitted, reflected or transmitted by a material using a laser scanning microscope |
| US20040051051A1 (en) | 2000-12-14 | 2004-03-18 | Olympus Optical Co., Ltd. | Fluorescence analysis apparatus and fluorescence analysis method |
| US6782297B2 (en) * | 2001-05-24 | 2004-08-24 | Eric Paul Tabor | Methods and apparatus for data smoothing |
| US20030218746A1 (en) | 2002-05-21 | 2003-11-27 | Sampas Nicholas M. | Imaging systems for signals on a surface |
| US20050260660A1 (en) * | 2002-11-07 | 2005-11-24 | Erasmus Universiteit Rotterdam | FRET probes and methods for detecting interacting molecules |
| JP2005099662A (en) | 2002-12-27 | 2005-04-14 | Olympus Corp | Confocal microscope |
| US20060158721A1 (en) | 2002-12-27 | 2006-07-20 | Olympus Optical Co., Ltd | Confocal microscope |
| US20040150880A1 (en) | 2002-12-27 | 2004-08-05 | Olympus Corporation | Confocal microscope |
| JP2005098876A (en) | 2003-09-25 | 2005-04-14 | Institute Of Physical & Chemical Research | Analytical method of analyzing interaction between two components |
| US20060078998A1 (en) * | 2004-09-28 | 2006-04-13 | Singulex, Inc. | System and methods for sample analysis |
| WO2006084283A2 (en) | 2005-01-31 | 2006-08-10 | The Board Of Trustees Of The University Of Illinois | Methods and devices for characterizing particles in clear and turbid media |
| US20060256338A1 (en) | 2005-01-31 | 2006-11-16 | The Board Of Trustees Of The University Of Iilinois | Methods and devices for characterizing particles in clear and turbid media |
| JP2008536093A (en) | 2005-01-31 | 2008-09-04 | ザ ボード オブ トラスティーズ オブ ザ ユニヴァーシティー オブ イリノイ | Method and device for characterizing particles in transparent and suspending media |
| JP2006333739A (en) | 2005-05-31 | 2006-12-14 | Hitachi High-Technologies Corp | Method for analyzing nucleic acid by monomolecular measurement |
| US20070231808A1 (en) | 2005-05-31 | 2007-10-04 | Hitachi High-Technologies Corporation | Methods of nucleic acid analysis by single molecule detection |
| JP2007020565A (en) | 2005-06-13 | 2007-02-01 | Kansai Bunri Sogo Gakuen | Method and system for detecting virus in specimen |
| EP1906172A1 (en) | 2005-07-15 | 2008-04-02 | Olympus Corporation | Light measuring instrument |
| WO2007010803A1 (en) | 2005-07-15 | 2007-01-25 | Olympus Corporation | Light measuring instrument |
| WO2007118209A2 (en) | 2006-04-07 | 2007-10-18 | Kim Laboratories | Apparatus and method for rapid detection of analytes |
| WO2007147159A2 (en) * | 2006-06-16 | 2007-12-21 | Cornell Research Foundation, Inc. | Functional nucleic acid ligands to fluorescent proteins |
| WO2008007580A1 (en) | 2006-07-13 | 2008-01-17 | Olympus Corporation | Method for analyzing fine particles |
| US20080052009A1 (en) | 2006-08-23 | 2008-02-28 | Washington, University Of | Method for deconvolving single-molecule intensity distributions for quantitative biological measurements |
| US8284484B2 (en) | 2006-09-14 | 2012-10-09 | PerkinElmer Singapore PTE, Ltd. | Relating to scanning confocal microscopy |
| JP2008116440A (en) | 2006-10-13 | 2008-05-22 | Shiga Pref Gov | Method and system for detecting fluorescent substance in sample |
| WO2008080417A1 (en) | 2006-12-28 | 2008-07-10 | Flult Biosystems Gmbh | A method of determining characteristic properties of a sample containing particles |
| US20100202043A1 (en) | 2007-02-14 | 2010-08-12 | Nikon Corporation | Slit-scanning confocal microscope |
| JP2008292371A (en) | 2007-05-25 | 2008-12-04 | Institute Of Physical & Chemical Research | Method for analyzing interaction by a plurality of components by fluorescence correlated spectroscopy and method for screening compound for controlling interaction |
| JP2009145242A (en) | 2007-12-14 | 2009-07-02 | Olympus Corp | Light measuring device |
| US20090159812A1 (en) * | 2007-12-19 | 2009-06-25 | Singulex, Inc | Scanning analyzer for single molecule detection and methods of use |
| WO2009117033A2 (en) | 2007-12-19 | 2009-09-24 | Singulex, Inc. | Scanning analyzer for single molecule detection and methods of use |
| JP2009281831A (en) | 2008-05-21 | 2009-12-03 | Hamamatsu Photonics Kk | Fluorescence analyzer and analysis method |
| JP2009288161A (en) | 2008-05-30 | 2009-12-10 | Olympus Corp | Optical measurement apparatus and optical measurement method |
| US20100177190A1 (en) | 2008-12-16 | 2010-07-15 | Ann-Shyn Chiang | Microscopy system with revolvable stage |
| JP2011002415A (en) | 2009-06-22 | 2011-01-06 | Olympus Corp | Fluorescence correlation spectroscopic device |
Non-Patent Citations (42)
| Title |
|---|
| Carlsson K et al: "Three-dimensional microscopy using a confocal laser scanning microscope", Optics Letters, Optical Society of America, vol. 10, No. 2, Feb. 1985, pp. 53-55, XP007922413, ISSN: 0146-9592. |
| Chinese Office Action dated Aug. 13, 2013, issued in related Chinese application No. 2011800116553 with translation (16 pages). |
| Chinese Office Action dated Aug. 9, 2013, issued in related Chinese application No. 201180011640.7 with translation. |
| Chinese Office Action dated Feb. 7, 2013, issued in related Chinese application No. 201180011644.5 with translation (18 pages). |
| Chinese Office Action dated Jul. 14, 2014, issued in corresponding Chinese Patent Application No. 201180036710.4 (12 pages). |
| Chinese Office Action dated Jul. 14, 2014, issued in corresponding Chinese Patent Application No. 201180036710.4 (6 pages). |
| European Communication Pursuant to Article 94(3) EPC dated Nov. 20, 2014, issued in corresponding European Patent Application No. 11812369.4 (6 pages). |
| Extended European search report dated Mar. 28, 2013, issued in related EP application No. 11750481. |
| Extended European Search Report dated Oct. 20, 2014, issued in related EP Application No. 12770835.2 (10 pages). |
| F. J. Meyers-Almes, "10 Nanoparticle Immunoassays: A new Method for Use in Molecular Diagnostics and High Throughput Pharmaceutical Screening based on Fluorescence Correlation Spectroscopy", R. Rigler, edit., Springer, Berlin, pp. 204-224, (2000). |
| Goodwin et al. "Rapid sizing of individual fluorescently stained DNA fragments by flow cytometry," Nucleic Acids Research, 1993, vol. 21, No. 4 pp. 803-806. |
| International Preliminary Report on Patentability (PCT/IPEA/409) issued in related PCT/JP2011/053481. |
| International Preliminary Report on Patentability (PCT/IPEA/409) issued in related PCT/JP2011/053482. |
| International Preliminary Report on Patentability (PCT/IPEA/409) issued in related PCT/JP2011/053483. |
| International Search Report for PCT/JP2011/066576, mailing date of Sep. 20, 2011. |
| International Search Report issued in related PCT/JP2011/053482, mailing date Mar. 29, 2011. |
| International Search Report of PCT/JP2011/053481, mailing date Mar. 29, 2011. |
| International Search Report of PCT/JP2011/053483, mailing date Mar. 29, 2011. |
| Itoh et al. "A New Method for Detection of Influenza Viruses by Single Particle-Recognition Based on the Principle of Fluorescence Correlation Spectroscopy," Chemistry and Biology, 2009, vol. 47, No. 12, pp. 823-830. |
| Japan Office Action dated Dec. 18, 2012, issued in related JP application No. 2012-503060 with translation. |
| K. Masataka, "Single molecule protein, nucleic acid, and enzyme assays and their procedures. Single molecule detection by fluorescence correlation spectroscopy", vol. 44, No. 9, pp. 1431-1438, (1999), With English translation. |
| Keller et al. "Single-Molecule Fluorescence Analysis in Solution," Applied Spectroscopy, 1996, vol. 50, No. 7, pp. 12A-32A. |
| Lee et al. "Laser-Induced Fluorescence Detection of a Single Molecule in a Capillary," Analytical Chemistry, Dec. 1, 1994, vol. 66, No. 23, pp. 4142-4149. |
| Li et al. "Ultrasensitive Coincidence Fluorescence Detection of Single DNA Molecule," Analytical Chemistry, Apr. 1, 2003, vol. 75, No. 7, pp. 1664-1670. |
| N. Kato et al., "A single molecule analyzer that enable new analysis of DNA and protein interactions", Gene Medicine vol. 6, No. 2, pp. 271-277, (2002). |
| Nie et al. "Probing Individual Molecules with Confocal Fluorescence Microscopy," Science, Nov. 11, 1994, vol. 266, pp. 1018-1021. |
| Office Action dated Mar. 25, 2015, issued in Chinese Patent Application No. 201180036710.4, with English translation (8 pages). |
| Office Action dated May 19, 2015, issued in corresponding Japanese Patent Application No. 2012-526460 with English translation (8 pages). |
| Official Notice dated May 13, 2015, issued in corresponding European application No. 11812369.4 (5 pages). |
| Official Notice dated Nov. 30, 2015, issued in corresponding European application No. 11812369.4. |
| P. Kask et al., "Fluorescence-intensity distribution analysis and its application in biomolecular detection technology", PNAS, vol. 96, No. 24, pp. 13756-13761, (1999). |
| P. Kask et al., "Two-Dimensional Fluorescence Intensity Distribution Analysis: Theory and Applications", Biophysical Journal, vol. 78, pp. 1703-1713, (2000). |
| Park et al., "Counting the Number of Fluorophores Labeled in Biomolecules by Observing the Fluorescence-Intensity Transient of a Single Molecule", Bulletin of the Chemical Society of Japan, vol. 78, No. 9, p. 1612-1618, Aug. 30, 2005. |
| Prasad V et al. "Topical Review; Confocal microscopy of colloids", Journal of Physics: Condensed Matter, Institute of Physics Publishing, Bristol, GB, vol. 19, No. 11, Mar. 21, 2007, p. 113102. |
| S. Sando and E.T. Kool., "Quencher as Leaving Group: Efficient Detection of DNA-Joining Reactions", J. Amer. Chem. Soc, vol. 124, No. 10, pp. 2096-2097, (2002). |
| Shuming N. et al., "Real-Time Detection of Single Molecules in Solution by Confocal Fluorescence Microscopy", Analytical Chemistry, American Chemical Society, vol. 67, No. 17, pp. 2849-2857, (1995). |
| Tahari, "Fluorescence Correlation Spectroscopy: Ultrasensitive Detection in Clear and Turbid Media," University of Illinois, 2005, pp. 1-88. |
| U.S. Office Action dated Jan. 3, 2013, issued in related U.S. Appl. No. 13/597,825. |
| U.S. Office Action dated Oct. 4, 2013, issued in related U.S. Appl. No. 13/596,243. |
| U.S. Office Action mailed Apr. 2, 2013, issued in related U.S. Appl. No. 13/596,280. |
| Written Opinion of International Searching Authority (PCT/ISA/237) issued in related PCT/JP2011/053481. |
| Wu et al. "Development and Preliminary Clinical Validation of a High Sensitivity Assay for Cardiac Troponin Using a Capillary Flow (Single Molecule) Fluorescence Detector," Clinical Chemistry, 2006, vol. 52, No. 11, pp. 2157-2159. |
Cited By (2)
| Publication number | Priority date | Publication date | Assignee | Title |
|---|---|---|---|---|
| US20140179023A1 (en) * | 2011-08-30 | 2014-06-26 | Olympus Corporation | Method for detecting a target particle in biosample containing pancreatic juice |
| US10732113B2 (en) * | 2016-02-26 | 2020-08-04 | Single Technologies Ab | Method and device for high throughput imaging |
Also Published As
| Publication number | Publication date |
|---|---|
| EP2584343B1 (en) | 2017-05-10 |
| EP2584343A4 (en) | 2014-01-08 |
| WO2012014778A1 (en) | 2012-02-02 |
| CN103026205B (en) | 2016-03-23 |
| JPWO2012014778A1 (en) | 2013-09-12 |
| CN103026205A (en) | 2013-04-03 |
| US20130122488A1 (en) | 2013-05-16 |
| JP5877155B2 (en) | 2016-03-02 |
| EP2584343A1 (en) | 2013-04-24 |
Similar Documents
| Publication | Publication Date | Title |
|---|---|---|
| US9395357B2 (en) | Method of detecting sparse particles in a solution using a light-emitting probe | |
| US8471220B2 (en) | Optical analysis device, optical analysis method and computer program for optical analysis | |
| US8785886B2 (en) | Optical analysis method using the light intensity of a single light-emitting particle | |
| US9116127B2 (en) | Quantitative determination method for target particles, photometric analysis device, and computer program for photometric analysis | |
| US8958066B2 (en) | Optical analysis method using measurement of light of two or more wavelength bands | |
| US9423349B2 (en) | Optical analysis device, optical analysis method and computer program for optical analysis using single light-emitting particle detection | |
| US10371631B2 (en) | Optical analysis device, optical analysis method and computer program for optical analysis using single light-emitting particle detection | |
| US8803106B2 (en) | Optical analysis device, optical analysis method and computer program for optical analysis for observing polarization characteristics of a single light-emitting particle | |
| US9354176B2 (en) | Method for detecting a target particle | |
| JP6013332B2 (en) | Target particle counting method | |
| JP6010029B2 (en) | Method for detecting fluorescent particles | |
| US20140179023A1 (en) | Method for detecting a target particle in biosample containing pancreatic juice |
Legal Events
| Date | Code | Title | Description |
|---|---|---|---|
| AS | Assignment |
Owner name: OLYMPUS CORPORATION, JAPAN Free format text: ASSIGNMENT OF ASSIGNORS INTEREST;ASSIGNORS:TANABE, TETSUYA;NAKATA, HIDETAKA;HANASHI, TAKUYA;AND OTHERS;SIGNING DATES FROM 20121227 TO 20130108;REEL/FRAME:029696/0756 |
|
| STCF | Information on status: patent grant |
Free format text: PATENTED CASE |
|
| AS | Assignment |
Owner name: OLYMPUS CORPORATION, JAPAN Free format text: CHANGE OF ADDRESS;ASSIGNOR:OLYMPUS CORPORATION;REEL/FRAME:040223/0561 Effective date: 20160425 |
|
| MAFP | Maintenance fee payment |
Free format text: PAYMENT OF MAINTENANCE FEE, 4TH YEAR, LARGE ENTITY (ORIGINAL EVENT CODE: M1551); ENTITY STATUS OF PATENT OWNER: LARGE ENTITY Year of fee payment: 4 |
|
| FEPP | Fee payment procedure |
Free format text: MAINTENANCE FEE REMINDER MAILED (ORIGINAL EVENT CODE: REM.); ENTITY STATUS OF PATENT OWNER: LARGE ENTITY |