US9405394B2 - Application operation evaluating apparatus and application operation evaluating method - Google Patents
Application operation evaluating apparatus and application operation evaluating method Download PDFInfo
- Publication number
- US9405394B2 US9405394B2 US14/382,124 US201314382124A US9405394B2 US 9405394 B2 US9405394 B2 US 9405394B2 US 201314382124 A US201314382124 A US 201314382124A US 9405394 B2 US9405394 B2 US 9405394B2
- Authority
- US
- United States
- Prior art keywords
- application
- application operation
- target surface
- cal
- pressing forces
- Prior art date
- Legal status (The legal status is an assumption and is not a legal conclusion. Google has not performed a legal analysis and makes no representation as to the accuracy of the status listed.)
- Active
Links
- 238000000034 method Methods 0.000 title claims description 58
- 238000003825 pressing Methods 0.000 claims abstract description 94
- 238000009826 distribution Methods 0.000 claims abstract description 54
- 239000006210 lotion Substances 0.000 claims description 7
- 230000007704 transition Effects 0.000 claims description 4
- 238000006073 displacement reaction Methods 0.000 description 31
- 238000005259 measurement Methods 0.000 description 24
- 239000000758 substrate Substances 0.000 description 21
- 238000000338 in vitro Methods 0.000 description 18
- 230000008569 process Effects 0.000 description 15
- 238000001727 in vivo Methods 0.000 description 11
- 238000012937 correction Methods 0.000 description 10
- 239000002537 cosmetic Substances 0.000 description 9
- 230000037072 sun protection Effects 0.000 description 9
- 238000003860 storage Methods 0.000 description 8
- 238000011156 evaluation Methods 0.000 description 7
- 230000001105 regulatory effect Effects 0.000 description 6
- 238000005303 weighing Methods 0.000 description 4
- 239000000470 constituent Substances 0.000 description 3
- 238000012545 processing Methods 0.000 description 3
- 238000012360 testing method Methods 0.000 description 3
- 238000004891 communication Methods 0.000 description 2
- 230000006872 improvement Effects 0.000 description 2
- 238000000691 measurement method Methods 0.000 description 2
- 238000012986 modification Methods 0.000 description 2
- 230000004048 modification Effects 0.000 description 2
- 230000000475 sunscreen effect Effects 0.000 description 2
- 239000000516 sunscreening agent Substances 0.000 description 2
- 230000008901 benefit Effects 0.000 description 1
- 239000003086 colorant Substances 0.000 description 1
- 238000011161 development Methods 0.000 description 1
- 230000006870 function Effects 0.000 description 1
- 239000004615 ingredient Substances 0.000 description 1
- 239000000463 material Substances 0.000 description 1
- 238000000053 physical method Methods 0.000 description 1
- 238000007781 pre-processing Methods 0.000 description 1
- 230000002633 protecting effect Effects 0.000 description 1
- 238000004611 spectroscopical analysis Methods 0.000 description 1
- 230000007480 spreading Effects 0.000 description 1
- 238000003892 spreading Methods 0.000 description 1
- 238000012549 training Methods 0.000 description 1
Images
Classifications
-
- G—PHYSICS
- G06—COMPUTING; CALCULATING OR COUNTING
- G06F—ELECTRIC DIGITAL DATA PROCESSING
- G06F3/00—Input arrangements for transferring data to be processed into a form capable of being handled by the computer; Output arrangements for transferring data from processing unit to output unit, e.g. interface arrangements
- G06F3/01—Input arrangements or combined input and output arrangements for interaction between user and computer
- G06F3/03—Arrangements for converting the position or the displacement of a member into a coded form
- G06F3/041—Digitisers, e.g. for touch screens or touch pads, characterised by the transducing means
- G06F3/0414—Digitisers, e.g. for touch screens or touch pads, characterised by the transducing means using force sensing means to determine a position
-
- G—PHYSICS
- G01—MEASURING; TESTING
- G01L—MEASURING FORCE, STRESS, TORQUE, WORK, MECHANICAL POWER, MECHANICAL EFFICIENCY, OR FLUID PRESSURE
- G01L1/00—Measuring force or stress, in general
- G01L1/20—Measuring force or stress, in general by measuring variations in ohmic resistance of solid materials or of electrically-conductive fluids; by making use of electrokinetic cells, i.e. liquid-containing cells wherein an electrical potential is produced or varied upon the application of stress
- G01L1/205—Measuring force or stress, in general by measuring variations in ohmic resistance of solid materials or of electrically-conductive fluids; by making use of electrokinetic cells, i.e. liquid-containing cells wherein an electrical potential is produced or varied upon the application of stress using distributed sensing elements
-
- G—PHYSICS
- G01—MEASURING; TESTING
- G01L—MEASURING FORCE, STRESS, TORQUE, WORK, MECHANICAL POWER, MECHANICAL EFFICIENCY, OR FLUID PRESSURE
- G01L25/00—Testing or calibrating of apparatus for measuring force, torque, work, mechanical power, or mechanical efficiency
-
- G—PHYSICS
- G01—MEASURING; TESTING
- G01N—INVESTIGATING OR ANALYSING MATERIALS BY DETERMINING THEIR CHEMICAL OR PHYSICAL PROPERTIES
- G01N17/00—Investigating resistance of materials to the weather, to corrosion, or to light
- G01N17/004—Investigating resistance of materials to the weather, to corrosion, or to light to light
-
- G—PHYSICS
- G06—COMPUTING; CALCULATING OR COUNTING
- G06F—ELECTRIC DIGITAL DATA PROCESSING
- G06F3/00—Input arrangements for transferring data to be processed into a form capable of being handled by the computer; Output arrangements for transferring data from processing unit to output unit, e.g. interface arrangements
- G06F3/01—Input arrangements or combined input and output arrangements for interaction between user and computer
- G06F3/03—Arrangements for converting the position or the displacement of a member into a coded form
- G06F3/033—Pointing devices displaced or positioned by the user, e.g. mice, trackballs, pens or joysticks; Accessories therefor
- G06F3/0354—Pointing devices displaced or positioned by the user, e.g. mice, trackballs, pens or joysticks; Accessories therefor with detection of 2D relative movements between the device, or an operating part thereof, and a plane or surface, e.g. 2D mice, trackballs, pens or pucks
- G06F3/03547—Touch pads, in which fingers can move on a surface
-
- G—PHYSICS
- G06—COMPUTING; CALCULATING OR COUNTING
- G06F—ELECTRIC DIGITAL DATA PROCESSING
- G06F3/00—Input arrangements for transferring data to be processed into a form capable of being handled by the computer; Output arrangements for transferring data from processing unit to output unit, e.g. interface arrangements
- G06F3/01—Input arrangements or combined input and output arrangements for interaction between user and computer
- G06F3/03—Arrangements for converting the position or the displacement of a member into a coded form
- G06F3/041—Digitisers, e.g. for touch screens or touch pads, characterised by the transducing means
- G06F3/0414—Digitisers, e.g. for touch screens or touch pads, characterised by the transducing means using force sensing means to determine a position
- G06F3/04142—Digitisers, e.g. for touch screens or touch pads, characterised by the transducing means using force sensing means to determine a position the force sensing means being located peripherally, e.g. disposed at the corners or at the side of a touch sensing plate
Definitions
- the present invention relates to an application operation evaluating apparatus and an application operation evaluating method.
- Sun protection cosmetics are known as functional cosmetics specified to protect against ultraviolet light.
- numerical index typically a Sun Protection Factor value (SPF)
- SPF Sun Protection Factor value
- the SPF value is a value based on an “ISO in vivo SPF measuring method” (see non-Patent Document 1, for example) or the like and is obtained by an in vivo measuring method using skin of a human test subject.
- the measurement is conducted under a condition that a professional engineer (applier) applies a predetermined amount of sun protection cosmetic on the skin by using his/her “finger”.
- the reason that the applier uses his/her finger in the measurement is to approximate the applied condition on the skin as the consumers mainly use their fingers when actually using the sun protection cosmetic.
- “to increase the repeatability of the applied conditions” means to actualize the same predetermined applied condition every time. This means that the thickness of the sample on an applied surface is uniform at every time, and the same measurement result is obtained at any position on the applied surface.
- the actual thickness of the applied sample depends on the ratio remained in the ingredient. For example, the thickness becomes an order of micron based on the sample applied amount (2.00 mg/cm 2 ) defined by the in vivo SPF measurement method, and it is not easy to apply the sample of this thickness to be uniform on the applied surface by a finger.
- Patent Documents 2 and 3 and non-Patent Document 3 for example
- an in vitro SPF measurement has been provided (see Patent Documents 2 and 3 and non-Patent Document 3, for example) by which an SPF value of the sample is predicted by a physical measurement using an application substrate that is a substitute for skin (see Patent Document 1 and non-Patent Document 2, for example), without using skin of a test subject.
- This method is often used at a development stage as this measurement can be easily conducted within a short time with a lower cost.
- the in vitro SPF measurement is a method for predicting a result of the in vivo SPF measurement, and a sample is applied using a “finger” following the in vivo SPF measurement when applying the sample on the above described application substrate.
- the above described repeatability of the applied conditions is required.
- improvement of the repeatability has been provided by standardizing details of the application method (see Patent Document 4, for example).
- the present invention is made in light of. the above problems, and provides an application operation evaluating apparatus, an application operation evaluating method and an application operation evaluating program capable of improving repeatability regarding an application operation.
- an application operation evaluating apparatus including a detecting unit that detects pressing force obtained by a plurality of sensors provided at an application target surface in accordance with an application operation to the application target surface; an estimating unit that estimates a pressed position of the application operation on the application target surface based on pressing forces respectively applied to the sensors obtained by the detecting unit; a load distribution generating unit that generates load distribution in accordance with the application operation based on the pressing force obtained by the detecting unit and the pressed position obtained by the estimating unit; and a display unit that displays the load distribution obtained by the load distribution generating unit on a screen.
- FIG. 1 is a schematic view illustrating an application operation evaluating apparatus of an embodiment
- FIG. 2 is a view illustrating an example of a functional structure of the application operation evaluating apparatus of the embodiment
- FIG. 3 is a view illustrating an example of a hardware structure of the application operation evaluating apparatus of the embodiment
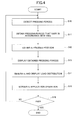
- FIG. 4 is a flowchart illustrating an application operation evaluating method of the embodiment
- FIG. 5 is a view for explaining a sample application method applied on an application substrate
- FIG. 6 is a view for explaining sensor calibration in measuring pressing forces
- FIG. 7 is a view for explaining the sensor calibration before estimating a pressed position
- FIG. 8 is a flowchart illustrating a flow of a coordinate correction amount obtaining process
- FIG. 9 is a view for explaining an example of obtaining an equation that is used in obtaining the displacement amounts
- FIG. 10 is a flowchart illustrating a flow of a pressed position estimating process
- FIG. 11 is a view illustrating an example of a display screen displayed during an application operation
- FIG. 12 is a view illustrating an example of a display screen showing the load distribution and the result of each step
- FIG. 13 is a view illustrating a relationship between each application operation and an in vitro SPF predicted value
- FIG. 14 is a view illustrating a relationship between an application force and an in vitro SPF predicted value of each sample.
- FIG. 15 is a view illustrating a relationship between the application force and a CV value (%) of the in vitro SPF predicted value of each of the samples.
- the present inventors have found that, after measuring many points of an applied surface on which a sample is applied with predetermined application force by a spectrometry apparatus, for example, applying the uniform thickness can be obtained by applying the sample by uniform application force.
- the above described application of the uniform thickness is actualized and the repeatability of the applied conditions is improved by measuring application forces in an application operation and evaluating the application operation to apply a sample with uniform application forces.
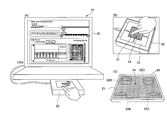
- FIG. 1 is a schematic view illustrating an application operation evaluating apparatus of the embodiment.
- (A) illustrates an entirety of the application operation evaluating apparatus.
- (B) illustrates an application operation on an application target surface.
- (C) illustrates sensors placed at the application target surface.
- a sun protection cosmetic (sunscreen) is exemplified as an example of a skin lotion to be applied on the application target surface in this embodiment, this is not limited so.
- a make-up cosmetic, a skin care cosmetic or the like may be used.
- an operation of applying a predetermined amount of a sample of a sun protection cosmetic that uses a finger or a finger cot (finger sack) is exemplified, for example, following the in vivo SPF measurement method.
- the application operation may be an operation that does not use skin lotion.
- an application operation evaluating apparatus 10 of the embodiment may be used for evaluating an application operation when applying various materials other than the skin lotion.
- the application operation evaluating apparatus 10 includes a sensor unit 20 that detects a pressing force (application force) in accordance with an application operation, and a display unit 30 that processes pressing force data detected by the sensor unit 20 and displays generated images.
- the sensor unit 20 includes an application substrate 21 , sensors 22 and a position regulating member 23 that regulates the position of the application substrate 21 .
- the application substrate 21 is a skin substitute film (plate) that copies sulcus cutis and crista cutis of a predetermined portion.
- “SPF MASTER PA01” or the like may be used, for example, but this is not limited so.
- the application substrate 21 is placed on a plate member or the like provided on the sensors 22 and the position of the application substrate 21 is regulated by the position regulating member 23 such as a magnet or the like.
- An application target surface 24 of the application substrate 21 has a size about 5 ⁇ 5 cm, for. example, but this is not limited so.
- an application operation of applying a sample on the application target surface 24 is performed by a finger of a user, finger cot or the like.
- the sensors 22 include four sensors 22 A to 22 D, for example.
- the sensors 22 are placed at four corners of a lower surface of the application target surface 24 , for example.
- Each of the sensors 22 is a strain gauge, a load cell, or the like, for example and measures variation of a pressing force (micro load) applied to the respective sensor 22 A to sensor 22 D.
- the sensors 22 may be composed of three sensors, for example, by changing the arrangement.
- the display unit 30 may display the pressing force that varies in accordance with time by the application operation to the application target surface 24 by the user on a screen by a sequentially display mode, or may display load distribution on a screen by an accumulated display mode, by storing the pressing force that varies in accordance with time in a memory or the like provided inside the application operation evaluating apparatus 10 . Further, the display unit 30 displays various setting screens or the like for evaluating the application operation by the user using the application operation evaluating apparatus 10 .
- FIG. 2 illustrates an example of a functional structure of the application operation evaluating apparatus of the embodiment.
- the application operation evaluating apparatus 10 includes an input unit 41 , an output unit 42 , a storing unit 43 , a detecting unit 44 , a calculating unit 45 , an estimating unit 46 , a load distribution generating unit 47 , an evaluating unit 48 , a screen generating unit 49 and a control unit 50 .
- the input unit 41 includes a pointing device or the like such as a keyboard, a mouse or the like, for example, and accepts input of starting or ending various instructions or the like.
- a pointing device or the like such as a keyboard, a mouse or the like, for example, and accepts input of starting or ending various instructions or the like.
- the output unit 42 includes a display, a speaker or the like, for example, and displays, outputs sound or the like of a content input by the input unit 41 , a content executed based on the input content or the like.
- the output unit 42 corresponds to the display unit 30 illustrated in FIG. 1 , for example, and displays the load distribution obtained by the load distribution generating unit 47 on a screen, or displays various screens generated by the screen generating unit 49 .
- the storing unit 43 stores pressing forces applied to the sensors 22 A to 228 obtained by the detecting unit 44 and a pressed position estimated by the estimating unit 46 . Further, the storing unit 43 may store the calculated result or the like calculated by the calculating unit 45 , or a previously set appropriate value of the pressing force.
- the detecting unit 44 corresponds to the sensor unit 20 illustrated in FIG. 1 , for example.
- the detecting unit 44 detects a pressing force by processing data obtained from the plurality of sensors 22 placed at the application target surface 24 in accordance with the application operation to the application target surface 24 .
- the detecting unit 44 detects the pressing force resulting from an application operation that uses a finger or a finger cot against the application target surface 24 , or the pressing force resulting from the application operation of applying a skin lotion provided on the application target surface 24 .
- the calculating unit 45 obtains the pressing force obtained by the detecting unit 44 every 20 ms, for example, and calculates a peak value of the pressing force within each predetermined time (0.5 seconds, for example).
- the method of calculating is not limited so, and the calculating unit 45 may calculate an average value of the pressing forces within each predetermined time.
- the time interval for obtaining the pressing force is not limited to the above described 20 ms, and may be varied in accordance with the difference in the application operation or the like, for example.
- the estimating unit 46 estimates the pressed position of the application operation at the application target surface 24 based on the pressing forces respectively applied to the sensors 22 obtained by the detecting unit 44 .
- the pressed position estimating method by the estimating unit 46 is explained later.
- the load distribution generating unit 47 generates load distribution caused by the application operation to the application target surface 24 based on the pressing forces obtained by the detecting unit 44 and the pressed position obtained by the estimating unit 46 at real time.
- the load distribution generating unit 47 previously sets color data corresponding to the load, and generates color distribution at the corresponding pressed position on the application target surface 24 based, on the load data by the pressing forces obtained by the detecting unit 44 , for example.
- the data of the pressed position is obtained from the estimating unit 46 .
- the load distribution generating unit 47 generates the load distribution (accumulated color distribution) using an accumulated value that is obtained by accumulating the pressing forces stored in the storing unit 43 for each pressed position, for example.
- the evaluating unit 48 compares the peak value or the average value of the pressing forces within the predetermined time obtained by the calculating unit 45 with a previously set appropriate value and evaluates the application operation based on the compared result.
- the screen generating unit 49 generates various screens for processing the evaluation of the application operation of the embodiment or a screen for the processed result or the like.
- the screen generating unit 49 outputs the generated screens to the output unit 42 or the like.
- the control unit 50 controls the entirety of components of the application operation evaluating apparatus 10 .
- the control unit 50 controls the detecting unit 44 , the estimating unit 46 , the load distribution generating unit 47 and the like based on the instruction from the input unit 41 by the user or the like, for example.
- FIG. 3 is a view illustrating an example of a hardware structure of the application operation evaluating apparatus of the embodiment.
- the application operation evaluating apparatus 10 includes an input device 51 , an output device 52 , a drive device 53 , an auxiliary storage 54 , a memory device 55 , a Central Processing Unit (CPU) 56 and a network connecting device 57 that are connected with each other via a system bus B.
- CPU Central Processing Unit
- the input device 51 includes a pointing device or the like such as a keyboard, a mouse or the like operated by the user or the like, for example, and inputs various operation signals such as executing the program or the like by the user or the like.
- a pointing device or the like such as a keyboard, a mouse or the like operated by the user or the like, for example, and inputs various operation signals such as executing the program or the like by the user or the like.
- the output device 52 includes a display for displaying a Graphical User Interface (GUI) necessary for operating the computer that executes the processes of the embodiment, screens generated by the screen generating unit 49 or the like, and displays the executed process or result of the program by the control program of the CPU 56 .
- GUI Graphical User Interface
- the input device 51 and the output device 52 may be an integrated input output device such as a touch panel or the like.
- the application operation evaluating program that is installed in the computer body is provided by a portable recording medium 58 or the like such as a USB memory, a CD-ROM or the like, for example.
- the recording medium 58 is capable of being set in the drive device 53 and the program stored in the recording medium 58 is installed in the auxiliary storage 54 via the drive device 53 from the recording medium 58 .
- the auxiliary storage 54 is a storage such as a hard disk or the like and stores the application operation evaluating program, a control program or the like of the computer, and the data can be input and output in accordance with necessity.
- the memory device 55 stores a program or the like that is read out from the auxiliary storage 54 by the CPU 56 .
- a Read Only Memory (ROM), a Random Access Memory (RAM) or the like may be used.
- the CPU 56 controls entire processes of the computer such as various calculations, input/output of data between each hardware structure unit, or the like, based on a control program such as an Operating System (OS) or the like, and a program stored in the memory device 55 .
- a control program such as an Operating System (OS) or the like
- OS Operating System
- Various information or the like used in executing the programs are obtained from the auxiliary storage 54 and executed results or the like are stored in the auxiliary storage 54 .
- the network connecting device 57 obtains a program from an external apparatus connected to a communication network or provides an executed result or the like obtained by executing the program to the external apparatus, by connecting to the communication network or the like.
- the application operation evaluating apparatus 10 is capable of performing the processes of the embodiment by the above configuration of the hardware structure.
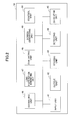
- FIG. 4 is a flowchart illustrating the application operation evaluating method of the embodiment.
- the calculating unit 45 obtains the pressing forces that vary in accordance with time (S 11 ).
- the estimating unit 46 estimates the pressed position of the application operation on the application target surface 24 based on the pressing forces each applied to the sensors 22 , obtained by the detecting unit 44 (S 12 ).
- the output unit 42 displays the pressing forces obtained by the calculating unit 45 (S 13 ).
- the load distribution generating unit 47 generates the load distribution in accordance with the application operation based on the pressing forces obtained by the detecting unit 44 and the pressed position obtained by the estimating unit 46 , and displays the generated load distribution by the output unit 42 (S 14 ).
- the evaluating unit 48 compares the peak value of the pressing forces within the predetermined time obtained by the calculating unit 45 with the previously set appropriate value, and evaluates the application operation based on the compared result (S 15 ).
- control unit 50 determines whether the application, operation is finished (S 16 ), and returns to the process of S 10 when it is determined that the application operation is not finished (NO in S 16 ). On the other hand, when it is determined that the application operation is finished (YES in S 16 ), the processes are finished.
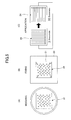
- FIG. 5 is a view for explaining the sample application method of applying the sample on the application substrate.
- (A) illustrates sample weighing
- (B) illustrates fixing the application substrate 21 after sample weighing
- (C) illustrates a flow of application steps.
- the sample weighing is performed within a range of about 30 to 60 spots on the application substrate 21 with a size of 5 ⁇ 5 cm, for example, using a syringe or the like, for example, within a predetermined time.
- the application substrate 21 is placed on the sensor unit 20 of the application operation evaluating apparatus 10 and the position of the application substrate 21 is regulated by the position regulating member 23 .
- step 1 the sample is spread by drawing small circles on the application substrate 21 many times for about 10 seconds. At this time, the sample may be applied on the entirety of the application target surface 24 of the application substrate 21 as spreading by application force of 25 to 50 g.
- step 2 as illustrated in (C) [I] of FIG. 5 , an operation of 1 stroke (about 0.5 seconds, for example) in a vertical direction (a longitudinal direction in FIG. 5 ) is repeated 10 times as an application operation in the vertical direction. Further, as illustrated in (C) [II] of FIG. 5 , an operation of 1 stroke (about 0.5 seconds, for example) in a horizontal direction (a lateral direction in FIG. 5 ) is repeated 10 times as an application operation in the horizontal direction. In step 2 , a set of application operation including the application operation in the vertical direction (about 5 seconds, for example) and the application operation in the horizontal direction (about 5 seconds, for example) is repeated 5 times (about 50 seconds, for example).
- the application operation is evaluated based on the application force or the like in accordance with the application operation is evaluated by the application operation evaluating apparatus 10 .
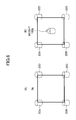
- FIG. 6 is a view for explaining the sensor calibration when measuring the pressing forces.
- the calculating unit 45 performs the following steps as an initial calibration.
- zero value data a 0,n is assumed as each sensor output for 0 g (“n” corresponds to a sensor number 1, 2, 3 and 4, and the numbers 1 to 4 corresponds to the sensors 22 A to 22 D) and data b 100,n is assumed as each sensor output for 100 g.
- the coefficient k for calibration is obtained.
- each sensor output is assumed as c cal,n , and the total output value C is calculated from the following equation (3).
- measurement pressing force G is obtained by sequentially calculating a difference between the obtained outputs of the sensors 22 and the sensor outputs for 0 g, and multiplying the coefficient k.
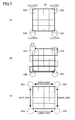
- FIG. 7 is a view for explaining the sensor calibration before estimating the pressed position.
- the estimating unit 46 obtains output values (zero value data a 0,n ) obtained from the sensors 22 A to 22 D when nothing is placed (0 g, for example) on the application target surface 24 .
- output values d cal,n (x, y) for each of which the zero value calibration is performed is obtained by subtracting the zero value data a 0,n from the output values c cal,n (x, y) when the predetermined weight is mounted.
- total output values D cal,n (x, y) are calculated from the following equation (5), for example, by calculating a total of the output values d cal,n (x, y) for each of which the zero value calibration is performed for the sensors 22 A to 22 D, at each coordinate point. Further, a ratio (individual output ratio e cal,n (x, y)) of the output value d cal,n (x, y) of each of the sensors 22 A to 22 D with respect to the total output value D cal,n (x,y) is obtained by the following equation (6).
- a calibration value Val cal,n (x, y) is obtained using the following equation (7), for example, such that a difference between the maximum value and the minimum, value of the individual, output ratios e cal,n (x, y) of the sensors 22 A to 22 D becomes a predetermined value (“100”, for example).
- calibrated values f cal,n (x,y) are obtained by the following equation (8), using the calibration value Val cal,n (x, y), such that the maximum value and the minimum value of the individual output ratios e cal,n (x, y) of the sensors 22 A to 22 D become the predetermined values (“100” and “0”, for example).
- a side including the sensor 22 A and the sensor 228 at an end portion is referred to as a “left side” and a side including the sensor 22 B and the sensor 22 C as an end portion is referred to as a “lower side” .
- a side including the sensor 22 C and the sensor 22 D as an end portion is referred to as a “right side” and a side including the sensor 22 D and the sensor 22 A is referred to as an “upper side” .
- a rectangular area in other words, a calibration target area
- FIG. 8 is a flowchart illustrating a flow of obtaining steps of a coordinate correction amount.
- the zero value data a 0,n is obtained from the sensors 22 A to 220 (S 20 )
- the output values c cal,n (x, y) in a case when the predetermined weight (100 g, for example) is placed at each coordinate point (25 points for the example in (C) of FIG. 7 ) are obtained (S 21 ).
- the output values d cal,n (x, y) are obtained for each of which the zero value calibration is performed at each coordinate point (S 22 ).
- the maximum value and the minimum value of the individual output ratios e cal,n (x, y) of the sensors 22 A to 22 D are obtained.
- the calibration value Val cal,n is obtained by which a difference between the obtained maximum value and the minimum value becomes a predetermined value (100, for example) (S 24 ).
- the individual output ratios e cal,n (x, y) are corrected using the calibration value V cal,n (x, y) such that the maximum value and the minimum value of the sensors 22 A to 22 D become predetermined values (100 and 0, for example), respectively, to obtain the calibrated values f cal,n (x,y) (S 25 ).
- V cal ( x,y ) ( f cal,1 ( x,y )+ f cal,4 ( x,y ))/( f cal,1 ( x,y )+ f cal,2 ( x,y )+ f cal,3 ( x,y )+ f cal,4 ( x,y ))
- H cal ( x,y ) ( f cal,1 ( x,y )+ f cal,2 ( x,y ))/( f cal,1 ( x,y )+ f cal,2 ( x,y )+ f cal,3 ( x,y )+ f cal,4 ( x,y )) (10)
- displacement amounts WX cal (x,y) and W cal (x,y) from each side at each of the above described predetermined positions (16 points that contact an outer periphery of the application target surface 24 among the above described 25 points, for example) are obtained using the following equation (11) (S 28 ).
- a method of obtaining the equation used in obtaining displacement amounts WX cal (x,y) and WY cal (x, y) from each side is explained later.
- the displacement amounts are converted to positional information corresponding to output values of the sensors 22 A to 22 D when a predetermined position is pressed.
- average values of the displacement amounts of the right side, the upper side and the lower side are obtained from displacement amounts obtained for coordinate points of the right side, the upper side and the lower side, respectively.
- the average value Lcx of the displacement amount of the left side is assumed as a reference point calXval
- the average value Ucy of the displacement amount of the upper side is assumed as a reference point calYval.
- the coordinate correction amounts for selling the coordinate of the calibration target area are previously obtained and used in the pressed position estimating process.
- an example of obtaining the coordinate correction amounts is not limited so.
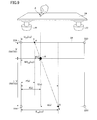
- FIG. 9 is a view for explaining an example of obtaining an equation that used in obtaining the displacement amounts.
- a method of obtaining the displacement amount WX (in other words, X coordinate) at a pressed position, when an arbitrary position (a pressed position A, for example) of the application target surface 24 is pressed, from each side is explained.
- a ratio of load ratios of the upper side and the lower side in the X direction (lateral direction) is added, for example.
- the pressure ratio of the lower side is expressed as follows.
- B cal f cal,3 /( f cal,2 +f cal,3 )
- the weight ratio of the upper side with respect to a total and the weight ratio of the lower side with respect to the total are expressed as follows.
- V cal ( f cal,1 +f cal,4 /( f cal,1 +f cal,2 +f cal,3 +f cal,4 )
- the weight ratio of the lower side can foe expressed as follows.
- V cal ( f cal,2 +f cal,3 )/( f cal,1 +f cal,2 +f cal,3 +f cal,4 )
- V cal is an equation same as the one explained above as the pressure ratio in the vertical direction.
- the X coordinate (in other words, x coordinate of WX) of barycenter of the point P and the point Q can be expressed as follows.
- Xa,Ya) and Xb,Yb coordinates of mass points a and b
- Xb,Yb coordinates of mass points a and b
- X ( n ⁇ Xa+m ⁇ Xb )/( m+n )
- Y ( n ⁇ Ya+m ⁇ Yb )/( m+n )
- the y coordinate of the displacement WX can be expressed as follows.
- WX(x,y) can be expressed as follows based on the above described WX(x) and WX(y),.
- WX ( x,y ) ( U cal ⁇ (1- V cal )+ B cal ⁇ V cal ,V cal )
- the X coordinate of the pressed position A to which load ratios of the upper side and the lower side in the lateral direction are added can be expressed as U cal ⁇ (1-V cal )+B cal ⁇ V cal .
- weight ratio of the left side to the total and the weight ratio of the right side to the total are expressed as follows.
- H cal (f cal,1 +f cal,2 )/( f cal,1 +f cal,2 +f cal,3 +f cal,4 )
- the weight ratio of the right side can foe expressed as follows.
- H cal (f cal,3 +f cal,4 )/( f cal,1 +f cal,2 +f cal,3 +f cal,4 )
- H cal is an equation same as the one explained above as the pressure ratio in the horizontal direction.
- the Y coordinate (in other words, the y coordinate of WY) of the barycenter of the point P′ and the point Q′ can be expressed as follows by the above described equation that internally divides the mass point a of the mass m and the mass point b of the mass n.
- the x coordinate of the displacement amount WY can be expressed as follows.
- WY(x,y) can be expressed as follows based on the above described WY(x) and WY(y).
- the Y coordinate of the pressed position A to which load ratios of the left side and the right side in the longitudinal direction are added can be expressed as L cal ⁇ (1-H cal )+R cal ⁇ H cal )
- the left end of the upper side is coordinate (x 1 ,y 1 )
- the left end of the lower side is coordinate (x 1 ,y 1 ,+1)
- the right end of the upper side is coordinate (x 4 ,y 4 )
- the right end of the lower side is coordinate (x 4 , y 4 +1) in FIG. 9 .
- the coordinate of the point P is (Px,Py)
- the pressure ratio from the coordinate (x 1 ,y 1 ) of the upper side to the point P is f cal,1 /(f cal,1 +f cal,4 )
- the pressure ratio from the point P to the coordinate (x 4 ,y 4 ) of the upper side is f cal,4 /(f cal,1 +f cal,4 ).
- the coordinate of the above described point Q is (Qx,Qy)
- the pressure ratio from the coordinate (x 1 ,y 1 +1) of the lower side to the point Q is f cal,2 /(f cal,2 +f cal,3 )
- the pressure ratio from the point Q to the coordinate (x 4 ,y 4 +1) of the lower side is f cal,3 /(f cal,2 +f cal,3 ).
- Px and Qx can be expressed as follows.
- Px x 1+( x 4 ⁇ x 1) ⁇ f cal,1 /( f cal,1 +f cal,4 )
- Qx x 1+( x 4 ⁇ x 1) ⁇ f cal,2 /( f cal,2 +f cal,3 )
- WX can be expressed as follows.
- WX can be obtained by the above described method.
- WY can be obtained by the similar method as that of WX.
- an amount from a crossing point of a line from the point P toward the lower side in a perpendicular direction with respect to the lower side and a line from the left side toward the right side in a perpendicular direction with respect to the left side and the right side that passes the pressed position A, to the pressed position A is a(x).
- an amount from a crossing point of a line from the upper side to the lower side in a perpendicular direction with respect to the upper side and the lower side that passes the pressed position A and the lower side, to the point Q is b(x).
- the X coordinate of the pressed position A can be expressed by the following method.
- ⁇ ⁇ means ⁇ ⁇ as ⁇ ⁇ follows .
- WX can be obtained by the above described method.
- WY can be obtained by the similar method as that of WX.
- the pressed position By obtaining the displacement amounts WX and WY of the pressed position, when the position is pressed by the user, for example, from each side by using the above described equations for obtaining the displacement amounts, the pressed position can be estimated as follows.
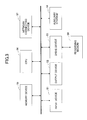
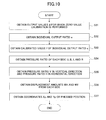
- FIG. 10 is a flowchart illustrating a flow of the pressed position estimating process. Steps from S 31 to S 36 in FIG. 10 are performed by the method similar to the steps from S 22 to S 23 and S 25 to S 28 in FIG. 8 .
- the steps of FIG. 10 are different from those of FIG. 8 in which displacement amounts are obtained when predetermined positions (25 points that are divided by the same interval, for example) are pressed by mounting a predetermined weight at the predetermined positions for setting the coordinates of the application target surface 24 , in that the displacement amounts are obtained based on the output values obtained from the sensors 22 A to 22 D when the user presses.
- the zero value data a obtained in the step of S 20 in FIG. 8 is subtracted from each of the output values from the sensors 22 A to 22 D to obtain the output values d cal for each of which the zero value calibration is performed (S 31 ).
- the total output value D cal is obtained from the four output values d cal obtained in the step of S 31 and a ratio of the output value with respect to the total output value D cal (individual output ratio e cal ) of each of the sensors 22 A to 22 D is obtained (S 32 ).
- the maximum value and the minimum value of the individual output ratios e cal of the sensors 22 A to 22 D are obtained.
- the individual output ratios e cal are calibrated by the calibration value Val cal obtained in the step of S 24 in FIG. 8 such that the maximum value and the minimum value become the predetermined, values (100 and 0, for example), respectively, to obtain the calibrated values f cal (S 33 ).
- the pressure ratios U cal , B cal , L cal and R cal of each side are obtained using the four calibrated values f cal obtained in the step of S 33 (S 34 ).
- the pressure ratio V cal in the vertical direction or the pressure ratio H cal in the horizontal direction is obtained (S 35 ).
- displacement amounts WX cal and WY cal from each side are obtained (S 36 ).
- coordinate Xp, Yp of the pressed position is obtained by correcting the displacement amounts WX cal and WY cal from each side obtained in the step of S 36 by the coordinate correction amounts (reference points calXval and calYval, and resolutions calXscale and calYscale, for example) previously obtained in the step illustrated in FIG. 8 (S 37 ), and the processes are finished.
- a reference point, for coordinates is calXval and calYval
- the displacement amounts WX cal and WY cal corrected by the resolutions calXscale and calYscale are set as a coordinate Xp,Yp of the pressed position.
- the coordinate Xp,Yp of the pressed position may be obtained by using the following equation (17).
- An origin (reference point) of the coordinate Xp,Yp obtained in the step of S 37 is, for example, a crossing point of the left side and the lower side of the application target surface 24 (in other words, a corner at left and lower).
- positional offset values calXposOffset and calYposOffset may be obtained using a predetermined value (50 when a diagonal line is divided by 100, for example) to express the coordinate Xp, Yp of the pressed position.
- the positional offset values calXposOffset and calYposOffset may be obtained by the following equation (18).
- the coordinate Xp,Yp of the pressed position is changed to a value from the a center coordinate (in other words, coordinate Xpos,Ypos) using the positional offset values calXposOffset and calYposOffset.
- the coordinate Xpos,Ypos may be obtained by the following equation (19), for example.
- the pressed position on the application target surface 24 that is pressed by a user at an actual measurement can be determined.
- the estimating unit 46 can estimate the pressed position of the application operation on the application target surface 24 based on the pressing forces applied to the sensors 22 obtained by the detecting unit 44 , respectively.
- the method of measuring the pressing forces and the method of estimating the pressed position of the embodiment are not limited so.
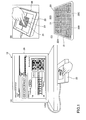
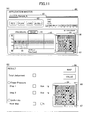
- FIG. 11 is a view illustrating an example of a display screen displayed during the application operation.
- a screen 60 illustrated in (A) of FIG. 11 includes a sample display part 61 , an operation display part 62 , a pressing force transit display part 63 , a load distribution display part 64 and an evaluation result display part 65 .
- sample A for the example illustrated in FIG. 7
- sample A for the example illustrated in FIG. 7
- selection buttons such as “REC”, “PLAY”, “LOAD”, “RESULT” or the like are displayed. For example, when the “REC” button is pressed before an application operation of the above described step 1 or step 2 is performed, the pressing force and the pressed position detected in accordance with the application operation are stored in the storing unit 43 .
- the output unit 42 outputs a starting sound that indicates starting of the application operation, and then outputs an indicating sound for indicating a timing to match the application operation to a speed of each step (1 stroke/0.5 seconds, for example), for example.
- the variance of the pressing force in accordance with time is displayed by a line graph or the like in which the horizontal axis indicates Time (sec) and the vertical axis indicates pressing force (g).
- the waveform 66 illustrated in (A) of FIG. 11 is a signal of time axis obtained every 20 ms, for example.
- the load distribution display part 64 a screen corresponding to the application target surface 24 is displayed. Specifically, the load distribution generating unit 47 generates load distribution using the accumulated value of the accumulated pressing force for each of the pressed positions estimated by the estimating unit 46 . The load distribution generated as such is displayed in the screen corresponding to the application target surface 24 .
- the color distribution expressed in different colors depending on the strength of the accumulated pressing force (from 20 g expressed by the color 67 to 200 g expressed by the color 68 or the like, for example) is displayed.
- a state in which the load is applied is displayed by the color 68 at an area corresponding to a center portion of the application target surface 24 and a state in which the load is not applied is displayed by the color 67 at end portions of the application target surface 24 .
- a screen 69 illustrated in (B) of FIG. 11 is displayed.
- an average value (Ave-g) of the application force (Finger Pressure) for each previously set step (Step) a value (%) of uniformity of pressure distribution (Uniformity) and the load distribution after the steps are finished are displayed.
- acceptance (or failure) is determined based on whether the values of the average value for each step and the uniformity satisfy reference values, for example. However, this is not limited so.
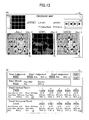
- FIG. 12 is a view illustrating an example of a display screen showing the load distribution and the result of each step.
- a screen 70 illustrated in (A) of FIG. 12 the load distribution after each step (“STEP 1 ” and “STEP 2 ”) and the load distribution after the whole steps are finished (“ALL”) are shown.
- the color distributions corresponding to the pressing force obtained by the detecting unit 44 are displayed, for example. With this, the result of the application operation expressed by color can be obtained easily and accurately.
- transitions of the pressing forces of “total”, “STEP 1 ” and “STEP 2 ” are displayed in detail.
- “PASS” is displayed when the determined result satisfies the previously arbitrarily set acceptance standard
- “FAIL” is displayed when the determined result does not satisfy the acceptance standard.
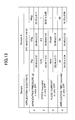
- FIG. 13 is a view illustrating a relationship between each of the application operations and an in vitro SPF predicted value.
- predicted values of the in vitro SPF to the applied surface are illustrated when varying the “application force (pressing force)”, the “speed (seconds)” of each one stroke, the “plate support” and the “application time (seconds)” when applying the “Sample A” using the application operation evaluating apparatus 10 .
- the predicted values for example, it is illustrated that the predicted value of the in vitro SPF is significantly varied when the “application force” is varied.
- the applied amount, the application time or the like may be regulated when evaluating an application method, the application force has not been considered as a variation factor.
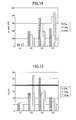
- FIG. 14 is a view illustrating a relationship between the application forces and in vitro SPF predicted values of each of the samples.
- samples S 1 to S 4 are used.
- the average value of the predicted values of the in vitro SPF to the applied surface is illustrated when the sample is applied by application forces of “25 g”, “100 g” and “200 g” using the application operation evaluating apparatus 10 .
- the predicted value is also varied in all of the samples. As such, it can be understood that the application force influence on the predicted value of the in vitro SPF for all of the samples.
- FIG. 15 is a view illustrating a relationship between the application force and a CV value (%) of the in vitro SPF predicted value of each of the samples.
- CV values obtained from the predicted values of the in vitro SPF of FIG. 14 are illustrated.
- an effective value for the CV value is about less than or equal to 20%. It can be recognized that when the application force is “25 g” or “200 g”, the effective value cannot be obtained for some samples.
- the predicted value of the in vitro SPF is a result obtained by applying the sample on an application substrate SPF MASTER PA-01 (SHISEIDO CO LTD) with an amount of 2.00 mg/cart, and measuring using an SPF MASTER (SHISEIDO CO LTD).
- the application operation evaluating apparatus 10 by evaluating after standardizing the application operation such that the application force is “100 g” using the application operation evaluating apparatus 10 , for example, it is possible to perform. an evaluation capable of actualizing the application with the uniform thickness by which the effective CV value can be obtained. Further, by varying the values that influence on the repeatability using the application operation evaluating apparatus 10 , the value capable of further improving the repeatability can be obtained.
- the repeatability regarding the application operation can be improved.
- the individual constituents of the application operation evaluating apparatus 10 illustrated in FIG. 2 illustrate blocks of functional units, not hardware units.
- the individual constituents of the application operation evaluating apparatus 10 illustrated in FIG. 2 may be embodied by arbitrary combinations of hardware and software, typified by a CPU of an arbitrary computer, a memory, a program loaded in the memory so as to embody the constituents illustrated in the drawings, a storage unit for storing the program such as a hard disk, and an interface for network connection. It may be understood by those skilled in the art that methods and devices for the embodiment allow various modifications.
Abstract
Description
- [Patent Document 1] Japanese Patent No. 4,454, 695
- [Patent Document 2] Japanese Laid-open Patent Publication No. 2008-096151
- [Patent Document 3] Japanese Patent No. 4,365,452
- [Patent Document 4] PCT International Patent Publication No. 2010/113961
- [non-Patent Document 1] ISO 24444, INTERNATIONAL STANDARD, Cosmetics-Sun protection test methods-In vivo determination of the sun protection factor (SPF) [non-Patent Document 2] Ferrero L. et al., Importance of Substrate Roughness fox In vitro Sun Protection Assessment, IFSCC Magazine, Vol. 9, No. 2, 2-13 (2006) [non-Patent Document 3] Stanfield J. W. et al., Optimizing in vitro measurement of Sunscreen Protection, SOFW-Journal, 7, 19-23 (2006)
d cal,n(x,y)=c cal,n(x,y)-a 0,n (4)
U cal(x,y)=f cal,4(x,y)/(f cal,1(x,y)+f cal,4(x,y))
B cal(x,y)=f cal,3(x,y)/(f cal,2(x,y)+f cal,3(x,y))
L cal(x,y)=f cal,2(x,y)/(f cal,1(x,y)+f cal,2(x,y))
R cal(x,y)=f cal,3(x,y)/(f cal,3(x,y)+f cal,4(x,y)) (9)
V cal(x,y)=(f cal,1(x,y)+f cal,4(x,y))/(f cal,1(x,y)+f cal,2(x,y)+f cal,3(x,y)+f cal,4(x,y))
H cal(x,y)=(f cal,1(x,y)+f cal,2(x,y))/(f cal,1(x,y)+f cal,2(x,y)+f cal,3(x,y)+f cal,4(x,y)) (10)
WX cal(x,y)=(U cal(x,y)×(1-V cal(x,y))30 B cal(x,y)×V cal(x,y))
WY cal(x,y)=(L cal(x,y)×(1-H cal(x,y))30 R cal(x,y)×H cal(x,y)) (11)
calXval=LCX
calYval=UCy
calXscale=100/(R CX −L CX)
calYscale=100/(B Cy −U Cy) (13)
U cal =f cal,4/(f cal,1 +f cal,4)
B cal =f cal,3/(f cal,2 +f cal,3)
V cal=(f cal,1 +f cal,4/(f cal,1 +f cal,2 +f cal,3 +f cal,4)
1-V cal=(f cal,2 +f cal,3)/(f cal,1 +f cal,2 +f cal,3 +f cal,4)
X=(n×Xa+m×Xb)/(m+n)
Y=(n×Ya+m×Yb)/(m+n)
WX(x,y)=(U cal×(1-V cal)+B cal ×V cal ,V cal)
L cal =f cal,2/(f cal,1 +f cal,2)
R cal =f cal,2/(f cal,3 +f cal,4)
H cal =(fcal,1 +f cal,2)/(f cal,1 +f cal,2 +f cal,3 +f cal,4)
H cal =(fcal,3 +f cal,4)/(f cal,1 +f cal,2 +f cal,3 +f cal,4)
Px=x1+(x4−x1)×f cal,1/(f cal,1 +f cal,4)
Qx=x1+(x4−x1)×f cal,2/(f cal,2 +f cal,3)
Xp=(WXcal-calXval)×calXscale
Yp=(WYcal-calYval)×calYscale (17)
calXposOffset=50-Xp
calYposOffset=50-Yp (18)
Xpos=Xp+calXposOffset
Ypos=Yp+calYposOffset (19)
Claims (20)
Applications Claiming Priority (5)
| Application Number | Priority Date | Filing Date | Title |
|---|---|---|---|
| JP2012-047058 | 2012-03-02 | ||
| JP2012047058 | 2012-03-02 | ||
| JP2013034865A JP5458196B2 (en) | 2012-03-02 | 2013-02-25 | Application operation evaluation apparatus, application operation evaluation method, and application operation evaluation program |
| JP2013-034865 | 2013-02-25 | ||
| PCT/JP2013/055444 WO2013129582A1 (en) | 2012-03-02 | 2013-02-28 | Application operation evaluating apparatus and application operation evaluating method |
Publications (2)
| Publication Number | Publication Date |
|---|---|
| US20150054758A1 US20150054758A1 (en) | 2015-02-26 |
| US9405394B2 true US9405394B2 (en) | 2016-08-02 |
Family
ID=49082773
Family Applications (1)
| Application Number | Title | Priority Date | Filing Date |
|---|---|---|---|
| US14/382,124 Active US9405394B2 (en) | 2012-03-02 | 2013-02-28 | Application operation evaluating apparatus and application operation evaluating method |
Country Status (8)
| Country | Link |
|---|---|
| US (1) | US9405394B2 (en) |
| EP (1) | EP2821767B1 (en) |
| JP (1) | JP5458196B2 (en) |
| KR (1) | KR101478692B1 (en) |
| CN (1) | CN104160257B (en) |
| HK (1) | HK1198715A1 (en) |
| TW (1) | TWI552726B (en) |
| WO (1) | WO2013129582A1 (en) |
Families Citing this family (2)
| Publication number | Priority date | Publication date | Assignee | Title |
|---|---|---|---|---|
| US10198125B2 (en) * | 2016-03-22 | 2019-02-05 | Synaptics Incorporated | Force sensor recalibration |
| CN106205633B (en) * | 2016-07-06 | 2019-10-18 | 李彦芝 | It is a kind of to imitate, perform practice scoring system |
Citations (31)
| Publication number | Priority date | Publication date | Assignee | Title |
|---|---|---|---|---|
| US3657475A (en) | 1969-03-19 | 1972-04-18 | Thomson Csf T Vt Sa | Position-indicating system |
| JPH0259633A (en) | 1988-08-25 | 1990-02-28 | Murata Mfg Co Ltd | Detector for pressure distribution |
| JPH04365452A (en) | 1991-06-12 | 1992-12-17 | Taisei Corp | Production of feed for livestock from distillation waste liquor of shochu |
| EP0595746A1 (en) | 1992-10-29 | 1994-05-04 | International Business Machines Corporation | Method and system for input device pressure indication in a data processing system |
| JPH09168529A (en) | 1995-12-19 | 1997-06-30 | Anima Kk | Floor reaction force measuring device |
| US5903229A (en) * | 1996-02-20 | 1999-05-11 | Sharp Kabushiki Kaisha | Jog dial emulation input device |
| US5959615A (en) * | 1996-09-25 | 1999-09-28 | Sharp Kabushiki Kaisha | Information processing device |
| US6215901B1 (en) * | 1997-03-07 | 2001-04-10 | Mark H. Schwartz | Pen based computer handwriting instruction |
| US20020149571A1 (en) | 2001-04-13 | 2002-10-17 | Roberts Jerry B. | Method and apparatus for force-based touch input |
| US20040141648A1 (en) * | 2003-01-21 | 2004-07-22 | Microsoft Corporation | Ink divider and associated application program interface |
| US20040148089A1 (en) * | 2002-09-30 | 2004-07-29 | Albrecht Schmidt | Context acquisition based on load sensing |
| JP2005127717A (en) | 2003-10-21 | 2005-05-19 | Shiseido Co Ltd | Tactual sense meter |
| JP2006233367A (en) | 2005-02-25 | 2006-09-07 | Kao Corp | Artificial leather |
| US20080048991A1 (en) * | 2003-10-10 | 2008-02-28 | Leapfrog Enterprises, Inc. | Display apparatus for teaching writing |
| JP2008064609A (en) | 2006-09-07 | 2008-03-21 | Nitta Ind Corp | Pressure measuring sheet, pressure distribution measuring device, and pressure distribution measuring method |
| JP2008096151A (en) | 2006-10-06 | 2008-04-24 | Shiseido Co Ltd | Ultraviolet detection apparatus and apparatus for evaluating ultraviolet protection effect |
| US20090256807A1 (en) | 2008-04-14 | 2009-10-15 | Nokia Corporation | User interface |
| JP4365452B2 (en) | 2007-10-18 | 2009-11-18 | 株式会社資生堂 | Ultraviolet ray protection effect evaluation method, evaluation apparatus, evaluation program, and recording medium on which the program is recorded |
| WO2010018889A1 (en) | 2008-08-11 | 2010-02-18 | Korea Research Institute Of Standards And Science | Structure of touch input for acquiring location and intensity of force, apparatus therewith and acquiring method thereof |
| US20100045623A1 (en) * | 2008-08-07 | 2010-02-25 | Panasonic Corporation | Information display device with touchscreen |
| JP4454695B2 (en) | 2008-06-13 | 2010-04-21 | 株式会社資生堂 | Evaluation method of skin substitute membrane and topical skin preparation |
| US20100134236A1 (en) * | 2007-07-26 | 2010-06-03 | Nitta Corporation | Sensor sheet |
| WO2010113961A1 (en) | 2009-03-30 | 2010-10-07 | 株式会社資生堂 | Method for applying external skin preparation, method for evaluating application by the method, device for evaluating the application and program for evaluating the application |
| US20110032211A1 (en) | 2008-03-27 | 2011-02-10 | Bbs Denmark A/S | secure keypad system |
| US20110117526A1 (en) * | 2009-11-16 | 2011-05-19 | Microsoft Corporation | Teaching gesture initiation with registration posture guides |
| US20110117535A1 (en) * | 2009-11-16 | 2011-05-19 | Microsoft Corporation | Teaching gestures with offset contact silhouettes |
| JP2012037626A (en) | 2010-08-04 | 2012-02-23 | Shiseido Co Ltd | Applying action training device |
| US20120212434A1 (en) * | 2011-02-18 | 2012-08-23 | Holger Bluemler | Technical medical device having a touchscreen and method |
| US20130120307A1 (en) * | 2011-11-11 | 2013-05-16 | Institute For Information Industry | Handheld Device and Control Method Thereof |
| US8777626B2 (en) * | 2012-05-03 | 2014-07-15 | Maxscholar, Llc | Interactive system and method for multi-sensory learning |
| US8884870B2 (en) * | 2008-12-19 | 2014-11-11 | Immersion Corporation | Interactive painting game and associated controller |
-
2013
- 2013-02-25 JP JP2013034865A patent/JP5458196B2/en active Active
- 2013-02-28 WO PCT/JP2013/055444 patent/WO2013129582A1/en active Application Filing
- 2013-02-28 EP EP13755798.9A patent/EP2821767B1/en not_active Not-in-force
- 2013-02-28 US US14/382,124 patent/US9405394B2/en active Active
- 2013-02-28 KR KR1020147026171A patent/KR101478692B1/en active IP Right Grant
- 2013-02-28 CN CN201380012239.4A patent/CN104160257B/en not_active Expired - Fee Related
- 2013-03-01 TW TW102107399A patent/TWI552726B/en not_active IP Right Cessation
-
2014
- 2014-12-02 HK HK14112156.9A patent/HK1198715A1/en unknown
Patent Citations (43)
| Publication number | Priority date | Publication date | Assignee | Title |
|---|---|---|---|---|
| US3657475A (en) | 1969-03-19 | 1972-04-18 | Thomson Csf T Vt Sa | Position-indicating system |
| JPH0259633A (en) | 1988-08-25 | 1990-02-28 | Murata Mfg Co Ltd | Detector for pressure distribution |
| US4953410A (en) | 1988-08-25 | 1990-09-04 | Murata Manufacturing Co., Ltd. | Pressure distribution detecting device |
| JPH04365452A (en) | 1991-06-12 | 1992-12-17 | Taisei Corp | Production of feed for livestock from distillation waste liquor of shochu |
| EP0595746A1 (en) | 1992-10-29 | 1994-05-04 | International Business Machines Corporation | Method and system for input device pressure indication in a data processing system |
| JPH09168529A (en) | 1995-12-19 | 1997-06-30 | Anima Kk | Floor reaction force measuring device |
| US5903229A (en) * | 1996-02-20 | 1999-05-11 | Sharp Kabushiki Kaisha | Jog dial emulation input device |
| US5959615A (en) * | 1996-09-25 | 1999-09-28 | Sharp Kabushiki Kaisha | Information processing device |
| US6215901B1 (en) * | 1997-03-07 | 2001-04-10 | Mark H. Schwartz | Pen based computer handwriting instruction |
| US20020149571A1 (en) | 2001-04-13 | 2002-10-17 | Roberts Jerry B. | Method and apparatus for force-based touch input |
| US20040148089A1 (en) * | 2002-09-30 | 2004-07-29 | Albrecht Schmidt | Context acquisition based on load sensing |
| US20040141648A1 (en) * | 2003-01-21 | 2004-07-22 | Microsoft Corporation | Ink divider and associated application program interface |
| US20080048991A1 (en) * | 2003-10-10 | 2008-02-28 | Leapfrog Enterprises, Inc. | Display apparatus for teaching writing |
| US8025504B2 (en) * | 2003-10-10 | 2011-09-27 | Leapfrog Enterprises, Inc. | Display apparatus for teaching writing |
| JP2005127717A (en) | 2003-10-21 | 2005-05-19 | Shiseido Co Ltd | Tactual sense meter |
| JP2006233367A (en) | 2005-02-25 | 2006-09-07 | Kao Corp | Artificial leather |
| JP2008064609A (en) | 2006-09-07 | 2008-03-21 | Nitta Ind Corp | Pressure measuring sheet, pressure distribution measuring device, and pressure distribution measuring method |
| JP2008096151A (en) | 2006-10-06 | 2008-04-24 | Shiseido Co Ltd | Ultraviolet detection apparatus and apparatus for evaluating ultraviolet protection effect |
| US20100012850A1 (en) * | 2006-10-06 | 2010-01-21 | Shiseido Company, Ltd. | Ultraviolet radiation detector and apparatus for evaluating ultraviolet radiation protection effect |
| US8049179B2 (en) | 2006-10-06 | 2011-11-01 | Shiseido Company, Ltd. | Ultraviolet radiation detector and apparatus for evaluating ultraviolet radiation protection effect |
| US7898381B2 (en) * | 2007-07-26 | 2011-03-01 | Nitta Corporation | Sensor sheet |
| US20100134236A1 (en) * | 2007-07-26 | 2010-06-03 | Nitta Corporation | Sensor sheet |
| US7937227B2 (en) | 2007-10-18 | 2011-05-03 | Shiseido Company, Ltd. | Method, apparatus, program, and recording medium for evaluating ultraviolet radiation protection effect |
| JP4365452B2 (en) | 2007-10-18 | 2009-11-18 | 株式会社資生堂 | Ultraviolet ray protection effect evaluation method, evaluation apparatus, evaluation program, and recording medium on which the program is recorded |
| US20100256924A1 (en) * | 2007-10-18 | 2010-10-07 | Shiseido Company Ltd. | Method, apparatus, program, and recording medium for evaluating ultraviolet radiation protection effect |
| US20110032211A1 (en) | 2008-03-27 | 2011-02-10 | Bbs Denmark A/S | secure keypad system |
| US20090256807A1 (en) | 2008-04-14 | 2009-10-15 | Nokia Corporation | User interface |
| US8337554B2 (en) | 2008-06-13 | 2012-12-25 | Shiseido Company, Ltd. | Skin substitute membrane, mold, and method of evaluating external preparation for skin |
| US20110098815A1 (en) * | 2008-06-13 | 2011-04-28 | Shiseido Company, Ltd. | Skin substitute membrane, mold, and method of evaluating external preparation for skin |
| JP4454695B2 (en) | 2008-06-13 | 2010-04-21 | 株式会社資生堂 | Evaluation method of skin substitute membrane and topical skin preparation |
| US20120109300A1 (en) * | 2008-06-13 | 2012-05-03 | Shiseido Company, Ltd. | Skin substitute membrane, mold, and method of evaluating external preparation for skin |
| US8264470B2 (en) * | 2008-08-07 | 2012-09-11 | Panasonic Corporation | Cleaning mode for information display device with touchscreen |
| US20100045623A1 (en) * | 2008-08-07 | 2010-02-25 | Panasonic Corporation | Information display device with touchscreen |
| WO2010018889A1 (en) | 2008-08-11 | 2010-02-18 | Korea Research Institute Of Standards And Science | Structure of touch input for acquiring location and intensity of force, apparatus therewith and acquiring method thereof |
| US8884870B2 (en) * | 2008-12-19 | 2014-11-11 | Immersion Corporation | Interactive painting game and associated controller |
| US20120022472A1 (en) | 2009-03-30 | 2012-01-26 | Shiseido Company Ltd | Application method of external dermatological medications, evaluating method of the same, application evaluating apparatus, and application evaluating program |
| WO2010113961A1 (en) | 2009-03-30 | 2010-10-07 | 株式会社資生堂 | Method for applying external skin preparation, method for evaluating application by the method, device for evaluating the application and program for evaluating the application |
| US20110117535A1 (en) * | 2009-11-16 | 2011-05-19 | Microsoft Corporation | Teaching gestures with offset contact silhouettes |
| US20110117526A1 (en) * | 2009-11-16 | 2011-05-19 | Microsoft Corporation | Teaching gesture initiation with registration posture guides |
| JP2012037626A (en) | 2010-08-04 | 2012-02-23 | Shiseido Co Ltd | Applying action training device |
| US20120212434A1 (en) * | 2011-02-18 | 2012-08-23 | Holger Bluemler | Technical medical device having a touchscreen and method |
| US20130120307A1 (en) * | 2011-11-11 | 2013-05-16 | Institute For Information Industry | Handheld Device and Control Method Thereof |
| US8777626B2 (en) * | 2012-05-03 | 2014-07-15 | Maxscholar, Llc | Interactive system and method for multi-sensory learning |
Non-Patent Citations (7)
| Title |
|---|
| "Cosmetics-Sun protection test methods-In vivo determination of the sun protection factor (SPF)", International Standard, Nov. 15, 2010, ISO 24444. |
| Extended European Search Report dated Feb. 19, 2015. |
| Extended European Search Report dated May 4, 2015 (Replaces previous search report dated Feb. 19, 2015). |
| Ferrero L. et al., Importance of Substrate Roughness for In Vitro Sun Protection Assessment, IFSCC Magazine, vol. 9, No. 2, 2-13 (2006). |
| International Search Report mailed on Apr. 16, 2013. |
| Stanfield J. W. et al., Optimizing in vitro Measurement of Sunscreen Protection, SOFW-Journal, 7, 19-23 (2006). |
| Toyada S, JP 2012-037626 A, machine translation. * |
Also Published As
| Publication number | Publication date |
|---|---|
| TW201345488A (en) | 2013-11-16 |
| US20150054758A1 (en) | 2015-02-26 |
| EP2821767A4 (en) | 2015-03-25 |
| EP2821767B1 (en) | 2017-10-25 |
| CN104160257B (en) | 2015-07-15 |
| HK1198715A1 (en) | 2015-05-29 |
| JP2013210366A (en) | 2013-10-10 |
| WO2013129582A1 (en) | 2013-09-06 |
| EP2821767A1 (en) | 2015-01-07 |
| JP5458196B2 (en) | 2014-04-02 |
| KR101478692B1 (en) | 2015-01-02 |
| CN104160257A (en) | 2014-11-19 |
| KR20140124428A (en) | 2014-10-24 |
| TWI552726B (en) | 2016-10-11 |
Similar Documents
| Publication | Publication Date | Title |
|---|---|---|
| Ahmadi et al. | Vertical ground reaction forces on rigid and vibrating surfaces for vibration serviceability assessment of structures | |
| EP2416144A1 (en) | Application method of external dermatological medications, evaluating method of the same, application evaluating apparatus, and application evaluating program | |
| US20160292380A1 (en) | Device and method for predicting skin age by using quantifying means | |
| JP6114562B2 (en) | Motion detection sensor and motion detection device | |
| JP7335392B2 (en) | METHOD FOR EVALUATING TOUCH OF COSMETICS IN USE AND APPARATUS FOR EVALUATING TOUCH IN USE OF COSMETICS | |
| EP3460433A1 (en) | Device for measuring hair properties | |
| US9405394B2 (en) | Application operation evaluating apparatus and application operation evaluating method | |
| JP2023052208A (en) | Information processing device, client device, and program | |
| JP2015114169A (en) | Fingertip contact state-measuring device | |
| US10884563B2 (en) | Method for determining change of initial distance of sensing electrode | |
| US10964062B2 (en) | Skin evaluation device, skin evaluation method, and skin evaluation program | |
| US20210048285A1 (en) | Portable surface characteristics measurement device and control method thereof | |
| JP2018196427A (en) | Skin condition evaluation method and skin condition evaluation device | |
| Scalise et al. | Pressure sensor matrix for indirect measurement of grip and push forces exerted on a handle | |
| JP2005127717A (en) | Tactual sense meter | |
| JP2019200065A (en) | Method and device for evaluation of adhesive properties | |
| JP6967984B2 (en) | Skin evaluation method | |
| KR20180027936A (en) | System and method for measuring coverage of comsmetic material | |
| US20190346573A1 (en) | Radiation imaging apparatus, radiation imaging method, and storage medium | |
| JP4327347B2 (en) | Mascara usability evaluation method and mascara usability evaluation apparatus | |
| Lim et al. | A Study on the Usability Testing of Gesture Tracking-Based Natural User Interface | |
| KR102075350B1 (en) | Foot pressure meter and measuring method | |
| JP4611233B2 (en) | Walking training support device | |
| JP2021139633A (en) | Touch characteristic evaluation method and touch characteristic evaluation device | |
| KR20180031921A (en) | System and method for quantitative evaluation using image processing techniques |
Legal Events
| Date | Code | Title | Description |
|---|---|---|---|
| AS | Assignment |
Owner name: SHISEIDO COMPANY, LTD., JAPAN Free format text: ASSIGNMENT OF ASSIGNORS INTEREST;ASSIGNORS:MIURA, YOSHIMASA;SUZUKI, SAYAKA;TOYODA, NARUHITO;SIGNING DATES FROM 20140809 TO 20140820;REEL/FRAME:033666/0461 |
|
| STCF | Information on status: patent grant |
Free format text: PATENTED CASE |
|
| MAFP | Maintenance fee payment |
Free format text: PAYMENT OF MAINTENANCE FEE, 4TH YEAR, LARGE ENTITY (ORIGINAL EVENT CODE: M1551); ENTITY STATUS OF PATENT OWNER: LARGE ENTITY Year of fee payment: 4 |
|
| FEPP | Fee payment procedure |
Free format text: MAINTENANCE FEE REMINDER MAILED (ORIGINAL EVENT CODE: REM.); ENTITY STATUS OF PATENT OWNER: LARGE ENTITY |