US9491024B2 - Methods for frequency offset estimation with Zadoff-Chu sequences - Google Patents
Methods for frequency offset estimation with Zadoff-Chu sequences Download PDFInfo
- Publication number
- US9491024B2 US9491024B2 US14/614,157 US201514614157A US9491024B2 US 9491024 B2 US9491024 B2 US 9491024B2 US 201514614157 A US201514614157 A US 201514614157A US 9491024 B2 US9491024 B2 US 9491024B2
- Authority
- US
- United States
- Prior art keywords
- cfo
- correlation peak
- correlation
- main
- region
- Prior art date
- Legal status (The legal status is an assumption and is not a legal conclusion. Google has not performed a legal analysis and makes no representation as to the accuracy of the status listed.)
- Active
Links
- 238000000034 method Methods 0.000 title claims abstract description 44
- 230000006870 function Effects 0.000 claims description 6
- 230000004044 response Effects 0.000 claims description 6
- 230000015654 memory Effects 0.000 claims description 4
- 238000001514 detection method Methods 0.000 abstract description 24
- 238000010586 diagram Methods 0.000 description 27
- 238000004891 communication Methods 0.000 description 21
- 230000010363 phase shift Effects 0.000 description 8
- 230000008901 benefit Effects 0.000 description 7
- 125000004122 cyclic group Chemical group 0.000 description 6
- 238000004088 simulation Methods 0.000 description 6
- 230000000875 corresponding effect Effects 0.000 description 4
- 230000001413 cellular effect Effects 0.000 description 3
- 230000001747 exhibiting effect Effects 0.000 description 3
- 230000007774 longterm Effects 0.000 description 3
- 238000004519 manufacturing process Methods 0.000 description 3
- 238000013507 mapping Methods 0.000 description 3
- 239000000203 mixture Substances 0.000 description 3
- 230000008569 process Effects 0.000 description 3
- 238000004364 calculation method Methods 0.000 description 2
- 230000002085 persistent effect Effects 0.000 description 2
- 230000006978 adaptation Effects 0.000 description 1
- 230000004075 alteration Effects 0.000 description 1
- 230000005540 biological transmission Effects 0.000 description 1
- 230000010267 cellular communication Effects 0.000 description 1
- 238000010276 construction Methods 0.000 description 1
- 230000002596 correlated effect Effects 0.000 description 1
- 230000008520 organization Effects 0.000 description 1
- 239000007787 solid Substances 0.000 description 1
- 238000006467 substitution reaction Methods 0.000 description 1
Images

Classifications
-
- H—ELECTRICITY
- H04—ELECTRIC COMMUNICATION TECHNIQUE
- H04L—TRANSMISSION OF DIGITAL INFORMATION, e.g. TELEGRAPHIC COMMUNICATION
- H04L27/00—Modulated-carrier systems
- H04L27/26—Systems using multi-frequency codes
- H04L27/2601—Multicarrier modulation systems
- H04L27/2647—Arrangements specific to the receiver only
- H04L27/2655—Synchronisation arrangements
- H04L27/2662—Symbol synchronisation
- H04L27/2663—Coarse synchronisation, e.g. by correlation
-
- H—ELECTRICITY
- H04—ELECTRIC COMMUNICATION TECHNIQUE
- H04L—TRANSMISSION OF DIGITAL INFORMATION, e.g. TELEGRAPHIC COMMUNICATION
- H04L27/00—Modulated-carrier systems
- H04L27/26—Systems using multi-frequency codes
- H04L27/2601—Multicarrier modulation systems
- H04L27/2647—Arrangements specific to the receiver only
- H04L27/2655—Synchronisation arrangements
- H04L27/2657—Carrier synchronisation
- H04L27/2659—Coarse or integer frequency offset determination and synchronisation
-
- H—ELECTRICITY
- H04—ELECTRIC COMMUNICATION TECHNIQUE
- H04L—TRANSMISSION OF DIGITAL INFORMATION, e.g. TELEGRAPHIC COMMUNICATION
- H04L27/00—Modulated-carrier systems
- H04L27/26—Systems using multi-frequency codes
- H04L27/2601—Multicarrier modulation systems
- H04L27/2647—Arrangements specific to the receiver only
- H04L27/2655—Synchronisation arrangements
- H04L27/2668—Details of algorithms
- H04L27/2673—Details of algorithms characterised by synchronisation parameters
- H04L27/2675—Pilot or known symbols
-
- H—ELECTRICITY
- H04—ELECTRIC COMMUNICATION TECHNIQUE
- H04L—TRANSMISSION OF DIGITAL INFORMATION, e.g. TELEGRAPHIC COMMUNICATION
- H04L27/00—Modulated-carrier systems
- H04L27/26—Systems using multi-frequency codes
- H04L27/2601—Multicarrier modulation systems
- H04L27/2647—Arrangements specific to the receiver only
- H04L27/2655—Synchronisation arrangements
- H04L27/2668—Details of algorithms
- H04L27/2681—Details of algorithms characterised by constraints
- H04L27/2685—Speed of convergence
Definitions
- the present disclosure is generally related to determining a carrier frequency offset in a wireless communication system. More particularly, the present disclosure is related to determining a carrier frequency offset in a wireless communication system based on a phase of correlation peaks associated with a received wireless signal.
- a carrier frequency offset may occur between a receiver (e.g., a base station) and a transmitter (e.g., a wireless device), which may degrade the performance of such wireless communication systems (e.g., long term evolution (LTE) systems and/or LTE-advanced systems).
- CFO may occur due to frequency deviation of oscillators of the transmitter and receiver, respectively, and may also occur due to Doppler shift caused by movement of the receiver, the transmitter, or both.
- CFO may cause the performance of the wireless communication system to degrade, thereby reducing the quality of service that may be provided to the receiver.
- CFO may cause loss of synchronization between the transmitter and the receiver, which may cause loss of service (e.g., a dropped call, etc.). Additionally, CFO may increase the power consumption of the transmitter and/or the receiver (e.g., due to more frequent attempts to gain synchronization between the receiver and the transmitter).
- Systems, methods, apparatuses, and computer-readable storage media for determining a carrier frequency offset (CFO) associated with a received signal are disclosed.
- the systems, methods, apparatuses, and computer-readable storage media for determining the CFO may utilize a characteristic associated with power of a correlation output and a characteristic associated with a phase of the correlation output to determine the CFO offset.
- the correlation output may be obtained from a Zadoff-Chu sequence. Using both the characteristic associated with the power of the correlation output and the characteristic associated with the phase of the correlation output may increase an accuracy of the CFO estimate.
- CFO estimates determined according to embodiments may be suitable for a High Speed Train (HST) scenario (e.g., embodiments may determine the CFO with improved accuracy when a device transmitting the signal is travelling at speeds up to 350 km per hour). Further, CFO estimates of embodiments may be suitable for other scenarios, such as when the signal is transmitted by a device travelling aboard an aircraft, a watercraft, or another land-based vehicle travelling at high speed.
- HST High Speed Train
- the signal when a signal is received from a device operating in an HST scenario, the signal may be correlated with at least one known sequence (e.g., a Zadoff-Chu root sequence having a zero-autocorrelation property), which may cause a device receiving the signal to observe a plurality of peaks as a result of the correlation, where the peaks may include a left peak, a main peak, and a right peak, and where the correlation generates complex values representative of an amplitude or magnitude of each of the plurality of peaks.
- a preamble index may be determined based on the received signal.
- squared power ratios associated with the plurality of peaks may be determined based on the magnitude of the plurality of peaks, and the squared power ratios may be compared to pre-determined squared power ratios associated with CFO candidates to determine a coarse CFO estimate.
- comparing the squared power ratios associated with the plurality of peaks of the received to the pre-determined squared power ratios associated with CFO candidates may be performed using a lookup table, where the pre-determined squared power ratios associated with CFO candidates are stored in the lookup table.
- a phase of at least one peak of the plurality of peaks may be determined and may be used to determine a final CFO estimate, where the final CFO estimate may be used to configure subsequent communications between the device transmitting the signal and the device receiving the signal.
- determining the final CFO estimate may include comparing the phase of the at least one peak of the received signal to a phase of a peak associated with a known CFO, where the final CFO estimate may be determined based at least in part on the comparison of the phase of the at least one peak associated with the received signal to the phase of the peak associated with the known CFO.
- a sign of the final CFO estimate may be determined based on the comparison phase of the at least one peak associated with the received signal to the phase of the peak associated with the known CFO.
- the phase comparison may be used to resolve an ambiguity in the coarse CFO estimate that may arise in some HST scenarios.
- FIG. 1 is a block diagram of a system for determining a carrier frequency offset (CFO) associated with a received signal using a high speed detection mode;
- CFO carrier frequency offset
- FIG. 2 is a ladder diagram illustrating an embodiment of a method of establishing and maintaining a connection between a wireless device and a transmitter in a high speed train (HST) operating environment;
- HST high speed train
- FIG. 3 depicts diagrams illustrating correlation outputs representative of signals associated with different carrier frequency offsets (CFOs) according to embodiments;
- FIG. 4 is a diagram illustrating a mapping of observed correlation peak power to a carrier frequency offset (CFO);
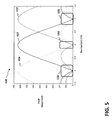
- FIG. 5 is a diagram illustrating ambiguity zones associated with estimating carrier frequency offset (CFO) using relative power of observed correlation peaks;
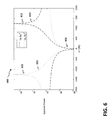
- FIG. 6 is a diagram illustrating squared power ratios of correlation peaks associated with a received signal
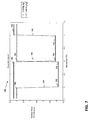
- FIG. 7 is a plot illustrating pre-determined theoretical values associated with a known preamble index according to embodiments.
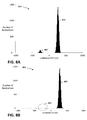
- FIGS. 8A and 8B are graphs comparing the accuracy of carrier frequency offset (CFO) estimates determined based on peak correlation power only and for CFO estimates determined according to embodiments;
- FIGS. 9A and 9B are charts plotting the absolute mean error (in Hz) and the standard deviation of the error (in Hz), respectively, for carrier frequency offset (CFO) estimates determined based on peak correlation power only and for CFO estimates determined according to embodiments;
- FIGS. 10A and 10B are graphs comparing the accuracy of carrier frequency offset (CFO) estimates determined based on peak correlation power only and for CFO estimates determined according to embodiments;
- CFO carrier frequency offset
- FIGS. 11A and 11B are charts plotting the absolute mean error (in Hz) and the standard deviation of the error (in Hz), respectively, for carrier frequency offset (CFO) estimates determined based on peak correlation power only and for CFO estimates determined according to embodiments;
- FIGS. 12A and 12B are graphs comparing the accuracy of carrier frequency offset (CFO) estimates determined based on peak correlation power only and for CFO estimates determined according to embodiments;
- CFO carrier frequency offset
- FIGS. 13A and 13B are charts plotting the absolute mean error (in Hz) and the standard deviation of the error (in Hz), respectively, for carrier frequency offset (CFO) estimates determined based on peak correlation power only and for CFO estimates determined according to embodiments; and
- FIG. 14 is a flowchart of an illustrative embodiment of a method for determining a carrier frequency offset (CFO) using phase information associated with a received signal.
- CFO carrier frequency offset
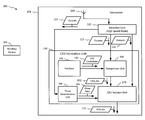
- a block diagram of a system for determining a carrier frequency offset (CFO) associated with a received signal using a high speed detection mode is shown as a system 100 .
- the system 100 may include a wireless device 102 and a transceiver 104 .
- the transceiver 104 may be adapted to transmit a wireless signal to the wireless device 102 , and to receive data from the wireless device 102 .
- the transceiver 104 may be a base station (e.g., an evolved nodeB (eNB), a femto cell, a macro cell, a pico cell, etc.) operating in wireless communication network (e.g., a cellular communication network, a cellular data network, a wireless local area network (WLAN), etc.) according to one or more standards/protocols (e.g., a 3 rd Generation (3G) standard, 4 th Generation (4G)/long term evolution (LTE) standard, an LTE advanced standard, an 802.11 wireless communication protocol, etc.), and may adapted to establish a wireless connection to the wireless device 102 .
- a base station e.g., an evolved nodeB (eNB), a femto cell, a macro cell, a pico cell, etc.
- wireless communication network e.g., a cellular communication network, a cellular data network, a wireless local area network (WLAN), etc.
- the wireless connection may enable the wireless device 102 to send and receive data to/from one or more remote devices (not shown in FIG. 1 ).
- the wireless device 102 may be a smartphone, a cellular phone, a personal digital assistant (PDA), a laptop computing device, a tablet computing device, a personal computing device, or another device adapted to operate according to embodiments.
- PDA personal digital assistant
- the wireless device 102 and/or the transceiver 104 may include one or more processors (e.g., digital signal processors (DSPs), central processing units (CPUs), a single CPU including two or more processing cores, etc.) and a memory (e.g., random access memory (RAM), read only memory (ROM), hard disk drives(s) (HDDs), solid state drive(s) (SSDs), or other types of memory devices for storing data in a persistent or non-persistent state).
- DSPs digital signal processors
- CPUs central processing units
- ROM read only memory
- HDDs hard disk drives(s)
- SSDs solid state drive
- the memories of the wireless device 102 and the transceiver 104 may store instructions that, when executed by the respective one or more processors, cause the respective one or more processors to perform operations described in connection with the wireless device 102 and the transceiver 104 , respectively, with reference to FIGS. 1-14 .
- the wireless device 102 may transmit a signal to the transceiver 104 .
- the signal may be associated with a CFO.
- the signal may be associated with a CFO caused Doppler shift induced by the velocity of the wireless device 102 relative to the transceiver 104 (which may be stationary).
- the signal may be associated with a CFO caused by frequency deviation between oscillators in the wireless device 102 and the transceiver 104 .
- the CFO may cause inter-carrier-interference (ICI) in the frequency domain, which may degrade performance of the system 100 .
- ICI inter-carrier-interference
- the signal may be distorted by a varying phase shift induced by the CFO.
- some standards impose requirements that attempt to constrain the CFO.
- wireless device CFO adaptation has +/ ⁇ 0.1 ppm accuracy requirement (e.g., +/ ⁇ 240 Hz CFO for a 2.4 GHz carrier frequency). While such requirements are suitable for many use cases, there are some use cases for which such requirements are not suitable.
- HSTs high speed trains
- a signal transmitted by a wireless device (e.g., the wireless device 102 ) aboard the HST may realize a CFO of +/ ⁇ 1340 Hz due to the rate of travel of the HST.
- wireless devices aboard the HST may experience degraded service and system performance with respect to a wireless communication network (e.g., a wireless communication network including the transceiver 104 ) due to inaccuracies associated with CFO estimates.
- the wireless device 102 may transmit an attachment signal 202 to the transceiver 104 .
- the attachment signal 202 may be transmitted using a physical random access channel (PRACH).
- PRACH physical random access channel
- the attachment signal 202 may be associated with a carrier frequency offset (CFO) up to +/ ⁇ 1340 Hz.
- CFO carrier frequency offset
- the transceiver 104 may determine a first CFO estimate using the attachment signal 202 received via the PRACH.
- a CFO estimation range associated with PRACH may be +/ ⁇ 1500 Hz. Because the CFO estimation range of signals transmitted using the PRACH is greater than the maximum CFO associated with the attachment signal (e.g., +/ ⁇ 1500 Hz>+/ ⁇ 1340 Hz), the CFO may be estimated by the transceiver 104 according to embodiments.
- the transceiver 104 may transmit a random access response message 204 to the wireless device 102 .
- the wireless device 102 may transmit subsequent uplink signals 206 to the transceiver 104 .
- the subsequent uplink signals 206 may transmitted using a physical uplink shared channel (PUSCH).
- the CFO estimation range for signals transmitted using the PUSCH may be +/ ⁇ 1000 Hz (e.g., due to the structure of the reference signals transmitted on the PUSCH), which may introduce errors into the CFO estimated based on signals received via the PUSCH (e.g., based on the subsequent uplink signals 206 ).
- the CFO estimation range of the PUSCH is less than the CFO associated with the attachment signal (e.g., +/ ⁇ 1000 Hz ⁇ +/ ⁇ 1340 Hz)
- a CFO estimated by the transceiver 104 based on the subsequent uplink signals 206 may be inaccurate, and, over time, such inaccuracies may degrade the performance of the system 100 .
- Such inaccuracies may be corrected using the CFO estimated using the attachment signal 202 received via the PRACH.
- ambiguity may also occur within the attachment signal 202 received via the PRACH under some conditions (e.g., a low signal-to-noise ratio (SNR) associated with the attachment signal 202 , and/or when a normalized CFO associated with the attachment signal 202 is small), as described in more detail below.
- SNR signal-to-noise ratio
- inaccuracies associated with estimating the CFO based on the subsequent uplink signals 206 may be correcting using an estimate of the CFO based on the attachment signal 202 received via the PRACH
- ambiguities in the CFO estimate determined using PRACH may result in an incorrect CFO estimate, which may reduce the effectiveness of using the CFO estimate associated with the PRACH to correct the CFO estimates determined using the signals received via the PUSCH.
- one or more embodiments of the present disclosure provide a method for resolving the ambiguity of CFO estimations using PRACH, as described in more detail below.
- the transceiver 104 may include one or more antennas 110 , a detection unit 120 , and a CFO estimation unit 130 .
- the CFO estimation unit 130 may be configured to determine a CFO estimate associated with a signal received from the wireless device 102 .
- the CFO estimation unit 130 may be configured to determine the CFO based on a signal received using a physical random access channel (PRACH) in accordance with embodiments.
- PRACH physical random access channel
- the CFO estimation unit 130 may include a database 140 , a power comparison unit 150 , a phase determination unit 160 , and a CFO decision unit 170 .
- the database 140 may store information associated with a plurality of CFO candidates, as described in more detail below.
- the transceiver 104 may receive a signal at the one or more antennas 110 , and may provide the received signal to the detection unit 120 .
- the signal may be received from the wireless device 102 at the one or more antennas 110 via the PRACH while the wireless device 102 is operating in an HST scenario. That is to say that the signal may be received at the transceiver 104 while the wireless device 102 is aboard an HST travelling at a speed of up to 350 km/h.
- the detection unit 120 may include a filter and a correlator (not shown in FIG. 1 ).
- the filter may filter the received signal to produce a filtered signal, and may provide the filtered signal to the correlator, which may correlate the received signal with one or more known local sequences to generate one or more correlation outputs.
- each of the one or more correlation outputs may have a constant amplitude.
- the known local sequence may be a root Zadoff-Chu (ZC) sequence (e.g., a ZC sequence that has not been cyclically shifted), and the correlation outputs may be associated with a correlation of the known local sequence and the received signal, which may cause one or more delta functions to be observed in the correlator.
- ZC Zadoff-Chu
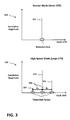
- a single correlation output (e.g., a single peak of constant amplitude) may be observed in the correlator when CFO is small, and three correlation outputs (e.g., three peaks of constant amplitude) may be observed when CFO is large, such as in an HST scenario.
- a first diagram 310 illustrates that, for a signal associated with a small CFO, a main peak (P 0 ) 312 (e.g., a single correlation output) of constant magnitude may be observed by the correlator in response to correlating the signal with a known local sequence. Additionally, as shown in the first diagram 310 , the main peak 312 may be observed at a first detection zone.
- a main peak (P 0 ) 312 e.g., a single correlation output
- a second diagram 320 illustrates that, for signals associated with a large CFO (e.g., a CFO associated with a signal transmitted in an HST scenario), the main peak (P 0 ) 312 may be observed by the correlator at the first detection zone, a right peak (P 1 ) of constant magnitude may be observed by the correlator at a second detection zone, and a left peak (P ⁇ 1 ) of constant magnitude may be observed by the correlator at a third detection zone, where the second and third detection zones are spaced apart from the first detection zone by a distance (du).
- the second and third detection zones may be associated with potential ambiguities in the CFO associated with the received signal.
- the power e.g., the magnitude
- P 0 , P 1 , and P ⁇ 1 may vary based on the CFO, and therefore, may be mapped to the CFO estimate.
- determining the CFO estimate based only on mapping the power of P 0 , P 1 , and P ⁇ 1 may result in an incorrect CFO estimate, as described in more detail below.
- the detection unit 120 may determine one or more peaks associated with the signal by correlating the signal with the local root sequence (e.g., a Zadoff-Chu sequence or another sequence having a zero autocorrelation property).
- the local root sequence e.g., a Zadoff-Chu sequence or another sequence having a zero autocorrelation property.
- the received Zadoff-Chu sequence with cyclic shift 0 and frequency offset ⁇ f may be given by:
- u may be the root index of the Zadoff-Chu sequence
- ⁇ f may be the frequency offset
- N may be the length of the Zadoff-Chu sequence
- du may be a cyclic shift
- ⁇ u may be regarded as a constant phase shift.
- the detection unit 120 may also determine one or more peaks based on the correlation.
- the one or more peaks observed by the correlator may include a plurality of peaks, where the plurality of peaks include a main peak (P 0 ), a right peak (P 1 ), and a left peak (P ⁇ 1 ).
- the main peak (P 0 ) may be given by:
- u may be the root index of the Zadoff-Chu sequence
- ⁇ f may be the frequency offset
- N may be the length of the Zadoff-Chu sequence
- * denotes a complex conjugate
- the right peak (P 1 ) may be given by:
- u may be the root index of the Zadoff-Chu sequence
- ⁇ f may be the frequency offset
- N may be the length of the Zadoff-Chu sequence
- du may be a cyclic shift
- ⁇ u may be regarded as a constant phase shift.
- the ratio of the complex value between the right peak (P 1 ) and the main peak (P 0 ) may be given by:
- u may be the root index of the Zadoff-Chu sequence
- ⁇ f may be the frequency offset
- N may be the length of the Zadoff-Chu sequence
- du may be a cyclic shift.
- the ratio of the complex value between the left peak (P ⁇ 1 ) and the main peak (P 0 ) may be given by:
- P - 1 P 0 1 - e j ⁇ 2 ⁇ ⁇ ⁇ ⁇ ⁇ f N 1 - e j ⁇ 2 ⁇ ⁇ ⁇ ( ⁇ ⁇ ⁇ f + 1 ) N ⁇ e j ⁇ ⁇ N ⁇ ( 1 + du ) + j ⁇ ⁇ ⁇ ⁇ ( 1 + du ) .. Equation ⁇ ⁇ 5
- u may be the root index of the Zadoff-Chu sequence
- ⁇ f may be the frequency offset
- N may be the length of the Zadoff-Chu sequence
- du may be a cyclic shift.
- the detection unit 120 may generate an output 122 that may be passed to the power comparison unit 150 , the phase determination unit 160 , and the CFO decision unit 170 .
- the output 122 may include a peak data associated with each of the peaks observed in the correlator.
- the peak data may include a complex value representative of both the power (or magnitude) and phase of each of the observed peaks (e.g., a complex value for each of P 0 , P 1 , and P ⁇ 1 ). Therefore, the detection unit 120 may determine a phase of each of the peaks, and the output 122 may include the phases of each of the peaks.
- the detection unit 120 may determine a preamble index associated with the signal.
- the detection unit 120 may determine the preamble index by combining the observed power of three cyclic shift windows (e.g., three detection zones) for each preamble index associated with the local Zadoff-Chu sequences to obtain a timing offset.
- the determined preamble index may be a particular preamble index having a same timing offset as the observed peaks.
- each detection window may correspond to one of the observed peaks, as described in more detail with reference to FIG. 3 .
- the outputs 122 may be provided to the power comparison unit 150 , the phase determination unit 160 , and the CFO decision unit 170 .
- the database 140 may store information associated with a plurality of CFO candidates.
- the information associated with the plurality of CFO candidates may include, for each CFO candidate, theoretical peaks corresponding to a particular CFO estimate.
- a particular entry of the database 140 may be associated with a particular CFO candidate, and may include information associated with a ratio of the squared power between each of the two side peaks (e.g., a left peak and a right peak) and a main peak associated with the particular CFO candidate, where the ratio of the squared power between the right peak and the main peak associated with the particular CFO candidate is denoted (r 1 ), and where the ratio of the squared power between the left peak and the main peak associated with the particular CFO candidate is denoted (r ⁇ 1 ).
- r 1 and r ⁇ 1 may be given by:
- the peak data included in the output 122 may include a ratio of the squared power between each of the two side peaks (P 1 and P ⁇ 1 ) and the main peak (P 0 ) associated with the received signal, where the ratio of the squared power between the right peak (P 1 ) and the main peak (P 0 ) of the correlation output may be
- the database 140 may provide CFO candidate data 142 (e.g., one or more CFO candidates) to the power comparison unit 150 , and the power comparison unit 150 may compare the squared power ratios of the peaks associated with the received signal to the squared power ratios (e.g., r 1 and r ⁇ 1 ) for each of the CFO candidates included in the CFO candidate data 142 to determine a coarse CFO estimate (
- the power comparison unit 150 may perform the comparison using a lookup table (e.g., the database 140 may be implemented as a lookup table).
- the power comparison unit 150 perform the comparison using an objective function g(f i ), where g(f i ) may be given by:
- P 1 corresponds to a correlation output associated with the right peak
- P 0 corresponds to a correlation output associated with the main peak
- P ⁇ 1 corresponds to a correlation output associated with the left peak
- ⁇ P 1 P 0 ⁇ 2 is the ratio of the squared power between the right peak (P 1 ) and the main peak (P 0 ) of the correlation output
- ⁇ P - 1 P 0 ⁇ 2 is the ratio of the squared power between the left peak (P ⁇ 1 ) and the main peak (P 0 ) of the correlation output
- f i corresponds to a known CFO associated with a particular CFO candidate of the plurality of CFO candidates
- r 1 (f i ) corresponds to a pre-determined value representative of the squared power ratio between a right peak of the particular CFO candidate and a main peak of the particular CFO candidate
- r ⁇ 1 (f i ) corresponds to a pre-determined value representative of the squared power ratio between a left peak of the particular CFO candidate and the main peak of the particular CFO candidate.
- r 1 (f i ) and r ⁇ 1 (f i ) may be given by:
- r 1 and r ⁇ 1 are representative of a squared power ratio between a right peak of a CFO candidate having a CFO (f i ) and a main peak of the CFO candidate, and a squared power ratio between the left peak of the CFO candidate and a main peak of the CFO candidate, respectively.
- arg min f i g(f i ) may identify a candidate CFO estimate ( ⁇ f coarse ) having a closest distance to the squared power ratios of the peaks of the correlation output associated with the received signal.
- ( ⁇ f coarse ) may be set equal to a CFO candidate having squared power ratios that most closely match the squared power ratios of the correlation peaks associated with the received signal. Therefore, ⁇ f coarse may closely approximate a CFO of the received signal as indicated by the power of the correlation peaks.
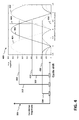
- the power comparison unit 150 may provide the coarse CFO estimate, shown in FIG. 1 as an output 152 , to the CFO decision unit 170 . Comparing the squared power ratios of the correlation peaks associated with the received signal and the squared power ratios associated with the CFO candidates to determine the coarse CFO estimate may provide a good initial estimate of the CFO of the received signal. For example, and referring to FIG. 4 , a diagram illustrating a mapping of observed correlation peak power to a carrier frequency offset (CFO) is shown as a diagram 400 . In FIG. 4 , a diagram 400 and the second diagram 320 of FIG. 3 are shown.
- CFO carrier frequency offset
- the y-axis corresponds to a magnitude of the correlator outputs (e.g., an amplitude of P 0 , P 1 , P ⁇ 1 ), and the x-axis corresponds to a normalized CFO in units of sub-carrier.
- a first plot 412 , a second plot 422 , and a third plot 424 are shown.
- the first plot 412 may be representative of a relationship between the normalized CFO and the magnitude of the main peak (P 0 ) 312
- the second plot 422 may be representative of a relationship between the normalized CFO and the magnitude of the right peak (P 1 ) 322
- the third plot 424 may be representative of a relationship between the normalized CFO and the magnitude of the left peak (P ⁇ 1 ) 322 .
- a CFO estimate 450 may be mapped to the magnitude (e.g., the power) of the correlation peaks (P 0 , P 1 , P ⁇ 1 ) by determining a CFO having a coordinate in the x-axis of the diagram 400 that intersects each of the plots 412 , 422 , 424 at a position (e.g., a position on the y-axis) corresponding to the magnitude of the respective peaks, as indicated by the line 440 .
- the lines 410 , 420 , 430 illustrate the respective magnitudes of the peaks 312 , 322 , 324 .
- the line 440 intersects each of the plots 412 , 422 , 424 at the respective magnitudes of the peaks 312 , 322 , 324 .
- the respective magnitudes of the peaks 312 , 322 , 324 should correspond to the intersection of the line 440 with the lines 410 , 420 , 430 , respectively.
- the coarse CFO estimate determined based on the comparison of the squared power ratios of the correlation peaks associated with the received signal and the squared power ratios associated with the CFO candidates may provide a good approximation of the CFO of the received signal.
- the squared power ratios of the correlation peaks associated with the received signal may be similar for different CFO candidates in some CFO regions (e.g.,
- FIG. 5 a diagram illustrating ambiguity zones associated with estimating carrier frequency offset (CFO) using relative power of correlation peaks associated with a received signal is shown.
- the diagram 400 of FIG. 4 is shown, and a plurality of zones of ambiguity are shown and include a first zone of ambiguity 510 , a second zone of ambiguity 520 , and a third zone of ambiguity 530 are shown.
- the first zone of ambiguity 510 may make it difficult to estimate the CFO when normalized CFO is small (e.g.,
- the peak magnitude associated with the left peak (P ⁇ 1 ) and the right peak (P 1 ) may be similar, which may result in an incorrect determination of the sign of the CFO (e.g., is the CFO positive or negative, or on the left or right side of 0).
- Ambiguity within the first zone of ambiguity 510 may also occur when a signal-to-noise ratio (SNR) associated with the received signal is low.
- SNR signal-to-noise ratio
- the ambiguity may occur within the second zone of ambiguity 520 and/or the third zone of ambiguity 530 when the magnitude of the two side peaks and the main peak is similar on both the left and right sides of the sub-carrier spacing when the normalized CFO is near +/ ⁇ 1 (e.g., 1000 Hz ⁇
- the ambiguities described above may cause an incorrect CFO estimation even when the CFO estimation is based on a signal received via the PRACH.
- determining CFO estimates based solely on the relationship of magnitude of the peaks e.g., the peaks 312 , 322 , 324 of FIG.
- a CFO estimation unit (e.g., the CFO estimation unit 130 of FIG. 1 ) of embodiments may be operable to resolve the ambiguity associated with the correct region of the CFO prior to determining the CFO estimate, thereby increasing the accuracy of the estimated CFO.
- the CFO estimation unit 130 of embodiments may resolve the ambiguity based on a phase of the left peak (P ⁇ 1 ), a phase of the right peak (P 1 ), and a phase of the main peak (P 0 ), as described in more detail below.
- a diagram illustrating squared power ratios of correlation peaks associated with a received signal is shown as a diagram 600 .
- a first plot 610 and a second plot 620 are shown.
- the first plot 610 may be associated with a squared power ratio between a right peak (P 1 ) and a main peak (P 0 )
- the second plot 620 may be associated with a squared power ratio between a left peak (P ⁇ 1 ) and the main peak (P 0 ).
- the power e.g., magnitude
- the zones of ambiguity 602 , 612 , 622 of FIG. 6 and the zones of ambiguity 510 , 520 , 530 of FIG. 5 illustrate that using only squared power ratios and other power related parameters to determine CFO estimates in conditions that are common to HST scenarios (e.g., CFOs of approximately +/ ⁇ 1340 Hz and CFOs determined under low signal-to-noise ratio (SNR) conditions) may cause inaccurate CFO estimates, which may degrade the performance of a system in communication with a wireless device (e.g., a cellular voice and/or data network).
- the present disclosure includes systems, methods, apparatus, and computer-readable storage media to more accurately estimate CFO by using phases of the peaks to resolve the ambiguities described above with reference to FIGS. 5 and 6 , as described in more detail below.
- the power comparison unit 150 may provide the coarse CFO estimate to the CFO decision unit 170 (e.g., as the output 152 ).
- the CFO decision unit 170 may determine a final CFO estimate 172 based on the coarse CFO estimate and phases of the respective peaks of the correlation output, as described in more detail below.
- the phase determination unit 160 may receive the output 122 from the detection unit 120 , and may be configured to determine theoretical values (or phases) of the peaks associated with the received signal based on the output 122 .
- the phase determination unit 160 may determine the theoretical values (or phases) of the peaks based on the preamble index included in the output 122 .
- the theoretical values (or phases) associated with the peaks may include a theoretical value ⁇ 1 associated with the right peak, and may include a theoretical value ⁇ ⁇ 1 associated with the left peak.
- the phase determination 160 may determine the theoretical phase difference between the right peak and the main peak, ⁇ 1 , and the theoretical phase difference between the left peak and the main peak, ⁇ ⁇ 1 using a lookup table given by:
- ⁇ F is the sub-carrier spacing
- ⁇ f is a known CFO
- ⁇ ⁇ ( P 1 P 0 ) ⁇ ⁇ ( 0 ⁇ ⁇ ⁇ ⁇ f ⁇ ⁇ ⁇ ⁇ F ) is a first phase difference between the right peak and the main peak when
- a plot illustrating pre-determined theoretical values associated with a known preamble index is shown as a plot 700 .
- the distance between theoretical value 742 and the phase difference between the right correlation peak and the main correlation peak may be represented by
- ⁇ 1 [ ⁇ ⁇ ( P 1 P 0 ) - ⁇ 1 ( 0 ⁇ ⁇ ⁇ ⁇ f ⁇ ( ⁇ ⁇ ⁇ F ) ] 2
- the distance between theoretical value 740 and the phase difference between the right correlation peak and the main correlation peak may be represented as
- ⁇ 2 [ ⁇ ⁇ ( P 1 P 0 ) - ⁇ 1 ⁇ ( ⁇ ⁇ ⁇ f > ⁇ ⁇ ⁇ F ) ] 2 , where ⁇ 1 is determined from the ⁇ (described above) and corresponds to the theoretical value 742 when the received signal (or the Zadoff-Chu sequence associated with the received signal) is associated with a particular preamble index and 0 ⁇ f ⁇ F, where ⁇ 1 corresponds to the theoretical value 740 when the received signal (or the Zadoff-Chu sequence associated with the received signal) is associated with the particular preamble index and
- ⁇ ⁇ ( P 1 P 0 ) is the phase difference between the right correlation peak and the main correlation peak
- ⁇ f is the CFO estimate
- ⁇ F is the sub-carrier spacing.
- the CFO (or normalized CFO) may be around +1 when the sub-carrier spacing is 1250 Hz and the CFO is between 1000 Hz and 1500 Hz.
- the distance between theoretical value 750 and the phase difference between the left correlation peak and the main correlation peak may be represented by
- ⁇ 1 [ ⁇ ⁇ ( P - 1 P 0 ) - ⁇ - 1 ( ⁇ ⁇ ⁇ f ⁇ ( - ⁇ ⁇ ⁇ F ) ] 2
- the distance between theoretical value 752 and the difference between the left correlation peak and the main correlation peak may be represented as
- ⁇ ⁇ 2 [ ⁇ ⁇ ( P - 1 P 0 ) - ⁇ - 1 ⁇ ( ( - ⁇ ⁇ ⁇ F ) ⁇ ⁇ ⁇ ⁇ f ⁇ 0 ) ] 2 , where ⁇ ⁇ 1 is determined from the ⁇ (described above) and corresponds to the theoretical value 750 when the received signal (or the Zadoff-Chu sequence associated with the received signal) is associated with a particular preamble index and ⁇ f ⁇ ( ⁇ F), and where ⁇ ⁇ 1 corresponds to the theoretical value 752 when the received signal (or the Zadoff-Chu sequence associated with the received signal) is associated with the particular preamble index and
- the CFO (or normalized CFO) may be around ⁇ 1 when the sub-carrier spacing is 1250 Hz and the CFO is between ⁇ 1500 Hz and ⁇ 1000 Hz.
- the distance between theoretical values 734 and 736 and those of the correlation output may be represented by
- ⁇ 1 [ ⁇ ⁇ ( P 1 P 0 ) - a 1 ⁇ ( 0 ⁇ ⁇ ⁇ ⁇ f ⁇ ⁇ ⁇ F ) ] 2 + [ ⁇ ⁇ ( P - 1 P 0 ) - a - 1 ⁇ ( 0 ⁇ ⁇ ⁇ ⁇ f ⁇ ⁇ ⁇ F ) ] 2 , where ⁇ 1 is representative of the sum of a distance between the theoretical value 734 and the phase difference between the right correlation peak and the main correlation peak when 0 ⁇ f ⁇ F and a distance between the theoretical value 736 and the phase difference between the left correlation peak and the main correlation peak when 0 ⁇ f ⁇ F, where ⁇ F is the sub-carrier spacing,
- ⁇ ⁇ ( P 1 P 0 ) is the phase difference between the right correlation peak and the main peak
- ⁇ ⁇ ( P - 1 P 0 ) is the phase difference between the left correlation peak and the main peak
- ⁇ 1 (0 ⁇ f ⁇ F) is the theoretical value 734 when the received signal (or the Zadoff-Chu sequence associated with the received signal) is associated with a particular preamble index of the Zadoff-Chu sequence and 0 ⁇ f ⁇ F
- ⁇ ⁇ 1 (0 ⁇ f ⁇ F) is the theoretical value 736 when the received signal (or the Zadoff-Chu sequence associated with the received signal) is associated with the particular preamble index of the Zadoff-Chu sequence and 0 ⁇ f ⁇ F
- ⁇ f is the CFO estimate
- ⁇ 2 [ ⁇ ⁇ ( P 1 P 0 ) - a 1 ⁇ ( - ⁇ ⁇ ⁇ F ⁇ ⁇ ⁇ ⁇ f ⁇ 0 ) ] 2 + [ ⁇ ⁇ ( P - 1 P 0 ) - a - 1 ⁇ ( - ⁇ ⁇ ⁇ F ⁇ ⁇ ⁇ ⁇ f ⁇ 0 ) ] 2 , where ⁇ 2 is representative of the sum of a distance between the theoretical value 730 and the phase difference between the right correlation peak and the main correlation peak when ⁇ F ⁇ f ⁇ 0 and a distance between the theoretical value 732 and the phase difference between the left correlation peak and the main correlation peak when ⁇ F ⁇ f ⁇ 0, where ⁇ F is the sub-carrier spacing,
- ⁇ ⁇ ( P 1 P 0 ) is the phase difference between the right correlation peak and the main peak
- ⁇ ⁇ ( P - 1 P 0 ) is the phase difference between the left correlation peak and the main peak
- ⁇ 1 ( ⁇ F ⁇ f ⁇ 0) is the theoretical value 730 when the received signal (or the Zadoff-Chu sequence associated with the received signal) is associated with the particular preamble index of the Zadoff-Chu sequence and ( ⁇ F ⁇ f ⁇ 0)
- ⁇ ⁇ 1 ( ⁇ F ⁇ f ⁇ 0) is the theoretical value 732 when the received signal (or the Zadoff-Chu sequence associated with the received signal) is associated with the particular preamble index of the Zadoff-Chu sequence and ⁇ F ⁇ f ⁇ 0
- ⁇ f is the CFO estimate
- ⁇ ⁇ ( P 1 P 0 ) is the phase difference between the right correlation peak and the main correlation peak
- ⁇ ⁇ ( P - 1 P 0 ) is the phase difference between the left correlation peak and the main correlation peak
- ⁇ f is the CFO estimate
- ⁇ F is the sub-carrier spacing.
- the CFO (or normalized CFO) may be around 0 when the sub-carrier spacing is 1250 Hz and the CFO is between ⁇ 500 Hz and 500 Hz.
- a CFO estimation unit (e.g., the CFO estimation unit 130 of FIG. 1 ) of embodiments may use the relationships described above to determine a region associated with the CFO, as described in more detail below.
- the phase determination unit 160 may generate an output 162 including information associated with the theoretical phase (or angle) differences between the left peak and the main peak and between the right peak and the main peak.
- the CFO decision unit 170 may be adapted to determine the final CFO estimate based on the coarse CFO estimate and phase information (e.g., the theoretical phases and phases of the peaks associated with the received signal). Using the phase information to determine the final CFO estimate may resolve the ambiguities that arise when only relative power values are used to determine the CFO estimate, as described in more detail below.
- the CFO decision unit 170 may determine a CFO region associated with the received signal. For example, the CFO decision unit may determine whether the CFO of the received signal is on the positive side of the sub-carrier spacing or the negative side of the sub-carrier spacing. In an embodiment, the CFO region may be determined based on the power comparison results (e.g., g(f i ) of equation 8) and the phases of the correlation peaks, which may utilize the predetermined values associated with the detected preamble index. In an embodiment, the predetermined values associated with the detected preamble index may be included in the output 162 .
- the CFO decision unit 170 may determine the CFO region associated with the received signal based further on the coarse estimate included in the output 152 , and may use the phase information to determine a final CFO estimate. For example, when the coarse estimate
- ⁇ ⁇ ( P 1 P 0 ) is the phase (or angle) difference between the right peak and the main peak
- ⁇ ⁇ ( P - 1 P 0 ) is the phase (or angle) difference between the left peak and the main peak, ⁇ corresponds to the predetermined values received from phase determination unit 160 , and where ⁇ is the absolute difference between the predetermined values and that of the correlation output.
- the CFO decision unit 170 may determine whether any value of ⁇ is larger than ⁇ . If any value of a is larger than ⁇ , the CFO decision unit 170 may replace that value with 2 ⁇ —itself. The CFO decision unit 170 may resolve the ambiguity of the CFO by determining a sign of the CFO based on the values of ⁇ .
- the CFO decision unit 170 may then evaluate whether ⁇ 1 ⁇ 2 to determine the region (e.g., the sign) of the CFO. For example, the CFO decision unit 170 may determine the final CFO ⁇ f according to:
- the CFO decision unit 170 of embodiments may resolve an ambiguity (e.g., the zone of ambiguity 510 of FIG. 5 ) for small CFO (e.g.,
- an ambiguity e.g., the zone of ambiguity 510 of FIG. 5
- small CFO e.g.,
- the CFO decision unit 170 may calculate:
- ⁇ ⁇ ( P 1 P 0 ) is the phase difference between the right peak and the main peak, ⁇ corresponds to the predetermined values received from phase determination unit 160 , ⁇ (:,1) is the first column of ⁇ , and where ⁇ is the difference between the predetermined values and that of the correlation output.
- the CFO decision unit 170 may determine whether any value of ⁇ is larger than ⁇ . If any value of ⁇ is larger than ⁇ , the CFO decision unit 170 may replace that value with 2 ⁇ —itself. The CFO decision unit 170 may resolve the ambiguity of the CFO by determining which side of positive subcarrier spacing (i.e., 1250 Hz) the CFO is on based on the values of ⁇ .
- ⁇ ⁇ ( P 1 P 0 ) is the phase difference between the right correlation peak and the main correlation peak associated with the signal.
- the CFO decision unit 170 may then evaluate whether ⁇ 1 ⁇ 2 to determine the region of the CFO, where ⁇ 1 ⁇ 2 indicates whether the phase of the phase difference between the right correlation peak and the main correlation peak is closer to the expected value of the left side (e.g., a CFO region on the negative side) of the sub-carrier spacing or the right side (e.g., a CFO region on the positive side) of the sub-carrier spacing.
- the CFO decision unit 170 may determine that the CFO is on the left side of ⁇ F, thereby eliminating potential ambiguity in the final CFO estimate.
- evaluating ⁇ 1 ⁇ 2 may facilitate the determination of a range of the CFO, which may be used to determine the final CFO estimate.
- the CFO decision unit 170 may determine the final CFO ⁇ f according to:
- Equation ⁇ ⁇ 15 ⁇ ⁇ ⁇ f ⁇ arg ⁇ ⁇ min f i ⁇ ⁇ ⁇ ⁇ F ⁇ ( ⁇ P 1 P 0 ⁇ 2 - r 1 ⁇ ( f i ) ) 2 + ( ⁇ P - 1 P 0 ⁇ 2 - r - 1 ⁇ ( f i ) ) 2 , if ⁇ ⁇ ⁇ 1 ⁇ ⁇ 2 arg ⁇ ⁇ min f i > ⁇ ⁇ ⁇ F ⁇ ( ⁇ P 1 P 0 ⁇ 2 - r 1 ⁇ ( f i ) ) 2 + ( ⁇ P - 1 P 0 ⁇ 2 - r - 1 ⁇ ( f i ) ) 2 , otherwise .
- ⁇ f is the final CFO estimate
- f i corresponds to a known CFO associated with a particular CFO candidate of the plurality of CFO candidates
- ⁇ P 1 P 0 ⁇ 2 is a squared power ratio between the right peak of the correlation output and the main peak of the correlation output
- ⁇ P - 1 P 0 ⁇ 2 is a squared power ratio between the left peak of the correlation output and the main peak of the correlation output
- r 1 (f i ) is the squared power ratio between a right peak of the particular CFO candidate and a main peak of the particular CFO candidate
- r ⁇ 1 (f i ) is the squared power ratio between a left peak of the particular CFO candidate and the main peak of the particular CFO candidate, where the particular CFO candidate is associated with the coarse CFO.
- the CFO decision unit 170 of embodiments may resolve an ambiguity (e.g., the zone of ambiguity 520 of FIG. 5 ) associated with a CFO estimate using the phase of the correlation peaks.
- the CFO decision unit 170 of embodiments may resolve an ambiguity (e.g., the second zone of ambiguity 520 of FIG. 5 ) associated with a CFO estimate, thereby increasing the accuracy of the final CFO estimate.
- equation 15 may be solved and the final CFO estimate may be given by:
- ⁇ ⁇ ⁇ f ⁇ arg ⁇ ⁇ min f i ⁇ ⁇ ⁇ F ⁇ g ⁇ ( f i ) ⁇ ⁇ if ⁇ ⁇ ⁇ 1 ⁇ ⁇ 2 ; and arg ⁇ ⁇ min f i > - ⁇ ⁇ ⁇ F ⁇ g ⁇ ( f i ) ⁇ ⁇ otherwise . Equation ⁇ ⁇ 16
- the CFO decision unit 170 may calculate:
- ⁇ ⁇ ( P - 1 P 0 ) is the phase difference between the left peak and the main peak
- ⁇ corresponds to the predetermined values received from phase determination unit 160
- ⁇ (:,2) is the second column of ⁇
- ⁇ is the difference between the predetermined values and that of the correlation output.
- the CFO decision unit 170 may determine whether any value of ⁇ is larger than ⁇ . If any value of ⁇ is larger than ⁇ , the CFO decision unit 170 may replace that value with 2 ⁇ —itself. The CFO decision unit 170 may resolve the ambiguity of the CFO by determining which side of negative subcarrier spacing (i.e., ⁇ 1250 Hz) the CFO is on based on the values of ⁇ .
- the CFO decision unit 170 may then evaluate whether ⁇ 1 ⁇ 2 to determine the region of the CFO. For example, the CFO decision unit 170 may determine the final CFO ⁇ f according to:
- Equation ⁇ ⁇ 18 ⁇ ⁇ ⁇ f ⁇ arg ⁇ ⁇ min f i ⁇ ( - ⁇ ⁇ ⁇ F ) ⁇ ( ⁇ P 1 P 0 ⁇ 2 - r 1 ⁇ ( f i ) ) 2 + ( ⁇ P - 1 P 0 ⁇ 2 - r - 1 ⁇ ( f i ) ) 2 , if ⁇ ⁇ ⁇ 1 ⁇ ⁇ 2 ; and arg ⁇ ⁇ min f i > ( - ⁇ ⁇ ⁇ F ) ⁇ ( ⁇ P 1 P 0 ⁇ 2 - r 1 ⁇ ( f i ) ) 2 + ( ⁇ P - 1 P 0 ⁇ 2 - r - 1 ⁇ ( f i ) ) 2 otherwise .
- ⁇ f is the final CFO estimate
- f i corresponds to a known CFO associated with a particular CFO candidate of the plurality of CFO candidates
- ⁇ P 1 P 0 ⁇ 2 is a squared power ratio between the right correlation peak associated with the received signal and the main correlation peak associated with the received signal
- ⁇ P - 1 P 0 ⁇ 2 is a squared power ratio between the left correlation peak associated with the received signal and the main correlation peak associated with the received signal
- r 1 (f i ) is the squared power ratio between a right peak of the particular CFO candidate and a main peak of the particular CFO candidate
- r ⁇ 1 (f i ) is the squared power ratio between a left peak of the particular CFO candidate and the main peak of the particular CFO candidate, where the particular CFO candidate is associated with the coarse CFO.
- the CFO decision unit 170 of embodiments may resolve an ambiguity (e.g., the third zone of ambiguity 530 of FIG. 5 ) associated with a CFO estimate, thereby increasing the accuracy of the final CFO estimate.
- equation 18 may be solved and the final CFO estimate may be given by:
- ⁇ ⁇ ⁇ f ⁇ arg ⁇ ⁇ min f i ⁇ ( ⁇ ⁇ ⁇ F ) ⁇ g ⁇ ( f i ) ⁇ ⁇ if ⁇ ⁇ ⁇ 1 ⁇ ⁇ 2 ; and ⁇ arg ⁇ ⁇ min f i > ( - ⁇ ⁇ ⁇ F ) ⁇ g ⁇ ( f i ) ⁇ ⁇ otherwise . Equation ⁇ ⁇ 19
- Equation 19 g(f i ) is obtained from equation 8, f i corresponds to a known CFO associated with a particular CFO candidate of the plurality of CFO candidates, and ⁇ f is the final CFO estimate.
- the system 100 of embodiments may determine a final CFO estimate with an increased accuracy.
- the CFO estimation unit 130 of embodiments may eliminate potential ambiguities that may result in an incorrect determination of the CFO, which may provide an advantage over systems that determine CFO estimates based only on power levels of the plurality of peaks, as explained above with reference to at least FIGS. 2 and 4-6 . Further, advantages and illustrations of the benefits of determining a final CFO estimate according to embodiments are described below with reference to FIGS. 8A-13B .
- embodiments may be readily applied to other signals and transmission channels exhibiting characteristics similar to the characteristics of the signals transmitted and received via PRACH, such as exhibiting a plurality of correlation peaks when correlating the received signal with a known sequence, and exhibiting phase shift of the plurality of correlation peaks at the zones of ambiguity described with reference to FIGS. 5 and 6 , and the like. Further, embodiments may also be applied to signals received on signals other than PRACH, such as signals received on other channels on which signals utilizing use Zadoff-Chu sequences are sent.
- one or more embodiments may improve the operations of wireless communication systems, such as 3G communication systems, 4G/LTE communication systems, LTE-advanced communication systems, 802.11 communication systems, and the like.
- wireless communication systems such as 3G communication systems, 4G/LTE communication systems, LTE-advanced communication systems, 802.11 communication systems, and the like.
- the equations and formulas described above have been provided for purposes of illustration, rather than by way of limitation.
- the present disclosure is not to be limited to the exemplary equations and formulas disclosed herein for resolving ambiguity associated with a CFO estimate.
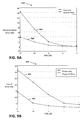
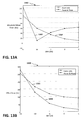
- FIGS. 8A and 8B graphs comparing the accuracy of carrier frequency offset (CFO) estimates determined based on correlation peak power only and for CFO estimates determined according to embodiments are shown.
- CFO estimate realizations illustrated by the graphs of FIGS. 8A and 8B were generated during a simulation of a system (e.g., the system 100 of FIG. 1 ) where CFO was simulated as 270 Hz in a high speed train scenario at a signal to noise ratio (SNR) of ⁇ 5 dB.
- SNR signal to noise ratio
- FIG. 8A a graph 810 illustrating the accuracy for a number of CFO estimate realizations is shown, where each CFO estimate realization was determined based on correlation peak power only.
- FIG. 8B a graph 820 illustrating the accuracy for a number of CFO estimate realizations is shown, where each CFO estimate realization was determined according to embodiments (e.g., CFO estimates determined based on both a power and a phase associated with the correlation peaks).
- each CFO estimate realization was determined according to embodiments (e.g., CFO estimates determined based on both a power and a phase associated with the correlation peaks).
- 100% of the CFO estimate realizations determined according to embodiments resulted in the CFO being determined in the correct zone, and, as indicated at 824 , none of the CFO estimate realizations determined according to embodiments were in the incorrect zone.
- FIGS. 8A and 8B illustrate that CFO estimate accuracy according to embodiments may increase the likelihood that the CFO is determined in the correct zone (e.g., the detection window associated with the CFO having the correct sign or region).
- CFO estimate determinations may improve the performance and reduce interference within a wireless communication system (e.g., the system 100 of FIG. 1 ).
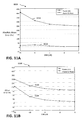
- FIGS. 9A and 9B charts plotting the absolute mean error (in Hz) and the standard deviation of the error (in Hz), respectively, for carrier frequency offset (CFO) estimates determined based on correlation peak power only and for CFO estimates determined according to embodiments are shown. It is noted that, the plots of FIGS. 9A and 9B were generated during a simulation of a system (e.g., the system 100 of FIG. 1 ) where CFO was simulated as 270 Hz.
- FIG. 9A a first chart 910 plotting the absolute mean error (in Hz) for CFO estimates determined based on correlation peak power only and for CFO estimates determined according to embodiments are shown.
- the first chart 910 a first plot 912 illustrating the absolute mean error (in Hz) for CFO estimates determined based on correlation peak power only is shown, and a second plot 914 illustrating the absolute mean error (in Hz) for CFO estimates determined according to embodiments are shown.
- the CFO estimates determined according to embodiments may have a reduced absolute mean error (in Hz).
- the first chart 910 illustrates that a reduced absolute mean error (in Hz) may be realized when CFO estimates are determined according to embodiments (e.g., CFO estimates determined based on both a power and a phase associated with the correlation peaks), even when the signal to noise ratio (SNR) is low.
- SNR signal to noise ratio
- FIG. 9B a second chart 920 plotting the standard deviation of the error (in Hz) for CFO estimates determined based on correlation peak power only and for CFO estimates determined according to embodiments are shown.
- a first plot 922 illustrating the standard deviation of the error (in Hz) for CFO estimates determined based on correlation peak power only is shown
- a second plot 924 illustrating the standard deviation of the error (in Hz) for CFO estimates determined according to embodiments is shown.
- the CFO estimates determined according to embodiments may realize a reduced standard deviation of the error (in Hz), even when the SNR is low.
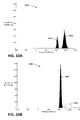
- FIGS. 10A and 10B graphs comparing the accuracy of carrier frequency offset (CFO) estimates determined based on correlation peak power only and for CFO estimates determined according to embodiments are shown. It is noted that, the graphs of FIGS. 10A and 10B were generated during a simulation of a system (e.g., the system 100 of FIG. 1 ) where CFO was simulated as 1100 Hz at a signal to noise ratio (SNR) of ⁇ 5 dB.
- SNR signal to noise ratio
- FIG. 10A a first graph 1010 illustrating the accuracy for a number of CFO estimate realizations is shown, where each CFO estimate realization was determined based on correlation peak power only.
- FIG. 10A illustrates that a majority of CFO estimates determined based on correlation peak power only are in the incorrect zone when CFO is 1100 Hz.
- FIG. 10B a second graph 1020 illustrating the accuracy for a number of CFO estimate realizations is shown, where each CFO estimate realization was determined according to embodiments (e.g., based on correlation peak power and phase information).
- each CFO estimate realization was determined according to embodiments (e.g., based on correlation peak power and phase information).
- nearly 100% (e.g., 99.97%) of the CFO estimate realizations determined according to embodiments resulted in the CFO being determined in the correct zone, and, as indicated at 1024 , less than 1% (e.g., 0.03%) of the CFO estimate realizations determined according to embodiments were in the incorrect zone.
- CFO estimate accuracy may increase the likelihood that the CFO is determined in the correct zone (e.g., the left side of 1250 Hz). Therefore, CFO estimate determinations according to embodiments (e.g., CFO estimates determined based on both a power and a phase associated with the peaks) may improve the performance and reduce interference within a wireless communication system (e.g., the system 100 of FIG. 1 ).
- FIGS. 11A and 11B charts plotting the absolute mean error (in Hz) and the standard deviation of the error (in Hz), respectively, for carrier frequency offset (CFO) estimates determined based on correlation peak power only and for CFO estimates determined according to embodiments are shown. It is noted that, the plots of FIGS. 11A and 11B were generated during a simulation of a system (e.g., the system 100 of FIG. 1 ) where CFO was simulated as 1100 Hz.
- FIG. 11A a first chart 1110 plotting the absolute mean error (in Hz) for CFO estimates determined based on correlation peak power only and for CFO estimates determined according to embodiments are shown.
- the first chart 1110 a first plot 1112 illustrating the absolute mean error (in Hz) for CFO estimates determined based on correlation peak power only is shown, and a second plot 1114 illustrating the absolute mean error (in Hz) for CFO estimates determined according to embodiments is shown.
- the CFO estimates determined according to embodiments may have a reduced absolute mean error (in Hz).
- the first chart 1110 illustrates that a reduced absolute mean error (in Hz) may be realized when CFO estimates are determined according to embodiments (e.g., CFO estimates determined based on both a power and a phase associated with the correlation peaks), even when the signal to noise ratio (SNR) is low.
- SNR signal to noise ratio
- FIG. 11B a second chart 1120 plotting the standard deviation of the error (in Hz) for CFO estimates determined based on correlation peak power only and for CFO estimates determined according to embodiments are shown.
- a first plot 1122 illustrating the standard deviation of the error (Hz) for CFO estimates determined based on correlation peak power only is shown
- a second plot 1124 illustrating the standard deviation of the error (in Hz) for CFO estimates determined according to embodiments is shown.
- the CFO estimates determined according to embodiments may realize a reduced standard deviation of the error (in Hz), even when the SNR is low.
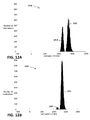
- FIGS. 12A and 12B graphs comparing the accuracy of carrier frequency offset (CFO) estimates determined based on correlation peak power only and for CFO estimates determined according to embodiments are shown. It is noted that, the graphs of FIGS. 12A and 12B were generated during a simulation of a system (e.g., the system 100 of FIG. 1 ) where CFO was simulated as 1340 Hz.
- FIG. 12A a first graph 1210 illustrating the accuracy for a number of CFO estimate realizations is shown, where each CFO estimate realization was determined based on correlation peak power only.
- FIG. 12A illustrates that a substantial number of CFO estimates determined based on correlation peak power only are in the incorrect zone when CFO is 1100 Hz.
- FIG. 12B a second graph 1220 illustrating the accuracy for a number of CFO estimate realizations at a signal to noise ratio (SNR) of ⁇ 5 dB is shown, where each CFO estimate realization was determined according to embodiments (e.g., based on correlation peak power and phase information).
- SNR signal to noise ratio
- CFO estimate accuracy may increase the likelihood that the CFO is determined in the correct zone (e.g., the right side of 1250 Hz). Therefore, CFO estimate determinations according to embodiments (e.g., CFO estimates determined based on both a power and a phase associated with the correlation peaks) may improve the performance and reduce interference within a wireless communication system (e.g., the system 100 of FIG. 1 ).
- FIGS. 13A and 13B charts plotting the absolute mean error (in Hz) and the standard deviation of the error (in Hz), respectively, for carrier frequency offset (CFO) estimates determined based on correlation peak power only and for CFO estimates determined according to embodiments are shown. It is noted that, the plots of FIGS. 13A and 13B were generated during a simulation of a system (e.g., the system 100 of FIG. 1 ) where CFO was simulated as 1340 Hz.
- FIG. 13A a first chart 1310 plotting the absolute mean error (Hz) for CFO estimates determined based on correlation peak power only and for CFO estimates determined according to embodiments are shown.
- first chart 1310 a first plot 1312 illustrating the absolute mean error (in Hz) for CFO estimates determined based on correlation peak power only is shown, and a second plot 1314 illustrating the absolute mean error (in Hz) for CFO estimates determined according to embodiments is shown.
- the CFO estimates determined according to embodiments may have a reduced absolute mean error (in Hz).
- the first chart 1310 illustrates that a reduced absolute mean error (in Hz) may be realized when CFO estimates are determined according to embodiments (e.g., CFO estimates determined based on both a power and a phase associated with the correlation peaks), even when the signal to noise ratio (SNR) is low.
- SNR signal to noise ratio
- FIG. 13B a second chart 1320 plotting the standard deviation of the error (in Hz) for CFO estimates determined based on correlation peak power only and for CFO estimates determined according to embodiments are shown.
- a first plot 1322 illustrating the standard deviation of the error (in Hz) for CFO estimates determined based on correlation peak power only is shown
- a second plot 1324 illustrating the standard deviation of the error (in Hz) for CFO estimates determined according to embodiments is shown.
- the CFO estimates determined according to embodiments may realize a reduced standard deviation of the error (in Hz), even when the SNR is low.
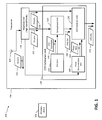
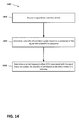
- a flowchart of an illustrative embodiment of a method for determining a carrier frequency offset (CFO) using phase information associated with a received signal is shown as a method 1400 .
- the method 1400 may be performed by the transceiver 104 of FIG. 1 .
- the method 1400 may be stored as instructions that, when executed by a processor of the transceiver 104 of FIG. 1 , cause the processor to perform the operations of the method 1400 , where the instructions may be stored at computer-readable storage medium of the transceiver 104 .
- the method 1400 includes receiving a signal from a wireless device, and, at 1420 , determining a plurality of correlation peaks associated with the received signal based on a correlation of the signal with a Zadoff-Chu sequence.
- the method 1400 includes determining a carrier frequency offset (CFO) associated with the signal based on a phase of the plurality of correlation peaks and a coarse CFO estimate.
- the coarse CFO estimate may be determined based on the plurality of correlation peaks.
- the coarse CFO estimate may be determined based on a comparison of squared power ratios associated with the plurality of correlation peaks and squared power ratios associated with one or more CFO candidates.
- the one or more CFO candidates may be stored in a lookup table, and the comparison may be performed using the lookup table, as described with reference to FIG. 1 .
- the phase associated with the plurality of correlation peaks may include a phase difference between a left correlation peak and a main correlation peak of the plurality of correlation peaks, and a phase difference between a right correlation peak and the main correlation peak of the plurality of correlation peaks, as described with reference to FIG. 1 .
- the phase differences associated with the left correlation peak and the right correlation peak may be determined based on predetermined theoretical values, as described with reference to FIG. 1 .
- the theoretical values may be determined based on a preamble index, where the preamble index is determined based on the correlation of the signal and the Zadoff-Chu sequence.
- the method 1400 may be used to perform long term evolution (LTE) high speed mode detection of a signal transmitted using a physical random access channel (PRACH).
- LTE long term evolution
- PRACH physical random access channel
- the method 1400 may be performed during attachment of a wireless device (e.g., the wireless device 102 of FIG. 1 ) to a transceiver (e.g., the transceiver 104 of FIG. 1 ) while the wireless device is operating in a high speed train (HST) scenario (or another scenario where the wireless device or the transceiver 104 is travelling at a high rate of speed, such as in an airplane, a boat, another type of land-based vehicle, and the like).
- HTT high speed train
- a likelihood that the correct CFO is determined may be increased, as described with reference to at least FIGS. 1 and 7-13B .
- a CFO determined using the method 1400 may reduce occurrences of inter-carrier interference (ICI) for communication systems utilizing the method 1400 for CFO calculation.
- ICI inter-carrier interference
Landscapes
- Engineering & Computer Science (AREA)
- Computer Networks & Wireless Communication (AREA)
- Signal Processing (AREA)
- Mobile Radio Communication Systems (AREA)
Abstract
Description
and where the ratio of the squared power between the left peak (P−1) and the main peak (P0) of the correlation output may be
is the ratio of the squared power between the right peak (P1) and the main peak (P0) of the correlation output,
is the ratio of the squared power between the left peak (P−1) and the main peak (P0) of the correlation output, fi corresponds to a known CFO associated with a particular CFO candidate of the plurality of CFO candidates, r1(fi) corresponds to a pre-determined value representative of the squared power ratio between a right peak of the particular CFO candidate and a main peak of the particular CFO candidate, and r−1(fi) corresponds to a pre-determined value representative of the squared power ratio between a left peak of the particular CFO candidate and the main peak of the particular CFO candidate. Additionally, in equation 8, r1(fi) and r−1(fi) may be given by:
Δf coarse =arg minf
is a first phase difference between the right peak and the main peak when
is a second phase difference between the right peak and the main peak when
is a first phase difference between the left peak and the main peak when
is a second phase difference between the left peak and the main peak when (−ΔF<Δf<0) which may be obtained from
and the distance between
where α1 is determined from the α (described above) and corresponds to the
is the phase difference between the right correlation peak and the main correlation peak, Δf is the CFO estimate, and ΔF is the sub-carrier spacing. In an embodiment, the CFO (or normalized CFO) may be around +1 when the sub-carrier spacing is 1250 Hz and the CFO is between 1000 Hz and 1500 Hz.
and the distance between
where α−1 is determined from the α (described above) and corresponds to the
is the phase difference between the left correlation peak and the main correlation peak, Δf is the CFO estimate, and ΔF is the sub-carrier spacing. In an embodiment, the CFO (or normalized CFO) may be around −1 when the sub-carrier spacing is 1250 Hz and the CFO is between −1500 Hz and −1000 Hz.
where δ1 is representative of the sum of a distance between the
is the phase difference between the right correlation peak and the main peak,
is the phase difference between the left correlation peak and the main peak, α1 (0<Δf<ΔF) is the
represents the distance between the
represents the distance between the
where δ2 is representative of the sum of a distance between the
is the phase difference between the right correlation peak and the main peak,
is the phase difference between the left correlation peak and the main peak, where α1 (−ΔF<Δf<0) is the
represents the distance between
represents the distance between
is the phase difference between the right correlation peak and the main correlation peak,
is the phase difference between the left correlation peak and the main correlation peak, Δf is the CFO estimate, and ΔF is the sub-carrier spacing. In an embodiment, the CFO (or normalized CFO) may be around 0 when the sub-carrier spacing is 1250 Hz and the CFO is between −500 Hz and 500 Hz.
is the phase (or angle) difference between the right peak and the main peak,
is the phase (or angle) difference between the left peak and the main peak, α corresponds to the predetermined values received from
is the phase difference between the right peak and the main peak, α corresponds to the predetermined values received from
where δ1 is a distance between the phase difference between the right correlation peak and the main correlation peak and a first theoretical value when 0<Δf<ΔF, where δ2 is a distance between the phase difference between the right correlation peak and the main correlation peak and a second theoretical value when Δf>ΔF, wherein P1 is the right correlation peak, wherein P0 is the main correlation peak, where α1 is the first theoretical value when 0<Δf<ΔF, wherein α1 is the second theoretical value when Δf>ΔF, where
is the phase difference between the right correlation peak and the main correlation peak associated with the signal. The
is a squared power ratio between the right peak of the correlation output and the main peak of the correlation output,
is a squared power ratio between the left peak of the correlation output and the main peak of the correlation output, r1(fi) is the squared power ratio between a right peak of the particular CFO candidate and a main peak of the particular CFO candidate, and r−1(fi) is the squared power ratio between a left peak of the particular CFO candidate and the main peak of the particular CFO candidate, where the particular CFO candidate is associated with the coarse CFO. Thus, it can be seen from
is the phase difference between the left peak and the main peak, α corresponds to the predetermined values received from
as described above. The
is a squared power ratio between the right correlation peak associated with the received signal and the main correlation peak associated with the received signal,
is a squared power ratio between the left correlation peak associated with the received signal and the main correlation peak associated with the received signal, r1(fi) is the squared power ratio between a right peak of the particular CFO candidate and a main peak of the particular CFO candidate, and r−1(fi) is the squared power ratio between a left peak of the particular CFO candidate and the main peak of the particular CFO candidate, where the particular CFO candidate is associated with the coarse CFO.
Claims (36)
Δf coarse =arg minf
Δf coarse =arg minf
Δf coarse =arg minf
Priority Applications (2)
| Application Number | Priority Date | Filing Date | Title |
|---|---|---|---|
| US14/614,157 US9491024B2 (en) | 2015-02-04 | 2015-02-04 | Methods for frequency offset estimation with Zadoff-Chu sequences |
| CN201510107461.3A CN104753836B (en) | 2015-02-04 | 2015-03-11 | A kind of carrier frequency bias estimation |
Applications Claiming Priority (1)
| Application Number | Priority Date | Filing Date | Title |
|---|---|---|---|
| US14/614,157 US9491024B2 (en) | 2015-02-04 | 2015-02-04 | Methods for frequency offset estimation with Zadoff-Chu sequences |
Publications (2)
| Publication Number | Publication Date |
|---|---|
| US20160226696A1 US20160226696A1 (en) | 2016-08-04 |
| US9491024B2 true US9491024B2 (en) | 2016-11-08 |
Family
ID=53592960
Family Applications (1)
| Application Number | Title | Priority Date | Filing Date |
|---|---|---|---|
| US14/614,157 Active US9491024B2 (en) | 2015-02-04 | 2015-02-04 | Methods for frequency offset estimation with Zadoff-Chu sequences |
Country Status (2)
| Country | Link |
|---|---|
| US (1) | US9491024B2 (en) |
| CN (1) | CN104753836B (en) |
Cited By (3)
| Publication number | Priority date | Publication date | Assignee | Title |
|---|---|---|---|---|
| US20170013553A1 (en) * | 2015-07-09 | 2017-01-12 | Verizon Patent And Licensing Inc., | Wakeup method for devices in power saving mode |
| US10285129B2 (en) | 2015-07-09 | 2019-05-07 | Verizon Patent And Licensing Inc. | Wakeup system and method for devices in power saving mode |
| US20220400439A1 (en) * | 2021-06-09 | 2022-12-15 | Verizon Patent And Licensing Inc. | Side channel mechanism for controlling data flows |
Families Citing this family (10)
| Publication number | Priority date | Publication date | Assignee | Title |
|---|---|---|---|---|
| US10129701B2 (en) * | 2015-09-15 | 2018-11-13 | Mediatek Inc. | Location context managing method and electronic device |
| CN105721378A (en) * | 2016-01-15 | 2016-06-29 | 华信咨询设计研究院有限公司 | CFO estimation method based on unitary matrix training sequence |
| CN105933262B (en) * | 2016-05-23 | 2018-12-14 | 华信咨询设计研究院有限公司 | CFO estimation method based on double training sequences |
| GB2560041B (en) * | 2017-02-28 | 2020-03-18 | Imagination Tech Ltd | OFDM signal parameter estimation |
| CN110071888B (en) * | 2019-02-28 | 2020-06-12 | 成都坤恒顺维科技股份有限公司 | Fast time synchronization method in high-speed data transmission |
| CN110673120B (en) * | 2019-09-18 | 2022-03-29 | 四川天邑康和通信股份有限公司 | Moving rate determination method based on Zadoff-Chu sequence |
| CN110579755B (en) * | 2019-09-18 | 2022-03-29 | 四川天邑康和通信股份有限公司 | High-precision Doppler frequency speed measuring device |
| WO2021230718A1 (en) * | 2020-05-15 | 2021-11-18 | 삼성전자 주식회사 | Method and device for estimating time and frequency offsets in communication system |
| US11742897B2 (en) * | 2020-07-08 | 2023-08-29 | Nxp Usa, Inc. | Method and apparatus for wireless communications |
| CN114584449B (en) * | 2022-03-03 | 2023-03-21 | 电子科技大学 | Improved M-part timing synchronization and frequency offset method based on CAZAC sequence |
Citations (14)
| Publication number | Priority date | Publication date | Assignee | Title |
|---|---|---|---|---|
| US6618452B1 (en) * | 1998-06-08 | 2003-09-09 | Telefonaktiebolaget Lm Ericsson (Publ) | Burst carrier frequency synchronization and iterative frequency-domain frame synchronization for OFDM |
| US6993094B1 (en) * | 1998-04-14 | 2006-01-31 | Fraunhofer-Gesellschaft Zur Foerderung Der Angewandten Forschung E.V. | Coarse frequency synchronization in multicarrier systems |
| US20090011722A1 (en) * | 2007-04-13 | 2009-01-08 | General Dynamics C4 Systems, Inc. | Methods and apparatus for wirelessly communicating signals that include embedded synchronization/pilot sequences |
| US20090238137A1 (en) * | 2006-05-01 | 2009-09-24 | Ntt Docomo, Inc. | Base station and method of generating a synchronization channel |
| US7627059B2 (en) | 2005-04-05 | 2009-12-01 | Samsung Electronics Co., Ltd. | Method of robust timing detection and carrier frequency offset estimation for OFDM systems |
| WO2010040204A1 (en) | 2008-10-09 | 2010-04-15 | British Columbia Cancer Agency Branch | Detection of granulosa-cell tumors |
| US20110026649A1 (en) * | 2009-07-28 | 2011-02-03 | Dietmar Lipka | Technique for determining a frequency offset |
| US8270528B2 (en) | 2003-09-17 | 2012-09-18 | Qualcomm Atheros, Inc. | Packet detection, synchronization, and frequency offset estimation |
| US20130136216A1 (en) * | 2011-03-30 | 2013-05-30 | Panasonic Corporation | Reception device |
| US8532233B2 (en) * | 2008-08-21 | 2013-09-10 | Fujitsu Limited | Apparatus and method for frequency offset estimation |
| CN103338508A (en) | 2013-07-10 | 2013-10-02 | 武汉邮电科学研究院 | Method and system for jointly estimating frequency offset |
| WO2013172748A1 (en) | 2012-05-14 | 2013-11-21 | Telefonaktiebolaget L M Ericsson (Publ) | Frequency offset estimation between a mobile communication terminal and a network node |
| US8797994B2 (en) | 2009-11-13 | 2014-08-05 | Nec Corporation | Frequency offset estimation method, communication apparatus, wireless communication system, and program |
| US8848844B2 (en) | 2010-09-17 | 2014-09-30 | Telefonaktiebolaget L M Ericsson (Publ) | Receiver node and a method therein for compensating frequency offset |
Family Cites Families (6)
| Publication number | Priority date | Publication date | Assignee | Title |
|---|---|---|---|---|
| CN1859345A (en) * | 2005-04-30 | 2006-11-08 | 中国科学院上海微系统与信息技术研究所 | Quick frequency catching method based on OFDM system |
| CN101374130B (en) * | 2007-08-20 | 2013-02-27 | 中兴通讯股份有限公司 | Synchronization method for multi-input multi-output OFDM system |
| JP5994773B2 (en) * | 2011-03-25 | 2016-09-21 | 日本電気株式会社 | Transmitter, receiver, transmission method, reception method, and communication system |
| CN104301264B (en) * | 2013-07-15 | 2017-09-22 | 普天信息技术研究院有限公司 | Frequency bias compensation method |
| CN103401661B (en) * | 2013-08-08 | 2016-07-06 | 电子科技大学 | A kind of integrated decoding method based on MIMO radar communication |
| CN103986686A (en) * | 2014-06-05 | 2014-08-13 | 北京科技大学 | Blind estimation method for carrier frequency offset, direct current offset and I/Q imbalance |
-
2015
- 2015-02-04 US US14/614,157 patent/US9491024B2/en active Active
- 2015-03-11 CN CN201510107461.3A patent/CN104753836B/en active Active
Patent Citations (14)
| Publication number | Priority date | Publication date | Assignee | Title |
|---|---|---|---|---|
| US6993094B1 (en) * | 1998-04-14 | 2006-01-31 | Fraunhofer-Gesellschaft Zur Foerderung Der Angewandten Forschung E.V. | Coarse frequency synchronization in multicarrier systems |
| US6618452B1 (en) * | 1998-06-08 | 2003-09-09 | Telefonaktiebolaget Lm Ericsson (Publ) | Burst carrier frequency synchronization and iterative frequency-domain frame synchronization for OFDM |
| US8270528B2 (en) | 2003-09-17 | 2012-09-18 | Qualcomm Atheros, Inc. | Packet detection, synchronization, and frequency offset estimation |
| US7627059B2 (en) | 2005-04-05 | 2009-12-01 | Samsung Electronics Co., Ltd. | Method of robust timing detection and carrier frequency offset estimation for OFDM systems |
| US20090238137A1 (en) * | 2006-05-01 | 2009-09-24 | Ntt Docomo, Inc. | Base station and method of generating a synchronization channel |
| US20090011722A1 (en) * | 2007-04-13 | 2009-01-08 | General Dynamics C4 Systems, Inc. | Methods and apparatus for wirelessly communicating signals that include embedded synchronization/pilot sequences |
| US8532233B2 (en) * | 2008-08-21 | 2013-09-10 | Fujitsu Limited | Apparatus and method for frequency offset estimation |
| WO2010040204A1 (en) | 2008-10-09 | 2010-04-15 | British Columbia Cancer Agency Branch | Detection of granulosa-cell tumors |
| US20110026649A1 (en) * | 2009-07-28 | 2011-02-03 | Dietmar Lipka | Technique for determining a frequency offset |
| US8797994B2 (en) | 2009-11-13 | 2014-08-05 | Nec Corporation | Frequency offset estimation method, communication apparatus, wireless communication system, and program |
| US8848844B2 (en) | 2010-09-17 | 2014-09-30 | Telefonaktiebolaget L M Ericsson (Publ) | Receiver node and a method therein for compensating frequency offset |
| US20130136216A1 (en) * | 2011-03-30 | 2013-05-30 | Panasonic Corporation | Reception device |
| WO2013172748A1 (en) | 2012-05-14 | 2013-11-21 | Telefonaktiebolaget L M Ericsson (Publ) | Frequency offset estimation between a mobile communication terminal and a network node |
| CN103338508A (en) | 2013-07-10 | 2013-10-02 | 武汉邮电科学研究院 | Method and system for jointly estimating frequency offset |
Non-Patent Citations (2)
| Title |
|---|
| Perisa, Ivan, et al., "Frequency Offset Estimation Based on Phase Offsets Between Sample Correlations", Department of Information Technology, University of Ulm, Germany, 4 pages. |
| Yucek, Tevfik et al., "Joint Channel and Frequency Offset Estimation for OFDM Systems", University of South Florida, Raytheon Company, 6 pages. |
Cited By (5)
| Publication number | Priority date | Publication date | Assignee | Title |
|---|---|---|---|---|
| US20170013553A1 (en) * | 2015-07-09 | 2017-01-12 | Verizon Patent And Licensing Inc., | Wakeup method for devices in power saving mode |
| US9998989B2 (en) * | 2015-07-09 | 2018-06-12 | Verizon Patent And Licensing Inc. | Wakeup method for devices in power saving mode |
| US10285129B2 (en) | 2015-07-09 | 2019-05-07 | Verizon Patent And Licensing Inc. | Wakeup system and method for devices in power saving mode |
| US10785722B2 (en) | 2015-07-09 | 2020-09-22 | Verizon Patent And Licensing Inc. | Wakeup system and method for devices in power saving mode |
| US20220400439A1 (en) * | 2021-06-09 | 2022-12-15 | Verizon Patent And Licensing Inc. | Side channel mechanism for controlling data flows |
Also Published As
| Publication number | Publication date |
|---|---|
| US20160226696A1 (en) | 2016-08-04 |
| CN104753836B (en) | 2018-03-06 |
| CN104753836A (en) | 2015-07-01 |
Similar Documents
| Publication | Publication Date | Title |
|---|---|---|
| US9491024B2 (en) | Methods for frequency offset estimation with Zadoff-Chu sequences | |
| EP3453218B1 (en) | Preamble detection and time-of-arrival estimation for a single- tone frequency hopping random access preamble | |
| RU2537960C2 (en) | Method of locating terminal in network coverage area | |
| US10746845B2 (en) | Method and system of timing and localizing a radio signal | |
| US10285195B2 (en) | Processing of random access preamble sequences | |
| EP3621241B1 (en) | Uplink synchronization timing deviation determination method and device | |
| US7852909B2 (en) | Method and apparatus for estimating frequency offset and timing offset of one or more mobile stations (MSs) | |
| US8862065B2 (en) | Apparatus and method for frequency offset estimation in mobile communication system | |
| US20160277893A1 (en) | Sub-decimeter radio frequency ranging | |
| KR20120036018A (en) | Apparatus and method for frequency offset estimation for high speed in wireless communication system | |
| CN102546514B (en) | Frequency synchronization method and equipment for OFDM system | |
| US20150172089A1 (en) | Method for estimating ofdm integer frequency offset, ofdm integer frequency offset estimator and ofdm receiver system | |
| US20220404451A1 (en) | Methods and Apparatuses for Positioning in a Wireless Communications Network | |
| JP2023535372A (en) | System and method for multi-carrier phase-based localization | |
| CN111132081B (en) | Method and system for downlink synchronization of vehicle-mounted 5G equipment of high-speed train | |
| US10608861B2 (en) | Method and system for processing frequency offset | |
| CN106878213B (en) | LTE uplink frequency offset estimation method | |
| US11585916B2 (en) | Ranging using beamforming antenna weight vectors and secure ranging packet with phase tracking | |
| US9769687B2 (en) | Method and related mobile device for determining a reference signal received power | |
| US20240073833A1 (en) | Method and systems for performing 3gpp nb-iot nsss frame number and cfo detection in low snr conditions | |
| Zhang et al. | A Design of NB-IOT Random Access Preamble Receiver for Large Frequency Offset | |
| US11709241B2 (en) | Radar | |
| WO2023016654A1 (en) | Determing time of arrival based on phase measurement |
Legal Events
| Date | Code | Title | Description |
|---|---|---|---|
| AS | Assignment |
Owner name: HONG KONG APPLIED SCIENCE AND TECHNOLOGY RESEARCH Free format text: ASSIGNMENT OF ASSIGNORS INTEREST;ASSIGNORS:ZHANG, YUXIAN;ZHANG, HONGLEI;KWAN, VICTOR;AND OTHERS;REEL/FRAME:035164/0616 Effective date: 20150313 |
|
| STCF | Information on status: patent grant |
Free format text: PATENTED CASE |
|
| CC | Certificate of correction | ||
| MAFP | Maintenance fee payment |
Free format text: PAYMENT OF MAINTENANCE FEE, 4TH YEAR, LARGE ENTITY (ORIGINAL EVENT CODE: M1551); ENTITY STATUS OF PATENT OWNER: LARGE ENTITY Year of fee payment: 4 |
|
| MAFP | Maintenance fee payment |
Free format text: PAYMENT OF MAINTENANCE FEE, 8TH YEAR, LARGE ENTITY (ORIGINAL EVENT CODE: M1552); ENTITY STATUS OF PATENT OWNER: LARGE ENTITY Year of fee payment: 8 |