US9504412B2 - Method and system to derive glycemic patterns from clustering of glucose data - Google Patents
Method and system to derive glycemic patterns from clustering of glucose data Download PDFInfo
- Publication number
- US9504412B2 US9504412B2 US13/621,499 US201213621499A US9504412B2 US 9504412 B2 US9504412 B2 US 9504412B2 US 201213621499 A US201213621499 A US 201213621499A US 9504412 B2 US9504412 B2 US 9504412B2
- Authority
- US
- United States
- Prior art keywords
- glucose
- day
- range
- interval
- controller
- Prior art date
- Legal status (The legal status is an assumption and is not a legal conclusion. Google has not performed a legal analysis and makes no representation as to the accuracy of the status listed.)
- Active, expires
Links
Images


Classifications
-
- G—PHYSICS
- G01—MEASURING; TESTING
- G01N—INVESTIGATING OR ANALYSING MATERIALS BY DETERMINING THEIR CHEMICAL OR PHYSICAL PROPERTIES
- G01N27/00—Investigating or analysing materials by the use of electric, electrochemical, or magnetic means
- G01N27/26—Investigating or analysing materials by the use of electric, electrochemical, or magnetic means by investigating electrochemical variables; by using electrolysis or electrophoresis
- G01N27/28—Electrolytic cell components
- G01N27/30—Electrodes, e.g. test electrodes; Half-cells
- G01N27/327—Biochemical electrodes, e.g. electrical or mechanical details for in vitro measurements
- G01N27/3271—Amperometric enzyme electrodes for analytes in body fluids, e.g. glucose in blood
- G01N27/3273—Devices therefor, e.g. test element readers, circuitry
-
- A—HUMAN NECESSITIES
- A61—MEDICAL OR VETERINARY SCIENCE; HYGIENE
- A61B—DIAGNOSIS; SURGERY; IDENTIFICATION
- A61B5/00—Measuring for diagnostic purposes; Identification of persons
- A61B5/145—Measuring characteristics of blood in vivo, e.g. gas concentration, pH value; Measuring characteristics of body fluids or tissues, e.g. interstitial fluid, cerebral tissue
- A61B5/1486—Measuring characteristics of blood in vivo, e.g. gas concentration, pH value; Measuring characteristics of body fluids or tissues, e.g. interstitial fluid, cerebral tissue using enzyme electrodes, e.g. with immobilised oxidase
-
- A—HUMAN NECESSITIES
- A61—MEDICAL OR VETERINARY SCIENCE; HYGIENE
- A61B—DIAGNOSIS; SURGERY; IDENTIFICATION
- A61B5/00—Measuring for diagnostic purposes; Identification of persons
- A61B5/145—Measuring characteristics of blood in vivo, e.g. gas concentration, pH value; Measuring characteristics of body fluids or tissues, e.g. interstitial fluid, cerebral tissue
- A61B5/14532—Measuring characteristics of blood in vivo, e.g. gas concentration, pH value; Measuring characteristics of body fluids or tissues, e.g. interstitial fluid, cerebral tissue for measuring glucose, e.g. by tissue impedance measurement
-
- A—HUMAN NECESSITIES
- A61—MEDICAL OR VETERINARY SCIENCE; HYGIENE
- A61B—DIAGNOSIS; SURGERY; IDENTIFICATION
- A61B5/00—Measuring for diagnostic purposes; Identification of persons
- A61B5/145—Measuring characteristics of blood in vivo, e.g. gas concentration, pH value; Measuring characteristics of body fluids or tissues, e.g. interstitial fluid, cerebral tissue
- A61B5/1468—Measuring characteristics of blood in vivo, e.g. gas concentration, pH value; Measuring characteristics of body fluids or tissues, e.g. interstitial fluid, cerebral tissue using chemical or electrochemical methods, e.g. by polarographic means
- A61B5/1477—Measuring characteristics of blood in vivo, e.g. gas concentration, pH value; Measuring characteristics of body fluids or tissues, e.g. interstitial fluid, cerebral tissue using chemical or electrochemical methods, e.g. by polarographic means non-invasive
-
- A—HUMAN NECESSITIES
- A61—MEDICAL OR VETERINARY SCIENCE; HYGIENE
- A61B—DIAGNOSIS; SURGERY; IDENTIFICATION
- A61B5/00—Measuring for diagnostic purposes; Identification of persons
- A61B5/145—Measuring characteristics of blood in vivo, e.g. gas concentration, pH value; Measuring characteristics of body fluids or tissues, e.g. interstitial fluid, cerebral tissue
- A61B5/1486—Measuring characteristics of blood in vivo, e.g. gas concentration, pH value; Measuring characteristics of body fluids or tissues, e.g. interstitial fluid, cerebral tissue using enzyme electrodes, e.g. with immobilised oxidase
- A61B5/14865—Measuring characteristics of blood in vivo, e.g. gas concentration, pH value; Measuring characteristics of body fluids or tissues, e.g. interstitial fluid, cerebral tissue using enzyme electrodes, e.g. with immobilised oxidase invasive, e.g. introduced into the body by a catheter or needle or using implanted sensors
-
- A—HUMAN NECESSITIES
- A61—MEDICAL OR VETERINARY SCIENCE; HYGIENE
- A61B—DIAGNOSIS; SURGERY; IDENTIFICATION
- A61B5/00—Measuring for diagnostic purposes; Identification of persons
- A61B5/15—Devices for taking samples of blood
- A61B5/150007—Details
- A61B5/150015—Source of blood
- A61B5/150022—Source of blood for capillary blood or interstitial fluid
-
- A—HUMAN NECESSITIES
- A61—MEDICAL OR VETERINARY SCIENCE; HYGIENE
- A61B—DIAGNOSIS; SURGERY; IDENTIFICATION
- A61B5/00—Measuring for diagnostic purposes; Identification of persons
- A61B5/15—Devices for taking samples of blood
- A61B5/150007—Details
- A61B5/150847—Communication to or from blood sampling device
- A61B5/150854—Communication to or from blood sampling device long distance, e.g. between patient's home and doctor's office
-
- A—HUMAN NECESSITIES
- A61—MEDICAL OR VETERINARY SCIENCE; HYGIENE
- A61B—DIAGNOSIS; SURGERY; IDENTIFICATION
- A61B5/00—Measuring for diagnostic purposes; Identification of persons
- A61B5/15—Devices for taking samples of blood
- A61B5/150007—Details
- A61B5/150847—Communication to or from blood sampling device
- A61B5/150862—Communication to or from blood sampling device intermediate range, e.g. within room or building
-
- A—HUMAN NECESSITIES
- A61—MEDICAL OR VETERINARY SCIENCE; HYGIENE
- A61B—DIAGNOSIS; SURGERY; IDENTIFICATION
- A61B5/00—Measuring for diagnostic purposes; Identification of persons
- A61B5/15—Devices for taking samples of blood
- A61B5/150007—Details
- A61B5/150847—Communication to or from blood sampling device
- A61B5/15087—Communication to or from blood sampling device short range, e.g. between console and disposable
-
- A—HUMAN NECESSITIES
- A61—MEDICAL OR VETERINARY SCIENCE; HYGIENE
- A61B—DIAGNOSIS; SURGERY; IDENTIFICATION
- A61B5/00—Measuring for diagnostic purposes; Identification of persons
- A61B5/15—Devices for taking samples of blood
- A61B5/155—Devices specially adapted for continuous or multiple sampling, e.g. at predetermined intervals
-
- A—HUMAN NECESSITIES
- A61—MEDICAL OR VETERINARY SCIENCE; HYGIENE
- A61B—DIAGNOSIS; SURGERY; IDENTIFICATION
- A61B5/00—Measuring for diagnostic purposes; Identification of persons
- A61B5/15—Devices for taking samples of blood
- A61B5/157—Devices characterised by integrated means for measuring characteristics of blood
-
- A—HUMAN NECESSITIES
- A61—MEDICAL OR VETERINARY SCIENCE; HYGIENE
- A61B—DIAGNOSIS; SURGERY; IDENTIFICATION
- A61B5/00—Measuring for diagnostic purposes; Identification of persons
- A61B5/48—Other medical applications
- A61B5/4836—Diagnosis combined with treatment in closed-loop systems or methods
- A61B5/4839—Diagnosis combined with treatment in closed-loop systems or methods combined with drug delivery
-
- A—HUMAN NECESSITIES
- A61—MEDICAL OR VETERINARY SCIENCE; HYGIENE
- A61B—DIAGNOSIS; SURGERY; IDENTIFICATION
- A61B5/00—Measuring for diagnostic purposes; Identification of persons
- A61B5/74—Details of notification to user or communication with user or patient ; user input means
- A61B5/7455—Details of notification to user or communication with user or patient ; user input means characterised by tactile indication, e.g. vibration or electrical stimulation
-
- A—HUMAN NECESSITIES
- A61—MEDICAL OR VETERINARY SCIENCE; HYGIENE
- A61M—DEVICES FOR INTRODUCING MEDIA INTO, OR ONTO, THE BODY; DEVICES FOR TRANSDUCING BODY MEDIA OR FOR TAKING MEDIA FROM THE BODY; DEVICES FOR PRODUCING OR ENDING SLEEP OR STUPOR
- A61M5/00—Devices for bringing media into the body in a subcutaneous, intra-vascular or intramuscular way; Accessories therefor, e.g. filling or cleaning devices, arm-rests
- A61M5/14—Infusion devices, e.g. infusing by gravity; Blood infusion; Accessories therefor
- A61M5/168—Means for controlling media flow to the body or for metering media to the body, e.g. drip meters, counters ; Monitoring media flow to the body
- A61M5/172—Means for controlling media flow to the body or for metering media to the body, e.g. drip meters, counters ; Monitoring media flow to the body electrical or electronic
- A61M5/1723—Means for controlling media flow to the body or for metering media to the body, e.g. drip meters, counters ; Monitoring media flow to the body electrical or electronic using feedback of body parameters, e.g. blood-sugar, pressure
-
- C—CHEMISTRY; METALLURGY
- C12—BIOCHEMISTRY; BEER; SPIRITS; WINE; VINEGAR; MICROBIOLOGY; ENZYMOLOGY; MUTATION OR GENETIC ENGINEERING
- C12Q—MEASURING OR TESTING PROCESSES INVOLVING ENZYMES, NUCLEIC ACIDS OR MICROORGANISMS; COMPOSITIONS OR TEST PAPERS THEREFOR; PROCESSES OF PREPARING SUCH COMPOSITIONS; CONDITION-RESPONSIVE CONTROL IN MICROBIOLOGICAL OR ENZYMOLOGICAL PROCESSES
- C12Q1/00—Measuring or testing processes involving enzymes, nucleic acids or microorganisms; Compositions therefor; Processes of preparing such compositions
- C12Q1/001—Enzyme electrodes
- C12Q1/005—Enzyme electrodes involving specific analytes or enzymes
- C12Q1/006—Enzyme electrodes involving specific analytes or enzymes for glucose
-
- G—PHYSICS
- G01—MEASURING; TESTING
- G01N—INVESTIGATING OR ANALYSING MATERIALS BY DETERMINING THEIR CHEMICAL OR PHYSICAL PROPERTIES
- G01N27/00—Investigating or analysing materials by the use of electric, electrochemical, or magnetic means
- G01N27/26—Investigating or analysing materials by the use of electric, electrochemical, or magnetic means by investigating electrochemical variables; by using electrolysis or electrophoresis
- G01N27/28—Electrolytic cell components
- G01N27/30—Electrodes, e.g. test electrodes; Half-cells
- G01N27/327—Biochemical electrodes, e.g. electrical or mechanical details for in vitro measurements
- G01N27/3271—Amperometric enzyme electrodes for analytes in body fluids, e.g. glucose in blood
- G01N27/3272—Test elements therefor, i.e. disposable laminated substrates with electrodes, reagent and channels
-
- G—PHYSICS
- G16—INFORMATION AND COMMUNICATION TECHNOLOGY [ICT] SPECIALLY ADAPTED FOR SPECIFIC APPLICATION FIELDS
- G16H—HEALTHCARE INFORMATICS, i.e. INFORMATION AND COMMUNICATION TECHNOLOGY [ICT] SPECIALLY ADAPTED FOR THE HANDLING OR PROCESSING OF MEDICAL OR HEALTHCARE DATA
- G16H50/00—ICT specially adapted for medical diagnosis, medical simulation or medical data mining; ICT specially adapted for detecting, monitoring or modelling epidemics or pandemics
- G16H50/20—ICT specially adapted for medical diagnosis, medical simulation or medical data mining; ICT specially adapted for detecting, monitoring or modelling epidemics or pandemics for computer-aided diagnosis, e.g. based on medical expert systems
-
- A—HUMAN NECESSITIES
- A61—MEDICAL OR VETERINARY SCIENCE; HYGIENE
- A61B—DIAGNOSIS; SURGERY; IDENTIFICATION
- A61B5/00—Measuring for diagnostic purposes; Identification of persons
- A61B5/0002—Remote monitoring of patients using telemetry, e.g. transmission of vital signals via a communication network
- A61B5/0015—Remote monitoring of patients using telemetry, e.g. transmission of vital signals via a communication network characterised by features of the telemetry system
- A61B5/0022—Monitoring a patient using a global network, e.g. telephone networks, internet
-
- A—HUMAN NECESSITIES
- A61—MEDICAL OR VETERINARY SCIENCE; HYGIENE
- A61B—DIAGNOSIS; SURGERY; IDENTIFICATION
- A61B5/00—Measuring for diagnostic purposes; Identification of persons
- A61B5/0002—Remote monitoring of patients using telemetry, e.g. transmission of vital signals via a communication network
- A61B5/0031—Implanted circuitry
-
- A—HUMAN NECESSITIES
- A61—MEDICAL OR VETERINARY SCIENCE; HYGIENE
- A61B—DIAGNOSIS; SURGERY; IDENTIFICATION
- A61B5/00—Measuring for diagnostic purposes; Identification of persons
- A61B5/15—Devices for taking samples of blood
- A61B5/150007—Details
- A61B5/150358—Strips for collecting blood, e.g. absorbent
Definitions
- Diabetes mellitus is a chronic metabolic disorder caused by an inability of the pancreas to produce sufficient amounts of the hormone drug so that the metabolism is unable to provide for the proper absorption of sugar and starch.
- This failure leads to hyperglycemia, i.e. the presence of an excessive amount of analyte within the blood plasma.
- Persistent hyperglycemia has been associated with a variety of serious symptoms and life threatening long term complications such as dehydration, ketoacidosis, diabetic coma, cardiovascular diseases, chronic renal failure, retinal damage and nerve damages with the risk of amputation of extremities. Because healing is not yet possible, a permanent therapy is necessary which provides constant glycemic control in order to always maintain the level of blood analyte within normal limits. Such glycemic control is achieved by regularly supplying external drug to the body of the patient to thereby reduce the elevated levels of blood analyte.
- An external drug was commonly administered by means of multiple, daily injections of a mixture of rapid and intermediate acting drugs via a hypodermic syringe. While this treatment does not require the frequent estimation of blood analyte, it has been found that the degree of glycemic control achievable in this way is suboptimal because the delivery is unlike physiological drug production, according to which drug enters the bloodstream at a lower rate and over a more extended period of time. Improved glycemic control may be achieved by the so-called intensive drug therapy which is based on multiple daily injections, including one or two injections per day of long acting drug for providing basal drug and additional injections of rapidly acting drug before each meal in an amount proportional to the size of the meal. Although traditional syringes have at least partly been replaced by drug pens, the frequent injections are nevertheless very inconvenient for the patient, particularly those who are incapable of reliably self-administering injections.
- the drug delivery device allows for the delivery of drug in a manner that bears greater similarity to the naturally occurring physiological processes and can be controlled to follow standard or individually modified protocols to give the patient better glycemic control.
- Drug delivery devices can be constructed as an implantable device for subcutaneous arrangement or can be constructed as an external device with an infusion set for subcutaneous infusion to the patient via the transcutaneous insertion of a catheter, cannula or a transdermal drug transport such as through a patch.
- External drug delivery devices are mounted on clothing, hidden beneath or inside clothing, or mounted on the body and are generally controlled via a user interface built-in to the device or on a separate remote device.
- Drug delivery devices have been utilized to assist in the management of diabetes by infusing drug or a suitable biologically effective material into the diabetic patient at a basal rate with additional drug or “bolus” to account for meals or high analyte values, levels or concentrations.
- the drug delivery device is connected to an infuser, better known as an infusion set by a flexible hose.
- the infuser typically has a subcutaneous cannula, adhesive backed mount on which the cannula is attached thereto.
- the cannula may include a quick disconnect to allow the cannula and mount to remain in place on the skin surface of the user while the flexible tubing is disconnected from the infuser.
- blood analyte monitoring is required to achieve acceptable glycemic control.
- delivery of suitable amounts of drug by the drug delivery device requires that the patient frequently determines his or her blood analyte level and manually input this value into a user interface for the external pump, which then calculates a suitable modification to the default or currently in-use drug delivery protocol, i.e. dosage and timing, and subsequently communicates with the drug delivery device to adjust its operation accordingly.
- the determination of blood analyte concentration is typically performed by means of an episodic measuring device such as a hand-held electronic meter which receives blood samples via enzyme-based test strips and calculates the blood analyte value based on the enzymatic reaction.
- Paper logbooks are not necessarily always carried by an individual and may not be accurately completed when required. Such paper logbooks are small and it is therefore difficult to enter detailed information requiring detailed descriptors of lifestyle events. Furthermore, an individual may often forget key facts about their lifestyle when questioned by a physician who has to manually review and interpret information from a hand-written notebook. There is no analysis provided by the paper logbook to distill or separate the component information. Also, there are no graphical reductions or summary of the information. Entry of data into a secondary data storage system, such as a database or other electronic systems, requires a laborious transcription of information, including lifestyle data, into this secondary data storage. Difficulty of data recordation encourages retrospective entry of pertinent information that results in inaccurate and incomplete records.
- a system for management of diabetes of a subject includes at least one glucose monitor and a controller operatively connected to the at least one glucose monitor.
- the at least one glucose monitor is configured to measure a glucose concentration based on an enzymatic reaction with physiological fluid in a biosensor that provides an electrical signal representative of the glucose concentration.
- the controller is in communication with at least one glucose monitor and configured to receive or transmit glucose data representative of glucose levels measured by the glucose monitor over a predetermined time period to determine plural clusters of glucose data with respect to glucose levels and the predetermined time so that the glucose levels with reference to a predetermined time period are correlated to each other in a cluster due to their similarity as compared to glucose levels in other clusters.
- the controller annunciates a message whenever at least a cluster in which a number (N) of glucose measurements of each cluster is divided into a total number of days (D) on which the glucose measurements were taken in a specific time interval of a day (SID) and the result (N/D) divided into the specific time interval in a day (SID) is less than a predetermined threshold so that the subject is notified that the number of glucose measurements is less than optimum for management of diabetes.
- N number of glucose measurements of each cluster is divided into a total number of days (D) on which the glucose measurements were taken in a specific time interval of a day (SID) and the result (N/D) divided into the specific time interval in a day (SID) is less than a predetermined threshold so that the subject is notified that the number of glucose measurements is less than optimum for management of diabetes.
- a system for management of diabetes of a subject includes at least one glucose monitor and a controller.
- the at least one glucose monitor is configured to measure a glucose concentration based on an enzymatic reaction with physiological fluid in a biosensor that provides an electrical signal representative of the glucose concentration.
- the controller is in communication with at least one glucose monitor, and configured to receive or transmit glucose data representative of glucose levels measured by the glucose monitor over a predetermined time period to determine plural clusters of glucose data with respect to glucose levels so that the glucose levels with reference to a predetermined time period are correlated to each other in a cluster due to their similarity as compared to glucose levels in other clusters and at least three clusters of glucose levels are provided to indicate the distribution of the glucose levels.
- the controller annunciates an indication of the distribution of the at least three clusters into respective first range, second range, and third range of glucose values.
- a method for managing diabetes of a user with at least a glucose monitor and an infusion pump which are coupled to controller is provided.
- the method can be achieved by: conducting a plurality of glucose measurements over time with the at least one glucose monitor; collating the plurality of glucose measurements into clusters for a predetermined time period; in the event that the clusters indicate gaps in the glucose measurements during the predetermined time period, annunciating such gaps to the user; in the event that the clusters indicate that the clusters are converging towards a certain range of glucose values, annunciating that the clusters are trending towards such range; or in the event that the clusters indicate three different ranges of glucose values in which one cluster has a boundary greater than 180 mg/dL, annunciating to the user a glucose range that is intermediate in value between 180 mg/dL and the boundary.
- the annunciating of gaps comprises informing the user whenever at least a cluster in which a number (N) of glucose measurements of each cluster is divided into a total number of days (D) on which the glucose measurements were taken in a specific time interval of a day (SID) and the result (N/D) divided into the specific time interval in a day (SID) is less than a predetermined threshold;
- the specific time interval in a day comprises at least one of an overnight interval from about 10 PM to about 6 AM; a day interval from about 6 AM to about 5 PM; or a night interval from about 5 PM to about 10 PM;
- the predetermined threshold for the night interval comprises about 0.17 tests per hour-day;
- the predetermined threshold for the day interval comprises about 0.095 tests per hour-day;
- the message comprises a suggestion of which specific time interval to obtain more glucose measurements;
- the first range of glucose values comprises a minimum greater than a maximum of the
- FIG. 1 illustrates an exemplary embodiment of the diabetic management system.
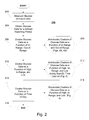
- FIG. 2 illustrates an exemplary logic 200 of the technique utilized by the system of FIG. 1 .
- FIG. 3A illustrates the clustering technique 300 utilized by the logic of FIG. 2 .
- FIGS. 3B, 3C, 3D, and 3E illustrate a simplified example of the clustering technique of FIG. 3 .
- FIGS. 4A and 4B illustrate outputs of insights gleaned from trends or convergence of the glucose measurement data with clustering of the data.
- FIG. 5 illustrates an output to show gaps in the glucose measurements with the use of clustering of glucose data.
- FIG. 6 illustrates an output of where the patient's glucose data fall into three different clusters as compared to the expected range of glucose measurements for a person with diabetes.
- the terms “about” or “approximately” for any numerical values or ranges indicate a suitable dimensional tolerance that allows the part or collection of components to function for its intended purpose as described herein.
- the terms “patient,” “host,” “user,” and “subject” refer to any human or animal subject and are not intended to limit the systems or methods to human use, although use of the subject invention in a human patient represents a preferred embodiment.
- the term “user” includes not only the patient using a drug infusion device but also the caretakers (e.g., parent or guardian, nursing staff or home care employee).
- the term “drug” may include pharmaceuticals or other chemicals that causes a biological response in the body of a user or patient.
- FIG. 1 illustrates a drug delivery system 100 according to an exemplary embodiment.
- Drug delivery system 100 includes a drug delivery device 102 and a remote controller 104 .
- Drug delivery device 102 is connected to an infusion set 106 via flexible tubing 108 .
- Drug delivery device 102 is configured to transmit and receive data to and from remote controller 104 by, for example, radio frequency communication 110 .
- Drug delivery device 102 may also function as a stand-alone device with its own built in micro controller or controller.
- drug delivery device 102 is a drug infusion device and remote controller 104 is a hand-held portable controller.
- data transmitted from drug delivery device 102 to remote controller 104 may include information such as, for example, drug delivery data, blood glucose information, basal, bolus, insulin to carbohydrates ratio or insulin sensitivity factor, to name a few.
- the controller 104 may be configured to receive continuous analyte readings from a continuous analyte (“CGM”) sensor 112 .
- CGM continuous analyte
- Data transmitted from remote controller 104 to drug delivery device 102 may include analyte test results and a food database to allow the drug delivery device 102 to calculate the amount of drug to be delivered by drug delivery device 102 .
- the remote controller 104 may perform dosing or bolus calculation and send the results of such calculations to the drug delivery device 102 .
- an episodic blood analyte meter 114 may be used alone or in conjunction with the CGM sensor 112 to provide data to either or both of the controller 104 and drug delivery device 102 .
- the remote controller 104 may be combined with the meter 114 into either (a) an integrated monolithic device; or (b) two separable devices that are dockable with each other to form an integrated device.
- a microcontroller can be in the form of a mixed signal microprocessor (MSP) for each of the devices 102 , 104 , or 114 .
- MSP mixed signal microprocessor
- Such MSP may be, for example, the Texas Instrument MSP 430, as described in patent application publication numbers US2010-0332445, and US2008-0312512 which are incorporated by reference in their entirety herein and attached hereto the Appendix of this application.
- the MSP 430 or the pre-existing microprocessor of each of these devices can be configured to also perform the method described and illustrated herein.
- the measurement of glucose can be based on a physical transformation (i.e., the selective oxidation) of glucose by the enzyme glucose oxidase (GO).
- GO glucose oxidase
- the reactions that can occur in such biosensor are summarized below in Equations 1 and 2.
- glucose is oxidized to gluconic acid by the oxidized form of glucose oxidase (GO (ox) ).
- GO (ox) may also be referred to as an “oxidized enzyme.”
- the oxidized enzyme GO (ox) is transformed to its reduced state, which is denoted as GO (red) (i.e., “reduced enzyme”).
- the reduced enzyme GO (red) is re-oxidized back to GO (ox) by reaction with Fe(CN) 6 3 ⁇ (referred to as either the oxidized mediator or ferricyanide) as illustrated in Equation 2.
- Fe(CN) 6 3 ⁇ is reduced to Fe(CN) 6 4 ⁇ (referred to as either reduced mediator or ferrocyanide).
- a test current can be created by the electrochemical re-oxidation of the reduced mediator at the electrode surface.
- a mediator such as ferricyanide
- ferricyanide is a compound that accepts electrons from an enzyme such as glucose oxidase and then donates the electrons to an electrode.
- the concentration of glucose in the sample increases, the amount of reduced mediator formed also increases; hence, there is a direct relationship between the test current, resulting from the re-oxidation of reduced mediator, and glucose concentration.
- the transfer of electrons across the electrical interface results in the flow of a test current (2 moles of electrons for every mole of glucose that is oxidized).
- the test current resulting from the introduction of glucose can, therefore, be referred to as a glucose current.
- Analyte levels or concentrations can also be determined by the use of the CGM sensor 112 .
- the CGM sensor 112 utilizes amperometric electrochemical sensor technology to measure analyte with three electrodes operably connected to the sensor electronics and are covered by a sensing membrane and a biointerface membrane, which are attached by a clip. The top ends of the electrodes are in contact with an electrolyte phase (not shown), which may include a free-flowing fluid phase disposed between the sensing membrane and the electrodes.
- the sensing membrane may include an enzyme, e.g., analyte oxidase, which covers the electrolyte phase.
- the counter electrode is provided to balance the current generated by the species being measured at the working electrode.
- analyte oxidase based glucose sensor the species being measured at the working electrode is H 2 O 2 .
- the current that is produced at the working electrode (and flows through the circuitry to the counter electrode) is proportional to the diffusional flux of H 2 O 2 . Accordingly, a raw signal may be produced that is representative of the concentration of blood glucose in the user's body, and therefore may be utilized to estimate a meaningful blood glucose value. Details of the sensor and associated components are shown and described in U.S. Pat. No. 7,276,029, which is incorporated by reference herein as if fully set forth herein this application.
- a continuous analyte sensor from the Dexcom Seven System can also be utilized with the exemplary embodiments described herein.
- Drug delivery device 102 may also be configured for bi-directional wireless communication with a remote health monitoring station 116 through, for example, a wireless communication network 118 .
- Remote controller 104 and remote monitoring station 116 may be configured for bi-directional wired communication through, for example, a telephone land based communication network.
- Remote monitoring station 116 may be used, for example, to download upgraded software to drug delivery device 102 and to process information from drug delivery device 102 .
- Examples of remote monitoring station 116 may include, but are not limited to, a personal or networked computer, a personal digital assistant, other mobile telephone, a hospital base monitoring station or a dedicated remote clinical monitoring station.
- Drug delivery device 102 includes processing electronics including a central processing unit and memory elements for storing control programs and operation data, a radio frequency module 116 for sending and receiving communication signals (i.e., messages) to/from remote controller 104 , a display for providing operational information to the user, a plurality of navigational buttons for the user to input information, a battery for providing power to the system, an alarm (e.g., visual, auditory or tactile) for providing feedback to the user, a vibrator for providing feedback to the user, a drug delivery mechanism (e.g. a drug pump and drive mechanism) for forcing a drug from a drug reservoir (e.g., a drug cartridge) through a side port connected to an infusion set 106 and into the body of the user.
- a drug delivery mechanism e.g. a drug pump and drive mechanism
- the components of the system described in relation to FIG. 1 are helpful to the person with diabetes in managing their disease. However, to achieve the efficacy in management of the disease, the person with diabetes would need more than just these components. As applicant has recognized, the component or the system must be able to provide easy to understand information that assist in the decision making of the person. To assist in this, applicant has devised a system that provides insights into the glucose measurements obtained for management of diabetes of a subject.
- a controller 104 is set up to be in communication with at least one glucose monitor (SMBG, CGM, or both).
- the controller 104 is configured to receive or transmit glucose data representative of glucose levels measured by the glucose monitor over a predetermined time period.
- the controller 104 in accordance with the logic 200 of FIG. 2 , is able to determine clusters of glucose data with respect to glucose levels and the predetermined time so that the glucose levels with reference to a predetermined time period are correlated to each other in a cluster due to their similarity as compared to glucose levels in other clusters.
- the logic 200 begins with measurements of glucose data with the glucose monitor at step 202 .
- the glucose data may include more than just the glucose concentration such as, for example, date, time, user's flags and other suitable records related to diabetes.
- the discussion will use glucose data but it should be clear that the embodiments herein are not limited to solely glucose measurements.
- the data is obtained by the controller 104 for a defined reporting period, such as, for example, in the last 7 days, 21 days, 30 days or any number of days as set by the user.
- the collated data from step 204 is “clustered” using a suitable cluster determination technique, such as, for example, the “K-mean clustering” technique.
- K means clustering
- K-means clustering is a technique to classify or to group your data objects as a function of attributes into k group where k is a positive integer number. The technique involves finding and minimizing the sum of squares of distances between data objects and one or more centroids of the data objects. Additional details of the technique are shown and described in “Algorithm AS 136: A K-Means Clustering Algorithm” by J. A. Hartigan and M. A. Wong Journal of the Royal Statistical Society. Series C ( Applied Statistics ) Vol. 28, No. 1 (1979), pp.
- the technique involves the following steps shown in process 300 of FIG. 3A .
- arbitrary K points can be placed into space represented by the glucose measurements with respect to time so that these K points represent initial group centroids. This can be seen in the example of FIG. 3B where four data points O 1 , O 2 , O 3 , and O 4 are utilized for brevity in this example.
- two centroids K 1 and K 2 are arbitrarily selected in FIG. 3C . The distance from data point O 3 to K 1 and K 2 are calculated along with the distance from O 4 and K 1 and K 2 are calculated.
- the glucose data O 1 , O 2 , O 3 , and O 4 are assigned based on the minimum distance to the centroids K 1 and K 2 .
- the glucose measurement O 1 is within Group 1 in which K 1 is also the centroid for Group 1 .
- Measurements O 2 , O 3 , and O 4 are part of group 2 closest to centroid K 1 .
- step 306 after all glucose measurements have been assigned to the closest respective centroids, recalculate the position of the K-centroids and relocate the centroids if needed to ensure the minimum distance between the data points and the relevant centroid(s).
- Group 2 has three members (O 2 , O 3 , and O 4 ), then the centroid of Group 2 (denoted by K 2 ′) is the average distance between the three members (3.7 hours by 2.7 mMol/dL).
- the minimum distance from each data object to the centroids is calculated and the minimum distance is calculated from each object to the new centroid K 2 ′. Due to the minimum distance from O 2 to centroid K 1 , O 2 belongs to Group 1 .
- a new centroid K 1 ′ is calculated based on the average distance between members O 1 and O 2 and designated in FIG. 3E .
- a new centroid K 2 ′′ is calculated based on the average distance between members O 3 and O 4 being in Group 2 . Steps 304 and 306 are repeated until the centroids can no longer be relocated in order to meet the minimum distance rule.
- the centroid K 1 ′ and K 2 ′′ do not move any longer as these centroids have reached a local optima while also satisfy the requirements of the clustering algorithm. This produces a separation of the objects into groups (e.g., Groups 1 and 2 of FIG. 3E ) based on a rational basis for this clustering.
- each of the clusters may include glucose measurements with respect specific time intervals within the predetermined time period so that an indication of a distribution of at least one cluster within one of the first, second and third ranges is annunciated, e.g., FIG. 4A or 4B .
- the term “annunciated” and variations on the root term indicate that an announcement may be provided via text, audio, visual or a combination of all modes of communication to a user, a caretaker of the user or a healthcare provider.
- a suggested testing frequency can be identified from a standard mapping taking into account the time of day and length of timeslot from, for example, Table 1.
- the timeslot For a timeslot closest to Night that spanned 4 hours, and had 10 tests over a 14 day period, the timeslot would average 0.71 tests/day, and over the 4 hours, the timeslot would average 0.179 tests/hour-day. This is above the limit of 0.1667 tests/hour-Day and would be considered sufficient.
- the timeslot For a timeslot closest to Day that spanned 6 hours, and had 8 tests over a 14 day period, the timeslot would average 0.57 tests/day, and over the 6 hours, the timeslot would average 0.095 tests/hour-day. This is above the limit of 0.095 tests/hour-Day and would be considered insufficient.
- the message would indicate the timeslot, and how many more readings each week that should be added to reach adequacy. For example, the system may output “you have inadequate testing from 12 PM-6 PM. You should test 0.5 times more each week in this timeslot to reach adequacy.”
- the visualization would highlight the timeslot that required more testing indicating target tests/week for each timeslot and actual tests per week in each timeslot, such as, for example, visually in FIG. 5 or textually in Table II.
- areas 502 , 504 , 506 , and 508 can be used by the system to indicate that there are gaps in when the user has conducted glucose measurements.
- this visualization can be used by the user or HCP to determine whether there are problems with the CGM data due to gaps in the output data.
- a textual indication can be provided to the user that actual glucose measurements at 4.2 measurements per week do not meet the recommended tests per week (e.g., 5.25) during a specific time interval from 12 AM to 6 AM and that the actual measurements at 4.2 tests per week do not meet the recommended measurements per week during the specific time interval from 12 PM to 6 PM during a predetermined range of time (e.g., one-week).
- the recommended tests per week e.g., 5.25
- the controller 104 may annunciate a message whenever at least a cluster in which a number (N) of glucose measurements of each cluster is divided into a total number of days (D) on which the glucose measurements were taken in a specific time interval of a day (SID) and the result (N/D) divided into the specific time interval in a day (SID) is less than a predetermined threshold so that the subject is notified that the number of glucose measurements is less than optimum for management of diabetes.
- N number of glucose measurements of each cluster is divided into a total number of days (D) on which the glucose measurements were taken in a specific time interval of a day (SID) and the result (N/D) divided into the specific time interval in a day (SID) is less than a predetermined threshold so that the subject is notified that the number of glucose measurements is less than optimum for management of diabetes.
- the specific time interval in a day may include at least one of an overnight interval from about 10 PM to about 6 AM; a day interval from about 6 AM to about 5 PM; or a night interval from about 5 PM to about 10 PM; the predetermined threshold for the night interval may include about 0.17 tests per hour-day; the predetermined threshold for the day interval may include about 0.095 tests per hour-day.
- a target range is often used to categorize a specific SMBG reading as being good or bad for a patient.
- doctors may customize the range.
- bringing their glucose under control and into the suggested range can seem daunting, especially when a patient is initially out of control with respect to glucose.
- the controller 104 can determine clusters of glucose data with respect to glucose levels such that at least three clusters of glucose levels are provided to indicate the distribution of the glucose levels.
- the technique will always identify 3 clusters of data but these clusters are not fixed to specific ranges but rather are defined by the three clusters themselves.
- the measurements are collated into the following 3 clusters: High Cluster 602 (ranging from about 225-335 mg/dL); a Mid-Range cluster 604 (ranging from about 80 mg/dL-225 mg/dL); and a Low Cluster 606 (ranging from about 45 mg/dL-50 mg/dL).
- the users' mid-range cluster 604 falls at about 80 mg/dL to about 225 mg/dL. It is noted that an ideal range would have all users managing to a range of about 70 mg/dL-130 mg/dL.
- the logic could compare user's current high end of the mid-range cluster to the ideal.
- the glucose concentration of 225 mg/dL would be compared to the ideal 130 mg/dL.
- Changing a subject's glucose concentration from 225 mg/dL down to 130 mg/dL may seem like a daunting task, and the system may suggest a 10% improvement over the current clustering, and recommend a high range of 202 mg/dL for now. This smaller goal improvement may be more manageable for the user, and the analysis would be re-run, and should be more tightly controlled data in the future after the user has better managed to the new recommended range.
- the logic could compare the user's current low-end of the mid-range cluster to the ideal. In this case, 80 would be compared to 70. For the system to maintain adequate safeguard against triggering an indication of hypoglycemia, it might not be desirable to make the low higher than the ideal low of 70. As such, the system would recommend 70 mg/dL as the low range (i.e., simply recommending the ideal target).
- the system's logic can be run separately on pre-meal and post-meal data to provide recommended ranges for these categorizations of glucose readings.
- the logic can be run on older data sets to show progress over time.
- the logic may use the linear distance in SMBG or CGM readings for analysis, or it can use adjusted values intended to scale SMBG or CGM readings more appropriately.
Abstract
Description
Glucose+GO(ox)→Gluconic Acid+GO(red) Eq. 1
GO(red)+2Fe(CN)6 3−→GO(ox)+2Fe(CN)6 4− Eq. 2
| TABLE I | |||
| Time of Day | Tests/hour-Day | ||
| Overnight (10 PM-6 AM) | 0.125 Tests/hour-Day | ||
| Day (6 AM-5 PM) | 0.1 Tests/hour-Day | ||
| Night (5 PM-10 PM) | 0.1667 Tests/hour-Day | ||
| TABLE II | ||||||||
| 12 AM-6 |
6 AM-8 AM | 8 AM-10 AM | 10 AM-12 PM | 12 PM-6 |
6 PM-9 PM | 9 PM-12 AM | ||
| Tests/Wk | 4.2 | 2 | 1.5 | 1.5 | 4 | 3.75 | 3 |
| Recommended | 5.25 | 1.4 | 1.4 | 1.47 | 4.2 | 3.5 | 2.625 |
| Tests/Wk | |||||||
Claims (11)
Priority Applications (2)
| Application Number | Priority Date | Filing Date | Title |
|---|---|---|---|
| US13/621,499 US9504412B2 (en) | 2012-09-17 | 2012-09-17 | Method and system to derive glycemic patterns from clustering of glucose data |
| US15/355,198 US20170067846A1 (en) | 2012-09-17 | 2016-11-18 | Method and system to derive glycemic patterns from clustering of glucose data |
Applications Claiming Priority (1)
| Application Number | Priority Date | Filing Date | Title |
|---|---|---|---|
| US13/621,499 US9504412B2 (en) | 2012-09-17 | 2012-09-17 | Method and system to derive glycemic patterns from clustering of glucose data |
Related Child Applications (1)
| Application Number | Title | Priority Date | Filing Date |
|---|---|---|---|
| US15/355,198 Division US20170067846A1 (en) | 2012-09-17 | 2016-11-18 | Method and system to derive glycemic patterns from clustering of glucose data |
Publications (2)
| Publication Number | Publication Date |
|---|---|
| US20140081103A1 US20140081103A1 (en) | 2014-03-20 |
| US9504412B2 true US9504412B2 (en) | 2016-11-29 |
Family
ID=50275161
Family Applications (2)
| Application Number | Title | Priority Date | Filing Date |
|---|---|---|---|
| US13/621,499 Active 2035-07-02 US9504412B2 (en) | 2012-09-17 | 2012-09-17 | Method and system to derive glycemic patterns from clustering of glucose data |
| US15/355,198 Abandoned US20170067846A1 (en) | 2012-09-17 | 2016-11-18 | Method and system to derive glycemic patterns from clustering of glucose data |
Family Applications After (1)
| Application Number | Title | Priority Date | Filing Date |
|---|---|---|---|
| US15/355,198 Abandoned US20170067846A1 (en) | 2012-09-17 | 2016-11-18 | Method and system to derive glycemic patterns from clustering of glucose data |
Country Status (1)
| Country | Link |
|---|---|
| US (2) | US9504412B2 (en) |
Cited By (2)
| Publication number | Priority date | Publication date | Assignee | Title |
|---|---|---|---|---|
| US20100047745A1 (en) * | 2006-07-19 | 2010-02-25 | Thomas Bergqwist | Mobile Apparatus, Method And System For Processing Blood Sugar Affecting Factors |
| US20170067846A1 (en) * | 2012-09-17 | 2017-03-09 | Lifescan, Inc. | Method and system to derive glycemic patterns from clustering of glucose data |
Families Citing this family (11)
| Publication number | Priority date | Publication date | Assignee | Title |
|---|---|---|---|---|
| WO2016022438A1 (en) * | 2014-08-08 | 2016-02-11 | Icahn School Of Medicine At Mount Sinai | Automatic disease diagnoses using longitudinal medical record data |
| CA3027019C (en) * | 2015-06-08 | 2023-10-03 | University Of Virginia Patent Foundation | System and method for tracking changes in average glycemia in diabetics |
| WO2017132663A1 (en) * | 2016-01-29 | 2017-08-03 | Patek Stephen D | Method, system, and computer readable medium for virtualization of a continuous glucose monitoring trace |
| US10575790B2 (en) | 2016-03-02 | 2020-03-03 | Roche Diabetes Care, Inc. | Patient diabetes monitoring system with clustering of unsupervised daily CGM profiles (or insulin profiles) and method thereof |
| US10311976B2 (en) | 2016-04-28 | 2019-06-04 | Roche Diabetes Care, Inc. | Bolus calculator with probabilistic carbohydrate measurements |
| US10332632B2 (en) | 2016-06-01 | 2019-06-25 | Roche Diabetes Care, Inc. | Control-to-range failsafes |
| US10297350B2 (en) | 2016-06-01 | 2019-05-21 | Roche Diabetes Care, Inc. | Risk-based control-to-range |
| US10332633B2 (en) | 2016-06-01 | 2019-06-25 | Roche Diabetes Care, Inc. | Control-to-range aggressiveness |
| EP3327598A1 (en) * | 2016-11-25 | 2018-05-30 | Roche Diabetes Care GmbH | A system and a method for automatically analyzing continuous glucose monitoring data indicative of glucose level in a bodily fluid |
| US10818390B1 (en) * | 2017-12-27 | 2020-10-27 | Verily Life Sciences Llc | Pattern discovery in continuous glucose monitoring data |
| CN113164071A (en) * | 2018-08-07 | 2021-07-23 | 金达中华有限公司 | Health map for navigating health space |
Citations (21)
| Publication number | Priority date | Publication date | Assignee | Title |
|---|---|---|---|---|
| US5251126A (en) * | 1990-10-29 | 1993-10-05 | Miles Inc. | Diabetes data analysis and interpretation method |
| US5307263A (en) * | 1992-11-17 | 1994-04-26 | Raya Systems, Inc. | Modular microprocessor-based health monitoring system |
| US5822715A (en) | 1997-01-10 | 1998-10-13 | Health Hero Network | Diabetes management system and method for controlling blood glucose |
| WO2000004512A2 (en) | 1998-07-20 | 2000-01-27 | Smithkline Beecham Corporation | Method and system for identifying at risk patients diagnosed with diabetes |
| WO2001000086A1 (en) | 1999-06-25 | 2001-01-04 | Delphi Health Systems, Inc. | Chronic disease monitor |
| US6390986B1 (en) | 1999-05-27 | 2002-05-21 | Rutgers, The State University Of New Jersey | Classification of heart rate variability patterns in diabetics using cepstral analysis |
| US20030208113A1 (en) * | 2001-07-18 | 2003-11-06 | Mault James R | Closed loop glycemic index system |
| EP1418523A2 (en) | 2002-11-06 | 2004-05-12 | Sysmex Corporation | Diagnosis support system for diabetes |
| US20050159656A1 (en) | 2003-03-07 | 2005-07-21 | Hockersmith Linda J. | Method and apparatus for presentation of noninvasive glucose concentration information |
| WO2005093629A2 (en) | 2004-03-26 | 2005-10-06 | Novo Nordisk A/S | Device for displaying data relevant for a diabetic patient |
| US20060020192A1 (en) * | 2004-07-13 | 2006-01-26 | Dexcom, Inc. | Transcutaneous analyte sensor |
| US20060264895A1 (en) | 2005-05-18 | 2006-11-23 | Flanders Samuel J | System for managing glucose levels in patients with diabetes or hyperglycemia |
| WO2007005170A2 (en) | 2005-06-29 | 2007-01-11 | Medtronic Minimed, Inc. | Flexible glucose analysis using varying time report deltas and configurable glucose target ranges |
| US20080071580A1 (en) | 2005-06-03 | 2008-03-20 | Marcus Alan O | System and method for medical evaluation and monitoring |
| WO2008071218A1 (en) | 2006-12-14 | 2008-06-19 | Egomedical Swiss Ag | Monitoring device |
| US20080235053A1 (en) | 2007-03-20 | 2008-09-25 | Pinaki Ray | Communication medium for diabetes management |
| US20080234992A1 (en) | 2007-03-20 | 2008-09-25 | Pinaki Ray | Systems and methods for pattern recognition in diabetes management |
| US20080234943A1 (en) | 2007-03-20 | 2008-09-25 | Pinaki Ray | Computer program for diabetes management |
| US20120232520A1 (en) * | 2011-03-10 | 2012-09-13 | Abbott Diabetes Care Inc. | Multi-Function Analyte Monitor Device and Methods of Use |
| US8317699B2 (en) * | 2008-02-29 | 2012-11-27 | Roche Diagnostics Operations, Inc. | Device and method for assessing blood glucose control |
| US20140083867A1 (en) * | 2012-09-21 | 2014-03-27 | Lifescan, Inc. | Method and system to derive multiple glycemic patterns from glucose measurements during time of the day |
Family Cites Families (4)
| Publication number | Priority date | Publication date | Assignee | Title |
|---|---|---|---|---|
| US5204532A (en) * | 1989-01-19 | 1993-04-20 | Futrex, Inc. | Method for providing general calibration for near infrared instruments for measurement of blood glucose |
| AU2606901A (en) * | 1999-12-28 | 2001-07-09 | Pindi Products, Inc. | Method and apparatus for non-invasive analysis of blood glucose |
| US8224415B2 (en) * | 2009-01-29 | 2012-07-17 | Abbott Diabetes Care Inc. | Method and device for providing offset model based calibration for analyte sensor |
| US9504412B2 (en) * | 2012-09-17 | 2016-11-29 | Lifescan, Inc. | Method and system to derive glycemic patterns from clustering of glucose data |
-
2012
- 2012-09-17 US US13/621,499 patent/US9504412B2/en active Active
-
2016
- 2016-11-18 US US15/355,198 patent/US20170067846A1/en not_active Abandoned
Patent Citations (29)
| Publication number | Priority date | Publication date | Assignee | Title |
|---|---|---|---|---|
| US5251126A (en) * | 1990-10-29 | 1993-10-05 | Miles Inc. | Diabetes data analysis and interpretation method |
| US5307263A (en) * | 1992-11-17 | 1994-04-26 | Raya Systems, Inc. | Modular microprocessor-based health monitoring system |
| US5822715A (en) | 1997-01-10 | 1998-10-13 | Health Hero Network | Diabetes management system and method for controlling blood glucose |
| WO2000004512A2 (en) | 1998-07-20 | 2000-01-27 | Smithkline Beecham Corporation | Method and system for identifying at risk patients diagnosed with diabetes |
| US6390986B1 (en) | 1999-05-27 | 2002-05-21 | Rutgers, The State University Of New Jersey | Classification of heart rate variability patterns in diabetics using cepstral analysis |
| WO2001000086A1 (en) | 1999-06-25 | 2001-01-04 | Delphi Health Systems, Inc. | Chronic disease monitor |
| US20030208113A1 (en) * | 2001-07-18 | 2003-11-06 | Mault James R | Closed loop glycemic index system |
| EP1418523A2 (en) | 2002-11-06 | 2004-05-12 | Sysmex Corporation | Diagnosis support system for diabetes |
| US20050159656A1 (en) | 2003-03-07 | 2005-07-21 | Hockersmith Linda J. | Method and apparatus for presentation of noninvasive glucose concentration information |
| US20070179352A1 (en) * | 2004-03-26 | 2007-08-02 | Novo Nordisk A/S | Device for displaying data relevant for a diabetic patient |
| WO2005093629A2 (en) | 2004-03-26 | 2005-10-06 | Novo Nordisk A/S | Device for displaying data relevant for a diabetic patient |
| US20060020192A1 (en) * | 2004-07-13 | 2006-01-26 | Dexcom, Inc. | Transcutaneous analyte sensor |
| US20060264895A1 (en) | 2005-05-18 | 2006-11-23 | Flanders Samuel J | System for managing glucose levels in patients with diabetes or hyperglycemia |
| US20080071580A1 (en) | 2005-06-03 | 2008-03-20 | Marcus Alan O | System and method for medical evaluation and monitoring |
| US20090150186A1 (en) * | 2005-06-29 | 2009-06-11 | Medtronic Minimed, Inc. | Flexible glucose analysis using varying time report deltas and configurable glucose target ranges |
| US20090030733A1 (en) * | 2005-06-29 | 2009-01-29 | Medtronic Minimed, Inc. | Flexible glucose analysis using varying time report deltas and configurable glucose target ranges |
| US20120059673A1 (en) * | 2005-06-29 | 2012-03-08 | Medtronic Minimed, Inc. | Flexible glucose analysis using varying time report deltas and configurable glucose target ranges |
| US20070016449A1 (en) * | 2005-06-29 | 2007-01-18 | Gary Cohen | Flexible glucose analysis using varying time report deltas and configurable glucose target ranges |
| WO2007005170A2 (en) | 2005-06-29 | 2007-01-11 | Medtronic Minimed, Inc. | Flexible glucose analysis using varying time report deltas and configurable glucose target ranges |
| US20090018779A1 (en) * | 2005-06-29 | 2009-01-15 | Medtronic Minimed, Inc. | Flexible glucose analysis using varying time report deltas and configurable glucose target ranges |
| WO2008071218A1 (en) | 2006-12-14 | 2008-06-19 | Egomedical Swiss Ag | Monitoring device |
| US20080234992A1 (en) | 2007-03-20 | 2008-09-25 | Pinaki Ray | Systems and methods for pattern recognition in diabetes management |
| US20080234943A1 (en) | 2007-03-20 | 2008-09-25 | Pinaki Ray | Computer program for diabetes management |
| US20080235053A1 (en) | 2007-03-20 | 2008-09-25 | Pinaki Ray | Communication medium for diabetes management |
| US8758245B2 (en) * | 2007-03-20 | 2014-06-24 | Lifescan, Inc. | Systems and methods for pattern recognition in diabetes management |
| US8317699B2 (en) * | 2008-02-29 | 2012-11-27 | Roche Diagnostics Operations, Inc. | Device and method for assessing blood glucose control |
| US8834367B2 (en) * | 2008-02-29 | 2014-09-16 | Roche Diagnostics Operations, Inc. | Device and method for assessing blood glucose control |
| US20120232520A1 (en) * | 2011-03-10 | 2012-09-13 | Abbott Diabetes Care Inc. | Multi-Function Analyte Monitor Device and Methods of Use |
| US20140083867A1 (en) * | 2012-09-21 | 2014-03-27 | Lifescan, Inc. | Method and system to derive multiple glycemic patterns from glucose measurements during time of the day |
Cited By (3)
| Publication number | Priority date | Publication date | Assignee | Title |
|---|---|---|---|---|
| US20100047745A1 (en) * | 2006-07-19 | 2010-02-25 | Thomas Bergqwist | Mobile Apparatus, Method And System For Processing Blood Sugar Affecting Factors |
| US10952664B2 (en) * | 2006-07-19 | 2021-03-23 | Cross Technology Solutions Ab | Mobile apparatus, method and system for processing blood sugar affecting factors |
| US20170067846A1 (en) * | 2012-09-17 | 2017-03-09 | Lifescan, Inc. | Method and system to derive glycemic patterns from clustering of glucose data |
Also Published As
| Publication number | Publication date |
|---|---|
| US20170067846A1 (en) | 2017-03-09 |
| US20140081103A1 (en) | 2014-03-20 |
Similar Documents
| Publication | Publication Date | Title |
|---|---|---|
| US9504412B2 (en) | Method and system to derive glycemic patterns from clustering of glucose data | |
| US10188796B2 (en) | Method and system for management of diabetes with a glucose monitor and infusion pump to provide feedback on bolus dosing | |
| US9592002B2 (en) | Method and system to derive multiple glycemic patterns from glucose measurements during time of the day | |
| EP2554110B1 (en) | Analyte testing method and system | |
| US20140024907A1 (en) | Method and system to indicate hyperglycemia or hypoglycemia for people with diabetes | |
| US20160082187A1 (en) | Decisions support for patients with diabetes | |
| US20140074059A1 (en) | Method and system to indicate glycemic impacts of insulin infusion pump commands | |
| US20140379358A1 (en) | Insertion-site decision-support systems and methods | |
| US20140030748A1 (en) | Method and system to manage diabetes using multiple risk indicators for a person with diabetes | |
| WO2013033025A1 (en) | Infusion set replacement reminder |
Legal Events
| Date | Code | Title | Description |
|---|---|---|---|
| AS | Assignment |
Owner name: LIFESCAN, INC., CALIFORNIA Free format text: ASSIGNMENT OF ASSIGNORS INTEREST;ASSIGNOR:SCHAIBLE, THOMAS;REEL/FRAME:029039/0252 Effective date: 20120912 |
|
| STCF | Information on status: patent grant |
Free format text: PATENTED CASE |
|
| AS | Assignment |
Owner name: BANK OF AMERICA, N.A., AS COLLATERAL AGENT, NORTH CAROLINA Free format text: SECURITY AGREEMENT;ASSIGNOR:LIFESCAN IP HOLDINGS, LLC;REEL/FRAME:047179/0150 Effective date: 20181001 Owner name: BANK OF AMERICA, N.A., AS COLLATERAL AGENT, NORTH Free format text: SECURITY AGREEMENT;ASSIGNOR:LIFESCAN IP HOLDINGS, LLC;REEL/FRAME:047179/0150 Effective date: 20181001 |
|
| AS | Assignment |
Owner name: BANK OF AMERICA, N.A., AS COLLATERAL AGENT, NORTH CAROLINA Free format text: SECURITY AGREEMENT;ASSIGNOR:LIFESCAN IP HOLDINGS, LLC;REEL/FRAME:047186/0836 Effective date: 20181001 Owner name: BANK OF AMERICA, N.A., AS COLLATERAL AGENT, NORTH Free format text: SECURITY AGREEMENT;ASSIGNOR:LIFESCAN IP HOLDINGS, LLC;REEL/FRAME:047186/0836 Effective date: 20181001 |
|
| AS | Assignment |
Owner name: LIFESCAN IP HOLDINGS, LLC, CALIFORNIA Free format text: ASSIGNMENT OF ASSIGNORS INTEREST;ASSIGNOR:CILAG GMBH INTERNATIONAL;REEL/FRAME:050837/0001 Effective date: 20181001 Owner name: CILAG GMBH INTERNATIONAL, SWITZERLAND Free format text: ASSIGNMENT OF ASSIGNORS INTEREST;ASSIGNOR:LIFESCAN INC.;REEL/FRAME:050836/0737 Effective date: 20181001 |
|
| MAFP | Maintenance fee payment |
Free format text: PAYMENT OF MAINTENANCE FEE, 4TH YEAR, LARGE ENTITY (ORIGINAL EVENT CODE: M1551); ENTITY STATUS OF PATENT OWNER: LARGE ENTITY Year of fee payment: 4 |
|
| AS | Assignment |
Owner name: BANK OF AMERICA, N.A., NORTH CAROLINA Free format text: FIRST LIEN PATENT SECURITY AGREEMENT;ASSIGNOR:LIFESCAN IP HOLDINGS, LLC;REEL/FRAME:063712/0430 Effective date: 20230519 |
|
| AS | Assignment |
Owner name: BANK OF AMERICA, N.A., NORTH CAROLINA Free format text: SECOND LIEN PATENT SECURITY AGREEMENT;ASSIGNOR:LIFESCAN IP HOLDINGS, LLC;REEL/FRAME:063740/0080 Effective date: 20230519 |
|
| AS | Assignment |
Owner name: JOHNSON & JOHNSON CONSUMER INC., NEW JERSEY Free format text: RELEASE OF SECOND LIEN PATENT SECURITY AGREEMENT RECORDED OCT. 3, 2018, REEL/FRAME 047186/0836;ASSIGNOR:BANK OF AMERICA, N.A.;REEL/FRAME:064206/0176 Effective date: 20230627 Owner name: JANSSEN BIOTECH, INC., PENNSYLVANIA Free format text: RELEASE OF SECOND LIEN PATENT SECURITY AGREEMENT RECORDED OCT. 3, 2018, REEL/FRAME 047186/0836;ASSIGNOR:BANK OF AMERICA, N.A.;REEL/FRAME:064206/0176 Effective date: 20230627 Owner name: LIFESCAN IP HOLDINGS, LLC, CALIFORNIA Free format text: RELEASE OF SECOND LIEN PATENT SECURITY AGREEMENT RECORDED OCT. 3, 2018, REEL/FRAME 047186/0836;ASSIGNOR:BANK OF AMERICA, N.A.;REEL/FRAME:064206/0176 Effective date: 20230627 |
|
| AS | Assignment |
Owner name: CILAG GMBH INTERNATIONAL, SWITZERLAND Free format text: CORRECTIVE ASSIGNMENT TO CORRECT THE PROPERTY LIST BY ADDING PATENTS 6990849;7169116; 7351770;7462265;7468125; 7572356;8093903; 8486245;8066866;AND DELETE 10881560. PREVIOUSLY RECORDED ON REEL 050836 FRAME 0737. ASSIGNOR(S) HEREBY CONFIRMS THE ASSIGNMENT;ASSIGNOR:LIFESCAN INC.;REEL/FRAME:064782/0443 Effective date: 20181001 |