WO2002078262A1 - Method and system for reducing false alarms in network fault management systems - Google Patents
Method and system for reducing false alarms in network fault management systems Download PDFInfo
- Publication number
- WO2002078262A1 WO2002078262A1 PCT/US2002/008902 US0208902W WO02078262A1 WO 2002078262 A1 WO2002078262 A1 WO 2002078262A1 US 0208902 W US0208902 W US 0208902W WO 02078262 A1 WO02078262 A1 WO 02078262A1
- Authority
- WO
- WIPO (PCT)
- Prior art keywords
- indicators
- state
- time
- time slice
- indicator
- Prior art date
Links
Classifications
-
- H—ELECTRICITY
- H04—ELECTRIC COMMUNICATION TECHNIQUE
- H04L—TRANSMISSION OF DIGITAL INFORMATION, e.g. TELEGRAPHIC COMMUNICATION
- H04L41/00—Arrangements for maintenance, administration or management of data switching networks, e.g. of packet switching networks
- H04L41/06—Management of faults, events, alarms or notifications
- H04L41/0604—Management of faults, events, alarms or notifications using filtering, e.g. reduction of information by using priority, element types, position or time
- H04L41/0609—Management of faults, events, alarms or notifications using filtering, e.g. reduction of information by using priority, element types, position or time based on severity or priority
-
- H—ELECTRICITY
- H04—ELECTRIC COMMUNICATION TECHNIQUE
- H04L—TRANSMISSION OF DIGITAL INFORMATION, e.g. TELEGRAPHIC COMMUNICATION
- H04L41/00—Arrangements for maintenance, administration or management of data switching networks, e.g. of packet switching networks
- H04L41/06—Management of faults, events, alarms or notifications
- H04L41/0631—Management of faults, events, alarms or notifications using root cause analysis; using analysis of correlation between notifications, alarms or events based on decision criteria, e.g. hierarchy, tree or time analysis
- H04L41/064—Management of faults, events, alarms or notifications using root cause analysis; using analysis of correlation between notifications, alarms or events based on decision criteria, e.g. hierarchy, tree or time analysis involving time analysis
Definitions
- the invention disclosed herein relates to computer network fault management.
- the present invention relates to improved techniques for reducing false alarms in such
- Each rule defines which data items or indicators, when detected together, indicate the presence or likelihood of a fault.
- System or device data can be correlated in a number of ways. For example, in the
- Netcool ® /VisionaryTM software a window of time is divided into time slices and rule-based
- the indicators being monitored has reached a state of severity, and computes a percentage
- the software marks the time slice as a positive result for the fault, an activity
- an alert or alarm is sent to a network management platform
- the conditions may in fact be unrelated and coincidental and may in
- timeslice For example, if two or more indicators being monitored by a rule change state during a time slice, but one transitions from a positive state to a negative state and the other indicator
- edge correlation should not cause it to fire.
- edges in a window should not count against the rule.
- edge correlation is an indicator specific attribute and is
- indicators are assigned an edge relevance to limit or
- the window of time consists of a plurality of sequential time slices in each of which a
- each indicator is determined such as by probing or polling.
- the method involves determining which indicator or indicators changed state during a first time slice and which
- a transition is determined through frequent polling ofthe state ofthe indicators.
- the transition is found by comparing the state of each ofthe indicators in the
- first time slice in the window such as at the end ofthe time slice, with the state ofthe respective
- the method further involves computing a time slice transition or edge factor
- time slice transition factor is used to
- transitional determination is made for multiple or all time slices, multiple transition factors are
- the indicators have a plurality of possible states including a
- time slice transition factor by, for example, identifying a maximum among the
- the ratio has a value necessarily no greater than one, thus
- this problem of jitter is solved by adjusting the first time slice to account for
- This adjustment may be accomplished by
- adjustment may be accomplished by determining which indicator, if any, changed state last in
- the predefined period may be the same interval as the interval ofthe time slices.
- Objects ofthe present invention are also achieved by a method for reducing false
- the system correlates a plurality of indicators
- a time slice transition factor is computed that relates the number ofthe
- this transition factor is used to adjust the correlation ofthe indicators over the window of time. If the factor reflects a lack of full correlation in the
- the correlation ofthe indicators is reduced, thus reducing
- Fig. 1 is a block diagram showing a network management system including an
- Fig. 2 is a timing diagram illustrating concepts underlying the present invention
- Fig. 3 is a flow chart showing a process of using edge correlation to reduce false
- Figs. 4A-4B contain a flow chart showing the process of Fig. 3 is greater detail in
- Fig. 5 is a flow chart showing a process of correlating edges of groups of
- Figs. 6-11 are exemplary data structures of indicator states over time
- FIG. 1 a system is shown for detecting the occurrence
- the system includes a network management platform 10 which consolidates, manages and presents event information relating to
- An exemplary network management platform 10 is the
- the system further includes a set
- Devices 16 include many types of hardware devices such as CPUs, routers, bridges, bridges, routers, bridges, routers, routers, routers, routers, routers, routers, routers, routers, routers, routers, routers, routers, routers, routers, routers, routers, routers, routers, routers, routers, routers, routers, routers, routers, routers, routers, routers, routers, routers, routers, routers, routers, routers, routers, routers, routers, routers, routers, routers, routers, routers, routers, routers, routers, routers, routers, routers, routers, routers, routers, routers, routers, routers, routers, routers, routers, routers, routers, routers, routers, routers, routers, routers, routers, routers, routers, routers, routers, routers, routers, routers, routers, routers, routers, routers,
- the status monitors 14 collect many raw data values from industry standard
- monitor uses a configuration file that specifies what SNMP objects it should monitor, how often
- the zoom image may include further information such as data on how to interpret the value of an object.
- event filters 20 reduce the overall number of events detected by the status monitors 12 by
- the event data filtered and transmitted by the event filters 20 is received and
- the correlation engine 22 receives the
- This analysis is performed by retrieving one or more rules from a rules
- the rules are used by the correlation engine 22 to determine whether an alert or
- the engine 22 determines which indicators it needs data
- the correlation engine 22 may also receive some event data as part ofthe
- the event filters 20 may also consult the rules to
- the correlation engine 22 also includes an edge
- correlation routine 26 which improves the accuracy ofthe rule-based correlation performed by
- the correlation engine 22 and reduces the number of false alarms generated by the engine 22.
- edge correlation routine 26 computes an edge or transition factor which is
- a configuration tool 28 is provided in the system to allow administrators to
- the configuration tool is configured to:
- system components such as the severity levels used in filtering data or the threshold values used
- This configuration tool 28 may be directly coupled to and in control ofthe
- correlation engine 22 or may be part of a system-wide configuration subsystem coupled to the
- network management platform 10 used in controlling not only the correlation engine but
- FIG. 1 Each ofthe components shown in Fig. 1 may be implemented in computer
- the program is stored in a memory device readable by a computer to cause the
- components may be part of a single overall system, or may be remotely located and communicate
- FIG. 2 an exemplary rule used to diagnose a given problem involves analysis of three indicators
- each indicator may have two
- indicator 1 is always at state 1 and does not transition as the
- the correlation engine computes a
- correlation routine compares the transitions ofthe indicator states over multiple discrete time
- transitions of indicators during each time period and is used to compute a transition correlation
- step 46 the transition
- correlation factor represents the ratio between the number of times the indicators transitioned
- the transition factor is applied to the correlation factor to produce a new
- step 48 If the new correlation factor exceeds a threshold, step 50, indicating
- the correlation engine generates and sends an alert message to the network management
- threshold may be predetermined from prior experience and set forth in the rule, or may be
- a predefined threshold value may be adjusted to account
- Figs. 4A-4B contain a flow chart showing one embodiment of this process used in
- the correlation factors are then combined over the entire window such as by calculating a mean
- step 60 The filters determine whether any ofthe monitored objects has reached a
- step 62 only allows the monitored event data to pass to the
- correlation engine retrieves the one or more rules relating to the object for which a severity
- step 64 further retrieves the state data relating to the other objects
- step 66
- step 68 performed on the collected state data, step 68, by converting the raw data to predefined states in
- mapping may simply convert the raw data to one of two states, e.g., a high/low state or
- working nonworking state may include additional gradations reflecting layers of severity.
- a time window is defined during which the indicators in the rule are correlated
- time slices may be set as fixed amounts for all indicators or may be set in a particular rule
- edge correlation relies upon a concept of edges transitioning in the
- edges may not always transition in the same timeslice given varying
- the engine adjusts the timing of the
- step 70 This adjustment may be performed in several different ways. One possible way is
- the first slice would be 0-5, and would see
- next slice would be 6-11 and would see both edges go down.
- the next slice would be 15-20, and would see both edges go up.
- the next slice, 18-23 would see
- slice 24-29 has object 2 down, object 1 even.
- the edge correlation routine begins the process of
- edge relevance a factor is assigned to each object in the rule
- Edge relevance for each object is stored in the rule.
- the correlation engine computes a correlation factor based on the state values of relevant or
- This correlation factor may be an average ofthe state values, a
- step 80 the object's state in the current time slice is analyzed to determine
- step 84 determines whether the object's state has remained the same, gone up, or gone down, step 84, as these time
- this determination that a transition has occurred may be made by comparing the object's state during
- step 88 until all relevant objects have been considered.
- the edge correlation routine then computes an edge correlation factor, step 90,
- Edge cf Max(upcount, downcount, samecount) / (total number of relevant objects)
- the overall factor may be found by determining in each time slice whether the
- correlation factor is compared to an appropriate threshold, step 98, to determine whether an alert
- step 100 should be sent, step 100, or no alert should be sent, step 102.
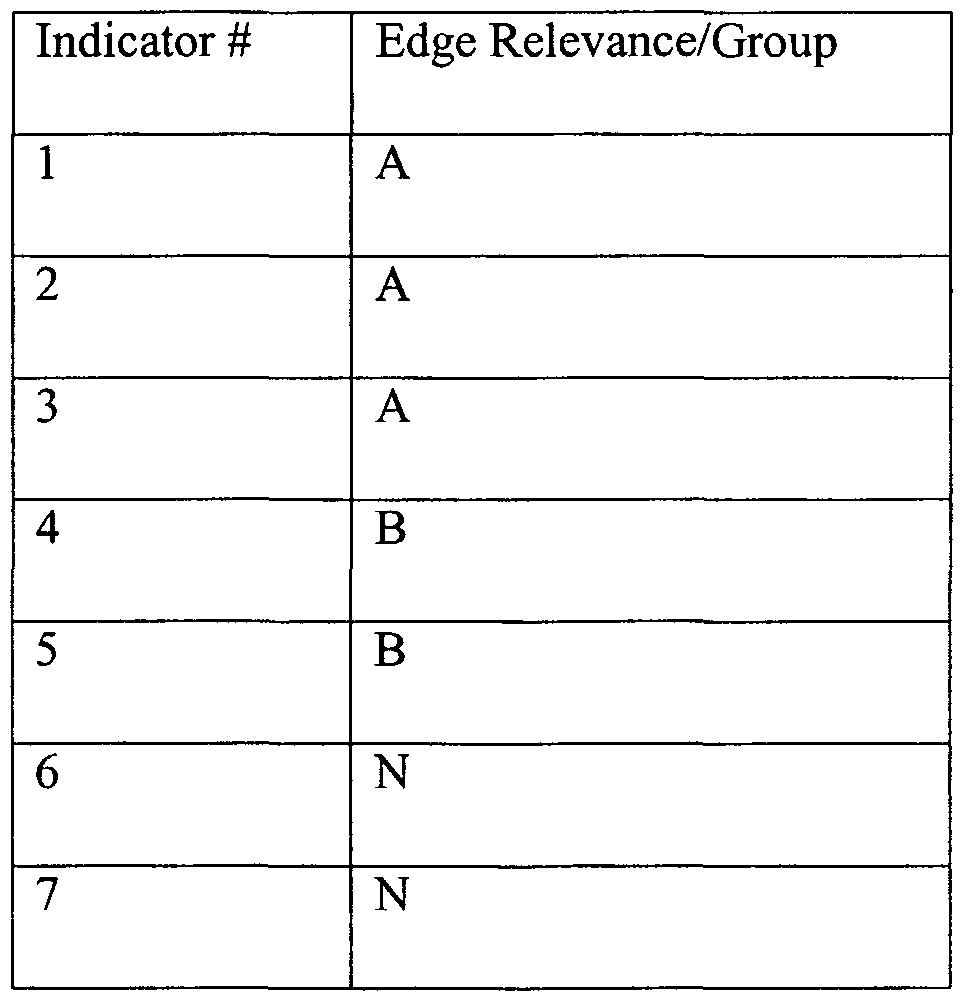
- step 102 there may be logical groupings of indicators in
- edge correlated may also be used to specify the edge correlation group to which the indicator
- indicators 4-5 belong to group B, and indicators 6-7 have no edge relevance.
- step 110 as are the appropriate rule(s), step 112. From the rules, the group or groups of
- step 114 The use of grouping supports various logical
- the correlation engine in conjunction with the edge correlation routine, performs
- step 120 the new correlation factor found for that group is the factor
- step 122 For each group are multiplied to produce the factor to be used for the time slice, step 122.
- Figs. 6-11 illustrate various examples ofthe use of edge correlation to reduce the
- newcf (max(upindicators, downindicators, sameindicators)/numindicators) A *[(max(upindicators, downindicators, sameindicators)/numindicators) B ]*cf,
- newcf represents the new correlation factor, e.g., for a given time slice, after application
- upindicators, downindicators and sameindicators represent the number of state changes
- numindicators represents the total number of indicators having edge relevance in a rule
- ⁇ /Ye presents the base correlation factor found using multivariable correlation techniques
- the rule monitors three indicators, with each indicator having
- rf an edge relevancy factor of 1.
- the indicators will be either at severity level (sev) 1 or sev 0,
- the sev-scale mapping maps a sev 1 to a value of 1, and a sev 0 to a value of 0.
- Fig. 6 demonstrates that a rule firing at 100% with no edges is not impacted by the
- Fig. 7 demonstrates that a rule with all indicators tracking is not impacted by edge
- Fig. 8 demonstrates that the rule is weakened as a result of lack of complete
- transition correlation in time slices 3, 7, and 10, but may still fire if the indicators track and there
- Fig. 9 shows that in a situation where one indicator is pegged high, another
- Fig. 10 indicates that edges are needed in order for edge correlation to have the
- Fig. 11 well illustrates the effectiveness of edge correlation. Simulating a noisy
Abstract
Description


Claims
Priority Applications (2)
| Application Number | Priority Date | Filing Date | Title |
|---|---|---|---|
| EP02721542A EP1382155B1 (en) | 2001-03-22 | 2002-03-21 | Method and system for reducing false alarms in network fault management systems |
| DE60214994T DE60214994T2 (en) | 2001-03-22 | 2002-03-21 | METHOD AND SYSTEM FOR REDUCING FALSE ALARMS IN NETWORK FAULT MANAGEMENT SYSTEMS |
Applications Claiming Priority (2)
| Application Number | Priority Date | Filing Date | Title |
|---|---|---|---|
| US09/815,557 US6966015B2 (en) | 2001-03-22 | 2001-03-22 | Method and system for reducing false alarms in network fault management systems |
| US09/815,557 | 2001-03-22 |
Publications (1)
| Publication Number | Publication Date |
|---|---|
| WO2002078262A1 true WO2002078262A1 (en) | 2002-10-03 |
Family
ID=25218152
Family Applications (1)
| Application Number | Title | Priority Date | Filing Date |
|---|---|---|---|
| PCT/US2002/008902 WO2002078262A1 (en) | 2001-03-22 | 2002-03-21 | Method and system for reducing false alarms in network fault management systems |
Country Status (5)
| Country | Link |
|---|---|
| US (2) | US6966015B2 (en) |
| EP (1) | EP1382155B1 (en) |
| AT (1) | ATE341136T1 (en) |
| DE (1) | DE60214994T2 (en) |
| WO (1) | WO2002078262A1 (en) |
Cited By (25)
| Publication number | Priority date | Publication date | Assignee | Title |
|---|---|---|---|---|
| US7219239B1 (en) | 2002-12-02 | 2007-05-15 | Arcsight, Inc. | Method for batching events for transmission by software agent |
| US7260844B1 (en) | 2003-09-03 | 2007-08-21 | Arcsight, Inc. | Threat detection in a network security system |
| US7333999B1 (en) | 2003-10-30 | 2008-02-19 | Arcsight, Inc. | Expression editor |
| US7376969B1 (en) | 2002-12-02 | 2008-05-20 | Arcsight, Inc. | Real time monitoring and analysis of events from multiple network security devices |
| US7424742B1 (en) | 2004-10-27 | 2008-09-09 | Arcsight, Inc. | Dynamic security events and event channels in a network security system |
| US7437359B2 (en) | 2006-04-05 | 2008-10-14 | Arcsight, Inc. | Merging multiple log entries in accordance with merge properties and mapping properties |
| US7509677B2 (en) | 2004-05-04 | 2009-03-24 | Arcsight, Inc. | Pattern discovery in a network security system |
| US7565696B1 (en) | 2003-12-10 | 2009-07-21 | Arcsight, Inc. | Synchronizing network security devices within a network security system |
| US7607169B1 (en) | 2002-12-02 | 2009-10-20 | Arcsight, Inc. | User interface for network security console |
| WO2009153901A1 (en) | 2008-06-17 | 2009-12-23 | Hitachi, Ltd. | Method and apparatus for performing root cause analysis |
| US7644438B1 (en) | 2004-10-27 | 2010-01-05 | Arcsight, Inc. | Security event aggregation at software agent |
| US7647632B1 (en) | 2005-01-04 | 2010-01-12 | Arcsight, Inc. | Object reference in a system |
| US7650638B1 (en) | 2002-12-02 | 2010-01-19 | Arcsight, Inc. | Network security monitoring system employing bi-directional communication |
| US7788722B1 (en) | 2002-12-02 | 2010-08-31 | Arcsight, Inc. | Modular agent for network security intrusion detection system |
| US7809131B1 (en) | 2004-12-23 | 2010-10-05 | Arcsight, Inc. | Adjusting sensor time in a network security system |
| US7844999B1 (en) | 2005-03-01 | 2010-11-30 | Arcsight, Inc. | Message parsing in a network security system |
| EP2255564A1 (en) * | 2008-03-14 | 2010-12-01 | Telefonaktiebolaget L M Ericsson (PUBL) | Alarm and event coordination between telecom nodes |
| US7899901B1 (en) | 2002-12-02 | 2011-03-01 | Arcsight, Inc. | Method and apparatus for exercising and debugging correlations for network security system |
| EP2355407A1 (en) * | 2010-01-26 | 2011-08-10 | Hitachi Ltd. | Failure display method, failure setting device and monitor control device |
| US8015604B1 (en) | 2003-10-10 | 2011-09-06 | Arcsight Inc | Hierarchical architecture in a network security system |
| US8176527B1 (en) | 2002-12-02 | 2012-05-08 | Hewlett-Packard Development Company, L. P. | Correlation engine with support for time-based rules |
| US8528077B1 (en) | 2004-04-09 | 2013-09-03 | Hewlett-Packard Development Company, L.P. | Comparing events from multiple network security devices |
| US8850565B2 (en) | 2005-01-10 | 2014-09-30 | Hewlett-Packard Development Company, L.P. | System and method for coordinating network incident response activities |
| US9027120B1 (en) | 2003-10-10 | 2015-05-05 | Hewlett-Packard Development Company, L.P. | Hierarchical architecture in a network security system |
| US9100422B1 (en) | 2004-10-27 | 2015-08-04 | Hewlett-Packard Development Company, L.P. | Network zone identification in a network security system |
Families Citing this family (75)
| Publication number | Priority date | Publication date | Assignee | Title |
|---|---|---|---|---|
| JP2002109211A (en) * | 2000-09-28 | 2002-04-12 | Fujitsu Ltd | Method and device for managing operation, recording medium and system for managing operation |
| US7233998B2 (en) | 2001-03-22 | 2007-06-19 | Sony Computer Entertainment Inc. | Computer architecture and software cells for broadband networks |
| US6966015B2 (en) * | 2001-03-22 | 2005-11-15 | Micromuse, Ltd. | Method and system for reducing false alarms in network fault management systems |
| US6832346B2 (en) * | 2001-04-13 | 2004-12-14 | Lockheed Martin Corporation | System and method for managing and communicating state changes of a complex system |
| US20030131343A1 (en) * | 2001-10-19 | 2003-07-10 | French Ronan J. | Framework for system monitoring |
| US7437450B1 (en) | 2001-11-30 | 2008-10-14 | Cisco Technology Inc. | End-to-end performance tool and method for monitoring electronic-commerce transactions |
| US7149917B2 (en) * | 2002-07-30 | 2006-12-12 | Cisco Technology, Inc. | Method and apparatus for outage measurement |
| US20040049570A1 (en) * | 2002-09-17 | 2004-03-11 | Frank Ed H. | Method and system for network management in a hybrid wired/wireless network |
| US7434109B1 (en) * | 2002-09-26 | 2008-10-07 | Computer Associates Think, Inc. | Network fault manager for maintaining alarm conditions |
| US20040153844A1 (en) * | 2002-10-28 | 2004-08-05 | Gautam Ghose | Failure analysis method and system for storage area networks |
| US20040111638A1 (en) * | 2002-12-09 | 2004-06-10 | Satyendra Yadav | Rule-based network survivability framework |
| US7131032B2 (en) * | 2003-03-13 | 2006-10-31 | Sun Microsystems, Inc. | Method, system, and article of manufacture for fault determination |
| CA2461069C (en) * | 2003-03-17 | 2013-08-13 | Tyco Telecommunications (Us) Inc. | System and method for fault diagnosis using distributed alarm correlation |
| US7523157B2 (en) | 2003-09-25 | 2009-04-21 | International Business Machines Corporation | Managing a plurality of processors as devices |
| US7389508B2 (en) | 2003-09-25 | 2008-06-17 | International Business Machines Corporation | System and method for grouping processors and assigning shared memory space to a group in heterogeneous computer environment |
| US20050071578A1 (en) * | 2003-09-25 | 2005-03-31 | International Business Machines Corporation | System and method for manipulating data with a plurality of processors |
| US7318218B2 (en) * | 2003-09-25 | 2008-01-08 | International Business Machines Corporation | System and method for processor thread for software debugging |
| US7415703B2 (en) * | 2003-09-25 | 2008-08-19 | International Business Machines Corporation | Loading software on a plurality of processors |
| US7475257B2 (en) | 2003-09-25 | 2009-01-06 | International Business Machines Corporation | System and method for selecting and using a signal processor in a multiprocessor system to operate as a security for encryption/decryption of data |
| US20050071828A1 (en) * | 2003-09-25 | 2005-03-31 | International Business Machines Corporation | System and method for compiling source code for multi-processor environments |
| US7516456B2 (en) * | 2003-09-25 | 2009-04-07 | International Business Machines Corporation | Asymmetric heterogeneous multi-threaded operating system |
| US7444632B2 (en) | 2003-09-25 | 2008-10-28 | International Business Machines Corporation | Balancing computational load across a plurality of processors |
| US7146529B2 (en) * | 2003-09-25 | 2006-12-05 | International Business Machines Corporation | System and method for processor thread acting as a system service processor |
| US7496917B2 (en) * | 2003-09-25 | 2009-02-24 | International Business Machines Corporation | Virtual devices using a pluarlity of processors |
| US7478390B2 (en) | 2003-09-25 | 2009-01-13 | International Business Machines Corporation | Task queue management of virtual devices using a plurality of processors |
| US7236998B2 (en) * | 2003-09-25 | 2007-06-26 | International Business Machines Corporation | System and method for solving a large system of dense linear equations |
| US7549145B2 (en) * | 2003-09-25 | 2009-06-16 | International Business Machines Corporation | Processor dedicated code handling in a multi-processor environment |
| US7500152B2 (en) | 2003-12-05 | 2009-03-03 | Freescale Semiconductor, Inc. | Apparatus and method for time ordering events in a system having multiple time domains |
| US7398511B2 (en) * | 2003-12-10 | 2008-07-08 | Microsoft Corporation | System and method for providing a health model for software |
| US7409604B2 (en) * | 2003-12-19 | 2008-08-05 | Microsoft Corporation | Determination of related failure events in a multi-node system |
| TWI262758B (en) * | 2004-05-07 | 2006-09-21 | Coretronic Corp | Ventilation cover structure |
| US7480828B2 (en) * | 2004-06-10 | 2009-01-20 | International Business Machines Corporation | Method, apparatus and program storage device for extending dispersion frame technique behavior using dynamic rule sets |
| US7408441B2 (en) * | 2004-10-25 | 2008-08-05 | Electronic Data Systems Corporation | System and method for analyzing user-generated event information and message information from network devices |
| US20060168170A1 (en) * | 2004-10-25 | 2006-07-27 | Korzeniowski Richard W | System and method for analyzing information relating to network devices |
| US7408440B2 (en) | 2004-10-25 | 2008-08-05 | Electronics Data Systems Corporation | System and method for analyzing message information from diverse network devices |
| EP1703350B1 (en) * | 2005-03-17 | 2019-05-08 | Siemens Aktiengesellschaft | Diagnostics of an automation system |
| US7295950B2 (en) * | 2005-06-23 | 2007-11-13 | International Business Machines Corporation | Monitoring multiple channels of data from real time process to detect recent abnormal behavior |
| US20070016687A1 (en) * | 2005-07-14 | 2007-01-18 | International Business Machines Corporation | System and method for detecting imbalances in dynamic workload scheduling in clustered environments |
| US7484121B2 (en) * | 2005-08-30 | 2009-01-27 | International Business Machines Corporation | Self-aware and self-healing computing system |
| US7774657B1 (en) * | 2005-09-29 | 2010-08-10 | Symantec Corporation | Automatically estimating correlation between hardware or software changes and problem events |
| JP4527642B2 (en) * | 2005-09-29 | 2010-08-18 | 富士通株式会社 | Network failure diagnosis apparatus, network failure diagnosis method, and network failure diagnosis program |
| EP1783569B1 (en) * | 2005-10-21 | 2018-08-29 | Omron Corporation | Data collection system |
| US20070233848A1 (en) * | 2006-03-28 | 2007-10-04 | International Business Machines Corporation | Monitor management that enables enhanced data collection |
| US8230051B1 (en) | 2006-06-27 | 2012-07-24 | Emc Corporation | Method and apparatus for mapping and identifying resources for network-based services |
| US7779101B1 (en) * | 2006-06-27 | 2010-08-17 | Emc Corporation | Method and apparatus for mapping and identifying the root causes of performance problems in network-based services |
| US8195478B2 (en) * | 2007-03-07 | 2012-06-05 | Welch Allyn, Inc. | Network performance monitor |
| US7788415B2 (en) * | 2007-05-28 | 2010-08-31 | Sandisk Il Ltd. | Management of internal operations by a storage device |
| US8013738B2 (en) | 2007-10-04 | 2011-09-06 | Kd Secure, Llc | Hierarchical storage manager (HSM) for intelligent storage of large volumes of data |
| US7382244B1 (en) | 2007-10-04 | 2008-06-03 | Kd Secure | Video surveillance, storage, and alerting system having network management, hierarchical data storage, video tip processing, and vehicle plate analysis |
| US8769346B2 (en) * | 2007-11-21 | 2014-07-01 | Ca, Inc. | Method and apparatus for adaptive declarative monitoring |
| CN102084620B (en) * | 2007-11-21 | 2015-09-30 | 阿尔卡特朗讯 | The method of implementation strategy and service management system in a network |
| US8041996B2 (en) * | 2008-01-11 | 2011-10-18 | Alcatel Lucent | Method and apparatus for time-based event correlation |
| US8447719B2 (en) * | 2008-01-14 | 2013-05-21 | Hewlett-Packard Development Company, L.P. | Compilation of causal rules into continuations |
| US8180718B2 (en) * | 2008-01-14 | 2012-05-15 | Hewlett-Packard Development Company, L.P. | Engine for performing root cause and effect analysis |
| US20090183030A1 (en) * | 2008-01-14 | 2009-07-16 | Bethke Bob | Episodic cause analysis |
| US20090254814A1 (en) * | 2008-04-08 | 2009-10-08 | Microsoft Corporation | Per-edge rules and constraints-based layout mechanism |
| JP5325981B2 (en) * | 2009-05-26 | 2013-10-23 | 株式会社日立製作所 | Management server and management system |
| US8375255B2 (en) * | 2009-12-23 | 2013-02-12 | At&T Intellectual Property I, Lp | Device and method for detecting and diagnosing correlated network anomalies |
| WO2011155621A1 (en) | 2010-06-07 | 2011-12-15 | 日本電気株式会社 | Malfunction detection device, obstacle detection method, and program recording medium |
| US8571182B2 (en) * | 2010-09-22 | 2013-10-29 | Fujitsu Limited | Systems and methods of masking non-service affecting alarms in a communication system |
| US8464102B2 (en) * | 2010-12-23 | 2013-06-11 | GM Global Technology Operations LLC | Methods and systems for diagnosing hardware and software faults using time-stamped events |
| US8380838B2 (en) * | 2011-04-08 | 2013-02-19 | International Business Machines Corporation | Reduction of alerts in information technology systems |
| US9253023B2 (en) | 2011-08-10 | 2016-02-02 | International Business Machines Corporation | Network management system with a switchable flood revention mode pregarding fault events for a managed device |
| US9251032B2 (en) * | 2011-11-03 | 2016-02-02 | Fujitsu Limited | Method, computer program, and information processing apparatus for analyzing performance of computer system |
| US9727736B1 (en) * | 2014-10-17 | 2017-08-08 | Amazon Technologies, Inc. | Tracking developer behavior with respect to software analysis tools |
| WO2018204020A1 (en) | 2017-05-01 | 2018-11-08 | Johnson Controls Technology Company | Building security system with false alarm reduction |
| US11126528B2 (en) * | 2018-06-26 | 2021-09-21 | Jpmorgan Chase Bank, N.A. | Methods for generating a branch health index |
| US10958509B2 (en) * | 2018-10-11 | 2021-03-23 | Ca, Inc. | Providing a new server alarm configuration based on the correlation of server alarms for varying metrics of monitored servers |
| US10607478B1 (en) * | 2019-03-28 | 2020-03-31 | Johnson Controls Technology Company | Building security system with false alarm reduction using hierarchical relationships |
| US10607476B1 (en) | 2019-03-28 | 2020-03-31 | Johnson Controls Technology Company | Building security system with site risk reduction |
| KR20200138565A (en) * | 2019-05-31 | 2020-12-10 | 삼성전자주식회사 | Method and apparatus for managing a plurality of remote radio heads in a communication network |
| US11099921B2 (en) | 2019-07-09 | 2021-08-24 | Microsoft Technology Licensing, Llc | Predictive system resource allocation |
| US10891849B1 (en) | 2019-07-09 | 2021-01-12 | Microsoft Technology Licensing, Llc | System for suppressing false service outage alerts |
| US11088980B1 (en) * | 2020-11-10 | 2021-08-10 | Micron Technology, Inc. | Single message management platform |
| WO2023219603A1 (en) * | 2022-05-10 | 2023-11-16 | Rakuten Symphony Singapore Pte. Ltd. | Apparatus and method for centralized fault monitoring |
Citations (2)
| Publication number | Priority date | Publication date | Assignee | Title |
|---|---|---|---|---|
| US5293323A (en) * | 1991-10-24 | 1994-03-08 | General Electric Company | Method for fault diagnosis by assessment of confidence measure |
| US6360335B1 (en) * | 1993-08-02 | 2002-03-19 | Nortel Networks Limited | Loss metrics in a communication network |
Family Cites Families (93)
| Publication number | Priority date | Publication date | Assignee | Title |
|---|---|---|---|---|
| US4135662A (en) * | 1977-06-15 | 1979-01-23 | Pitney-Bowes, Inc. | Operator prompting system |
| US4438494A (en) * | 1981-08-25 | 1984-03-20 | Intel Corporation | Apparatus of fault-handling in a multiprocessing system |
| US4503534A (en) * | 1982-06-30 | 1985-03-05 | Intel Corporation | Apparatus for redundant operation of modules in a multiprocessing system |
| US4503535A (en) * | 1982-06-30 | 1985-03-05 | Intel Corporation | Apparatus for recovery from failures in a multiprocessing system |
| US4585975A (en) * | 1983-04-21 | 1986-04-29 | Tektronix, Inc. | High speed Boolean logic trigger oscilloscope vertical amplifier with edge sensitivity and nested trigger |
| US4634110A (en) | 1983-07-28 | 1987-01-06 | Harris Corporation | Fault detection and redundancy management system |
| US4568909A (en) * | 1983-12-19 | 1986-02-04 | United Technologies Corporation | Remote elevator monitoring system |
| US4517468A (en) * | 1984-04-30 | 1985-05-14 | Westinghouse Electric Corp. | Diagnostic system and method |
| US4648044A (en) * | 1984-06-06 | 1987-03-03 | Teknowledge, Inc. | Basic expert system tool |
| US4591983A (en) * | 1984-07-09 | 1986-05-27 | Teknowledge, Inc. | Hierarchical knowledge system |
| US4727545A (en) * | 1986-09-02 | 1988-02-23 | Digital Equipment Corporation | Method and apparatus for isolating faults in a digital logic circuit |
| US4932026A (en) * | 1986-12-19 | 1990-06-05 | Wang Laboratories, Inc. | Apparatus for distributing data processing across a plurality of loci of control |
| US4805107A (en) * | 1987-04-15 | 1989-02-14 | Allied-Signal Inc. | Task scheduler for a fault tolerant multiple node processing system |
| US4823345A (en) * | 1987-06-15 | 1989-04-18 | International Business Machines Corp. | Method and apparatus for communication network alert record identification |
| JPH0786833B2 (en) * | 1987-06-26 | 1995-09-20 | 株式会社日立製作所 | Knowledge-based management system |
| US4817092A (en) * | 1987-10-05 | 1989-03-28 | International Business Machines | Threshold alarms for processing errors in a multiplex communications system |
| US5133075A (en) * | 1988-12-19 | 1992-07-21 | Hewlett-Packard Company | Method of monitoring changes in attribute values of object in an object-oriented database |
| US5109486A (en) * | 1989-01-06 | 1992-04-28 | Motorola, Inc. | Distributed computer system with network and resource status monitoring |
| US5125091A (en) * | 1989-06-08 | 1992-06-23 | Hazox Corporation | Object oriented control of real-time processing |
| US5107497A (en) * | 1989-07-28 | 1992-04-21 | At&T Bell Laboratories | Technique for producing an expert system for system fault diagnosis |
| US5123017A (en) * | 1989-09-29 | 1992-06-16 | The United States Of America As Represented By The Administrator Of The National Aeronautics And Space Administration | Remote maintenance monitoring system |
| JP2810171B2 (en) * | 1989-12-18 | 1998-10-15 | 株式会社日立製作所 | Network system and network management method applying the same |
| US5722427A (en) * | 1993-05-10 | 1998-03-03 | Eyesys Technologies, Inc. | Method of refractive surgery |
| US5295244A (en) * | 1990-09-17 | 1994-03-15 | Cabletron Systems, Inc. | Network management system using interconnected hierarchies to represent different network dimensions in multiple display views |
| EP0737921B1 (en) * | 1990-09-17 | 2000-06-28 | Cabletron Systems, Inc. | System and method for modelling a computer network |
| US5751933A (en) * | 1990-09-17 | 1998-05-12 | Dev; Roger H. | System for determining the status of an entity in a computer network |
| US5727157A (en) * | 1990-09-17 | 1998-03-10 | Cabletron Systems, Inc. | Apparatus and method for determining a computer network topology |
| US5214653A (en) * | 1990-10-22 | 1993-05-25 | Harris Corporation | Fault finder expert system |
| US5293629A (en) * | 1990-11-30 | 1994-03-08 | Abraxas Software, Inc. | Method of analyzing computer source code |
| US5325518A (en) | 1991-04-02 | 1994-06-28 | Carnegie Mellon University | Adaptive distributed system and method for fault tolerance |
| US5774377A (en) | 1991-07-30 | 1998-06-30 | Hewlett-Packard Company | Method and apparatus for monitoring a subsystem within a distributed system for providing an archive of events within a certain time of a trap condition |
| US5179556A (en) * | 1991-08-02 | 1993-01-12 | Washington University | Bandwidth management and congestion control scheme for multicast ATM networks |
| US5321837A (en) * | 1991-10-11 | 1994-06-14 | International Business Machines Corporation | Event handling mechanism having a process and an action association process |
| US5309448A (en) * | 1992-01-03 | 1994-05-03 | International Business Machines Corporation | Methods and systems for alarm correlation and fault localization in communication networks |
| US5383178A (en) | 1992-03-26 | 1995-01-17 | Hewlett-Packard Company | Network commentator |
| US5495470A (en) * | 1992-04-02 | 1996-02-27 | Applied Digital Access, Inc. | Alarm correlation system for a telephone network |
| US5819028A (en) | 1992-06-10 | 1998-10-06 | Bay Networks, Inc. | Method and apparatus for determining the health of a network |
| EP0686336B1 (en) | 1993-02-23 | 1998-05-20 | BRITISH TELECOMMUNICATIONS public limited company | Event correlation |
| GB9303640D0 (en) | 1993-02-23 | 1993-04-07 | British Telecomm | Object-oriented correlation |
| US6049792A (en) | 1993-03-19 | 2000-04-11 | Ricoh Company Limited | Automatic invocation of computational resources without user intervention across a network |
| US5557747A (en) | 1993-06-22 | 1996-09-17 | Rogers; Lawrence D. | Network policy implementation system for performing network control operations in response to changes in network state |
| US5432934A (en) * | 1993-07-26 | 1995-07-11 | Gensym Corporation | Access restrictions as a means of configuring a user interface and making an application secure |
| US5485455A (en) * | 1994-01-28 | 1996-01-16 | Cabletron Systems, Inc. | Network having secure fast packet switching and guaranteed quality of service |
| US5528516A (en) | 1994-05-25 | 1996-06-18 | System Management Arts, Inc. | Apparatus and method for event correlation and problem reporting |
| US5483637A (en) * | 1994-06-27 | 1996-01-09 | International Business Machines Corporation | Expert based system and method for managing error events in a local area network |
| WO1996013107A1 (en) * | 1994-10-25 | 1996-05-02 | Cabletron Systems, Inc. | Method and apparatus for automatically populating a network simulator tool |
| US6006016A (en) | 1994-11-10 | 1999-12-21 | Bay Networks, Inc. | Network fault correlation |
| US5748781A (en) * | 1995-01-04 | 1998-05-05 | Cabletron Systems, Inc. | Method and apparatus for digital data compression |
| US5627819A (en) * | 1995-01-09 | 1997-05-06 | Cabletron Systems, Inc. | Use of multipoint connection services to establish call-tapping points in a switched network |
| US6209033B1 (en) * | 1995-02-01 | 2001-03-27 | Cabletron Systems, Inc. | Apparatus and method for network capacity evaluation and planning |
| US5706436A (en) * | 1995-02-01 | 1998-01-06 | Cabletron Systems, Inc. | Apparatus and method for evaluation network traffic performance |
| US5872928A (en) * | 1995-02-24 | 1999-02-16 | Cabletron Systems, Inc. | Method and apparatus for defining and enforcing policies for configuration management in communications networks |
| US6255943B1 (en) * | 1995-03-29 | 2001-07-03 | Cabletron Systems, Inc. | Method and apparatus for distributed object filtering |
| US5777549A (en) * | 1995-03-29 | 1998-07-07 | Cabletron Systems, Inc. | Method and apparatus for policy-based alarm notification in a distributed network management environment |
| US6381639B1 (en) * | 1995-05-25 | 2002-04-30 | Aprisma Management Technologies, Inc. | Policy management and conflict resolution in computer networks |
| US6421719B1 (en) * | 1995-05-25 | 2002-07-16 | Aprisma Management Technologies, Inc. | Method and apparatus for reactive and deliberative configuration management |
| US5889953A (en) * | 1995-05-25 | 1999-03-30 | Cabletron Systems, Inc. | Policy management and conflict resolution in computer networks |
| US5649103A (en) * | 1995-07-13 | 1997-07-15 | Cabletron Systems, Inc. | Method and apparatus for managing multiple server requests and collating reponses |
| US5764955A (en) * | 1995-10-19 | 1998-06-09 | Oasys Group, Inc. | Gateway for using legacy telecommunications network element equipment with a common management information protocol |
| US5793362A (en) * | 1995-12-04 | 1998-08-11 | Cabletron Systems, Inc. | Configurations tracking system using transition manager to evaluate votes to determine possible connections between ports in a communications network in accordance with transition tables |
| US5949759A (en) | 1995-12-20 | 1999-09-07 | International Business Machines Corporation | Fault correlation system and method in packet switching networks |
| US5734642A (en) * | 1995-12-22 | 1998-03-31 | Cabletron Systems, Inc. | Method and apparatus for network synchronization |
| US5761502A (en) | 1995-12-29 | 1998-06-02 | Mci Corporation | System and method for managing a telecommunications network by associating and correlating network events |
| US5872911A (en) | 1995-12-29 | 1999-02-16 | Mci Communications Corporations | Method and system of service impact analysis in a communications network |
| US6233623B1 (en) * | 1996-01-11 | 2001-05-15 | Cabletron Systems, Inc. | Replicated resource management system for managing resources in a distributed application and maintaining a relativistic view of state |
| US6199172B1 (en) * | 1996-02-06 | 2001-03-06 | Cabletron Systems, Inc. | Method and apparatus for testing the responsiveness of a network device |
| US5751965A (en) * | 1996-03-21 | 1998-05-12 | Cabletron System, Inc. | Network connection status monitor and display |
| US6118936A (en) | 1996-04-18 | 2000-09-12 | Mci Communications Corporation | Signaling network management system for converting network events into standard form and then correlating the standard form events with topology and maintenance information |
| US5768501A (en) * | 1996-05-28 | 1998-06-16 | Cabletron Systems | Method and apparatus for inter-domain alarm correlation |
| US5946373A (en) * | 1996-06-21 | 1999-08-31 | Mci Communications Corporation | Topology-based fault analysis in telecommunications networks |
| US5832196A (en) | 1996-06-28 | 1998-11-03 | Mci Communications Corporation | Dynamic restoration process for a telecommunications network |
| US5907696A (en) * | 1996-07-03 | 1999-05-25 | Cabletron Systems, Inc. | Network device simulator |
| US6041383A (en) * | 1996-07-22 | 2000-03-21 | Cabletron Systems, Inc. | Establishing control of lock token for shared objects upon approval messages from all other processes |
| JP3825845B2 (en) * | 1996-09-27 | 2006-09-27 | ヤマハ発動機株式会社 | Evolutionary control method |
| US6012152A (en) | 1996-11-27 | 2000-01-04 | Telefonaktiebolaget Lm Ericsson (Publ) | Software fault management system |
| US5984178A (en) | 1996-11-29 | 1999-11-16 | Diebold, Incorporated | Fault monitoring and notification system for automated banking machines |
| US6084858A (en) * | 1997-01-29 | 2000-07-04 | Cabletron Systems, Inc. | Distribution of communication load over multiple paths based upon link utilization |
| US5791694A (en) * | 1997-02-20 | 1998-08-11 | Dover Corporation | Lock for coupling cam arms |
| US6216168B1 (en) * | 1997-03-17 | 2001-04-10 | Cabletron Systems, Inc. | Perspective-based shared scope address resolution method and apparatus |
| US6392667B1 (en) * | 1997-06-09 | 2002-05-21 | Aprisma Management Technologies, Inc. | Method and apparatus for representing objects as visually discernable entities based on spatial definition and perspective |
| US6141720A (en) * | 1997-06-12 | 2000-10-31 | Cabletron Systems, Inc. | Method and apparatus for coordination of a shared object in a distributed system |
| US6085174A (en) * | 1997-09-23 | 2000-07-04 | Edelman; Ric | Computer assisted and/or implemented process and architecture for administering an investment and/or retirement program |
| US6047279A (en) | 1997-11-17 | 2000-04-04 | Objective Systems Integrators, Inc. | System and method for automatic network management support using artificial intelligence |
| US6026442A (en) * | 1997-11-24 | 2000-02-15 | Cabletron Systems, Inc. | Method and apparatus for surveillance in communications networks |
| CA2331820A1 (en) * | 1998-05-07 | 1999-11-11 | Cabletron Systems, Inc. | Multiple priority buffering in a computer network |
| US6336138B1 (en) * | 1998-08-25 | 2002-01-01 | Hewlett-Packard Company | Template-driven approach for generating models on network services |
| US6253339B1 (en) * | 1998-10-28 | 2001-06-26 | Telefonaktiebolaget Lm Ericsson (Publ) | Alarm correlation in a large communications network |
| US6349306B1 (en) * | 1998-10-30 | 2002-02-19 | Aprisma Management Technologies, Inc. | Method and apparatus for configuration management in communications networks |
| US6446136B1 (en) * | 1998-12-31 | 2002-09-03 | Computer Associates Think, Inc. | System and method for dynamic correlation of events |
| US6239699B1 (en) * | 1999-03-03 | 2001-05-29 | Lucent Technologies Inc. | Intelligent alarm filtering in a telecommunications network |
| WO2002019077A2 (en) * | 2000-09-01 | 2002-03-07 | Sri International, Inc. | Probabilistic alert correlation |
| US6966015B2 (en) * | 2001-03-22 | 2005-11-15 | Micromuse, Ltd. | Method and system for reducing false alarms in network fault management systems |
| US7603709B2 (en) * | 2001-05-03 | 2009-10-13 | Computer Associates Think, Inc. | Method and apparatus for predicting and preventing attacks in communications networks |
-
2001
- 2001-03-22 US US09/815,557 patent/US6966015B2/en not_active Expired - Fee Related
-
2002
- 2002-03-21 AT AT02721542T patent/ATE341136T1/en not_active IP Right Cessation
- 2002-03-21 WO PCT/US2002/008902 patent/WO2002078262A1/en active IP Right Grant
- 2002-03-21 DE DE60214994T patent/DE60214994T2/en not_active Expired - Lifetime
- 2002-03-21 EP EP02721542A patent/EP1382155B1/en not_active Expired - Lifetime
-
2005
- 2005-09-23 US US11/233,928 patent/US7318178B2/en not_active Expired - Fee Related
Patent Citations (2)
| Publication number | Priority date | Publication date | Assignee | Title |
|---|---|---|---|---|
| US5293323A (en) * | 1991-10-24 | 1994-03-08 | General Electric Company | Method for fault diagnosis by assessment of confidence measure |
| US6360335B1 (en) * | 1993-08-02 | 2002-03-19 | Nortel Networks Limited | Loss metrics in a communication network |
Cited By (39)
| Publication number | Priority date | Publication date | Assignee | Title |
|---|---|---|---|---|
| US8176527B1 (en) | 2002-12-02 | 2012-05-08 | Hewlett-Packard Development Company, L. P. | Correlation engine with support for time-based rules |
| US8230507B1 (en) | 2002-12-02 | 2012-07-24 | Hewlett-Packard Development Company, L.P. | Modular agent for network security intrusion detection system |
| US7899901B1 (en) | 2002-12-02 | 2011-03-01 | Arcsight, Inc. | Method and apparatus for exercising and debugging correlations for network security system |
| US7376969B1 (en) | 2002-12-02 | 2008-05-20 | Arcsight, Inc. | Real time monitoring and analysis of events from multiple network security devices |
| US8365278B1 (en) | 2002-12-02 | 2013-01-29 | Hewlett-Packard Development Company, L.P. | Displaying information regarding time-based events |
| US7219239B1 (en) | 2002-12-02 | 2007-05-15 | Arcsight, Inc. | Method for batching events for transmission by software agent |
| US8056130B1 (en) | 2002-12-02 | 2011-11-08 | Hewlett-Packard Development Company, L.P. | Real time monitoring and analysis of events from multiple network security devices |
| US7788722B1 (en) | 2002-12-02 | 2010-08-31 | Arcsight, Inc. | Modular agent for network security intrusion detection system |
| US7607169B1 (en) | 2002-12-02 | 2009-10-20 | Arcsight, Inc. | User interface for network security console |
| US8613083B1 (en) | 2002-12-02 | 2013-12-17 | Hewlett-Packard Development Company, L.P. | Method for batching events for transmission by software agent |
| US7650638B1 (en) | 2002-12-02 | 2010-01-19 | Arcsight, Inc. | Network security monitoring system employing bi-directional communication |
| US7861299B1 (en) | 2003-09-03 | 2010-12-28 | Arcsight, Inc. | Threat detection in a network security system |
| US7260844B1 (en) | 2003-09-03 | 2007-08-21 | Arcsight, Inc. | Threat detection in a network security system |
| US8015604B1 (en) | 2003-10-10 | 2011-09-06 | Arcsight Inc | Hierarchical architecture in a network security system |
| US9027120B1 (en) | 2003-10-10 | 2015-05-05 | Hewlett-Packard Development Company, L.P. | Hierarchical architecture in a network security system |
| US7333999B1 (en) | 2003-10-30 | 2008-02-19 | Arcsight, Inc. | Expression editor |
| US7565696B1 (en) | 2003-12-10 | 2009-07-21 | Arcsight, Inc. | Synchronizing network security devices within a network security system |
| US8230512B1 (en) | 2003-12-10 | 2012-07-24 | Hewlett-Packard Development Company, L.P. | Timestamp modification in a network security system |
| US8528077B1 (en) | 2004-04-09 | 2013-09-03 | Hewlett-Packard Development Company, L.P. | Comparing events from multiple network security devices |
| US7984502B2 (en) | 2004-05-04 | 2011-07-19 | Hewlett-Packard Development Company, L.P. | Pattern discovery in a network system |
| US7509677B2 (en) | 2004-05-04 | 2009-03-24 | Arcsight, Inc. | Pattern discovery in a network security system |
| US7424742B1 (en) | 2004-10-27 | 2008-09-09 | Arcsight, Inc. | Dynamic security events and event channels in a network security system |
| US8099782B1 (en) | 2004-10-27 | 2012-01-17 | Hewlett-Packard Development Company, L.P. | Event aggregation in a network |
| US9100422B1 (en) | 2004-10-27 | 2015-08-04 | Hewlett-Packard Development Company, L.P. | Network zone identification in a network security system |
| US7644438B1 (en) | 2004-10-27 | 2010-01-05 | Arcsight, Inc. | Security event aggregation at software agent |
| US7809131B1 (en) | 2004-12-23 | 2010-10-05 | Arcsight, Inc. | Adjusting sensor time in a network security system |
| US7647632B1 (en) | 2005-01-04 | 2010-01-12 | Arcsight, Inc. | Object reference in a system |
| US8065732B1 (en) | 2005-01-04 | 2011-11-22 | Hewlett-Packard Development Company, L.P. | Object reference in a system |
| US8850565B2 (en) | 2005-01-10 | 2014-09-30 | Hewlett-Packard Development Company, L.P. | System and method for coordinating network incident response activities |
| US7844999B1 (en) | 2005-03-01 | 2010-11-30 | Arcsight, Inc. | Message parsing in a network security system |
| US7437359B2 (en) | 2006-04-05 | 2008-10-14 | Arcsight, Inc. | Merging multiple log entries in accordance with merge properties and mapping properties |
| EP2255564A4 (en) * | 2008-03-14 | 2011-09-07 | Ericsson Telefon Ab L M | Alarm and event coordination between telecom nodes |
| EP2255564A1 (en) * | 2008-03-14 | 2010-12-01 | Telefonaktiebolaget L M Ericsson (PUBL) | Alarm and event coordination between telecom nodes |
| US8112378B2 (en) | 2008-06-17 | 2012-02-07 | Hitachi, Ltd. | Methods and systems for performing root cause analysis |
| US8732111B2 (en) | 2008-06-17 | 2014-05-20 | Hitachi, Ltd. | Method and system for performing root cause analysis |
| US8583581B2 (en) | 2008-06-17 | 2013-11-12 | Hitachi, Ltd. | Method and system for performing root cause analysis |
| US8990141B2 (en) | 2008-06-17 | 2015-03-24 | Hitachi, Ltd. | Method and system for performing root cause analysis |
| WO2009153901A1 (en) | 2008-06-17 | 2009-12-23 | Hitachi, Ltd. | Method and apparatus for performing root cause analysis |
| EP2355407A1 (en) * | 2010-01-26 | 2011-08-10 | Hitachi Ltd. | Failure display method, failure setting device and monitor control device |
Also Published As
| Publication number | Publication date |
|---|---|
| EP1382155B1 (en) | 2006-09-27 |
| US20060069956A1 (en) | 2006-03-30 |
| ATE341136T1 (en) | 2006-10-15 |
| EP1382155A4 (en) | 2004-09-01 |
| US6966015B2 (en) | 2005-11-15 |
| DE60214994D1 (en) | 2006-11-09 |
| DE60214994T2 (en) | 2007-06-14 |
| US20020170002A1 (en) | 2002-11-14 |
| US7318178B2 (en) | 2008-01-08 |
| EP1382155A1 (en) | 2004-01-21 |
Similar Documents
| Publication | Publication Date | Title |
|---|---|---|
| EP1382155B1 (en) | Method and system for reducing false alarms in network fault management systems | |
| US7877472B2 (en) | System and method for displaying historical performance of an element on a network | |
| US7131037B1 (en) | Method and system to correlate a specific alarm to one or more events to identify a possible cause of the alarm | |
| US6320585B1 (en) | Displaying resource performance and utilization information | |
| AU2002216660B2 (en) | Method and system for predicting causes of network service outages using time domain correlation | |
| US7603458B1 (en) | System and methods for processing and displaying aggregate status events for remote nodes | |
| US7076397B2 (en) | System and method for statistical performance monitoring | |
| US7050931B2 (en) | Computing performance thresholds based on variations in network traffic patterns | |
| AU2001270017A1 (en) | Liveexception system | |
| US5751964A (en) | System and method for automatic determination of thresholds in network management | |
| US6006016A (en) | Network fault correlation | |
| US6182022B1 (en) | Automated adaptive baselining and thresholding method and system | |
| US20080148180A1 (en) | Detecting Anomalies in Server Behavior | |
| US20020183972A1 (en) | Adaptive performance data measurement and collections | |
| US20050097207A1 (en) | System and method of predicting future behavior of a battery of end-to-end probes to anticipate and prevent computer network performance degradation | |
| US20080177874A1 (en) | Method and System for Visualizing Network Performance Characteristics | |
| US7502844B2 (en) | Abnormality indicator of a desired group of resource elements | |
| US20030135382A1 (en) | Self-monitoring service system for providing historical and current operating status | |
| US20030023716A1 (en) | Method and device for monitoring the performance of a network | |
| US20030101261A1 (en) | Failure analysis support system | |
| US7594014B2 (en) | Abnormality detection system, abnormality management apparatus, abnormality management method, probe and program | |
| US20060142001A1 (en) | Methods and apparatus for monitoring a communication network | |
| WO2003009140A2 (en) | System and method for adaptive threshold determination for performance metrics | |
| AU2002216660A1 (en) | Method and system for predicting causes of network service outages using time domain correlation | |
| Hoke et al. | InteMon: continuous mining of sensor data in large-scale self-infrastructures |
Legal Events
| Date | Code | Title | Description |
|---|---|---|---|
| AK | Designated states |
Kind code of ref document: A1 Designated state(s): AE AG AL AM AT AU AZ BA BB BG BR BY BZ CA CH CN CO CR CU CZ DE DK DM DZ EC EE ES FI GB GD GE GH GM HR HU ID IL IN IS JP KE KG KP KR KZ LC LK LR LS LT LU LV MA MD MG MK MN MW MX MZ NO NZ OM PH PL PT RO RU SD SE SG SI SK SL TJ TM TN TR TT TZ UA UG UZ VN YU ZA ZM ZW |
|
| AL | Designated countries for regional patents |
Kind code of ref document: A1 Designated state(s): GH GM KE LS MW MZ SD SL SZ TZ UG ZM ZW AM AZ BY KG KZ MD RU TJ TM AT BE CH CY DE DK ES FI FR GB GR IE IT LU MC NL PT SE TR BF BJ CF CG CI CM GA GN GQ GW ML MR NE SN TD TG |
|
| 121 | Ep: the epo has been informed by wipo that ep was designated in this application | ||
| DFPE | Request for preliminary examination filed prior to expiration of 19th month from priority date (pct application filed before 20040101) | ||
| WWE | Wipo information: entry into national phase |
Ref document number: 2002721542 Country of ref document: EP |
|
| WWP | Wipo information: published in national office |
Ref document number: 2002721542 Country of ref document: EP |
|
| REG | Reference to national code |
Ref country code: DE Ref legal event code: 8642 |
|
| NENP | Non-entry into the national phase |
Ref country code: JP |
|
| WWW | Wipo information: withdrawn in national office |
Country of ref document: JP |
|
| WWG | Wipo information: grant in national office |
Ref document number: 2002721542 Country of ref document: EP |