WO2007067632A2 - Method and system for detecting electrophysiological changes in pre-cancerous and cancerous tissue and epithelium - Google Patents
Method and system for detecting electrophysiological changes in pre-cancerous and cancerous tissue and epithelium Download PDFInfo
- Publication number
- WO2007067632A2 WO2007067632A2 PCT/US2006/046570 US2006046570W WO2007067632A2 WO 2007067632 A2 WO2007067632 A2 WO 2007067632A2 US 2006046570 W US2006046570 W US 2006046570W WO 2007067632 A2 WO2007067632 A2 WO 2007067632A2
- Authority
- WO
- WIPO (PCT)
- Prior art keywords
- impedance
- breast
- electrode
- tissue
- epithelial
- Prior art date
Links
Classifications
-
- A—HUMAN NECESSITIES
- A61—MEDICAL OR VETERINARY SCIENCE; HYGIENE
- A61B—DIAGNOSIS; SURGERY; IDENTIFICATION
- A61B5/00—Measuring for diagnostic purposes; Identification of persons
- A61B5/05—Detecting, measuring or recording for diagnosis by means of electric currents or magnetic fields; Measuring using microwaves or radio waves
- A61B5/053—Measuring electrical impedance or conductance of a portion of the body
Definitions
- the present invention relates generally to the detection of abnormal or cancerous tissue, and more particularly, to the detection of changes in the electrophysiological characteristics of abnormal or cancerous tissue and to changes in those electrophysiological characteristics related to the functional, structural and topographic (the interaction of shape, position and function) relationships of the tissue during the development of malignancy. These measurements are made in the absence and presence of pharmacological and hormonal agents to reveal and accentuate the electrophysiological characteristics of abnormal or cancerous tissue.
- Cancer is a leading cause of death in both men and women in the United States. Difficulty in detecting abnormal pre-cancerous or cancerous tissue before treatment options become non-viable is one of the reasons for the high mortality rate. Detecting of the presence of abnormal or cancerous tissues is difficult, in part, because such tissues are largely located deep within the body, thus requiring expensive, complex, invasive, and/or uncomfortable procedures. For this reason, the use of detection procedures is often restricted until a patient is experiencing symptoms related to the abnormal tissue. Many forms of cancers or tumors, however, require extended periods of time to attain a detectable size (and thus to produce significant symptoms or signs in the patient) . It is often too late for effective treatment by the time the detection is performed with currently available diagnostic modalities.
- mammography and clinical breast examination have relatively poor specificity in diagnosing breast cancer. Therefore many positive mammographic findings or lesions detected on clinical breast examination ultimately prove to be false positives resulting in physical and emotional trauma for patients . Improved methods and technologies to identify patients who need to undergo biopsy would reduce healthcare costs and avoid unnecessary diagnostic biopsies .
- One proposed method for early detection of cancerous and pre-cancerous tissue includes measuring of the electrical impedance of biological tissue.
- U.S. Patent No. 3,949,736 discloses a low-level electric current passed through tissue, with a measurement of the voltage drop across the tissue providing an indirect indication of the overall tissue impedance.
- This method teaches that a change in impedance of the tissue is associated with an abnormal condition of the cells composing the tissue, indicating a tumor, carcinoma, or other abnormal biological condition.
- This disclosure does not discuss either an increase or decrease in impedance associated with abnormal cells, nor does it specifically address tumor cells.
- the disadvantage of this and similar systems is that the DC electrical properties of the epithelium are not considered.
- Most common malignancies develop in an epithelium (the cell layer that lines a hollow organ, such as the bowel, or ductal structures such as the breast or prostate) , that maintains a transepithelial electropotential .
- the epithelium loses its transepithelial potential, particularly when compared to epithelium some distance away from the developing malignancy.
- the combination of transepithelial electropotential measurements with impedance are more accurate in diagnosing pre-cancerous and cancerous conditions.
- the frequency range is not defined. Certain information is obtained about cells according to the range of frequencies selected. Different frequency bands may be associated with different structural or functional aspects of the tissue. See, for example, F.A. Duck, Physical Properties of Tissues, London: Academic Press, 2001; K. R. Foster, H. P. Schwan, Dielectric properties of tissues and biological materials : a critical review, Crit. Rev. Biomed. Eng. , 1989, 17(1) : 25-104. For example at high frequencies such as greater than about 1 GHz molecular structure has a dominating effect on the relaxation characteristics of the impedance profile. Relaxation characteristics include the delay in the response of a tissue to a change in the applied electric field. For example, an applied AC current results in voltage change across the tissue which will be delayed or phase shifted, because of the impedance characteristics of the tissue. Relaxation and dispersion characteristics of the tissue vary according to the frequency of the applied signal.
- Characteristic alterations occur in the ion transport of an epithelium during the process of malignant transformation affecting the impedance characteristics of the epithelium measured at frequencies in the ⁇ -dispersion range. Later in the malignant process, structural alterations with opening of the tight junctions and decreasing resistance of the paracellular pathways, together with changes in the composition and volume of the cell cytoplasm and nucleus, affect the impedance measured in the ⁇ -dispersion range.
- Another disadvantage of the above referenced methods is that they do not probe the specific conductive pathways that are altered during the malignant process .
- potassium conductance is reduced in the surface epithelium of the colon early in the malignant process.
- the potassium conductance and permeability may be estimated in the surface epithelium at a depth from less than 500 ⁇ to the surface.
- EIT Electrical impedance tomography
- This approach relies on the differences in conductivity and impedivity between different tissue types and relies on data acquisition and image reconstruction algorithms which are difficult to apply clinically.
- Another disadvantage with using EIT to diagnose breast cancer is the inhomogeneity of breast tissue.
- the image reconstruction assumes that current passes homogeneously through the breast tissue which is unlikely given the varying electrical properties of different types of tissue comprising the breast.
- image reconstruction depends upon the calculation of the voltage distribution on the surface of the breast from a known impedance distribution (the so called forward problem) , and then estimating the impedance distribution within the breast from the measured voltage distribution measured with surface electrodes (the inverse problem) .
- Reconstruction algorithms are frequently based on finite element modeling using Poisson's equation and with assumptions with regard to quasistatic conditions, because of the low frequencies used in most EIT systems.
- Epithelial cells line the surfaces of the body and act as a barrier to isolate the body from the outside world. Not only do epithelial cells serve to insulate the body, but they also modify the body's environment by transporting salts, nutrients, and water across the cell barrier while maintaining their own cytoplasmic environment within fairly narrow limits.
- One mechanism by which the epithelial layer withstands the constant battering is by continuous proliferation and replacement of the barrier. This continued cell proliferation may partly explain why more than 80% of cancers are of epithelial cell origin.
- a disease process involving altered growth regulation may have associated changes in transport properties of epithelia.
- Intracellular Ca 2+ (Ca 2+ i) and pH (pHi) are increased by mitogen activation.
- Cell proliferation may be initiated following the activation of phosphatidylinositol which releases two second messengers, 1, 2-diacylglycerol and inosotol-1 , 4 , 5-triphosphate, which triggers Ca 2+ I release from internal stores.
- Ca 2+ ! and PH 1 may then alter the gating of various ion channels in the cell membrane, which are responsible for maintaining the voltage of the cell membrane. Therefore, there is the potential for interaction between other intracellular messengers, ion transport mechanisms, and cell membrane potential.
- Most studies have been performed in transformed and cultured cells and not in intact epithelia during the development of cancer.
- the cell membrane potential in a benign human breast epithelial cell line was observed to be -50 ⁇ 4 mV (mean ⁇ SEM) and was significantly depolarized at -35 ⁇ 1 mV (p ⁇ 0.002) in the same cell line after ras-transformation (the MCF-IOAT cell line).
- Apoptosis or physiological cell death is down- regulated during the development of malignancy.
- Ion transport mechanisms affected by apoptosis include the influx of Ca 2+ , non-selective Ca 2+ -permeable cation channels, calcium-activated chloride channels, and K + -Cl " -cotransport .
- J. A. Kim et al Involvement of Ca2+ influx in the mechanism of tamoxifen- induced apoptosis in Hep2G human hepatoblastoma cells. Cancer Lett.- 1999; 147(1-2): 115-123; A. A. Gutierrez et al .
- Tight junctions consist of cell-to-cell adhesion molecules. These adhesion proteins regulate the paracellular transport of molecules and ions between cells and are dynamic structures that can tighten the epithelium, preventing the movement of substances, or loosen allowing substances to pass between cells. Tight junctions consist of integral membrane proteins, claudins , occludins and JAMs (junctional adhesion molecules). Tight junctions will open and close in response to intra and extracellular stimuli.
- a number of substances will open or close tight junctions.
- the proinflammatory agent TGF-alpha, cytokines, IGF and VEGF opens tight junctions.
- Zonula occludens toxin, nitric oxide donors, and phorbol esters also reversibly open tight junctions.
- Other substances close tight junctions including calcium, H2 antagonists and retinoids.
- Various hormones such as prolactin and glucocorticoids will also regulate the tight junctions.
- Other substances added to drug formulations act as non-specific tight junction modulators including chitosan and wheat germ agglutinin.
- the above referenced substances and others may act directly or indirectly on the tight junction proteins, which are altered during carcinogenesis.
- claudin-7 is lost in breast ductal epithelium during the development of breast cancer.
- the response of the tight junctions varies according to the malignant state of the epithelium and their constituent proteins. As a result the opening or closing of tight junctions is affected by the malignant state of the epithelium.
- Polyps or overtly malignant lesions may develop in a background of disordered proliferation and altered transepithelial ion transport.
- Experimental animal studies of large bowel cancer have demonstrated that transepithelial depolarization is an early feature of the pre-malignant state, in nasal polyp studies, the lesions had a higher transepithelial potential, but ' these lesions were not pre- malignant in the same sense as an adenomatous or pre-malignant colonic polyp, that are usually depolarized.
- Electrical depolarization has been found in biopsies of malignant breast tissue. Recently alterations in impedance have been found to be associated with the pre-malignant or cancerous state in breast and bowel.
- transepithelial depolarization was a specific event associated with colonic carcinogenesis in CFi mice.
- a non-specific cytotoxic agent (5-fluorouracil) administered over the same period did not cause a reduction in V ⁇ in the same model .
- the reduction in V ⁇ was confirmed in a subsequent study where almost a 60% reduction was observed after- carcinogen treatment.
- V ⁇ is invariably higher when measured in vivo, the "premalignant " colonic epithelium is usually depolarized when compared to normal colon.
- DC electrical potential alterations have been used to diagnose non-malignant conditions such as cystic fibrosis, cancer in animal models, human cells or tissue and in man. Differences in impedance between normal tissue and cancer have been described in animal models in vitro human tissue in vitro and have been applied to in vivo cancer diagnosis.
- transepithelial potential and impedance may be quite variable and are affected by the hydration state, dietary salt intake, diurnal or cyclical variation in hormonal level or non-specific inflammatory changes and other factors. in the absence of knowledge about the physiological variables which influence transepithelial potential and impedance these kind of measurement may not be completely reliable to diagnose pre-malignancy or cancer.
- Breast cancer is thought to originate from epithelial cells in the terminal ductal lobular units (TDLUS) of mammary tissue. These cells proliferate and have a functional role in the absorption and secretion of various substances when quiescent and may produce milk when lactating. Functional alterations in breast epithelium have largely been ignored as a possible approach to breast cancer diagnosis.
- Breast epithelium is responsible for milk formation during lactation. Every month pre-menopausal breast epithelium undergoes a "rehearsal" for pregnancy with involution following menstruation. The flattened epithelium becomes more columnar as the epithelium enters the luteal phase from the follicular phase. In addition, duct branching and the number of acini reach a maximum during the latter half of the luteal phase. Just before menstruation apoptosis of the epithelium occurs and the process starts over again unless the woman becomes pregnant .
- EaC epithelial Na + channel
- CFTR cystic fibrosis transmembrane conductance regulator
- TEP Transepithelial potential
- V A voltage of the apical membrane
- R 3 paracellular (shunt) resistance.
- Apocrine cysts occur in 7% of the female population and are thought to develop in the TDLUs .
- Apocrine cysts have a higher potassium content than simple cysts .
- Apocrine cysts may be associated with the subsequent development of breast cancer. There may therefore be a fundamental change in the epithelium at risk for breast cancer development with a redistribution of electrolyte content across the cell membrane resulting in altered cyst electrolyte content and cell membrane depolarization.
- a number of approaches have been used to obtain ductal fluid, including a suction cup to obtained pooled secretions; nipple aspiration fluid (NAF), and more recently, cannulation of one of the 6-12 ducts that open onto the nipple surface. Substances and cells within the duct fluid may therefore be accessed to identify abnormalities that may be associated with the diseased state of the breast.
- NAF nipple aspiration fluid
- One disadvantage of the above referenced approaches is the difficulty in obtaining adequate NAF or lavage fluid to perform analysis.
- Another disadvantage has been the inability to identify or cannulate the ducts where an abnormality in the fluid or cells may be identified.
- Ionic gradients exist between the fluid secretions within the breast ducts and the plasma.
- the nipple aspirate fluid has a sodium concentration [Na + ] of 123.6 ⁇ 33.8 mEq/1 (mean ⁇ standard deviation) compared with a serum [Na + ] of approximately 150 mEq/1 (Petrakisl) .
- Nulliparous women have NAF [Na + ] that are approximately 10 mEq/1 higher than parous women, but still significantly below serum levels.
- potassium concentration [K + ] is significantly higher at 13.5 ⁇ 7.7 mEq/1 in parous women and 12.9 ⁇ 6.0 mEq/1 in nulliparous women compared with serum levels of [K + ] of approximately 5.0 mEq/1.
- Other investigators have reported lower NAF [Na + ] of 53.2 mEq/1 suggesting that significant ionic gradients can be established between the plasma and duct lumen in non-lactating breast. In pregnancy these gradients are even higher for sodium with a [Na + ] of 8.5 ⁇ 0.9 mEq/1 reported in milk which is almost 20 fold lower than plasma.
- Chloride concentration [Cl " ] in milk is almost one tenth of the concentration found in plasma with values of 11.9 ⁇ 0.5 mM reported.
- [Na + ] and [Cl " ] levels in ductal secretions rise and the [K + ] falls following the cessation of lactation, significant ionic gradients are maintained between the duct lumen and plasma.
- prolactin decreases the permeability of the tight-junctions between breast epithelial cells, stimulates mucosal to serosal Na + flux, upregulates Na + : K + : 2Cl " cotransport and increases the [K + ] and decreases the [Na + ] in milk.
- Glucocorticoids control the formation of tight-junctions increasing transepithelial resistance and decreasing epithelial permeability.
- Administration of Cortisol into breast ducts late in pregnancy has been shown to increase the [K + ] and decrease [Na + ] of ductal secretions.
- Progesterone inhibits tight-junction closure during pregnancy and may be responsible for the fluctuations in ductal fluid electrolytes observed during menstrual cycle in non-pregnant women, and discussed above.
- Estrogen has been observed to increase cell membrane and transepithelial potential and may stimulate the opening of K + - channels in breast epithelial cells.
- the hormones mentioned above vary diurnally and during menstrual cycle. It is likely that these variations influence the functional properties of breast epithelium altering the ionic concentrations within the lumen, the transepithelial potential and impedance properties, which are dependent upon the ion transport properties of epithelial cells and the transcellular and paracellular conductance pathways .
- a method for determining a condition of a region of epithelial or stromal tissue comprising: (A) establishing a connection between a first electrode and the tissue; (B) placing a second electrode in electrical contact on an outer tissue surface proximate the epithelial tissue; (C) establishing at least one electrical signal between the first and second electrodes; (D) measuring or deriving at least one electrical property between the first and second electrode, the property selected from the group consisting of impedance, DC potential, subepithelial resistance, epithelial resistance, capacitance, characteristic frequency, depression angle and transepithelial potential; and (E) determining the condition of a region of epithelial tissue based on the at least one property.
- the epithelial or stromal tissue is associated with the breast.
- Figure 1 is a schematic diagram of a DC and AC impedance measuring device, consistent with an embodiment of the present invention
- Figure 2 illustrates an exemplary embodiment of a device suitable for use with systems and methods consistent with the present invention
- Figure 3 illustrates an exemplary embodiment of a surface measurement probe suitable for use with systems and methods consistent with the present invention
- Figure 4 illustrates an exemplary embodiment of a nipple electrode suitable for use with systems and methods consistent with the present invention
- Figure 5 illustrates an exemplary embodiment of a ductal electrode probe suitable for use with systems and methods consistent with the present invention
- Figure 6 illustrates varying ionic content and the effect on transepithelial conductance in human breast epithelium
- Figure 7 illustrates measurements of cell membrane potential in human breast epithelial cells
- C0061 Figure 8 illustrates the effect of increasing estradiol concentrations on the transepithelial potential in benign and malignant breast epithelia
- Figure 9 illustrates conductance and the electropotential measurements made over the surface of the breast in women with and without breast cancer
- Figure 10 illustrates the measurement of electropotentials at the surface of the breast, and variation of the measurement during menstrual cycle
- Figure 11 illustrates electrophysiological changes that occur within the ductal epithelium during the development of breast cancer
- Figure 12 illustrates changes in the short circuit current of human epithelium exposed to a potassium channel blocker (TEA) or varying concentrations of potassium;
- TAA potassium channel blocker
- Figure 13 illustrates how the information obtained in figure 12 may be used to plot the potassium gradient against the change in short circuit current.
- Figure 14 illustrates multiple Nyquist impedance plots from human breasts according to the present invention.
- Figure 15 illustrates the impedance profile for a patient with a hemorrhagic cyst.
- Figure 16 illustrates a Bode plot of impedance data comparing patients with fibrocystic disease (0465) and breast cancer (0099) .
- Figure 17 illustrates the same data as in Figure 16 plotted as a Nyquist plot.
- Figure 18 illustrates the impedance spectra data curve for breast cancer tissue added to the curves of Figure 17.
- Figure 19 illustrates the effects of altering the level of suction applied to a nipple cup electrode on a normal breast.
- Figure 20 illustrates the effects of altering the level of suction applied to a nipple cup electrode on a breast in which malignancy is present.
- Figure 21 illustrates the method for estimating impedance for the high suction curve associated with cancer in Figure 20.
- Figure 22-1A is a representation of breast epithelium with different ion transport pathways.
- Figure 22-1B illustrates an electrical modeling of breast epithelium demonstrating the capacitive and resistive elements of the circuit.
- Figure 22-lC illustrates a Nyquist plot demonstrating how the different circuit parameters are obtained using a varying frequency sine wave to probe the epithelium.
- Figure 22-1D illustrates an electrical measurement set-up on a breast with a specially designed nipple sensor cup which makes electrical contact with the ductal epithelium.
- Figure 22-2A is a schematic representation of an electrical measurement set-up for the breast.
- Figure 22-2B is an example of a transepithelial impedance (Nyquist) plot obtained in normal control patient.
- Figure 22-2C is an example of a transepithelial impedance (Nyquist) plot for a patient with a carcinoma of the left breast.
- Figure 22-2D is an example of a transepithelial impedance (Nyquist) plot for a patient with benign fibrosis and invasive ductal cancer.
- Figure 22-3A compares open circuit potentials in benign and proliferative lesions.
- Figure 22-3B compares epithelial impedance and depression angle results in benign, proliferative and malignant lesions obtained using epithelial impedance spectroscopy .
- the present invention overcomes problems and inadequacies associated with prior methods used for characterizing abnormal or cancerous epithelial tissue.
- various embodiments of the present invention use DC and/or impedance measurements, under ambient and/or variable suction, that pass the current or signal across the breast epithelium and tumor using specially constructed electrodes.
- a nipple electrode may be used to measure the voltage and/or impedance between ductal epithelium, surrounding breast tissue, skin and surface or other electrode.
- the nipple electrode may also be used to pass the current along the ductal system of the breast.
- Another type of electrode may be used to measure the voltage and/or impedance signal, and/or pass a current and measure the signal at the individual ductal orifices at the nipple surface.
- Another type of electrode may be used to measure the voltage and/or impedance signal, and/or pass a current and measure the signal within individual ducts using a modified ductal probe or ductoscope which may have one or more electrodes attached to it. All of these electrodes may be used individually, in combination with one another, or with a surface probe or electrodes. Additionally DC and impedance measurements will be used in combination to more adequately characterize abnormal or cancerous tissues. DC measurements provide information about the functional state of the epithelium and can detect early pre-malignant changes and an adjacent malignancy.
- impedance measurements at several frequencies in specifically defined ranges using differently spaced electrodes provide depth and topographic information to give both structural (high frequency range) and functional (low frequency range) information about the tissue being probed.
- Abnormal or cancerous tissue can be detected and characterized by detecting and measuring transport alterations in epithelial tissues, using ionic substitutions and/or pharmacological and hormonal manipulations to determine the presence of abnormal pre-cancerous or cancerous cells .
- a baseline level of transepithelial DC potential, impedance or other electrophysiological property that is sensitive to alterations in transport in epithelia is measured in the tissue to be evaluated.
- An agent may be introduced to enhance the transport or make it possible to detect the transport alteration.
- the transepithelial DC potential and/or impedance of the tissue are then measured. Based on the agent introduced and the measured electrophysiological parameter, the condition of the tissue is determined.
- a method and system are provided for determining a condition of a selected region of breast epithelial tissue.
- At least two current-passing electrodes are located in contact with a first surface of the selected region of the tissue.
- the current passing electrodes may pass current across the tissue or epithelium as for example between the nipple ducts, ductal lumen, epithelium, breast parenchyma and surface of the breast.
- the ducts may be accessed by a central duct catheter or ductoscope.
- a plurality of measuring electrodes are located in contact with the first surface of the breast as well. Initially, one or more of the measuring electrodes is used to measure the DC potential referenced to another electrode, or reference point.
- a signal is established between the current-passing electrodes. Impedance, associated with the established signal, is measured by one or more of the measuring electrodes. Alternatively a three-electrode system may be used for measurements whereby one electrode is used for both current injection and voltage recording. An agent is introduced into the region of tissue. The condition of the tissue is determined based on the effect of the agent on measured DC transepithelial potential, impedance or other electrophysiological characteristic.
- the electrodes in the described methods and apparatus can be used in contact with, in proximity to, over, or inserted into the tissues being examined. It should be understood that where the method is described in an embodiment as encompassing one of these arrangements, it is contemplated that it can also be used interchangeably with the other.
- the method can also be used with the electrode inserted into or in proximity to the tissue.
- the method can also be in contact with or inserted into the tissue.
- a pharmacological agent in order to more accurately detect transport alterations in abnormal pre-cancerous or cancerous epithelial tissue, a pharmacological agent may be introduced to manipulate the tissue.
- Pharmacological agents may include agonists of specific ion transport and electrical activity, antagonists of specific ion transport and electrical activity, ionic substitutions, and/or hormonal or growth factor stimulation or inhibition of electrical activity.
- a number of methods may be used to administer the pharmacological or hormonal agents .
- One exemplary method includes introducing the agent directly to the tissue being investigated, via ductal infusion, perfusion, direct contact or injection.
- Another exemplary method includes applying the agent to the skin surface, wherein the agent acts transcutaneously, or through the skin.
- Yet another exemplary method includes electroporation, wherein the ductal epithelium or surface is made permeable by the passage of alternating current via electrodes in contact or penetrating the organ or epithelium of interest.
- the agent then passive diffuses into the organ and its constituent cells.
- the agent may be introduced directly into the breast ductal system using the modified nipple aspirator cup and electrode, or lavaged into a specific duct using a ductal catheter or probe.
- Additional exemplary methods include via inhalation, oral administration, lavage, gavage, enema, parenteral injection into a vein or artery, sublingually or via the buccal mucosa, or via intraperitoneal administration.
- the method chosen is determined by the tissue to be investigated.
- systems and methods consistent with the present invention use transepithelial electropotential or/and impedance measurements to diagnose pre-malignancy or cancer. Further, systems and methods consistent with the present invention use a defined set of frequencies , in combination, to characterize functional and structural alterations in pre- malignancy and cancer.
- the present invention may provide topographic and geometrical (depth) information about the epithelium under examination to diagnose pre-malignancy and cancer.
- systems and methods of the present invention use electrodes with specially formulated ECMs to provide functional information about the epithelium to diagnose pre-malignancy and cancer.
- the lumen of the duct be electrically accessed by a nipple electrode constructed to make an electrical connection between the Ag/AgCl (or similar low offset platinum/hydrogen, titanium, tin-lead alloy, nickel, aluminum, zinc, carbon, or other conductive metal or conductive polymer electrode) pellet recessed within the nipple cup.
- the cup is filled with an ECM (electro-conductive medium) , which enters the ductal system passively, or after aspiration with a syringe or pump, making contact with the ductal lumen.
- ECM electro-conductive medium
- a surface electrode placed at the surface of the breast completes the electrical circuit, so that measurements of transepithelial potential may be made between the ductal epithelium, or center of the tumor and the skin surface. Similar considerations have to be given to measure transepithelial AC impedance whereby the measuring electrodes measure the voltage drop and phase shift across the ductal epithelium or tumor, by utilizing a nipple electrode in combination with a skin surface electrode. Other configurations of this approach are more invasive, whereby measurement can be made between an electrode inserted via a ductoscope or nipple duct probe electrode referenced to the skin or an IV (intravenous), intradermal, or subcutaneous electrode. In another embodiment, the duct may also be accessed by a needle-electrode inserted through the skin.
- the electrodes may contain different ionic concentrations, pharmacological agents or hormones in their ECMs.
- an ECM is a medium that permits transmission of electrical signals between the surface being measured and the electrode.
- An agent includes any ionic concentration, pharmacological agent, hormone or other compound added to the ECM or otherwise introduced to the tissue under investigation, selected to provide further information about the condition of the tissue.
- the concentrations of agents may be changed using a flow through system.
- Electroconductive media can include conductive fluids, creams or gels used with external or internal electrodes to reduce the impedance (resistance to alternating current) of the contact between the electrode surface and the skin or epithelial surface.
- impedance resistance to alternating current
- the ECM will often contain a hydrogel that will draw fluid and electrolytes from deeper layers of the skin to establish electrical contact with the surface electrode.
- Electrodes that are used to pass current require ECMs with high conductance. Usually this is accomplished by using ECMs with high electrolyte content.
- the electrolytes frequently used are KCl (potassium chloride) because of the similar ionic mobility of these two ions in free solution, so that electrode polarization is less of a problem than when ions of different mobility are used.
- KCl potassium chloride
- Other ions such as sodium may be used in ECM formulations, and the higher electrolyte concentration result in more rapid electrode equilibration.
- the concentration of K in the ECM will be varied so that the conductance of the epithelium to potassium may be measured electrophysiologically.
- An enhancer or permeant may be added to the ECM to increase the conductance of the underlying skin to the electrolyte in the ECM.
- Other approaches include mild surface abrasion to reduce surface skin resistance or silicon electrodes, which just penetrate the stratum corneum to reduce skin surface resistance.
- the voltage drop will be made between surface electrodes with different spacing. Spacing will be determined by knowledge of the depth to be probed. Similarly two different frequency ranges will be used to measure functional and structural changes at different depths.
- a pharmacological agent is introduced to manipulate the tissue, while electrically probing the tissue at different frequencies and monitoring the voltage drop between differently spaced electrodes.
- Pharmacological agents include agonists of specific ion transport and electrical activity, antagonists of specific ion transport and electrical activity, ionic substitutions, and/or hormonal or growth factor stimulation or inhibition of electrical activity.
- a number of methods are used to administer the pharmacological or hormonal agents.
- One exemplary method includes introducing the agent directly to the tissue being investigated, via ductal perfusion, infusion, direct contact or injection.
- Another exemplary method includes applying the agent to the skin surface, wherein the agent acts transcutaneously, or through the skin.
- Yet another exemplary method includes electroporation, wherein the epithelium or surface is made permeable by the passage of alternating current via electrodes in contact or penetrating the surface of the breast or ductal epithelium of interest. The agent then passively diffuses into the breast and its constituent cells.
- Additional exemplary methods include via inhalation, oral administration, lavage, gavage, enema, parenteral injection into a vein or artery, sublingually or via the buccal mucosa, or via intraperitoneal administration.
- oral administration lavage, gavage, enema, parenteral injection into a vein or artery, sublingually or via the buccal mucosa, or via intraperitoneal administration.
- lavage gavage
- enema parenteral injection into a vein or artery
- sublingually or via the buccal mucosa or via intraperitoneal administration.
- measurements of electrophysiological properties are performed.
- Other properties that can be measured includes, transepithelial potential, changes in spontaneous oscillations in transepithelial potential or impedance associated with the malignant state, time delay in a propagation signal between electrodes, which indicates a loss of gap-junction function. If adjacent cells are electrically coupled, one can examine the loss of coupling by pharmacologically eliciting an electrical signal and measuring the signal propagation up and down-stream through surface epithelial cells . This is a functional measurement of the gap-junctions , whereas simple electrical stimulation will measure shunting of a current between the cells (a structural measurement, at least in the high frequency range) .
- the method and system of the present invention is applicable to any epithelial derived cancer, such as, but not limited to, prostate, colon, breast, esophageal, and nasopharyngeal cancers, as well as other epithelial malignancies, such as lung, gastric, uterine cervix, endometrial, skin and bladder.
- transport alterations may be sufficiently large to suggest that they are a consequence of an early mutat-ion, affecting a large number of cells (i.e., a field defect) .
- they may be exploited as potential biomarkers for determining which patients should be either more frequently monitored, or conversely, may be used to identify particular regions of epithelium that require biopsy.
- the latter is especially helpful in the case of atypical ductal hyperplasia or ductal carcinoma in situ (DCIS) , which are more difficult to detect mammographically, or by clinical breast examination without having to resort to an invasive biopsy.
- DCIS ductal carcinoma in situ
- Electrical resistance of the tumor may be lower at lower frequencies, for example, in the range of about 1 to about 0.1 hertz. This also depends on the type and size of the tumor .
- Capacitance of the tumor may be higher at the lower frequencies. This also depends on the pathological type and size of the tumor.
- the impedance When current is passed across a malignant tumor from another site on the breast or body, rather than from the nipple to the surface of the breast, the impedance may be lower when the voltage drop is measured across the tumor rather than between the nipple and the tumor i.e., across ductal epithelium.
- the capacitance is usually higher when the measurement is made across a malignant tumor, rather than across the ductal epithelium. Therefore a combination of measurements; nipple to breast surface (transepithelial impedance spectroscopy) , body surface to breast surface (transtumor impedance) , and transepithelial potential (ductal epithelium in series with skin provides the optimum diagnostic information .
- the methods of the present invention are particularly useful when use is made of the entire frequency range between about 60,000 Hertz and about 0.1 Hertz, although most of the discriminatory information is observed at frequencies below about 200Hz.
- the preferred protocol is to take 5-10 electrical measurements (impedance, reactance, phase angle, resistance, etc.) between about 60,000Hz and about 200Hz and then take as many measurements as possible (taking into consideration, for example, the comfort of the patient, response time of the equipment, etc.) between about 200 and about O.lHz; preferably between about 150Hz and about O.lHz; more preferably about 100Hz and about O.lHz; for example between about 50Hz and about 0.1Hz. In practice, this can mean taking about 20 to about 40 measurements in one or more of the lower frequencies ranges.
- a particularly improved device will employ an automated suction pump connected to a manometer to suction rhythmically, analogous to a breast pump, then employ a holding suction pressure at a predetermined level and then change the holding pressure to another level so that the effect of altered suction on the impedance spectra can be used as a diagnostic test.
- One probe or other device includes a plurality of miniaturized electrodes in recessed wells .
- Disposable commercially available silicon chips processing functions, such as filtering, may perform surface recording and initial electronic processing.
- Each ECM solution or agent may be specific to the individual electrode and reservoir on the chip.
- a particular set of electrodes is used for one measurement.
- a different set of electrodes is used for another measurement, for example, at a different ionic concentration. While this produces some variations, as the electrodes for one measurement are not located at the same points as for another, this system provides generally reliable results .
- An alternative approach is to use fewer electrodes and use a flow-through or microfluidic system to change solutions and agents. Specifically, solutions or agents are changed by passing small amounts of electrical current to move solution or agent through channels and out through pores in the surface of the probe. In this embodiment, the electrode remains in contact with the same region of the skin or ductal epithelium, thus eliminating region-to-region variation in measurement. This approach requires time for equilibration between different solutions.
- a hand-held probe for obtaining surface measurements at the skin.
- the probe may include electrodes for passing current as well as for measuring.
- An impedance measurement may be taken between the nipple cup electrode and the hand-held probe, or may be taken between electrodes on the hand-held probe.
- a ductoscopic or non-optical ductal probe may be interfaced with one or more miniaturized electrodes.
- a wetting/permeabilizing agent may be introduced to reduce skin impedance.
- the agent may be introduced using a microfluidic approach, as described above, to move fluid to the surface of the electrodes.
- surface electrodes that just penetrate the stratum corneum may be used to decrease impedance.
- Figure 1 is a schematic of a DC and AC impedance measurement system 100 used in cancer diagnosis, consistent with the present invention.
- the system 100 interfaces with a probe device 105 including multiple electrodes, wherein the actual implementation of the probe device 105 depends on the organ and condition under test.
- the probe device 105 may incorporate the electrodes attached to a needle, body cavity, ductoscopic, non-optical ductal or surface probe.
- a reference probe 110 may take the form of an intravenous probe, skin surface probe, nipple-cup or ductal epithelial surface reference probe depending on the test situation and region of breast under investigation.
- the electrodes may be connected via shielded wires to a selection switch 120 which may select a specific probe 105 following a command from the Digital Signal Processor (DSP) 130.
- the selection switch 120 also selects the appropriate filter interfaced to the probe 105, such that a low pass filter is used during DC measurements and/or an intermediate or high pass filter is used during the AC impedance measurements.
- the selection switch 120 passes the current to an amplifier array 140 which may be comprised of multiple amplifiers or switch the signals from different electrodes through the same amplifiers when multiple electrodes are employed.
- digital or analogue lock-in amplifiers are used to detect minute signals buried in noise.
- the switching element may average, sample, or select the signal of interest depending on the context of the measurement.
- This processing of the signal will be controlled by the DSP following commands from the CPU.
- the signals then pass to a multiplexer 150, and are serialized before conversion from an analogue to a digital signal by the ADC.
- a programmable gain amplifier 160 matches the input signal to the range of the ADC 170.
- the output of the ADC 170 passes to the DSP 130.
- the DSP 130 processes the information to calculate the DC potential and its pattern on the ductal- epithelial or skin surface as well as over the region of suspicion.
- the impedance at varying depth and response of the DC potential and impedance to different ECM concentrations of ions, drug, hormones, or other agent are used to estimate the probability of cancer.
- the results are then sent to the CPU 180 to give a test result 185.
- the signal interpretation may partly or completely take place in the CPU 180.
- An arbitrary waveform generator 190 or sine wave frequency generator will be used to send a composite waveform signal to the probe electrodes and tissue under test.
- the measured signal response (in the case of the composite wave form stimulus) may ⁇ be deconvolved using PPT (Fast Fourier Transforms) in the DSP 130 or CPU 180 from which the impedance profile is measured under the different test conditions.
- An internal calibration reference 195 is used for internal calibration of the system for impedance measurements. DC calibration may be performed externally, calibrating the probe being utilized against an external reference electrolyte solution.
- Figure 2 includes a handheld probe 400, consistent with the present invention, which may be applied to the surface of the breast.
- the probe may include a handle 410.
- the probe 400 may be attached, either directly or indirectly using, for example, wireless technology, to a measurement device 420.
- the probe 400 may be referenced to an intravenous electrode, a skin surface electrode, other ground, nipple electrode, or ductal probe electrode within the duct or at the nipple orifice.
- the reference is a nipple electrode or ductal probe 430, illustrated in greater detail at close-up 440.
- One advantage of this configuration is that DC electropotential and impedance can be measured between the nipple electrode 430 and the probe 400. The measurement is thus a combination of the DC potentials or/and impedance of the breast ductal epithelium, non-ductal breast- parenchyma, and the skin.
- the ductal probe is inserted into one of several ductal orifices that open onto the surface of the nipple.
- Ductal probe 443 is shown within a ductal sinus 444, which drains a larger collecting duct 445.
- nipple electrode Another advantage of using a nipple electrode is that a solution for irrigating the ductal system may be exchanged through the probe, permitting introduction of pharmacological and/or hormonal agents.
- nipple probe 443 , 443 ' fluid can be exchanged through a side port. Fluid may be infused into the duct and aspirated at the proximal end (away from the nipple) of the nipple probe.
- Different electrolyte solutions may be infused into the duct to measure altered permeability of the ductal epithelium to specific ions or the epithelium may be probed with different drugs to identify regions of abnormality.
- Estradiol, or other hormonal agents may be infused into a breast duct to measure the abnormal electrical response associated with pre-malignant or malignant changes in the epithelium.
- FIG. 3 illustrates the probe 400 of Figure 2 in greater detail.
- the skin contact of the surface 450 is placed in contact with the breast.
- the surface electrodes 451 measure DC or AC voltages.
- the current passing electrodes 452 are used for impedance measurements.
- Probe 400 may also include one or more recessed wells containing one or more ECMs. Multiple sensor electrode arrays may be attached to the surface probe together with current passing electrodes .
- the individual electrodes may be recessed and ECMs with different composition may be- ⁇ used to pharmacologically, electrophysiological ⁇ , or hormonally probe the deeper tissues or epithelium under test. Spacing of the electrodes may be greater for the breast configuration than for other organ systems so that deeper tissue may be electrically probed and the impedance of the deeper tissue evaluated.
- This probe may either be placed passively in contact with the surface of the breast or held in place by pneumatic suction over the region of interest. Ports may be placed for the exchange of solutions or for fluid exchange and suction (not shown) . Guard rings (not shown) may be incorporated to prevent crosstalk between electrodes and to force current from the contact surface into the breast. In this configuration there are four current passing electrodes [453] each positioned radially 90° apart. This permits current to be passed and the voltage response to be measured in perpendicular fields . The electrodes will be interfaced via electrical wire, or wireless technology, with the device described in figure 1 above.
- Further embodiments of this technique may involve the use of spaced electrodes to probe different depths of the breast, and the use of hormones, drugs, and other agents to differentially alter the impedance and transepithelial potential from benign and malignant breast tissue, measured at the skin surface. This enables further improvements in diagnostic accuracy.
- FIG 4 illustrates a nipple cup electrode [500] that may be used as a reference, current passing, voltage measuring or combination electrode [502] .
- suction and fluid exchange is applied to the electrode housing [501] through a side port [510] connected by a flexible hose [515] to a suction device, aspirator or syringe (not shown) .
- the flange [503] at the base of the cup is applied to the areola of the breast [520] .
- Pneumatic suction is applied through the side port and communicated to the housing by passage [512] so as to obtain a seal between the breast [520] and the nipple electrode [501].
- Electrolyte solution is used to fill the cup and make electrical contact with the underlying ductal system. Fluid may be exchanged, or pharmacological and hormonal agents introduced, by applying alternating suction and injecting fluid or drugs into the cup through the side port.
- the pneumatic suction will open up the duct openings [505] either by itself or after preparation with alcohol or de-keratinizing agents to remove keratin plugs at the duct openings at the surface of the nipple.
- the nipple cup electrode [502] may be interfaced by means of an electrical connection [530] or by a wireless connection (not shown) with the devices illustrated in figures 1-3 to obtain DC potential, AC impedance or combination measurements.
- FIG. 5 illustrates an alternative approach where an individual duct is probed with a flexible catheter electrode [550] attached to a syringe [555] .
- a saline filled syringe is connected to a flexible electrode [550] , which is inserted into the duct [551] .
- Fluid may be exchanged, or drugs and hormones may be infused into the duct, through the catheter.
- An electrode within, or attached to the syringe makes electrical contact with the individual ductal system, and the surface probe electrodes [552] complete the circuit so that the DC potential, AC impedance or a combination of both may be measured across the ductal epithelium, skin and intervening breast parenchyma in combination with the systems described in figures 1-3.
- Another approach would be to use a ductoscope in combination with a surface probe with the electrode (s) interfaced with the ductoscope.
- Devices to measure the electrophysiological characteristics of tissue and the differences between normal and abnormal tissue may include those known in the art such as electrical meters, digital signal processors, volt meters, oscillators, signal processors, potentiometers, or any other device used to measure voltage, conductance, resistance or impedance .
- DC potential is usually measured using a voltmeter, consisting of a galvanometer in series with a high resistance, and two electrodes (one working and one reference) . Voltmeters may be analog or digital. Ideally these should have an extremely high input resistance to avoid current-draw. DC potential may also be measured with an oscilloscope.
- Impedance may be measured using a number of approaches. Without limitation, examples include phase-lock amplifiers, which may be either digital or analog lock-in amplifiers . Pre-amplifiers may be used in conjunction with the lock-in amplifier to minimize stray currents to ground improving accuracy. Digital lock-in amplifiers are based on the multiplication of two sine waves, one being the signal carrying the amplitude-modulated information of interest, and the other being a reference signal with a specific frequency and phase. A signal generator can be used to produce the sine waves or composite signal to stimulate the tissue. Analog lock-in amplifiers contain a synchronous rectifier that includes a phase-sensitive detector (PSD) and a low-pass filter.
- PSD phase-sensitive detector
- the tissue response is deconvolved using fast Fourier transforms or other techniques.
- Bipolar, tripolar or tetrapolar current and voltage electrodes may be used to make measurements .
- tetrapolar electrode configurations are employed to avoid inaccuracies that are introduced due to electrode polarization and electrode- tissue impedance errors.
- current density may be measured using an array of electrodes at the epithelial or skin surface. Impedance may also be measured using electromagnetic induction without the need for electrode contact with the skin or epithelium.
- impedance and DC electrical potential have been used separately at the skin's surface to diagnose breast cancer. Neither of these methods measures the ductal transepithelial DC or AC electrical properties of the breast. This significantly reduces the accuracy of the approach, because the origins of breast cancer are within the ductal epithelium, and not the surrounding breast stroma. Accuracy is further improved when the transepithelial measurements of impedance and DC potential are combined.
- the use of pharmacological and/or hormonal agents in combination with impedance or DC electrical potential measurements provide a more effective method for detecting abnormal precancerous or cancerous breast tissue.
- TDLUs terminal ductal lobular units
- the TDLUs are lined by epithelial cells, which maintain a TEP (transepithelial potential).
- TEP terminal ductal lobular units
- the ducts are depolarized.
- the depolarization of ducts under the skin surface results in skin depolarization.
- the depolarization is significantly attenuated compared to that which is observed using a transepithelial ductal approach, as opposed to a non-transepithelial skin surface approach such as disclosed in Patents 6,351,666; 5,678,547; 4,955,383.
- the electrophysiological response of breast tissue to 17- ⁇ -estradiol has been observed to be different in pre-cancerous or cancerous epithelium than in normal breast epithelium.
- estradiol is introduced directly into the duct or systemically following sublingual administration of 17- ⁇ - estradiol (4 mg) .
- This agent produces a rapid response, which peaks at approximately 20 minutes.
- the electrophysiological response depends, in part, on the stage of the patient's menstrual cycle, as well as the condition of the breast tissue. Specifically, in normal breast tissue, a rise in TEP will occur during the follicular (or early) phase. In precancerous or cancerous tissue, this response is abrogated. Post-menopausal women at risk for breast cancer may have an exaggerated TEP response to estradiol because of up-regulated estrogen receptors on epithelial cell surfaces.
- estrogen, progesterone, prolactin, corticosteroids, tamoxifen or metabolites may be introduced either orally, intravenously, transcutaneous].:/, or by intraductal installation.
- breast or other cancers may be diagnosed by examining the basal conductance state of the paracellular pathway of the epithelium.
- a substance known to affect the conductance of the tight junctions may be infused into the duct, or administered by other mean, and the transepithelial impedance and/or the DC potential of the breast is measured, before and after the administration of the agent, using a combination of surface, nipple, ductal or other electrodes.
- the difference in the transepithelial electrical response of the tight junctions to the agent in normal compared to pre-malignant or malignant breast epithelium is then is used to diagnose the presence or absence of malignancy.
- the electrodes are placed over the suspicious region and the passive DC potential is measured. Then AC impedance measurements are made as discussed below.
- the variable impedance properties of the overlying skin may attenuate or increase the measured DC surface electropotentials .
- impedance measurements at different frequencies may initially include a superimposed continuous sine wave on top of an applied DC voltage. Phase, DC voltage and AC voltage will be measured. The resistance of the skin or other epithelium at AC and a different resistance at DC are measured. under DC conditions since there is no phase shift, it is possible to measure the transepithelial potential at the surface.
- the capacitive properties of the skin may allow the underlying breast epithelial and tumor potential to be measured at the skin surface .
- Figure 6 demonstrates the effect of varying the ionic content of the bathing Ringers solution on transepithelial conductance.
- the human breast epithelial cells were grown as monolayers on Millipore filters and grew to confluence in 7 to 10 days .
- the epithelia were then mounted in modified Ussing chambers and the DC conductances were measured using a voltage clamp.
- the conductance was measured by passing a 2 ⁇ A current pulse for 200 milliseconds and measuring the DC voltage response and calculating the transepithelial conductance (y-axis), and plotting it against time (x-axis) .
- the conductance was measured first in standard Ringer solution, then in a sodium- free Ringer, then returned to standard Ringer, then in a potassium-free Ringer and finally returning to standard Ringer solution while maintaining normal osmolality during the studies.
- the upper plot (filled squares and solid line) demonstrates the conductance of benign human breast epithelia grown as a monolayer. The conductance is higher in the benign epithelial cells. The Na + and K + components of conductance are approximately, 10 and 5 mS . cm "2 respectively.
- the lower plot (filled circles and dotted line) demonstrates the conductance of malignant human breast epithelia grown as a monolayer. The conductance is significantly lower in the malignant epithelial cells. The Na + and K + components of conductance are approximately, 4 and 1 mS.cm "2 respectively.
- Figure 7 demonstrates measurements of cell membrane potential ( ⁇ ) in human breast epithelial cells. Measurements were made using a potentiometric fluorescent probe, and ratiometric measurements, which are calibrated using valinomycin and [K + ] -gradients . ⁇ s were measured in the presence (closed circles) and absence (open circles) of estradiol (the active metabolite of estrogen) . Each symbol is the mean measurement. The upper error bar is the standard error of the mean, and the lower error bar is the 95% confidence level for the observations. The addition of estrogen to cultured breast epithelial cells results in an instantaneous increase in ⁇ (data not shown) as well as the transepithelial potential see figure 8.
- Figure 7 demonstrates that benign breast epithelial cells have a ⁇ of approximately -50 mV in the absence of estradiol and -70 mv when estradiol is added to the culture media.
- Malignant and transformed cells have a ⁇ of between - 31 and -35 mV in the absence of estradiol and approximately 50 mV when estradiol is present in the culture medium.
- the difference in the electrical properties may be exploited to diagnose breast cancer in vivo.
- Surface electropotential measurements are a combination of the transepithelial potential, tumor potential and overlying skin potential.
- Physiological doses of estradiol may be administered to the patient to increase ⁇ and the sustained effect of estradiol results in an increase in transepithelial potential and tumor potential measured as an increase in surface electropotential.
- the increase following sustained exposure is less in malignant than benign breast tissue.
- FIG 8 demonstrates the instantaneous effect of increasing doses of estradiol on the transepithelial potential (TEP) of benign and malignant human breast epithelial cells.
- TEP transepithelial potential
- the cells were grown as monolayers on Millipore filters and grew to confluence in 7 to 10 days.
- the epithelia were then mounted in modified Ussing chambers and the TEP was measured using a voltage clamp.
- Increasing doses of estradiol between 0 and 0.8 ⁇ M were added (x-axis) .
- the transepithelial potential was measured after each addition and the TEP was measured (y-axis) .
- the different dose response is apparent for benign and malignant epithelia.
- Malignant epithelia have a lower TEP but undergo an instantaneous increase in TEP of approximately 9 mV (becomes more electronegative and reaches a level of ⁇ -6 mV) after exposure to only 0.1 ⁇ M estradiol and then depolarize to approximately -2 mV with increasing doses of estradiol up to about 0.5 ⁇ M.
- Benign epithelia have a lesser response to increasing doses of estradiol and do not peak until almost 0.3 ⁇ M and then remain persistently elevated (higher electro negativity) , unlike the malignant epithelia, with increasing doses of estradiol.
- Estradiol, or other estrogens at a low dose will be administered systemically, transcutaneously, intraductally, or by other route.
- the instantaneous response of the surface electropotential and/or impedance may then be used to diagnose breast cancer with improved accuracy over existing diagnostic modalities using impedance or DC measurement alone.
- Figure 9 shows conductance measurements made at 2000 Hz at the surface of the breast. At this frequency the influence of the overlying skin impedance is less. There is still however some variable component of skin impedance, which results in significant variability of the measurement as evidenced by the overlapping error bars. Each symbol represents the median measurement with error bars the standard deviation of the mean.
- Open symbols represent measurements made in patients with a biopsy proven malignancy, while closed symbols represent measurements made in patients whose subsequent biopsy proved to be a benign process such as fibrocystic disease.
- Malignant lesions are often associated with surrounding breast epithelium that demonstrates Up-regulated proliferation. These regions (“adjacent region”) are depolarized and may have a lower conductance than either over the region of malignancy. This decreased conductance may be because of decreased K + -conductance of the adjacent and pre- malignant epithelium as I have observed in human colon.
- Each of the three groups of symbols represents measurements from over a suspicious lesion or region, then the adjacent region, and then over normal breast in an uninvolved quadrant of the breast.
- the first two symbols (circles) in each of the three groups are impedance measurements where the median value is plotted against the left y-axis as conductance in mS.cm "2 .
- the second two symbols (squares) is the surface electrical potential measured in mV and plotted against the right y-axis, • each division equals 5 mV.
- the third two symbols are the electrical index for benign and malignant lesions and are in arbitrary units and are derived from the conductance and surface potential measurement.
- breast cancer can be more accurately diagnosed using a combination of surface potential measurement and AC-impedance measurements. Further enhancements of this technique will involve the use of spaced electrodes to probe different depths of the breast, and the use of the hormones, drugs and other agents to differentially alter the impedance and transepithelial potential from benign and malignant breast tissue, and measured at the skin or duct surface. This will enable further improvements in diagnostic accuracy.
- FIG. 10 illustrates this variance. This figure demonstrates electropotential measurements taken over the surface of each breast at 8 different locations with an array of 8 electrodes on each breast referenced to an electrode on the skin of the upper abdomen. Measurements are taken with error bars equal to the standard error of the mean. Filled circles and filled squares represent the median value from the left and right breast respectively. The vertical dotted line is the first day of each menstrual cycle.
- estradiol or another agent that changes the electropotential of the breast may be administered systemically, topically (transdermal), intraductally or by other means, and the drug or hormone-induced change in surface potential may be used as a provocative test to diagnose breast cancer.
- FIG 11 is a diagram illustrating the histological and electrophysiological changes that occur during the development of breast cancer.
- the continuum from normal ductal epithelium, through hyperplasia, atypical hyperplasia, ductal carcinoma in situ (DCIS) , to invasive breast cancer is thought to take 10 to 15 years. Some of the steps may be skipped although usually a breast cancer develops within a background of disordered ductal proliferation.
- the normal duct maintains a transepithelial potential (inside of duct negatively charged) , which depolarizes and impedance, which increases during the development of cancer.
- the disordered ducts have altered electrophysiogical and ion transport properties. These properties are illustrated in the lower aspect of figure 11. These electrophysiological and transport alterations will be exploited to diagnose cancer and premalignant changes in the breast .
- breast cancer can be more accurately diagnosed using transepithelial measurements of potential, or impedance, or a combination of transepithelial surface potential measurement, AC-impedance measurements and pharmacological manipulations .
- the system and method of the present invention may be used with cancer preventative and therapeutic agents and treatments.
- electrical measurement of altered structure and function provides a method for evaluating a patient's response to the drugs without requiring a biopsy and without waiting for the cancer to further develop. Patients who respond to a given chemopreventative or therapeutic agent would likely show restoration of epithelial function to a more normal state. Patients who do not respond would show minimal change or may even demonstrate progression to a more advanced stage of the disease.
- This system and method may be used by either clinicians or drug companies in assessing drug response or by clinicians in monitoring the progress of a patient's disease and treatment, or monitoring the process of carcinogenesis (cancer development) , before an overt malignancy has fully developed.
- FIG. 12 demonstrates the short circuit current (Isc) of human colonic epithelium ex-vivo.
- the figure demonstrates the time course along the x-axis while varying the potassium gradient across the tissue.
- the potassium permeability of the apical membrane of human colonic mucosa (P ⁇ a ) was determined in surgical specimens of controls and grossly normal-appearing mucosa obtained 10-30 cm proximal to colorectal adenocarcinomas.
- the mucosa was mounted in Ussing chambers and the basolateral membrane resistance and voltage were nullified by elevating the K + in the serosal bathing solution.
- the apical sodium (Na + ) conductance was blocked with 0. ImM amiloride.
- This protocol reduces the equivalent circuit model of the epithelium to an apical membrane conductance and electromotive force in parallel with the paracellular pathway as has been verified by microelectrode studies.
- Increasing serosal K + caused the I sc to become negative (-140 uA/cm2) in normal colon after which 30 itiM mucosal TEA caused an abrupt increase in I sc corresponding to block of apical K + channels .
- the reduction in I sc is to -65 uA/cm 2 .
- the serosal bath was remained constant at 125 mM [K] .
- Figure 13 demonstrates mean ⁇ sem values for I sc in both normal and premalignant human distal colon.
- the apical K + permeability of controls was 9.34 x 10 "6 cm/ ⁇ ec and this was significantly reduced by 50% in premalignant human mucosa to 4.45 x 10 ⁇ 6 cm/sec.
- P ⁇ a could also be calculated for the change in I sc when the K + channels were blocked with TEA, assuming complete block. This resulted in somewhat lower values of 6.4 x 10 "6 cm/sec and 3.8 x 10 ⁇ 6 cm/sec corresponding to a 40% reduction in P ⁇ a .
- Amiloride may be introduced through the breast duct and then the ⁇ -concentration varied in the ECM used in the nipple electrode or irrigated into the duct to measure the reduced potassium permeability observed in the surrounding breast ductal epithelium (with atypical ductal hyperplasia or early DCIS), or increased permeability in the region of the developing invasive breast cancer.
- Figure 14 illustrates multiple Nyquist impedance plots from human breasts .
- Current was passed between a nipple cup electrode containing a physiological saline solution under suction to open up the breast ducts on the surface of the nipple, and an electrode placed on the surface of the breast.
- Voltage was then measured between the nipple and the region of interest using a separate set of voltage measuring electrodes. All measurements were made at 59 frequencies logarithmically spaced between 60,000 hertz and 1 hertz except for the fibrocystic with atypia case (filled squares), which was measured at 59 frequencies between 60,000 hertz and 0.1 hertz.
- the impedance curves demonstrate the lowest impedance at highest frequencies . As the frequency of the applied sine wave decreases the curves shift from left to right along the x-axis .
- Fig 15 illustrates the impedance profile for a patient with a hemorrhagic cyst. These studies were performed at frequencies from 60,000 hertz to 0.1 hertz. Measurements were made over the mass (lesion) in the 4 o'clock location of the breast and control measurements were made in the 10 o'clock location of the same breast. The high frequency- measurement demonstrates that the curves were superimposable. Separation begins at a frequency below 5 Hz. The resistance of the mass was higher than the control quadrant of the breast at low frequencies. Surface open circuit potential measurements showed depolarization of only 2 mV over the mass and therefore enabled discrimination from cancer despite the high impedance .
- Figure 16 illustrates a Bode plot of impedance plots comparing a patient with fibrocystic disease (0465) and a patient with breast cancer ((0099) . It can be seen that the impedance [Z] and theta (phase angle) separate at the lowest frequencies (open and closed symbols) . The data for the suspicious mass, which was identified as fibrocystic disease on pathology, the control region and the control region from the breast cancer are almost superimposable . At the low frequency end of the spectrum the cancer (0099D-filled circles) separates from the control quadrant measurement (0099C-open circles) at approximately 20 Hz.
- Figure 17 illustrates the same data as in figure 16 plotted as a Nyqui ⁇ t plot.
- the mass a region of fibrocystic disease 0465A-open squares
- the mass has a 5000 ⁇ lower impedance at the low frequency end of the curve to the right side of the x- axis, compared with the control region (0465B filled squares) .
- Plot 0099C open circles
- the curve shows a "double hump" indicating two different time constants ( ⁇ ) for the low and high frequency ends of the impedance spectra in the malignant breast. This characteristic appearance can also be utilized as a diagnostic tool.
- Figure 18 demonstrates the impedance spectra when the curve (0099D-filled circles) is added for the breast cancer to figure 17.
- the total impedance is significantly higher at 76397 ⁇ compared to 45447 ⁇ for the control quadrant, and the lower (high frequency) curves begin to separate below about 200 Hz.
- the cancer was depolarized by 26 mV compared with the control quadrant, and the fibrocystic disease was depolarized by 5.5 mV.
- the combination of higher impedance and greater depolarization enabled diagnosis of breast cancer in one patient and fibrocystic disease in the other despite the fibrocystic patient having impedances close to 50,000 ⁇ , a high value typically, but not necessarily suggesting the presence of cancer.
- Figure 19 illustrates the effects of altering the level of suction applied to the nipple cup electrode. Holding suction was established where 3 ml of saline was aspirated from the nipple cup and is illustrated as the impedance curve with open squares. The impedance is approximately 26,000 ⁇ . When an additional 2-3 ml of saline is aspirated from the nipple cup electrode the impedance curve collapses to an impedance of approximately 3000 ⁇ -filled squares. The addition of 1-2 ml of saline resulted in an increase in impedance (open circles), which increased to approximately 15000 ⁇ after 5 minutes (closed circles) .
- Figure 20 illustrates similar suction pressure experiments on a malignant breast: aspirating 3 ml of physiological saline from the nipple electrode, after holding suction is obtained, results in a decrease in total impedance from 45,447 ⁇ to 29,029 ⁇ in the control quadrant whereas impedance decreases from 76,937 ⁇ to 62,568 ⁇ over the cancer.
- the greatest decrease in impedance is seen at the high frequency end of the impedance spectra (curves on the left side of the X-axis) .
- the impedance decreases from 29216 to 1550 ⁇ in the control quadrant, and from 35824 to 10106 ⁇ over the cancer.
- the changes in impedance are much less in the lower frequency spectra (curves on the right-side of the X-axis) .
- a higher suction results in a decrease in impedance from 19985 to 16593 ⁇ in the control quadrant whereas the change is even less over the cancer decreasing from 72674 to 71229 ⁇ .
- Figure 21 illustrates the method used for estimating the impedance for the cancer high suction curve in Figure 20, where an arc is fitted to the impedance data and extrapolated to the x-axis at each end of the curve. The difference between the low and high intercepts is the estimated resistance of 72674 ⁇ .
- the Capacitance (C) is estimated from the reactance at the maximum height of the arc, and is 1.1652E-5.
- the Depression Angle (15.932) is the angle between the x-axi ⁇ and a line drawn from the origin of the x-axis to the center of the plotted arc.
- the methods of the present invention allow one to obtain multiple curves from the measured impedance information, typically two or more curves; for example about 2 to about 4 such curves; including 2, 3 or 4 curves.
- Each curve can provide different information about the condition of the tissues and structures associated with the breast, including:
- a high frequency curve (about 60,000 Hz to about 100 Hz) provides information about the nipple and overlying skin;
- a intermediate curve (about 100 Hz to about 10 Hz) provides information about the larger ducts and breast stroma;
- a low frequency curve (less than about 6 Hz, for example less than about 1 Hz) provides information about the terminal ductal lobular units (TDLUs) .
- Various embodiments of the present invention permit the use of various different frequencies and frequency- ranges, which may overlap those listed above and each, or a combination of two or more, may be capable of providing additional information that can assist in developing a more accurate diagnosis without the need for invasive procedures.
- use can be made of a curve generated based on a frequency range of about 100 Hs to about 6 Hs, as well as curves in selected ranges within the overall range just described, for example about 60,000 Hz to about 1 Hz or less.
- breast cancer causes a number of structural and functional changes to the breast
- R EPI / epithelial resistance - the difference between R ⁇ and Ro (the high and the low intercept of the curve with the X-axis, or the difference in the resistance at low and high frequency) ;
- Capacitance (C) - derived from the curve using the formula Z (Impedance on the Y-axis) l/2 ⁇ f c C;
- Characteristic frequency (f c ) the frequency at the highest point on the impedance curve
- Depression angle - the angle formed by a line drawn between the locus (center) of the impedance circle and the Ro or R ⁇ intercept on the x-axis;
- One embodiment of a probe or other device for use in the present invention includes a plurality of miniaturized electrodes in recessed wells.
- Surface recording and initial electronic processing, such as filtering, may be performed by disposable commercially-available silicon chips.
- Each ECM solution or agent may be specific to the individual electrode and reservoir on the chip.
- a particular set of electrodes would be used.
- a different set of electrodes would be used. While this produces some variations, as the electrodes for one measurement are not located at the same points as for another, this system provides generally reliable results.
- An alternative approach is to use fewer electrodes and use a flow-through or microfluidic system to change solutions and drugs. Specifically, solutions or agents are changed by passing small amounts of electrical current to move solution or agent through channels and out through pores in the surface of the device. In this embodiment, the electrode remains in contact with the same region of the surface of the breast, thus eliminating region-to-region variation in measurement. This approach requires time for equilibration between different solutions.
- a hand-held probe is provided for obtaining surface measurements at the skin.
- the probe may include electrodes for passing current as well as for measuring.
- An impedance measurement may be taken between the nipple cup electrode and the hand-held probe, between a nipple cup electrode and adhesive skin electrodes, between electrodes on a miniature ductoscope, between electrodes on a ductoscope and the skin surface electrodes, or may be taken between electrodes on the hand-held probe.
- a wetting/permeabilizing agent may be introduced to reduce skin impedance.
- the agent may be introduced using a microfluidic approach, as described above, to move fluid to the surface of the electrodes.
- surface electrodes that just penetrate the stratum corneum may be used to decrease impedance.
- Fluids for use with the present inventions could include various electrolyte solutions such as physiologic saline (e.g. Ringers) with or without pharmacological agents.
- physiologic saline e.g. Ringers
- One preferable electrolyte solution to infuse into the ductal system will represent a physiological Ringer solution. Typically this consists of NaCl 6 g, KCl 0.075 g, CaCl 2 0.1 g, NaHCCb 0.1 g, and smaller concentrations of sodium hyper and hypophosphate at a physiological pH of 7.4.
- Other electrolyte solution may be used were the electrolyte comprises approximately 1% of the volume of the solute.
- Hypertonic or hypotonic solutions that are greater or less than 1% may be used in provocative testing of the epithelium and/or tumor.
- concentration of Na, K and Cl will be adjusted under different conditions to evaluate the conductance and permeability of the epithelium.
- Different pharmacological agents such as amiloride (to block electrogenic sodium absorption) , Forskolin (or similar drugs to raise cyclic-AMP) and hormones such as prolactin or estradiol can also be infused with the Ringer solution to examine the electrophysiological response of the epithelium and tumor to these agents.
- the calcium concentration of the infusate will be varied to alter the tight junction permeability and measure the electrophysiological response of the epithelium to this manipulation.
- Dexamethasone may be infused to decrease the permeability of the tight junctions, and the electrophysiological response will be measured.
- any agonist or antagonist of specific ionic transport, or tight-junctional integrity, known to be affected during carcinogenesis may be used, particularly when it is known to influence the electrophysiological properties of the epithelium or tumor.
- a signal is used to measure either the ductal tran ⁇ epithelial potential by itself, or the transepithelial impedance. These two measurements may then be combined to characterize the electrical properties of the epithelium associated with a developing abnormality of the breast, and are then compared with uninvolved areas of the same or opposite breast. Surface electropotential measurements and impedance measurements are then made to characterize the non-transepithelial electrical properties of the breast. These measurements involve DC potential measurements where the surface potential is referenced to an electrode that is not in contact directly, or indirectly through an ECM, with the duct lumen.
- Impedance measurements are similarly made between surface electrodes or a surface electrode and a reference electrode not in contact directly or indirectly (through an ECM) with the ductal lumen. These measurements are then compared and combined with the transepithelial electrical measurements to further characterize the breast tissue.
- impedance or DC potential may increase or decrease because of several factors.
- Increased stromal density of the breast may alter its impedance. This is a non-specific change, which may not have bearing on the probability of malignancy.
- a decrease in the potassium permeability of the epithelia around a developing malignancy would increase impedance and would be more likely associated with a developing cancer than a non-specific impedance change. Additional information is obtained from my method by probing the tissue to different depths using spaced voltage-sensing electrodes.
- a cup electrode may be used in other organs where the epithelium may be difficult to access endoscopically, or an endoscopic approach is not desired.
- An example would be the pancreatic and bile ducts, which join and open at the ampulla of Vater within the second part of the duodenum. Bile duct tumors develop from the endothelial lining of the bile duct, (i.e., cholangiocarcinomas , or the epithelial lining of the pancreatic duct, i.e., pancreatic carcinomas).
- the ampulla may be accessed endoscopically and a cup electrode applied by suction to the ampulla.
- Physiological saline can be infused into the ducts and then a transepithelial potential and impedance could be measured intraoperatively to identify the region of tumor in the pancreatic, or bile duct using a second electrode placed on the peritoneal surface of the pancreas or bile duct.
- the peritoneal surface electrode may be replaced by a skin surface, or intravenous electrode when used in a minimally or non-invasive manner.
- Drugs may be infused though the cup electrode as a provocative test and described for breast.
- Secretin for example, stimulates bicarbonate secretion by the pancreatic ducts. This response may be abrogated by changes in the epithelium associated with pancreatic carcinoma.
- the distribution of muscarinic receptors, particularly Ml and M3 may be altered in the epithelium during pancreatic carcinogenesis.
- muscarinic agonists cholinomimetic choline esters and natural alkaloids
- antagonists atropine, Pirenzepine (Ml), Darifenacin (M3 )
- atropine Pirenzepine (Ml)
- Similar approaches may be used in the intra and extrahepatic bile ducts to diagnose liver cancer.
- Prostatic cancer may be diagnosed using a urethral cup electrode applied to the external urethral meatus. Physiological saline is infused into the urethra. Direct electrical connection is established with the prostatic ductal and acinar epithelium via prostatic ducts that open into the prostatic urethra. A surface electrode may then be placed per rectum onto the surface of the prostate and electrophysiological measurements may be made in a transepi thelial fashion as described in the breast. Similarly, provocative tests may be performed with drugs and hormones that differentially affect the electrophysiological characteristics of abnormal prostatic epithelium when compared to normal prostatic tissue.
- Endometrial cancer may be diagnosed with an electrode cup placed on the uterine cervix.
- Physiological saline may be infused through the cervical canal to make electrical contact with the endometrium.
- Electrophysiological measurements may be made with a reference electrode, placed on the skin, intravenously or at a suitable reference point. Alternatively, this approach may be used during surgery where the cervical cup electrode is used in conjunction with a reference electrode used on the peritoneal or outside surface of the uterus .
- Salivary gland tumors open through small ducts into the oral cavity.
- Stensen's duct opens inside the mouth opposite the second upper molar tooth.
- a cup electrode may be used over the opening of the duct inside the mouth.
- Physiological saline is infused into the duct and electrical contact is thus established with the ductal epithelium of the salivary gland.
- a surface electrode is then used over the skin surface of the gland and electrical measurements are used to establish the diagnosis of cancer.
- this technique may be used to diagnose any tumor, where endoscopic access to the epithelium is not possible or desired.
- the application of physiological saline via a cup or short catheter may be used for example in the bowel or other organ system where electrical contact with the epithelium permits a transepithelial electrophysiological measurement to be made without resorting to endoscopic electrode placement.
- the second electrode is then used to externally scan the organ for the presence of a tumor or abnormal epithelium. Since the physiological saline acts as an electrode in direct contact with the epithelium this approach simplifies the approach to electrophysiological measurements. Depolarization and the impedance characteristics of the epithelium will be more accurate when the surface-scanning electrode is in close proximity to the underlying abnormal epithelium or tumor.
- EXAMPLE 1 Breast Cancer Diagnosis Using Ductal Epithelial Impedance Spectroscopy
- Alterations in ion conductance and transport [1] represent early events in cellular proliferation and malignant transformation.
- Breast cancer develops within the ductal or lobular epithelium of the breast.
- functional changes occur in transgenic models of breast cancer [2, 3], and it has been demonstrated that a down-regulation of specific ionic conductances occurs in human breast epithelia during breast cancer development [4, 5].
- electrical impedance scanning [6] or tomography have been used to image mass lesions within the breast and for risk assessment, epithelial impedance spectroscopy has not been utilized to diagnose cancer in the epithelium, where breast cancer originates .
- One embodiment of the present invention illustrated in this example is an "Electronic Biopsy" to non-invasively identify breast cancer in the epithelium.
- Figure 22-1A Representation of breast epithelium with different ion transport pathways.
- Figure 22-1B Electrical modeling of breast epithelium demonstrating the capacitive and resistive elements of the circuit.
- Figure 22-lC A Nyquist plot demonstrating how the different circuit parameters are obtained using a varying frequency sine wave to probe the epithelium.
- Figure 22-1D Measurement set-up with a specially designed nipple sensor cup which makes electrical contact with the ductal epithelium.
- Figure 22-2A Schematic representation of measurement set-up. Current is passed between the nipple sensor and surface electrodes, in this example using a four electrode system and FRA (Frequency Response Analyzer) .
- Figures 22-2B through 22-2D Examples of Nyquist Plots obtained in normal control (B) and patients prior to biopsy (C, D) .
- the Nyquist plot Figure 22-2B is inverted compared to Nyguist plots Figures 22-2C and 22-2D.
- Figure 22-3A Open Circuit Potentials. No significant differences were observed when the open circuit potentials were compared between lesions that were benign
- Figure 22-3B Epithelial Impedance Spectroscopy.
- the epithelial impedance profile was significantly different when benign breast lesions were compared to malignant lesions.
- Epithelial resistance in breast cancers was 393.2 ⁇ 24.9 K ⁇ (mean ⁇ SEM) compared to 124.3 ⁇ 24.9 K ⁇ in benign lesions (p ⁇ 0.02).
- the epithelial resistance was intermediate between benign and malignant lesions ( Figure 22-3B) .
- the epithelial impedance and the depression angle of the Nyquist plots were greater in malignant epithelium ( Figures 22-lC and 22-3B) .
- the first pair of bars are the impedance and depression angle values for a benign lesion; the second pair of bars for a proliferative lesion and the third pair for a malignant lesion, in each instance the bar to the right in each pair indicating the value of the depression angle.
- a positive value shows that the center of the semicircular arc in the Nyquist plot is depressed below the X-axis in Figure 1C of the poster (by convention, a Nyquist plot is from bottom-positive to top- negative, thereby resulting in an inverted semicircle) .
- This figure shows that at low frequencies differences in the electrical signature can be observed.
- epithelial impedance and the depression angle of the Nyquist plots were greater in malignant epithelium.
- the diagnostic electrical characteristics described above have been applied to observations based on sample sizes varying between 110 and 150 patients as described below.
- Group 1 refers to benign (BN) lesions
- Group 2 refers to larger cancers (CA) , >1 cm;
- Group 3 refers to AH (Atypical Hyperplasia) or hyperplasia and proliferative lesions; and Group 4 refers to DCIS (Ductal-Carcinoma-ln-Situ) and small cancers, ⁇ 1 cm.
- R SUBI subepithelial resistance defined for purposes of this analysis as the resistance value at R ⁇ where the impedance curve intercepts the X-axis at high frequency (60,000 Hz) on the left of the curve illustrated, for example, in Fig. 22-lC.
- R SUB increases in proliferative disease and cancer.
- a multiple comparison procedure can be used to isolate the group or groups that differ from the others, for example, Dunn's method using all Pairwise Multiple Comparison Procedures :
- R EP i or epithelial resistance is the difference between R ⁇ and R 0 (the high and the low intercept of the curve with the X-axis, or the difference in the resistance at low and high frequency) . Note the actual resistance depends on the shape of the plot and where the component curves separate, such that the circuit components can be derived. This value tends to increase in proliferative disease (AH Lesions) and
- DCIS or small cancers DCIS or small cancers (DCIS, small CA) , but decreases in larger cancers (larger CA) when the tight junctions break down between cells.
- Typical values obtained are obtained as illustrated in the examples below, including data based on the results of measurements at all frequencies identified, frequencies in the range of 60,000 Hz to 10 Hz and frequencies of 6 Hz to 0.1 Hz.
- a multiple comparison procedure can be used to isolate the group or groups that differ from the others, for example, Dunn's method using all Pairwise Multiple Comparison Procedures :
- a multiple comparison procedure can be used to isolate the group or groups that differ from the others, for example, Dunn's method using all Pairwise Multiple Comparison Procedures :
- 0.1 Hs i.e., it examines the difference between the high and low intercept of the impedance curve on the X-axis drawn for frequencies 6 Hz-O.1 Hz.
- a multiple comparison procedure can be used to isolate the group or groups that differ from the others, for example, Dunn's method using all Pairwise Multiple Comparison Procedures :
- a multiple comparison procedure can be used to isolate the group or groups that differ from the others, for example, Dunn's method using all Pairwise Multiple Comparison Procedures :
- a multiple comparison procedure can be used to isolate the group or groups that differ from the others. All Pairwise Multiple Comparison Procedures (Dunn's Method):
- Characteristic frequency (fc) is the frequency at the highest point on the impedance curve. In the high frequency curves this tends to increase in larger cancers and tends to be lower in smaller cancers or DCIS. In the lower frequency curves there tends to be less discrimination for the larger cancers, but f c tends to be lower for smaller cancers and proliferative disease.
- a multiple comparison procedure is used to isolate the group or groups that differ from the others. All Pairwise Multiple Comparison Procedures (Dunn's Method):
- Depression angle is defined as the angle formed by a line drawn between the locus (center) of the impedance circle and the Ro or R °° intercept on the X-axi . This progressively decreases with proliferative changes, small cancers, and may become negative with larger cancers in the low frequency ( ⁇ 6
- a multiple comparison procedure is used to isolate the group or groups that differ from the others use a multiple comparison procedure. All Pairwise Multiple Comparison Procedures (Dunn's Method):
- Open Circuit Potential or Transepithelial potential is measured between the nipple and the surface electrode. No difference is noted between the Cancer group and the Benign Lesion group (BN) . However when the proliferative benign and the cancers are combined (CA or Prolif . Lesion) and compared with the non-proliferative benign lesions, significant depolarization was observed
- Time Constant is defined as the value R x C (Product of Resistance and Capacitance) . its value is in seconds .
- R x C Product of Resistance and Capacitance
- the Nyquist plots splits into two or more curves (double or triple "humps").
- notch frequency i.e., the frequency at which two curves separate .
- the notch frequency value may provide further discriminatory information between cancer and benign lesions, further enhancing the value of the data obtained by embodiments of the present invention.
- T c increases in the high frequency range in proliferative disease and cancer, and is higher in the low frequency range for proliferative disease, small cancers and
- Time Constant (T c ) 6 Hz-O.1 Hz; all values expressed in seconds (25% and 75%, value at the 25 th and 75 th percentile)
- a multiple comparison procedure is used to isolate the group or groups that differ from the others. All Pairwise Multiple Comparison Procedures (Dunn's Method):
Abstract
Description
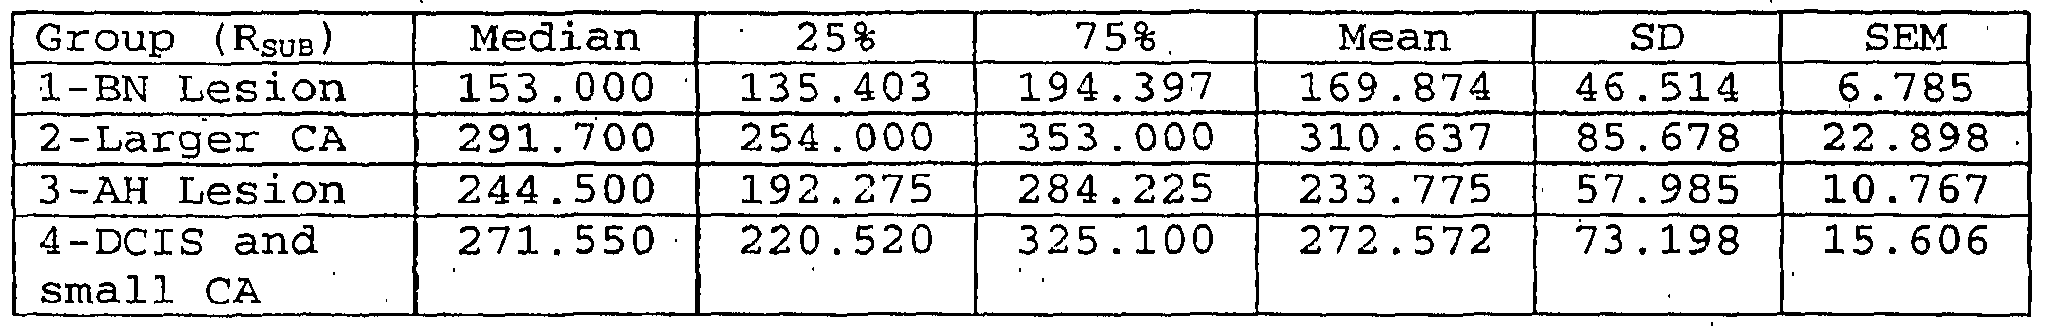


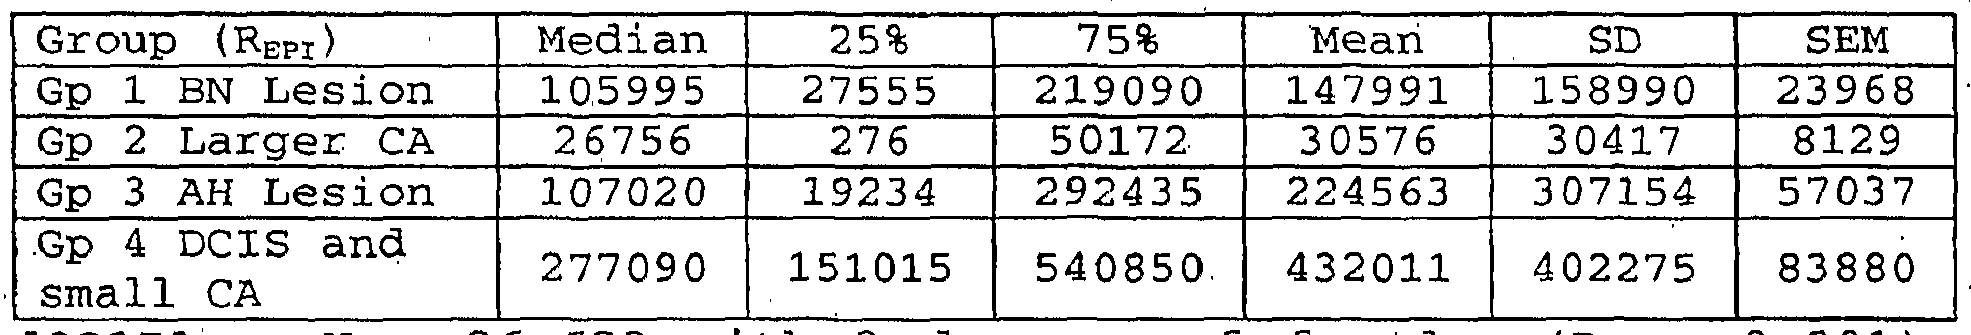


Claims
Priority Applications (5)
| Application Number | Priority Date | Filing Date | Title |
|---|---|---|---|
| EP06844899A EP1956972A2 (en) | 2005-12-06 | 2006-12-06 | Method and system for detecting electrophysiological changes in pre-cancerous and cancerous tissue and epithelium |
| CA002630921A CA2630921A1 (en) | 2005-12-06 | 2006-12-06 | Method and system for detecting electrophysiological changes in pre-cancerous and cancerous tissue and epithelium |
| US12/086,021 US8332025B2 (en) | 2005-12-06 | 2006-12-06 | Method and system for detecting electrophysiological changes in pre-cancerous and cancerous tissue and epithelium |
| JP2008544481A JP2009518131A (en) | 2005-12-06 | 2006-12-06 | Methods and systems for detecting electrophysiological changes in precancerous and cancerous tissues and epithelium |
| AU2006321922A AU2006321922A1 (en) | 2005-12-06 | 2006-12-06 | Method and system for detecting electrophysiological changes in pre-cancerous and cancerous tissue and epithelium |
Applications Claiming Priority (2)
| Application Number | Priority Date | Filing Date | Title |
|---|---|---|---|
| US74283005P | 2005-12-06 | 2005-12-06 | |
| US60/742,830 | 2005-12-06 |
Publications (2)
| Publication Number | Publication Date |
|---|---|
| WO2007067632A2 true WO2007067632A2 (en) | 2007-06-14 |
| WO2007067632A3 WO2007067632A3 (en) | 2008-11-27 |
Family
ID=38123462
Family Applications (1)
| Application Number | Title | Priority Date | Filing Date |
|---|---|---|---|
| PCT/US2006/046570 WO2007067632A2 (en) | 2005-12-06 | 2006-12-06 | Method and system for detecting electrophysiological changes in pre-cancerous and cancerous tissue and epithelium |
Country Status (6)
| Country | Link |
|---|---|
| US (1) | US8332025B2 (en) |
| EP (1) | EP1956972A2 (en) |
| JP (1) | JP2009518131A (en) |
| AU (1) | AU2006321922A1 (en) |
| CA (1) | CA2630921A1 (en) |
| WO (1) | WO2007067632A2 (en) |
Cited By (28)
| Publication number | Priority date | Publication date | Assignee | Title |
|---|---|---|---|---|
| WO2009093238A1 (en) * | 2008-01-22 | 2009-07-30 | Yeda Research And Development Co. Ltd. | Method and device for monitoring breastfeeding |
| US7857813B2 (en) | 2006-08-29 | 2010-12-28 | Baxano, Inc. | Tissue access guidewire system and method |
| US7887538B2 (en) | 2005-10-15 | 2011-02-15 | Baxano, Inc. | Methods and apparatus for tissue modification |
| US7938830B2 (en) | 2004-10-15 | 2011-05-10 | Baxano, Inc. | Powered tissue modification devices and methods |
| US7959577B2 (en) | 2007-09-06 | 2011-06-14 | Baxano, Inc. | Method, system, and apparatus for neural localization |
| US8048080B2 (en) | 2004-10-15 | 2011-11-01 | Baxano, Inc. | Flexible tissue rasp |
| US8062300B2 (en) | 2006-05-04 | 2011-11-22 | Baxano, Inc. | Tissue removal with at least partially flexible devices |
| US8062298B2 (en) | 2005-10-15 | 2011-11-22 | Baxano, Inc. | Flexible tissue removal devices and methods |
| US8092456B2 (en) | 2005-10-15 | 2012-01-10 | Baxano, Inc. | Multiple pathways for spinal nerve root decompression from a single access point |
| JP2012500663A (en) * | 2008-08-22 | 2012-01-12 | エル. フォーペル、マーク | Method and apparatus for disease diagnosis and screening using extremely low frequency electromagnetic fields |
| US8192436B2 (en) | 2007-12-07 | 2012-06-05 | Baxano, Inc. | Tissue modification devices |
| US8257356B2 (en) | 2004-10-15 | 2012-09-04 | Baxano, Inc. | Guidewire exchange systems to treat spinal stenosis |
| US8366712B2 (en) | 2005-10-15 | 2013-02-05 | Baxano, Inc. | Multiple pathways for spinal nerve root decompression from a single access point |
| US8394102B2 (en) | 2009-06-25 | 2013-03-12 | Baxano, Inc. | Surgical tools for treatment of spinal stenosis |
| US8398641B2 (en) | 2008-07-01 | 2013-03-19 | Baxano, Inc. | Tissue modification devices and methods |
| US8409206B2 (en) | 2008-07-01 | 2013-04-02 | Baxano, Inc. | Tissue modification devices and methods |
| US8419653B2 (en) | 2005-05-16 | 2013-04-16 | Baxano, Inc. | Spinal access and neural localization |
| US8430881B2 (en) | 2004-10-15 | 2013-04-30 | Baxano, Inc. | Mechanical tissue modification devices and methods |
| US8568416B2 (en) | 2004-10-15 | 2013-10-29 | Baxano Surgical, Inc. | Access and tissue modification systems and methods |
| US8579902B2 (en) | 2004-10-15 | 2013-11-12 | Baxano Signal, Inc. | Devices and methods for tissue modification |
| US8613745B2 (en) | 2004-10-15 | 2013-12-24 | Baxano Surgical, Inc. | Methods, systems and devices for carpal tunnel release |
| US8647346B2 (en) | 2004-10-15 | 2014-02-11 | Baxano Surgical, Inc. | Devices and methods for tissue modification |
| US8801626B2 (en) | 2004-10-15 | 2014-08-12 | Baxano Surgical, Inc. | Flexible neural localization devices and methods |
| US8845639B2 (en) | 2008-07-14 | 2014-09-30 | Baxano Surgical, Inc. | Tissue modification devices |
| US9101386B2 (en) | 2004-10-15 | 2015-08-11 | Amendia, Inc. | Devices and methods for treating tissue |
| US9247952B2 (en) | 2004-10-15 | 2016-02-02 | Amendia, Inc. | Devices and methods for tissue access |
| US9314253B2 (en) | 2008-07-01 | 2016-04-19 | Amendia, Inc. | Tissue modification devices and methods |
| US9456829B2 (en) | 2004-10-15 | 2016-10-04 | Amendia, Inc. | Powered tissue modification devices and methods |
Families Citing this family (20)
| Publication number | Priority date | Publication date | Assignee | Title |
|---|---|---|---|---|
| AU2006265763B2 (en) | 2005-07-01 | 2012-08-09 | Impedimed Limited | Monitoring system |
| JP5607300B2 (en) | 2005-07-01 | 2014-10-15 | インぺディメッド リミテッド | Apparatus and method for performing impedance measurements on an object |
| WO2008064426A1 (en) | 2006-11-30 | 2008-06-05 | Impedimed Limited | Measurement apparatus |
| WO2008095108A1 (en) * | 2007-02-01 | 2008-08-07 | Ls Biopath, Inc. | Electrical systems for detection and characterization of abnormal tissue and cells |
| US9566030B2 (en) * | 2007-02-01 | 2017-02-14 | Ls Biopath, Inc. | Optical system for detection and characterization of abnormal tissue and cells |
| US10307074B2 (en) | 2007-04-20 | 2019-06-04 | Impedimed Limited | Monitoring system and probe |
| AU2008207672B2 (en) | 2008-02-15 | 2013-10-31 | Impedimed Limited | Impedance Analysis |
| JP2010082244A (en) * | 2008-09-30 | 2010-04-15 | Panasonic Electric Works Co Ltd | Cell activation level reducing method, and device thereof |
| AU2009321478B2 (en) * | 2008-11-28 | 2014-01-23 | Impedimed Limited | Impedance measurement process |
| BRPI1009478A8 (en) * | 2009-03-16 | 2016-10-18 | Critical Perfusion Inc | systems and methods for estimation of characteristic parameter of gastric impedance spectrum in humans |
| US9042976B2 (en) * | 2009-09-01 | 2015-05-26 | Roman A. Slizynski | Use of impedance techniques in breast-mass detection |
| JP5643829B2 (en) | 2009-10-26 | 2014-12-17 | インぺディメッド リミテッドImpedimed Limited | Method and apparatus for use in impedance measurement analysis |
| EP2501283B1 (en) | 2009-11-18 | 2016-09-21 | Impedimed Limited | Signal distribution for patient-electrode measurements |
| KR20120046554A (en) * | 2010-11-02 | 2012-05-10 | 연세대학교 산학협력단 | Sensor for detecting cancer tissue and manufacturing method of the same |
| JP6034499B2 (en) | 2012-10-18 | 2016-11-30 | カーディアック ペースメイカーズ, インコーポレイテッド | Inductive element for providing MRI compatibility in implantable medical device leads |
| US9351653B1 (en) | 2012-11-29 | 2016-05-31 | Intan Technologies, LLC | Multi-channel reconfigurable systems and methods for sensing biopotential signals |
| GB2545703B (en) | 2015-12-22 | 2019-01-09 | Univ Sheffield | Apparatus and methods for determining force applied to the tip of a probe |
| US11109787B2 (en) * | 2018-05-21 | 2021-09-07 | Vine Medical LLC | Multi-tip probe for obtaining bioelectrical measurements |
| SE544094C2 (en) * | 2018-11-05 | 2021-12-21 | Scibase Ab | Medical device for analyzing epithelial barrier function using electrical impedance spectroscopy |
| CN113720893A (en) * | 2021-09-01 | 2021-11-30 | 致慧医疗科技(上海)有限公司 | Method for evaluating malignancy degree of tumor based on surface charge intensity of cancer cells |
Citations (3)
| Publication number | Priority date | Publication date | Assignee | Title |
|---|---|---|---|---|
| US4729385A (en) * | 1985-10-23 | 1988-03-08 | American Mediscan, Inc. | Probe and method of use for detecting abnormal tissues |
| US6308097B1 (en) * | 1994-10-24 | 2001-10-23 | Transscan Medical Ltd. | Tissue characterization based on impedance images and on impedance measurements |
| US20030216661A1 (en) * | 2002-05-20 | 2003-11-20 | Davies Richard J. | Method and system for detecting electrophysiological changes in pre-cancerous and cancerous tissue |
Family Cites Families (34)
| Publication number | Priority date | Publication date | Assignee | Title |
|---|---|---|---|---|
| US3786801A (en) | 1969-02-24 | 1974-01-22 | Diagnostic Inc | Method and apparatus for aiding in the detection of breast cancer |
| US3949736A (en) | 1974-07-15 | 1976-04-13 | Vyvojova A Provozni Zakladna Vyzkumnych Ustavu | Circuit for automatically deriving and measuring relative voltages associated with impedance components of a biological object |
| US5109849A (en) | 1983-08-30 | 1992-05-05 | Nellcor, Inc. | Perinatal pulse oximetry sensor |
| US4955383A (en) | 1988-12-22 | 1990-09-11 | Biofield Corporation | Discriminant function analysis method and apparatus for disease diagnosis and screening |
| US5697369A (en) | 1988-12-22 | 1997-12-16 | Biofield Corp. | Method and apparatus for disease, injury and bodily condition screening or sensing |
| US5099844A (en) | 1988-12-22 | 1992-03-31 | Biofield Corp. | Discriminant function analysis method and apparatus for disease diagnosis and screening |
| GB9008764D0 (en) | 1990-04-19 | 1990-06-13 | Egnell Ameda Ltd | A resilient suction cup |
| US6026322A (en) | 1991-08-07 | 2000-02-15 | Ultramind International Limited | Biofeedback apparatus for use in therapy |
| US6389305B1 (en) | 1993-12-15 | 2002-05-14 | Lifeline Biotechnologies, Inc. | Method and apparatus for detection of cancerous and precancerous conditions in a breast |
| US5417222A (en) | 1994-01-21 | 1995-05-23 | Hewlett-Packard Company | Patient monitoring system |
| EP0744911B1 (en) | 1994-02-11 | 2004-06-30 | Quickels Systems AB | A sealing element for a biomedical electrode |
| US6456865B2 (en) | 1995-06-08 | 2002-09-24 | Ilan Zadik Samson | Non-invasive medical probe |
| US6135953A (en) | 1996-01-25 | 2000-10-24 | 3M Innovative Properties Company | Multi-functional biomedical electrodes |
| JPH09271516A (en) | 1996-04-05 | 1997-10-21 | Nippon Koden Corp | Method and apparatus for judging anesthesia depth |
| CA2191285A1 (en) | 1996-11-26 | 1998-05-26 | Philip Maurice Church | Electrode arrangement for electrical impedance tomography system |
| SE9604564D0 (en) | 1996-12-12 | 1996-12-12 | Paal Svedman | Method and apparatus for conducting electrical currents |
| EP0998216B1 (en) | 1997-07-25 | 2004-06-09 | Werner A. Kaiser | Device for detecting, characterizing by differential diagnosis, and treating tumours |
| US6122544A (en) | 1998-05-01 | 2000-09-19 | Organ; Leslie William | Electrical impedance method and apparatus for detecting and diagnosing diseases |
| US6328735B1 (en) | 1998-10-30 | 2001-12-11 | E.P., Limited | Thermal ablation system |
| US6251681B1 (en) | 1998-11-30 | 2001-06-26 | Richard J. Davies | Method for the detection of cancer and premalignancy conditions thereof |
| DE60038603T2 (en) | 1999-01-13 | 2009-05-20 | Cytyc Corp., Marlborough | IDENTIFICATION OF DUCTAL OPENINGS USING THE CHARACTERISTIC ELECTRICAL SIGNAL |
| WO2000043550A2 (en) | 1999-01-21 | 2000-07-27 | Wayne State University | Method and apparatus for measuring factors in mammary fluids |
| US6773418B1 (en) | 1999-08-18 | 2004-08-10 | Iotek, Inc. | Device and method for delivery of agents to the female reproductive tract |
| JP2001187035A (en) | 1999-12-28 | 2001-07-10 | Tanita Corp | Lesion recovery degree judging device |
| US6898303B2 (en) | 2000-01-18 | 2005-05-24 | Arch Development Corporation | Method, system and computer readable medium for the two-dimensional and three-dimensional detection of lesions in computed tomography scans |
| JP2001212100A (en) * | 2000-02-07 | 2001-08-07 | Sekisui Chem Co Ltd | Equipment for measuring electrical characteristics |
| US6641604B1 (en) | 2000-02-11 | 2003-11-04 | Iotek, Inc. | Devices and method for manipulation of organ tissue |
| US7499745B2 (en) | 2000-02-28 | 2009-03-03 | Barbara Ann Karmanos Cancer Institute | Multidimensional bioelectrical tissue analyzer |
| US6962587B2 (en) | 2000-07-25 | 2005-11-08 | Rita Medical Systems, Inc. | Method for detecting and treating tumors using localized impedance measurement |
| IL138471A0 (en) | 2000-09-14 | 2001-10-31 | Yissum Res Dev Co | Novel semiconductor materials and their uses |
| US6823203B2 (en) | 2001-06-07 | 2004-11-23 | Koninklijke Philips Electronics N.V. | System and method for removing sensitive data from diagnostic images |
| WO2003066132A1 (en) | 2002-02-07 | 2003-08-14 | Medela Ag | Breast cap |
| US20030181890A1 (en) | 2002-03-22 | 2003-09-25 | Schulze Dale R. | Medical device that removably attaches to a bodily organ |
| JP2008536650A (en) * | 2005-04-21 | 2008-09-11 | エピ‐サイ,リミテッド・ライアビリティ・カンパニー | Methods and systems for detecting electrophysiological changes in pre-cancerous and cancerous tissues and epithelial tissues |
-
2006
- 2006-12-06 EP EP06844899A patent/EP1956972A2/en not_active Withdrawn
- 2006-12-06 CA CA002630921A patent/CA2630921A1/en not_active Abandoned
- 2006-12-06 US US12/086,021 patent/US8332025B2/en not_active Expired - Fee Related
- 2006-12-06 WO PCT/US2006/046570 patent/WO2007067632A2/en active Application Filing
- 2006-12-06 JP JP2008544481A patent/JP2009518131A/en active Pending
- 2006-12-06 AU AU2006321922A patent/AU2006321922A1/en not_active Abandoned
Patent Citations (3)
| Publication number | Priority date | Publication date | Assignee | Title |
|---|---|---|---|---|
| US4729385A (en) * | 1985-10-23 | 1988-03-08 | American Mediscan, Inc. | Probe and method of use for detecting abnormal tissues |
| US6308097B1 (en) * | 1994-10-24 | 2001-10-23 | Transscan Medical Ltd. | Tissue characterization based on impedance images and on impedance measurements |
| US20030216661A1 (en) * | 2002-05-20 | 2003-11-20 | Davies Richard J. | Method and system for detecting electrophysiological changes in pre-cancerous and cancerous tissue |
Cited By (50)
| Publication number | Priority date | Publication date | Assignee | Title |
|---|---|---|---|---|
| US8257356B2 (en) | 2004-10-15 | 2012-09-04 | Baxano, Inc. | Guidewire exchange systems to treat spinal stenosis |
| US8430881B2 (en) | 2004-10-15 | 2013-04-30 | Baxano, Inc. | Mechanical tissue modification devices and methods |
| US9320618B2 (en) | 2004-10-15 | 2016-04-26 | Amendia, Inc. | Access and tissue modification systems and methods |
| US8613745B2 (en) | 2004-10-15 | 2013-12-24 | Baxano Surgical, Inc. | Methods, systems and devices for carpal tunnel release |
| US7938830B2 (en) | 2004-10-15 | 2011-05-10 | Baxano, Inc. | Powered tissue modification devices and methods |
| US8647346B2 (en) | 2004-10-15 | 2014-02-11 | Baxano Surgical, Inc. | Devices and methods for tissue modification |
| US8048080B2 (en) | 2004-10-15 | 2011-11-01 | Baxano, Inc. | Flexible tissue rasp |
| US9463041B2 (en) | 2004-10-15 | 2016-10-11 | Amendia, Inc. | Devices and methods for tissue access |
| US8579902B2 (en) | 2004-10-15 | 2013-11-12 | Baxano Signal, Inc. | Devices and methods for tissue modification |
| US8568416B2 (en) | 2004-10-15 | 2013-10-29 | Baxano Surgical, Inc. | Access and tissue modification systems and methods |
| US9456829B2 (en) | 2004-10-15 | 2016-10-04 | Amendia, Inc. | Powered tissue modification devices and methods |
| US9345491B2 (en) | 2004-10-15 | 2016-05-24 | Amendia, Inc. | Flexible tissue rasp |
| US8617163B2 (en) | 2004-10-15 | 2013-12-31 | Baxano Surgical, Inc. | Methods, systems and devices for carpal tunnel release |
| US8652138B2 (en) | 2004-10-15 | 2014-02-18 | Baxano Surgical, Inc. | Flexible tissue rasp |
| US10052116B2 (en) | 2004-10-15 | 2018-08-21 | Amendia, Inc. | Devices and methods for treating tissue |
| US9247952B2 (en) | 2004-10-15 | 2016-02-02 | Amendia, Inc. | Devices and methods for tissue access |
| US8801626B2 (en) | 2004-10-15 | 2014-08-12 | Baxano Surgical, Inc. | Flexible neural localization devices and methods |
| US9101386B2 (en) | 2004-10-15 | 2015-08-11 | Amendia, Inc. | Devices and methods for treating tissue |
| US11382647B2 (en) | 2004-10-15 | 2022-07-12 | Spinal Elements, Inc. | Devices and methods for treating tissue |
| US8419653B2 (en) | 2005-05-16 | 2013-04-16 | Baxano, Inc. | Spinal access and neural localization |
| US9125682B2 (en) | 2005-10-15 | 2015-09-08 | Amendia, Inc. | Multiple pathways for spinal nerve root decompression from a single access point |
| US7887538B2 (en) | 2005-10-15 | 2011-02-15 | Baxano, Inc. | Methods and apparatus for tissue modification |
| US8092456B2 (en) | 2005-10-15 | 2012-01-10 | Baxano, Inc. | Multiple pathways for spinal nerve root decompression from a single access point |
| US8062298B2 (en) | 2005-10-15 | 2011-11-22 | Baxano, Inc. | Flexible tissue removal devices and methods |
| US9492151B2 (en) | 2005-10-15 | 2016-11-15 | Amendia, Inc. | Multiple pathways for spinal nerve root decompression from a single access point |
| US8366712B2 (en) | 2005-10-15 | 2013-02-05 | Baxano, Inc. | Multiple pathways for spinal nerve root decompression from a single access point |
| US8585704B2 (en) | 2006-05-04 | 2013-11-19 | Baxano Surgical, Inc. | Flexible tissue removal devices and methods |
| US8062300B2 (en) | 2006-05-04 | 2011-11-22 | Baxano, Inc. | Tissue removal with at least partially flexible devices |
| US9351741B2 (en) | 2006-05-04 | 2016-05-31 | Amendia, Inc. | Flexible tissue removal devices and methods |
| US7857813B2 (en) | 2006-08-29 | 2010-12-28 | Baxano, Inc. | Tissue access guidewire system and method |
| US8551097B2 (en) | 2006-08-29 | 2013-10-08 | Baxano Surgical, Inc. | Tissue access guidewire system and method |
| US8845637B2 (en) | 2006-08-29 | 2014-09-30 | Baxano Surgical, Inc. | Tissue access guidewire system and method |
| US8303516B2 (en) | 2007-09-06 | 2012-11-06 | Baxano, Inc. | Method, system and apparatus for neural localization |
| US7959577B2 (en) | 2007-09-06 | 2011-06-14 | Baxano, Inc. | Method, system, and apparatus for neural localization |
| US8663228B2 (en) | 2007-12-07 | 2014-03-04 | Baxano Surgical, Inc. | Tissue modification devices |
| US9463029B2 (en) | 2007-12-07 | 2016-10-11 | Amendia, Inc. | Tissue modification devices |
| US8192436B2 (en) | 2007-12-07 | 2012-06-05 | Baxano, Inc. | Tissue modification devices |
| US9155488B2 (en) | 2008-01-22 | 2015-10-13 | Yeda Research And Development Co., Ltd. | Method and device for monitoring breastfeeding |
| CN102014743B (en) * | 2008-01-22 | 2013-11-20 | 耶达研究及发展有限公司 | Method and device for monitoring breastfeeding |
| RU2543297C2 (en) * | 2008-01-22 | 2015-02-27 | Йеда Ресеарч Энд Девелопмент Ко. Лтд. | Method and device for breastfeeding control |
| US8521272B2 (en) | 2008-01-22 | 2013-08-27 | Yeda Research And Development Co. Ltd. | Method and device for monitoring breastfeeding |
| JP2011509792A (en) * | 2008-01-22 | 2011-03-31 | アリク ペレド, | Method and apparatus for monitoring lactation |
| WO2009093238A1 (en) * | 2008-01-22 | 2009-07-30 | Yeda Research And Development Co. Ltd. | Method and device for monitoring breastfeeding |
| US9314253B2 (en) | 2008-07-01 | 2016-04-19 | Amendia, Inc. | Tissue modification devices and methods |
| US8398641B2 (en) | 2008-07-01 | 2013-03-19 | Baxano, Inc. | Tissue modification devices and methods |
| US8409206B2 (en) | 2008-07-01 | 2013-04-02 | Baxano, Inc. | Tissue modification devices and methods |
| US8845639B2 (en) | 2008-07-14 | 2014-09-30 | Baxano Surgical, Inc. | Tissue modification devices |
| JP2016028778A (en) * | 2008-08-22 | 2016-03-03 | フォーペル、マーク エル.FAUPEL Mark L. | Device for diagnosing and screening disease using extremely low frequency electromagnetic field |
| JP2012500663A (en) * | 2008-08-22 | 2012-01-12 | エル. フォーペル、マーク | Method and apparatus for disease diagnosis and screening using extremely low frequency electromagnetic fields |
| US8394102B2 (en) | 2009-06-25 | 2013-03-12 | Baxano, Inc. | Surgical tools for treatment of spinal stenosis |
Also Published As
| Publication number | Publication date |
|---|---|
| CA2630921A1 (en) | 2007-06-14 |
| US8332025B2 (en) | 2012-12-11 |
| US20090306535A1 (en) | 2009-12-10 |
| WO2007067632A3 (en) | 2008-11-27 |
| JP2009518131A (en) | 2009-05-07 |
| EP1956972A2 (en) | 2008-08-20 |
| AU2006321922A1 (en) | 2007-06-14 |
Similar Documents
| Publication | Publication Date | Title |
|---|---|---|
| US8332025B2 (en) | Method and system for detecting electrophysiological changes in pre-cancerous and cancerous tissue and epithelium | |
| US7853319B2 (en) | Method and system for detecting electrophysiological changes in pre-cancerous and cancerous tissue and epithelium | |
| US9042977B2 (en) | Method and system for detecting electrophysiological changes in pre-cancerous and cancerous breast tissue and epithelium | |
| US6922586B2 (en) | Method and system for detecting electrophysiological changes in pre-cancerous and cancerous tissue | |
| US20080009764A1 (en) | Method and system for detecting electrophysiological changes in pre-cancerous and cancerous tissue and epithelium | |
| US20080004543A1 (en) | Electrophysiological approaches to assess resection and tumor ablation margins and responses to drug therapy | |
| WO2007067633A2 (en) | Method and system for detecting electrophysiological changes in pre-cancerous and cancerous tissue | |
| AU2011244871A1 (en) | Method and system for detecting electrophysiological changes in pre-cancerous and cancerous breast tissue and epithelium | |
| NZ564935A (en) | System for detecting precancerous and cancerous tissue |
Legal Events
| Date | Code | Title | Description |
|---|---|---|---|
| 121 | Ep: the epo has been informed by wipo that ep was designated in this application | ||
| WWE | Wipo information: entry into national phase |
Ref document number: 2630921 Country of ref document: CA |
|
| WWE | Wipo information: entry into national phase |
Ref document number: 2006844899 Country of ref document: EP |
|
| WWE | Wipo information: entry into national phase |
Ref document number: 2006321922 Country of ref document: AU Ref document number: 2008544481 Country of ref document: JP |
|
| NENP | Non-entry into the national phase |
Ref country code: DE |
|
| WWE | Wipo information: entry into national phase |
Ref document number: 568977 Country of ref document: NZ |
|
| WWE | Wipo information: entry into national phase |
Ref document number: 2360/KOLNP/2008 Country of ref document: IN |
|
| ENP | Entry into the national phase |
Ref document number: 2006321922 Country of ref document: AU Date of ref document: 20061206 Kind code of ref document: A |
|
| WWE | Wipo information: entry into national phase |
Ref document number: 12086021 Country of ref document: US |