WO2012008058A1 - Management system and management method for computer system - Google Patents
Management system and management method for computer system Download PDFInfo
- Publication number
- WO2012008058A1 WO2012008058A1 PCT/JP2010/062696 JP2010062696W WO2012008058A1 WO 2012008058 A1 WO2012008058 A1 WO 2012008058A1 JP 2010062696 W JP2010062696 W JP 2010062696W WO 2012008058 A1 WO2012008058 A1 WO 2012008058A1
- Authority
- WO
- WIPO (PCT)
- Prior art keywords
- failure
- analysis result
- event
- node device
- resolved
- Prior art date
Links
Images


Classifications
-
- H—ELECTRICITY
- H04—ELECTRIC COMMUNICATION TECHNIQUE
- H04L—TRANSMISSION OF DIGITAL INFORMATION, e.g. TELEGRAPHIC COMMUNICATION
- H04L43/00—Arrangements for monitoring or testing data switching networks
- H04L43/08—Monitoring or testing based on specific metrics, e.g. QoS, energy consumption or environmental parameters
- H04L43/0805—Monitoring or testing based on specific metrics, e.g. QoS, energy consumption or environmental parameters by checking availability
- H04L43/0817—Monitoring or testing based on specific metrics, e.g. QoS, energy consumption or environmental parameters by checking availability by checking functioning
-
- G—PHYSICS
- G06—COMPUTING; CALCULATING OR COUNTING
- G06F—ELECTRIC DIGITAL DATA PROCESSING
- G06F11/00—Error detection; Error correction; Monitoring
- G06F11/07—Responding to the occurrence of a fault, e.g. fault tolerance
- G06F11/0703—Error or fault processing not based on redundancy, i.e. by taking additional measures to deal with the error or fault not making use of redundancy in operation, in hardware, or in data representation
- G06F11/079—Root cause analysis, i.e. error or fault diagnosis
-
- G—PHYSICS
- G06—COMPUTING; CALCULATING OR COUNTING
- G06F—ELECTRIC DIGITAL DATA PROCESSING
- G06F11/00—Error detection; Error correction; Monitoring
- G06F11/30—Monitoring
- G06F11/3055—Monitoring arrangements for monitoring the status of the computing system or of the computing system component, e.g. monitoring if the computing system is on, off, available, not available
-
- H—ELECTRICITY
- H04—ELECTRIC COMMUNICATION TECHNIQUE
- H04L—TRANSMISSION OF DIGITAL INFORMATION, e.g. TELEGRAPHIC COMMUNICATION
- H04L41/00—Arrangements for maintenance, administration or management of data switching networks, e.g. of packet switching networks
- H04L41/06—Management of faults, events, alarms or notifications
- H04L41/0604—Management of faults, events, alarms or notifications using filtering, e.g. reduction of information by using priority, element types, position or time
Definitions
- the present invention relates to a computer system management method and management system, for example, a technique for managing a failure of a host computer, a network switch, and a storage system that constitute the computer system.
- a cause event is detected from a plurality of faults detected in the system or its signs. More specifically, in Patent Document 1, management software is used to make an event that a performance value exceeds a threshold value in a managed device, and information is stored in an event DB.
- the management software also has an analysis engine for analyzing the causal relationship between a plurality of failure events that have occurred in the managed device. This analysis engine accesses a configuration DB having inventory information of managed devices, recognizes in-device components on the path on the I / O path, and can affect the performance of the logical volume on the host. The components are recognized as a group called “topology”.
- the analysis engine applies an analysis rule including a predetermined conditional statement and an analysis result to each topology and constructs an expansion rule.
- This expansion rule includes a cause event that is a cause of performance degradation in another device and a related event group caused by the cause event. Specifically, an event described as the root cause of the failure in the THEN part of the rule is a cause event, and an event other than the cause event among events described in the IF part is a related event.
- failure analysis function In the failure analysis function disclosed in Patent Document 1, a combination of events received from managed devices and failure cause candidates are described as rules in IF-THEN format.
- the failure analysis function calculates the certainty factor of the failure cause candidate described in the THEN portion by calculating the occurrence rate of the event described in the IF portion of the rule.
- the calculated certainty factor and failure cause candidate are displayed in a GUI according to the user's request.
- the present invention has been made in view of such a situation, and provides a failure analysis function capable of shortening the time required to solve a failure in a monitored device.
- the device abnormal state that is the basis for the derivation of the failure analysis result is Dissolved items are displayed on the GUI separately from other analysis results.
- the failure analysis result is derived from a plurality of failure events, when the normalization of all failure events is confirmed, the failure analysis result is displayed on the GUI separately from other failure analysis results.
- the status of the device in an abnormal state is normal.
- the failure cause candidate is saved as a failure analysis result together with the certainty at the time when all of the device abnormal states that have been derived are resolved.
- the failure analysis result is displayed on the GUI separately from other analysis results.
- the management server acquires a processing performance value indicating the processing performance of the node device, detects the state of the node device from the acquired processing performance value, and can generate the detected state in the node device. This is applied to an analysis rule indicating the relationship between a combination of one or more condition events and a conclusion event that is the root cause of the combination of condition events. Then, a certainty factor, which is information indicating the possibility of the occurrence of a failure in the node device, is calculated, and it is determined from the certainty factor whether a failure has occurred in the node device.
- the unresolved failure analysis result and the state of the failure analysis result of the node device in which the state remains abnormal without changing the certainty information for the node device determined to have failed.
- the resolved failure analysis result that is the failure analysis result of the node device that has changed normally from the abnormality is displayed on the display screen.
- the unresolved failure analysis result and the resolved failure analysis result are distinguished and displayed on the display screen, or the processing priority is combined with the unresolved failure analysis result and the resolved failure result. May be displayed on the display screen.
- the administrator when presenting a failure analysis result to an administrator (user), the administrator can easily determine the corresponding priority of the analysis result by displaying the normalization of the received failure. It is possible to reduce the load required to check the analysis result.
- FIG. 1 It is a figure which shows the physical structural example of a computer system. It is a figure which shows the detailed structural example of a host computer. It is a figure which shows the detailed structural example of a storage apparatus. It is a figure which shows the detailed structural example of a management server. It is a figure which shows the structural example of the apparatus performance management table
- FIG. 10 is a flowchart for explaining handling priority setting processing of a failure analysis result executed by a management server in the third embodiment. It is a figure which shows the structural example of the failure analysis result screen which a management server displays in 3rd Embodiment.
- the embodiment of the present invention relates to failure root cause analysis in consideration of failure elimination.
- aaa table In this specification, the information used in the present invention is described by the expression “aaa table”. However, expressions such as “aaa table”, “aaa list”, “aaaDB”, “aaa queue”, etc. , Lists, DBs, queues, and other data structures. Therefore, in order to show that the information used in the present invention does not depend on the data structure, “aaa table”, “aaa list”, “aaaDB”, “aaa queue”, etc. may be referred to as “aaa information”. is there.
- program or “module” may be described as the subject of operation (subject), but the program or module is defined by being executed by the processor. Since the above processing is performed using the memory and the communication port (communication control device), the processing may be read as processing in which the processor is an operation subject (subject). Further, the processing disclosed with the program or module as the subject may be processing performed by a computer such as a management server or an information processing apparatus. Part or all of the program may be realized by dedicated hardware. Various programs may be installed in each computer by a program distribution server or a storage medium.
- 1st Embodiment 1st Embodiment is related with the resolved event reflection process by management software (for example, contained in a management server).
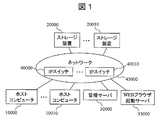
- FIG. 1 is a diagram showing a physical configuration of a computer system according to the present invention.
- the computer system includes a storage device 20000, a host computer 10000, a management server 30000, a WEB browser activation server 35000, and an IP switch 40000, which are connected via a network 45000. .
- the host computers 10000 to 10010 receive file I / O requests from, for example, client computers (not shown) connected thereto, and realize access to the storage apparatuses 20000 to 20010 based on the received requests.
- the management server (management computer) 30000 manages the operation of the entire computer system.
- the WEB browser activation server 35000 communicates with the GUI display processing module 32400 of the management server 30000 via the network 45000 and displays various information on the WEB browser.
- the user manages the devices in the computer system by referring to the information displayed on the WEB browser on the WEB browser activation server.
- the management server 30000 and the web browser activation server 35000 may be composed of a single server.
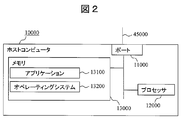
- FIG. 2 is a diagram showing a detailed internal configuration example of the host computer 10000 according to the present invention.
- the host computer 10000 has a port 11000 for connecting to the network 45000, a processor 12000, and a memory 13000 (which may include a disk device as a component), which are mutually connected via a circuit such as an internal bus. It is configured to be connected.
- the memory 13000 stores a business application 13100 and an operating system 13200.
- the business application 13100 uses a storage area provided from the operating system 13200, and performs data input / output (hereinafter referred to as I / O) to the storage area.
- I / O data input / output
- the operating system 13200 executes processing for causing the business application 13100 to recognize the logical volumes on the storage apparatuses 20000 to 20010 connected to the host computer 10000 via the network 45000 as storage areas.
- the port 11000 is a single port including an I / O port for communicating with the storage device 20000 by iSCSI and a management port for the management server 30000 to acquire management information in the host computers 10000 to 10010. However, it may be divided into an I / O port for communication by iSCSI and a management port.
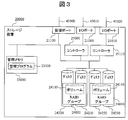
- FIG. 3 is a diagram showing a detailed internal configuration example of the storage apparatus 20000 according to the present invention.
- the storage device 20010 has the same configuration.
- the storage device 20000 stores I / O ports 21000 and 21010 for connecting to the host computer 10000 via the network 45000, a management port 21100 for connecting to the management server 30000 via the network 45000, and various management information.
- the components are connected to each other through a circuit. Note that the connection of the RAID groups 24000 to 24010 indicates that the storage devices constituting the RAID groups 24000 to 24010 are more accurately connected to other components.
- the management memory 23000 stores a storage device management program 23100.
- the management program 23100 communicates with the management server 30000 via the management port 21100 and provides the configuration information of the storage device 20000 to the management server 30000.
- Each of the RAID groups 24000 to 24010 includes one or more magnetic disks 24200, 24210, 24220, and 24230. In the case of being constituted by a plurality of magnetic disks, these magnetic disks may have a RAID configuration.
- the RAID groups 24000 to 24010 are logically divided into a plurality of volumes 24100 to 24110.
- the logical volumes 24100 and 24110 need not have a RAID configuration as long as they are configured using storage areas of one or more magnetic disks. Furthermore, as long as a storage area corresponding to a logical volume is provided, a storage device using another storage medium such as a flash memory may be used instead of the magnetic disk.
- the controllers 25000 and 25010 have therein a processor that controls the storage device 20000 and a cache memory that temporarily stores data exchanged with the host computer 10000. Each controller is interposed between the I / O port and the RAID group, and exchanges data between them.
- the storage device 20000 provides a logical volume to any host computer, receives an access request (indicating an I / O request), and reads / writes data from / to a storage device in response to the received access request
- an access request indicating an I / O request
- reads / writes data from / to a storage device in response to the received access request
- the storage controller and the storage device that provides the storage area may be stored in different cases. Good. That is, in the example of FIG. 3, the management memory 23000 and the controllers 25000 and 25110 are provided as separate entities, but may be configured as a storage controller in which they are integrated. Further, in this specification, a storage device may be referred to as a storage system when the storage controller and the storage device are present in the same housing or as an expression including another housing.
- FIG. 4 is a diagram showing a detailed internal configuration example of the management server 30000 according to the present invention.
- the management server 30000 has a management port 31000 for connection to the network 45000, a processor 31100, a memory 32000 such as a cache memory, a secondary storage device (secondary storage area) 33000 such as an HDD, and processing results to be described later.
- the memory 32000 stores a program control module 32100, a configuration management information acquisition module 32200, an apparatus performance acquisition module 32300, a GUI display processing module 32400, an event analysis processing module 32500, and a rule expansion module 32600. Yes.
- each module is provided as a software module of the memory 32000, but may be provided as a hardware module. Also, the processing performed by each module may be provided as one or more program codes, and there may be no clear boundary between modules. Modules may be read as programs.
- the secondary storage area 33000 includes an apparatus performance management table 33100, a volume topology management table 33200, an event management table 33300, a general rule repository 33400, an expansion rule repository 33500, an analysis result management table 33600, and an event type management.
- a table 33700 and a performance metric management table 33800 are stored.
- the secondary storage area 33000 is composed of either a semiconductor memory or a magnetic disk, or both a semiconductor memory and a magnetic disk.
- the GUI display processing module 33400 displays the acquired configuration management information via the output device 31200 in response to a request from the administrator via the input device 31300.
- the input device and the output device may be separate devices, or one or more integrated devices.
- the management server (management computer) 30000 has, for example, a keyboard and a pointer device as the input device 31300 and a display, a printer, and the like as the output device 31200, but may be other devices.
- a serial interface or an Ethernet interface is used as an alternative to the input / output device, a display computer having a display or keyboard or pointer device is connected to the interface, and the display information is transmitted to the display computer, or the input information May be displayed by the display computer, or the input and display at the input / output device may be substituted by receiving the input.
- a set of one or more computers that manage the computer system (information processing system) 1 and display display information may be referred to as a management system.
- the management server 30000 displays display information
- the management server 30000 is a management system
- a combination of the management server 30000 and a display computer for example, the WEB browser activation server 35000 in FIG. 1
- processing equivalent to that of the management server may be realized with a plurality of computers.
- the plurality of computers if the display computer performs display, display (Including computers) is the management system.
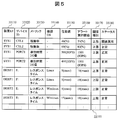
- FIG. 5 is a diagram showing a configuration example of the device performance management table 33100 that the management server 30000 has.
- the device performance management table 33100 includes a field 33110 for registering a device ID that is an identifier of a device to be managed, a field 33120 for registering a device ID that is a device identifier inside the device to be managed, and performance information of the management target device.
- a field 33130 for storing the metric name, a field 33140 for registering the OS type of the device that detected the threshold abnormality (which means “determined to be abnormal based on the threshold”), and the management target device A field 33150 for acquiring and storing the performance value from the corresponding device, and a field 33160 for storing a threshold (alert execution threshold) that is the upper limit or lower limit of the normal range of the performance value of the management target device in response to an input from the user.
- a field for registering whether the threshold is the upper limit or lower limit of the normal value.
- a field 33170 includes a field 33180 for performance value registers whether the abnormal value is a normal value, as configuration items.
- the processor operating rate in the controller CTL1 in the storage device SYS1 is 40% (see 33150) at the present time, and the operating rate of CTL1 is 20%.
- the management server 30000 determines that the controller CTL1 is overloaded when exceeding (see 33160), but in this specific example, it is understood that this performance value is determined to be an abnormal value (see 33180).
- the I / O amount per unit time and the operation rate are given as examples of the performance value of the device managed by the management server 30000, but the performance value managed by the management server 30000 may be other than this.
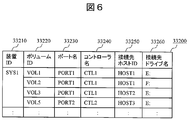
- FIG. 6 is a diagram showing a configuration example of the volume topology management table 32200 that the management server 30000 has.
- the volume topology management table 33200 includes a field 33210 for registering a device ID serving as a storage device identifier, a field 33220 for registering a volume ID serving as a volume identifier of the storage device, and a volume used when communicating with the host computer 10000.
- a field 33230 for registering a port ID to be an identifier of a port to be registered a field 32340 for registering an ID of a controller used for communication between the port and the volume, and a field 33250 for registering an identifier of the host computer 10000 to which the volume is connected.
- a field 33260 for registering the drive name of the logical volume of the host computer 10000 in which the volume is an entity, as a configuration item.
- the volume VOL1 of the storage device SYS1 is connected to the host computer HOST1 via the storage-side port indicated by PORT1 and the controller indicated by CTL1. It can be seen that the logical volume (E :) is recognized on the host.
- FIG. 7 is a diagram showing a configuration example of the event management table 33300 that the management server 30000 has. This event management table 33300 is appropriately referred to in a failure cause analysis process and a resolved event reflection process described later.
- the event management table 33300 includes a field 33310 for registering an event ID serving as an identifier of the event itself, a field 33320 for registering a device ID serving as an identifier of a device having an event such as a threshold abnormality in the acquired performance value, and an event occurrence A field 33330 for registering the identifier of the part in the device that has been detected, a field 33340 for registering the name of the metric in which the threshold abnormality is detected, a field 33350 for registering the OS type of the device in which the threshold abnormality is detected, and a part in the device
- the configuration item includes a field 33360 for registering the state when the event occurs, a field 33370 for registering whether the event has been analyzed by the event analysis processing module 32500 described later, and a field 33380 for registering the date and time when the event occurred. Including They are out.
- the management server 30000 detects the threshold abnormality of the processor operation rate in the controller indicated by CTL1 of the storage device SYS1, and the event ID is EV1. It turns out that it is. It should be noted that even when the abnormal state changes normally, it may be registered as an event.
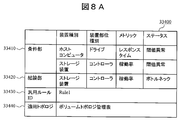
- FIGS. 8A and 8B are diagrams illustrating a configuration example of the general rules in the general rule repository 33400 included in the management server 30000.
- FIG. A general-purpose rule (the same applies to the expansion rules described later) indicates the relationship between a combination of one or more condition events that can occur in a node device constituting a computer system and a conclusion event that is the root cause of the combination of condition events. It is.
- the event propagation model for identifying the root cause in failure analysis is a combination of events that are expected to occur as a result of a failure, and the root cause is described in “IF-THEN” format. It has become.
- the general-purpose rules are not limited to those shown in FIGS. 8A and 8B, and there may be more rules.
- the general rule includes a field 33430 for registering a general rule ID as an identifier of the general rule, a field 33410 for registering an observation event corresponding to the IF part of the general rule described in the “IF-THEN” format, and “IF-THEN”.
- a general-purpose rule whose general-purpose rule ID is Rule1 indicates that a threshold error (related event) in the response time of the logical volume on the host computer as an observation event and a threshold of the processor usage rate of the controller in the storage device It can be seen that when an abnormality (cause event) is detected, it is concluded that the threshold is abnormal in the processor usage rate of the controller of the storage apparatus. Further, when generating the expansion rule, topology information is acquired from the volume topology management table.
- a certain condition is normal as an event included in the observation event.
- it is defined as an observation event that the processor usage rate of the controller of the storage apparatus is normal.
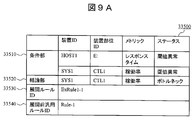
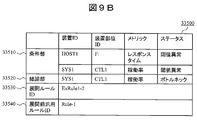
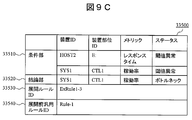
- FIGS. 9A to 9D are diagrams illustrating configuration examples of expansion rules in the expansion rule repository 33500 included in the management server 30000.
- FIG. These expansion rules are generated by inserting items of each entry of the volume topology management table (FIG. 7) into the general-purpose rules (FIGS. 8A and 8B).
- the expansion rule includes a field 33530 for registering an expansion rule ID serving as an expansion rule identifier, a field 33540 for registering a general rule ID serving as a general rule identifier based on the expansion rule, and “IF-THEN”.
- a field 33510 for registering an observation event corresponding to the IF part of the expansion rule described in the format, and a field 33520 for registering a cause event corresponding to the THEN part of the expansion rule described in the “IF-THEN” format. Includes as a configuration item.
- the expansion rule in FIG. 9A is generated by inserting the controller name 32240, the host ID 32250, and the connection destination drive name 32260 of the first entry in FIG. 7 into the device type and device part type in the general rule ID Rule1.
- the From FIG. 9A an expansion rule whose expansion rule ID is ExRule1-1 is expanded based on the general rule whose general rule ID is Rule1, and the response time of the logical volume on the host computer is observed as an observation event.
- a threshold abnormality and a threshold abnormality of the processor operating rate of the controller in the storage device are detected, it can be concluded that the cause is a threshold abnormality of the processor usage rate of the controller of the storage device.
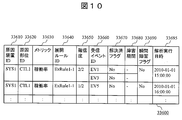
- FIG. 10 is a diagram showing a configuration example of the analysis result management table 33600 that the management server 30000 has.
- the analysis result management table 33600 includes a field 33610 for registering a device ID that is an identifier of a device in which an event has been determined to be a root cause in the failure cause analysis process, and a field for registering an identifier of a part in the device in which the event has occurred.
- a field 33630 for registering the name of the metric that detected the threshold abnormality
- a field 33640 for registering the ID of the expansion rule that is the basis for determining the event as the root cause, and the event described in the condition part in the expansion rule
- a field 33650 for registering the occurrence ratio
- a field 33660 for registering the ID of the actually received event among the events described in the condition part in the expansion rule
- a field 33680 for registering the time until event normalization
- a field 33690 for registering whether or not the analysis result is due to an instantaneous failure
- a field 33695 for registering the date and time when the failure analysis processing accompanying the occurrence of an event is started , As a configuration item.
- the management server 30000 is rooted in the threshold abnormality of the processor operation rate in the controller indicated by CTL1 of the storage device SYS1.
- the event IDs EV1 and EV3 are received as the basis, that is, the occurrence rate of the conditional event is 2/2.
- the program control module 32100 instructs the information acquisition module 32200 to periodically acquire configuration management information from the storage device 20000, the host computer 10000, and the IP switch 40000 in the computer system 1 by, for example, polling processing.
- the configuration management information acquisition module 32200 acquires configuration management information from the storage device 20000, the host computer 10000, and the IP switch 40000, and updates the volume topology management table 33200.
- FIG. 11 is a flowchart for explaining a normal device performance information acquisition process executed by the device performance acquisition module 32300 of the management server 30000.
- the program control module 32100 instructs the device performance acquisition module 32300 to execute the device performance information acquisition process at the time of starting the program or every time a predetermined time elapses from the previous device performance information acquisition processing. It should be noted that when the execution instruction is repeatedly issued, it is not necessarily strictly every fixed period, and it is only necessary to repeat it.
- the device performance information acquisition module 32300 repeats the following series of processes for each device to be monitored.
- the device performance information acquisition module 32300 first instructs each device to be monitored to transmit the configuration management information (step 61010).
- the device performance information acquisition module 32300 determines whether or not there is a response from the monitoring target device (step 61020). If there is a device performance information response from the device (Yes in step 61020), the acquired device performance information is displayed. The information is stored in the device performance management table 33100 (step 61030). If there is no response for configuration management information from the device (No in step 61020), the configuration management information acquisition process ends.
- the device performance acquisition module 32300 refers to the device performance information stored in the device performance management table 33100, and repeats the processing from step 61050 to step 61070 for each performance value (step 61040).
- the device performance acquisition module 32300 checks whether the performance value exceeds the threshold, and updates the state registered in the device performance management table 33100 (Step 61050). Then, the device performance acquisition module 32300 determines whether the state has changed from normal to threshold abnormality or from threshold abnormality to normal (step 61060). If the state has changed (Yes in step 61060), the event An event is registered in the management table 33300 (step 61070). If the state has not changed (No in step 61060), the processing returns to step 61050 if the state confirmation processing for all performance values has not been completed.
- the device performance acquisition module 32300 determines whether there is an event newly added in a series of processing (step 61080), and if there is an additional event (for example, processing) When a new abnormality occurs in the event), the event analysis processing module 32500 is instructed to perform the failure cause analysis processing shown in FIG. 12 (step 61090).
- the above is the device performance information acquisition process performed by the device performance acquisition module 32300.
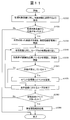
- FIG. 12 is a flowchart for explaining details of normal failure cause analysis processing (step 61090 in FIG. 11) executed by the event analysis processing module 32500 of the management server 30000.
- the event analysis processing module 32500 acquires an event whose analyzed flag is not Yes from the event management table 33300 (Step 62010).
- the event analysis processing module 32500 repeats the processing from step 62030 to step 62050 for each expansion rule in the expansion rule repository 33500 (step 62020).
- the event analysis processing module 32500 first calculates the number of occurrences in the past certain period for each event corresponding to the condition part described in the expansion rule (step 62030). Then, the event analysis processing module 32500 determines whether or not the number of event occurrences counted in the process of step 62030 exceeds a certain ratio in all events described in the condition part (step 62040). If it is determined that it has exceeded (Yes in step 62040), the event analysis processing module 32500 displays the root cause event together with the event occurrence rate in the conditional statement to the GUI display processing module 32400. An instruction is given (step 62050), and the process is terminated.
- the event analysis processing module 32500 executes the resolved reflection process (FIG. 15) (step 62060), and then refers to the event management table 33300 and sets the analyzed flag 33370 to Yes for the event acquired in step 62010. (Step 62070).
- the event analysis processing module 32500 writes, in the analysis result management table 33600, each of the expansion rules in the expansion rule repository that has a certainty factor that is not 0 (step 62080).
- condition part includes “abnormal response time threshold of logical volume (E :) in host computer HOST1” and “abnormal threshold operation rate of controller CTL1 in storage device SYS1”. "Is defined.
- the module 32500 refers to the event management table 33300 after waiting for a certain period of time, and acquires events that have occurred in the past certain period.
- the event analysis processing module 32500 calculates the number of occurrences in the past certain period for each event corresponding to the condition part described in the expansion rule ExRule1-1 of the expansion rule repository 33400.
- “Anomaly in response time threshold of logical volume (E :) in host computer HOST1” (related event) has occurred in the past certain period, so it corresponds to the condition part described in the expansion rule ExRule1-1
- the ratio of the number of occurrences of each event (cause event and related event) in the past fixed period in all events described in the condition part is 2/2.
- the event analysis processing module 32500 instructs the GUI display processing module 32400 to display the root cause event together with the event occurrence ratio in the conditional statement.
- the constant value here is 80%, for example, in this specific example, the occurrence ratio of each event in the condition part of the expansion rule ExRule1-1 in the past certain period is 2/2, that is, 100%. Will be displayed in the GUI.
- a resolved event reflection process is newly provided so that the analysis result can be displayed together with the processing priority.
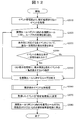
- FIG. 13 is a diagram showing a configuration example of the event type management table 33700 provided in the management server 30000.
- the event type management table 33700 is obtained from the field 33710 for registering the type of the device managed by the management server, the field 33720 for registering the part in the device for which performance information is to be acquired, among the devices, and acquired from the device.
- the status of “exceeding threshold” and “unknown” does not mean normalization of the abnormal state, but the status of “normal” Indicates that the abnormal state is normalized.
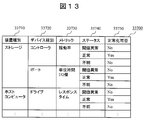
- FIG. 14 is a diagram illustrating a configuration example of the performance metric management table 33800 included in the management server 30000.
- the performance metric management table 33800 is obtained from a field 33810 for registering the type of device managed by the management server, a field 33820 for registering a part in the device from which performance information is to be acquired, and the device.
- the configuration item includes a field 33830 for registering the name of a metric to be registered, a field 33840 for registering an OS type that can be taken by the device, and a field 33850 for registering a calculation method of the metric value.
- FIG. 14 shows an example of specific values of performance metrics that the management server 30000 has. That is, the management server 30000 monitors the response time of the drive of the server (host computer 10000). At that time, for the host computer 10000 whose OS is Windows (registered trademark), the integrated value and the management server 30000 which is Linux. Indicates that the instantaneous value is acquired.
- the “instantaneous value” here refers to the case where the instantaneous value in a very short measurement period (for example, the performance value at the time of access) is calculated as the performance value when the performance value is calculated in the managed device. Can be mentioned.
- the “integrated value” is a case where an average value in a somewhat long measurement period is calculated as a performance value (for example, the performance values are integrated and averaged over a measurement time of 5 minutes). Can be mentioned.
- FIG. 15 is a flowchart for explaining the resolved event reflection processing (step 62060) performed by the event analysis processing module 32500 of the management server 30000 in the first embodiment. This process is performed immediately before step 62070 of the failure cause analysis process, as shown in FIG.
- the event analysis processing module 32500 acquires an event whose analyzed flag is not Yes from the event management table 33300 (step 63010).
- the event analysis processing module 32500 repeats the following processing for all acquired events (step 63020).
- the event analysis processing module 32500 confirms the event type management table 33700, and confirms whether or not the event means a problem solution (normalized event) (step 63030). That is, the metrics (operation rate, response time, I / O amount, etc.) are narrowed down, and it is confirmed whether the status (see 33360 in FIG. 7) corresponding to the narrowed down metrics is “normal”. If the event does not represent resolved (No in step 63030), the process proceeds to the next event. In the case of an event indicating a solved state (Yes in step 63030), the following processing is executed.
- the metrics operation rate, response time, I / O amount, etc.
- the event analysis processing module 32500 confirms the event management table 33300, and acquires the ID of the abnormal event that is paired with the resolved event (step 63040).
- the event analysis processing module 32500 refers to the analysis result management table 33600, and repeats the following series of processes for each analysis result defined in the analysis result management table (step 63050).
- the event analysis processing module 32500 changes the resolved flag to Yes for the abnormal event paired with the resolved event (step 63060). Then, the event analysis processing module 32500 confirms the event management table 33300, calculates the time required from the failure occurrence to the failure resolution, and records it as a failure period in the analysis result management table 33600 (FIG. 10) (step 63070). ).
- the event analysis processing module 32500 checks the event type management table 33700 for the above event, and checks whether or not the event means problem solving.
- the event type management table 33700 is confirmed, it is understood that the “normal status of the operation rate of the controller of the storage apparatus” is a status indicating that the event has been solved.
- the event analysis processing module 32500 confirms the event management table 33300, and acquires the ID of the abnormal event paired with the resolved event. Referring to the event management table 33300, immediately before “normal status of operation rate of controller CTL1 in storage device SYS1” (occurrence date: 2010-01-01: 015: 05: 00), “operation of controller CTL1 in storage device SYS1” “Threshold threshold error” (occurrence date: 2010-01-01 15:00:00) has occurred, and it can be seen that this is a pair of abnormal events. Also, it can be seen that the event ID is “EV1”.
- the event analysis processing module 32500 refers to the analysis result management table 33600, and among the events included in the analysis result defined in the analysis result management table 33600, the event whose event ID is indicated by “EV1” has been resolved. Change the flag to Yes. In addition, the time required from the occurrence of a fault to the resolution of the fault is recorded as a fault period. The reception event EV1 is resolved in 5 minutes from the occurrence, and this is registered as a failure period.
- event analysis processing is performed.
- the module 32500 also changes the resolved flag to Yes for the event EV3 paired therewith.
- the time required from the occurrence of a fault to the resolution of the fault is recorded in the analysis result management table 33600 as a fault period.
- the reception event EV3 is resolved in 10 minutes from the occurrence, and this is recorded in the analysis result management table 33600 as a failure period.
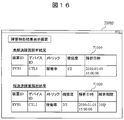
- FIG. 16 is a diagram illustrating a display example 71000 of a failure analysis result display screen that the management server 30000 displays for a user (administrator).
- the analysis results solved by all the received events are distinguished and displayed, and the failure periods are displayed together (table 71020).
- the longest resolution time of each event is displayed.
- the second embodiment relates to instantaneous failure event reflection processing by management software (for example, included in the management server 30000). Since the system configuration and the configuration of each device are the same as those in the first embodiment, description thereof will be omitted.
- the management server 30000 executes instantaneous failure event reflection processing.
- the configuration management information included in the management server 30000 is the same as that in the first embodiment.
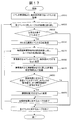
- FIG. 17 is a flowchart for explaining details of the instantaneous failure event reflection process executed by the event analysis processing module 32500 of the management server 30000 in the second embodiment.
- the instant failure event reflection process is executed in place of the resolved event reflection process (step 62060) of FIG. 12, and is performed immediately before step 62070 of the failure cause analysis process as shown in FIG. .
- the event analysis processing module 32500 obtains an event whose analyzed flag is not Yes from the event management table 33300 (step 64010).
- the event analysis processing module 32500 repeats the following processing for all acquired events (step 64020).
- the event analysis processing module 32500 confirms the event type management table 33700, and confirms whether or not the event means problem solving (step 64030). If the event does not indicate resolved, the process proceeds to the next event. In the case of an event indicating solved, the following processing is performed.
- the event analysis processing module 32500 confirms the event management table 33300 and acquires the ID of the abnormal event that is paired with the resolved event (step 64040).
- the event analysis processing module 32500 refers to the analysis result management table 33600, and repeats the following series of processes for each analysis result defined in the analysis result management table (step 64050).
- the event analysis processing module 32500 changes the resolved flag to Yes for the abnormal event that is paired with the resolved event (step 64060).
- the event analysis processing module 32500 checks the event management table 33300, calculates the time required from the occurrence of the failure to the resolution of the failure, and records it as a failure period in the analysis result management table 33600 (step 64070).
- the event analysis processing module 32500 has one reception event included in the analysis result, the metric is an instantaneous value, and the calculated failure period indicates the device performance in the device performance information acquisition processing shown in FIG. It is confirmed whether it is the same or shorter than the interval to be acquired (step 64080).
- the reason for confirming whether or not there is one reception event included in the analysis result in step 64080 is that the failure event (event in the condition part) described in one expansion rule (see FIG. 9) is independent. If it occurs, the failure event is likely to be an event that does not affect other connected IT systems. In other words, if only one event of the condition part has occurred, there is a high possibility that a failure has occurred instantaneously.
- the determination is made based on whether or not only one event has occurred. However, the determination may be made based on whether or not the event occurrence ratio (certainty factor) is less than a predetermined threshold used for the failure analysis result. good.
- the reason for confirming whether the failure period is the same as or shorter than the interval for acquiring the performance of the device is that the management server has already recognized the threshold abnormality in the monitored device and has already acquired the next performance acquisition timing. This is because when the threshold abnormality has been eliminated, the first recognized threshold abnormality is likely to be abrupt.
- step 64080 If it is determined in step 64080 that the analysis result does not satisfy all of the above conditions, the process proceeds to the next analysis result processing. On the other hand, if it is determined in step 64080 that the analysis result satisfies all the conditions, the event analysis processing module 32500 changes the instantaneous failure flag of the analysis result to Yes (step 64090). The reason why the flag is changed to Yes in this way is to distinguish and display the analysis result depending on whether or not there is an instantaneous failure as shown in FIG.
- the event analysis processing module 32500 checks the event type management table 33700 for the above event, and checks whether or not the event means problem solving.
- the event type management table 33700 is confirmed, it is understood that the “normal status of the operation rate of the controller of the storage apparatus” is a status indicating that the event has been solved.
- the event analysis processing module 32500 confirms the event management table 33300, and acquires the abnormal event ID paired with the resolved event.
- the event management table 33300 immediately before “normal status of response time of drive (E :) in host computer HOST1 (OS type: Linux)” (occurrence date: 2010-01-01 16:05:00) "Normal status of response time of drive (E :) on host computer HOST1 (OS type: Linux)" (occurrence date: 2010-01-01 16:00:00) has occurred, and this is an abnormal event I understand. Also, it can be seen that the event ID is “EV5”.
- the event analysis processing module 32500 refers to the analysis result management table 33600, and has resolved the event whose event ID is indicated by “EV5” among the events included in the analysis result defined in the analysis result management table 33600. Change the flag to Yes.
- the time required from the occurrence of a fault to the resolution of the fault is recorded as a fault period.
- the reception event EV5 is resolved in 5 minutes from the occurrence, and this is registered in the analysis result management table 33600 as a failure period.
- the event analysis processing module 32500 confirms whether there is one reception event included in the analysis result, the metric is an instantaneous value, and the failure period is equal to or less than a certain value.
- the condition is satisfied if the failure period is less than 10 minutes, the condition is satisfied because the failure period in this example is 5 minutes.
- the performance metric management table shown in FIG. 14 it can be seen that the drive response time in the host computer whose OS type is Linux is “instantaneous value”. Therefore, since the analysis result satisfies all the conditions, the instantaneous failure flag 33690 of the analysis result management table 33600 is changed to Yes.
- FIG. 18 is a diagram illustrating a display example 71000 of a failure analysis result display screen that the management server 30000 displays for an administrator (user).
- the analysis results defined in the analysis result management table 33600 are distinguished and displayed when the instantaneous failure flag of the analysis result is Yes, and the failure period is also displayed ( Table 71030).
- the longest of the resolution times of each event is displayed.
- the system management software generates an error when the failure analysis unit receives a failure event that occurs even though the managed device does not interfere with business operations and normalizes immediately after the occurrence.
- the failure cause candidate is saved as a failure analysis result together with the certainty factor when all the device abnormal states that have been derived are resolved.
- the failure analysis result is displayed on the GUI separately from other analysis results. As a result, the user can easily determine the corresponding priority of the analysis result, and the load required for checking the analysis result can be reduced.
- the third embodiment relates to processing priority setting processing for failure analysis results by management software (for example, included in the management server 30000).
- management software for example, included in the management server 30000.
- the system configuration and the configuration of each device are the same as those in the first embodiment except for the analysis result management table 33600 shown in FIG.
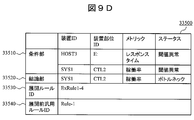
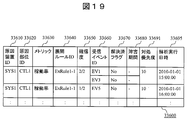
- FIG. 19 is a diagram illustrating a configuration example of an analysis result management table 33600 included in the management server 30000 according to the third embodiment.
- the analysis result management table 33600 includes a field 33691 for registering the user processing priority for the analysis result as a configuration item.
- the other configuration items are the same as the configuration items of the analysis result management table 33600 shown in FIG.
- the greater the processing priority assigned to the analysis result the faster the user action is taken, the maximum value being 10, and the minimum value being 0. Further, it is assumed that the processing priority is set to 10 when the analysis result is registered in the analysis result management table 33600.
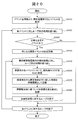
- FIG. 20 is a flowchart for explaining the handling priority setting processing of the failure analysis result executed by the event analysis processing module 32500 of the management server 30000 in the third embodiment. This process is performed immediately before step 62070 of the failure cause analysis process shown in FIG. 12, and is executed in place of the resolved event reflection process (step 62060) of FIG.
- the event analysis processing module 32500 acquires an event whose analyzed flag is not Yes from the event management table 33300 (step 65010).
- the event analysis processing module 32500 repeats the following processing for all acquired events (step 65020).
- the event analysis processing module 32500 refers to the event type management table 33700 and confirms whether or not the status 33360 of the event to be processed means problem solving (step 65030). For example, in the event management table 33300, if the operating rate of the controller indicates a threshold abnormality status, the event has not been resolved. Then, the event analysis processing module 32500 shifts the processing of the next event when the event does not indicate solved (in the case of No in step 65030), and in the case of an event indicating resolved (in the case of Yes in step 65030) ) Shifts the processing to step 65040.
- the event analysis processing module 32500 confirms the event management table 33300, and acquires the ID of the abnormal event that is paired with the resolved event (step 65040).
- the event analysis processing module 32500 refers to the analysis result management table 33600 and repeats the following series of processes for each analysis result defined in the analysis result management table 33600 (step 65050).
- the event analysis processing module 32500 changes the resolved flag to Yes for the abnormal event that is paired with the resolved event (step 65060).
- the event analysis processing module 32500 confirms the event management table 33300, calculates the time required from the occurrence of the failure to the resolution of the failure, and records it as a failure period in the analysis result management table 33600 (step 65070).
- the above is the handling priority setting processing of the failure analysis result performed by the event analysis processing module 32500.
- FIG. 21 is a diagram illustrating a display example 71000 of the failure analysis result display screen that the management server 30000 displays to the user.
- the analysis result defined in the analysis result management table is displayed together with the priority of handling (table 71010).
- the handling priority of the fault analysis result is displayed on the fault analysis result display screen 71000.
- the method of displaying was described.
- the following methods can be considered as a reference for calculating the priority of dealing with the analysis result by the user.
- This priority display can be realized in combination with the distinction display of the first embodiment. That is, the priority may be calculated for the unresolved analysis result displayed separately from the solved analysis result in the first embodiment, and the priority information may be displayed together.
- an abnormal state is detected from the performance value of each node device, and the analysis result (calculation of the certainty of the abnormal state) is presented to the administrator. Even if it is not performed, when it changes to a normal state with the passage of time, a flag indicating normalization is added without changing the certainty value, and the analysis result is presented to the administrator. This is because the certainty factor is an evaluation of the analysis result, and the evaluation should not be changed over time. By doing so, the resolved analysis result and the unsolved analysis result can be displayed separately, and the result to be dealt with can be displayed together with the priority information. Therefore, as an administrator, it becomes possible to efficiently narrow down failures that should be dealt with more clearly.
- the instantaneous failure analysis result that is considered to be only a temporary failure is presented to the administrator separately from other failure analysis results (see, for example, FIG. 18). By doing so, it is possible to postpone the handling of the failure indicated in the instantaneous failure analysis result, and it becomes possible for the administrator to manage the computer system very efficiently.
- the present invention can also be realized by a program code of software that realizes the functions of the embodiment.
- a storage medium in which the program code is recorded is provided to the system or apparatus, and the computer (or CPU or MPU) of the system or apparatus reads the program code stored in the storage medium.
- the program code itself read from the storage medium realizes the functions of the above-described embodiments, and the program code itself and the storage medium storing the program code constitute the present invention.
- a storage medium for supplying such program code for example, a flexible disk, CD-ROM, DVD-ROM, hard disk, optical disk, magneto-optical disk, CD-R, magnetic tape, nonvolatile memory card, ROM Etc. are used.
- an OS operating system
- the computer CPU or the like performs part or all of the actual processing based on the instruction of the program code.
- the program code is stored in a storage means such as a hard disk or memory of a system or apparatus, or a storage medium such as a CD-RW or CD-R
- the computer (or CPU or MPU) of the system or apparatus may read and execute the program code stored in the storage means or the storage medium when used.
- Server 20000 Storage device 30000: Management server 35000: Web browser activation server 40000: IP switch 45000: Network
Abstract
Description
第1の実施形態は、管理ソフトウェア(例えば、管理サーバに含まれる)による解決済みイベント反映処理に関するものである。 (1) 1st Embodiment 1st Embodiment is related with the resolved event reflection process by management software (for example, contained in a management server).
図1は、本発明による計算機システムの物理的構成を示す図である。当該計算機システムは、ストレージ装置20000と、ホストコンピュータ10000と、管理サーバ30000と、WEBブラウザ起動サーバ35000と、IPスイッチ40000と、を有し、それらが、ネットワーク45000によって接続される構成となっている。 <System configuration>
FIG. 1 is a diagram showing a physical configuration of a computer system according to the present invention. The computer system includes a
図2は、本発明によるホストコンピュータ10000の詳細な内部構成例を示す図である。ホストコンピュータ10000は、ネットワーク45000に接続するためのポート11000と、プロセッサ12000と、メモリ13000と、を有し(ディスク装置を構成として含んでも良い)、これらは内部バス等の回路を介して相互に接続される構成となっている。 <Internal configuration of host computer>
FIG. 2 is a diagram showing a detailed internal configuration example of the
図3は、本発明によるストレージ装置20000の詳細な内部構成例を示す図である。ストレージ装置20010も同様の構成を有している。 <Internal configuration of storage device>
FIG. 3 is a diagram showing a detailed internal configuration example of the
図4は、本発明による管理サーバ30000の詳細な内部構成例を示す図である。管理サーバ30000は、ネットワーク45000に接続するための管理ポート31000と、プロセッサ31100と、キャッシュメモリ等のメモリ32000と、HDD等の二次記憶装置(二次記憶領域)33000と、後述する処理結果を出力するためのディスプレイ装置等の出力デバイス31200と、ストレージ管理者が指示を入力するためのキーボード等の入力デバイス31300とを有し、これらが内部バス等の回路を介して相互に接続される構成となっている。 <Internal configuration of management server>
FIG. 4 is a diagram showing a detailed internal configuration example of the
図5は、管理サーバ30000が有する装置性能管理表33100の構成例を示す図である。 <Configuration of device performance management table>
FIG. 5 is a diagram showing a configuration example of the device performance management table 33100 that the
図6は、管理サーバ30000の有するボリュームトポロジ管理表32200の構成例を示す図である。 <Configuration of volume topology management table>
FIG. 6 is a diagram showing a configuration example of the volume topology management table 32200 that the
図7は、管理サーバ30000が有するイベント管理表33300の構成例を示す図である。このイベント管理表33300は、後述する障害原因解析処理、解決済みイベント反映処理、において適宜参照されるものである。 <Configuration of event management table>
FIG. 7 is a diagram showing a configuration example of the event management table 33300 that the
図8A及びBは、管理サーバ30000が有する汎用ルールリポジトリ33400内の汎用ルールの構成例を示す図である。汎用ルール(後述の展開ルールも同様)は、計算機システムを構成するノード装置で発生し得る1つ以上の条件イベントの組み合わせと条件イベントの組み合わせの根本原因とされる結論イベントとの関係を示すものである。 <General rule configuration>
FIGS. 8A and 8B are diagrams illustrating a configuration example of the general rules in the
図9A乃至Dは、管理サーバ30000が有する展開ルールリポジトリ33500内の展開ルールの構成例を示す図である。これらの展開ルールは、汎用ルール(図8A及びB)にボリュームトポロジ管理表(図7)の各エントリの項目を挿入することによって生成される。 <Configuration of deployment rules>
FIGS. 9A to 9D are diagrams illustrating configuration examples of expansion rules in the
図10は、管理サーバ30000の有する解析結果管理表33600の構成例を示す図である。 <Configuration of analysis result management table>
FIG. 10 is a diagram showing a configuration example of the analysis result management table 33600 that the
イベント種別管理表33700と、性能メトリック管理表33800に関する説明は、後述する。 <About the configuration of other management tables>
Descriptions regarding the event type management table 33700 and the performance metric management table 33800 will be described later.
プログラム制御モジュール32100は、例えばポーリング処理によって、情報取得モジュール32200に対し、計算機システム1内のストレージ装置20000、ホストコンピュータ10000およびIPスイッチ40000から、構成管理情報を定期的に取得するよう指示する。 <Configuration management information acquisition processing and volume topology management table update processing>
The
図11は、管理サーバ30000の装置性能取得モジュール32300が実行する通常の装置性能情報取得処理を説明するためのフローチャートである。プログラム制御モジュール32100は、プログラムの起動時、もしくは前回の装置性能情報取得処理から一定時間経過するたびに、装置性能取得モジュール32300に対し、装置性能情報取得処理を実行するよう指示する。なお、当該実行指示を繰り返し出す場合は厳密に一定期間毎である必要は無く、繰り返しさえしていればよい。 <General device performance information acquisition processing and event analysis processing>
FIG. 11 is a flowchart for explaining a normal device performance information acquisition process executed by the device
図12は、管理サーバ30000のイベント解析処理モジュール32500が実行する通常の障害原因解析処理(図11のステップ61090)の詳細を説明するためのフローチャートである。 <Details of Failure Analysis Processing (Step 61090)>
FIG. 12 is a flowchart for explaining details of normal failure cause analysis processing (
そこで、従来技術における課題を解決するため、本発明の第1の実施形態では管理サーバ30000における解決済みイベント反映処理が追加されている。以下、当該解決済みイベント処理に必要な情報及び動作の詳細について説明する。 <Contents of resolved event reflection processing>
Therefore, in order to solve the problems in the prior art, a resolved event reflection process in the
図13は、管理サーバ30000の具備するイベント種別管理表33700の構成例を示す図である。イベント種別管理表33700は、管理サーバの管理する機器の種別を登録するフィールド33710と、前記機器のうち、性能情報の取得の対象となる機器内の部位を登録するフィールド33720と、前記機器より取得するメトリックの名称を登録するフィールド33730と、前記メトリックについて検知しうるステータス(イベントの種別)を登録するフィールド33740と、前記ステータスが、異常状態の正常化を意味するものであるかを登録するフィールド33750と、を構成項目として含んでいる。 <Configuration of event type management table>
FIG. 13 is a diagram showing a configuration example of the event type management table 33700 provided in the
図14は、管理サーバ30000の具備する性能メトリック管理表33800の構成例を示す図である。性能メトリック管理表33800は、管理サーバの管理する機器の種別を登録するフィールド33810と、前記機器のうち、性能情報の取得の対象となる機器内の部位を登録するフィールド33820と、前記機器より取得するメトリックの名称を登録するフィールド33830と、前記機器の取りうるOS種別を登録するフィールド33840と、前記メトリックの値の算出方法を登録するフィールド33850と、を構成項目として含んでいる。 <Configuration of performance metric management table>
FIG. 14 is a diagram illustrating a configuration example of the performance metric management table 33800 included in the
図15は、第1の実施形態における、管理サーバ30000のイベント解析処理モジュール32500が実施する解決済みイベント反映処理(ステップ62060)を説明するためのフローチャートである。なお、本処理は、図12に示されるように、障害原因解析処理のステップ62070の直前に行われる。 <Details of resolved event reflection processing (step 62060) in the present invention>
FIG. 15 is a flowchart for explaining the resolved event reflection processing (step 62060) performed by the event
図16は、管理サーバ30000がユーザ(管理者)に対して表示する、障害解析結果表示画面の表示例71000を示す図である。 <Configuration of failure analysis result display screen>
FIG. 16 is a diagram illustrating a display example 71000 of a failure analysis result display screen that the
以上、第1の実施形態によれば、管理サーバ30000の管理ソフトウェアは、図12に示す障害原因解析処理の後、異常状態にあった機器のステータス正常化を検知したとき、障害解析結果のうち、その導出根拠となった機器異常状態が解消したものについて他の解析結果と区別してGUIに表示する。障害解析結果が複数の障害イベントにより導出された場合は、全ての障害イベントの正常化を確認した時点で、他の障害解析結果とは区別してGUIに表示する。その結果、ユーザが解析結果の対応優先度を容易に判断でき、解析結果確認に要する負荷を軽減できる。 <Effect of resolved event reflection processing>
As described above, according to the first embodiment, when the management software of the
第2の実施形態は、管理ソフトウェア(例えば、管理サーバ30000に含まれる)による瞬間障害イベント反映処理に関するものである。システム構成や各装置の構成は第1の実施形態と同じであるので、説明は省略する。 (2) Second Embodiment The second embodiment relates to instantaneous failure event reflection processing by management software (for example, included in the management server 30000). Since the system configuration and the configuration of each device are the same as those in the first embodiment, description thereof will be omitted.
本実施形態では、管理サーバ30000が、瞬間障害イベント反映処理を実行する。なお、管理サーバ30000が有する構成管理情報は、第1の実施形態と同じである。 <Details of instantaneous failure event reflection processing>
In the present embodiment, the
図18は、管理サーバ30000が管理者(ユーザ)に対し表示する、障害解析結果表示画面の表示例71000を示す図である。 <Configuration of failure analysis result display screen>
FIG. 18 is a diagram illustrating a display example 71000 of a failure analysis result display screen that the
以上のように、システム管理ソフトウェアは、管理対象機器において業務に支障をきたす事態となっていないにもかかわらず発生し、発生後すぐに正常化する障害イベントを障害解析部が受信した時、異常状態にあった機器のステータス正常化を検知したとき、その導出根拠となった機器異常状態が全て解消した時点で、障害原因候補を確信度と共に障害解析結果として保存する。また、障害解析結果について他の解析結果と区別してGUIに表示する。その結果、ユーザが解析結果の対応優先度を容易に判断でき、解析結果確認に要する負荷を軽減できる。 <Effect of instant failure event reflection processing>
As described above, the system management software generates an error when the failure analysis unit receives a failure event that occurs even though the managed device does not interfere with business operations and normalizes immediately after the occurrence. When the normalization of the status of the device in the state is detected, the failure cause candidate is saved as a failure analysis result together with the certainty factor when all the device abnormal states that have been derived are resolved. The failure analysis result is displayed on the GUI separately from other analysis results. As a result, the user can easily determine the corresponding priority of the analysis result, and the load required for checking the analysis result can be reduced.
第3の実施形態は、管理ソフトウェア(例えば、管理サーバ30000に含まれる)による障害解析結果の対処優先度設定処理に関するものである。システム構成や各装置の構成は、図19に示す解析結果管理表33600を除いて第1の実施形態と同じであるので、説明は省略する。 (3) Third Embodiment The third embodiment relates to processing priority setting processing for failure analysis results by management software (for example, included in the management server 30000). The system configuration and the configuration of each device are the same as those in the first embodiment except for the analysis result management table 33600 shown in FIG.
図19は、第3の実施形態による、管理サーバ30000が有する解析結果管理表33600の構成例を示す図である。 <Configuration of analysis result management table>
FIG. 19 is a diagram illustrating a configuration example of an analysis result management table 33600 included in the
図20は、第3の実施形態において、管理サーバ30000のイベント解析処理モジュール32500が実行する障害解析結果の対処優先度設定処理を説明するためのフローチャートである。なお、本処理は、図12に示される障害原因解析処理のステップ62070の直前に行われ、図12の解決済みイベント反映処理(ステップ62060)に代わって実行されるものである。 <Resolved event reflection processing>
FIG. 20 is a flowchart for explaining the handling priority setting processing of the failure analysis result executed by the event
図21は、管理サーバ30000がユーザに対し表示する、障害解析結果表示画面の表示例71000を示す図である。 <Configuration of failure analysis result display screen>
FIG. 21 is a diagram illustrating a display example 71000 of the failure analysis result display screen that the
以上、第3の実施形態では、管理者(ユーザ)が解析結果の対処優先度を容易に判断できるための方法の1つとして、障害解析結果表示画面71000において、障害解析結果の対処優先度を表示する方法について述べた。その他、ユーザによる解析結果への対処優先度を算出するための基準として、以下の方法が考えられる。 <Effects of failure priority analysis processing priority setting processing>
As described above, in the third embodiment, as one method for the administrator (user) to easily determine the handling priority of the analysis result, the handling priority of the fault analysis result is displayed on the fault analysis
本実施形態では、各ノード装置の性能値から異常状態を検知し、その解析結果(異常状態の確信度を演算)を管理者に提示するが、その異常状態が特別な対処を行わなくても時間経過により正常状態に変化した場合、その確信度の値を変えることなく、正常化したことを意味するフラグを付与して解析結果を管理者に提示するようにしている。これは、確信度が解析結果に対する評価であるため時間経過とともにその評価を変えてはいけないからである。このようにすることにより、解決済解析結果と未解決解析結果とを区別して表示することができ、また、障害対処すべき結果を優先度情報と共に表示することができるようになる。よって、管理者としては、より明確に対処すべき障害を効率よく絞り込みことができるようになる。 (4) Summary In this embodiment, an abnormal state is detected from the performance value of each node device, and the analysis result (calculation of the certainty of the abnormal state) is presented to the administrator. Even if it is not performed, when it changes to a normal state with the passage of time, a flag indicating normalization is added without changing the certainty value, and the analysis result is presented to the administrator. This is because the certainty factor is an evaluation of the analysis result, and the evaluation should not be changed over time. By doing so, the resolved analysis result and the unsolved analysis result can be displayed separately, and the result to be dealt with can be displayed together with the priority information. Therefore, as an administrator, it becomes possible to efficiently narrow down failures that should be dealt with more clearly.
20000:ストレージ装置
30000:管理サーバ
35000:WEBブラウザ起動サーバ
40000:IPスイッチ
45000:ネットワーク 10000: Server 20000: Storage device 30000: Management server 35000: Web browser activation server 40000: IP switch 45000: Network
Claims (14)
- 監視の対象となるノード装置と、ネットワークを介して前記ノード装置に接続され、前記ノード装置を監視及び管理する管理システムと、を有する計算機システムの管理方法であって、
前記管理サーバが、前記ノード装置の処理性能を示す処理性能値を取得し、当該取得した処理性能値から前記ノード装置の状態を検知し、
前記管理システムが、前記検知した状態を、前記ノード装置で発生し得る1つ以上の条件イベントの組み合わせと前記条件イベントの組み合わせの根本原因とされる結論イベントとの関係を示す解析ルールに適用し、前記ノード装置における障害の発生の可能性を示す情報である確信度を算出し、
前記管理システムが、前記確信度から前記ノード装置に障害が発生したか否か判断し、
前記管理システムが、前記障害が発生したと判断されたノード装置について、前記確信度の情報は変更せずに、前記状態が異常のままのノード装置の障害解析結果である未解決障害解析結果と前記状態が異常から正常に変化したノード装置の障害解析結果である解決済障害解析結果とを表示画面に表示する、
ことを特徴とする計算機システムの管理方法。 A management method for a computer system comprising: a node device to be monitored; and a management system connected to the node device via a network and monitoring and managing the node device,
The management server acquires a processing performance value indicating the processing performance of the node device, detects the state of the node device from the acquired processing performance value,
The management system applies the detected state to an analysis rule indicating a relationship between a combination of one or more condition events that can occur in the node device and a conclusion event that is a root cause of the combination of the condition events. , Calculating a certainty factor that is information indicating the possibility of failure in the node device,
The management system determines whether a failure has occurred in the node device from the certainty factor,
For the node device for which the management system has determined that the failure has occurred, the reliability information is not changed, and the unresolved failure analysis result that is the failure analysis result of the node device in which the state remains abnormal Displaying the resolved failure analysis result that is the failure analysis result of the node device in which the state has changed from abnormal to normal on the display screen;
A computer system management method characterized by the above. - 請求項1において、
前記管理システムは、前記未解決障害解析結果と前記解決済障害解析結果とを区別して前記表示画面に表示することを特徴とする計算機システムの管理方法。 In claim 1,
The management system distinguishes between the unresolved failure analysis result and the resolved failure analysis result and displays them on the display screen. - 請求項1において、さらに、
前記管理システムが、前記未解決障害解析結果及び前記解決済障害結果に対して、処理優先度を併せて前記表示画面に表示することを特徴とする計算機システムの管理方法。 The claim 1, further comprising:
The management system displays a processing priority for the unresolved failure analysis result and the resolved failure result together on the display screen. - 請求項3において、
前記管理システムは、前記未解決障害結果において、前記条件イベントのいくつが解決済であるかに基づいて、前記処理優先度を算出することを特徴とする計算機システムの管理方法。 In claim 3,
The management system calculates the processing priority based on how many of the condition events have been resolved in the unresolved failure result, and a management method for a computer system. - 請求項1において、さらに、
前記管理システムが、前記解決済障害解析結果について、前記状態が異常から正常に変化するまでの時間を示す障害期間を算出し、当該障害期間を併せて前記表示画面に表示することを特徴とする計算機システムの管理方法。 The claim 1, further comprising:
The management system calculates a failure period indicating a time until the state changes from abnormal to normal with respect to the solved failure analysis result, and displays the failure period together on the display screen. Computer system management method. - 請求項5において、
前記管理システムは、前記障害期間を算出する際に、前記確信度が所定値未満であるか判断し、さらに、前記ノード装置の前記処理性能値の種類を確認し、当該処理性能値の種類が瞬間的に得られた瞬間値であるか、或いは所定期間の性能値を積算して得られた積算値であるかを判断し、かつ、前記障害期間が所定値以下であるかを判断し、前記確信度が所定値未満で、前記処理性能値の種類が前記瞬間値で、かつ前記障害期間が所定値以下の前記解決済障害解析結果を、他の解決済障害解析結果及び前記未解決障害解析結果と区別して前記表示画面に表示することを特徴とする計算機システムの管理方法。 In claim 5,
When calculating the failure period, the management system determines whether the certainty factor is less than a predetermined value, confirms the type of the processing performance value of the node device, and determines whether the type of the processing performance value is Determining whether it is an instantaneous value obtained instantaneously or an integrated value obtained by integrating performance values for a predetermined period, and determining whether the failure period is less than or equal to a predetermined value; The resolved failure analysis result of which the certainty factor is less than a predetermined value, the type of the processing performance value is the instantaneous value, and the failure period is equal to or less than the predetermined value, another resolved failure analysis result and the unresolved failure A management method for a computer system, characterized in that it is displayed on the display screen in distinction from an analysis result. - 請求項1において、
前記ノード装置は、複数のホスト計算機と複数のストレージ装置を含み、
前記管理システムは、前記ノード装置の構成デバイス毎に前記ノード装置の前記処理性能値を管理し、
前記管理システムは、前記ノード装置の構成デバイスの処理性能を示す構成デバイス性能値を取得し、当該取得した構成デバイス性能値から前記ノード装置の前記構成デバイスの状態を検知し、
前記管理システムは、前記検知した構成デバイスの状態を前記解析ルールに適用し、前記確信度を算出して、当該確信度が所定値以上の場合に前記ノード装置に障害が発生したと判断し、
前記管理システムは、前記未解決障害解析結果と前記解決済障害解析結果とを区別して前記表示画面に表示すると共に、前記未解決障害解析結果及び前記解決済障害結果に対して、前記条件イベントのいくつが解決済であるかに基づいて算出した処理優先度を併せて前記表示画面に表示し、
前記管理システムは、さらに、前記解決済障害解析結果について、前記状態が異常から正常に変化するまでの時間を示す障害期間を算出し、当該障害期間を併せて前記表示画面に表示すると共に、前記障害期間を算出する際に、前記確信度が所定値未満であるか判断し、さらに、前記ノード装置の前記処理性能値の種類を確認し、当該処理性能値の種類が瞬間的に得られた瞬間値であるか、或いは所定期間の性能値を積算して得られた積算値であるかを判断し、かつ、前記障害期間が所定値以下であるかを判断し、前記確信度が所定値未満で、前記処理性能値の種類が前記瞬間値で、かつ前記障害期間が所定値以下の前記解決済障害解析結果を、他の解決済障害解析結果及び前記未解決障害解析結果と区別して前記表示画面に表示する、
ことを特徴とする計算機システムの管理方法。 In claim 1,
The node device includes a plurality of host computers and a plurality of storage devices,
The management system manages the processing performance value of the node device for each component device of the node device,
The management system acquires a configuration device performance value indicating the processing performance of the configuration device of the node device, detects the status of the configuration device of the node device from the acquired configuration device performance value,
The management system applies the state of the detected configuration device to the analysis rule, calculates the certainty factor, and determines that a failure has occurred in the node device when the certainty factor is equal to or greater than a predetermined value,
The management system distinguishes and displays the unresolved failure analysis result and the resolved failure analysis result on the display screen, and the condition event of the condition event is determined for the unresolved failure analysis result and the resolved failure result. The processing priority calculated based on how many have been resolved is also displayed on the display screen,
The management system further calculates a failure period indicating a time until the state changes from abnormal to normal with respect to the resolved failure analysis result, displays the failure period together on the display screen, and When calculating the failure period, it is determined whether the certainty factor is less than a predetermined value, the type of the processing performance value of the node device is confirmed, and the type of the processing performance value is obtained instantaneously It is determined whether it is an instantaneous value or an integrated value obtained by integrating performance values for a predetermined period, and whether the failure period is equal to or less than a predetermined value, and the certainty factor is a predetermined value Less than, the type of the processing performance value is the instantaneous value, and the resolved failure analysis result whose failure period is a predetermined value or less is distinguished from other resolved failure analysis results and the unresolved failure analysis results. Display on the display screen,
A computer system management method characterized by the above. - 監視対象のノード装置とネットワークを介して接続され、前記ノード装置を管理する管理システムであって、
前記ノード装置の処理性能を示す処理性能値を取得し、当該取得した処理性能値から前記ノード装置の状態を検知するプロセッサと、
前記ノード装置で発生し得る1つ以上の条件イベントの組み合わせと前記条件イベントの組み合わせの根本原因とされる結論イベントとの関係を示す解析ルールを格納するメモリと、を有し、
前記プロセッサは、
前記検知した状態を前記解析ルールに適用し、前記ノード装置における障害の発生の可能性を示す情報である確信度を算出し、
前記確信度から前記ノード装置に障害が発生したか否か判断し、
前記障害が発生したと判断されたノード装置について、前記確信度の情報は変更せずに、前記状態が異常のままのノード装置の障害解析結果である未解決障害解析結果と前記状態が異常から正常に変化したノード装置の障害解析結果である解決済障害解析結果とを表示画面に表示する、
ことを特徴とする管理システム。 A management system connected to a monitored node device via a network and managing the node device,
A processor that acquires a processing performance value indicating the processing performance of the node device, and detects a state of the node device from the acquired processing performance value;
A memory for storing an analysis rule indicating a relationship between a combination of one or more condition events that can occur in the node device and a conclusion event that is a root cause of the combination of the condition events;
The processor is
Applying the detected state to the analysis rule, calculating a certainty factor that is information indicating the possibility of failure in the node device,
Determining whether a failure has occurred in the node device from the certainty factor,
For the node device that is determined to have the failure, the reliability information is not changed, and the unresolved failure analysis result that is the failure analysis result of the node device in which the state remains abnormal and the state is abnormal. Display the resolved failure analysis result, which is the failure analysis result of the node device that has changed normally, on the display screen.
Management system characterized by that. - 請求項8において、
前記プロセッサは、前記未解決障害解析結果と前記解決済障害解析結果とを区別して前記表示画面に表示することを特徴とする管理システム。 In claim 8,
The processor is characterized in that the unresolved failure analysis result and the resolved failure analysis result are distinguished from each other and displayed on the display screen. - 請求項8において、
前記プロセッサは、前記未解決障害解析結果及び前記解決済障害結果に対して、処理優先度を併せて前記表示画面に表示することを特徴とする管理システム。 In claim 8,
The processor displays a processing priority for the unresolved failure analysis result and the resolved failure result together on the display screen. - 請求項10において、
前記プロセッサは、前記未解決障害結果において、前記条件イベントのいくつが解決済であるかに基づいて、前記処理優先度を算出することを特徴とする管理システム。 In claim 10,
The management system, wherein the processor calculates the processing priority based on how many of the condition events have been resolved in the unresolved failure result. - 請求項8において、
前記プロセッサは、前記解決済障害解析結果について、前記状態が異常から正常に変化するまでの時間を示す障害期間を算出し、当該障害期間を併せて前記表示画面に表示することを特徴とする管理システム。 In claim 8,
The processor calculates a failure period indicating a time until the state changes from abnormal to normal with respect to the solved failure analysis result, and displays the failure period together on the display screen. system. - 請求項12において、
前記プロセッサは、前記障害期間を算出する際に、前記確信度が所定値未満であるか判断し、さらに、前記ノード装置の前記処理性能値の種類を確認し、当該処理性能値の種類が瞬間的に得られた瞬間値であるか、或いは所定期間の性能値を積算して得られた積算値であるかを判断し、かつ、前記障害期間が所定値以下であるかを判断し、前記確信度が所定値未満で、前記処理性能値の種類が前記瞬間値で、かつ前記障害期間が所定値以下の前記解決済障害解析結果を、他の解決済障害解析結果及び前記未解決障害解析結果と区別して前記表示画面に表示することを特徴とする管理システム。 In claim 12,
When calculating the failure period, the processor determines whether the certainty factor is less than a predetermined value, further checks the type of the processing performance value of the node device, and the type of the processing performance value is instantaneous. Whether it is an instantaneous value that is obtained automatically or an integrated value obtained by integrating performance values for a predetermined period, and determining whether the failure period is less than or equal to a predetermined value, When the certainty factor is less than a predetermined value, the type of the processing performance value is the instantaneous value, and the failure period is less than or equal to the predetermined value, the resolved failure analysis result, the other resolved failure analysis result and the unresolved failure analysis A management system characterized in that it is displayed on the display screen in distinction from the result. - 請求項8において、
前記ノード装置は、複数のホスト計算機と複数のストレージ装置を含み、
前記プロセッサは、
前記ノード装置の構成デバイス毎に前記ノード装置の前記処理性能値を管理し、
前記ノード装置の構成デバイスの処理性能を示す構成デバイス性能値を取得し、当該取得した構成デバイス性能値から前記ノード装置の前記構成デバイスの状態を検知し、
前記検知した構成デバイスの状態を前記解析ルールに適用し、前記確信度を算出して、当該確信度が所定値以上の場合に前記ノード装置に障害が発生したと判断し、
前記未解決障害解析結果と前記解決済障害解析結果とを区別して前記表示画面に表示すると共に、前記未解決障害解析結果及び前記解決済障害結果に対して、前記条件イベントのいくつが解決済であるかに基づいて算出した処理優先度を併せて前記表示画面に表示し、
さらに、前記解決済障害解析結果について、前記状態が異常から正常に変化するまでの時間を示す障害期間を算出し、当該障害期間を併せて前記表示画面に表示すると共に、前記障害期間を算出する際に、前記確信度が所定値未満であるか判断し、さらに、前記ノード装置の前記処理性能値の種類を確認し、当該処理性能値の種類が瞬間的に得られた瞬間値であるか、或いは所定期間の性能値を積算して得られた積算値であるかを判断し、かつ、前記障害期間が所定値以下であるかを判断し、前記確信度が所定値未満で、前記処理性能値の種類が前記瞬間値で、かつ前記障害期間が所定値以下の前記解決済障害解析結果を、他の解決済障害解析結果及び前記未解決障害解析結果と区別して前記表示画面に表示する、ことを特徴とする管理システム。 In claim 8,
The node device includes a plurality of host computers and a plurality of storage devices,
The processor is
Managing the processing performance value of the node device for each component device of the node device;
A configuration device performance value indicating processing performance of the configuration device of the node device is acquired, and the state of the configuration device of the node device is detected from the acquired configuration device performance value,
Applying the state of the detected component device to the analysis rule, calculating the certainty factor, and determining that a failure has occurred in the node device when the certainty factor is a predetermined value or more,
The unresolved failure analysis result and the resolved failure analysis result are distinguished and displayed on the display screen, and some of the condition events have been resolved with respect to the unresolved failure analysis result and the resolved failure result. The processing priority calculated based on whether it is present is also displayed on the display screen,
Further, for the resolved failure analysis result, a failure period indicating a time until the state changes from abnormal to normal is calculated, and the failure period is displayed on the display screen together with the failure period. In this case, it is determined whether the certainty factor is less than a predetermined value, and further, the type of the processing performance value of the node device is confirmed, and whether the type of the processing performance value is an instantaneous value obtained instantaneously. Alternatively, it is determined whether or not the integrated value obtained by integrating performance values for a predetermined period, and whether or not the failure period is equal to or less than a predetermined value, and the certainty factor is less than the predetermined value, The resolved failure analysis result whose performance value is the instantaneous value and the failure period is equal to or less than a predetermined value is displayed on the display screen in distinction from other resolved failure analysis results and the unresolved failure analysis results. Management system characterized by Beam.
Priority Applications (3)
| Application Number | Priority Date | Filing Date | Title |
|---|---|---|---|
| US12/995,133 US8429455B2 (en) | 2010-07-16 | 2010-07-28 | Computer system management method and management system |
| CN201080067454.0A CN102959521B (en) | 2010-07-16 | 2010-07-28 | The management method of computer system is with administrating system |
| EP10854740.7A EP2562651A4 (en) | 2010-07-16 | 2010-07-28 | Management system and management method for computer system |
Applications Claiming Priority (2)
| Application Number | Priority Date | Filing Date | Title |
|---|---|---|---|
| JP2010-161724 | 2010-07-16 | ||
| JP2010161724A JP5419819B2 (en) | 2010-07-16 | 2010-07-16 | Computer system management method and management system |
Publications (1)
| Publication Number | Publication Date |
|---|---|
| WO2012008058A1 true WO2012008058A1 (en) | 2012-01-19 |
Family
ID=45469079
Family Applications (1)
| Application Number | Title | Priority Date | Filing Date |
|---|---|---|---|
| PCT/JP2010/062696 WO2012008058A1 (en) | 2010-07-16 | 2010-07-28 | Management system and management method for computer system |
Country Status (4)
| Country | Link |
|---|---|
| EP (1) | EP2562651A4 (en) |
| JP (1) | JP5419819B2 (en) |
| CN (1) | CN102959521B (en) |
| WO (1) | WO2012008058A1 (en) |
Families Citing this family (6)
| Publication number | Priority date | Publication date | Assignee | Title |
|---|---|---|---|---|
| US8863154B2 (en) | 2012-02-27 | 2014-10-14 | Hitachi, Ltd. | Monitoring system and monitoring program |
| JP5719974B2 (en) * | 2012-09-03 | 2015-05-20 | 株式会社日立製作所 | Management system for managing a computer system having a plurality of devices to be monitored |
| US9881056B2 (en) | 2012-10-31 | 2018-01-30 | Hitachi, Ltd. | Monitor system and monitor program |
| US9619314B2 (en) * | 2013-04-05 | 2017-04-11 | Hitachi, Ltd. | Management system and management program |
| CN104956331A (en) * | 2013-09-18 | 2015-09-30 | 株式会社日立制作所 | Management system for managing computer system and management method thereof |
| CN105223884A (en) * | 2015-09-30 | 2016-01-06 | 国网北京市电力公司 | The method for pushing of fault picture and device |
Citations (4)
| Publication number | Priority date | Publication date | Assignee | Title |
|---|---|---|---|---|
| JPH0730540A (en) * | 1993-07-08 | 1995-01-31 | Hitachi Ltd | Network fault monitor equipment |
| US7107185B1 (en) | 1994-05-25 | 2006-09-12 | Emc Corporation | Apparatus and method for event correlation and problem reporting |
| WO2009144969A2 (en) * | 2008-05-27 | 2009-12-03 | 株式会社日立製作所 | Method of collecting information in computer system, management computer using the same, and computer system |
| JP2010128661A (en) * | 2008-11-26 | 2010-06-10 | Fujitsu Ltd | Method and apparatus for guessing cause of failure, and program |
Family Cites Families (5)
| Publication number | Priority date | Publication date | Assignee | Title |
|---|---|---|---|---|
| US5528516A (en) * | 1994-05-25 | 1996-06-18 | System Management Arts, Inc. | Apparatus and method for event correlation and problem reporting |
| JP3996040B2 (en) * | 2002-11-06 | 2007-10-24 | 株式会社日立製作所 | Database disturbance elimination processing method, implementation apparatus thereof, and processing program thereof |
| JP4872262B2 (en) * | 2005-07-27 | 2012-02-08 | 日本電気株式会社 | Management support system, management support method, and management support program |
| JP5087309B2 (en) * | 2007-04-24 | 2012-12-05 | 株式会社日立製作所 | Management apparatus and management method |
| US8112378B2 (en) * | 2008-06-17 | 2012-02-07 | Hitachi, Ltd. | Methods and systems for performing root cause analysis |
-
2010
- 2010-07-16 JP JP2010161724A patent/JP5419819B2/en not_active Expired - Fee Related
- 2010-07-28 WO PCT/JP2010/062696 patent/WO2012008058A1/en active Application Filing
- 2010-07-28 CN CN201080067454.0A patent/CN102959521B/en not_active Expired - Fee Related
- 2010-07-28 EP EP10854740.7A patent/EP2562651A4/en not_active Withdrawn
Patent Citations (4)
| Publication number | Priority date | Publication date | Assignee | Title |
|---|---|---|---|---|
| JPH0730540A (en) * | 1993-07-08 | 1995-01-31 | Hitachi Ltd | Network fault monitor equipment |
| US7107185B1 (en) | 1994-05-25 | 2006-09-12 | Emc Corporation | Apparatus and method for event correlation and problem reporting |
| WO2009144969A2 (en) * | 2008-05-27 | 2009-12-03 | 株式会社日立製作所 | Method of collecting information in computer system, management computer using the same, and computer system |
| JP2010128661A (en) * | 2008-11-26 | 2010-06-10 | Fujitsu Ltd | Method and apparatus for guessing cause of failure, and program |
Non-Patent Citations (1)
| Title |
|---|
| See also references of EP2562651A4 * |
Also Published As
| Publication number | Publication date |
|---|---|
| JP2012022614A (en) | 2012-02-02 |
| EP2562651A1 (en) | 2013-02-27 |
| JP5419819B2 (en) | 2014-02-19 |
| CN102959521B (en) | 2015-11-25 |
| CN102959521A (en) | 2013-03-06 |
| EP2562651A4 (en) | 2017-08-23 |
Similar Documents
| Publication | Publication Date | Title |
|---|---|---|
| JP5684946B2 (en) | Method and system for supporting analysis of root cause of event | |
| US8819220B2 (en) | Management method of computer system and management system | |
| US8429455B2 (en) | Computer system management method and management system | |
| JP5432867B2 (en) | Computer system management method and management system | |
| US9294338B2 (en) | Management computer and method for root cause analysis | |
| US8972622B2 (en) | Monitoring network performance and detecting network faults using round trip transmission times | |
| US9619314B2 (en) | Management system and management program | |
| JP5222876B2 (en) | System management method and management system in computer system | |
| EP2523115A1 (en) | Operation management device, operation management method, and program storage medium | |
| JP5419819B2 (en) | Computer system management method and management system | |
| US20140122931A1 (en) | Performing diagnostic tests in a data center | |
| US20120102362A1 (en) | Management system and management method | |
| US9852007B2 (en) | System management method, management computer, and non-transitory computer-readable storage medium | |
| JP6009089B2 (en) | Management system for managing computer system and management method thereof | |
| US9021078B2 (en) | Management method and management system | |
| US20170132102A1 (en) | Computer readable non-transitory recording medium storing pseudo failure generation program, generation method, and generation apparatus | |
| US20160197994A1 (en) | Storage array confirmation of use of a path | |
| US9411666B2 (en) | Anticipatory protection of critical jobs in a computing system | |
| JP2019009726A (en) | Fault separating method and administrative server | |
| US20120089874A1 (en) | Diagnosing entities associated with software components | |
| EP3537300A1 (en) | Application reconfiguration |
Legal Events
| Date | Code | Title | Description |
|---|---|---|---|
| WWE | Wipo information: entry into national phase |
Ref document number: 201080067454.0 Country of ref document: CN |
|
| WWE | Wipo information: entry into national phase |
Ref document number: 12995133 Country of ref document: US |
|
| 121 | Ep: the epo has been informed by wipo that ep was designated in this application |
Ref document number: 10854740 Country of ref document: EP Kind code of ref document: A1 |
|
| WWE | Wipo information: entry into national phase |
Ref document number: 2547/MUMNP/2012 Country of ref document: IN |
|
| WWE | Wipo information: entry into national phase |
Ref document number: 2010854740 Country of ref document: EP |
|
| NENP | Non-entry into the national phase |
Ref country code: DE |