WO2012100235A2 - Systems and methods for sample use maximization - Google Patents
Systems and methods for sample use maximization Download PDFInfo
- Publication number
- WO2012100235A2 WO2012100235A2 PCT/US2012/022130 US2012022130W WO2012100235A2 WO 2012100235 A2 WO2012100235 A2 WO 2012100235A2 US 2012022130 W US2012022130 W US 2012022130W WO 2012100235 A2 WO2012100235 A2 WO 2012100235A2
- Authority
- WO
- WIPO (PCT)
- Prior art keywords
- sample
- tip
- container
- assay
- concentration
- Prior art date
Links
- 238000000034 method Methods 0.000 title claims abstract description 277
- 238000001514 detection method Methods 0.000 claims abstract description 158
- 238000002360 preparation method Methods 0.000 claims abstract description 23
- 238000003556 assay Methods 0.000 claims description 473
- 210000004027 cell Anatomy 0.000 claims description 280
- 238000003384 imaging method Methods 0.000 claims description 246
- 239000003153 chemical reaction reagent Substances 0.000 claims description 232
- 239000012491 analyte Substances 0.000 claims description 159
- 238000005259 measurement Methods 0.000 claims description 156
- 210000004369 blood Anatomy 0.000 claims description 115
- 239000008280 blood Substances 0.000 claims description 115
- 239000007788 liquid Substances 0.000 claims description 101
- 238000005119 centrifugation Methods 0.000 claims description 92
- 210000002381 plasma Anatomy 0.000 claims description 90
- 238000010790 dilution Methods 0.000 claims description 87
- 239000012895 dilution Substances 0.000 claims description 87
- 239000012530 fluid Substances 0.000 claims description 77
- 239000000463 material Substances 0.000 claims description 65
- 230000007246 mechanism Effects 0.000 claims description 57
- 238000005286 illumination Methods 0.000 claims description 54
- -1 debris Substances 0.000 claims description 32
- 238000012545 processing Methods 0.000 claims description 32
- 239000011541 reaction mixture Substances 0.000 claims description 30
- 238000000605 extraction Methods 0.000 claims description 29
- 230000003595 spectral effect Effects 0.000 claims description 26
- 230000000694 effects Effects 0.000 claims description 24
- 230000000295 complement effect Effects 0.000 claims description 21
- 239000006228 supernatant Substances 0.000 claims description 21
- 230000005540 biological transmission Effects 0.000 claims description 19
- 210000002966 serum Anatomy 0.000 claims description 19
- 239000008188 pellet Substances 0.000 claims description 18
- 239000013060 biological fluid Substances 0.000 claims description 17
- 239000002245 particle Substances 0.000 claims description 16
- 230000001965 increasing effect Effects 0.000 claims description 15
- 238000009987 spinning Methods 0.000 claims description 14
- 239000002244 precipitate Substances 0.000 claims description 13
- 238000003908 quality control method Methods 0.000 claims description 13
- 238000011282 treatment Methods 0.000 claims description 11
- 238000002156 mixing Methods 0.000 claims description 10
- 210000000601 blood cell Anatomy 0.000 claims description 9
- 239000000835 fiber Substances 0.000 claims description 8
- 238000007789 sealing Methods 0.000 claims description 6
- 238000011068 loading method Methods 0.000 claims description 5
- 210000003296 saliva Anatomy 0.000 claims description 5
- 230000036541 health Effects 0.000 claims description 4
- 210000002700 urine Anatomy 0.000 claims description 4
- 210000000582 semen Anatomy 0.000 claims description 2
- 238000004458 analytical method Methods 0.000 abstract description 60
- 238000012360 testing method Methods 0.000 abstract description 40
- 210000001124 body fluid Anatomy 0.000 abstract description 26
- 230000001976 improved effect Effects 0.000 abstract description 20
- 239000000523 sample Substances 0.000 description 689
- 230000003287 optical effect Effects 0.000 description 94
- 108091023037 Aptamer Proteins 0.000 description 86
- 238000006243 chemical reaction Methods 0.000 description 81
- 108091006146 Channels Proteins 0.000 description 79
- 230000006870 function Effects 0.000 description 47
- 239000007795 chemical reaction product Substances 0.000 description 45
- 150000007523 nucleic acids Chemical group 0.000 description 45
- 108020004707 nucleic acids Proteins 0.000 description 44
- 102000039446 nucleic acids Human genes 0.000 description 44
- 230000027455 binding Effects 0.000 description 42
- 238000009739 binding Methods 0.000 description 42
- 108090000623 proteins and genes Proteins 0.000 description 41
- 239000000243 solution Substances 0.000 description 41
- 230000008569 process Effects 0.000 description 40
- 230000004044 response Effects 0.000 description 39
- 238000005534 hematocrit Methods 0.000 description 38
- 230000005499 meniscus Effects 0.000 description 37
- 239000000203 mixture Substances 0.000 description 36
- 238000002835 absorbance Methods 0.000 description 35
- 102000004169 proteins and genes Human genes 0.000 description 35
- 238000000926 separation method Methods 0.000 description 35
- 150000001875 compounds Chemical class 0.000 description 33
- 235000018102 proteins Nutrition 0.000 description 33
- 238000004891 communication Methods 0.000 description 32
- 239000000047 product Substances 0.000 description 32
- 239000003085 diluting agent Substances 0.000 description 31
- 239000003814 drug Substances 0.000 description 31
- 238000012546 transfer Methods 0.000 description 31
- 230000003321 amplification Effects 0.000 description 30
- 238000010191 image analysis Methods 0.000 description 30
- 238000003199 nucleic acid amplification method Methods 0.000 description 30
- 102000004190 Enzymes Human genes 0.000 description 29
- 108090000790 Enzymes Proteins 0.000 description 29
- 229940088598 enzyme Drugs 0.000 description 29
- 239000000758 substrate Substances 0.000 description 29
- 210000000265 leukocyte Anatomy 0.000 description 28
- 239000000975 dye Substances 0.000 description 27
- 230000035945 sensitivity Effects 0.000 description 27
- 238000004422 calculation algorithm Methods 0.000 description 24
- 238000004163 cytometry Methods 0.000 description 24
- 239000011324 bead Substances 0.000 description 22
- HVYWMOMLDIMFJA-DPAQBDIFSA-N cholesterol Chemical compound C1C=C2C[C@@H](O)CC[C@]2(C)[C@@H]2[C@@H]1[C@@H]1CC[C@H]([C@H](C)CCCC(C)C)[C@@]1(C)CC2 HVYWMOMLDIMFJA-DPAQBDIFSA-N 0.000 description 22
- 239000000376 reactant Substances 0.000 description 22
- 230000009471 action Effects 0.000 description 21
- 229940079593 drug Drugs 0.000 description 21
- 108020004414 DNA Proteins 0.000 description 20
- 238000013461 design Methods 0.000 description 20
- 230000004520 agglutination Effects 0.000 description 19
- 239000000872 buffer Substances 0.000 description 19
- 238000002474 experimental method Methods 0.000 description 19
- 239000000090 biomarker Substances 0.000 description 17
- UDSAIICHUKSCKT-UHFFFAOYSA-N bromophenol blue Chemical compound C1=C(Br)C(O)=C(Br)C=C1C1(C=2C=C(Br)C(O)=C(Br)C=2)C2=CC=CC=C2S(=O)(=O)O1 UDSAIICHUKSCKT-UHFFFAOYSA-N 0.000 description 17
- 208000037265 diseases, disorders, signs and symptoms Diseases 0.000 description 17
- 238000004519 manufacturing process Methods 0.000 description 17
- 238000001228 spectrum Methods 0.000 description 17
- YBJHBAHKTGYVGT-ZKWXMUAHSA-N (+)-Biotin Chemical compound N1C(=O)N[C@@H]2[C@H](CCCCC(=O)O)SC[C@@H]21 YBJHBAHKTGYVGT-ZKWXMUAHSA-N 0.000 description 16
- 239000004793 Polystyrene Substances 0.000 description 16
- 238000009826 distribution Methods 0.000 description 16
- 238000011534 incubation Methods 0.000 description 16
- 238000012544 monitoring process Methods 0.000 description 16
- 229920002223 polystyrene Polymers 0.000 description 16
- 230000008859 change Effects 0.000 description 15
- 201000010099 disease Diseases 0.000 description 15
- 230000005284 excitation Effects 0.000 description 15
- 108020004774 Alkaline Phosphatase Proteins 0.000 description 14
- 102000002260 Alkaline Phosphatase Human genes 0.000 description 14
- 239000003795 chemical substances by application Substances 0.000 description 14
- 229930027945 nicotinamide-adenine dinucleotide Natural products 0.000 description 14
- XLYOFNOQVPJJNP-UHFFFAOYSA-N water Substances O XLYOFNOQVPJJNP-UHFFFAOYSA-N 0.000 description 14
- 238000012937 correction Methods 0.000 description 13
- 230000003247 decreasing effect Effects 0.000 description 13
- 238000004020 luminiscence type Methods 0.000 description 13
- 230000008901 benefit Effects 0.000 description 12
- 238000005516 engineering process Methods 0.000 description 12
- 230000033001 locomotion Effects 0.000 description 12
- 102000005962 receptors Human genes 0.000 description 12
- 108020003175 receptors Proteins 0.000 description 12
- 238000011084 recovery Methods 0.000 description 12
- 239000007787 solid Substances 0.000 description 12
- 239000000126 substance Substances 0.000 description 12
- 210000001519 tissue Anatomy 0.000 description 12
- 102000003855 L-lactate dehydrogenase Human genes 0.000 description 11
- 108700023483 L-lactate dehydrogenases Proteins 0.000 description 11
- 238000007397 LAMP assay Methods 0.000 description 11
- 239000000427 antigen Substances 0.000 description 11
- 102000036639 antigens Human genes 0.000 description 11
- 108091007433 antigens Proteins 0.000 description 11
- 239000011230 binding agent Substances 0.000 description 11
- 235000012000 cholesterol Nutrition 0.000 description 11
- 230000008713 feedback mechanism Effects 0.000 description 11
- 239000011521 glass Substances 0.000 description 11
- 238000002372 labelling Methods 0.000 description 11
- 239000003446 ligand Substances 0.000 description 11
- 230000002934 lysing effect Effects 0.000 description 11
- 239000002207 metabolite Substances 0.000 description 11
- 238000002560 therapeutic procedure Methods 0.000 description 11
- 102100036475 Alanine aminotransferase 1 Human genes 0.000 description 10
- 108010082126 Alanine transaminase Proteins 0.000 description 10
- 101000738771 Homo sapiens Receptor-type tyrosine-protein phosphatase C Proteins 0.000 description 10
- MHAJPDPJQMAIIY-UHFFFAOYSA-N Hydrogen peroxide Chemical compound OO MHAJPDPJQMAIIY-UHFFFAOYSA-N 0.000 description 10
- 102100037422 Receptor-type tyrosine-protein phosphatase C Human genes 0.000 description 10
- 241000700605 Viruses Species 0.000 description 10
- 239000007850 fluorescent dye Substances 0.000 description 10
- 230000014509 gene expression Effects 0.000 description 10
- 238000010438 heat treatment Methods 0.000 description 10
- 238000003018 immunoassay Methods 0.000 description 10
- BOPGDPNILDQYTO-NNYOXOHSSA-N nicotinamide-adenine dinucleotide Chemical compound C1=CCC(C(=O)N)=CN1[C@H]1[C@H](O)[C@H](O)[C@@H](COP(O)(=O)OP(O)(=O)OC[C@@H]2[C@H]([C@@H](O)[C@@H](O2)N2C3=NC=NC(N)=C3N=C2)O)O1 BOPGDPNILDQYTO-NNYOXOHSSA-N 0.000 description 10
- 229920003023 plastic Polymers 0.000 description 10
- 239000004033 plastic Substances 0.000 description 10
- LFQSCWFLJHTTHZ-UHFFFAOYSA-N Ethanol Chemical compound CCO LFQSCWFLJHTTHZ-UHFFFAOYSA-N 0.000 description 9
- 108091034117 Oligonucleotide Proteins 0.000 description 9
- 238000013459 approach Methods 0.000 description 9
- 210000003743 erythrocyte Anatomy 0.000 description 9
- 239000004816 latex Substances 0.000 description 9
- 229920000126 latex Polymers 0.000 description 9
- 230000002829 reductive effect Effects 0.000 description 9
- 239000000725 suspension Substances 0.000 description 9
- 108010088751 Albumins Proteins 0.000 description 8
- 102000009027 Albumins Human genes 0.000 description 8
- 108090001008 Avidin Proteins 0.000 description 8
- 238000000018 DNA microarray Methods 0.000 description 8
- 238000002965 ELISA Methods 0.000 description 8
- 229960002685 biotin Drugs 0.000 description 8
- 235000020958 biotin Nutrition 0.000 description 8
- 239000011616 biotin Substances 0.000 description 8
- 239000003086 colorant Substances 0.000 description 8
- 238000005457 optimization Methods 0.000 description 8
- 238000005086 pumping Methods 0.000 description 8
- 239000012898 sample dilution Substances 0.000 description 8
- 239000007790 solid phase Substances 0.000 description 8
- RWQNBRDOKXIBIV-UHFFFAOYSA-N thymine Chemical compound CC1=CNC(=O)NC1=O RWQNBRDOKXIBIV-UHFFFAOYSA-N 0.000 description 8
- 230000007704 transition Effects 0.000 description 8
- 238000012286 ELISA Assay Methods 0.000 description 7
- WQZGKKKJIJFFOK-GASJEMHNSA-N Glucose Natural products OC[C@H]1OC(O)[C@H](O)[C@@H](O)[C@@H]1O WQZGKKKJIJFFOK-GASJEMHNSA-N 0.000 description 7
- 108010028554 LDL Cholesterol Proteins 0.000 description 7
- VYPSYNLAJGMNEJ-UHFFFAOYSA-N Silicium dioxide Chemical compound O=[Si]=O VYPSYNLAJGMNEJ-UHFFFAOYSA-N 0.000 description 7
- 229930003316 Vitamin D Natural products 0.000 description 7
- QYSXJUFSXHHAJI-XFEUOLMDSA-N Vitamin D3 Natural products C1(/[C@@H]2CC[C@@H]([C@]2(CCC1)C)[C@H](C)CCCC(C)C)=C/C=C1\C[C@@H](O)CCC1=C QYSXJUFSXHHAJI-XFEUOLMDSA-N 0.000 description 7
- 238000000149 argon plasma sintering Methods 0.000 description 7
- 239000012141 concentrate Substances 0.000 description 7
- 230000007547 defect Effects 0.000 description 7
- 239000012470 diluted sample Substances 0.000 description 7
- 239000000834 fixative Substances 0.000 description 7
- 239000008103 glucose Substances 0.000 description 7
- 239000003550 marker Substances 0.000 description 7
- 239000011325 microbead Substances 0.000 description 7
- 241000894007 species Species 0.000 description 7
- 238000002798 spectrophotometry method Methods 0.000 description 7
- 235000000346 sugar Nutrition 0.000 description 7
- 125000000391 vinyl group Chemical group [H]C([*])=C([H])[H] 0.000 description 7
- 229920002554 vinyl polymer Polymers 0.000 description 7
- 235000019166 vitamin D Nutrition 0.000 description 7
- 239000011710 vitamin D Substances 0.000 description 7
- 150000003710 vitamin D derivatives Chemical class 0.000 description 7
- 229940046008 vitamin d Drugs 0.000 description 7
- 108091032973 (ribonucleotides)n+m Proteins 0.000 description 6
- VOXZDWNPVJITMN-ZBRFXRBCSA-N 17β-estradiol Chemical compound OC1=CC=C2[C@H]3CC[C@](C)([C@H](CC4)O)[C@@H]4[C@@H]3CCC2=C1 VOXZDWNPVJITMN-ZBRFXRBCSA-N 0.000 description 6
- 102100038080 B-cell receptor CD22 Human genes 0.000 description 6
- BPYKTIZUTYGOLE-IFADSCNNSA-N Bilirubin Chemical compound N1C(=O)C(C)=C(C=C)\C1=C\C1=C(C)C(CCC(O)=O)=C(CC2=C(C(C)=C(\C=C/3C(=C(C=C)C(=O)N\3)C)N2)CCC(O)=O)N1 BPYKTIZUTYGOLE-IFADSCNNSA-N 0.000 description 6
- 101000884305 Homo sapiens B-cell receptor CD22 Proteins 0.000 description 6
- 238000008214 LDL Cholesterol Methods 0.000 description 6
- 239000004743 Polypropylene Substances 0.000 description 6
- 206010036618 Premenstrual syndrome Diseases 0.000 description 6
- FAPWRFPIFSIZLT-UHFFFAOYSA-M Sodium chloride Chemical compound [Na+].[Cl-] FAPWRFPIFSIZLT-UHFFFAOYSA-M 0.000 description 6
- JLCPHMBAVCMARE-UHFFFAOYSA-N [3-[[3-[[3-[[3-[[3-[[3-[[3-[[3-[[3-[[3-[[3-[[5-(2-amino-6-oxo-1H-purin-9-yl)-3-[[3-[[3-[[3-[[3-[[3-[[5-(2-amino-6-oxo-1H-purin-9-yl)-3-[[5-(2-amino-6-oxo-1H-purin-9-yl)-3-hydroxyoxolan-2-yl]methoxy-hydroxyphosphoryl]oxyoxolan-2-yl]methoxy-hydroxyphosphoryl]oxy-5-(5-methyl-2,4-dioxopyrimidin-1-yl)oxolan-2-yl]methoxy-hydroxyphosphoryl]oxy-5-(6-aminopurin-9-yl)oxolan-2-yl]methoxy-hydroxyphosphoryl]oxy-5-(6-aminopurin-9-yl)oxolan-2-yl]methoxy-hydroxyphosphoryl]oxy-5-(6-aminopurin-9-yl)oxolan-2-yl]methoxy-hydroxyphosphoryl]oxy-5-(6-aminopurin-9-yl)oxolan-2-yl]methoxy-hydroxyphosphoryl]oxyoxolan-2-yl]methoxy-hydroxyphosphoryl]oxy-5-(5-methyl-2,4-dioxopyrimidin-1-yl)oxolan-2-yl]methoxy-hydroxyphosphoryl]oxy-5-(4-amino-2-oxopyrimidin-1-yl)oxolan-2-yl]methoxy-hydroxyphosphoryl]oxy-5-(5-methyl-2,4-dioxopyrimidin-1-yl)oxolan-2-yl]methoxy-hydroxyphosphoryl]oxy-5-(5-methyl-2,4-dioxopyrimidin-1-yl)oxolan-2-yl]methoxy-hydroxyphosphoryl]oxy-5-(6-aminopurin-9-yl)oxolan-2-yl]methoxy-hydroxyphosphoryl]oxy-5-(6-aminopurin-9-yl)oxolan-2-yl]methoxy-hydroxyphosphoryl]oxy-5-(4-amino-2-oxopyrimidin-1-yl)oxolan-2-yl]methoxy-hydroxyphosphoryl]oxy-5-(4-amino-2-oxopyrimidin-1-yl)oxolan-2-yl]methoxy-hydroxyphosphoryl]oxy-5-(4-amino-2-oxopyrimidin-1-yl)oxolan-2-yl]methoxy-hydroxyphosphoryl]oxy-5-(6-aminopurin-9-yl)oxolan-2-yl]methoxy-hydroxyphosphoryl]oxy-5-(4-amino-2-oxopyrimidin-1-yl)oxolan-2-yl]methyl [5-(6-aminopurin-9-yl)-2-(hydroxymethyl)oxolan-3-yl] hydrogen phosphate Polymers Cc1cn(C2CC(OP(O)(=O)OCC3OC(CC3OP(O)(=O)OCC3OC(CC3O)n3cnc4c3nc(N)[nH]c4=O)n3cnc4c3nc(N)[nH]c4=O)C(COP(O)(=O)OC3CC(OC3COP(O)(=O)OC3CC(OC3COP(O)(=O)OC3CC(OC3COP(O)(=O)OC3CC(OC3COP(O)(=O)OC3CC(OC3COP(O)(=O)OC3CC(OC3COP(O)(=O)OC3CC(OC3COP(O)(=O)OC3CC(OC3COP(O)(=O)OC3CC(OC3COP(O)(=O)OC3CC(OC3COP(O)(=O)OC3CC(OC3COP(O)(=O)OC3CC(OC3COP(O)(=O)OC3CC(OC3COP(O)(=O)OC3CC(OC3COP(O)(=O)OC3CC(OC3COP(O)(=O)OC3CC(OC3COP(O)(=O)OC3CC(OC3CO)n3cnc4c(N)ncnc34)n3ccc(N)nc3=O)n3cnc4c(N)ncnc34)n3ccc(N)nc3=O)n3ccc(N)nc3=O)n3ccc(N)nc3=O)n3cnc4c(N)ncnc34)n3cnc4c(N)ncnc34)n3cc(C)c(=O)[nH]c3=O)n3cc(C)c(=O)[nH]c3=O)n3ccc(N)nc3=O)n3cc(C)c(=O)[nH]c3=O)n3cnc4c3nc(N)[nH]c4=O)n3cnc4c(N)ncnc34)n3cnc4c(N)ncnc34)n3cnc4c(N)ncnc34)n3cnc4c(N)ncnc34)O2)c(=O)[nH]c1=O JLCPHMBAVCMARE-UHFFFAOYSA-N 0.000 description 6
- 238000003491 array Methods 0.000 description 6
- 239000006285 cell suspension Substances 0.000 description 6
- 239000011248 coating agent Substances 0.000 description 6
- 238000000576 coating method Methods 0.000 description 6
- 230000008878 coupling Effects 0.000 description 6
- 238000010168 coupling process Methods 0.000 description 6
- 238000005859 coupling reaction Methods 0.000 description 6
- 230000009089 cytolysis Effects 0.000 description 6
- 229960005309 estradiol Drugs 0.000 description 6
- 229930182833 estradiol Natural products 0.000 description 6
- 238000002073 fluorescence micrograph Methods 0.000 description 6
- 238000009396 hybridization Methods 0.000 description 6
- NOESYZHRGYRDHS-UHFFFAOYSA-N insulin Chemical compound N1C(=O)C(NC(=O)C(CCC(N)=O)NC(=O)C(CCC(O)=O)NC(=O)C(C(C)C)NC(=O)C(NC(=O)CN)C(C)CC)CSSCC(C(NC(CO)C(=O)NC(CC(C)C)C(=O)NC(CC=2C=CC(O)=CC=2)C(=O)NC(CCC(N)=O)C(=O)NC(CC(C)C)C(=O)NC(CCC(O)=O)C(=O)NC(CC(N)=O)C(=O)NC(CC=2C=CC(O)=CC=2)C(=O)NC(CSSCC(NC(=O)C(C(C)C)NC(=O)C(CC(C)C)NC(=O)C(CC=2C=CC(O)=CC=2)NC(=O)C(CC(C)C)NC(=O)C(C)NC(=O)C(CCC(O)=O)NC(=O)C(C(C)C)NC(=O)C(CC(C)C)NC(=O)C(CC=2NC=NC=2)NC(=O)C(CO)NC(=O)CNC2=O)C(=O)NCC(=O)NC(CCC(O)=O)C(=O)NC(CCCNC(N)=N)C(=O)NCC(=O)NC(CC=3C=CC=CC=3)C(=O)NC(CC=3C=CC=CC=3)C(=O)NC(CC=3C=CC(O)=CC=3)C(=O)NC(C(C)O)C(=O)N3C(CCC3)C(=O)NC(CCCCN)C(=O)NC(C)C(O)=O)C(=O)NC(CC(N)=O)C(O)=O)=O)NC(=O)C(C(C)CC)NC(=O)C(CO)NC(=O)C(C(C)O)NC(=O)C1CSSCC2NC(=O)C(CC(C)C)NC(=O)C(NC(=O)C(CCC(N)=O)NC(=O)C(CC(N)=O)NC(=O)C(NC(=O)C(N)CC=1C=CC=CC=1)C(C)C)CC1=CN=CN1 NOESYZHRGYRDHS-UHFFFAOYSA-N 0.000 description 6
- 125000005647 linker group Chemical group 0.000 description 6
- 239000011159 matrix material Substances 0.000 description 6
- 239000012528 membrane Substances 0.000 description 6
- 229910021645 metal ion Inorganic materials 0.000 description 6
- 230000004048 modification Effects 0.000 description 6
- 238000012986 modification Methods 0.000 description 6
- 229920000642 polymer Polymers 0.000 description 6
- 229920001155 polypropylene Polymers 0.000 description 6
- 108090000765 processed proteins & peptides Proteins 0.000 description 6
- QZAYGJVTTNCVMB-UHFFFAOYSA-N serotonin Chemical compound C1=C(O)C=C2C(CCN)=CNC2=C1 QZAYGJVTTNCVMB-UHFFFAOYSA-N 0.000 description 6
- JUJBNYBVVQSIOU-UHFFFAOYSA-M sodium;4-[2-(4-iodophenyl)-3-(4-nitrophenyl)tetrazol-2-ium-5-yl]benzene-1,3-disulfonate Chemical compound [Na+].C1=CC([N+](=O)[O-])=CC=C1N1[N+](C=2C=CC(I)=CC=2)=NC(C=2C(=CC(=CC=2)S([O-])(=O)=O)S([O-])(=O)=O)=N1 JUJBNYBVVQSIOU-UHFFFAOYSA-M 0.000 description 6
- 108010074051 C-Reactive Protein Proteins 0.000 description 5
- 102100032752 C-reactive protein Human genes 0.000 description 5
- OYPRJOBELJOOCE-UHFFFAOYSA-N Calcium Chemical compound [Ca] OYPRJOBELJOOCE-UHFFFAOYSA-N 0.000 description 5
- 108091008102 DNA aptamers Proteins 0.000 description 5
- 108010001336 Horseradish Peroxidase Proteins 0.000 description 5
- 241001465754 Metazoa Species 0.000 description 5
- 206010028980 Neoplasm Diseases 0.000 description 5
- 108020004711 Nucleic Acid Probes Proteins 0.000 description 5
- 239000003146 anticoagulant agent Substances 0.000 description 5
- 229940127219 anticoagulant drug Drugs 0.000 description 5
- 239000011575 calcium Substances 0.000 description 5
- 229910052791 calcium Inorganic materials 0.000 description 5
- 238000003745 diagnosis Methods 0.000 description 5
- 239000006185 dispersion Substances 0.000 description 5
- 238000006073 displacement reaction Methods 0.000 description 5
- 239000003792 electrolyte Substances 0.000 description 5
- 150000002148 esters Chemical class 0.000 description 5
- 238000011156 evaluation Methods 0.000 description 5
- 238000011901 isothermal amplification Methods 0.000 description 5
- 150000002632 lipids Chemical class 0.000 description 5
- 238000002493 microarray Methods 0.000 description 5
- 238000000386 microscopy Methods 0.000 description 5
- 108091008104 nucleic acid aptamers Proteins 0.000 description 5
- 239000002853 nucleic acid probe Substances 0.000 description 5
- 125000003729 nucleotide group Chemical group 0.000 description 5
- 230000003285 pharmacodynamic effect Effects 0.000 description 5
- 230000000144 pharmacologic effect Effects 0.000 description 5
- 238000005424 photoluminescence Methods 0.000 description 5
- 238000011002 quantification Methods 0.000 description 5
- 229920006395 saturated elastomer Polymers 0.000 description 5
- 150000003384 small molecules Chemical class 0.000 description 5
- 229940124597 therapeutic agent Drugs 0.000 description 5
- 238000004879 turbidimetry Methods 0.000 description 5
- RNIPJYFZGXJSDD-UHFFFAOYSA-N 2,4,5-triphenyl-1h-imidazole Chemical class C1=CC=CC=C1C1=NC(C=2C=CC=CC=2)=C(C=2C=CC=CC=2)N1 RNIPJYFZGXJSDD-UHFFFAOYSA-N 0.000 description 4
- 102400000630 Acylation stimulating protein Human genes 0.000 description 4
- 101800000415 Acylation stimulating protein Proteins 0.000 description 4
- BVTJGGGYKAMDBN-UHFFFAOYSA-N Dioxetane Chemical class C1COO1 BVTJGGGYKAMDBN-UHFFFAOYSA-N 0.000 description 4
- 102000001554 Hemoglobins Human genes 0.000 description 4
- 108010054147 Hemoglobins Proteins 0.000 description 4
- 108010007622 LDL Lipoproteins Proteins 0.000 description 4
- 102000007330 LDL Lipoproteins Human genes 0.000 description 4
- FYYHWMGAXLPEAU-UHFFFAOYSA-N Magnesium Chemical compound [Mg] FYYHWMGAXLPEAU-UHFFFAOYSA-N 0.000 description 4
- JLVVSXFLKOJNIY-UHFFFAOYSA-N Magnesium ion Chemical compound [Mg+2] JLVVSXFLKOJNIY-UHFFFAOYSA-N 0.000 description 4
- CSNNHWWHGAXBCP-UHFFFAOYSA-L Magnesium sulfate Chemical compound [Mg+2].[O-][S+2]([O-])([O-])[O-] CSNNHWWHGAXBCP-UHFFFAOYSA-L 0.000 description 4
- WCUXLLCKKVVCTQ-UHFFFAOYSA-M Potassium chloride Chemical compound [Cl-].[K+] WCUXLLCKKVVCTQ-UHFFFAOYSA-M 0.000 description 4
- 108010072866 Prostate-Specific Antigen Proteins 0.000 description 4
- 102100038358 Prostate-specific antigen Human genes 0.000 description 4
- 108010094028 Prothrombin Proteins 0.000 description 4
- 108090000190 Thrombin Proteins 0.000 description 4
- XJLXINKUBYWONI-DQQFMEOOSA-N [[(2r,3r,4r,5r)-5-(6-aminopurin-9-yl)-3-hydroxy-4-phosphonooxyoxolan-2-yl]methoxy-hydroxyphosphoryl] [(2s,3r,4s,5s)-5-(3-carbamoylpyridin-1-ium-1-yl)-3,4-dihydroxyoxolan-2-yl]methyl phosphate Chemical compound NC(=O)C1=CC=C[N+]([C@@H]2[C@H]([C@@H](O)[C@H](COP([O-])(=O)OP(O)(=O)OC[C@@H]3[C@H]([C@@H](OP(O)(O)=O)[C@@H](O3)N3C4=NC=NC(N)=C4N=C3)O)O2)O)=C1 XJLXINKUBYWONI-DQQFMEOOSA-N 0.000 description 4
- 238000010521 absorption reaction Methods 0.000 description 4
- 108010026331 alpha-Fetoproteins Proteins 0.000 description 4
- 102000013529 alpha-Fetoproteins Human genes 0.000 description 4
- 235000013405 beer Nutrition 0.000 description 4
- 239000003593 chromogenic compound Substances 0.000 description 4
- 238000012790 confirmation Methods 0.000 description 4
- 238000007796 conventional method Methods 0.000 description 4
- DDRJAANPRJIHGJ-UHFFFAOYSA-N creatinine Chemical compound CN1CC(=O)NC1=N DDRJAANPRJIHGJ-UHFFFAOYSA-N 0.000 description 4
- OPTASPLRGRRNAP-UHFFFAOYSA-N cytosine Chemical compound NC=1C=CNC(=O)N=1 OPTASPLRGRRNAP-UHFFFAOYSA-N 0.000 description 4
- 230000007423 decrease Effects 0.000 description 4
- 230000001419 dependent effect Effects 0.000 description 4
- 239000010432 diamond Substances 0.000 description 4
- 231100000673 dose–response relationship Toxicity 0.000 description 4
- 239000000284 extract Substances 0.000 description 4
- 238000001914 filtration Methods 0.000 description 4
- 150000004676 glycans Chemical class 0.000 description 4
- 230000005484 gravity Effects 0.000 description 4
- UYTPUPDQBNUYGX-UHFFFAOYSA-N guanine Chemical compound O=C1NC(N)=NC2=C1N=CN2 UYTPUPDQBNUYGX-UHFFFAOYSA-N 0.000 description 4
- 230000003100 immobilizing effect Effects 0.000 description 4
- 238000001746 injection moulding Methods 0.000 description 4
- 230000003834 intracellular effect Effects 0.000 description 4
- 238000011005 laboratory method Methods 0.000 description 4
- 230000000670 limiting effect Effects 0.000 description 4
- HWYHZTIRURJOHG-UHFFFAOYSA-N luminol Chemical compound O=C1NNC(=O)C2=C1C(N)=CC=C2 HWYHZTIRURJOHG-UHFFFAOYSA-N 0.000 description 4
- 239000011777 magnesium Substances 0.000 description 4
- 229910052749 magnesium Inorganic materials 0.000 description 4
- 238000007726 management method Methods 0.000 description 4
- 230000000877 morphologic effect Effects 0.000 description 4
- 239000002773 nucleotide Substances 0.000 description 4
- 229920003229 poly(methyl methacrylate) Polymers 0.000 description 4
- 239000004926 polymethyl methacrylate Substances 0.000 description 4
- 229920001282 polysaccharide Polymers 0.000 description 4
- 239000005017 polysaccharide Substances 0.000 description 4
- 102000004196 processed proteins & peptides Human genes 0.000 description 4
- 230000001105 regulatory effect Effects 0.000 description 4
- 102000029752 retinol binding Human genes 0.000 description 4
- 108091000053 retinol binding Proteins 0.000 description 4
- 239000013049 sediment Substances 0.000 description 4
- 238000013207 serial dilution Methods 0.000 description 4
- 238000000638 solvent extraction Methods 0.000 description 4
- 230000003068 static effect Effects 0.000 description 4
- 238000003860 storage Methods 0.000 description 4
- ZFXYFBGIUFBOJW-UHFFFAOYSA-N theophylline Chemical compound O=C1N(C)C(=O)N(C)C2=C1NC=N2 ZFXYFBGIUFBOJW-UHFFFAOYSA-N 0.000 description 4
- 229960004072 thrombin Drugs 0.000 description 4
- 238000005406 washing Methods 0.000 description 4
- 238000003466 welding Methods 0.000 description 4
- WFDIJRYMOXRFFG-UHFFFAOYSA-N Acetic anhydride Chemical compound CC(=O)OC(C)=O WFDIJRYMOXRFFG-UHFFFAOYSA-N 0.000 description 3
- 102100025674 Angiopoietin-related protein 4 Human genes 0.000 description 3
- 241000222122 Candida albicans Species 0.000 description 3
- JJLJMEJHUUYSSY-UHFFFAOYSA-L Copper hydroxide Chemical compound [OH-].[OH-].[Cu+2] JJLJMEJHUUYSSY-UHFFFAOYSA-L 0.000 description 3
- HMFHBZSHGGEWLO-SOOFDHNKSA-N D-ribofuranose Chemical compound OC[C@H]1OC(O)[C@H](O)[C@@H]1O HMFHBZSHGGEWLO-SOOFDHNKSA-N 0.000 description 3
- KCXVZYZYPLLWCC-UHFFFAOYSA-N EDTA Chemical compound OC(=O)CN(CC(O)=O)CCN(CC(O)=O)CC(O)=O KCXVZYZYPLLWCC-UHFFFAOYSA-N 0.000 description 3
- LYCAIKOWRPUZTN-UHFFFAOYSA-N Ethylene glycol Chemical compound OCCO LYCAIKOWRPUZTN-UHFFFAOYSA-N 0.000 description 3
- 102000030914 Fatty Acid-Binding Human genes 0.000 description 3
- 102100030431 Fatty acid-binding protein, adipocyte Human genes 0.000 description 3
- 108010049003 Fibrinogen Proteins 0.000 description 3
- 102000008946 Fibrinogen Human genes 0.000 description 3
- 108090000368 Fibroblast growth factor 8 Proteins 0.000 description 3
- WSFSSNUMVMOOMR-UHFFFAOYSA-N Formaldehyde Chemical compound O=C WSFSSNUMVMOOMR-UHFFFAOYSA-N 0.000 description 3
- 102000003886 Glycoproteins Human genes 0.000 description 3
- 108090000288 Glycoproteins Proteins 0.000 description 3
- 206010018910 Haemolysis Diseases 0.000 description 3
- 241000950629 Icteria Species 0.000 description 3
- DGAQECJNVWCQMB-PUAWFVPOSA-M Ilexoside XXIX Chemical compound C[C@@H]1CC[C@@]2(CC[C@@]3(C(=CC[C@H]4[C@]3(CC[C@@H]5[C@@]4(CC[C@@H](C5(C)C)OS(=O)(=O)[O-])C)C)[C@@H]2[C@]1(C)O)C)C(=O)O[C@H]6[C@@H]([C@H]([C@@H]([C@H](O6)CO)O)O)O.[Na+] DGAQECJNVWCQMB-PUAWFVPOSA-M 0.000 description 3
- 102000004877 Insulin Human genes 0.000 description 3
- 108090001061 Insulin Proteins 0.000 description 3
- 102100037765 Periostin Human genes 0.000 description 3
- 101710199268 Periostin Proteins 0.000 description 3
- 102000004160 Phosphoric Monoester Hydrolases Human genes 0.000 description 3
- 108090000608 Phosphoric Monoester Hydrolases Proteins 0.000 description 3
- ZLMJMSJWJFRBEC-UHFFFAOYSA-N Potassium Chemical compound [K] ZLMJMSJWJFRBEC-UHFFFAOYSA-N 0.000 description 3
- 101800004937 Protein C Proteins 0.000 description 3
- 102100027378 Prothrombin Human genes 0.000 description 3
- PYMYPHUHKUWMLA-LMVFSUKVSA-N Ribose Natural products OC[C@@H](O)[C@@H](O)[C@@H](O)C=O PYMYPHUHKUWMLA-LMVFSUKVSA-N 0.000 description 3
- 102400000827 Saposin-D Human genes 0.000 description 3
- 101800001700 Saposin-D Proteins 0.000 description 3
- XSQUKJJJFZCRTK-UHFFFAOYSA-N Urea Chemical compound NC(N)=O XSQUKJJJFZCRTK-UHFFFAOYSA-N 0.000 description 3
- 102100033177 Vascular endothelial growth factor receptor 2 Human genes 0.000 description 3
- HMFHBZSHGGEWLO-UHFFFAOYSA-N alpha-D-Furanose-Ribose Natural products OCC1OC(O)C(O)C1O HMFHBZSHGGEWLO-UHFFFAOYSA-N 0.000 description 3
- QVGXLLKOCUKJST-UHFFFAOYSA-N atomic oxygen Chemical compound [O] QVGXLLKOCUKJST-UHFFFAOYSA-N 0.000 description 3
- 210000003719 b-lymphocyte Anatomy 0.000 description 3
- 230000001580 bacterial effect Effects 0.000 description 3
- 230000009286 beneficial effect Effects 0.000 description 3
- 239000012472 biological sample Substances 0.000 description 3
- 238000005415 bioluminescence Methods 0.000 description 3
- 230000029918 bioluminescence Effects 0.000 description 3
- 238000009582 blood typing Methods 0.000 description 3
- 210000000988 bone and bone Anatomy 0.000 description 3
- 239000007975 buffered saline Substances 0.000 description 3
- 238000004364 calculation method Methods 0.000 description 3
- 201000011510 cancer Diseases 0.000 description 3
- 229940095731 candida albicans Drugs 0.000 description 3
- 210000000170 cell membrane Anatomy 0.000 description 3
- 230000001413 cellular effect Effects 0.000 description 3
- 230000001427 coherent effect Effects 0.000 description 3
- 238000004737 colorimetric analysis Methods 0.000 description 3
- 238000011109 contamination Methods 0.000 description 3
- 206010012601 diabetes mellitus Diseases 0.000 description 3
- 238000010586 diagram Methods 0.000 description 3
- 239000002359 drug metabolite Substances 0.000 description 3
- 230000005670 electromagnetic radiation Effects 0.000 description 3
- 238000010828 elution Methods 0.000 description 3
- 238000007824 enzymatic assay Methods 0.000 description 3
- 210000003979 eosinophil Anatomy 0.000 description 3
- 238000001704 evaporation Methods 0.000 description 3
- 230000008020 evaporation Effects 0.000 description 3
- 230000005281 excited state Effects 0.000 description 3
- 108091022862 fatty acid binding Proteins 0.000 description 3
- 229940012952 fibrinogen Drugs 0.000 description 3
- 238000000684 flow cytometry Methods 0.000 description 3
- 239000008187 granular material Substances 0.000 description 3
- 210000002216 heart Anatomy 0.000 description 3
- 230000008588 hemolysis Effects 0.000 description 3
- 229940088597 hormone Drugs 0.000 description 3
- 239000005556 hormone Substances 0.000 description 3
- 239000000017 hydrogel Substances 0.000 description 3
- 125000002887 hydroxy group Chemical group [H]O* 0.000 description 3
- 230000000984 immunochemical effect Effects 0.000 description 3
- 230000006872 improvement Effects 0.000 description 3
- 238000010348 incorporation Methods 0.000 description 3
- 238000002347 injection Methods 0.000 description 3
- 239000007924 injection Substances 0.000 description 3
- 229940125396 insulin Drugs 0.000 description 3
- 230000010354 integration Effects 0.000 description 3
- 230000003993 interaction Effects 0.000 description 3
- 238000009830 intercalation Methods 0.000 description 3
- 238000002955 isolation Methods 0.000 description 3
- 210000004185 liver Anatomy 0.000 description 3
- 210000004698 lymphocyte Anatomy 0.000 description 3
- 229910052943 magnesium sulfate Inorganic materials 0.000 description 3
- 210000000440 neutrophil Anatomy 0.000 description 3
- 229910052760 oxygen Inorganic materials 0.000 description 3
- 239000001301 oxygen Substances 0.000 description 3
- 150000002978 peroxides Chemical class 0.000 description 3
- 239000004417 polycarbonate Substances 0.000 description 3
- 229920001184 polypeptide Polymers 0.000 description 3
- 239000011591 potassium Substances 0.000 description 3
- 229910052700 potassium Inorganic materials 0.000 description 3
- 238000001556 precipitation Methods 0.000 description 3
- 125000006239 protecting group Chemical group 0.000 description 3
- 229960000856 protein c Drugs 0.000 description 3
- 229940039716 prothrombin Drugs 0.000 description 3
- 150000003212 purines Chemical class 0.000 description 3
- 150000003230 pyrimidines Chemical class 0.000 description 3
- 230000009467 reduction Effects 0.000 description 3
- 238000004062 sedimentation Methods 0.000 description 3
- 239000011734 sodium Substances 0.000 description 3
- 229910052708 sodium Inorganic materials 0.000 description 3
- 239000011780 sodium chloride Substances 0.000 description 3
- 238000010186 staining Methods 0.000 description 3
- 238000010561 standard procedure Methods 0.000 description 3
- 150000008163 sugars Chemical class 0.000 description 3
- 230000001225 therapeutic effect Effects 0.000 description 3
- 229940113082 thymine Drugs 0.000 description 3
- 238000013519 translation Methods 0.000 description 3
- 238000001429 visible spectrum Methods 0.000 description 3
- 239000011534 wash buffer Substances 0.000 description 3
- ZYDGCYWJDWIJCS-UHFFFAOYSA-N 1-methoxyphenazine Chemical compound C1=CC=C2N=C3C(OC)=CC=CC3=NC2=C1 ZYDGCYWJDWIJCS-UHFFFAOYSA-N 0.000 description 2
- HPZMWTNATZPBIH-UHFFFAOYSA-N 1-methyladenine Chemical compound CN1C=NC2=NC=NC2=C1N HPZMWTNATZPBIH-UHFFFAOYSA-N 0.000 description 2
- RFLVMTUMFYRZCB-UHFFFAOYSA-N 1-methylguanine Chemical compound O=C1N(C)C(N)=NC2=C1N=CN2 RFLVMTUMFYRZCB-UHFFFAOYSA-N 0.000 description 2
- KGLPWQKSKUVKMJ-UHFFFAOYSA-N 2,3-dihydrophthalazine-1,4-dione Chemical class C1=CC=C2C(=O)NNC(=O)C2=C1 KGLPWQKSKUVKMJ-UHFFFAOYSA-N 0.000 description 2
- FZWGECJQACGGTI-UHFFFAOYSA-N 2-amino-7-methyl-1,7-dihydro-6H-purin-6-one Chemical compound NC1=NC(O)=C2N(C)C=NC2=N1 FZWGECJQACGGTI-UHFFFAOYSA-N 0.000 description 2
- ASJSAQIRZKANQN-CRCLSJGQSA-N 2-deoxy-D-ribose Chemical compound OC[C@@H](O)[C@@H](O)CC=O ASJSAQIRZKANQN-CRCLSJGQSA-N 0.000 description 2
- BFSVOASYOCHEOV-UHFFFAOYSA-N 2-diethylaminoethanol Chemical group CCN(CC)CCO BFSVOASYOCHEOV-UHFFFAOYSA-N 0.000 description 2
- VOUAQYXWVJDEQY-QENPJCQMSA-N 33017-11-7 Chemical compound OC(=O)CC[C@H](N)C(=O)N[C@@H](C)C(=O)N[C@@H](CCC(O)=O)C(=O)N[C@@H](CC(O)=O)C(=O)N[C@@H](CC(C)C)C(=O)N[C@@H](CCC(N)=O)C(=O)N[C@@H](C(C)C)C(=O)NCC(=O)N[C@@H](CCC(N)=O)C(=O)N[C@@H](C(C)C)C(=O)N[C@@H](CCC(O)=O)C(=O)N[C@@H](CC(C)C)C(=O)NCC(=O)NCC(=O)NCC(=O)N1CCC[C@H]1C(=O)NCC(=O)N[C@@H](C)C(=O)NCC(=O)N[C@@H](CO)C(=O)N[C@@H](CC(C)C)C(=O)N[C@@H](CCC(N)=O)C(=O)N1[C@H](C(=O)N[C@@H](CC(C)C)C(=O)N[C@@H](C)C(=O)N[C@@H](CC(C)C)C(=O)N[C@@H](CCC(O)=O)C(=O)NCC(=O)N[C@@H](CO)C(=O)N[C@@H](CC(C)C)C(=O)N[C@@H](CCC(N)=O)C(O)=O)CCC1 VOUAQYXWVJDEQY-QENPJCQMSA-N 0.000 description 2
- XZKIHKMTEMTJQX-UHFFFAOYSA-N 4-Nitrophenyl Phosphate Chemical compound OP(O)(=O)OC1=CC=C([N+]([O-])=O)C=C1 XZKIHKMTEMTJQX-UHFFFAOYSA-N 0.000 description 2
- RLFWWDJHLFCNIJ-UHFFFAOYSA-N 4-aminoantipyrine Chemical compound CN1C(C)=C(N)C(=O)N1C1=CC=CC=C1 RLFWWDJHLFCNIJ-UHFFFAOYSA-N 0.000 description 2
- OVONXEQGWXGFJD-UHFFFAOYSA-N 4-sulfanylidene-1h-pyrimidin-2-one Chemical compound SC=1C=CNC(=O)N=1 OVONXEQGWXGFJD-UHFFFAOYSA-N 0.000 description 2
- KDCGOANMDULRCW-UHFFFAOYSA-N 7H-purine Chemical compound N1=CNC2=NC=NC2=C1 KDCGOANMDULRCW-UHFFFAOYSA-N 0.000 description 2
- 229930024421 Adenine Natural products 0.000 description 2
- GFFGJBXGBJISGV-UHFFFAOYSA-N Adenine Chemical compound NC1=NC=NC2=C1N=CN2 GFFGJBXGBJISGV-UHFFFAOYSA-N 0.000 description 2
- 102000004379 Adrenomedullin Human genes 0.000 description 2
- 101800004616 Adrenomedullin Proteins 0.000 description 2
- 108010005094 Advanced Glycation End Products Proteins 0.000 description 2
- 102000054930 Agouti-Related Human genes 0.000 description 2
- 101710127426 Agouti-related protein Proteins 0.000 description 2
- NLXLAEXVIDQMFP-UHFFFAOYSA-N Ammonia chloride Chemical compound [NH4+].[Cl-] NLXLAEXVIDQMFP-UHFFFAOYSA-N 0.000 description 2
- JBRZTFJDHDCESZ-UHFFFAOYSA-N AsGa Chemical compound [As]#[Ga] JBRZTFJDHDCESZ-UHFFFAOYSA-N 0.000 description 2
- 208000023275 Autoimmune disease Diseases 0.000 description 2
- 238000012935 Averaging Methods 0.000 description 2
- 102000004506 Blood Proteins Human genes 0.000 description 2
- 108010017384 Blood Proteins Proteins 0.000 description 2
- 102400000667 Brain natriuretic peptide 32 Human genes 0.000 description 2
- 101800000407 Brain natriuretic peptide 32 Proteins 0.000 description 2
- 101800002247 Brain natriuretic peptide 45 Proteins 0.000 description 2
- 108010075254 C-Peptide Proteins 0.000 description 2
- 101100496968 Caenorhabditis elegans ctc-1 gene Proteins 0.000 description 2
- ZKQDCIXGCQPQNV-UHFFFAOYSA-N Calcium hypochlorite Chemical compound [Ca+2].Cl[O-].Cl[O-] ZKQDCIXGCQPQNV-UHFFFAOYSA-N 0.000 description 2
- CURLTUGMZLYLDI-UHFFFAOYSA-N Carbon dioxide Chemical compound O=C=O CURLTUGMZLYLDI-UHFFFAOYSA-N 0.000 description 2
- 108090000201 Carboxypeptidase B2 Proteins 0.000 description 2
- 108010022366 Carcinoembryonic Antigen Proteins 0.000 description 2
- 102100025475 Carcinoembryonic antigen-related cell adhesion molecule 5 Human genes 0.000 description 2
- VEXZGXHMUGYJMC-UHFFFAOYSA-M Chloride anion Chemical compound [Cl-] VEXZGXHMUGYJMC-UHFFFAOYSA-M 0.000 description 2
- 238000008620 Cholesterol Assay Methods 0.000 description 2
- 102100022641 Coagulation factor IX Human genes 0.000 description 2
- 102100023804 Coagulation factor VII Human genes 0.000 description 2
- 208000035473 Communicable disease Diseases 0.000 description 2
- IGXWBGJHJZYPQS-SSDOTTSWSA-N D-Luciferin Chemical compound OC(=O)[C@H]1CSC(C=2SC3=CC=C(O)C=C3N=2)=N1 IGXWBGJHJZYPQS-SSDOTTSWSA-N 0.000 description 2
- 102000053602 DNA Human genes 0.000 description 2
- 239000003298 DNA probe Substances 0.000 description 2
- 108010014303 DNA-directed DNA polymerase Proteins 0.000 description 2
- 102000016928 DNA-directed DNA polymerase Human genes 0.000 description 2
- CYCGRDQQIOGCKX-UHFFFAOYSA-N Dehydro-luciferin Natural products OC(=O)C1=CSC(C=2SC3=CC(O)=CC=C3N=2)=N1 CYCGRDQQIOGCKX-UHFFFAOYSA-N 0.000 description 2
- ZAHDXEIQWWLQQL-IHRRRGAJSA-N Deoxypyridinoline Chemical compound OC(=O)[C@@H](N)CCCC[N+]1=CC(O)=C(C[C@H](N)C([O-])=O)C(CC[C@H](N)C(O)=O)=C1 ZAHDXEIQWWLQQL-IHRRRGAJSA-N 0.000 description 2
- RTZKZFJDLAIYFH-UHFFFAOYSA-N Diethyl ether Chemical compound CCOCC RTZKZFJDLAIYFH-UHFFFAOYSA-N 0.000 description 2
- SHIBSTMRCDJXLN-UHFFFAOYSA-N Digoxigenin Natural products C1CC(C2C(C3(C)CCC(O)CC3CC2)CC2O)(O)C2(C)C1C1=CC(=O)OC1 SHIBSTMRCDJXLN-UHFFFAOYSA-N 0.000 description 2
- 241000194032 Enterococcus faecalis Species 0.000 description 2
- 241000588724 Escherichia coli Species 0.000 description 2
- 108010076282 Factor IX Proteins 0.000 description 2
- 108010014172 Factor V Proteins 0.000 description 2
- 108010023321 Factor VII Proteins 0.000 description 2
- 108010014173 Factor X Proteins 0.000 description 2
- 108010074864 Factor XI Proteins 0.000 description 2
- 108010080865 Factor XII Proteins 0.000 description 2
- 102000000429 Factor XII Human genes 0.000 description 2
- 108010071289 Factor XIII Proteins 0.000 description 2
- BJGNCJDXODQBOB-UHFFFAOYSA-N Fivefly Luciferin Natural products OC(=O)C1CSC(C=2SC3=CC(O)=CC=C3N=2)=N1 BJGNCJDXODQBOB-UHFFFAOYSA-N 0.000 description 2
- 229910001218 Gallium arsenide Inorganic materials 0.000 description 2
- 101710107035 Gamma-glutamyltranspeptidase Proteins 0.000 description 2
- 101710173228 Glutathione hydrolase proenzyme Proteins 0.000 description 2
- 108010023302 HDL Cholesterol Proteins 0.000 description 2
- 230000005355 Hall effect Effects 0.000 description 2
- 101001062864 Homo sapiens Fatty acid-binding protein, adipocyte Proteins 0.000 description 2
- 101001034652 Homo sapiens Insulin-like growth factor 1 receptor Proteins 0.000 description 2
- 101001013832 Homo sapiens Mitochondrial peptide methionine sulfoxide reductase Proteins 0.000 description 2
- 101000597785 Homo sapiens Tumor necrosis factor receptor superfamily member 6B Proteins 0.000 description 2
- 102000013463 Immunoglobulin Light Chains Human genes 0.000 description 2
- 108010065825 Immunoglobulin Light Chains Proteins 0.000 description 2
- 206010061218 Inflammation Diseases 0.000 description 2
- 102100039688 Insulin-like growth factor 1 receptor Human genes 0.000 description 2
- XEEYBQQBJWHFJM-UHFFFAOYSA-N Iron Chemical compound [Fe] XEEYBQQBJWHFJM-UHFFFAOYSA-N 0.000 description 2
- KFZMGEQAYNKOFK-UHFFFAOYSA-N Isopropanol Chemical compound CC(C)O KFZMGEQAYNKOFK-UHFFFAOYSA-N 0.000 description 2
- 241000588747 Klebsiella pneumoniae Species 0.000 description 2
- QNAYBMKLOCPYGJ-REOHCLBHSA-N L-alanine Chemical compound C[C@H](N)C(O)=O QNAYBMKLOCPYGJ-REOHCLBHSA-N 0.000 description 2
- JVTAAEKCZFNVCJ-UHFFFAOYSA-M Lactate Chemical compound CC(O)C([O-])=O JVTAAEKCZFNVCJ-UHFFFAOYSA-M 0.000 description 2
- 108010092277 Leptin Proteins 0.000 description 2
- 102000016267 Leptin Human genes 0.000 description 2
- 102100031775 Leptin receptor Human genes 0.000 description 2
- 108010028275 Leukocyte Elastase Proteins 0.000 description 2
- 108060001084 Luciferase Proteins 0.000 description 2
- 239000005089 Luciferase Substances 0.000 description 2
- DDWFXDSYGUXRAY-UHFFFAOYSA-N Luciferin Natural products CCc1c(C)c(CC2NC(=O)C(=C2C=C)C)[nH]c1Cc3[nH]c4C(=C5/NC(CC(=O)O)C(C)C5CC(=O)O)CC(=O)c4c3C DDWFXDSYGUXRAY-UHFFFAOYSA-N 0.000 description 2
- 241000124008 Mammalia Species 0.000 description 2
- RJQXTJLFIWVMTO-TYNCELHUSA-N Methicillin Chemical compound COC1=CC=CC(OC)=C1C(=O)N[C@@H]1C(=O)N2[C@@H](C(O)=O)C(C)(C)S[C@@H]21 RJQXTJLFIWVMTO-TYNCELHUSA-N 0.000 description 2
- 102100031767 Mitochondrial peptide methionine sulfoxide reductase Human genes 0.000 description 2
- 102400000569 Myeloperoxidase Human genes 0.000 description 2
- 108090000235 Myeloperoxidases Proteins 0.000 description 2
- 102100030856 Myoglobin Human genes 0.000 description 2
- 108010062374 Myoglobin Proteins 0.000 description 2
- HYVABZIGRDEKCD-UHFFFAOYSA-N N(6)-dimethylallyladenine Chemical compound CC(C)=CCNC1=NC=NC2=C1N=CN2 HYVABZIGRDEKCD-UHFFFAOYSA-N 0.000 description 2
- HRNLUBSXIHFDHP-UHFFFAOYSA-N N-(2-aminophenyl)-4-[[[4-(3-pyridinyl)-2-pyrimidinyl]amino]methyl]benzamide Chemical compound NC1=CC=CC=C1NC(=O)C(C=C1)=CC=C1CNC1=NC=CC(C=2C=NC=CC=2)=N1 HRNLUBSXIHFDHP-UHFFFAOYSA-N 0.000 description 2
- 101100221647 Neurospora crassa (strain ATCC 24698 / 74-OR23-1A / CBS 708.71 / DSM 1257 / FGSC 987) cox-1 gene Proteins 0.000 description 2
- 102100033174 Neutrophil elastase Human genes 0.000 description 2
- 102000007999 Nuclear Proteins Human genes 0.000 description 2
- 108010089610 Nuclear Proteins Proteins 0.000 description 2
- 102000004067 Osteocalcin Human genes 0.000 description 2
- 108090000573 Osteocalcin Proteins 0.000 description 2
- 102000008108 Osteoprotegerin Human genes 0.000 description 2
- 108010035042 Osteoprotegerin Proteins 0.000 description 2
- 102000004316 Oxidoreductases Human genes 0.000 description 2
- 108090000854 Oxidoreductases Proteins 0.000 description 2
- 101150062589 PTGS1 gene Proteins 0.000 description 2
- 102000008080 Pancreatitis-Associated Proteins Human genes 0.000 description 2
- 108010074467 Pancreatitis-Associated Proteins Proteins 0.000 description 2
- 108010079855 Peptide Aptamers Proteins 0.000 description 2
- 108091093037 Peptide nucleic acid Proteins 0.000 description 2
- 102000012288 Phosphopyruvate Hydratase Human genes 0.000 description 2
- 108010022181 Phosphopyruvate Hydratase Proteins 0.000 description 2
- 108010022233 Plasminogen Activator Inhibitor 1 Proteins 0.000 description 2
- 102100039418 Plasminogen activator inhibitor 1 Human genes 0.000 description 2
- 102000018967 Platelet-Derived Growth Factor beta Receptor Human genes 0.000 description 2
- 108010051742 Platelet-Derived Growth Factor beta Receptor Proteins 0.000 description 2
- 102100039277 Pleiotrophin Human genes 0.000 description 2
- 241000276498 Pollachius virens Species 0.000 description 2
- 108010050808 Procollagen Proteins 0.000 description 2
- RJKFOVLPORLFTN-LEKSSAKUSA-N Progesterone Chemical compound C1CC2=CC(=O)CC[C@]2(C)[C@@H]2[C@@H]1[C@@H]1CC[C@H](C(=O)C)[C@@]1(C)CC2 RJKFOVLPORLFTN-LEKSSAKUSA-N 0.000 description 2
- 102000016971 Proto-Oncogene Proteins c-kit Human genes 0.000 description 2
- 108010014608 Proto-Oncogene Proteins c-kit Proteins 0.000 description 2
- 241000589517 Pseudomonas aeruginosa Species 0.000 description 2
- 108010007127 Pulmonary Surfactant-Associated Protein D Proteins 0.000 description 2
- 102100027845 Pulmonary surfactant-associated protein D Human genes 0.000 description 2
- CZPWVGJYEJSRLH-UHFFFAOYSA-N Pyrimidine Chemical compound C1=CN=CN=C1 CZPWVGJYEJSRLH-UHFFFAOYSA-N 0.000 description 2
- 102000013674 S-100 Human genes 0.000 description 2
- 108700021018 S100 Proteins 0.000 description 2
- 206010040047 Sepsis Diseases 0.000 description 2
- DBMJMQXJHONAFJ-UHFFFAOYSA-M Sodium laurylsulphate Chemical compound [Na+].CCCCCCCCCCCCOS([O-])(=O)=O DBMJMQXJHONAFJ-UHFFFAOYSA-M 0.000 description 2
- 241000191967 Staphylococcus aureus Species 0.000 description 2
- 241000194017 Streptococcus Species 0.000 description 2
- 241000193998 Streptococcus pneumoniae Species 0.000 description 2
- 108010000499 Thromboplastin Proteins 0.000 description 2
- 102000002262 Thromboplastin Human genes 0.000 description 2
- 239000007983 Tris buffer Substances 0.000 description 2
- 102000004987 Troponin T Human genes 0.000 description 2
- 108090001108 Troponin T Proteins 0.000 description 2
- 102100035284 Tumor necrosis factor receptor superfamily member 6B Human genes 0.000 description 2
- ISAKRJDGNUQOIC-UHFFFAOYSA-N Uracil Chemical compound O=C1C=CNC(=O)N1 ISAKRJDGNUQOIC-UHFFFAOYSA-N 0.000 description 2
- DRTQHJPVMGBUCF-XVFCMESISA-N Uridine Chemical compound O[C@@H]1[C@H](O)[C@@H](CO)O[C@H]1N1C(=O)NC(=O)C=C1 DRTQHJPVMGBUCF-XVFCMESISA-N 0.000 description 2
- 108010053099 Vascular Endothelial Growth Factor Receptor-2 Proteins 0.000 description 2
- 238000010817 Wright-Giemsa staining Methods 0.000 description 2
- 238000011481 absorbance measurement Methods 0.000 description 2
- 239000002250 absorbent Substances 0.000 description 2
- 230000002745 absorbent Effects 0.000 description 2
- DZBUGLKDJFMEHC-UHFFFAOYSA-N acridine Chemical class C1=CC=CC2=CC3=CC=CC=C3N=C21 DZBUGLKDJFMEHC-UHFFFAOYSA-N 0.000 description 2
- 239000004676 acrylonitrile butadiene styrene Substances 0.000 description 2
- 230000004913 activation Effects 0.000 description 2
- 229960000643 adenine Drugs 0.000 description 2
- 239000000853 adhesive Substances 0.000 description 2
- 230000001070 adhesive effect Effects 0.000 description 2
- 238000007818 agglutination assay Methods 0.000 description 2
- 235000004279 alanine Nutrition 0.000 description 2
- 150000001408 amides Chemical class 0.000 description 2
- YZVWKHVRBDQPMQ-UHFFFAOYSA-N aminoantipyrene Natural products C1=C2C(N)=CC=C(C=C3)C2=C2C3=CC=CC2=C1 YZVWKHVRBDQPMQ-UHFFFAOYSA-N 0.000 description 2
- 230000000712 assembly Effects 0.000 description 2
- 238000000429 assembly Methods 0.000 description 2
- 210000003651 basophil Anatomy 0.000 description 2
- 102000005936 beta-Galactosidase Human genes 0.000 description 2
- 108010005774 beta-Galactosidase Proteins 0.000 description 2
- 230000008033 biological extinction Effects 0.000 description 2
- 230000000903 blocking effect Effects 0.000 description 2
- 210000004556 brain Anatomy 0.000 description 2
- 229910002092 carbon dioxide Inorganic materials 0.000 description 2
- 239000002771 cell marker Substances 0.000 description 2
- 210000003850 cellular structure Anatomy 0.000 description 2
- 238000000701 chemical imaging Methods 0.000 description 2
- 238000004587 chromatography analysis Methods 0.000 description 2
- 238000010668 complexation reaction Methods 0.000 description 2
- 239000002131 composite material Substances 0.000 description 2
- 238000007906 compression Methods 0.000 description 2
- 230000006835 compression Effects 0.000 description 2
- 230000001276 controlling effect Effects 0.000 description 2
- CVSVTCORWBXHQV-UHFFFAOYSA-N creatine Chemical compound NC(=[NH2+])N(C)CC([O-])=O CVSVTCORWBXHQV-UHFFFAOYSA-N 0.000 description 2
- 229940109239 creatinine Drugs 0.000 description 2
- 238000004132 cross linking Methods 0.000 description 2
- 229940104302 cytosine Drugs 0.000 description 2
- 230000006378 damage Effects 0.000 description 2
- 230000008021 deposition Effects 0.000 description 2
- 239000003599 detergent Substances 0.000 description 2
- 238000011161 development Methods 0.000 description 2
- 230000018109 developmental process Effects 0.000 description 2
- 229960000633 dextran sulfate Drugs 0.000 description 2
- QONQRTHLHBTMGP-UHFFFAOYSA-N digitoxigenin Natural products CC12CCC(C3(CCC(O)CC3CC3)C)C3C11OC1CC2C1=CC(=O)OC1 QONQRTHLHBTMGP-UHFFFAOYSA-N 0.000 description 2
- SHIBSTMRCDJXLN-KCZCNTNESA-N digoxigenin Chemical compound C1([C@@H]2[C@@]3([C@@](CC2)(O)[C@H]2[C@@H]([C@@]4(C)CC[C@H](O)C[C@H]4CC2)C[C@H]3O)C)=CC(=O)OC1 SHIBSTMRCDJXLN-KCZCNTNESA-N 0.000 description 2
- 125000002147 dimethylamino group Chemical group [H]C([H])([H])N(*)C([H])([H])[H] 0.000 description 2
- 208000035475 disorder Diseases 0.000 description 2
- 238000005315 distribution function Methods 0.000 description 2
- 238000002651 drug therapy Methods 0.000 description 2
- 230000005684 electric field Effects 0.000 description 2
- 238000005401 electroluminescence Methods 0.000 description 2
- 229940032049 enterococcus faecalis Drugs 0.000 description 2
- 230000002255 enzymatic effect Effects 0.000 description 2
- GNBHRKFJIUUOQI-UHFFFAOYSA-N fluorescein Chemical compound O1C(=O)C2=CC=CC=C2C21C1=CC=C(O)C=C1OC1=CC(O)=CC=C21 GNBHRKFJIUUOQI-UHFFFAOYSA-N 0.000 description 2
- MHMNJMPURVTYEJ-UHFFFAOYSA-N fluorescein-5-isothiocyanate Chemical compound O1C(=O)C2=CC(N=C=S)=CC=C2C21C1=CC=C(O)C=C1OC1=CC(O)=CC=C21 MHMNJMPURVTYEJ-UHFFFAOYSA-N 0.000 description 2
- 239000012634 fragment Substances 0.000 description 2
- 238000004108 freeze drying Methods 0.000 description 2
- 125000000524 functional group Chemical group 0.000 description 2
- 102000006640 gamma-Glutamyltransferase Human genes 0.000 description 2
- 229910052732 germanium Inorganic materials 0.000 description 2
- RWSXRVCMGQZWBV-WDSKDSINSA-N glutathione Chemical compound OC(=O)[C@@H](N)CCC(=O)N[C@@H](CS)C(=O)NCC(O)=O RWSXRVCMGQZWBV-WDSKDSINSA-N 0.000 description 2
- KWIUHFFTVRNATP-UHFFFAOYSA-N glycine betaine Chemical compound C[N+](C)(C)CC([O-])=O KWIUHFFTVRNATP-UHFFFAOYSA-N 0.000 description 2
- PCHJSUWPFVWCPO-UHFFFAOYSA-N gold Chemical compound [Au] PCHJSUWPFVWCPO-UHFFFAOYSA-N 0.000 description 2
- 210000003714 granulocyte Anatomy 0.000 description 2
- 230000035931 haemagglutination Effects 0.000 description 2
- 238000010211 hemagglutination inhibition (HI) assay Methods 0.000 description 2
- JYGXADMDTFJGBT-VWUMJDOOSA-N hydrocortisone Chemical compound O=C1CC[C@]2(C)[C@H]3[C@@H](O)C[C@](C)([C@@](CC4)(O)C(=O)CO)[C@@H]4[C@@H]3CCC2=C1 JYGXADMDTFJGBT-VWUMJDOOSA-N 0.000 description 2
- 230000002209 hydrophobic effect Effects 0.000 description 2
- 230000009474 immediate action Effects 0.000 description 2
- 230000002779 inactivation Effects 0.000 description 2
- 230000004054 inflammatory process Effects 0.000 description 2
- 238000007689 inspection Methods 0.000 description 2
- 239000000543 intermediate Substances 0.000 description 2
- 108010023015 ischemia-modified albumin Proteins 0.000 description 2
- 210000003734 kidney Anatomy 0.000 description 2
- 229940039781 leptin Drugs 0.000 description 2
- NRYBAZVQPHGZNS-ZSOCWYAHSA-N leptin Chemical compound O=C([C@H](CO)NC(=O)[C@H](CC(C)C)NC(=O)[C@H](CC(O)=O)NC(=O)[C@H](CC(C)C)NC(=O)[C@H](CCC(N)=O)NC(=O)[C@H](CC=1C2=CC=CC=C2NC=1)NC(=O)[C@H](CC(C)C)NC(=O)[C@@H](NC(=O)[C@H](CC(O)=O)NC(=O)[C@H](CCC(N)=O)NC(=O)[C@H](CC(C)C)NC(=O)[C@H](CO)NC(=O)CNC(=O)[C@H](CCC(N)=O)NC(=O)[C@@H](N)CC(C)C)CCSC)N1CCC[C@H]1C(=O)NCC(=O)N[C@@H](CS)C(O)=O NRYBAZVQPHGZNS-ZSOCWYAHSA-N 0.000 description 2
- 108010019813 leptin receptors Proteins 0.000 description 2
- 230000001000 lipidemic effect Effects 0.000 description 2
- 239000007791 liquid phase Substances 0.000 description 2
- 238000003754 machining Methods 0.000 description 2
- 235000019341 magnesium sulphate Nutrition 0.000 description 2
- 239000006249 magnetic particle Substances 0.000 description 2
- 238000007885 magnetic separation Methods 0.000 description 2
- 229910052751 metal Inorganic materials 0.000 description 2
- 239000002184 metal Substances 0.000 description 2
- 229960003085 meticillin Drugs 0.000 description 2
- 244000005700 microbiome Species 0.000 description 2
- 239000002991 molded plastic Substances 0.000 description 2
- 210000003205 muscle Anatomy 0.000 description 2
- 210000001167 myeloblast Anatomy 0.000 description 2
- 108010065887 myosin light chain I Proteins 0.000 description 2
- 239000002105 nanoparticle Substances 0.000 description 2
- HPNRHPKXQZSDFX-OAQDCNSJSA-N nesiritide Chemical compound C([C@H]1C(=O)NCC(=O)N[C@@H](CCCNC(N)=N)C(=O)N[C@@H](CCCCN)C(=O)N[C@@H](CCSC)C(=O)N[C@@H](CC(O)=O)C(=O)N[C@@H](CCCNC(N)=N)C(=O)N[C@H](C(N[C@@H](CO)C(=O)N[C@@H](CO)C(=O)N[C@@H](CO)C(=O)N[C@@H](CO)C(=O)NCC(=O)N[C@@H](CC(C)C)C(=O)NCC(=O)N[C@@H](CSSC[C@@H](C(=O)N1)NC(=O)CNC(=O)[C@H](CO)NC(=O)CNC(=O)[C@H](CCC(N)=O)NC(=O)[C@@H](NC(=O)[C@H](CCSC)NC(=O)[C@H](CCCCN)NC(=O)[C@H]1N(CCC1)C(=O)[C@@H](N)CO)C(C)C)C(=O)N[C@@H](CCCCN)C(=O)N[C@@H](C(C)C)C(=O)N[C@@H](CC(C)C)C(=O)N[C@@H](CCCNC(N)=N)C(=O)N[C@@H](CCCNC(N)=N)C(=O)N[C@@H](CC=1N=CNC=1)C(O)=O)=O)[C@@H](C)CC)C1=CC=CC=C1 HPNRHPKXQZSDFX-OAQDCNSJSA-N 0.000 description 2
- 208000015122 neurodegenerative disease Diseases 0.000 description 2
- 238000007826 nucleic acid assay Methods 0.000 description 2
- XXUPLYBCNPLTIW-UHFFFAOYSA-N octadec-7-ynoic acid Chemical compound CCCCCCCCCCC#CCCCCCC(O)=O XXUPLYBCNPLTIW-UHFFFAOYSA-N 0.000 description 2
- 150000002894 organic compounds Chemical class 0.000 description 2
- 238000012946 outsourcing Methods 0.000 description 2
- 150000003891 oxalate salts Chemical class 0.000 description 2
- 125000003431 oxalo group Chemical group 0.000 description 2
- 125000000636 p-nitrophenyl group Chemical group [H]C1=C([H])C(=C([H])C([H])=C1*)[N+]([O-])=O 0.000 description 2
- 244000052769 pathogen Species 0.000 description 2
- 239000008177 pharmaceutical agent Substances 0.000 description 2
- 239000006187 pill Substances 0.000 description 2
- 229920000515 polycarbonate Polymers 0.000 description 2
- 102000040430 polynucleotide Human genes 0.000 description 2
- 108091033319 polynucleotide Proteins 0.000 description 2
- 239000002157 polynucleotide Substances 0.000 description 2
- 238000012805 post-processing Methods 0.000 description 2
- 239000001103 potassium chloride Substances 0.000 description 2
- 235000011164 potassium chloride Nutrition 0.000 description 2
- 229910001414 potassium ion Inorganic materials 0.000 description 2
- 238000004321 preservation Methods 0.000 description 2
- 238000003825 pressing Methods 0.000 description 2
- 229940002612 prodrug Drugs 0.000 description 2
- 239000000651 prodrug Substances 0.000 description 2
- 238000000746 purification Methods 0.000 description 2
- 239000010453 quartz Substances 0.000 description 2
- 230000035484 reaction time Effects 0.000 description 2
- 230000000717 retained effect Effects 0.000 description 2
- 238000012216 screening Methods 0.000 description 2
- 238000010845 search algorithm Methods 0.000 description 2
- 229940076279 serotonin Drugs 0.000 description 2
- 238000007493 shaping process Methods 0.000 description 2
- 229910052710 silicon Inorganic materials 0.000 description 2
- 239000000377 silicon dioxide Substances 0.000 description 2
- 230000009870 specific binding Effects 0.000 description 2
- 238000004611 spectroscopical analysis Methods 0.000 description 2
- 229940031000 streptococcus pneumoniae Drugs 0.000 description 2
- 238000006467 substitution reaction Methods 0.000 description 2
- 230000008685 targeting Effects 0.000 description 2
- 125000003831 tetrazolyl group Chemical group 0.000 description 2
- 229960000278 theophylline Drugs 0.000 description 2
- UMGDCJDMYOKAJW-UHFFFAOYSA-N thiourea Chemical compound NC(N)=S UMGDCJDMYOKAJW-UHFFFAOYSA-N 0.000 description 2
- 239000012780 transparent material Substances 0.000 description 2
- 150000003626 triacylglycerols Chemical class 0.000 description 2
- LENZDBCJOHFCAS-UHFFFAOYSA-N tris Chemical compound OCC(N)(CO)CO LENZDBCJOHFCAS-UHFFFAOYSA-N 0.000 description 2
- 239000003656 tris buffered saline Substances 0.000 description 2
- 238000007817 turbidimetric assay Methods 0.000 description 2
- 238000002604 ultrasonography Methods 0.000 description 2
- 239000013026 undiluted sample Substances 0.000 description 2
- 238000010200 validation analysis Methods 0.000 description 2
- 230000000007 visual effect Effects 0.000 description 2
- URJOZSLMTIRWFW-QGZVFWFLSA-N (4r)-4-(1,3-benzodioxol-5-yl)-5,6-dimethoxy-4,9-dihydro-1h-benzo[f][2]benzofuran-3-one Chemical compound C1=C2OCOC2=CC([C@H]2C3=C(COC3=O)CC3=CC=C(C(=C32)OC)OC)=C1 URJOZSLMTIRWFW-QGZVFWFLSA-N 0.000 description 1
- BQCIDUSAKPWEOX-UHFFFAOYSA-N 1,1-Difluoroethene Chemical compound FC(F)=C BQCIDUSAKPWEOX-UHFFFAOYSA-N 0.000 description 1
- GEYOCULIXLDCMW-UHFFFAOYSA-N 1,2-phenylenediamine Chemical compound NC1=CC=CC=C1N GEYOCULIXLDCMW-UHFFFAOYSA-N 0.000 description 1
- MPCAJMNYNOGXPB-SLPGGIOYSA-N 1,5-anhydro-D-glucitol Chemical compound OC[C@H]1OC[C@H](O)[C@@H](O)[C@@H]1O MPCAJMNYNOGXPB-SLPGGIOYSA-N 0.000 description 1
- SATCOUWSAZBIJO-UHFFFAOYSA-N 1-methyladenine Natural products N=C1N(C)C=NC2=C1NC=N2 SATCOUWSAZBIJO-UHFFFAOYSA-N 0.000 description 1
- WJNGQIYEQLPJMN-IOSLPCCCSA-N 1-methylinosine Chemical compound C1=NC=2C(=O)N(C)C=NC=2N1[C@@H]1O[C@H](CO)[C@@H](O)[C@H]1O WJNGQIYEQLPJMN-IOSLPCCCSA-N 0.000 description 1
- YSAJFXWTVFGPAX-UHFFFAOYSA-N 2-[(2,4-dioxo-1h-pyrimidin-5-yl)oxy]acetic acid Chemical compound OC(=O)COC1=CNC(=O)NC1=O YSAJFXWTVFGPAX-UHFFFAOYSA-N 0.000 description 1
- SVBOROZXXYRWJL-UHFFFAOYSA-N 2-[(4-oxo-2-sulfanylidene-1h-pyrimidin-5-yl)methylamino]acetic acid Chemical compound OC(=O)CNCC1=CNC(=S)NC1=O SVBOROZXXYRWJL-UHFFFAOYSA-N 0.000 description 1
- JKMHFZQWWAIEOD-UHFFFAOYSA-N 2-[4-(2-hydroxyethyl)piperazin-1-yl]ethanesulfonic acid Chemical compound OCC[NH+]1CCN(CCS([O-])(=O)=O)CC1 JKMHFZQWWAIEOD-UHFFFAOYSA-N 0.000 description 1
- LLWPKTDSDUQBFY-UHFFFAOYSA-N 2-[6-(aminomethyl)-2,4-dioxo-1H-pyrimidin-5-yl]acetic acid Chemical compound C(=O)(O)CC=1C(NC(NC=1CN)=O)=O LLWPKTDSDUQBFY-UHFFFAOYSA-N 0.000 description 1
- XMSMHKMPBNTBOD-UHFFFAOYSA-N 2-dimethylamino-6-hydroxypurine Chemical compound N1C(N(C)C)=NC(=O)C2=C1N=CN2 XMSMHKMPBNTBOD-UHFFFAOYSA-N 0.000 description 1
- SMADWRYCYBUIKH-UHFFFAOYSA-N 2-methyl-7h-purin-6-amine Chemical compound CC1=NC(N)=C2NC=NC2=N1 SMADWRYCYBUIKH-UHFFFAOYSA-N 0.000 description 1
- IQUPABOKLQSFBK-UHFFFAOYSA-N 2-nitrophenol Chemical compound OC1=CC=CC=C1[N+]([O-])=O IQUPABOKLQSFBK-UHFFFAOYSA-N 0.000 description 1
- CPBJMKMKNCRKQB-UHFFFAOYSA-N 3,3-bis(4-hydroxy-3-methylphenyl)-2-benzofuran-1-one Chemical compound C1=C(O)C(C)=CC(C2(C3=CC=CC=C3C(=O)O2)C=2C=C(C)C(O)=CC=2)=C1 CPBJMKMKNCRKQB-UHFFFAOYSA-N 0.000 description 1
- BTIDJAQNJLWPTI-UHFFFAOYSA-N 3-(n-ethyl-3,5-dimethoxyanilino)-2-hydroxypropane-1-sulfonic acid Chemical compound OS(=O)(=O)CC(O)CN(CC)C1=CC(OC)=CC(OC)=C1 BTIDJAQNJLWPTI-UHFFFAOYSA-N 0.000 description 1
- HXITYOAFXWBMLL-UHFFFAOYSA-N 3-(n-ethylanilino)propane-1-sulfonic acid Chemical compound OS(=O)(=O)CCCN(CC)C1=CC=CC=C1 HXITYOAFXWBMLL-UHFFFAOYSA-N 0.000 description 1
- KIWODJBCHRADND-UHFFFAOYSA-N 3-anilino-4-[1-[3-(1-imidazolyl)propyl]-3-indolyl]pyrrole-2,5-dione Chemical compound O=C1NC(=O)C(C=2C3=CC=CC=C3N(CCCN3C=NC=C3)C=2)=C1NC1=CC=CC=C1 KIWODJBCHRADND-UHFFFAOYSA-N 0.000 description 1
- KOLPWZCZXAMXKS-UHFFFAOYSA-N 3-methylcytosine Chemical compound CN1C(N)=CC=NC1=O KOLPWZCZXAMXKS-UHFFFAOYSA-N 0.000 description 1
- GJAKJCICANKRFD-UHFFFAOYSA-N 4-acetyl-4-amino-1,3-dihydropyrimidin-2-one Chemical compound CC(=O)C1(N)NC(=O)NC=C1 GJAKJCICANKRFD-UHFFFAOYSA-N 0.000 description 1
- BTJIUGUIPKRLHP-UHFFFAOYSA-N 4-nitrophenol Chemical compound OC1=CC=C([N+]([O-])=O)C=C1 BTJIUGUIPKRLHP-UHFFFAOYSA-N 0.000 description 1
- MQJSSLBGAQJNER-UHFFFAOYSA-N 5-(methylaminomethyl)-1h-pyrimidine-2,4-dione Chemical compound CNCC1=CNC(=O)NC1=O MQJSSLBGAQJNER-UHFFFAOYSA-N 0.000 description 1
- WPYRHVXCOQLYLY-UHFFFAOYSA-N 5-[(methoxyamino)methyl]-2-sulfanylidene-1h-pyrimidin-4-one Chemical compound CONCC1=CNC(=S)NC1=O WPYRHVXCOQLYLY-UHFFFAOYSA-N 0.000 description 1
- LQLQRFGHAALLLE-UHFFFAOYSA-N 5-bromouracil Chemical compound BrC1=CNC(=O)NC1=O LQLQRFGHAALLLE-UHFFFAOYSA-N 0.000 description 1
- 102000040125 5-hydroxytryptamine receptor family Human genes 0.000 description 1
- 108091032151 5-hydroxytryptamine receptor family Proteins 0.000 description 1
- KELXHQACBIUYSE-UHFFFAOYSA-N 5-methoxy-1h-pyrimidine-2,4-dione Chemical compound COC1=CNC(=O)NC1=O KELXHQACBIUYSE-UHFFFAOYSA-N 0.000 description 1
- ZLAQATDNGLKIEV-UHFFFAOYSA-N 5-methyl-2-sulfanylidene-1h-pyrimidin-4-one Chemical compound CC1=CNC(=S)NC1=O ZLAQATDNGLKIEV-UHFFFAOYSA-N 0.000 description 1
- LRSASMSXMSNRBT-UHFFFAOYSA-N 5-methylcytosine Chemical compound CC1=CNC(=O)N=C1N LRSASMSXMSNRBT-UHFFFAOYSA-N 0.000 description 1
- RXGJTUSBYWCRBK-UHFFFAOYSA-M 5-methylphenazinium methyl sulfate Chemical compound COS([O-])(=O)=O.C1=CC=C2[N+](C)=C(C=CC=C3)C3=NC2=C1 RXGJTUSBYWCRBK-UHFFFAOYSA-M 0.000 description 1
- NIOWRPKKLZMTPC-UHFFFAOYSA-N 5-pent-1-ynyl-1h-pyrimidine-2,4-dione Chemical compound CCCC#CC1=CNC(=O)NC1=O NIOWRPKKLZMTPC-UHFFFAOYSA-N 0.000 description 1
- HSPHKCOAUOJLIO-UHFFFAOYSA-N 6-(aziridin-1-ylamino)-1h-pyrimidin-2-one Chemical compound N1C(=O)N=CC=C1NN1CC1 HSPHKCOAUOJLIO-UHFFFAOYSA-N 0.000 description 1
- DCPSTSVLRXOYGS-UHFFFAOYSA-N 6-amino-1h-pyrimidine-2-thione Chemical compound NC1=CC=NC(S)=N1 DCPSTSVLRXOYGS-UHFFFAOYSA-N 0.000 description 1
- CKOMXBHMKXXTNW-UHFFFAOYSA-N 6-methyladenine Chemical compound CNC1=NC=NC2=C1N=CN2 CKOMXBHMKXXTNW-UHFFFAOYSA-N 0.000 description 1
- CJIJXIFQYOPWTF-UHFFFAOYSA-N 7-hydroxycoumarin Natural products O1C(=O)C=CC2=CC(O)=CC=C21 CJIJXIFQYOPWTF-UHFFFAOYSA-N 0.000 description 1
- MSSXOMSJDRHRMC-UHFFFAOYSA-N 9H-purine-2,6-diamine Chemical compound NC1=NC(N)=C2NC=NC2=N1 MSSXOMSJDRHRMC-UHFFFAOYSA-N 0.000 description 1
- 101150054149 ANGPTL4 gene Proteins 0.000 description 1
- 208000035657 Abasia Diseases 0.000 description 1
- 108010042708 Acetylmuramyl-Alanyl-Isoglutamine Proteins 0.000 description 1
- 102100031786 Adiponectin Human genes 0.000 description 1
- 108010076365 Adiponectin Proteins 0.000 description 1
- 101710186708 Agglutinin Proteins 0.000 description 1
- 239000012117 Alexa Fluor 700 Substances 0.000 description 1
- 239000012099 Alexa Fluor family Substances 0.000 description 1
- 208000024827 Alzheimer disease Diseases 0.000 description 1
- 102000004400 Aminopeptidases Human genes 0.000 description 1
- 108090000915 Aminopeptidases Proteins 0.000 description 1
- 239000004382 Amylase Substances 0.000 description 1
- 102000013142 Amylases Human genes 0.000 description 1
- 108010065511 Amylases Proteins 0.000 description 1
- 108700042530 Angiopoietin-Like Protein 4 Proteins 0.000 description 1
- 102100025668 Angiopoietin-related protein 3 Human genes 0.000 description 1
- 101710085845 Angiopoietin-related protein 4 Proteins 0.000 description 1
- 102400000068 Angiostatin Human genes 0.000 description 1
- 108010079709 Angiostatins Proteins 0.000 description 1
- 108010064733 Angiotensins Proteins 0.000 description 1
- 102000015427 Angiotensins Human genes 0.000 description 1
- 102100029470 Apolipoprotein E Human genes 0.000 description 1
- 108010071619 Apolipoproteins Proteins 0.000 description 1
- 102000007592 Apolipoproteins Human genes 0.000 description 1
- 102000018616 Apolipoproteins B Human genes 0.000 description 1
- 108010027006 Apolipoproteins B Proteins 0.000 description 1
- 102000013933 Apolipoproteins D Human genes 0.000 description 1
- 108010025614 Apolipoproteins D Proteins 0.000 description 1
- 108010025628 Apolipoproteins E Proteins 0.000 description 1
- 102100021723 Arginase-1 Human genes 0.000 description 1
- 101710129000 Arginase-1 Proteins 0.000 description 1
- 101710142885 Arginine N-succinyltransferase Proteins 0.000 description 1
- 206010003805 Autism Diseases 0.000 description 1
- 208000020706 Autistic disease Diseases 0.000 description 1
- 102100022005 B-lymphocyte antigen CD20 Human genes 0.000 description 1
- 101100445061 Bacillus sp. (strain YaB) ale gene Proteins 0.000 description 1
- 208000031729 Bacteremia Diseases 0.000 description 1
- 241000894006 Bacteria Species 0.000 description 1
- 108091003079 Bovine Serum Albumin Proteins 0.000 description 1
- 230000005653 Brownian motion process Effects 0.000 description 1
- 229940124638 COX inhibitor Drugs 0.000 description 1
- 101150071146 COX2 gene Proteins 0.000 description 1
- 101000715943 Caenorhabditis elegans Cyclin-dependent kinase 4 homolog Proteins 0.000 description 1
- 101100114534 Caenorhabditis elegans ctc-2 gene Proteins 0.000 description 1
- 101100314454 Caenorhabditis elegans tra-1 gene Proteins 0.000 description 1
- 241000283707 Capra Species 0.000 description 1
- 101710167800 Capsid assembly scaffolding protein Proteins 0.000 description 1
- 101710205625 Capsid protein p24 Proteins 0.000 description 1
- KXDHJXZQYSOELW-UHFFFAOYSA-M Carbamate Chemical compound NC([O-])=O KXDHJXZQYSOELW-UHFFFAOYSA-M 0.000 description 1
- 102000003847 Carboxypeptidase B2 Human genes 0.000 description 1
- 102100028892 Cardiotrophin-1 Human genes 0.000 description 1
- 208000024172 Cardiovascular disease Diseases 0.000 description 1
- 102000004171 Cathepsin K Human genes 0.000 description 1
- 108090000625 Cathepsin K Proteins 0.000 description 1
- 108010067225 Cell Adhesion Molecules Proteins 0.000 description 1
- 102000016289 Cell Adhesion Molecules Human genes 0.000 description 1
- 108010075016 Ceruloplasmin Proteins 0.000 description 1
- 102100023321 Ceruloplasmin Human genes 0.000 description 1
- 241000606069 Chlamydiaceae Species 0.000 description 1
- 108010089254 Cholesterol oxidase Proteins 0.000 description 1
- 102000011022 Chorionic Gonadotropin Human genes 0.000 description 1
- 108010062540 Chorionic Gonadotropin Proteins 0.000 description 1
- 108010038447 Chromogranin A Proteins 0.000 description 1
- 102000010792 Chromogranin A Human genes 0.000 description 1
- 241000588919 Citrobacter freundii Species 0.000 description 1
- 102100029117 Coagulation factor X Human genes 0.000 description 1
- 102100030563 Coagulation factor XI Human genes 0.000 description 1
- 206010053567 Coagulopathies Diseases 0.000 description 1
- 108010035532 Collagen Proteins 0.000 description 1
- 102000008186 Collagen Human genes 0.000 description 1
- 108010022452 Collagen Type I Proteins 0.000 description 1
- 102000012422 Collagen Type I Human genes 0.000 description 1
- 108091035707 Consensus sequence Proteins 0.000 description 1
- RYGMFSIKBFXOCR-UHFFFAOYSA-N Copper Chemical compound [Cu] RYGMFSIKBFXOCR-UHFFFAOYSA-N 0.000 description 1
- 108010061642 Cystatin C Proteins 0.000 description 1
- 102000012192 Cystatin C Human genes 0.000 description 1
- 239000003154 D dimer Substances 0.000 description 1
- XUIIKFGFIJCVMT-GFCCVEGCSA-N D-thyroxine Chemical compound IC1=CC(C[C@@H](N)C(O)=O)=CC(I)=C1OC1=CC(I)=C(O)C(I)=C1 XUIIKFGFIJCVMT-GFCCVEGCSA-N 0.000 description 1
- 108020003215 DNA Probes Proteins 0.000 description 1
- 238000007400 DNA extraction Methods 0.000 description 1
- 101100481408 Danio rerio tie2 gene Proteins 0.000 description 1
- 238000005698 Diels-Alder reaction Methods 0.000 description 1
- 206010061818 Disease progression Diseases 0.000 description 1
- 102000015554 Dopamine receptor Human genes 0.000 description 1
- 108050004812 Dopamine receptor Proteins 0.000 description 1
- 101100284769 Drosophila melanogaster hemo gene Proteins 0.000 description 1
- 102000001301 EGF receptor Human genes 0.000 description 1
- 108060006698 EGF receptor Proteins 0.000 description 1
- 241000196324 Embryophyta Species 0.000 description 1
- 208000017701 Endocrine disease Diseases 0.000 description 1
- 108010067770 Endopeptidase K Proteins 0.000 description 1
- 102400001047 Endostatin Human genes 0.000 description 1
- 108010079505 Endostatins Proteins 0.000 description 1
- 241000194033 Enterococcus Species 0.000 description 1
- 241000194031 Enterococcus faecium Species 0.000 description 1
- 102400001368 Epidermal growth factor Human genes 0.000 description 1
- 101800003838 Epidermal growth factor Proteins 0.000 description 1
- 102000018651 Epithelial Cell Adhesion Molecule Human genes 0.000 description 1
- 108010066687 Epithelial Cell Adhesion Molecule Proteins 0.000 description 1
- 108091008794 FGF receptors Proteins 0.000 description 1
- 108010054218 Factor VIII Proteins 0.000 description 1
- 102000001690 Factor VIII Human genes 0.000 description 1
- 102100030421 Fatty acid-binding protein 5 Human genes 0.000 description 1
- 102100032596 Fibrocystin Human genes 0.000 description 1
- 101710182545 Fibrocystin Proteins 0.000 description 1
- 238000012413 Fluorescence activated cell sorting analysis Methods 0.000 description 1
- GHASVSINZRGABV-UHFFFAOYSA-N Fluorouracil Chemical compound FC1=CNC(=O)NC1=O GHASVSINZRGABV-UHFFFAOYSA-N 0.000 description 1
- 206010017533 Fungal infection Diseases 0.000 description 1
- 241000233866 Fungi Species 0.000 description 1
- 102000003688 G-Protein-Coupled Receptors Human genes 0.000 description 1
- 108090000045 G-Protein-Coupled Receptors Proteins 0.000 description 1
- 229910005540 GaP Inorganic materials 0.000 description 1
- 108010004460 Gastric Inhibitory Polypeptide Proteins 0.000 description 1
- 102100039994 Gastric inhibitory polypeptide Human genes 0.000 description 1
- 241000237858 Gastropoda Species 0.000 description 1
- 206010056740 Genital discharge Diseases 0.000 description 1
- 101800001586 Ghrelin Proteins 0.000 description 1
- 102400000442 Ghrelin-28 Human genes 0.000 description 1
- 102100039289 Glial fibrillary acidic protein Human genes 0.000 description 1
- 101710193519 Glial fibrillary acidic protein Proteins 0.000 description 1
- 102400000320 Glicentin Human genes 0.000 description 1
- 101800002945 Glicentin Proteins 0.000 description 1
- 102000006395 Globulins Human genes 0.000 description 1
- 108010044091 Globulins Proteins 0.000 description 1
- 102400000321 Glucagon Human genes 0.000 description 1
- 108060003199 Glucagon Proteins 0.000 description 1
- 102400000322 Glucagon-like peptide 1 Human genes 0.000 description 1
- DTHNMHAUYICORS-KTKZVXAJSA-N Glucagon-like peptide 1 Chemical compound C([C@@H](C(=O)N[C@@H]([C@@H](C)CC)C(=O)N[C@@H](C)C(=O)N[C@@H](CC=1C2=CC=CC=C2NC=1)C(=O)N[C@@H](CC(C)C)C(=O)N[C@@H](C(C)C)C(=O)N[C@@H](CCCCN)C(=O)NCC(=O)N[C@@H](CCCNC(N)=N)C(N)=O)NC(=O)[C@H](CCC(O)=O)NC(=O)[C@H](CCCCN)NC(=O)[C@H](C)NC(=O)[C@H](C)NC(=O)[C@H](CCC(N)=O)NC(=O)CNC(=O)[C@H](CCC(O)=O)NC(=O)[C@H](CC(C)C)NC(=O)[C@H](CC=1C=CC(O)=CC=1)NC(=O)[C@H](CO)NC(=O)[C@H](CO)NC(=O)[C@@H](NC(=O)[C@H](CC(O)=O)NC(=O)[C@H](CO)NC(=O)[C@@H](NC(=O)[C@H](CC=1C=CC=CC=1)NC(=O)[C@@H](NC(=O)CNC(=O)[C@H](CCC(O)=O)NC(=O)[C@H](C)NC(=O)[C@@H](N)CC=1N=CNC=1)[C@@H](C)O)[C@@H](C)O)C(C)C)C1=CC=CC=C1 DTHNMHAUYICORS-KTKZVXAJSA-N 0.000 description 1
- 101800000224 Glucagon-like peptide 1 Proteins 0.000 description 1
- 102400000326 Glucagon-like peptide 2 Human genes 0.000 description 1
- 101800000221 Glucagon-like peptide 2 Proteins 0.000 description 1
- SXRSQZLOMIGNAQ-UHFFFAOYSA-N Glutaraldehyde Chemical compound O=CCCCC=O SXRSQZLOMIGNAQ-UHFFFAOYSA-N 0.000 description 1
- 108010024636 Glutathione Proteins 0.000 description 1
- 102000007390 Glycogen Phosphorylase Human genes 0.000 description 1
- 108010046163 Glycogen Phosphorylase Proteins 0.000 description 1
- 108010031186 Glycoside Hydrolases Proteins 0.000 description 1
- 102000005744 Glycoside Hydrolases Human genes 0.000 description 1
- 206010018612 Gonorrhoea Diseases 0.000 description 1
- 108060003393 Granulin Proteins 0.000 description 1
- 102100039939 Growth/differentiation factor 8 Human genes 0.000 description 1
- 239000007995 HEPES buffer Substances 0.000 description 1
- 241000606768 Haemophilus influenzae Species 0.000 description 1
- HTTJABKRGRZYRN-UHFFFAOYSA-N Heparin Chemical compound OC1C(NC(=O)C)C(O)OC(COS(O)(=O)=O)C1OC1C(OS(O)(=O)=O)C(O)C(OC2C(C(OS(O)(=O)=O)C(OC3C(C(O)C(O)C(O3)C(O)=O)OS(O)(=O)=O)C(CO)O2)NS(O)(=O)=O)C(C(O)=O)O1 HTTJABKRGRZYRN-UHFFFAOYSA-N 0.000 description 1
- 208000001688 Herpes Genitalis Diseases 0.000 description 1
- 108010000487 High-Molecular-Weight Kininogen Proteins 0.000 description 1
- 102000000543 Histamine Receptors Human genes 0.000 description 1
- 108010002059 Histamine Receptors Proteins 0.000 description 1
- 241000282412 Homo Species 0.000 description 1
- 101000693085 Homo sapiens Angiopoietin-related protein 3 Proteins 0.000 description 1
- 101000693076 Homo sapiens Angiopoietin-related protein 4 Proteins 0.000 description 1
- 101000897405 Homo sapiens B-lymphocyte antigen CD20 Proteins 0.000 description 1
- 101001062855 Homo sapiens Fatty acid-binding protein 5 Proteins 0.000 description 1
- 101000623901 Homo sapiens Mucin-16 Proteins 0.000 description 1
- 101001024605 Homo sapiens Next to BRCA1 gene 1 protein Proteins 0.000 description 1
- 101000692455 Homo sapiens Platelet-derived growth factor receptor beta Proteins 0.000 description 1
- 101000821885 Homo sapiens Protein S100-B Proteins 0.000 description 1
- 101001059454 Homo sapiens Serine/threonine-protein kinase MARK2 Proteins 0.000 description 1
- 101000851007 Homo sapiens Vascular endothelial growth factor receptor 2 Proteins 0.000 description 1
- 101710146024 Horcolin Proteins 0.000 description 1
- 102000004157 Hydrolases Human genes 0.000 description 1
- 108090000604 Hydrolases Proteins 0.000 description 1
- 206010020751 Hypersensitivity Diseases 0.000 description 1
- 206010020772 Hypertension Diseases 0.000 description 1
- 102000017727 Immunoglobulin Variable Region Human genes 0.000 description 1
- 108010067060 Immunoglobulin Variable Region Proteins 0.000 description 1
- 235000000177 Indigofera tinctoria Nutrition 0.000 description 1
- UGQMRVRMYYASKQ-KQYNXXCUSA-N Inosine Chemical compound O[C@@H]1[C@H](O)[C@@H](CO)O[C@H]1N1C2=NC=NC(O)=C2N=C1 UGQMRVRMYYASKQ-KQYNXXCUSA-N 0.000 description 1
- 229930010555 Inosine Natural products 0.000 description 1
- 102100034343 Integrase Human genes 0.000 description 1
- 238000012351 Integrated analysis Methods 0.000 description 1
- 108010044467 Isoenzymes Proteins 0.000 description 1
- 102100035792 Kininogen-1 Human genes 0.000 description 1
- FFFHZYDWPBMWHY-VKHMYHEASA-N L-homocysteine Chemical compound OC(=O)[C@@H](N)CCS FFFHZYDWPBMWHY-VKHMYHEASA-N 0.000 description 1
- 102000008238 LHRH Receptors Human genes 0.000 description 1
- 108010021290 LHRH Receptors Proteins 0.000 description 1
- 101710189395 Lectin Proteins 0.000 description 1
- 241000589242 Legionella pneumophila Species 0.000 description 1
- PEEHTFAAVSWFBL-UHFFFAOYSA-N Maleimide Chemical compound O=C1NC(=O)C=C1 PEEHTFAAVSWFBL-UHFFFAOYSA-N 0.000 description 1
- 101710179758 Mannose-specific lectin Proteins 0.000 description 1
- 101710150763 Mannose-specific lectin 1 Proteins 0.000 description 1
- 101710150745 Mannose-specific lectin 2 Proteins 0.000 description 1
- 102100030335 Midkine Human genes 0.000 description 1
- 108010092801 Midkine Proteins 0.000 description 1
- 102100034256 Mucin-1 Human genes 0.000 description 1
- 102100023123 Mucin-16 Human genes 0.000 description 1
- 102000016943 Muramidase Human genes 0.000 description 1
- 108010014251 Muramidase Proteins 0.000 description 1
- 241001529936 Murinae Species 0.000 description 1
- 101100335081 Mus musculus Flt3 gene Proteins 0.000 description 1
- 101100481410 Mus musculus Tek gene Proteins 0.000 description 1
- 102000014415 Muscarinic acetylcholine receptor Human genes 0.000 description 1
- 108050003473 Muscarinic acetylcholine receptor Proteins 0.000 description 1
- 241000187479 Mycobacterium tuberculosis Species 0.000 description 1
- 241000202934 Mycoplasma pneumoniae Species 0.000 description 1
- 108010056852 Myostatin Proteins 0.000 description 1
- SGSSKEDGVONRGC-UHFFFAOYSA-N N(2)-methylguanine Chemical compound O=C1NC(NC)=NC2=C1N=CN2 SGSSKEDGVONRGC-UHFFFAOYSA-N 0.000 description 1
- 108010062010 N-Acetylmuramoyl-L-alanine Amidase Proteins 0.000 description 1
- 102400001263 NT-proBNP Human genes 0.000 description 1
- 101150111783 NTRK1 gene Proteins 0.000 description 1
- 241000588652 Neisseria gonorrhoeae Species 0.000 description 1
- 239000004677 Nylon Substances 0.000 description 1
- 208000008589 Obesity Diseases 0.000 description 1
- 102100040556 Osteocrin Human genes 0.000 description 1
- 101710089325 Osteocrin Proteins 0.000 description 1
- 229910019142 PO4 Chemical group 0.000 description 1
- 101150000187 PTGS2 gene Proteins 0.000 description 1
- 108010067035 Pancrelipase Proteins 0.000 description 1
- 108030001694 Pappalysin-1 Proteins 0.000 description 1
- 102100029909 Peptide YY Human genes 0.000 description 1
- 108010088847 Peptide YY Proteins 0.000 description 1
- 108700020962 Peroxidase Proteins 0.000 description 1
- 102000003992 Peroxidases Human genes 0.000 description 1
- 101710177166 Phosphoprotein Proteins 0.000 description 1
- 108700019535 Phosphoprotein Phosphatases Proteins 0.000 description 1
- ABLZXFCXXLZCGV-UHFFFAOYSA-N Phosphorous acid Chemical group OP(O)=O ABLZXFCXXLZCGV-UHFFFAOYSA-N 0.000 description 1
- 108090000113 Plasma Kallikrein Proteins 0.000 description 1
- 102100038124 Plasminogen Human genes 0.000 description 1
- 108010051456 Plasminogen Proteins 0.000 description 1
- 102000004211 Platelet factor 4 Human genes 0.000 description 1
- 108090000778 Platelet factor 4 Proteins 0.000 description 1
- 102100026547 Platelet-derived growth factor receptor beta Human genes 0.000 description 1
- 241000233872 Pneumocystis carinii Species 0.000 description 1
- 102100036143 Polycystin-1 Human genes 0.000 description 1
- 101710146367 Polycystin-1 Proteins 0.000 description 1
- 101710146368 Polycystin-2 Proteins 0.000 description 1
- 102100036142 Polycystin-2 Human genes 0.000 description 1
- 239000002202 Polyethylene glycol Substances 0.000 description 1
- NPYPAHLBTDXSSS-UHFFFAOYSA-N Potassium ion Chemical compound [K+] NPYPAHLBTDXSSS-UHFFFAOYSA-N 0.000 description 1
- 108010071690 Prealbumin Proteins 0.000 description 1
- 102000007584 Prealbumin Human genes 0.000 description 1
- 102000005819 Pregnancy-Associated Plasma Protein-A Human genes 0.000 description 1
- 102100033237 Pro-epidermal growth factor Human genes 0.000 description 1
- 101710130420 Probable capsid assembly scaffolding protein Proteins 0.000 description 1
- 108010048233 Procalcitonin Proteins 0.000 description 1
- 102000015433 Prostaglandin Receptors Human genes 0.000 description 1
- 108010050183 Prostaglandin Receptors Proteins 0.000 description 1
- 102100035703 Prostatic acid phosphatase Human genes 0.000 description 1
- 108090000315 Protein Kinase C Proteins 0.000 description 1
- 229940096437 Protein S Drugs 0.000 description 1
- 108010066124 Protein S Proteins 0.000 description 1
- 102000029301 Protein S Human genes 0.000 description 1
- 102100021487 Protein S100-B Human genes 0.000 description 1
- 102100024923 Protein kinase C beta type Human genes 0.000 description 1
- 101710094033 Protein kinase C beta type Proteins 0.000 description 1
- 108010089836 Proto-Oncogene Proteins c-met Proteins 0.000 description 1
- 102000008022 Proto-Oncogene Proteins c-met Human genes 0.000 description 1
- 241000589516 Pseudomonas Species 0.000 description 1
- 102000007466 Purinergic P2 Receptors Human genes 0.000 description 1
- 108010085249 Purinergic P2 Receptors Proteins 0.000 description 1
- LCYXYLLJXMAEMT-SAXRGWBVSA-N Pyridinoline Chemical compound OC(=O)[C@@H](N)CCC1=C[N+](C[C@H](O)CC[C@H](N)C([O-])=O)=CC(O)=C1C[C@H](N)C(O)=O LCYXYLLJXMAEMT-SAXRGWBVSA-N 0.000 description 1
- LCTONWCANYUPML-UHFFFAOYSA-M Pyruvate Chemical compound CC(=O)C([O-])=O LCTONWCANYUPML-UHFFFAOYSA-M 0.000 description 1
- 108010042687 Pyruvate Oxidase Proteins 0.000 description 1
- 108010025832 RANK Ligand Proteins 0.000 description 1
- 102000014128 RANK Ligand Human genes 0.000 description 1
- 108091008103 RNA aptamers Proteins 0.000 description 1
- 238000002123 RNA extraction Methods 0.000 description 1
- 108010092799 RNA-directed DNA polymerase Proteins 0.000 description 1
- 206010049190 Red blood cell agglutination Diseases 0.000 description 1
- 102100024735 Resistin Human genes 0.000 description 1
- 108010047909 Resistin Proteins 0.000 description 1
- 101710102802 Runt-related transcription factor 2 Proteins 0.000 description 1
- CGNLCCVKSWNSDG-UHFFFAOYSA-N SYBR Green I Chemical compound CN(C)CCCN(CCC)C1=CC(C=C2N(C3=CC=CC=C3S2)C)=C2C=CC=CC2=[N+]1C1=CC=CC=C1 CGNLCCVKSWNSDG-UHFFFAOYSA-N 0.000 description 1
- 101000744436 Saccharomyces cerevisiae (strain ATCC 204508 / S288c) Trans-acting factor D Proteins 0.000 description 1
- 101710204410 Scaffold protein Proteins 0.000 description 1
- 102100028904 Serine/threonine-protein kinase MARK2 Human genes 0.000 description 1
- 241000607715 Serratia marcescens Species 0.000 description 1
- 208000019802 Sexually transmitted disease Diseases 0.000 description 1
- 102100023105 Sialin Human genes 0.000 description 1
- 101710105284 Sialin Proteins 0.000 description 1
- BQCADISMDOOEFD-UHFFFAOYSA-N Silver Chemical compound [Ag] BQCADISMDOOEFD-UHFFFAOYSA-N 0.000 description 1
- 108020004682 Single-Stranded DNA Proteins 0.000 description 1
- 101710149279 Small delta antigen Proteins 0.000 description 1
- 241001147736 Staphylococcus capitis Species 0.000 description 1
- 241000191963 Staphylococcus epidermidis Species 0.000 description 1
- 241000192087 Staphylococcus hominis Species 0.000 description 1
- 241000191978 Staphylococcus simulans Species 0.000 description 1
- 241000192086 Staphylococcus warneri Species 0.000 description 1
- 241000122973 Stenotrophomonas maltophilia Species 0.000 description 1
- 108010090804 Streptavidin Proteins 0.000 description 1
- 241000193996 Streptococcus pyogenes Species 0.000 description 1
- 210000001744 T-lymphocyte Anatomy 0.000 description 1
- 108700012920 TNF Proteins 0.000 description 1
- 108010065917 TOR Serine-Threonine Kinases Proteins 0.000 description 1
- 102000013530 TOR Serine-Threonine Kinases Human genes 0.000 description 1
- 108010032050 Tartrate-Resistant Acid Phosphatase Proteins 0.000 description 1
- 102000007591 Tartrate-Resistant Acid Phosphatase Human genes 0.000 description 1
- XNRNNGPBEPRNAR-UHFFFAOYSA-N Thromboxane B2 Natural products CCCCCC(O)C=CC1OC(O)CC(O)C1CC=CCCCC(O)=O XNRNNGPBEPRNAR-UHFFFAOYSA-N 0.000 description 1
- 108090000373 Tissue Plasminogen Activator Proteins 0.000 description 1
- 102000003978 Tissue Plasminogen Activator Human genes 0.000 description 1
- 102000004338 Transferrin Human genes 0.000 description 1
- 108090000901 Transferrin Proteins 0.000 description 1
- 102000007238 Transferrin Receptors Human genes 0.000 description 1
- 108010033576 Transferrin Receptors Proteins 0.000 description 1
- 208000005448 Trichomonas Infections Diseases 0.000 description 1
- 241000224527 Trichomonas vaginalis Species 0.000 description 1
- 206010044620 Trichomoniasis Diseases 0.000 description 1
- 102000013394 Troponin I Human genes 0.000 description 1
- 108010065729 Troponin I Proteins 0.000 description 1
- 102000001400 Tryptase Human genes 0.000 description 1
- 108060005989 Tryptase Proteins 0.000 description 1
- 102100022563 Tubulin polymerization-promoting protein Human genes 0.000 description 1
- 208000035896 Twin-reversed arterial perfusion sequence Diseases 0.000 description 1
- LEHOTFFKMJEONL-UHFFFAOYSA-N Uric Acid Chemical compound N1C(=O)NC(=O)C2=C1NC(=O)N2 LEHOTFFKMJEONL-UHFFFAOYSA-N 0.000 description 1
- TVWHNULVHGKJHS-UHFFFAOYSA-N Uric acid Natural products N1C(=O)NC(=O)C2NC(=O)NC21 TVWHNULVHGKJHS-UHFFFAOYSA-N 0.000 description 1
- 108010027007 Uromodulin Proteins 0.000 description 1
- 102100040613 Uromodulin Human genes 0.000 description 1
- 102000003848 Uteroglobin Human genes 0.000 description 1
- 108090000203 Uteroglobin Proteins 0.000 description 1
- 108091008605 VEGF receptors Proteins 0.000 description 1
- 108010073929 Vascular Endothelial Growth Factor A Proteins 0.000 description 1
- 102000009484 Vascular Endothelial Growth Factor Receptors Human genes 0.000 description 1
- 108010019530 Vascular Endothelial Growth Factors Proteins 0.000 description 1
- 102100039037 Vascular endothelial growth factor A Human genes 0.000 description 1
- 241000251539 Vertebrata <Metazoa> Species 0.000 description 1
- 206010058874 Viraemia Diseases 0.000 description 1
- HCHKCACWOHOZIP-UHFFFAOYSA-N Zinc Chemical compound [Zn] HCHKCACWOHOZIP-UHFFFAOYSA-N 0.000 description 1
- 241000606834 [Haemophilus] ducreyi Species 0.000 description 1
- PNNCWTXUWKENPE-UHFFFAOYSA-N [N].NC(N)=O Chemical compound [N].NC(N)=O PNNCWTXUWKENPE-UHFFFAOYSA-N 0.000 description 1
- 230000001133 acceleration Effects 0.000 description 1
- 239000002253 acid Substances 0.000 description 1
- NIXOWILDQLNWCW-UHFFFAOYSA-N acrylic acid group Chemical group C(C=C)(=O)O NIXOWILDQLNWCW-UHFFFAOYSA-N 0.000 description 1
- 125000002015 acyclic group Chemical group 0.000 description 1
- 239000012082 adaptor molecule Substances 0.000 description 1
- 239000000654 additive Substances 0.000 description 1
- ULCUCJFASIJEOE-NPECTJMMSA-N adrenomedullin Chemical compound C([C@@H](C(=O)N[C@@H](CCC(N)=O)C(=O)NCC(=O)N[C@@H]([C@@H](C)CC)C(=O)N[C@@H](CCCNC(N)=N)C(=O)N[C@@H](CO)C(=O)N[C@@H](CC=1C=CC=CC=1)C(=O)NCC(=O)N[C@@H]1C(N[C@@H](CCCNC(N)=N)C(=O)N[C@@H](CC=2C=CC=CC=2)C(=O)NCC(=O)N[C@H](C(=O)N[C@@H](CSSC1)C(=O)N[C@@H]([C@@H](C)O)C(=O)N[C@@H](C(C)C)C(=O)N[C@@H](CCC(N)=O)C(=O)N[C@@H](CCCCN)C(=O)N[C@@H](CC(C)C)C(=O)N[C@@H](C)C(=O)N[C@@H](CC=1NC=NC=1)C(=O)N[C@@H](CCC(N)=O)C(=O)N[C@@H]([C@@H](C)CC)C(=O)N[C@@H](CC=1C=CC(O)=CC=1)C(=O)N[C@@H](CCC(N)=O)C(=O)N[C@@H](CC=1C=CC=CC=1)C(=O)N[C@@H]([C@@H](C)O)C(=O)N[C@@H](CC(O)=O)C(=O)N[C@@H](CCCCN)C(=O)N[C@@H](CC(O)=O)C(=O)N[C@@H](CCCCN)C(=O)N[C@@H](CC(O)=O)C(=O)N[C@@H](CC(N)=O)C(=O)N[C@@H](C(C)C)C(=O)N[C@@H](C)C(=O)N1[C@@H](CCC1)C(=O)N[C@@H](CCCNC(N)=N)C(=O)N[C@@H](CO)C(=O)N[C@@H](CCCCN)C(=O)N[C@@H]([C@@H](C)CC)C(=O)N[C@@H](CO)C(=O)N1[C@@H](CCC1)C(=O)N[C@@H](CCC(N)=O)C(=O)NCC(=O)N[C@@H](CC=1C=CC(O)=CC=1)C(N)=O)[C@@H](C)O)=O)NC(=O)[C@H](CC(N)=O)NC(=O)[C@H](CC(N)=O)NC(=O)[C@H](CCSC)NC(=O)[C@H](CO)NC(=O)[C@H](CCC(N)=O)NC(=O)[C@H](CCCNC(N)=N)NC(=O)[C@@H](N)CC=1C=CC(O)=CC=1)C1=CC=CC=C1 ULCUCJFASIJEOE-NPECTJMMSA-N 0.000 description 1
- 230000002411 adverse Effects 0.000 description 1
- 238000001261 affinity purification Methods 0.000 description 1
- 230000004523 agglutinating effect Effects 0.000 description 1
- 239000000910 agglutinin Substances 0.000 description 1
- 230000002776 aggregation Effects 0.000 description 1
- 238000004220 aggregation Methods 0.000 description 1
- RGCKGOZRHPZPFP-UHFFFAOYSA-N alizarin Chemical compound C1=CC=C2C(=O)C3=C(O)C(O)=CC=C3C(=O)C2=C1 RGCKGOZRHPZPFP-UHFFFAOYSA-N 0.000 description 1
- 125000003342 alkenyl group Chemical group 0.000 description 1
- 125000000217 alkyl group Chemical group 0.000 description 1
- 208000026935 allergic disease Diseases 0.000 description 1
- 230000007815 allergy Effects 0.000 description 1
- 230000005262 alpha decay Effects 0.000 description 1
- 229910052782 aluminium Inorganic materials 0.000 description 1
- XAGFODPZIPBFFR-UHFFFAOYSA-N aluminium Chemical compound [Al] XAGFODPZIPBFFR-UHFFFAOYSA-N 0.000 description 1
- 229940059260 amidate Drugs 0.000 description 1
- 235000001014 amino acid Nutrition 0.000 description 1
- 150000001413 amino acids Chemical class 0.000 description 1
- 125000003277 amino group Chemical group 0.000 description 1
- 235000019270 ammonium chloride Nutrition 0.000 description 1
- 235000019418 amylase Nutrition 0.000 description 1
- 230000033115 angiogenesis Effects 0.000 description 1
- 230000001745 anti-biotin effect Effects 0.000 description 1
- 230000002587 anti-hemolytic effect Effects 0.000 description 1
- 230000036436 anti-hiv Effects 0.000 description 1
- 230000003460 anti-nuclear Effects 0.000 description 1
- 230000000692 anti-sense effect Effects 0.000 description 1
- 230000000890 antigenic effect Effects 0.000 description 1
- 239000002246 antineoplastic agent Substances 0.000 description 1
- 239000007864 aqueous solution Substances 0.000 description 1
- PYMYPHUHKUWMLA-WDCZJNDASA-N arabinose Chemical compound OC[C@@H](O)[C@@H](O)[C@H](O)C=O PYMYPHUHKUWMLA-WDCZJNDASA-N 0.000 description 1
- PYMYPHUHKUWMLA-UHFFFAOYSA-N arabinose Natural products OCC(O)C(O)C(O)C=O PYMYPHUHKUWMLA-UHFFFAOYSA-N 0.000 description 1
- 125000003710 aryl alkyl group Chemical group 0.000 description 1
- 125000003118 aryl group Chemical group 0.000 description 1
- FZCSTZYAHCUGEM-UHFFFAOYSA-N aspergillomarasmine B Natural products OC(=O)CNC(C(O)=O)CNC(C(O)=O)CC(O)=O FZCSTZYAHCUGEM-UHFFFAOYSA-N 0.000 description 1
- 238000007836 assay cartridge Methods 0.000 description 1
- 238000011948 assay development Methods 0.000 description 1
- 238000002820 assay format Methods 0.000 description 1
- 230000000386 athletic effect Effects 0.000 description 1
- 239000012298 atmosphere Substances 0.000 description 1
- 230000003190 augmentative effect Effects 0.000 description 1
- 230000005255 beta decay Effects 0.000 description 1
- SRBFZHDQGSBBOR-UHFFFAOYSA-N beta-D-Pyranose-Lyxose Natural products OC1COC(O)C(O)C1O SRBFZHDQGSBBOR-UHFFFAOYSA-N 0.000 description 1
- WQZGKKKJIJFFOK-VFUOTHLCSA-N beta-D-glucose Chemical compound OC[C@H]1O[C@@H](O)[C@H](O)[C@@H](O)[C@@H]1O WQZGKKKJIJFFOK-VFUOTHLCSA-N 0.000 description 1
- DRTQHJPVMGBUCF-PSQAKQOGSA-N beta-L-uridine Natural products O[C@H]1[C@@H](O)[C@H](CO)O[C@@H]1N1C(=O)NC(=O)C=C1 DRTQHJPVMGBUCF-PSQAKQOGSA-N 0.000 description 1
- 229960003237 betaine Drugs 0.000 description 1
- 230000004071 biological effect Effects 0.000 description 1
- 230000031018 biological processes and functions Effects 0.000 description 1
- 230000033228 biological regulation Effects 0.000 description 1
- 230000015572 biosynthetic process Effects 0.000 description 1
- 239000012490 blank solution Substances 0.000 description 1
- 208000015294 blood coagulation disease Diseases 0.000 description 1
- 238000004820 blood count Methods 0.000 description 1
- 210000001772 blood platelet Anatomy 0.000 description 1
- 230000036772 blood pressure Effects 0.000 description 1
- 238000009534 blood test Methods 0.000 description 1
- 238000000071 blow moulding Methods 0.000 description 1
- 210000001185 bone marrow Anatomy 0.000 description 1
- 229940098773 bovine serum albumin Drugs 0.000 description 1
- 210000000481 breast Anatomy 0.000 description 1
- 238000000339 bright-field microscopy Methods 0.000 description 1
- 210000000233 bronchiolar non-ciliated Anatomy 0.000 description 1
- 238000005537 brownian motion Methods 0.000 description 1
- 239000007853 buffer solution Substances 0.000 description 1
- 239000006227 byproduct Substances 0.000 description 1
- 239000004202 carbamide Substances 0.000 description 1
- 125000002837 carbocyclic group Chemical group 0.000 description 1
- 150000001720 carbohydrates Chemical class 0.000 description 1
- 235000014633 carbohydrates Nutrition 0.000 description 1
- 239000001569 carbon dioxide Substances 0.000 description 1
- 125000003178 carboxy group Chemical group [H]OC(*)=O 0.000 description 1
- 108010041776 cardiotrophin 1 Proteins 0.000 description 1
- 238000005266 casting Methods 0.000 description 1
- 238000000423 cell based assay Methods 0.000 description 1
- 238000004113 cell culture Methods 0.000 description 1
- 230000006037 cell lysis Effects 0.000 description 1
- 210000002421 cell wall Anatomy 0.000 description 1
- 229920002301 cellulose acetate Polymers 0.000 description 1
- 210000001175 cerebrospinal fluid Anatomy 0.000 description 1
- 201000004308 chancroid Diseases 0.000 description 1
- 230000003196 chaotropic effect Effects 0.000 description 1
- 239000002738 chelating agent Substances 0.000 description 1
- 238000007385 chemical modification Methods 0.000 description 1
- 239000012916 chromogenic reagent Substances 0.000 description 1
- 230000008045 co-localization Effects 0.000 description 1
- 230000009852 coagulant defect Effects 0.000 description 1
- 230000015271 coagulation Effects 0.000 description 1
- 238000005345 coagulation Methods 0.000 description 1
- AGVAZMGAQJOSFJ-WZHZPDAFSA-M cobalt(2+);[(2r,3s,4r,5s)-5-(5,6-dimethylbenzimidazol-1-yl)-4-hydroxy-2-(hydroxymethyl)oxolan-3-yl] [(2r)-1-[3-[(1r,2r,3r,4z,7s,9z,12s,13s,14z,17s,18s,19r)-2,13,18-tris(2-amino-2-oxoethyl)-7,12,17-tris(3-amino-3-oxopropyl)-3,5,8,8,13,15,18,19-octamethyl-2 Chemical compound [Co+2].N#[C-].[N-]([C@@H]1[C@H](CC(N)=O)[C@@]2(C)CCC(=O)NC[C@@H](C)OP(O)(=O)O[C@H]3[C@H]([C@H](O[C@@H]3CO)N3C4=CC(C)=C(C)C=C4N=C3)O)\C2=C(C)/C([C@H](C\2(C)C)CCC(N)=O)=N/C/2=C\C([C@H]([C@@]/2(CC(N)=O)C)CCC(N)=O)=N\C\2=C(C)/C2=N[C@]1(C)[C@@](C)(CC(N)=O)[C@@H]2CCC(N)=O AGVAZMGAQJOSFJ-WZHZPDAFSA-M 0.000 description 1
- 239000005515 coenzyme Substances 0.000 description 1
- 229910052681 coesite Inorganic materials 0.000 description 1
- 229920001436 collagen Polymers 0.000 description 1
- 108010049937 collagen type I trimeric cross-linked peptide Proteins 0.000 description 1
- 238000004440 column chromatography Methods 0.000 description 1
- 230000002860 competitive effect Effects 0.000 description 1
- 238000003271 compound fluorescence assay Methods 0.000 description 1
- 230000021615 conjugation Effects 0.000 description 1
- 239000000356 contaminant Substances 0.000 description 1
- 229910052802 copper Inorganic materials 0.000 description 1
- 239000010949 copper Substances 0.000 description 1
- 238000005314 correlation function Methods 0.000 description 1
- 229960003624 creatine Drugs 0.000 description 1
- 239000006046 creatine Substances 0.000 description 1
- 229910052906 cristobalite Inorganic materials 0.000 description 1
- 239000003431 cross linking reagent Substances 0.000 description 1
- 238000005520 cutting process Methods 0.000 description 1
- 125000000392 cycloalkenyl group Chemical group 0.000 description 1
- 125000000753 cycloalkyl group Chemical group 0.000 description 1
- 229940127089 cytotoxic agent Drugs 0.000 description 1
- 125000001295 dansyl group Chemical group [H]C1=C([H])C(N(C([H])([H])[H])C([H])([H])[H])=C2C([H])=C([H])C([H])=C(C2=C1[H])S(*)(=O)=O 0.000 description 1
- 238000007405 data analysis Methods 0.000 description 1
- 238000013480 data collection Methods 0.000 description 1
- 230000002498 deadly effect Effects 0.000 description 1
- 238000010511 deprotection reaction Methods 0.000 description 1
- 230000001066 destructive effect Effects 0.000 description 1
- 230000023004 detection of visible light Effects 0.000 description 1
- 150000004985 diamines Chemical class 0.000 description 1
- 230000001079 digestive effect Effects 0.000 description 1
- 238000007865 diluting Methods 0.000 description 1
- 238000003113 dilution method Methods 0.000 description 1
- 239000000539 dimer Substances 0.000 description 1
- STQIGZGVKIDNSA-UHFFFAOYSA-N dioxetane;phosphoric acid Chemical class C1COO1.OP(O)(O)=O STQIGZGVKIDNSA-UHFFFAOYSA-N 0.000 description 1
- XPPKVPWEQAFLFU-UHFFFAOYSA-J diphosphate(4-) Chemical compound [O-]P([O-])(=O)OP([O-])([O-])=O XPPKVPWEQAFLFU-UHFFFAOYSA-J 0.000 description 1
- 235000011180 diphosphates Nutrition 0.000 description 1
- LOKCTEFSRHRXRJ-UHFFFAOYSA-I dipotassium trisodium dihydrogen phosphate hydrogen phosphate dichloride Chemical compound P(=O)(O)(O)[O-].[K+].P(=O)(O)([O-])[O-].[Na+].[Na+].[Cl-].[K+].[Cl-].[Na+] LOKCTEFSRHRXRJ-UHFFFAOYSA-I 0.000 description 1
- 230000005750 disease progression Effects 0.000 description 1
- BFMYDTVEBKDAKJ-UHFFFAOYSA-L disodium;(2',7'-dibromo-3',6'-dioxido-3-oxospiro[2-benzofuran-1,9'-xanthene]-4'-yl)mercury;hydrate Chemical compound O.[Na+].[Na+].O1C(=O)C2=CC=CC=C2C21C1=CC(Br)=C([O-])C([Hg])=C1OC1=C2C=C(Br)C([O-])=C1 BFMYDTVEBKDAKJ-UHFFFAOYSA-L 0.000 description 1
- 238000004090 dissolution Methods 0.000 description 1
- 238000007877 drug screening Methods 0.000 description 1
- 238000001035 drying Methods 0.000 description 1
- 230000009977 dual effect Effects 0.000 description 1
- 238000013399 early diagnosis Methods 0.000 description 1
- 238000003708 edge detection Methods 0.000 description 1
- 230000005611 electricity Effects 0.000 description 1
- 230000005518 electrochemistry Effects 0.000 description 1
- 230000005672 electromagnetic field Effects 0.000 description 1
- 230000005662 electromechanics Effects 0.000 description 1
- 238000001962 electrophoresis Methods 0.000 description 1
- 230000005686 electrostatic field Effects 0.000 description 1
- 238000004049 embossing Methods 0.000 description 1
- 230000002708 enhancing effect Effects 0.000 description 1
- 238000006911 enzymatic reaction Methods 0.000 description 1
- 239000002532 enzyme inhibitor Substances 0.000 description 1
- 229940116977 epidermal growth factor Drugs 0.000 description 1
- 102000052116 epidermal growth factor receptor activity proteins Human genes 0.000 description 1
- 108700015053 epidermal growth factor receptor activity proteins Proteins 0.000 description 1
- NPUKDXXFDDZOKR-LLVKDONJSA-N etomidate Chemical compound CCOC(=O)C1=CN=CN1[C@H](C)C1=CC=CC=C1 NPUKDXXFDDZOKR-LLVKDONJSA-N 0.000 description 1
- 210000003722 extracellular fluid Anatomy 0.000 description 1
- 229960004222 factor ix Drugs 0.000 description 1
- 229940012413 factor vii Drugs 0.000 description 1
- 229960000301 factor viii Drugs 0.000 description 1
- 229940012444 factor xiii Drugs 0.000 description 1
- 230000002349 favourable effect Effects 0.000 description 1
- 108010052295 fibrin fragment D Proteins 0.000 description 1
- 102000052178 fibroblast growth factor receptor activity proteins Human genes 0.000 description 1
- 230000005669 field effect Effects 0.000 description 1
- 238000001917 fluorescence detection Methods 0.000 description 1
- 238000000799 fluorescence microscopy Methods 0.000 description 1
- 238000002189 fluorescence spectrum Methods 0.000 description 1
- 238000005558 fluorometry Methods 0.000 description 1
- 229960002949 fluorouracil Drugs 0.000 description 1
- 235000013305 food Nutrition 0.000 description 1
- 235000021550 forms of sugar Nutrition 0.000 description 1
- 238000009472 formulation Methods 0.000 description 1
- 230000005251 gamma ray Effects 0.000 description 1
- BTCSSZJGUNDROE-UHFFFAOYSA-N gamma-aminobutyric acid Chemical compound NCCCC(O)=O BTCSSZJGUNDROE-UHFFFAOYSA-N 0.000 description 1
- 230000002496 gastric effect Effects 0.000 description 1
- 239000000499 gel Substances 0.000 description 1
- 238000001502 gel electrophoresis Methods 0.000 description 1
- 230000002068 genetic effect Effects 0.000 description 1
- 201000004946 genital herpes Diseases 0.000 description 1
- GNPVGFCGXDBREM-UHFFFAOYSA-N germanium atom Chemical compound [Ge] GNPVGFCGXDBREM-UHFFFAOYSA-N 0.000 description 1
- GNKDKYIHGQKHHM-RJKLHVOGSA-N ghrelin Chemical compound C([C@H](NC(=O)[C@@H](NC(=O)[C@H](CO)NC(=O)CN)COC(=O)CCCCCCC)C(=O)N[C@@H](CC(C)C)C(=O)N[C@@H](CO)C(=O)N1[C@@H](CCC1)C(=O)N[C@@H](CCC(O)=O)C(=O)N[C@@H](CC=1N=CNC=1)C(=O)N[C@@H](CCC(N)=O)C(=O)N[C@@H](CCCNC(N)=N)C(=O)N[C@@H](C(C)C)C(=O)N[C@@H](CCC(N)=O)C(=O)N[C@@H](CCC(N)=O)C(=O)N[C@@H](CCCNC(N)=N)C(=O)N[C@@H](CCCCN)C(=O)N[C@@H](CCC(O)=O)C(=O)N[C@@H](CO)C(=O)N[C@@H](CCCCN)C(=O)N[C@@H](CCCCN)C(=O)N1[C@@H](CCC1)C(=O)N1[C@@H](CCC1)C(=O)N[C@@H](C)C(=O)N[C@@H](CCCCN)C(=O)N[C@@H](CC(C)C)C(=O)N[C@@H](CCC(N)=O)C(=O)N1[C@@H](CCC1)C(=O)N[C@@H](CCCNC(N)=N)C(O)=O)C1=CC=CC=C1 GNKDKYIHGQKHHM-RJKLHVOGSA-N 0.000 description 1
- 210000005046 glial fibrillary acidic protein Anatomy 0.000 description 1
- MASNOZXLGMXCHN-ZLPAWPGGSA-N glucagon Chemical compound C([C@@H](C(=O)N[C@H](C(=O)N[C@@H](CCC(N)=O)C(=O)N[C@@H](CC=1C2=CC=CC=C2NC=1)C(=O)N[C@@H](CC(C)C)C(=O)N[C@@H](CCSC)C(=O)N[C@@H](CC(N)=O)C(=O)N[C@@H]([C@@H](C)O)C(O)=O)C(C)C)NC(=O)[C@H](CC(O)=O)NC(=O)[C@H](CCC(N)=O)NC(=O)[C@H](C)NC(=O)[C@H](CCCNC(N)=N)NC(=O)[C@H](CCCNC(N)=N)NC(=O)[C@H](CO)NC(=O)[C@H](CC(O)=O)NC(=O)[C@H](CC(C)C)NC(=O)[C@H](CC=1C=CC(O)=CC=1)NC(=O)[C@H](CCCCN)NC(=O)[C@H](CO)NC(=O)[C@H](CC=1C=CC(O)=CC=1)NC(=O)[C@H](CC(O)=O)NC(=O)[C@H](CO)NC(=O)[C@@H](NC(=O)[C@H](CC=1C=CC=CC=1)NC(=O)[C@@H](NC(=O)CNC(=O)[C@H](CCC(N)=O)NC(=O)[C@H](CO)NC(=O)[C@@H](N)CC=1NC=NC=1)[C@@H](C)O)[C@@H](C)O)C1=CC=CC=C1 MASNOZXLGMXCHN-ZLPAWPGGSA-N 0.000 description 1
- 229960004666 glucagon Drugs 0.000 description 1
- TWSALRJGPBVBQU-PKQQPRCHSA-N glucagon-like peptide 2 Chemical compound C([C@@H](C(=O)N[C@H](C(=O)N[C@@H](CC(N)=O)C(=O)N[C@@H](CC=1C2=CC=CC=C2NC=1)C(=O)N[C@@H](CC(C)C)C(=O)N[C@@H]([C@@H](C)CC)C(=O)N[C@@H](CCC(N)=O)C(=O)N[C@@H]([C@@H](C)O)C(=O)N[C@@H](CCCCN)C(=O)N[C@@H]([C@@H](C)CC)C(=O)N[C@@H]([C@@H](C)O)C(=O)N[C@@H](CC(O)=O)C(O)=O)[C@@H](C)CC)NC(=O)[C@H](CC(O)=O)NC(=O)[C@H](CCCNC(N)=N)NC(=O)[C@H](C)NC(=O)[C@H](C)NC(=O)[C@H](CC(C)C)NC(=O)[C@H](CC(N)=O)NC(=O)[C@H](CC(O)=O)NC(=O)[C@H](CC(C)C)NC(=O)[C@@H](NC(=O)[C@@H](NC(=O)[C@H](CC(N)=O)NC(=O)[C@H](CCSC)NC(=O)[C@H](CCC(O)=O)NC(=O)[C@H](CC(O)=O)NC(=O)[C@H](CO)NC(=O)[C@H](CC=1C=CC=CC=1)NC(=O)[C@H](CO)NC(=O)CNC(=O)[C@H](CC(O)=O)NC(=O)[C@H](C)NC(=O)[C@@H](N)CC=1NC=NC=1)[C@@H](C)O)[C@@H](C)CC)C1=CC=CC=C1 TWSALRJGPBVBQU-PKQQPRCHSA-N 0.000 description 1
- 229960003180 glutathione Drugs 0.000 description 1
- 108010004903 glycosylated serum albumin Proteins 0.000 description 1
- 229910052737 gold Inorganic materials 0.000 description 1
- 239000010931 gold Substances 0.000 description 1
- 208000001786 gonorrhea Diseases 0.000 description 1
- 230000005283 ground state Effects 0.000 description 1
- 229960000789 guanidine hydrochloride Drugs 0.000 description 1
- PJJJBBJSCAKJQF-UHFFFAOYSA-N guanidinium chloride Chemical compound [Cl-].NC(N)=[NH2+] PJJJBBJSCAKJQF-UHFFFAOYSA-N 0.000 description 1
- ZJYYHGLJYGJLLN-UHFFFAOYSA-N guanidinium thiocyanate Chemical compound SC#N.NC(N)=N ZJYYHGLJYGJLLN-UHFFFAOYSA-N 0.000 description 1
- 150000003278 haem Chemical class 0.000 description 1
- 229940047650 haemophilus influenzae Drugs 0.000 description 1
- 229910052736 halogen Inorganic materials 0.000 description 1
- 150000002367 halogens Chemical class 0.000 description 1
- 230000003862 health status Effects 0.000 description 1
- 208000019622 heart disease Diseases 0.000 description 1
- 210000002443 helper t lymphocyte Anatomy 0.000 description 1
- 239000003219 hemolytic agent Substances 0.000 description 1
- 229960002897 heparin Drugs 0.000 description 1
- 229920000669 heparin Polymers 0.000 description 1
- 208000006454 hepatitis Diseases 0.000 description 1
- 231100000283 hepatitis Toxicity 0.000 description 1
- 208000005252 hepatitis A Diseases 0.000 description 1
- 108010011705 herstatin Proteins 0.000 description 1
- 150000007857 hydrazones Chemical class 0.000 description 1
- BHEPBYXIRTUNPN-UHFFFAOYSA-N hydridophosphorus(.) (triplet) Chemical compound [PH] BHEPBYXIRTUNPN-UHFFFAOYSA-N 0.000 description 1
- 229960000890 hydrocortisone Drugs 0.000 description 1
- 230000002218 hypoglycaemic effect Effects 0.000 description 1
- 238000003703 image analysis method Methods 0.000 description 1
- 238000003709 image segmentation Methods 0.000 description 1
- 238000001727 in vivo Methods 0.000 description 1
- 238000011065 in-situ storage Methods 0.000 description 1
- 229940097275 indigo Drugs 0.000 description 1
- COHYTHOBJLSHDF-UHFFFAOYSA-N indigo powder Natural products N1C2=CC=CC=C2C(=O)C1=C1C(=O)C2=CC=CC=C2N1 COHYTHOBJLSHDF-UHFFFAOYSA-N 0.000 description 1
- 208000015181 infectious disease Diseases 0.000 description 1
- 208000027866 inflammatory disease Diseases 0.000 description 1
- 230000002757 inflammatory effect Effects 0.000 description 1
- 206010022000 influenza Diseases 0.000 description 1
- 208000037798 influenza B Diseases 0.000 description 1
- 239000004615 ingredient Substances 0.000 description 1
- 239000000893 inhibin Substances 0.000 description 1
- 230000005764 inhibitory process Effects 0.000 description 1
- ZPNFWUPYTFPOJU-LPYSRVMUSA-N iniprol Chemical compound C([C@H]1C(=O)NCC(=O)NCC(=O)N[C@H]2CSSC[C@H]3C(=O)N[C@@H](CCCCN)C(=O)N[C@@H](C)C(=O)N[C@@H](CCCNC(N)=N)C(=O)N[C@H](C(N[C@H](C(=O)N[C@@H](CCCNC(N)=N)C(=O)N[C@@H](CC=4C=CC(O)=CC=4)C(=O)N[C@@H](CC=4C=CC=CC=4)C(=O)N[C@@H](CC=4C=CC(O)=CC=4)C(=O)N[C@@H](CC(N)=O)C(=O)N[C@@H](C)C(=O)N[C@@H](CCCCN)C(=O)N[C@@H](C)C(=O)NCC(=O)N[C@@H](CC(C)C)C(=O)N[C@@H](CSSC[C@H](NC(=O)[C@H](CC(O)=O)NC(=O)[C@H](CCC(O)=O)NC(=O)[C@H](C)NC(=O)[C@H](CO)NC(=O)[C@H](CCCCN)NC(=O)[C@H](CC=4C=CC=CC=4)NC(=O)[C@H](CC(N)=O)NC(=O)[C@H](CC(N)=O)NC(=O)[C@H](CCCNC(N)=N)NC(=O)[C@H](CCCCN)NC(=O)[C@H](C)NC(=O)[C@H](CCCNC(N)=N)NC2=O)C(=O)N[C@@H](CCSC)C(=O)N[C@@H](CCCNC(N)=N)C(=O)N[C@@H]([C@@H](C)O)C(=O)N[C@@H](CSSC[C@H](NC(=O)[C@H](CC=2C=CC=CC=2)NC(=O)[C@H](CC(O)=O)NC(=O)[C@H]2N(CCC2)C(=O)[C@@H](N)CCCNC(N)=N)C(=O)N[C@@H](CC(C)C)C(=O)N[C@@H](CCC(O)=O)C(=O)N2[C@@H](CCC2)C(=O)N2[C@@H](CCC2)C(=O)N[C@@H](CC=2C=CC(O)=CC=2)C(=O)N[C@@H]([C@@H](C)O)C(=O)NCC(=O)N2[C@@H](CCC2)C(=O)N3)C(=O)NCC(=O)NCC(=O)N[C@@H](C)C(O)=O)C(=O)N[C@@H](CCC(N)=O)C(=O)N[C@H](C(=O)N[C@@H](CC=2C=CC=CC=2)C(=O)N[C@H](C(=O)N1)C(C)C)[C@@H](C)O)[C@@H](C)CC)=O)[C@@H](C)CC)C1=CC=C(O)C=C1 ZPNFWUPYTFPOJU-LPYSRVMUSA-N 0.000 description 1
- 230000000977 initiatory effect Effects 0.000 description 1
- 229960003786 inosine Drugs 0.000 description 1
- 238000003780 insertion Methods 0.000 description 1
- 230000037431 insertion Effects 0.000 description 1
- 102000006495 integrins Human genes 0.000 description 1
- 108010044426 integrins Proteins 0.000 description 1
- 230000002452 interceptive effect Effects 0.000 description 1
- 238000005342 ion exchange Methods 0.000 description 1
- 150000002500 ions Chemical class 0.000 description 1
- 229910052742 iron Inorganic materials 0.000 description 1
- 229940043355 kinase inhibitor Drugs 0.000 description 1
- 229940115932 legionella pneumophila Drugs 0.000 description 1
- 230000031700 light absorption Effects 0.000 description 1
- 230000037356 lipid metabolism Effects 0.000 description 1
- 150000002634 lipophilic molecules Chemical class 0.000 description 1
- 238000000622 liquid--liquid extraction Methods 0.000 description 1
- 238000002796 luminescence method Methods 0.000 description 1
- 210000004072 lung Anatomy 0.000 description 1
- 239000012139 lysis buffer Substances 0.000 description 1
- 229960000274 lysozyme Drugs 0.000 description 1
- 239000004325 lysozyme Substances 0.000 description 1
- 235000010335 lysozyme Nutrition 0.000 description 1
- 150000002671 lyxoses Chemical class 0.000 description 1
- 230000014759 maintenance of location Effects 0.000 description 1
- 230000003211 malignant effect Effects 0.000 description 1
- 230000000873 masking effect Effects 0.000 description 1
- 238000004949 mass spectrometry Methods 0.000 description 1
- 230000013011 mating Effects 0.000 description 1
- 210000003622 mature neutrocyte Anatomy 0.000 description 1
- 238000010907 mechanical stirring Methods 0.000 description 1
- 230000010534 mechanism of action Effects 0.000 description 1
- 102000006240 membrane receptors Human genes 0.000 description 1
- 108020004084 membrane receptors Proteins 0.000 description 1
- QSHDDOUJBYECFT-UHFFFAOYSA-N mercury Chemical compound [Hg] QSHDDOUJBYECFT-UHFFFAOYSA-N 0.000 description 1
- 229910052753 mercury Inorganic materials 0.000 description 1
- 208000030159 metabolic disease Diseases 0.000 description 1
- 239000007769 metal material Substances 0.000 description 1
- CWWARWOPSKGELM-SARDKLJWSA-N methyl (2s)-2-[[(2s)-2-[[2-[[(2s)-2-[[(2s)-2-[[(2s)-5-amino-2-[[(2s)-5-amino-2-[[(2s)-1-[(2s)-6-amino-2-[[(2s)-1-[(2s)-2-amino-5-(diaminomethylideneamino)pentanoyl]pyrrolidine-2-carbonyl]amino]hexanoyl]pyrrolidine-2-carbonyl]amino]-5-oxopentanoyl]amino]-5 Chemical compound C([C@@H](C(=O)NCC(=O)N[C@@H](CC(C)C)C(=O)N[C@@H](CCSC)C(=O)OC)NC(=O)[C@H](CC=1C=CC=CC=1)NC(=O)[C@H](CCC(N)=O)NC(=O)[C@H](CCC(N)=O)NC(=O)[C@H]1N(CCC1)C(=O)[C@H](CCCCN)NC(=O)[C@H]1N(CCC1)C(=O)[C@@H](N)CCCN=C(N)N)C1=CC=CC=C1 CWWARWOPSKGELM-SARDKLJWSA-N 0.000 description 1
- IZAGSTRIDUNNOY-UHFFFAOYSA-N methyl 2-[(2,4-dioxo-1h-pyrimidin-5-yl)oxy]acetate Chemical compound COC(=O)COC1=CNC(=O)NC1=O IZAGSTRIDUNNOY-UHFFFAOYSA-N 0.000 description 1
- 239000011859 microparticle Substances 0.000 description 1
- 210000001616 monocyte Anatomy 0.000 description 1
- BSOQXXWZTUDTEL-ZUYCGGNHSA-N muramyl dipeptide Chemical compound OC(=O)CC[C@H](C(N)=O)NC(=O)[C@H](C)NC(=O)[C@@H](C)O[C@H]1[C@H](O)[C@@H](CO)O[C@@H](O)[C@@H]1NC(C)=O BSOQXXWZTUDTEL-ZUYCGGNHSA-N 0.000 description 1
- 230000003387 muscular Effects 0.000 description 1
- XJVXMWNLQRTRGH-UHFFFAOYSA-N n-(3-methylbut-3-enyl)-2-methylsulfanyl-7h-purin-6-amine Chemical compound CSC1=NC(NCCC(C)=C)=C2NC=NC2=N1 XJVXMWNLQRTRGH-UHFFFAOYSA-N 0.000 description 1
- YOHYSYJDKVYCJI-UHFFFAOYSA-N n-[3-[[6-[3-(trifluoromethyl)anilino]pyrimidin-4-yl]amino]phenyl]cyclopropanecarboxamide Chemical compound FC(F)(F)C1=CC=CC(NC=2N=CN=C(NC=3C=C(NC(=O)C4CC4)C=CC=3)C=2)=C1 YOHYSYJDKVYCJI-UHFFFAOYSA-N 0.000 description 1
- 239000002086 nanomaterial Substances 0.000 description 1
- 239000013642 negative control Substances 0.000 description 1
- 238000004848 nephelometry Methods 0.000 description 1
- 210000005036 nerve Anatomy 0.000 description 1
- 230000001537 neural effect Effects 0.000 description 1
- 230000003472 neutralizing effect Effects 0.000 description 1
- 238000009659 non-destructive testing Methods 0.000 description 1
- 230000000683 nonmetastatic effect Effects 0.000 description 1
- 230000009871 nonspecific binding Effects 0.000 description 1
- 238000002414 normal-phase solid-phase extraction Methods 0.000 description 1
- 238000010606 normalization Methods 0.000 description 1
- 238000001821 nucleic acid purification Methods 0.000 description 1
- 239000002777 nucleoside Substances 0.000 description 1
- 150000003833 nucleoside derivatives Chemical class 0.000 description 1
- 235000003715 nutritional status Nutrition 0.000 description 1
- 229920001778 nylon Polymers 0.000 description 1
- 125000001209 o-nitrophenyl group Chemical group [H]C1=C([H])C(*)=C(C([H])=C1[H])[N+]([O-])=O 0.000 description 1
- 235000020824 obesity Nutrition 0.000 description 1
- 238000005580 one pot reaction Methods 0.000 description 1
- 230000005693 optoelectronics Effects 0.000 description 1
- 239000003960 organic solvent Substances 0.000 description 1
- 125000001181 organosilyl group Chemical group [SiH3]* 0.000 description 1
- 230000001151 other effect Effects 0.000 description 1
- 230000002611 ovarian Effects 0.000 description 1
- 238000004806 packaging method and process Methods 0.000 description 1
- 238000003909 pattern recognition Methods 0.000 description 1
- 230000035515 penetration Effects 0.000 description 1
- 230000008447 perception Effects 0.000 description 1
- 210000005259 peripheral blood Anatomy 0.000 description 1
- 239000011886 peripheral blood Substances 0.000 description 1
- 239000012071 phase Substances 0.000 description 1
- NBIIXXVUZAFLBC-UHFFFAOYSA-K phosphate Chemical group [O-]P([O-])([O-])=O NBIIXXVUZAFLBC-UHFFFAOYSA-K 0.000 description 1
- 239000010452 phosphate Chemical group 0.000 description 1
- 239000002953 phosphate buffered saline Substances 0.000 description 1
- 125000002467 phosphate group Chemical group [H]OP(=O)(O[H])O[*] 0.000 description 1
- 150000004713 phosphodiesters Chemical class 0.000 description 1
- 229910052698 phosphorus Inorganic materials 0.000 description 1
- 239000003757 phosphotransferase inhibitor Substances 0.000 description 1
- 230000000704 physical effect Effects 0.000 description 1
- 230000004962 physiological condition Effects 0.000 description 1
- 102000005162 pleiotrophin Human genes 0.000 description 1
- 238000000711 polarimetry Methods 0.000 description 1
- 229920000729 poly(L-lysine) polymer Polymers 0.000 description 1
- 229920002492 poly(sulfone) Polymers 0.000 description 1
- 229920001223 polyethylene glycol Polymers 0.000 description 1
- 229920001296 polysiloxane Polymers 0.000 description 1
- 229920001343 polytetrafluoroethylene Polymers 0.000 description 1
- 239000004810 polytetrafluoroethylene Substances 0.000 description 1
- 239000004814 polyurethane Substances 0.000 description 1
- 229920002635 polyurethane Polymers 0.000 description 1
- 239000004800 polyvinyl chloride Substances 0.000 description 1
- 230000001124 posttranscriptional effect Effects 0.000 description 1
- 235000015497 potassium bicarbonate Nutrition 0.000 description 1
- 229910000028 potassium bicarbonate Inorganic materials 0.000 description 1
- 239000011736 potassium bicarbonate Substances 0.000 description 1
- TYJJADVDDVDEDZ-UHFFFAOYSA-M potassium hydrogencarbonate Chemical compound [K+].OC([O-])=O TYJJADVDDVDEDZ-UHFFFAOYSA-M 0.000 description 1
- 238000002203 pretreatment Methods 0.000 description 1
- 239000013615 primer Substances 0.000 description 1
- 239000002987 primer (paints) Substances 0.000 description 1
- 108010008064 pro-brain natriuretic peptide (1-76) Proteins 0.000 description 1
- CWCXERYKLSEGEZ-KDKHKZEGSA-N procalcitonin Chemical compound C([C@@H](C(=O)N1CCC[C@H]1C(=O)N[C@@H](CCC(N)=O)C(=O)N[C@H](C(=O)N[C@@H](C)C(=O)N[C@@H]([C@@H](C)CC)C(=O)NCC(=O)N[C@@H](C(C)C)C(=O)NCC(=O)N[C@@H](C)C(=O)N1[C@@H](CCC1)C(=O)NCC(O)=O)[C@@H](C)O)NC(=O)[C@@H](NC(=O)[C@H](CC=1NC=NC=1)NC(=O)[C@H](CC=1C=CC=CC=1)NC(=O)[C@H](CCCCN)NC(=O)[C@H](CC(N)=O)NC(=O)[C@H](CC=1C=CC=CC=1)NC(=O)[C@H](CC(O)=O)NC(=O)[C@H](CCC(N)=O)NC(=O)[C@@H](NC(=O)[C@H](CC=1C=CC(O)=CC=1)NC(=O)[C@@H](NC(=O)CNC(=O)[C@H](CC(C)C)NC(=O)[C@H](CCSC)NC(=O)[C@H]1NC(=O)[C@H]([C@@H](C)O)NC(=O)[C@H](CO)NC(=O)[C@H](CC(C)C)NC(=O)[C@H](CC(N)=O)NC(=O)CNC(=O)[C@@H](N)CSSC1)[C@@H](C)O)[C@@H](C)O)[C@@H](C)O)C1=CC=CC=C1 CWCXERYKLSEGEZ-KDKHKZEGSA-N 0.000 description 1
- 239000000186 progesterone Substances 0.000 description 1
- 229960003387 progesterone Drugs 0.000 description 1
- 150000003180 prostaglandins Chemical class 0.000 description 1
- 210000002307 prostate Anatomy 0.000 description 1
- 108010043671 prostatic acid phosphatase Chemical class 0.000 description 1
- 238000000159 protein binding assay Methods 0.000 description 1
- 239000012474 protein marker Substances 0.000 description 1
- 230000004850 protein–protein interaction Effects 0.000 description 1
- 239000002510 pyrogen Substances 0.000 description 1
- 238000013441 quality evaluation Methods 0.000 description 1
- 238000011158 quantitative evaluation Methods 0.000 description 1
- 239000002096 quantum dot Substances 0.000 description 1
- 238000006862 quantum yield reaction Methods 0.000 description 1
- 238000010791 quenching Methods 0.000 description 1
- 230000005258 radioactive decay Effects 0.000 description 1
- 230000002285 radioactive effect Effects 0.000 description 1
- 238000003127 radioimmunoassay Methods 0.000 description 1
- 238000011897 real-time detection Methods 0.000 description 1
- 108091008598 receptor tyrosine kinases Proteins 0.000 description 1
- 102000027426 receptor tyrosine kinases Human genes 0.000 description 1
- 230000006798 recombination Effects 0.000 description 1
- 238000005215 recombination Methods 0.000 description 1
- 238000000611 regression analysis Methods 0.000 description 1
- 230000000246 remedial effect Effects 0.000 description 1
- 238000009877 rendering Methods 0.000 description 1
- 239000011347 resin Substances 0.000 description 1
- 229920005989 resin Polymers 0.000 description 1
- 230000000241 respiratory effect Effects 0.000 description 1
- 230000036387 respiratory rate Effects 0.000 description 1
- 230000002441 reversible effect Effects 0.000 description 1
- 238000012552 review Methods 0.000 description 1
- PYWVYCXTNDRMGF-UHFFFAOYSA-N rhodamine B Chemical compound [Cl-].C=12C=CC(=[N+](CC)CC)C=C2OC2=CC(N(CC)CC)=CC=C2C=1C1=CC=CC=C1C(O)=O PYWVYCXTNDRMGF-UHFFFAOYSA-N 0.000 description 1
- WHALSQRTWNBBCV-UHFFFAOYSA-N s-aminosulfanylthiohydroxylamine Chemical compound NSSN WHALSQRTWNBBCV-UHFFFAOYSA-N 0.000 description 1
- 239000012266 salt solution Substances 0.000 description 1
- 150000003839 salts Chemical class 0.000 description 1
- 238000003118 sandwich ELISA Methods 0.000 description 1
- 238000004621 scanning probe microscopy Methods 0.000 description 1
- 150000003341 sedoheptuloses Chemical class 0.000 description 1
- 230000011218 segmentation Effects 0.000 description 1
- 239000004065 semiconductor Substances 0.000 description 1
- 238000011896 sensitive detection Methods 0.000 description 1
- 239000010703 silicon Substances 0.000 description 1
- 229910052709 silver Inorganic materials 0.000 description 1
- 239000004332 silver Substances 0.000 description 1
- 238000004088 simulation Methods 0.000 description 1
- 210000003491 skin Anatomy 0.000 description 1
- 229940126586 small molecule drug Drugs 0.000 description 1
- 229910001415 sodium ion Inorganic materials 0.000 description 1
- 159000000000 sodium salts Chemical class 0.000 description 1
- HDARHUHTZKLJET-UHFFFAOYSA-M sodium;3-(n-ethyl-3,5-dimethoxyanilino)-2-hydroxypropane-1-sulfonate Chemical compound [Na+].[O-]S(=O)(=O)CC(O)CN(CC)C1=CC(OC)=CC(OC)=C1 HDARHUHTZKLJET-UHFFFAOYSA-M 0.000 description 1
- 238000000956 solid--liquid extraction Methods 0.000 description 1
- 239000002904 solvent Substances 0.000 description 1
- 238000012306 spectroscopic technique Methods 0.000 description 1
- 239000003381 stabilizer Substances 0.000 description 1
- 229940037648 staphylococcus simulans Drugs 0.000 description 1
- 238000007619 statistical method Methods 0.000 description 1
- 239000003270 steroid hormone Substances 0.000 description 1
- 229910052682 stishovite Inorganic materials 0.000 description 1
- 125000001424 substituent group Chemical group 0.000 description 1
- 238000003239 susceptibility assay Methods 0.000 description 1
- 238000003786 synthesis reaction Methods 0.000 description 1
- 208000006379 syphilis Diseases 0.000 description 1
- 230000026676 system process Effects 0.000 description 1
- BFKJFAAPBSQJPD-UHFFFAOYSA-N tetrafluoroethene Chemical group FC(F)=C(F)F BFKJFAAPBSQJPD-UHFFFAOYSA-N 0.000 description 1
- WGTODYJZXSJIAG-UHFFFAOYSA-N tetramethylrhodamine chloride Chemical compound [Cl-].C=12C=CC(N(C)C)=CC2=[O+]C2=CC(N(C)C)=CC=C2C=1C1=CC=CC=C1C(O)=O WGTODYJZXSJIAG-UHFFFAOYSA-N 0.000 description 1
- UEUXEKPTXMALOB-UHFFFAOYSA-J tetrasodium;2-[2-[bis(carboxylatomethyl)amino]ethyl-(carboxylatomethyl)amino]acetate Chemical compound [Na+].[Na+].[Na+].[Na+].[O-]C(=O)CN(CC([O-])=O)CCN(CC([O-])=O)CC([O-])=O UEUXEKPTXMALOB-UHFFFAOYSA-J 0.000 description 1
- MPLHNVLQVRSVEE-UHFFFAOYSA-N texas red Chemical compound [O-]S(=O)(=O)C1=CC(S(Cl)(=O)=O)=CC=C1C(C1=CC=2CCCN3CCCC(C=23)=C1O1)=C2C1=C(CCC1)C3=[N+]1CCCC3=C2 MPLHNVLQVRSVEE-UHFFFAOYSA-N 0.000 description 1
- 229940126585 therapeutic drug Drugs 0.000 description 1
- 150000007970 thio esters Chemical class 0.000 description 1
- 150000003573 thiols Chemical class 0.000 description 1
- XNRNNGPBEPRNAR-JQBLCGNGSA-N thromboxane B2 Chemical compound CCCCC[C@H](O)\C=C\[C@H]1OC(O)C[C@H](O)[C@@H]1C\C=C/CCCC(O)=O XNRNNGPBEPRNAR-JQBLCGNGSA-N 0.000 description 1
- 229940034208 thyroxine Drugs 0.000 description 1
- XUIIKFGFIJCVMT-UHFFFAOYSA-N thyroxine-binding globulin Natural products IC1=CC(CC([NH3+])C([O-])=O)=CC(I)=C1OC1=CC(I)=C(O)C(I)=C1 XUIIKFGFIJCVMT-UHFFFAOYSA-N 0.000 description 1
- 229960000187 tissue plasminogen activator Drugs 0.000 description 1
- 230000001988 toxicity Effects 0.000 description 1
- 231100000419 toxicity Toxicity 0.000 description 1
- 230000002103 transcriptional effect Effects 0.000 description 1
- 239000012581 transferrin Substances 0.000 description 1
- 230000009466 transformation Effects 0.000 description 1
- 229910052905 tridymite Inorganic materials 0.000 description 1
- AUIINJJXRXMPGT-UHFFFAOYSA-K trisodium 3-hydroxy-4-[(2-hydroxy-4-sulfonatonaphthalen-1-yl)diazenyl]naphthalene-2,7-disulfonate Chemical compound [Na+].[Na+].[Na+].Oc1cc(c2ccccc2c1N=Nc1c(O)c(cc2cc(ccc12)S([O-])(=O)=O)S([O-])(=O)=O)S([O-])(=O)=O AUIINJJXRXMPGT-UHFFFAOYSA-K 0.000 description 1
- 238000007514 turning Methods 0.000 description 1
- 229940121358 tyrosine kinase inhibitor Drugs 0.000 description 1
- 239000005483 tyrosine kinase inhibitor Substances 0.000 description 1
- ORHBXUUXSCNDEV-UHFFFAOYSA-N umbelliferone Chemical compound C1=CC(=O)OC2=CC(O)=CC=C21 ORHBXUUXSCNDEV-UHFFFAOYSA-N 0.000 description 1
- HFTAFOQKODTIJY-UHFFFAOYSA-N umbelliferone Natural products Cc1cc2C=CC(=O)Oc2cc1OCC=CC(C)(C)O HFTAFOQKODTIJY-UHFFFAOYSA-N 0.000 description 1
- 241000712461 unidentified influenza virus Species 0.000 description 1
- 229940035893 uracil Drugs 0.000 description 1
- DRTQHJPVMGBUCF-UHFFFAOYSA-N uracil arabinoside Natural products OC1C(O)C(CO)OC1N1C(=O)NC(=O)C=C1 DRTQHJPVMGBUCF-UHFFFAOYSA-N 0.000 description 1
- 208000000143 urethritis Diseases 0.000 description 1
- 229940116269 uric acid Drugs 0.000 description 1
- 229940045145 uridine Drugs 0.000 description 1
- 210000003932 urinary bladder Anatomy 0.000 description 1
- 230000002485 urinary effect Effects 0.000 description 1
- VBEQCZHXXJYVRD-GACYYNSASA-N uroanthelone Chemical compound C([C@@H](C(=O)N[C@H](C(=O)N[C@@H](CS)C(=O)N[C@@H](CC(N)=O)C(=O)N[C@@H](CS)C(=O)N[C@H](C(=O)N[C@@H]([C@@H](C)CC)C(=O)NCC(=O)N[C@@H](CC=1C=CC(O)=CC=1)C(=O)N[C@@H](CO)C(=O)NCC(=O)N[C@@H](CC(O)=O)C(=O)N[C@@H](CCCNC(N)=N)C(=O)N[C@@H](CS)C(=O)N[C@@H](CCC(N)=O)C(=O)N[C@@H]([C@@H](C)O)C(=O)N[C@@H](CCCNC(N)=N)C(=O)N[C@@H](CC(O)=O)C(=O)N[C@@H](CC(C)C)C(=O)N[C@@H](CCCNC(N)=N)C(=O)N[C@@H](CC=1C2=CC=CC=C2NC=1)C(=O)N[C@@H](CC=1C2=CC=CC=C2NC=1)C(=O)N[C@@H](CCC(O)=O)C(=O)N[C@@H](CC(C)C)C(=O)N[C@@H](CCCNC(N)=N)C(O)=O)C(C)C)[C@@H](C)O)NC(=O)[C@H](CO)NC(=O)[C@H](CC(O)=O)NC(=O)[C@H](CC(C)C)NC(=O)[C@H](CO)NC(=O)[C@H](CCC(O)=O)NC(=O)[C@@H](NC(=O)[C@H](CC=1NC=NC=1)NC(=O)[C@H](CCSC)NC(=O)[C@H](CS)NC(=O)[C@@H](NC(=O)CNC(=O)CNC(=O)[C@H](CC(N)=O)NC(=O)[C@H](CC(C)C)NC(=O)[C@H](CS)NC(=O)[C@H](CC=1C=CC(O)=CC=1)NC(=O)CNC(=O)[C@H](CC(O)=O)NC(=O)[C@H](CC=1C=CC(O)=CC=1)NC(=O)[C@H](CO)NC(=O)[C@H](CO)NC(=O)[C@H]1N(CCC1)C(=O)[C@H](CS)NC(=O)CNC(=O)[C@H]1N(CCC1)C(=O)[C@H](CC=1C=CC(O)=CC=1)NC(=O)[C@H](CO)NC(=O)[C@@H](N)CC(N)=O)C(C)C)[C@@H](C)CC)C1=CC=C(O)C=C1 VBEQCZHXXJYVRD-GACYYNSASA-N 0.000 description 1
- 238000001291 vacuum drying Methods 0.000 description 1
- 229940124676 vascular endothelial growth factor receptor Drugs 0.000 description 1
- 230000003612 virological effect Effects 0.000 description 1
- 238000011179 visual inspection Methods 0.000 description 1
- 238000012800 visualization Methods 0.000 description 1
- 229940088594 vitamin Drugs 0.000 description 1
- 229930003231 vitamin Natural products 0.000 description 1
- 235000013343 vitamin Nutrition 0.000 description 1
- 239000011782 vitamin Substances 0.000 description 1
- 150000003722 vitamin derivatives Chemical class 0.000 description 1
- 108010047303 von Willebrand Factor Proteins 0.000 description 1
- 102100036537 von Willebrand factor Human genes 0.000 description 1
- 229960001134 von willebrand factor Drugs 0.000 description 1
- PJVWKTKQMONHTI-UHFFFAOYSA-N warfarin Chemical compound OC=1C2=CC=CC=C2OC(=O)C=1C(CC(=O)C)C1=CC=CC=C1 PJVWKTKQMONHTI-UHFFFAOYSA-N 0.000 description 1
- 229960005080 warfarin Drugs 0.000 description 1
- 239000002699 waste material Substances 0.000 description 1
- 229910052724 xenon Inorganic materials 0.000 description 1
- FHNFHKCVQCLJFQ-UHFFFAOYSA-N xenon atom Chemical compound [Xe] FHNFHKCVQCLJFQ-UHFFFAOYSA-N 0.000 description 1
- 150000003742 xyloses Chemical class 0.000 description 1
- 229910052727 yttrium Inorganic materials 0.000 description 1
- 229910052725 zinc Inorganic materials 0.000 description 1
- 239000011701 zinc Substances 0.000 description 1
Classifications
-
- G—PHYSICS
- G01—MEASURING; TESTING
- G01N—INVESTIGATING OR ANALYSING MATERIALS BY DETERMINING THEIR CHEMICAL OR PHYSICAL PROPERTIES
- G01N21/00—Investigating or analysing materials by the use of optical means, i.e. using sub-millimetre waves, infrared, visible or ultraviolet light
- G01N21/01—Arrangements or apparatus for facilitating the optical investigation
- G01N21/03—Cuvette constructions
- G01N21/0303—Optical path conditioning in cuvettes, e.g. windows; adapted optical elements or systems; path modifying or adjustment
-
- G—PHYSICS
- G01—MEASURING; TESTING
- G01J—MEASUREMENT OF INTENSITY, VELOCITY, SPECTRAL CONTENT, POLARISATION, PHASE OR PULSE CHARACTERISTICS OF INFRARED, VISIBLE OR ULTRAVIOLET LIGHT; COLORIMETRY; RADIATION PYROMETRY
- G01J3/00—Spectrometry; Spectrophotometry; Monochromators; Measuring colours
- G01J3/28—Investigating the spectrum
- G01J3/42—Absorption spectrometry; Double beam spectrometry; Flicker spectrometry; Reflection spectrometry
-
- B—PERFORMING OPERATIONS; TRANSPORTING
- B01—PHYSICAL OR CHEMICAL PROCESSES OR APPARATUS IN GENERAL
- B01L—CHEMICAL OR PHYSICAL LABORATORY APPARATUS FOR GENERAL USE
- B01L3/00—Containers or dishes for laboratory use, e.g. laboratory glassware; Droppers
- B01L3/02—Burettes; Pipettes
- B01L3/0275—Interchangeable or disposable dispensing tips
-
- B—PERFORMING OPERATIONS; TRANSPORTING
- B04—CENTRIFUGAL APPARATUS OR MACHINES FOR CARRYING-OUT PHYSICAL OR CHEMICAL PROCESSES
- B04B—CENTRIFUGES
- B04B5/00—Other centrifuges
- B04B5/04—Radial chamber apparatus for separating predominantly liquid mixtures, e.g. butyrometers
- B04B5/0407—Radial chamber apparatus for separating predominantly liquid mixtures, e.g. butyrometers for liquids contained in receptacles
- B04B5/0414—Radial chamber apparatus for separating predominantly liquid mixtures, e.g. butyrometers for liquids contained in receptacles comprising test tubes
- B04B5/0421—Radial chamber apparatus for separating predominantly liquid mixtures, e.g. butyrometers for liquids contained in receptacles comprising test tubes pivotably mounted
-
- C—CHEMISTRY; METALLURGY
- C12—BIOCHEMISTRY; BEER; SPIRITS; WINE; VINEGAR; MICROBIOLOGY; ENZYMOLOGY; MUTATION OR GENETIC ENGINEERING
- C12Q—MEASURING OR TESTING PROCESSES INVOLVING ENZYMES, NUCLEIC ACIDS OR MICROORGANISMS; COMPOSITIONS OR TEST PAPERS THEREFOR; PROCESSES OF PREPARING SUCH COMPOSITIONS; CONDITION-RESPONSIVE CONTROL IN MICROBIOLOGICAL OR ENZYMOLOGICAL PROCESSES
- C12Q1/00—Measuring or testing processes involving enzymes, nucleic acids or microorganisms; Compositions therefor; Processes of preparing such compositions
- C12Q1/34—Measuring or testing processes involving enzymes, nucleic acids or microorganisms; Compositions therefor; Processes of preparing such compositions involving hydrolase
- C12Q1/42—Measuring or testing processes involving enzymes, nucleic acids or microorganisms; Compositions therefor; Processes of preparing such compositions involving hydrolase involving phosphatase
-
- C—CHEMISTRY; METALLURGY
- C12—BIOCHEMISTRY; BEER; SPIRITS; WINE; VINEGAR; MICROBIOLOGY; ENZYMOLOGY; MUTATION OR GENETIC ENGINEERING
- C12Q—MEASURING OR TESTING PROCESSES INVOLVING ENZYMES, NUCLEIC ACIDS OR MICROORGANISMS; COMPOSITIONS OR TEST PAPERS THEREFOR; PROCESSES OF PREPARING SUCH COMPOSITIONS; CONDITION-RESPONSIVE CONTROL IN MICROBIOLOGICAL OR ENZYMOLOGICAL PROCESSES
- C12Q1/00—Measuring or testing processes involving enzymes, nucleic acids or microorganisms; Compositions therefor; Processes of preparing such compositions
- C12Q1/48—Measuring or testing processes involving enzymes, nucleic acids or microorganisms; Compositions therefor; Processes of preparing such compositions involving transferase
- C12Q1/52—Measuring or testing processes involving enzymes, nucleic acids or microorganisms; Compositions therefor; Processes of preparing such compositions involving transferase involving transaminase
-
- C—CHEMISTRY; METALLURGY
- C12—BIOCHEMISTRY; BEER; SPIRITS; WINE; VINEGAR; MICROBIOLOGY; ENZYMOLOGY; MUTATION OR GENETIC ENGINEERING
- C12Q—MEASURING OR TESTING PROCESSES INVOLVING ENZYMES, NUCLEIC ACIDS OR MICROORGANISMS; COMPOSITIONS OR TEST PAPERS THEREFOR; PROCESSES OF PREPARING SUCH COMPOSITIONS; CONDITION-RESPONSIVE CONTROL IN MICROBIOLOGICAL OR ENZYMOLOGICAL PROCESSES
- C12Q1/00—Measuring or testing processes involving enzymes, nucleic acids or microorganisms; Compositions therefor; Processes of preparing such compositions
- C12Q1/68—Measuring or testing processes involving enzymes, nucleic acids or microorganisms; Compositions therefor; Processes of preparing such compositions involving nucleic acids
- C12Q1/6806—Preparing nucleic acids for analysis, e.g. for polymerase chain reaction [PCR] assay
-
- C—CHEMISTRY; METALLURGY
- C12—BIOCHEMISTRY; BEER; SPIRITS; WINE; VINEGAR; MICROBIOLOGY; ENZYMOLOGY; MUTATION OR GENETIC ENGINEERING
- C12Q—MEASURING OR TESTING PROCESSES INVOLVING ENZYMES, NUCLEIC ACIDS OR MICROORGANISMS; COMPOSITIONS OR TEST PAPERS THEREFOR; PROCESSES OF PREPARING SUCH COMPOSITIONS; CONDITION-RESPONSIVE CONTROL IN MICROBIOLOGICAL OR ENZYMOLOGICAL PROCESSES
- C12Q1/00—Measuring or testing processes involving enzymes, nucleic acids or microorganisms; Compositions therefor; Processes of preparing such compositions
- C12Q1/68—Measuring or testing processes involving enzymes, nucleic acids or microorganisms; Compositions therefor; Processes of preparing such compositions involving nucleic acids
- C12Q1/6809—Methods for determination or identification of nucleic acids involving differential detection
-
- C—CHEMISTRY; METALLURGY
- C12—BIOCHEMISTRY; BEER; SPIRITS; WINE; VINEGAR; MICROBIOLOGY; ENZYMOLOGY; MUTATION OR GENETIC ENGINEERING
- C12Q—MEASURING OR TESTING PROCESSES INVOLVING ENZYMES, NUCLEIC ACIDS OR MICROORGANISMS; COMPOSITIONS OR TEST PAPERS THEREFOR; PROCESSES OF PREPARING SUCH COMPOSITIONS; CONDITION-RESPONSIVE CONTROL IN MICROBIOLOGICAL OR ENZYMOLOGICAL PROCESSES
- C12Q1/00—Measuring or testing processes involving enzymes, nucleic acids or microorganisms; Compositions therefor; Processes of preparing such compositions
- C12Q1/68—Measuring or testing processes involving enzymes, nucleic acids or microorganisms; Compositions therefor; Processes of preparing such compositions involving nucleic acids
- C12Q1/6876—Nucleic acid products used in the analysis of nucleic acids, e.g. primers or probes
- C12Q1/6888—Nucleic acid products used in the analysis of nucleic acids, e.g. primers or probes for detection or identification of organisms
- C12Q1/689—Nucleic acid products used in the analysis of nucleic acids, e.g. primers or probes for detection or identification of organisms for bacteria
-
- G—PHYSICS
- G01—MEASURING; TESTING
- G01N—INVESTIGATING OR ANALYSING MATERIALS BY DETERMINING THEIR CHEMICAL OR PHYSICAL PROPERTIES
- G01N1/00—Sampling; Preparing specimens for investigation
- G01N1/28—Preparing specimens for investigation including physical details of (bio-)chemical methods covered elsewhere, e.g. G01N33/50, C12Q
- G01N1/40—Concentrating samples
- G01N1/4077—Concentrating samples by other techniques involving separation of suspended solids
-
- G—PHYSICS
- G01—MEASURING; TESTING
- G01N—INVESTIGATING OR ANALYSING MATERIALS BY DETERMINING THEIR CHEMICAL OR PHYSICAL PROPERTIES
- G01N21/00—Investigating or analysing materials by the use of optical means, i.e. using sub-millimetre waves, infrared, visible or ultraviolet light
-
- G—PHYSICS
- G01—MEASURING; TESTING
- G01N—INVESTIGATING OR ANALYSING MATERIALS BY DETERMINING THEIR CHEMICAL OR PHYSICAL PROPERTIES
- G01N21/00—Investigating or analysing materials by the use of optical means, i.e. using sub-millimetre waves, infrared, visible or ultraviolet light
- G01N21/01—Arrangements or apparatus for facilitating the optical investigation
- G01N21/03—Cuvette constructions
- G01N21/05—Flow-through cuvettes
-
- G—PHYSICS
- G01—MEASURING; TESTING
- G01N—INVESTIGATING OR ANALYSING MATERIALS BY DETERMINING THEIR CHEMICAL OR PHYSICAL PROPERTIES
- G01N21/00—Investigating or analysing materials by the use of optical means, i.e. using sub-millimetre waves, infrared, visible or ultraviolet light
- G01N21/17—Systems in which incident light is modified in accordance with the properties of the material investigated
- G01N21/47—Scattering, i.e. diffuse reflection
- G01N21/49—Scattering, i.e. diffuse reflection within a body or fluid
- G01N21/51—Scattering, i.e. diffuse reflection within a body or fluid inside a container, e.g. in an ampoule
-
- G—PHYSICS
- G01—MEASURING; TESTING
- G01N—INVESTIGATING OR ANALYSING MATERIALS BY DETERMINING THEIR CHEMICAL OR PHYSICAL PROPERTIES
- G01N21/00—Investigating or analysing materials by the use of optical means, i.e. using sub-millimetre waves, infrared, visible or ultraviolet light
- G01N21/17—Systems in which incident light is modified in accordance with the properties of the material investigated
- G01N21/59—Transmissivity
-
- G—PHYSICS
- G01—MEASURING; TESTING
- G01N—INVESTIGATING OR ANALYSING MATERIALS BY DETERMINING THEIR CHEMICAL OR PHYSICAL PROPERTIES
- G01N33/00—Investigating or analysing materials by specific methods not covered by groups G01N1/00 - G01N31/00
- G01N33/48—Biological material, e.g. blood, urine; Haemocytometers
- G01N33/50—Chemical analysis of biological material, e.g. blood, urine; Testing involving biospecific ligand binding methods; Immunological testing
- G01N33/53—Immunoassay; Biospecific binding assay; Materials therefor
- G01N33/5308—Immunoassay; Biospecific binding assay; Materials therefor for analytes not provided for elsewhere, e.g. nucleic acids, uric acid, worms, mites
-
- G—PHYSICS
- G01—MEASURING; TESTING
- G01N—INVESTIGATING OR ANALYSING MATERIALS BY DETERMINING THEIR CHEMICAL OR PHYSICAL PROPERTIES
- G01N33/00—Investigating or analysing materials by specific methods not covered by groups G01N1/00 - G01N31/00
- G01N33/48—Biological material, e.g. blood, urine; Haemocytometers
- G01N33/50—Chemical analysis of biological material, e.g. blood, urine; Testing involving biospecific ligand binding methods; Immunological testing
- G01N33/53—Immunoassay; Biospecific binding assay; Materials therefor
- G01N33/543—Immunoassay; Biospecific binding assay; Materials therefor with an insoluble carrier for immobilising immunochemicals
- G01N33/54313—Immunoassay; Biospecific binding assay; Materials therefor with an insoluble carrier for immobilising immunochemicals the carrier being characterised by its particulate form
- G01N33/54326—Magnetic particles
-
- G—PHYSICS
- G01—MEASURING; TESTING
- G01N—INVESTIGATING OR ANALYSING MATERIALS BY DETERMINING THEIR CHEMICAL OR PHYSICAL PROPERTIES
- G01N33/00—Investigating or analysing materials by specific methods not covered by groups G01N1/00 - G01N31/00
- G01N33/48—Biological material, e.g. blood, urine; Haemocytometers
- G01N33/50—Chemical analysis of biological material, e.g. blood, urine; Testing involving biospecific ligand binding methods; Immunological testing
- G01N33/53—Immunoassay; Biospecific binding assay; Materials therefor
- G01N33/543—Immunoassay; Biospecific binding assay; Materials therefor with an insoluble carrier for immobilising immunochemicals
- G01N33/54393—Improving reaction conditions or stability, e.g. by coating or irradiation of surface, by reduction of non-specific binding, by promotion of specific binding
-
- G—PHYSICS
- G01—MEASURING; TESTING
- G01N—INVESTIGATING OR ANALYSING MATERIALS BY DETERMINING THEIR CHEMICAL OR PHYSICAL PROPERTIES
- G01N33/00—Investigating or analysing materials by specific methods not covered by groups G01N1/00 - G01N31/00
- G01N33/48—Biological material, e.g. blood, urine; Haemocytometers
- G01N33/50—Chemical analysis of biological material, e.g. blood, urine; Testing involving biospecific ligand binding methods; Immunological testing
- G01N33/53—Immunoassay; Biospecific binding assay; Materials therefor
- G01N33/569—Immunoassay; Biospecific binding assay; Materials therefor for microorganisms, e.g. protozoa, bacteria, viruses
- G01N33/56966—Animal cells
- G01N33/56972—White blood cells
-
- G—PHYSICS
- G01—MEASURING; TESTING
- G01N—INVESTIGATING OR ANALYSING MATERIALS BY DETERMINING THEIR CHEMICAL OR PHYSICAL PROPERTIES
- G01N33/00—Investigating or analysing materials by specific methods not covered by groups G01N1/00 - G01N31/00
- G01N33/48—Biological material, e.g. blood, urine; Haemocytometers
- G01N33/50—Chemical analysis of biological material, e.g. blood, urine; Testing involving biospecific ligand binding methods; Immunological testing
- G01N33/53—Immunoassay; Biospecific binding assay; Materials therefor
- G01N33/569—Immunoassay; Biospecific binding assay; Materials therefor for microorganisms, e.g. protozoa, bacteria, viruses
- G01N33/56983—Viruses
-
- G—PHYSICS
- G01—MEASURING; TESTING
- G01N—INVESTIGATING OR ANALYSING MATERIALS BY DETERMINING THEIR CHEMICAL OR PHYSICAL PROPERTIES
- G01N33/00—Investigating or analysing materials by specific methods not covered by groups G01N1/00 - G01N31/00
- G01N33/48—Biological material, e.g. blood, urine; Haemocytometers
- G01N33/50—Chemical analysis of biological material, e.g. blood, urine; Testing involving biospecific ligand binding methods; Immunological testing
- G01N33/53—Immunoassay; Biospecific binding assay; Materials therefor
- G01N33/573—Immunoassay; Biospecific binding assay; Materials therefor for enzymes or isoenzymes
-
- G—PHYSICS
- G01—MEASURING; TESTING
- G01N—INVESTIGATING OR ANALYSING MATERIALS BY DETERMINING THEIR CHEMICAL OR PHYSICAL PROPERTIES
- G01N33/00—Investigating or analysing materials by specific methods not covered by groups G01N1/00 - G01N31/00
- G01N33/48—Biological material, e.g. blood, urine; Haemocytometers
- G01N33/50—Chemical analysis of biological material, e.g. blood, urine; Testing involving biospecific ligand binding methods; Immunological testing
- G01N33/74—Chemical analysis of biological material, e.g. blood, urine; Testing involving biospecific ligand binding methods; Immunological testing involving hormones or other non-cytokine intercellular protein regulatory factors such as growth factors, including receptors to hormones and growth factors
- G01N33/743—Steroid hormones
-
- G—PHYSICS
- G01—MEASURING; TESTING
- G01N—INVESTIGATING OR ANALYSING MATERIALS BY DETERMINING THEIR CHEMICAL OR PHYSICAL PROPERTIES
- G01N33/00—Investigating or analysing materials by specific methods not covered by groups G01N1/00 - G01N31/00
- G01N33/48—Biological material, e.g. blood, urine; Haemocytometers
- G01N33/50—Chemical analysis of biological material, e.g. blood, urine; Testing involving biospecific ligand binding methods; Immunological testing
- G01N33/80—Chemical analysis of biological material, e.g. blood, urine; Testing involving biospecific ligand binding methods; Immunological testing involving blood groups or blood types or red blood cells
-
- G—PHYSICS
- G01—MEASURING; TESTING
- G01N—INVESTIGATING OR ANALYSING MATERIALS BY DETERMINING THEIR CHEMICAL OR PHYSICAL PROPERTIES
- G01N33/00—Investigating or analysing materials by specific methods not covered by groups G01N1/00 - G01N31/00
- G01N33/48—Biological material, e.g. blood, urine; Haemocytometers
- G01N33/50—Chemical analysis of biological material, e.g. blood, urine; Testing involving biospecific ligand binding methods; Immunological testing
- G01N33/82—Chemical analysis of biological material, e.g. blood, urine; Testing involving biospecific ligand binding methods; Immunological testing involving vitamins or their receptors
-
- G—PHYSICS
- G01—MEASURING; TESTING
- G01N—INVESTIGATING OR ANALYSING MATERIALS BY DETERMINING THEIR CHEMICAL OR PHYSICAL PROPERTIES
- G01N33/00—Investigating or analysing materials by specific methods not covered by groups G01N1/00 - G01N31/00
- G01N33/48—Biological material, e.g. blood, urine; Haemocytometers
- G01N33/50—Chemical analysis of biological material, e.g. blood, urine; Testing involving biospecific ligand binding methods; Immunological testing
- G01N33/92—Chemical analysis of biological material, e.g. blood, urine; Testing involving biospecific ligand binding methods; Immunological testing involving lipids, e.g. cholesterol, lipoproteins, or their receptors
-
- G—PHYSICS
- G01—MEASURING; TESTING
- G01N—INVESTIGATING OR ANALYSING MATERIALS BY DETERMINING THEIR CHEMICAL OR PHYSICAL PROPERTIES
- G01N35/00—Automatic analysis not limited to methods or materials provided for in any single one of groups G01N1/00 - G01N33/00; Handling materials therefor
- G01N35/10—Devices for transferring samples or any liquids to, in, or from, the analysis apparatus, e.g. suction devices, injection devices
-
- G—PHYSICS
- G06—COMPUTING; CALCULATING OR COUNTING
- G06T—IMAGE DATA PROCESSING OR GENERATION, IN GENERAL
- G06T3/00—Geometric image transformation in the plane of the image
- G06T3/40—Scaling the whole image or part thereof
- G06T3/4084—Transform-based scaling, e.g. FFT domain scaling
-
- G—PHYSICS
- G06—COMPUTING; CALCULATING OR COUNTING
- G06T—IMAGE DATA PROCESSING OR GENERATION, IN GENERAL
- G06T7/00—Image analysis
- G06T7/0002—Inspection of images, e.g. flaw detection
-
- G—PHYSICS
- G06—COMPUTING; CALCULATING OR COUNTING
- G06T—IMAGE DATA PROCESSING OR GENERATION, IN GENERAL
- G06T7/00—Image analysis
- G06T7/0002—Inspection of images, e.g. flaw detection
- G06T7/0012—Biomedical image inspection
-
- H—ELECTRICITY
- H04—ELECTRIC COMMUNICATION TECHNIQUE
- H04N—PICTORIAL COMMUNICATION, e.g. TELEVISION
- H04N23/00—Cameras or camera modules comprising electronic image sensors; Control thereof
- H04N23/60—Control of cameras or camera modules
- H04N23/64—Computer-aided capture of images, e.g. transfer from script file into camera, check of taken image quality, advice or proposal for image composition or decision on when to take image
-
- B—PERFORMING OPERATIONS; TRANSPORTING
- B01—PHYSICAL OR CHEMICAL PROCESSES OR APPARATUS IN GENERAL
- B01L—CHEMICAL OR PHYSICAL LABORATORY APPARATUS FOR GENERAL USE
- B01L2300/00—Additional constructional details
- B01L2300/16—Surface properties and coatings
- B01L2300/168—Specific optical properties, e.g. reflective coatings
-
- C—CHEMISTRY; METALLURGY
- C12—BIOCHEMISTRY; BEER; SPIRITS; WINE; VINEGAR; MICROBIOLOGY; ENZYMOLOGY; MUTATION OR GENETIC ENGINEERING
- C12Q—MEASURING OR TESTING PROCESSES INVOLVING ENZYMES, NUCLEIC ACIDS OR MICROORGANISMS; COMPOSITIONS OR TEST PAPERS THEREFOR; PROCESSES OF PREPARING SUCH COMPOSITIONS; CONDITION-RESPONSIVE CONTROL IN MICROBIOLOGICAL OR ENZYMOLOGICAL PROCESSES
- C12Q2600/00—Oligonucleotides characterized by their use
- C12Q2600/158—Expression markers
-
- G—PHYSICS
- G01—MEASURING; TESTING
- G01N—INVESTIGATING OR ANALYSING MATERIALS BY DETERMINING THEIR CHEMICAL OR PHYSICAL PROPERTIES
- G01N1/00—Sampling; Preparing specimens for investigation
- G01N1/28—Preparing specimens for investigation including physical details of (bio-)chemical methods covered elsewhere, e.g. G01N33/50, C12Q
- G01N1/40—Concentrating samples
- G01N1/4077—Concentrating samples by other techniques involving separation of suspended solids
- G01N2001/4083—Concentrating samples by other techniques involving separation of suspended solids sedimentation
-
- G—PHYSICS
- G01—MEASURING; TESTING
- G01N—INVESTIGATING OR ANALYSING MATERIALS BY DETERMINING THEIR CHEMICAL OR PHYSICAL PROPERTIES
- G01N35/00—Automatic analysis not limited to methods or materials provided for in any single one of groups G01N1/00 - G01N33/00; Handling materials therefor
- G01N2035/00465—Separating and mixing arrangements
- G01N2035/00495—Centrifuges
-
- G—PHYSICS
- G01—MEASURING; TESTING
- G01N—INVESTIGATING OR ANALYSING MATERIALS BY DETERMINING THEIR CHEMICAL OR PHYSICAL PROPERTIES
- G01N35/00—Automatic analysis not limited to methods or materials provided for in any single one of groups G01N1/00 - G01N33/00; Handling materials therefor
- G01N35/10—Devices for transferring samples or any liquids to, in, or from, the analysis apparatus, e.g. suction devices, injection devices
- G01N35/1009—Characterised by arrangements for controlling the aspiration or dispense of liquids
- G01N35/1016—Control of the volume dispensed or introduced
- G01N2035/1018—Detecting inhomogeneities, e.g. foam, bubbles, clots
-
- G—PHYSICS
- G01—MEASURING; TESTING
- G01N—INVESTIGATING OR ANALYSING MATERIALS BY DETERMINING THEIR CHEMICAL OR PHYSICAL PROPERTIES
- G01N2333/00—Assays involving biological materials from specific organisms or of a specific nature
- G01N2333/435—Assays involving biological materials from specific organisms or of a specific nature from animals; from humans
- G01N2333/575—Hormones
- G01N2333/62—Insulins
-
- G—PHYSICS
- G01—MEASURING; TESTING
- G01N—INVESTIGATING OR ANALYSING MATERIALS BY DETERMINING THEIR CHEMICAL OR PHYSICAL PROPERTIES
- G01N2333/00—Assays involving biological materials from specific organisms or of a specific nature
- G01N2333/90—Enzymes; Proenzymes
- G01N2333/91—Transferases (2.)
- G01N2333/91188—Transferases (2.) transferring nitrogenous groups (2.6)
-
- G—PHYSICS
- G01—MEASURING; TESTING
- G01N—INVESTIGATING OR ANALYSING MATERIALS BY DETERMINING THEIR CHEMICAL OR PHYSICAL PROPERTIES
- G01N2333/00—Assays involving biological materials from specific organisms or of a specific nature
- G01N2333/90—Enzymes; Proenzymes
- G01N2333/914—Hydrolases (3)
- G01N2333/948—Hydrolases (3) acting on peptide bonds (3.4)
- G01N2333/95—Proteinases, i.e. endopeptidases (3.4.21-3.4.99)
- G01N2333/964—Proteinases, i.e. endopeptidases (3.4.21-3.4.99) derived from animal tissue
- G01N2333/96425—Proteinases, i.e. endopeptidases (3.4.21-3.4.99) derived from animal tissue from mammals
- G01N2333/96427—Proteinases, i.e. endopeptidases (3.4.21-3.4.99) derived from animal tissue from mammals in general
- G01N2333/9643—Proteinases, i.e. endopeptidases (3.4.21-3.4.99) derived from animal tissue from mammals in general with EC number
- G01N2333/96433—Serine endopeptidases (3.4.21)
- G01N2333/96441—Serine endopeptidases (3.4.21) with definite EC number
- G01N2333/96463—Blood coagulation factors not provided for in a preceding group or according to more than one of the proceeding groups
-
- G—PHYSICS
- G06—COMPUTING; CALCULATING OR COUNTING
- G06T—IMAGE DATA PROCESSING OR GENERATION, IN GENERAL
- G06T2207/00—Indexing scheme for image analysis or image enhancement
- G06T2207/30—Subject of image; Context of image processing
- G06T2207/30004—Biomedical image processing
-
- G—PHYSICS
- G06—COMPUTING; CALCULATING OR COUNTING
- G06T—IMAGE DATA PROCESSING OR GENERATION, IN GENERAL
- G06T2207/00—Indexing scheme for image analysis or image enhancement
- G06T2207/30—Subject of image; Context of image processing
- G06T2207/30168—Image quality inspection
-
- G—PHYSICS
- G16—INFORMATION AND COMMUNICATION TECHNOLOGY [ICT] SPECIALLY ADAPTED FOR SPECIFIC APPLICATION FIELDS
- G16C—COMPUTATIONAL CHEMISTRY; CHEMOINFORMATICS; COMPUTATIONAL MATERIALS SCIENCE
- G16C20/00—Chemoinformatics, i.e. ICT specially adapted for the handling of physicochemical or structural data of chemical particles, elements, compounds or mixtures
- G16C20/20—Identification of molecular entities, parts thereof or of chemical compositions
Definitions
- Diagnosis and treatment of diseases can take advantage of multiplexed biomarker measurements, which provide additional knowledge of the condition of a patient. For example, when monitoring the effects of a drug, three or more biomarkers can be measured in parallel.
- microtiter plates and other similar apparatuses have been used to perform multiplexed separation-based assays.
- a microtiter plate (for example, a 384 well microtiter plate) can perform a large number of assays in parallel.
- POC Point-of-Care
- the number of assays that can be performed in parallel is often limited by the size of the device and the volume of the sample to be analyzed. In many POC devices, the number assays performed is about 1 to 10. A POC device capable of performing multiplexed assays on a small sample would be desirable.
- a shortcoming of many multiplexed POC assay devices is the high cost of manufacturing the components of the device. If the device is disposable, the cost of the components can make the manufacturing of a POC device impractical. Further, for multiplexed POC devices that incorporate all of the necessary reagents onboard of the device, if any one of those reagents exhibit instability, an entire manufactured lot of devices may have to be discarded even if all the other reagents are still usable.
- POC methods have proven to be very valuable in monitoring disease and therapy (for example, blood glucose systems in diabetes therapy, Prothrombin Time measurement in anticoagulant therapy using Warfarin). By measuring multiple markers, it is believed that complex diseases (such as cancer) for which multi-drug therapies are required can be better monitored and controlled.
- the present invention addresses the aforementioned needs and provides related advantages.
- the present invention relates to point-of-care and/or point-of-service devices. In some embodiments, the present invention relates to systems, devices, user interfaces, and methods for assaying samples using a point-of-care and/or point-of-service device.
- the devices and methods disclosed herein are designed to identify the sample type (blood versus plasma and etc.) to measure the volume of sample early enough in the assay procedure to ensure an appropriate sample is used is an intended assay.
- the present invention also allows for one to be able to correct for significant volume errors that occur in performing an assay.
- this invention allows for simultaneous measurements on several analytes of different types with high accuracy.
- An aspect of the invention may be directed to an automated system for separating one or more components in a biological fluid.
- the automated system may comprise a pipette tip or closed tube adapted to engage with an aspirator wherein said pipette tip or tube comprises two opposing ends, at least one of which is closed or sealable; and a centrifuge configured to receive said sealed pipette tip or closed tube to effect said separating of one or more components in a biological fluid.
- the one or more components are selected from the group consisting of blood plasma, blood serum, blood cells, and particulates.
- when the pipette tip is engaged with the aspirator to effect a draw of the biological fluid.
- the pipette tip has an open end that forms an airtight seal with the aspirator.
- the system further comprises an imaging device; and at least one other pipette tip dimensioned to allow dispensing of a liquid into the pipette tip or tube of (a) or to allow the aspiration of a liquid from the pipette tip or tube of (a).
- the pipette tip or closed tube is oriented vertically when the centrifuge is at rest.
- the pipette tip or closed tube is oriented horizontally when the centrifuge is spinning at a predetermined rotational velocity.
- Another aspect of the invention may be a method for isolating components in a sample comprising one or more of the following steps: loading a sample into a pipette tip or a tube comprising two opposing ends, at least one of which is sealable or sealed; sealing the pipette tip on the at least one end of the pipette tip;
- the method further comprises determining the location of the supernatant by said imaging step and automatically aspirating the supernatant based on the location of the supernatant.
- the determination occurs with the aid of a processor, and said processor provides instructions to an aspirating device which performs the automated aspiration step.
- the imaging occurs by use of a camera that is configured to capture the image of the side profile of the pipette tip or the tube.
- the supernatant includes one or more of the following: blood plasma or blood serum.
- the pellet includes one or more of the following: blood cells or particulates.
- a computer-assisted method for characterizing an analyte suspected to be present in a sample may be provided in accordance with an additional aspect of the invention.
- the computer-assisted method may comprise obtaining a digital image of the sample, wherein the digital image comprises at least a two- dimensional array of pixels, and wherein each pixel comprises a plurality of intensity values, each of which corresponds to a distinct detection spectral region; correlating, with the aid of a programmable device, the obtained intensity values with a predetermined set of values that define a dynamic range of each detection spectral region; and predicting the presence and/or quantity of said analyte in the sample based on said correlating of the obtained intensity values with a predetermine set of values.
- the plurality of intensity values comprise intensity values for red, green, and blue detection spectral regions.
- the method further comprises selecting an illumination wavelength, and illuminating the sample with the selected illumination wavelength prior to and/or concurrently with obtaining the digital image.
- the method further comprises, subsequent to obtaining the digital image, (a) selecting another illumination wavelength; (b) illuminating the sample with the other selected illumination wavelength; (c) obtaining another digital image of the sample, wherein the digital image comprises at least a two- dimensional array of pixels, and wherein each pixel comprises a plurality of intensity values, each of which corresponds to a distinct detection spectral region; and (d) predicting the presence and/or quantity of said analyte in the sample based on the obtained intensity values from the digital image and said another digital image.
- an aspect of the invention may be directed to a method of measuring an analyte concentration in a sample fluid comprising providing the sample contained in a container dimensioned with a plurality of distinct widths to permit transmission of light along a plurality of varying path lengths that correspond to the plurality of distinct widths; illuminating the container along at least one of the plurality of path lengths; and imaging the container to measure a first light intensity transmitted across said at least one of the plurality of path lengths, for the determination of the concentration of the analyte based on the measured first light intensity.
- a method of detecting the presence or concentration of an analyte in a sample fluid contained in a container may comprise illuminating the container along a first region having a first path length to yield a first measurement of light intensity transmitted across the first path length; moving the sample fluid to another region in the container having another path length if the first measurement falls outside a predetermined dynamic range of transmitted light intensity; illuminating the container along the another region to yield another measurement of light intensity transmitted across the another path length; and optionally repeating second and third steps until a measurement of light intensity falls within the predetermined dynamic range, thereby detecting the presence or concentration of the analyte.
- the method further comprises deconvoluting a line scan of the image, thereby detecting the presence or concentration of an analyte.
- the sample is moved from a first region of the container having a first path length to a second region of the container having another path length by aspirating the sample.
- an end of the container is attached to a pipette which is configured to aspirate the sample.
- the sample is moved up or down the length of the container.
- the container is a pipette tip.
- the container is conically shaped.
- the container has two open ends. In another embodiment, a first open end has a greater diameter than a second open end.
- the container has a plurality of distinct widths to permit transmission of light along a plurality of varying path lengths.
- the container volume is less than 100 microliters.
- a plurality of distinct path lengths are imaged simultaneously.
- a method may be provided as an additional aspect of the invention.
- the method may be provided for characterizing an analyte suspected to be present in a sample of biological fluid, said method comprising: providing said sample of biological fluid; allowing said analyte to react with one or more reagents that specifically react with said analyte to generate an optically detectable signal; and measuring said optically detectable signal with a plurality of detection spectral regions, wherein the presence of said optically detectable signal within a dynamic range of at least one detection spectral region is indicative of the concentration of said analyte in said sample of biological fluid.
- the measuring is performed by an imaging device configured to measure a plurality of detection spectral regions.
- the imaging device is configured to measure the plurality of detection spectral regions simultaneously.
- the imaging device is configured to measure the plurality of detection spectral regions sequentially.
- An aspect of the invention provides a method for increasing the accuracy of an assay comprising imaging a sample in a first tip to determine the volume of the first sample; imaging one or more reagents in a second tip to determine the volume of the one or more reagents; mixing the sample and the one or more reagents to form a reaction mixture; imaging the reaction mixture; correcting a calibration based on said determined volumes of the sample and the one or more reagents; and calculating a concentration of an analyte using the corrected calibration.
- the method further comprises imaging the reaction mixture to determine the volume of the reaction mixture.
- the imaging of the sample in the first tip is conducted using a camera configured to capture a side profile of the first tip.
- imaging of the one or more reagents in the second tip is conducted using a camera configured to capture a side profile of the second tip.
- the height of the sample and the one or more reagents is calculated based on the captured profiles.
- determining the volume is based on the height of the sample and the one or more reagents and the known cross-sectional areas of the sample and the one or more reagents respectively.
- the calibration is also based on the determined volume of the reaction mixture.
- a setup comprising: a vessel configured to accept and confine a sample, wherein the vessel comprises an interior surface, an exterior surface, an open end, and an opposing closed end; and a tip configured to extend into the vessel through the open end, wherein the tip comprises a first open end and second open end, wherein the second open end is inserted into the vessel, wherein the vessel or the tip further comprises a protruding surface feature that prevents the second open end of the tip from contacting the bottom of the interior surface of the closed end of the vessel.
- the surface feature is integrally formed on the bottom interior surface of the vessel.
- the surface feature comprises a plurality of bumps on the bottom interior surface of the vessel.
- the protruding surface feature is at or near the closed end.
- the centrifuge is contained within the sample preparation station and/or the assay station.
- the computer-executable commands are configured to perform the point-of-service service at a site selected from the group consisting of a retailer site, the subject's home, or a health assessment/treatment location.
- Another aspect of the invention provides a method for dynamic feedback, said method comprising: taking an initial measurement of a sample within a container using a detection mechanism; based on said initial measurement, determining, using a processor, whether the sample concentration falls into a desired range, and determining, using a processor, (a) a degree of dilution to be performed if the sample concentration is higher than the desired range or (b) a degree of concentration to be performed if the sample concentration is lower than the desired range; and adjusting the sample concentration according to the determined degree of dilution or the determined degree of concentration.
- the method further comprises taking a subsequent measurement of the sample within the container.
- the method further comprises, based on the subsequent measurement determining, using a processor, whether the sample concentration falls into a desired range.
- the subsequent measurement is made using the detection mechanism.
- the method further comprises determining a characteristic of the sample based on the subsequent measurement.
- the characteristic is selected from one or more of the following: the presence or concentration of an analyte, the presence or concentration of a cell, and the morphology of the cell.
- the subsequent measurement is made using a separate detection mechanism from the initial detection mechanism.
- the initial measurement provides a crude cell concentration measurement of the sample.
- the subsequent measurement provides a measurement of cell concentration of the sample of greater resolution than the initial measurement.
- the initial measurement is taken by imaging the sample.
- the adjusting of the sample concentration permits detection of analyte that would otherwise fall outside the desired range.
- Another aspect of the invention provides a method for providing quality control, said method comprising capturing an image of conditions under which a detection mechanism measures a characteristic of a sample; and determining, using a processor, based on the image whether there are undesirable conditions under which the detection mechanism is operated.
- the undesirable conditions includes the presence of one or more undesirable materials.
- the undesirable materials includes one or more of the following: bubbles, particles, fibers, debris, and precipitates that interfere with the measurement of the characteristic of the sample.
- the detection mechanism is a different mechanism from a mechanism used to capture the image.
- the image is captured using a camera.
- the method further comprises providing an alert if an undesirable condition is detected.
- the method further comprises adjusting the sample if an undesirable condition is detected.
- the image includes an image of the sample.
- the image includes an image of one or more of the following: the sample container or the detection mechanism.
- Another aspect of the invention is an automated system for separating one or more components in a biological fluid
- a centrifuge comprising one or more bucket configured to receive a container to effect said separating of one or more components in a fluid sample; and the container, wherein the container includes one or more shaped feature that is complementary to a shaped feature of the bucket.
- the shaped feature of the bucket includes one or more shelf upon which a protruding portion of the container is configured to rest.
- the bucket is configured to be capable of accepting a plurality of containers having different configurations, and wherein the shaped feature of the bucket includes a plurality of shelves, wherein a first container having a first configuration is configured to rest upon a first shelf, and a second container having a second configuration is configured to rest upon a second shelf.
- Another aspect of the invention provides an assay unit comprising a first end and a second end; an outer surface; and an inner surface comprising one or more selected patterns each of which is immobilized thereon or therein with a capture reagent capable of capturing an analyte suspected to be present in a biological sample, wherein the first end and the second end are of different dimensions.
- Another aspect of the invention provides an assay unit comprising an identifier that is used to determine (a) the one or more capture reagents immobilized on the inner surface; and (b) source of the biological sample if the assay unit contains said sample.
- Another aspect of the invention provides an assay unit comprising a plurality of selected patterns, each pattern of said plurality comprises a distinct capturing agent.
- Figure 1 shows a side view of a centrifuge.
- Figure 2 shows a face on view of a centrifuge.
- Figure 3 shows a perspective view of the back of a centrifuge.
- Figure 4 shows a top view of a sample tip.
- Figure 5 shows a side view of a sample tip.
- Figure 6 shows a cross-sectional view of a sample tip.
- Figure 7 shows a diagram of a sample tip positioned in a sample above a plasma/packed cell interface.
- Figure 8 shows a graph of centrifugation time as a function of revolutions per minute.
- Figure 9 shows a graph of centrifugation time as a function of the radius of the centrifuge rotor.
- Figure 10 shows an empty capped sample tip.
- Figure 11 shows a capped sample tip containing a sample of a bodily fluid, e.g., blood.
- a bodily fluid e.g., blood.
- Figure 12 shows a capped sample tip containing a sample of about 23% hematocrit blood after centrifugation.
- Figure 13 shows a capped sample tip containing a sample of about 31% hematocrit blood after centrifugation.
- Figure 14 shows a capped sample tip containing a sample of about 40% hematocrit blood after centrifugation.
- Figure 15 shows a capped sample tip containing a sample of about 52% hematocrit blood after centrifugation.
- Figure 16 shows a capped sample tip containing a sample of 68% hematocrit blood after centrifugation.
- Figure 17 shows a comparison of hematocrit measured using by digitally imaging system a centrifuged sample ("hematocrit, % reported”) and hematocrit measured by standard microhematocrit apparatus ("hematocrit, % target”)
- Figure 18 shows a diagram of a tip used for reactions and a tip used for blood/plasma (dimensions shown in mm).
- Figure 19 shows a cylindrical capillary containing a sample.
- Figure 20 shows angles and dimensions for calculating volumes within a conical container, e.g. a capillary.
- Figure 21 shows angles and dimensions for calculating volumes within a conical container, e.g., a capillary.
- Figure 22 shows angles and dimensions for calculating volume of a spherical cap.
- Figure 23 shows dimensions for calculating the volume of a sample contained within a cylindrical tip, where the sample has a single meniscus.
- Figure 24 shows dimensions for calculating the volume of a sample contained within a cylindrical tip, where the sample has two menisci.
- Figure 25 shows dimensions for calculating the volume of a sample contained within and/or associated with a cylindrical tip, where the sample has two menisci and one of which is external to the cylindrical tip.
- Figure 26 shows dimensions for calculating the volume of a sample contained within a cylindrical tip, where there is a bubble in the sample.
- Figure 27 shows dimensions for calculating the volume of a sample contained within a cylindrical tip, where there is a bubble in the sample that spans the width of the cylindrical tip.
- Figure 28 shows dimensions for calculating the volume of a sample contained within and/or associated with a cylindrical tip, where the sample includes a pendant droplet of sample outside the cylindrical tip.
- Figure 29 shows dimensions for calculating the volume of a residual sample contained within a cylindrical tip.
- Figure 30 shows a blood sample within a tip prior to being mixed with a magnetic reagent.
- Figure 31 shows a blood sample being mixed with a magnetic reagent.
- Figure 32 shows a blood sample mixed with a magnetic reagent.
- Figure 33 shows a blood sample mixed with a magnetic reagent contained within a tip.
- Figure 34 shows a blood sample mixed with a magnetic reagent moved to a selected position within a tip.
- Figure 35 shows a magnetic force applied by a magnet (M) to a blood sample mixed with a magnetic reagent.
- Figure 36 shows a blood sample that has been separated into a red cell component and a plasma component using magnetic force.
- Figure 37 shows a well positioned beneath a tip containing a blood sample that has been separated into a red cell component and a plasma component.
- Figure 38 shows a depiction of blood plasma being transferred from a tip to a well.
- Figure 39 shows a tip after dispensing of blood plasma to a well.
- Figure 40 shows a high contrast image of a cylindrical tip containing a liquid with low absorbance.
- Figure 41 shows an image of a conical tip containing a liquid with high absorbance.
- Figure 42 shows a tip with a high absorbance liquid showing two menisci within the tip.
- Figure 43 shows a tip with a sample liquid and large bubbles that span the diameter of the tip.
- Figure 44 shows a tip containing water showing a clear upper meniscus in a transparent tip or capillary.
- Figure 45 shows a graph of computed Protein-C concentration as a function of sample volume.
- Figure 46 shows an image of a sample transfer device with a capillary, housing, plunger, groove, and raised feature.
- the raised feature may help locate the plunger in the housing.
- Figure 47 shows a sample contained with the capillary of a sample transfer device.
- Figure 48 shows a sample transfer device after a sample has been ejected by a plunger.
- Figure 49 shows a sample transfer device after a sample has been incompletely ejected.
- Figure 50 shows a conical tip containing a sample, with the position L3 indicated by the arrow shown.
- Figure 51 shows a graph of the ratio of the distance between L2 and LI and the distance between L3 and LI as a function of sample volume.
- Figure 52 shows a schematic of a chemical reaction that produces a colored product.
- Figure 53 shows a schematic of a chemical reaction that produces a colored product from cholesterol.
- Figure 54 shows a schematic of a chemical reaction that uses reducing equivalents to produce a colored product.
- Figure 55 shows an example of a compound that changes color upon being complexed with a metal ion.
- Figure 56 shows a series of images of tips with two-fold decreasing concentration of albumin from right to left, except for the left-most tip, which has no albumin.
- Figure 57 shows a series of images of tips with two-fold decreasing concentration of cholesterol from right to left, except for the left-most tip, which has no cholesterol.
- Figure 58 shows a series of hemispherical wells machined from a block of white opaque plastic, which each well having two-fold decreasing concentration of analyte from right to left, except for the left-most well, which has no analyte.
- the analyte may be calcium.
- Figure 59 shows a series of hemispherical wells machined from a block of white opaque plastic, which each well having two-fold decreasing concentration of analyte from right to left, except for the left-most well, which has no analyte.
- the analyte may be magnesium.
- Figure 60 shows a series of hemispherical wells machined from a block of white opaque plastic, which each well having two-fold decreasing concentration of analyte from right to left, except for the left-most well, which has no analyte.
- the analyte may be urea.
- Figure 61 shows a series of tips containing bromophenol blue solutions.
- Figure 62 is an illustration of tips having a plurality of distinct optical path lengths.
- Figure 63 shows a light path through a rectangular cuvette.
- Figure 64 shows a light path through a microtiter well.
- Figure 65 shows a light path through a conically shaped cuvette.
- Figure 66 shows a graph of light intensity as a function of location as measured on tips containing samples with varying concentration of bromophenol blue solutions for red, green, and blue color channels.
- Figure 67 shows an image of the tips that were analyzed in Figure 66.
- Figure 68 shows a graph of signal as a function of bromophenol blue concentration as measured by red, green, and blue color channels.
- the optical density may be measured at 589 nm.
- Figure 69 shows a log scale graph of signal response as a function of bromophenol blue concentration as measured by blue (diamonds) and red (squares) color channels.
- Figure 70 shows a graph of concentration measured by color analysis of digital images as a function actual concentration.
- Figure 71 shows a graph of signal response as measured by red (squares), green (diamonds), and blue (triangles) color channels as a function of albumin concentration.
- Figure 72 shows three graphs of signal response as measured for green, red, and blue color channels for polystyrene latex particles.
- Figure 73 shows tips that each separately contain reagents NADH, WST-1, PMS, and two tips containing a mixture of the reagents.
- Figure 74 shows a digital image of tips containing two-fold decreasing concentration of lactate dehydrogenase (LDH) from left to right.
- LDH lactate dehydrogenase
- Figure 75 shows a graph of optical density measured at 450 nm as a function of LDH.
- Figure 76 shows solutions of potassium chloride added to potassium assay strips.
- Figure 77 shows tips containing blood samples mixed with blood typing reagents for Anti-A, Anti-
- Figure 78 shows measured signals for signal as a function of position for red (left column), green (middle column), and blue (right column) for samples mixed with Anti-A, Anti B, Anti-D, and Control reagents.
- Figure 79 shows normalized signal as a function of relative concentration measured for narrow and wide path lengths using red, green, and blue color channels.
- Figure 80 shows a graph of log of measured concentration as a function of actual concentration, illustrating the accuracy of the measurement algorithm.
- Figure 81 shows a fluorescence image of assay products in tubes.
- Figure 82 shows an image of reaction products in tips.
- Figure 83 shows an image of reaction products in tips.
- Figure 84 shows an image of reaction products in tips.
- Figure 85 shows an image of reaction products in tips.
- Figure 86 shows an image of reaction products in tips.
- Figure 87 shows an image of reaction products in tips.
- Figure 88 shows a background color image obtained for calibration.
- Figure 89 shows a fluorescence image of reaction products in tips.
- Figure 90 shows red and blue color channel response and fluorescence response as a function of
- Figure 91 shows graph of transformed 3-color signal as a function of fluorescence signal.
- Figure 92 shows a graph of green channel signal response as a function of pixel position.
- Figure 93 shows an image of tips containing solutions of bromophenol blue and water.
- Figure 94 shows an image of additional tips that may contain solutions of bromophenol blue and water.
- Figure 95 shows an schematic of a tip containing reaction mixtures to perform multiple assays.
- Figure 96 shows an image of tips containing solutions of bromophenol blue and water.
- Figure 97 shows a graph of signal response for sample, water, and control in multiple standards.
- the samples may be aqueous calibrators containing known concentrations of analyte.
- Figure 98 shows tips containing assays for both Ca 2+ (upper region of the tip) and Mg 2+ (lower region of the tip).
- Figure 99 shows four tips with various types of serum samples: hemolyzed (reddish in color), lipemic (gray), icteric (yellow in color), and normal (from left to right).
- Figure 100 shows a schematic of a camera and optical components.
- Figure 101 shows a cross-sectional view of a camera and optical components including a white light source, an aperture, and a sensor.
- Figure 102 shows a schematic of an optical setup for measuring light signal using (A) a sensor that is positioned to detect light at a perpendicular angle to an excitation beam, and (B) a sensor that is positioned in line with an excitation beam.
- Figure 103 shows images taken using (A) an excitation beam perpendicular to a sensor and (B) an excitation beam that is in line with a sensor.
- Figure 104 shows an array of printed dyes that can be used to calibrate the optical setup.
- Figure 105 shows a graph of signal as a function of sample volume.
- Series 1-5 may correspond to different analyte concentrations, such as 0, 20, 40, 60, and 80 respectively.
- Figure 106 shows a graph of signal as a function of sample volume. Series 1-5 may correspond to different analyte concentrations, such as 0, 20, 40, 60, and 80 respectively.
- Figure 107 shows a graph of signal as a function of sample volume. Series 1-5 may correspond to different analyte concentrations, such as 0, 20, 40, 60, and 80 respectively.
- Figure 108 shows a graph of measured analyte concentration as a function of actual analyte concentration.
- Figure 109 shows a graph of measured analyte concentration as a function of actual analyte concentration.
- Figure 110 schematically illustrates an exemplary method for an ELISA assay.
- Figure 111 shows an example of a rotor at rest with buckets vertical.
- Figure 112 shows an example of a rotor at a speed with buckets at a small angle to horizontal.
- Figure 113 shows an example of a bucket configuration.
- Figure 114 shows an example of a centrifugation vessel mated with the bucket.
- Figure 115 shows an example of another centrifugation vessel that can be mated with the bucket.
- Figure 116 shows an example of a centrifugation vessel.
- Figure 117 shows an example of an extraction tip.
- Figure 118 provides an example of how the centrifugation vessel and extraction tip may mate.
- Figure 119 is an image that was taken of the original reaction mixture prior to centrifugation.
- Figure 120 is another image that was taken of the original reaction mixture prior to centrifugation
- Figure 121 is an additional image that was taken of the original reaction mixture prior to centrifugation
- Figure 131 shows images collected by a digital camera.
- Figure 132 illustrates examples of images taken of reaction product.
- Figure 133 provides examples of images that were analyzed before spinning in the centrifuge, and after spinning in the centrifuge.
- Figure 134 illustrates examples of images taken of reaction product.
- Figure 135 illustrates spectra of several serum samples.
- Figure 136 illustrates an example detection process of the invention using an array.
- Figure 137 illustrates an example detection process of the invention using beads.
- Figure 138 illustrates an example detection process of the invention using tagged aptamers.
- Figure 139 illustrates detection of aptamer binding to a complementary probe.
- Figure 140 illustrates absence of binding between aptamer and a non-complementary probe.
- Figure 141 illustrates binding specificity of aptamers on an array.
- Figure 142 shows a more detailed view of analyte detection on an array.
- Figure 143 shows an example array.
- Figure 144 shows a plot of chemiluminescence against concentration for a vitamin D assay.
- Figure 145 shows a plot of chemiluminescence against concentration for an estradiol assay.
- Figure 146 shows a spectrophotometric measurement of WBC concentration.
- Figure 147 shows plots of turbidity as a function of time.
- Figure 148 is a plot of inflection points for three experiments at 800 copies/uL and 80 copies/uL.
- Figure 149 is a plot of an example in which magnetic beads are used for the analysis of proteins and small molecules via ELISA assays.
- Figure 150 is a plot of an example in which magnetic beads are used for the analysis of proteins and small molecules via ELISA assays.
- the invention provides mobile applications for system and methods for sample use maximization.
- Various aspects of the invention described herein may be applied to any of the particular applications set forth below or for any other types of diagnostic or therapeutic applications.
- the invention may be applied as a standalone system or method, or as part of an integrated pre-clinical, clinical, laboratory or medical application. It shall be understood that different aspects of the invention can be appreciated individually, collectively, or in combination with each other.
- the devices and systems herein can provide an effective means for real-time detection of analytes present in a bodily fluid from a subject.
- the detection methods may be used in a wide variety of circumstances including identification and quantification of analytes that are associated with specific biological processes, physiological conditions, disorders or stages of disorders.
- the systems have a broad spectrum of utility in, for example, drug screening, disease diagnosis, phylogenetic classification, parental and forensic identification, disease onset and recurrence, individual response to treatment versus population bases, and/or monitoring of therapy.
- the subject devices and systems are also particularly useful for advancing preclinical and clinical stage of development of therapeutics, improving patient compliance, monitoring ADRs associated with a prescribed drug, developing individualized medicine, outsourcing blood testing from the central laboratory to the home or on a prescription basis, and/or monitoring therapeutic agents following regulatory approval.
- the subject devices and system can be utilized by payors outsourcing blood tests from a central laboratory.
- the devices and systems can provide a flexible system for personalized medicine. Using the same system, a device can be changed or interchanged along with a protocol or instructions to a programmable processor of the systems to perform a wide variety of assays as described.
- a system of the invention comprises a device comprising assay units and reagent units, which include reagents, e.g., both liquid and/or solid phase reagents.
- reagents e.g., both liquid and/or solid phase reagents.
- at least one of the whole device, an assay unit, a reagent unit, or a combination thereof is disposable.
- the detection of an analyte with the subject device is typically automated. Such automation can be effected by a built-in protocol or a protocol provided to the system by the manufacturer.
- the devices and systems as described herein can offer many features that are not available in existing POC systems or integrated analysis systems.
- many POC cartridges rely on a closed fluidic system or loop to handle small volumes of liquid in an efficient manner.
- the fluidic devices such as cartridges described herein can have open fluid movement between units within a given cartridge.
- a reagent can be stored in a unit, a sample stored in a sample collection unit, a diluent stored in a diluent unit, and the capture surface can be in an assay unit, where in one state of cartridge, none of the units are in fluid communication with any of the other units.
- a fluid transfer device can comprise a head that engages an assay unit and brings the assay unit in fluidic communication with a reagent unit.
- the head is a pipette head that moves the assay unit (e.g., tip) in fluid
- the present invention provides a method of detecting and /or measuring the concentration of an analyte in a bodily fluid or tissue sample, the method typically comprises the steps of providing a sample (e.g., blood, urine, saliva, tissue) to a device or system of the invention, allowing the sample to react within at least one assay unit of the device, and detecting the detectable signal generated from the analyte in the blood sample.
- a sample e.g., blood, urine, saliva, tissue
- One aspect of the invention provides for analyzing samples using a point-of-care device that is configured to maximize sample utilization. For example, more than about 15, 25, 50, 75, or 100 assays can be performed on a sample having a volume of less than about 1, 20, 50, 100, or 500 ⁇ .
- the sample can be a blood sample taken from a finger prick.
- the sample can be collected in a sealable capillary or tip.
- the sample can be prepared for one or more assays by subjecting the sample to a separation (e.g., centrifugation) and/or dilution process.
- the one or more assays can be prepared by combining the sample, which may have been separated and diluted, with one or more reagents in a reaction chamber.
- the reaction chamber can be a pipette tip, vial, a sample transfer device, and/or a cuvette.
- the one or more assays can be configured such that an optical signal can be measured which is indicative of the concentration of one or more analytes in the sample.
- the reaction chamber can contain a plurality of assays, which may be spatially separated. A plurality of optical signals can be generated within a single reaction chamber from one assay, or from a plurality of spatially separated assays.
- the one or more optical signals can be measured by a digital imaging camera that can measure a plurality of detection spectral regions or detection bands, e.g., red, green and blue.
- the optical signal can be measured on the assay reaction product in the reaction chamber, which can be a pipette tip or other sample containers.
- the systems, devices, and methods can be fully automated or semi-automated by programmable logic.
- Samples can be prepared for analysis by one or more separation devices.
- a sample can be prepared for analysis by centrifugation within a centrifuge.
- Other separations based on charge, size, hydrophobicity/hydrophilicity, and/or volatility can also be implemented.
- the system can include a camera that can measure an optical signal using one or more detection spectrum regions.
- a camera can measure an optical signal using red, green, and blue detection spectrum regions.
- the measured signal can include three measured values that can be interpreted using one or more algorithms described herein.
- the use of more than one detection spectrum region can increase the dynamic range of an assay and can increase the accuracy of a measurement as compared to measurements using a single detection spectrum region.
- the invention also provides for systems, devices, and methods for performing optical measurements on samples and assay reaction products that are contained within reaction chambers, each with a plurality of distinct path lengths.
- the reaction chambers can have a plurality of distinct path lengths such that a greater or lower amount of light absorbance is observed.
- the plurality of distinct path lengths (such as, for example, through the sample and/or reaction chamber) allows for an increase in the dynamic range of a selected assay protocol.
- the image of the reaction chamber can be analyzed as described herein to obtain information on the sample or the assay reaction products.
- the combination of utilizing the plurality of available path lengths within a single reaction chamber and the use of three channel detection spectrum regions greatly enhances the dynamic range of a given assay.
- a system for performing sample preparation and analysis can include instrumentation, disposable components, and reagents.
- the system can accept samples and automatically performs a plurality of assays without user intervention.
- the instrumentation can include a graphical user interface, a mechanism for introducing cartridges, which may be disposable, a motorized stage, which may have mobility in three dimensions, one or more single -head liquid handling devices, one or more multi-head liquid handling devices, one or more devices for performing sample preparation, optical sensors, which can include a PMT and/or an imaging device, temperature controllers, and communication devices.
- the disposable component can include a disposable cartridge that contains sample tips, tip seals, and reagents. In some embodiments, the disposable cartridge may also contain neutralizing assemblies configured to absorb and neutralize liquid assay products.
- the instrumentation, disposable components, and reagents can be housed within a closeable environment, such as a case or a cabinet.
- the case has a cross-sectional area less than about 4 m 2 , 2 m 2 , 1 m 2 , 0.5 m 2 , 0.1 m 2 , 0.05 m 2 , or lower.
- the invention provides for a distributed test system, such as a point-of-care device, which can include one or more of the following aspects:
- the device of the invention is self-contained and comprises all reagents, liquid- and solid-phase reagents, required to perform a plurality of assays in parallel.
- the device is configured to perform at least 2, 3, 4, 5, 6, 7, 8, 9, 10, 20, 30, 40, 50, 100, 200, 500, 1000 or more assays.
- One or more control assays can also be incorporated into the device to be performed in parallel if desired.
- Calibrators can also be provided for assay system calibration.
- Some examples of dried controls and calibrators useful for assay system calibration can include aqueous solutions of analytes, serum, or plasma samples with known levels of analytes, known quantities of such calibrators and controls can also be dried by lyophilization, vacuum drying, and other manufacturing processes (and dissolved during the assay).
- a patient or user can have a plurality of analytes, for example more than about 10, 20, 30, 50, 75, 100, 150, or 200 analytes, quantified within less than about 0.5, 1, 2, 3, 4, 5, 10, 20, 30, 60, 120, 180, 240, 480 or 600 minutes.
- the subject devices and systems can be utilized for conducting quantitative immunoassays, which can be completed in a short period of time.
- Other assay type can be performed with a device of the invention including, but not limited to, measurements of nucleic acid sequences and measurements of metabolite, such as cholesterol or electrolytes such as magnesium and chloride ions.
- the assay is completed in no more than one hour, preferably less than 120, 60, 30, 15, 10, 5, 4, 3, 2, or 1 minute. In other embodiments, the assay is performed in less than 5 minutes. The duration of assay detection can be adjusted accordingly to the type of assay that is to be carried out with a device of the invention.
- an assay can be incubated for more than one hour or up to more than one day.
- assays that require a long duration may be more practical in other POC applications, such as home use, than in a clinical POC setting.
- the reagent units of a subject device are configured to be a set of mix-and-match components.
- a reagent unit typically stores liquid or solid reagents necessary for conducting an assay that detect a given analyte.
- the assay units can sometimes (or optionally not always) comprise at least one capture surface capable of reacting with an analyte from the sample of bodily fluid.
- the assay unit may be a tubular tip with a capture surface within the tip. Examples of tips of the invention are described herein.
- Each individual assay and reagent unit can be configured for assay function independently.
- the units can be assembled in a just-in-time fashion for use in an integrated device, which can take the format of cartridge.
- a housing for a device of the invention can be made of a polymeric material, a metallic material or a composite material, such as, e.g., aluminum, polystyrene or other moldable or machinable plastic, and can have defined locations to place assay units and reagent units.
- the housing may include a metal or any other material.
- the housing may partially or entirely enclose the assay units and/or reagent units.
- the housing may support the weight of the assay units and/or reagent units.
- the housing has means for blotting tips or assay units to remove excess liquid.
- the means for blotting can be a porous membrane, such as cellulose acetate, or a piece bibulous material such as filter paper.
- At least one of the components of the device may be constructed of polymeric materials.
- polymeric materials include polystyrene, polycarbonate, polypropylene, polydimethysiloxanes (PDMS), polyurethane, polyvinylchloride (PVC), polysulfone, polymethylmethacrylate (PMMA), acrylonitrile-butadiene-styrene (ABS), and glass.
- the device or the subcomponents of the device may be manufactured by variety of methods including, without limitation, stamping, injection molding, embossing, casting, blow molding, machining, welding, ultrasonic welding, and thermal bonding.
- a device in manufactured by injection molding, thermal bonding, and ultrasonic welding can be affixed to each other by thermal bonding, ultrasonic welding, friction fitting (press fitting), adhesives or, in the case of certain substrates, for example, glass, or semi-rigid and non-rigid polymeric substrates, a natural adhesion between the two components.
- a system as described can run a variety of assays, regardless of the analyte being detected from a bodily fluid sample.
- a protocol dependent on the identity of the device may be transferred from an external device where it can be stored to a reader assembly to enable the reader assembly to carry out the specific protocol on the device.
- the device has an identifier (ID) that is detected or read by an identifier detector described herein.
- ID can enable two-way communication between the device and a sensor or receiving system.
- the identifier detector can communicate with a communication assembly via a controller which transmits the identifier to an external device. Where desired, the external device sends a protocol stored on the external device to the communication assembly based on the identifier.
- the protocol to be run on the system may comprise instructions to the controller of the system to perform the protocol, including but not limited to a particular assay to be run and a detection method to be performed.
- a signal indicative of an analyte in the bodily fluid sample is generated and detected by a detection assembly of the system.
- the detected signal may then be communicated to the communications assembly, where it can be transmitted to the external device for processing, including without limitation, calculation of the analyte concentration in the sample.
- Samples, reagents, and assembled assays described herein can be handled and contained by a variety of reaction chamber types.
- a sample handing device and a reaction chamber can be a well, a tube, or an open ended tip, which may also be a cuvette.
- a tip can also referred to as a sample tip, a cuvette tip, a reaction chamber, a cuvette, a capillary, a sample handing device, or a sample transfer device. Samples may be collected from a source into a tip or a tube. The tips may be sealed. Such seals may be permanent or reversible.
- Diluted samples can be combined with one or more reagents and mixed (as described in previous applications) within "assay elements" such as tips (open-ended cuvettes) or open or covered wells.
- the assay element can be presented to the optical system for image analysis or other types of reading.
- assay reaction mixtures can be transferred from one type of element to another.
- assays incubated in tips can be blotted onto an absorbent or bibulous medium or assays incubated in wells can be aspirated into tips.
- Many assays can be processed in parallel.
- Assay readout can be serial or simultaneous depending on the assay protocol and/or incubation time. For assays involving measurement of a rate of change, the assay element can be presented to the optical system more than once at different times.
- a fluid transfer device can be part of a system.
- the fluid transfer device can comprise a plurality of heads. Any number of heads as is necessary to detect a plurality of analytes in a sample is envisioned for a fluid transfer device of the invention.
- a fluid transfer device has about eight heads mounted in a line and separated by a distance.
- the heads have a tapered nozzle that engages by press fitting with a variety of tips, such as assay unit or sample collection units as described herein.
- the tips can have a feature that enables them to be removed automatically by the instrument and disposed into in a housing of a device as described after use.
- the assay tips are clear and transparent and can be similar to a cuvette within which an assay is run that can be detected by an optical detector such as a photomultiplier tube or camera sensor.
- a programmable processor e.g., central processing unit, CPU
- a programmable processor can comprise or be configured to accept (such as, e.g., from a memory location) instructions or commands and can operate a fluid transfer device according to the instructions to transfer liquid samples by either withdrawing (for drawing liquid in) or extending (for expelling liquid) a piston into a closed air space.
- the processor can be configured to facilitate aspiration and/or dispensing. Both the volume of air moved and the speed of movement can be precisely controlled, for example, by the programmable processor.
- Mixing of samples (or reagents) with diluents (or other reagents) can be achieved by aspirating components to be mixed into a common tube and then repeatedly aspirating a significant fraction of the combined liquid volume up and down into a tip. Dissolution of reagents dried into a tube can be done is similar fashion. Incubation of liquid samples and reagents with a capture surface on which is bound a capture reagent (for example an antibody) can be achieved by drawing the appropriate liquid into the tip and holding it there for a predetermined time. Removal of samples and reagents can be achieved by expelling the liquid into a reservoir or an absorbent pad in a device as described. Another reagent can then be drawn into the tip according to instructions or protocol from the programmable processor.
- a capture reagent for example an antibody
- a system can comprise a holder or engager for moving the assay units or tips.
- An engager may comprise a vacuum assembly or an assembly designed to fit snugly into a boss of an assay unit tip.
- a means for moving the tips can be moved in a manner similar to the fluid transfer device heads. The device can also be moved on a stage according to the position of an engager or holder.
- an instrument for moving the tips is the same as an instrument for moving a volume of sample, such as a fluid transfer device as described herein.
- a sample collection tip can be fit onto a pipette head according to the boss on the collection tip.
- the collection tip can then be used to distribute the liquid throughout the device and system.
- the collection tip can be disposed, and the pipette head can be fit onto an assay unit according to the boss on the assay unit.
- the assay unit tip can then be moved from reagent unit to reagent unit, and reagents can be distributed to the assay unit according to the aspiration- or pipette -type action provided by the pipette head.
- the pipette head can also perform mixing within a collection tip, assay unit, or reagent unit by aspiration- or syringe -type action.
- tips containing liquids including assay reaction mixtures can be disconnected from the pipetting device and "parked" at specific locations within the instrument or within a disposable unit. If needed, tips can be capped using a seal (as used in the centrifuge) to prevent liquids from draining out.
- the seal can be a vinyl seal.
- a cuvette can be circular, cylindrical, square, rectangular, cubical, conical, pyramidal, or any other shape capable of holding a sample of fluid.
- Rectangular cuvettes where a light beam impinges at right angles to the cuvette surfaces as shown in plan and section views in Figure 63 can be employed.
- the liquid sample that is illuminated is also rectangular and is defined by the cuvette.
- Cuvettes with circular cross-sections can also be used.
- some types of micro titer plates where the illuminated sample volume is in part defined by the sample meniscus as shown below in plan and section view in Figure 64.
- Variable pathlength cuvettes can be used to optimize and extend the assay response and minimize the volume of sample required to measure the assay. Cuvettes can be longer in relation to their cross-section in at least one region. In some cases, the pathlength of a cuvette can be selected based on cuvette geometry and/or material. Different cuvettes can be selected for different assays.
- one preferred version of the assay cuvette has a circular cross-section in the direction of the light beam as shown in Figure 65.
- the use of a cuvette with a circular cross-section has several advantages, including, but not limited to the following:
- optical pathlength can be precisely defined. Dimensional precision of injection-molded parts have been found to be better than 1 -2 % CV. In conventional microtiter plates the unconstrained liquid meniscus can introduce imprecision in pathlength.
- the optical image of the tips provides for the ability to identify the tip location and boundaries of the liquid column and to locate very precisely the center of the tip where the signal is maximal.
- An exemplary tip may have the following general features:
- Tip dimensional precision generally better than 2% or +/- 0.001 cm
- Tip configuration The tip will generally have a feature that engages with a pipette (cylindrical) so as to form a fluid tight seal. There is a region generally cylindrical or conical which is used for imaging.
- the optical part of the tip will have at least two different sections with different pathlengths.
- the lower end of the tip will typically be narrow so as to aid in retention of vertical liquid columns under gravity
- Tip material Clear or uniformly specular plastic (polystyrene, polypropylene etc.) (transmission of light in the visible > 80%)
- the tip can generally be clear or translucent, but the tips do not have to be clear to work well as assay cuvettes when three-color analysis is used.
- Tip cuvettes which appear "cloudy” may function similarly to clear tips.
- the cloudy tips are made in injection molds with non-polished or textured surfaces or by adding some light scattering material to the plastic used to fabricate the tips.
- the light scattering intensity of such cloudy tips may be chosen to be not so great as to obscure the colored liquid to be measured.
- the impact of light scattering on transmitted light can be selected to be less than 10, (20, and 30 %) relative to the impact of the colored material.
- the light scattering effect can be selected such that the light scattering of the cloudy tips is uniform.
- the tips and reaction chambers described herein can be comprised of a cylindrical (or conical) shaft about 2 cm in length and having an inner diameter of about 1-5 mm corresponding to a capacity of about 10 - 50 uL.
- a truncated cylindrical "boss" fluidically connected to the cylinder and adapted so as to be able to engage with the tapered feature of a pipetter.
- the lower end of the tip may be narrowed to provide a feature that enables the tip to hold its liquid contents when oriented vertically and not attached to the pipetter.
- the tip may be a pointed tip.
- the external shape of the lower end of the tip is typically also somewhat pointed with the diameter being reduced from the main part of the cylindrical shaft toward the end so as to be capable of being fluidically sealed with a flexible (vinyl) cap into which the tip end is press fit.
- Tips are usually made of molded plastic (polystyrene, polypropylene and the like). The tips can be clear or translucent such that information about the sample can be acquired by imaging.
- Figure 4, Figure 5, and Figure 6 show an example of a tip.
- the tip is configured with (1) an upper feature that can engage to form an air tight seal with a pipette head, (2) a basically cylindrical (actually conical with a very slight draft angle) shaft and a narrow, pointed lower tip.
- This tip can form a liquid-tight seal with a cap.
- the pointed shape aids in getting good conformance with the cap under moderate force.
- the material used is injection-molded polystyrene.
- the overall dimensions are: 32 mm long, about 7.6 mm largest outer diameter, useful capacity about 20 uL.
- the dimensions of the tip can be scaled to a larger volume. For example, for a 50 uL sample, the IDs can be increased by about 1.6-fold.
- Sealing can be achieved using a cap made of vinyl or other materials which is easily press-fit to the narrow end of the sample containment means using force generated by motion of the instrument stage in the z- direction.
- a bubble of air can become trapped within the tip when the tip is capped.
- a centrifugation step can be used to drive the bubble to the top of the column of blood so as to eliminate the effects of the bubble.
- the dimensions of the tip and/or the dimensions of the tip holder in a centrifuge can be matched such that a tip can be secured for centrifugation.
- the invention provides for systems, methods, and devices for the processing and analysis of samples can be collected from a variety of sources.
- the sample can be collected from patients, animals, or the environment.
- the sample can be a bodily fluid. Any bodily fluids suspected to contain an analyte of interest can be used in conjunction with the system or devices of the invention. Commonly employed bodily fluids include but are not limited to blood, serum, saliva, urine, gastric and digestive fluid, tears, stool, semen, vaginal fluid, interstitial fluids derived from tumorous tissue, and cerebrospinal fluid.
- the bodily fluid is a blood sample from a human patient.
- the blood source can be collected from a finger prick and have a volume of less than about 0.5, 1, 5, 10, 20, 50, 100, 200, 300, 400, 500, or 1000 uL.
- a bodily fluid may be drawn from a patient and provided to a device in a variety of ways, including but not limited to, lancing, injection, or pipetting.
- the terms "subject” and “patient” are used interchangeably herein, and refer to a vertebrate, preferably a mammal, more preferably a human. Mammals include, but are not limited to, murines, simians, humans, farm animals, sport animals, and pets.
- a lancet punctures the skin and withdraws a sample using, for example, gravity, capillary action, aspiration, or vacuum force.
- the lancet may be part of the device, or part of a system or a stand-alone component. Where needed, the lancet may be activated by a variety of mechanical, electrical, electromechanical, or any other known activation mechanism or any combination of such methods.
- a patient can simply provide a bodily fluid to the device, as for example, could occur with a saliva sample. The collected fluid can be placed in the sample collection unit within the device.
- the device comprises at least one microneedle which punctures the skin.
- the volume of bodily fluid to be used with a device can be less than about 500 microliters, typically between about 1 to 100 microliters. Where desired, a sample of 1 to 50 microliters, 1 to 40 microliters, 1 to 30 microliters, 1 to 10 microliters or even 1 to 3 microliters can be used for detecting an analyte using the device.
- the volume of bodily fluid used for detecting an analyte utilizing the subject devices or systems is one drop of fluid. For example, one drop of blood from a pricked finger can provide the sample of bodily fluid to be analyzed with a device, system or method described herein.
- a sample of bodily fluid can be collected from a subject directly into a tip of the described herein, or can be later transferred to a tip.
- the configuration of the processor to direct fluid transfer effects a degree of dilution of the bodily fluid sample in the array of assay units to bring signals indicative of the plurality of analytes being detected within a detectable range, such that said plurality of analytes are detectable with said system.
- the bodily fluid sample comprises at least two analytes that are present at concentrations that differ by at least 1, 2, 5, 10, 15, 50, 100, 500, 1000, 10,000, 10 5 , 10 6 , 10 7 , 10 8 , 10 9 , or 10 10 fold.
- the bodily fluid sample is a single drop of blood.
- the concentrations of at least two analytes present in a sample differs by up to 10 orders of magnitude (for example, a first analyte is present at 0.1 pg/mL and a second analyte is present at 500 ug/mL).
- some protein analytes are found at concentrations of greater than 100 mg/mL, which can extend the range of interest to about twelve orders of magnitude.
- nucleic acid analytes such as DNA and NA using exponential amplification methods such as polymerase reaction
- the number of copies of analyte can be increased by a billion fold prior to measurement.
- a degree of dilution of the bodily fluid sample can bring the signals indicative of the at least two analytes within the detectable range.
- the systems and devices herein can enable many features of the flexibility of laboratory setting in a POC environment. For example, samples can be collected and manipulated automatically in a table top size or smaller device or system. A common issue in POC devices is achieving different dilution ranges when conducting a plurality of assays, wherein the assays may have significantly different sensitivity or specificity. For example, there may be two analytes in a sample, but one analyte has a high concentration in the sample and the other analyte has a very low concentration. As provided, the systems and devices herein can dilute the sample to significantly different levels in order to detect both analytes. Alternatively, a sample may be split into two or more samples, which may enable individual analytes to be detected at various levels of dilution.
- a sample can be serially diluted to the appropriate detection range and provided to a capture surface for detection.
- a sample with an analyte in a low concentration may not need to be diluted.
- the assay range of the POC devices and systems provided herein can be expanded from many of the current POC devices.
- Separation-based ELISA assays can have an intrinsic limitation in the capacity of the capture surface to bind the analyte (for example about a few hundred ng/ml for a typical protein analyte). Some analytes are present in blood at hundreds of micrograms/ml. Even when diluted by 100-fold, the analyte concentration may be outside the range of calibration.
- multiple dilutions can be achieved by performing multiple fluid transfers of the diluent into an individual assay unit or sample collection unit. For example, if the concentration of an analyte is very high in a sample as described above, the sample can be diluted multiple times until the concentration of the analyte is within an acceptable detection range.
- the systems and methods herein can provide accurate measurements or estimations of the dilutions in order to calculate the original concentration of the analyte.
- a sample can be prepared for analysis by an initial separation step.
- a DNA separation step can be employed to eliminate or reduce contaminants or unwanted source material.
- the separation step can utilize chromatography, centrifugation, liquid-liquid extraction, solid-liquid extraction, affinity binding, or any other mechanisms known to one skilled in the art.
- a blood sample to be analyzed is first processed by separating the plasma component from the blood sample. This step can be performed using a variety of techniques, such as filtration, centrifugation, and affinity binding. Centrifugation can be an efficient method for separation of blood sample components, and can be employed in the present invention.
- Plasma separation Blood can be introduced into a close ended or sealable tip in a variety of ways, for example samples can be provided in a tube and a sealable tip can receive the sample from the tube via capillary action or via pneumatic force.
- a sealable tip can receive the sample from the tube via capillary action or via pneumatic force.
- One preferred means of introduction is the use of capillary action.
- container used to hold the sample for centrifugal separation can be configured with only one opening as in a conventional centrifuge.
- the tip once filled with blood, can be moved automatically to a location in a disposable cartridge where there is a sealing element.
- the sealing element can be a small "cup” made of a deformable (pliant) material (vinyl, silicone or the like) conformed to fit on the lower end of the tip and to seal it.
- the tip is pressed into the seal by the instrument thus forming a liquid-tight junction.
- the sealed tip is then moved to a small centrifuge (typically located in and forming part of the instrument) and press-fit into a positioning feature in the centrifuge rotor such that the lower (sealed) end of the tip butts up to a rigid shelf that will support the tip during the centrifugation step.
- the centrifuge rotor can be circular having about 10 cm in diameter.
- the mass of the blood- containing tip is either (1) small relative to the rotor or (2), where desired, balanced by a counter weight located on the opposite part of the rotor such that any vibration during the centrifugation step is minimized.
- One exemplary orientation of the centrifuge rotor is vertical (axis of rotation horizontal).
- the rotor is mounted in a drive shaft with is driven by an electric motor.
- Centrifugation can be achieved by spinning the rotor at about 15,000 rpm for 5 minutes. During this process, the particular elements in the blood (red cells and white cells) sediment to the sealed end of the tip and form a closely packed column with cell free plasma separated at the part of the tip distal from the seal.
- the tip containing the separated sample can then be placed vertically in a location accessible to a fluid handling device comprised of a narrow pipette tip ("sample acquisition tip") mounted on a pipetting device in turn mounted on an x-y-z stage.
- a fluid handling device comprised of a narrow pipette tip ("sample acquisition tip") mounted on a pipetting device in turn mounted on an x-y-z stage.
- Plasma can now be efficiently recovered from the centrifuged sample. This is achieved by moving the sample acquisition tip vertically along the axis of the centrifuge tip so that it comes into fluid contact with the plasma and can draw the plasma upwards using, e.g., pneumatic means.
- this operation can be monitored using a camera or other imaging device which can be used both to measure the sample hematocrit and to provide information as to the location of the plasma/red cell boundary to the stage/pipetter controller.
- a narrow pipette tip fitted to a pipette is slowly moved vertically down, such that the tip is directed axially down the sample containment means until it contacts the plasma.
- the tip is then moved further until it is close (within less than about 3, 2, 1, 0.5, or 0.1 mm) of the packed cell interface.
- plasma is aspirated into the narrow pipette tip under computer control.
- the plasma can be aspirated simultaneously while moving the narrow pipette tip into the plasma column so that the plasma does not become displaced into the upper part of the sample containment means.
- the aspiration can be controlled to avoid air being aspirated during the plasma removal step.
- a pipette tip with a very narrow end can be used to aspirate the plasma from the centrifuged sample tip.
- the narrow tip is typically conical or tapered and has dimensions 1 - 3 x 0.1 - 0.5 cm (length x diameter) and made of any of a variety of materials (polypropylene, polystyrene etc.). The material can be clear or translucent in the visible.
- One end of the tip engages with a pipetting device.
- the other is very narrow (0.05 - 0.5 mm OD) such that it can move into the sample tip without touching the inner surface of the sample tip. Even if there is contact between the plasma aspiration tip and the sample tip, plasma aspiration is not hindered.
- FIG. 7 A schematic of the plasma aspiration process at the stage where the plasma aspiration tip is located just above the plasma-packed cell interface during the aspiration step is shown in Figure 7.
- the aspirated plasma can be moved to other locations for dilution and mixing with assay reagents so that assays for analytes industry but not limited to metabolites, electrolytes, protein biomarkers, drugs and nucleic acids may be performed.
- a further use of the invention is to isolate and concentrate the white cells from blood.
- the blood sample is first subject to a process which lyses the red cells (and optionally fixes the white cells) by adding a reagent (For example, BD PharmlyseTM 555899 or BD FACSTM Lysing Solution 349202)_to the blood and mixing.
- a reagent for example, BD PharmlyseTM 555899 or BD FACSTM Lysing Solution 349202
- the lysed sample is subject to centrifugation as described above such that the white cells are concentrated at the sealed end of the blood tip.
- the lysed red cell solution can then be removed by aspiration.
- Recovery of the white cells is achieved by either (1) addition of a small amount of a buffer solution and repeated up and down aspiration to re-suspend the cells followed by displacement into a receptacle or (2) removal of the seal and downward displacement of the packed cells into a receptacle using air pressure.
- An alternate scheme allows recovery of white cells without lysis of the red cells. After centrifugation of blood (as is well known) the white cells form a layer on top of the packed red cells known as the Buffy Coat. Following removal of most of the plasma (as above) the white cells can be efficiently recovered by (1) optionally adding a small volume (e.g. about 5 uL) of isotonic buffer, or (2) using the residual plasma and re-suspending the white cells by repeated aspiration and/or mechanical stirring using the sample acquisition tip. Once suspended, the resulting mixture of white cells together with a small proportion of red cells also re- suspended can be acquired by aspiration for analysis of the white cells. In this way most of the white cells (typically all) can be recovered with only a small (contaminating) quantity of red cells (typically less than 5% of the original).
- a small volume e.g. about 5 uL
- FIG 1, Figure 2, and Figure 3 show scale perspectives of a centrifuge (Figure 1 - side view, Figure 2 - front face view, Figure 3 - rear view) that can be integrated into the system.
- the centrifuge may contain an electric motor capable of turning the rotor at 15,000 rpm
- One type of centrifuge rotor is shaped somewhat like a fan blade is mounted on the motor spindle in a vertical plane.
- Affixed to the rotor is an element which holds the sample holding means (tip) and provides a ledge or shelf on which the end of the tip distal to the motor axis rests and which provides support during the centrifugation so that the sample cannot escape.
- the tip may be further supported at its proximal end by a mechanical stop in the rotor.
- the tip can be inserted and removed by standard pick and place mechanisms but preferably by a pipette.
- the rotor is a single piece of acrylic (or other material) shaped to minimize vibration and noise during operation of the centrifuge.
- the rotor is (optionally) shaped so that when it is oriented in particular angles to the vertical, other movable components in the instrument can move past the centrifuge.
- the sample holding means are centrifugally balanced by counter masses on the opposite side of the rotor such that the center of rotational inertia is axial relative to the motor.
- the centrifuge motor may provide positional data to a computer which can then control the rest position of the rotor (typically vertical before and after centrifugation).
- JV is the rotational speed, measured in revolutions per unit of time.
- a centrifuge may be a horizontally oriented centrifuge with a swinging bucket design.
- the axis of rotation of the centrifuge is vertical. In alternate embodiments, the axis of rotation can be horizontal or at any angle.
- the centrifuge may be capable of simultaneously spinning two or more vessels and may be designed to be fully integrated into an automated system employing computer-controlled pipettes. In some embodiments, the vessels may be close-bottomed.
- the swinging bucket design may permit the centrifugation vessels to be passively oriented in a vertical position when stopped, and spin out to a fixed angle when spinning. In some embodiments, the swinging buckets may permit the centrifugation vessels to spin out to a horizontal orientation.
- centrifuge with swinging bucket design may meet the positional accuracy and repeatability requirements of a robotic system a number of positioning systems are employed.
- a computer-based control system may use position information from an optical encoder in order to spin the rotor at controlled slow speeds. Because an appropriate motor could be designed for high-speed performance, accurate static positions need not be held using position feedback alone. In some embodiments, a cam in combination with a solenoid-actuated lever may be employed to achieve very accurate and stable stopping at a fixed number of positions. Using a separate control system and feedback from Hall-Effect sensors built into the motor, the velocity of the rotor can be very accurately controlled at high speeds.
- the design of the centrifuge preferably minimizes or reduces vibration.
- the rotor may be aerodynamically designed with a smooth exterior - fully enclosing the buckets when they are in their horizontal position. Also, vibration dampening can be employed in multiple locations in the design of the case.
- a centrifuge rotor can be a component of the system which may hold and spin the centrifugation vessel(s).
- the axis of rotation can be vertical, and thus the rotor itself can be positioned horizontally.
- different axes of rotation and rotor positions can be employed.
- Alternative configurations are possible in which buckets are oriented with radial symmetry, for example three buckets oriented at 120 degrees. Any number of buckets may be provided, including but not limited to 1, 2, 3, 4, 5, 6, 7, 8, or more buckets.
- the buckets can be evenly spaced from one another. For example, if n buckets are provided where n is a whole number, then the buckets may be spaced about 360/ « degrees apart from one another. In other embodiments, the buckets need not be spaced evenly around one another or with radial symmetry.
- FIG 111 shows an example of a rotor at rest with buckets vertical. In some embodiments, the buckets may passively fall to a predetermined angle that may or may not be vertical. When the rotor spins, the buckets are forced into a nearly horizontal position or to a predetermined angle by centrifugal forces.
- Figure 112 shows an example of a rotor at a speed with buckets at a small angle to horizontal. There can be physical hard stops for both the vertical and horizontal positions acting to enforce their accuracy and positional repeatability.
- the rotor may be aerodynamically designed with a disk shape, and as few physical features as possible in order to minimize vibration caused by air turbulence.
- the outer geometry of the bucket may exactly match that of the rotor such that when the rotor is spinning and the bucket can be forced horizontal the bucket and rotor can be perfectly aligned.
- the rotor may be angled down toward the ground relative to the horizon. Because the angle of the bucket can be matched to that of the rotor, this may enforce a fixed spinning angle for the bucket. The resulting pellet from such a configuration could be angled relative to the vessel when placed upright.
- a narrow extraction tip may be used to aspirate plasma from the top of the centrifugation vessel. By placing the extraction tip near the bottom of the slope created by the angle pellet, the final volume of plasma can be more efficiently extracted without disturbing the sensitive buffy coat.
- a variety of tubes designs can be accommodated in the buckets of the device.
- the various tube designs may be closed ended. Some are shaped like conventional centrifuge tubes with conical bottoms. Other tube designs may be cylindrical. Tubes with a low ratio of height to cross- sectional area may be favored for cell processing. Tubes with a large ratio (>10: 1) may be suitable for accurate measurement of hematocrit and other imaging requirements. However, any height to cross-sectional area ratio may be employed.
- the buckets can be made of any of several plastics (polystyrene, polypropylene), or any other material discussed elsewhere herein. Buckets have capacities ranging from a few microliters to about a milliliter. The tubes may be inserted into and removed from the centrifuge using a "pick and place" mechanism.
- a dual control system approach may be used.
- a position based control system may be implemented.
- the control system may employ a PID (Proportional Integral
- Positional feedback for the position controller may be provided by a high-resolution optical encoder.
- a velocity controller may be implemented, while employing a PID control system tuned for velocity control.
- Rotational rate feedback for the velocity controller may be provided by a set of simple Hall-Effect sensors placed on the motor shaft. Each sensor may generate a square wave at one cycle per motor shaft rotation.
- a physical stopping mechanism may be employed.
- the stopping mechanism may use a cam, coupled to the rotor, along with a solenoid-actuated lever.
- the cam may be shaped like a circular disk with a number of "C" shaped notches machined around the perimeter.
- To position the centrifuge rotor its rotational velocity may first be lowered to, at most, 30RPM.
- the rotational velocity may be lowered to any other amount, including but not limited to about 5 rpm, 10 rpm, 15 rpm, 20 rpm, 25 rpm, 35 rpm, 40 rpm, or 50 rpm
- the lever may be actuated.
- a cam follower which may glide along the perimeter of the cam with minimal friction. Once the cam follower reaches the center of a particular notch in the cam, the force of the solenoid-actuated lever can overcome that of the motor and the rotor may be brought to a halt. At that point the motor may be electronically braked, and, in combination with the stopping mechanism a rotational position can be very accurately and firmly held indefinitely.
- the centrifuge swing-out buckets may be configured to accommodate different type of centrifuge tubes.
- the various tube types may have a collar or flange at their upper (open) end. This collar or flange feature may rests on the upper end of the bucket and support the tube during centrifugation.
- Conical and cylindrical tubes of various lengths and volumes can be accommodated.
- Figures 113, 114, and 115 provide examples of buckets and other bucket designs may be employed.
- Figure 113 shows an example of a bucket configuration.
- the bucket may have side portions that mate with the centrifuge and allow the bucket to swing freely.
- the bucket may have a closed bottom and an opening at the top.
- Figure 114 shows an example of a centrifugation vessel mated with the bucket.
- the bucket may be shaped to accept various configurations of centrifugation vessels.
- the centrifugation vessel may have one or more protruding member that may rest upon the bucket.
- the centrifugation vessel may be shaped with one or more feature that may mate with the centrifugation bucket.
- the feature may be a shaped feature of the vessel or one or more protrusion.
- Figure 115 shows an example of another centrifugation vessel that can be mated with the bucket.
- the bucket can have one or more shaped feature that may allow different configurations of centrifugation vessels to mate with the bucket.
- the centrifuge tube and extraction tip may be provided individually and can be mated together for extraction of material following centrifugation.
- the centrifugation tube and extraction tip may be designed to deal with complex processes in an automated system.
- Figure 116 shows an example of a centrifugation vessel.
- Figure 117 shows an example of an extraction tip.
- Figure 118 provides an example of how the centrifugation vessel and extraction tip may mate. Any dimensions are provided by way of example only, and other dimensions of the same or differing proportions may be utilized.
- the system can enable one or more of the following:
- a custom vessel and tip may be used for the operation of the centrifuge in order to satisfy the variety of constraints placed on the system.
- the centrifugation vessel may be a closed bottom tube designed to be spun in the centrifuge.
- the centrifugation vessel may be the vessel illustrated in Figure 116 or may have one or more features illustrated in Figure 116. It may have a number of unique features enabling the wide range of required functionality including hematocrit measurement, BC lysing, pellet re- suspension and efficient plasma extraction.
- the extraction tip may be designed to be inserted into the centrifugation vessel for precise fluid extraction, and pellet re-suspension.
- the extraction tip may be the tip illustrated in Figure 117 or may have one or more features illustrated in Figure 117.
- the centrifugation vessel may be designed to handle two separate usage scenarios, each associated with a different anti-coagulant and whole blood volume.
- V(d) d*7il .25mm 2 .
- the sacrificed volume could be 1.23uL for the 60% hematocrit case. This volume can be decreased by decreasing the internal radius of the hematocrit portion of the centrifugation vessel.
- the existing dimensions of the centrifugation vessel may be close to the minimum.
- the hematocrit be measured using computer vision.
- the total height for a given volume of hematocrit may be maximized by minimizing the internal diameter of the narrow portion of the vessel. By maximizing the height, the relationship between changes in hematocrit volume and physical change in column height may be optimized, thus increasing the number of pixels that can be used for the measurement.
- the height of the narrow portion of the vessel may also be long enough to accommodate the worst-case scenario of 80% hematocrit while still leaving a small portion of plasma at the top of the column to allow for efficient extraction.
- 40uL*80% 32uL may be the required volume capacity for accurate measurement of the hematocrit.
- the volume of the narrow portion of the tip as designed may be about 35.3uL which may allow for some volume of plasma to remain, even in the worst case.
- a second usage scenario is much more involved, and may require one, more, or all of the following:
- a physical feature may be added to the bottom of the centrifugation vessel.
- this feature may comprise four small hemispherical nubs placed around the perimeter of the bottom portion of the vessel.
- the maximum expected fluid volume is 60uL, which, along with 25uL displaced by the extraction tip may demand a total volume capacity of 85uL.
- a design with a current maximum volume of lOOuL may exceed this requirement.
- Other aspects of the second usage scenario require similar or already discussed tip characteristics.
- the upper geometry of the centrifugation vessel may be designed to mate with a pipette nozzle. Any pipette nozzle described elsewhere herein or known in the art may be used.
- the external geometry of the upper portion of the vessel may exactly match that of a reaction tip which both the current nozzle and cartridge may be designed around.
- a small ridge may circumscribe the internal surface of the upper portion. This ridge may be a visual marker of the maximum fluid height, meant to facilitate automatic error detection using computer vision system.
- the distance from the bottom of the fully mated nozzle to the top of the maximum fluid line is 2.5mm. This distance is 1.5mm less than the 4mm recommended distance adhered to by the extraction tip. This decreased distance may be driven by the need to minimize the length of the extraction tip while adhering to minimum volume requirements. The justification for this decreased distance stems from the particular use of the vessel. Because, in some implementations, fluid may be exchanged with the vessel from the top only, the maximum fluid it will ever have while mated with the nozzle is the maximum amount of whole blood expected at any given time (40uL). The height of this fluid may be well below the bottom of the nozzle.
- the volume of fluid in the vessel may be much greater than this and wet the walls of up to the height of the nozzle. In some embodiments, it will be up to those using the vessel to ensure that the meniscus of any fluids contained within the vessel do not exceed the max fluid height, even if the total volume is less than the maximum specified. In other embodiments, other features may be provided to keep the fluid contained within the vessel.
- the centrifugation vessel can be subjected to a number of forces during the process of exchanging fluids and rapidly inserting and removing tips. If the vessel is not constrained, it is possible that these forces will be strong enough to lift or otherwise dislodge the vessel from the centrifuge bucket. In order to prevent movement, the vessel should be secured in some way. To accomplish this, a small ring circumscribing the bottom exterior of the vessel was added. This ring can easily be mated with a compliant mechanical feature on the bucket. As long as the retaining force of the nub is greater than the forces experienced during fluid manipulations, but less than the friction force when mated with the nozzle then the problem is solved.
- the Extraction Tip may be designed to interface with the centrifugation vessel, efficiently extracting plasma, and re-suspending pelleted cells. Where desired, its total length (e.g., 34.5 mm) may exactly match that of another blood tip including but not limited to those described in US. Serial No. 12/244,723 (incorporated herein by reference) but may be long enough to physically touch the bottom of the centrifugation vessel. The ability to touch the bottom of the vessel may be required in some embodiments, both for the re- suspension process, and for complete recovery of the white cell suspension.
- the required volume of the extraction tip may be determined by the maximum volume it is expected to aspirate from the centrifugation vessel at any given time. In some embodiments, this volume may be approximately 60uL, which may be less than the maximum capacity of the tip which is 85uL. In some embodiments, a tip of greater volume than required volume may be provided. As with the centrifugation vessel, an internal feature circumscribing the interior of the upper portion of the tip may be used to mark the height of this maximum volume. The distance between the maximum volume line and the top of the mated nozzle may be 4.5mm, which may be considered a safe distance to prevent nozzle contamination. Any sufficient distance to prevent nozzle contamination may be used.
- the centrifuge may be used to sediment precipitated LDL-cholesterol. Imaging may be used to verify that the supernatant is clear, indicating complete removal of the precipitate.
- plasma may be diluted (e.g., 1 : 10) into a mixture of dextran sulfate (25mg/dL) and magnesium sulfate (lOOmM), and may be then incubated for 1 minute to precipitate LDL-cholesterol.
- the reaction product may be aspirated into the tube of the centrifuge, capped then and spun at 3000 rpm for three minutes.
- Figures 119, 120, and 121 are images that were taken of the original reaction mixture prior to centrifugation (showing the white precipitate), following centrifugation (showing a clear supernatant) and of the LDL-cholesterol pellet (after removal of the cap), respectively.
- centrifuges that can be employed in the present invention are described in U.S. Patent Nos. 5,693,233, 5,578,269, 6,599,476 and U.S. Patent Publication Nos. 2004/0230400, 2009/0305392, and 2010/0047790, which are incorporated by reference in their entirety for all purposes.
- protocol may be used for centrifugation and processing.
- a typical protocol for use of the centrifuge to process and concentrate white cells for cytometry may include one or more of the following steps. The steps below may be provided in varying orders or other steps may be substituted for any of the steps below:
- the steps may include receiving a sample.
- the sample may be a bodily fluid, such as blood, or any other sample described elsewhere herein.
- the sample may be a small volume, such as any of the volume measurements described elsewhere herein.
- the sample may have an anti-coagulant.
- a separation step may occur.
- a density-based separation may occur. Such separation may occur via centrifugation, magnetic separation, lysis, or any other separation technique known in the art.
- the sample may be blood, and the red and white blood cells may be separated.
- a measurement may be made.
- the measurement may be made via imaging, or any other detection mechanism described elsewhere herein.
- the hematocrit of a separated blood sample may be made by imaging. Imaging may occur via a digital camera or any other image capture device described herein.
- One or more component of a sample may be removed. For example, if the sample is separated into solid and liquid components, the liquid component may be moved. The plasma of a blood sample may be removed. In some instances, the liquid component, such as plasma, may be removed via a pipette. The liquid component may be removed without disturbing the solid component.
- the imaging may aid in the removal of the liquid component, or any other selected component of the sample. For example, the imaging may be used to determine where the plasma is located and may aid in the placement of the pipette to remove the plasma.
- a reagent or other material may be added to the sample.
- the solid portion of the sample may be resuspended.
- a material may be added with a label.
- One or more incubation step may occur.
- a lysing and/or fixative reagent may be added. Additional separation and/or resuspending steps may occur. As needed, dilution and/or concentration steps may occur.
- the volume of the sample may be measured. In some instances, the volume of the sample may be measured in a precise and/or accurate fashion. The volume of the sample may be measured in a system with a low coefficient of variation, such as coefficient of variation values described elsewhere herein. In some instances, the volume of the sample may be measured using imaging. An image of the sample may be captured and the volume of the sample may be calculated from the image.
- the sample may be delivered to a desired process.
- the sample may be delivered for cytometry.
- a typical protocol that may or may not make use of the centrifuge for nucleic acid purification may include one or more of the following steps.
- the system may enable DNA/RNA extraction to deliver nucleic acid template to exponential amplification reactions for detection.
- the process may be designed to extract nucleic acids from a variety of samples including, but not limited to whole blood, serum, viral transfer medium, human and animal tissue samples, food samples, and bacterial cultures.
- the process may be completely automated and may extract DNA/RNA in a consistent and quantitative manner.
- the steps below may be provided in varying orders or other steps may be substituted for any of the steps below:
- the chaotropic- salt buffer may include one or more of the following: chao tropic salt such as, but not limited to, 3-6 M guanidine hydrochloride or guanidinium thiocyanate; sodium dodecyl sulfate (SDS) at a typical concentration of 0.1-5% v/v; ethylenediaminetetraacetic acid (EDTA) at a typical concentration of l-5mM; lysozyme at a typical concentration of 1 mg/mL; proteinase-K at a typical concentration of 1 mg/niL; and pH may be set at 7-7.5 using a buffer such as HEPES.
- the sample may be incubated in the buffer at typical temperature of 20-95 °C for 0-30 minutes. Isopropanol (50%-100% v/v) may be added to the mixture after
- Lysed sample may be exposed to a functionalized surface (often in the form of a packed bed of beads) such as, but not limited to, a resin-support packed in a chromatography style column, magnetic beads mixed with the sample in a batch style manner, sample pumped through a suspended resin in a fluidized-bed mode, and sample pumped through a closed channel in a tangential flow manner over the surface.
- a functionalized surface such as, but not limited to, a resin-support packed in a chromatography style column, magnetic beads mixed with the sample in a batch style manner, sample pumped through a suspended resin in a fluidized-bed mode, and sample pumped through a closed channel in a tangential flow manner over the surface.
- the surface may be functionalized so as to bind nucleic acids (e.g. DNA, RNA, DNA/ NA hybrid) in the presence of the lysis buffer.
- Surface types may include silica, and ion-exchange functional groups such as diethylaminoethanol (DEAE).
- Nucleic acids may be eluted from the surface by exposing the surface to water or buffer at pH 7-9. Elution may be performed in the same manner as loading.
- the pipetting device Liquids (typically isotonic buffered saline, a lysing agent, a mixture of a lysing agent and a fixative or a cocktail of labeled antibodies in buffer) may be dispensed into the centrifuge bucket and repeatedly aspirated and re- dispensed. The tip of the pipette may be forced into the packed cells to facilitate the process. Image analysis aids the process by objectively verifying that all the cells have been re-suspended.
- Liquids typically isotonic buffered saline, a lysing agent, a mixture of a lysing agent and a fixative or a cocktail of labeled antibodies in buffer
- the system may have pipetting, pick-and-place and centrifugal capabilities. Such capabilities may enable almost any type of sample pretreatment and complex assay procedures to be performed efficiently with very small volumes of sample.
- the system may enables separation of formed elements (red and white cells) from plasma.
- the system may also enable re-suspension of formed elements.
- the system may enable concentration of white cells from fixed and hemo lysed blood.
- the system may also enable lysis of cells to release nucleic acids.
- purification and concentration of nucleic acids by filtration through tips packed with (typically beaded) solid phase reagents (e.g. silica) may be enabled by the system.
- the system may also permit elution of purified nucleic acids following solid phase extraction. Removal and collection of precipitates (for example LDL-cholesterol precipitated using polyethylene glycol) may also be enabled by the system.
- the system may enable affinity purification.
- Small molecules such as vitamin-D and serotonin may be adsorbed onto beaded (particulate) hydrophobic substrates, then eluted using organic solvents.
- Antigens may be provided onto antibody-coated substrates and eluted with acid. The same methods can be used to concentrate analytes found at low concentrations such as thromboxane -B2 and 6-keto- prostaglandin Fla.
- Antigens may be provided onto antibody or aptamer-coated substrates and then eluted.
- the system may enable chemical modification of analytes prior to assay.
- serotonin (5-Hydroxytryptamine) for example, it may be required to convert the analyte to a derivative (such as an acetylated form) using a reagent (such as acetic anhydride). This may be done to produce a form of the analyte that can be recognized by an antibody.
- Liquids can be moved using the pipette (vacuum aspiration and pumping).
- the pipette may be limited to relatively low positive and negative pressures (approximately 0.1 - 2.0 atmospheres).
- a centrifuge can be used to generate much higher pressures when needed to force liquids through beaded solid phase media. For example, using a rotor with a radius of 5 cm at a speed of 10,000 rpm, forces of about 5,000 x g (about 7 atmospheres) may be generated, sufficient to force liquids through resistive media such as packed beds. Any of the centrifuge designs and configurations discussed elsewhere herein or known in the art may be used.
- Measurement of hematocrit with very small volumes of blood may occur.
- inexpensive digital cameras are capable of making good images of small objects even when the contrast is poor.
- the system of the present invention may enable automated measurement of hematocrit with a very small volume of blood.
- 1 uL of blood may be drawn into a microcap glass capillary.
- the capillary may then be sealed with a curable adhesive and then subject to centrifugation at 10,000 x g for 5 minutes.
- the packed cell volume may be easily measured and the plasma meniscus (indicated by an arrow) may also be visible so hematocrit can be accurately measured.
- the camera may be used "as is" without operation with a microscope to make a larger image.
- a microscope or other optical techniques may be used to magnify the image.
- the hematocrit was determined using the digital camera without additional optical interference, and the hematocrit measured was identical to that determined by a conventional microhematocrit laboratory method requiring many microliters of sample.
- the length of the sample column and of that of the column of packed red cells can be measured very precisely (+/- ⁇ 0.05 mm). Given that the blood sample column may be about 10 - 20 mm, the standard deviation of hematocrit may be much better than 1 % matching that obtained by standard laboratory methods.
- the system may enable measurement of erythrocyte sedimentation rate (ES ).
- ES erythrocyte sedimentation rate
- the ability of digital cameras to measure very small distances and rates of change of distances may be exploited to measure ESR.
- three blood samples (15 uL) were aspirated into "reaction tips”. Images were captured over one hour at two-minute intervals. Image analysis was used to measure the movement of the interface between red cells and plasma.
- Figure 122 shows results as distance of the interface from the plasma meniscus.
- the precision of the measurement may be estimated by fitting the data to a polynomial function and calculating the standard deviation of the difference between the data and the fitted curve (for all samples). In the example, this was determined to be 0.038 mm or ⁇ 2 % CV when related to the distance moved over one hour. Accordingly, ESR can be measured precisely by this method. Another method for determination of ESR is to measure the maximum slope of the distance versus time relationship.
- tips can be designed to accommodate a plurality of reactions or assays. Simultaneous measurement of several different assay mixtures and one or more controls or one or more calibrators can be made within one tip of the present invention. In doing this we exploit the ability to sample several liquid sources by sequential aspiration of liquids into the same tip. Effective segmentation and separation of the liquids is greatly improved by aspirating in sequence a small volume of air and a small volume of a wash solution which cleans the surface of the tips prior to aspiration of the next liquid of interest.
- tips can have conical shapes.
- an assay can require oxygen as a reactant.
- increasing availability of oxygen within a reaction can be achieved by moving the sample and/or assay mixture to a wide part of tip to increase surface area to volume ratio.
- solutions of bromphenol blue were aspirated into tips.
- the uppermost segments (aspirated first) 6 uL are from a two-fold dilution series (highest concentration (0.0781 mg/mL) to the right of the image, with the exception of the left-most tip which is a water blank).
- air (2 uL), wash solution (2 uL) respectively were aspirated followed by a 6 uL volume of a fixed concentration control solution (0.625 mg/mL).
- Average carry-over (from high concentration control to the water wash) is calculated at 1.4 %. Since, in effect, the leading zone (proximal to the earlier slug) of a later slug of liquid acts as second wash step and the color reading is taken at a location remote from this leading zone (typically at a central zone of the slug), the effective carryover from one slug to the next is typically much less than 1 % and therefore generally insignificant.
- the dilution series is measured using only dilution series samples to fill the tips, results are identical with those obtained above. The above represents a "stress test" designed to evaluate the extent of carry-over.
- Figure 98 shows a tip containing reaction products for two commercially available assays for ionized calcium, Ca2+ (upper segment) and magnesium Mg2+ (lower segment) that were aspirated into tips for measurement.
- Ca2+ concentrations used in this experiment are 0, 2.5, 5, 10, 20, and 40 mg/dL; Mg2+ concentrations are 0, 1.25, 2.5, 5, 10, 20 mg/dL.
- Assay reaction mixtures (6 uL [Ca2+] and 4 uL [Mg2+]) are well separated using 2 uL of air, 3 uL of wash and a further 4 uL of air. Results for each assay read in this way are essentially identical to those measured having only one assay reaction mixture per tip.
- the present invention allows for simultaneous evaluation of a plurality of assays. Images can be made of many assay cuvettes in the same field of view. Specifically, simultaneous evaluation of assays and controls in the same assay cuvette can be performed. Simultaneous evaluation of several assays in the same assay cuvette can be also performed.
- a system can comprise a heating block for heating the assay or assay unit and/or for control of the assay temperature. Heat can be used in the incubation step of an assay reaction to promote the reaction and shorten the duration necessary for the incubation step.
- a system can comprise a heating block configured to receive an assay unit of the invention.
- the heating block can be configured to receive a plurality of assay units from a device of the invention. For example, if 8 assays are desired to be run on a device, the heating block can be configured to receive 8 assay units.
- assay units can be moved into thermal contact with a heating block using the means for moving the assay units. The heating can be performed by a heating means known in the art.
- Assay protocols for analyzing samples can be optimized in a variety of manners. When multiple assays are to be run on a sample, all protocols can be optimized to the most stringent reaction conditions, or each assay protocol can be optimized based on the desired performance of a particular assay.
- a single protocol that can be designed to meet the test requirements under all possible use cases.
- a single protocol may be specified based on the case when all tests on the cartridge are to be performed (i.e., the limiting case).
- This protocol can be designed to meet the minimal test requirements, such as the precision and dynamic range for each test on the cartridge.
- this approach can be suboptimal for alternate use cases, for example, when only a subset of tests on the cartridge is to be performed.
- some assays can achieve improved performance in terms of sensitivity and precision. There can be a trade-off between how much sample is allocated to an assay and assay sensitivity.
- an assay which has a sensitivity of 1 unit/mL when the sample is diluted 1 : 100 may be able to detect 0.1 unit/mL if the dilution factor is increased to 1 : 10.
- One downside of using a lower dilution factor in a multiplexed assay system with restricted sample volume can be that the fraction of the sample required for this assay is increased by 10-fold even when using the minimal volume to perform the assay.
- assay precision may be improved by using a higher sample concentration.
- an assay which results in a signal of (say) 0.1 absorbance +/- 0.02 (20 % signal imprecision) at its limit of detection can be improved by use of 10 times the sample concentration such that the signal produced is 10 times greater giving a signal of 0.1 +/1 0.02 OD at an analyte concentration ten times lower and at signal of 1.0, +/- 0.02 the imprecision is now only 2 %.
- typically assay signal at the lower range of analyte concentrations
- the signal imprecision can be typically related to the square root of the signal and so increases as the square root of analyte concentration (and sample concentration).
- the coefficient of variation (CV) of the signal can be inversely proportional to the square root of the signal; such that a 10-fold increase in signal corresponds to approximately three-fold decrease in signal CV. Since concentration CV is typically directly related to signal CV, the concentration CV will decrease with increased sample concentration (decreased dilution).
- Protocols can be optimized to specific use cases rather than the typical one-size fits all approach described above. For example, the protocol may be optimized to enhance the precision of each test being performed in the multiplex device. Moreover, some tests may be prioritized relative to other tests for optimization. Protocol optimization can be pre-computed for use cases that are known a priori. Protocol optimization can also be performed in real-time for new use cases not known a priori. System validation can be performed to span the suite of use cases.
- Protocol optimization is described below comparing two uses cases. For both use cases, 8 uL of undiluted sample is available to run the required tests. In this example, the multiplex cartridge has 20 tests on board, where 5 of the tests require 1 :5 dilution and 15 of the tests require 1 :25 dilution.
- Sample usage is 0.8 uL undiluted sample per assay for a total of 8 uL. Since the sample concentration in the assay is increased by 5-fold relative to that for use-case A, the assay sensitivity is improved by a factor of 5 and the assay imprecision is reduced by about 2.4 (5 ⁇ 0.5) fold to about 4.5 %.
- use case B By re-optimizing the protocol, in use case B employs 5-times as much original sample for each test, thereby improving overall performance. Note that the above discussion does not account for any imprecision due to errors in metering of volumes but only addresses errors due to imprecision in measurement of optical signal. Use-case B would have a lower imprecision due to imprecision in volumes since it uses fewer pipetting steps.
- the signal imprecision is equal to the square root of the signal and thus the signal CV is 100/ (square root of signal). For example, a signal of 10,000 counts will have a CV of 1 %.
- the signal is almost exactly proportional to analyte concentration, at least at the lower concentration range).
- the measured analyte imprecision scales with 1/ (square root of signal) for concentrations significantly above the limit of detection. In assays which utilize dilution of the sample, the measured analyte imprecision will therefore scale as 1/ (sample dilution).
- an assay using a 1 : 100 dilution of sample will have signal and concentration CVs about 3.2 fold (10 ⁇ 0.5) higher than an assay using a dilution 1: 10 (and will also have a sensitivity about 10 -times higher).
- a variety of assays may be performed on a fluidic device according to the present invention to detect an analyte of interest in a sample.
- a label is utilized in the assay, one may choose from a wide diversity of labels is available in the art that can be employed for conducting the subject assays.
- labels are detectable by spectroscopic, photochemical, biochemical, electrochemical, immunochemical, or other chemical means.
- useful nucleic acid labels include the, fluorescent dyes, electron-dense reagents, and enzymes.
- a wide variety of labels suitable for labeling biological components are known and are reported extensively in both the scientific and patent literature, and are generally applicable to the present invention for the labeling of biological components.
- Suitable labels include, enzymes, fluorescent moieties, chemiluminescent moieties, bioluminescent labels, or colored labels.
- Reagents defining assay specificity optionally include, for example, monoclonal antibodies, polyclonal antibodies, aptamers, proteins, nucleic acid probes or other polymers such as affinity matrices, carbohydrates or lipids. Detection can proceed by any of a variety of known methods, including spectrophotometric or optical tracking of fluorescent, or luminescent markers, or other methods which track a molecule based upon size, charge or affinity.
- a detectable moiety can be of any material having a detectable physical or chemical property.
- a label includes without limitation any composition detectable by spectroscopic, photochemical, biochemical, immunochemical, nucleic acid probe -based, electrical, optical thermal, or other chemical means.
- the label (such as a colored compound, fluor or enzyme) is coupled directly or indirectly to a molecule to be detected, according to methods well known in the art.
- the label is attached to a receptor for the analyte (such as an antibody, nucleic acid probe, aptamer etc.).
- a receptor for the analyte such as an antibody, nucleic acid probe, aptamer etc.
- Non-radioactive labels are often attached by indirect means.
- a receptor specific to the analyte is linked to a signal-generating moiety.
- the analyte receptor is linked to an adaptor molecule (such as biotin or avidin) and the assay reagent set includes a binding moiety (such as a biotinylated reagent or avidin) that binds to the adaptor and to the analyte.
- the analyte binds to a specific receptor on the reaction site.
- a labeled reagent can form a sandwich complex in which the analyte is in the center.
- the reagent can also compete with the analyte for receptors on the reaction site or bind to vacant receptors on the reaction site not occupied by analyte.
- the label is either inherently detectable or bound to a signal system, such as a detectable enzyme, a fluorescent compound, a chemiluminescent compound, or a chemiluminogenic entity such as an enzyme with a luminogenic substrate.
- a signal system such as a detectable enzyme, a fluorescent compound, a chemiluminescent compound, or a chemiluminogenic entity such as an enzyme with a luminogenic substrate.
- ligands and anti-ligands can be used. Where a ligand has a natural anti-ligand, for example, biotin, thyroxine, digoxigenin, and Cortisol, it can be used in conjunction with labeled, anti-ligands. Alternatively, any haptenic or antigenic compound can be used in combination with an antibody.
- Enzymes of interest as labels will primarily be hydrolases, particularly phosphatases, esterases and glycosidases, or oxidoreductases, particularly peroxidases.
- Fluorescent compounds include fluorescein and its derivatives, rhodamine and its derivatives, dansyl groups, and umbelliferone.
- Chemiluminescent compounds include dioxetanes, acridinium esters, luciferin, and 2,3-dihydrophthalazinediones, such as luminol.
- the label is fluorescent
- it may be detected by exciting the fluorochrome with light of an appropriate wavelength and detecting the resulting fluorescence by, for example, microscopy, visual inspection, via photographic film, by the use of electronic detectors such as digital cameras, charge coupled devices (CCDs) or photomultipliers and phototubes, or other detection devices.
- electronic detectors such as digital cameras, charge coupled devices (CCDs) or photomultipliers and phototubes, or other detection devices.
- enzymatic labels are detected by providing appropriate substrates for the enzyme and detecting the resulting reaction product spectroscopically or by digital imaging (the subject of the present invention).
- simple colorimetric labels are often detected simply by observing the color associated with the label. For example, colloidal gold sols often appear pink, while various beads doped with dyes are strongly colored.
- the detectable signal may be provided by luminescence sources.
- Luminescence is the term commonly used to refer to the emission of light from a substance for any reason other than a rise in its temperature.
- atoms or molecules emit photons of electromagnetic energy (e.g., light) when they transition from an excited state to a lower energy state (usually the ground state).
- the exciting agent is a photon
- the luminescence process is referred to as photo luminescence or fluorescence.
- the exciting cause is an electron
- the luminescence process can be referred to as electroluminescence. More specifically, electroluminescence results from the direct injection and removal of electrons to form an electron-hole pair, and subsequent recombination of the electron-hole pair to emit a photon.
- Luminescence which results from a chemical reaction is usually referred to as chemiluminescence.
- Luminescence produced by a living organism is usually referred to as bioluminescence.
- the photoluminescence process is usually referred to as fluorescence.
- fluorescence emissions do not persist after the exciting cause is removed as a result of short-lived excited states which may rapidly relax through such spin allowed transitions.
- photoluminescence is the result of a spin forbidden transition (e.g., a triplet-singlet transition)
- the photoluminescence process is usually referred to as phosphorescence.
- phosphorescence emissions persist long after the exciting cause is removed as a result of long-lived excited states which may relax only through such spin-forbidden transitions.
- a luminescent label may have any one of the above -described properties.
- Suitable chemiluminescent sources include a compound which becomes electronically excited by a chemical reaction and may then emit light which serves as the detectible signal or donates energy to a fluorescent acceptor.
- a diverse number of families of compounds have been found to provide chemiluminescence under a variety of conditions.
- One family of compounds is 2,3-dihydro-l,4- phthalazinedione.
- a frequently used compound is luminol, which is a 5-amino compound.
- Other members of the family include the 5-amino-6, 7, 8-trimethoxy- and the dimethylamino[ca]benz analog. These compounds can be made to luminesce with alkaline hydrogen peroxide or calcium hypochlorite and base.
- Another family of compounds is the 2,4,5-triphenylimidazoles, with lophine as the common name for the parent product.
- Chemiluminescent analogs include para-dimethylamino and -methoxy substituents. Chemiluminescence may also be obtained with oxalates, usually oxalyl active esters, for example, p-nitrophenyl and a peroxide such as hydrogen peroxide, under basic conditions. Other useful chemiluminescent compounds that are also known include -N-alkyl acridinum esters and dioxetanes. Alternatively, luciferins may be used in conjunction with luciferase or lucigenins to provide bioluminescence. Especially preferred chemiluminescent sources are "luminogenic" enzyme substrates such as dioxetane -phosphate esters.
- luminescent substrates for enzymes is particularly preferred because the enzyme acts as an amplifier capable of converting thousands of substrate molecules per second to product. Luminescence methods are also preferred because the signal (light) can be detected both very sensitively and over a huge dynamic range using PMTs.
- analytes as used herein includes without limitation drugs, prodrugs, pharmaceutical agents, drug metabolites, biomarkers such as expressed proteins and cell markers, antibodies, serum proteins, cholesterol and other metabolites, electrolytes, metal ions, polysaccharides, nucleic acids, biological analytes, biomarkers, genes, proteins, hormones, or any combination thereof.
- Analytes can be combinations of polypeptides, glycoproteins, polysaccharides, lipids, and nucleic acids.
- the system can be used to detect and/or quantify a variety of analytes.
- analytes that can be detected and/or quantified include Albumin, Alkaline Phosphatase, ALT, AST, Bilirubin (Direct), Bilirubin (Total), Blood Urea Nitrogen (BUN), Calcium, Chloride, Cholesterol, Carbon Dioxide (C0 2 ), Creatinine, Gamma-glutamyl-transpeptidase (GGT), Globulin, Glucose, HDL-cholesterol, Hemoglobin, Homocysteine, Iron, Lactate Dehydrogenase, Magnesium, Phosphorous, Potassium, Sodium, Total Protein, Triglycerides, and Uric Acid.
- the detection and/or quantification of these analytes can be performed using optical, electrical, or any other type of measurements.
- biomarkers which are associated with a particular disease or with a specific disease stage.
- Such analytes include but are not limited to those associated with autoimmune diseases, obesity, hypertension, diabetes, neuronal and/or muscular degenerative diseases, cardiac diseases, endocrine disorders, metabolic disorders, inflammation, cardiovascular diseases, sepsis, angiogenesis, cancers,
- Alzheimer's disease Alzheimer's disease, athletic complications, and any combinations thereof.
- biomarkers that are present in varying abundance in one or more of the body tissues including heart, liver, prostate, lung, kidney, bone marrow, blood, skin, bladder, brain, muscles, nerves, and selected tissues that are affected by various disease, such as different types of cancer (malignant or non- metastatic), autoimmune diseases, inflammatory or degenerative diseases.
- body tissues including heart, liver, prostate, lung, kidney, bone marrow, blood, skin, bladder, brain, muscles, nerves, and selected tissues that are affected by various disease, such as different types of cancer (malignant or non- metastatic), autoimmune diseases, inflammatory or degenerative diseases.
- analytes that are indicative of a microorganism, virus, or Chlamydiaceae.
- exemplary microorganisms include but are not limited to bacteria, viruses, fungi and protozoa.
- Analytes that can be detected by the subject method also include blood-born pathogens selected from a non- limiting group that consists of Staphylococcus epidermidis, Escherichia coli, methicillin-resistant Staphylococcus aureus (MSRA), Staphylococcus aureus, Staphylococcus hominis, Enterococcus faecalis, Pseudomonas aeruginosa, Staphylococcus capitis, Staphylococcus warneri, Klebsiella pneumoniae, Haemophilus influenzae,
- MSRA methicillin-resistant Staphylococcus aureus
- Staphylococcus aureus Staphylococcus hominis
- Staphylococcus simulans Streptococcus pneumoniae and Candida albicans.
- Analytes that can be detected by the subject method also encompass a variety of sexually transmitted diseases selected from the following: gonorrhea (Neisseria gonorrhoeae), syphilis (Treponena pallidum), clamydia (Clamyda tracomitis), nongonococcal urethritis (Ureaplasm urealyticum), yeast infection (Candida albicans), chancroid (Haemophilus ducreyi), trichomoniasis (Trichomonas vaginalis), genital herpes (HSV type I & II), HIV I, HIV II and hepatitis A, B, C, G, as well as hepatitis caused by TTV.
- gonorrhea Neisseria gonorrhoeae
- syphilis Teponena pallidum
- clamydia Clamyda tracomitis
- Additional analytes that can be detected by the subject methods encompass a diversity of respiratory pathogens including but not limited to Pseudomonas aeruginosa, methicillin-resistant
- Staphlococccus aureus (MSRA), Klebsiella pneumoniae, Haemophilis influenzae, Staphlococcus aureus, Stenotrophomonas maltophilia, Haemophilis parainfluenzae, Escherichia coli, Enterococcus faecalis, Serratia marcescens, Haemophilis parahaemolyticus, Enterococcus cloacae, Candida albicans, Moraxiella catarrhalis, Streptococcus pneumoniae, Citrobacter freundii, Enterococcus faecium, Klebsella oxytoca, Pseudomonas fluorscens, Neiseria meningitidis, Streptococcus pyogenes, Pneumocystis carinii, Klebsella pneumoniae Legionella pneumophila, Mycoplasma pneumoniae, and Mycobacterium tuberculos
- exemplary markers according to the present invention: Theophylline, CRP, CKMB, PSA, Myoglobin, CA125, Progesterone, TxB2, 6-keto-PGF-l-alpha, and Theophylline, Estradiol , Lutenizing hormone, Triglycerides, Tryptase, Low density lipoprotein Cholesterol, High density lipoprotein Cholesterol, Cholesterol, IGFR.
- liver markers include without limitation LDH, (LD5), Alanine-aminotransferase (ALT), Arginase 1 (liver type), Alpha-fetoprotein (AFP), Alkaline phosphatase, Lactate dehydrogenase, and Bilirubin.
- kidney markers include without limitation TNFa Receptor, Cystatin C, Lipocalin-type urinary prostaglandin D, synthatase (LPGDS), Hepatocyte growth factor receptor, Polycystin 2, Polycystin 1, Fibrocystin, Uromodulin, Alanine, aminopeptidase, N-acetyl-B-D-glucosaminidase, Albumin, and Retinol- binding protein (RBP).
- Exemplary heart markers include without limitation Troponin I (Tnl), Troponin T (TnT), Creatine dinase (CK), CKMB, Myoglobin, Fatty acid binding protein (FABP), C-reactive protein (CRP), Fibrinogen D- dimer, S-100 protein, Brain natriuretic peptide (BNP), NT-proBNP, PAPP-A, Myeloperoxidase (MPO), Glycogen phosphorylase isoenzyme BB (GPBB), Thrombin Activatable Fibrinolysis Inhibitor (TAFI), Fibrinogen, Ischemia modified albumin (IMA), Cardiotrophin-1, and MLC-I (Myosin Light Chain-I).
- Tnl Troponin I
- TnT Troponin T
- CK Creatine dinase
- CRP C-reactive protein
- Fibrinogen D- dimer S-100 protein
- BNP Brain natriuretic peptide
- pancrease markers include without limitation Amylase, Pancreatitis-Associated protein (PAP-1), and Regeneratein proteins (REG).
- PAP-1 Pancreatitis-Associated protein
- REG Regeneratein proteins
- Exemplary muscle tissue markers include without limitation Myostatin.
- Exemplary blood markers include without limitation Erythopoeitin (EPO).
- EPO Erythopoeitin
- Exemplary bone markers include without limitation, Cross-linked N-telopeptides of bone type I collagen (NTx), Carboxyterminal cross-linking telopeptide of bone collagen, Lysyl-pyridinoline
- Procollagen type I N propeptide Osteocalcin (bone gla-protein), Alkaline phosphatase, Cathepsin K, COMP (Cartillage Oligimeric Matrix Protein), Osteocrin, Osteoprotegerin (OPG), RANKL, sRANK , TRAP 5 (TRACP 5), Osteoblast Specific Factor 1 (OSF-1, Pleiotrophin), Soluble cell adhesion molecules, sTfR, sCD4, sCD8, sCD44, and Osteoblast Specific Factor 2 (OSF-2, Periostin).
- markers according to the present invention are disease specific.
- Exemplary cancer markers include without limitation PSA (total prostate specific antigen), Creatinine, Prostatic acid phosphatase, PSA complexes, Prostrate-specific gene-1, CA 12-5, Carcinoembryonic Antigen (CEA), Alpha feto protein (AFP) , hCG (Human chorionic gonadotropin), Inhibin, CAA Ovarian C1824, CA 27.29, CA 15-3, CAA Breast CI 924, Her-2, Pancreatic, CA 19-9, , CAA pancreatic, Neuron-specific enolase, Angiostatin DcR3 (Soluble decoy receptor 3), Endostatin, Ep-CAM (MK-1), Free Immunoglobulin Light Chain Kappa, Free Immunoglobulin Light Chain Lambda, Herstatin, Chromogranin A, Adrenomedullin, Integrin, Epidermal growth factor receptor, Epidermal growth factor receptor-
- Exemplary infectious disease conditions include without limitation: Viremia, Bacteremia, Sepsis, and markers: PMN Elastase, PMN elastase/ al-PI complex, Surfactant Protein D (SP-D), HBVc antigen, HBVs antigen, Anti-HBVc, Anti-HIV, T-supressor cell antigen, T-cell antigen ratio, T-helper cell antigen, Anti-HCV, Pyrogens, p24 antigen, Muramyl-dipeptide.
- SP-D Surfactant Protein D
- HBVc antigen HBVs antigen
- Anti-HBVc Anti-HIV
- T-supressor cell antigen T-cell antigen ratio
- T-helper cell antigen Anti-HCV
- Pyrogens Pyrogens
- p24 antigen Muramyl-dipeptide.
- Exemplary diabetes markers include without limitation C-Peptide, Hemoglobin Ale, Glycated albumin, Advanced glycosylation end products (AGEs), 1,5-anhydroglucitol, Gastric Inhibitory Polypeptide, Glucose, Hemoglobin Ale, ANGPTL3 and 4.
- Exemplary inflammation markers include without limitation Rheumatoid factor (RF), Antinuclear RF
- ANA Antibody
- C-reactive protein C-reactive protein
- Clara Cell Protein Uteroglobin
- Exemplary allergy markers include without limitation Total IgE and Specific IgE.
- autism markers include without limitation Ceruloplasmin, Metalothioneine, Zinc,
- Exemplary coagulation disorders markers include without limitation b-Thromboglobulin, Platelet factor 4, Von Willebrand factor.
- a marker may be therapy specific. Markers indicative of the action of COX inhibitors include without limitation TxB2 (Cox-1), 6-keto-PGF-l -alpha (Cox 2), 11-Dehydro-TxB-la (Cox-1).
- markers of the present invention include without limitation Leptin, Leptin receptor, and Procalcitonin, Brain S100 protein, Substance P, 8-Iso-PGF-2a.
- Exemplary geriatric markers include without limitation, Neuron-specific enolase, GFAP, and S100B.
- Exemplary markers of nutritional status include without limitation Prealbumin, Albumin, Retinol- binding protein (RBP), Transferrin, Acylation- Stimulating Protein (ASP), Adiponectin, Agouti-Related Protein (AgRP), Angiopoietin-like Protein 4 (ANGPTL4, FIAF), C-peptide, AFABP (Adipocyte Fatty Acid Binding Protein, FABP4), Acylation- Stimulating Protein (ASP), EFABP (Epidermal Fatty Acid Binding Protein, FABP5), Glicentin, Glucagon, Glucagon-Like Peptide- 1, Glucagon-Like Peptide-2, Ghrelin, Insulin, Leptin, Leptin Receptor, PYY, RELMs, Resistin, amd sTfR (soluble Transferrin Receptor).
- Exemplary markers of Lipid metabolism include without limitation Apo-lipoproteins (several), Apo
- Exemplary coagulation status markers include without limitation Factor I: Fibrinogen, Factor II:
- Factor XI Plasma thromboplastin antecedent
- Factor XII Hageman factor
- Factor XIII Fibrin-stabilizing factor
- Plasminogen activator inhibitor 1 Plasminogen activator inhibitor 1 (PAH).
- Exemplary monoclonal antibodies include those for EGF , ErbB2, and IGF1R.
- Exemplary tyrosine kinase inhibitors include without limitation Abl, Kit, PDGFR, Src, ErbB2,
- ErbB 4 EGFR, EphB, VEGFR1-4, PDGFRb, FLt3, FGFR, PKC, Met, Tie2, RAF, and TrkA.
- Exemplary Serine/Threonine Kinase Inhibitors include without limitation AKT, Aurora A/B/B,
- CDK CDK
- CDK pan
- CDKl-2 VEGFR2
- PDGFRb CDK4/6
- MEK1-2 mTOR
- PKC-beta PKC-beta
- GPCR targets include without limitation Histamine Receptors, Serotonin Receptors, Angiotensin
- Prostaglandin Receptors and ADP Receptors.
- Measurement of metabolites can be performed by production of a colored product using oxidases (such as cholesterol oxidase) (to make H202) and horse-radish peroxidase plus a chromogen (such as N-Ethyl- N-(2-hydroxy-3-sulfopropyl)-3,5-dimethoxyaniline, sodium salt ["DAOS” plus amino anti-pyrene] to form a colored product such as a Trinder dye).
- oxidases such as cholesterol oxidase
- horse-radish peroxidase plus a chromogen such as N-Ethyl- N-(2-hydroxy-3-sulfopropyl)-3,5-dimethoxyaniline, sodium salt ["DAOS” plus amino anti-pyrene] to form a colored product such as a Trinder dye.
- oxidases such as cholesterol oxidase
- horse-radish peroxidase plus a chromogen such as N-E
- NADH or NADPH are frequently used in clinical assays. This is because these coenzymes are common substrates for enzymes.
- measurement of enzymes of clinical interest such as lactate dehydogenase (LDH) can be measured by the rate of production of NADH. Since NADH absorbs light maximally at 340 nm and (1) polystyrene and other plastics transmit light poorly in the near UV, (2) White light sources produce little light in the near UV and (3) camera and scanner sensors have low sensitivity to near UV light, it is not practical to measure NADH by three color image analysis.
- LDH lactate dehydogenase
- NADH can be converted to a colored product using tetrazolium salts such as Water Soluble Tetrazolium (e.g.WST-1 (Dojindo Molecular Technologies) plus an "electron mediator” such as 1- Methoxyphenazine methosulfate (PMS).
- tetrazolium salts such as Water Soluble Tetrazolium (e.g.WST-1 (Dojindo Molecular Technologies) plus an "electron mediator” such as 1- Methoxyphenazine methosulfate (PMS).
- assays that produce or consume NADH or NADPH can be paired with other reactions that allow for colorimetric measurement.
- NADH or NADPH can be used to reduce compounds such as 2-(4-Iodophenyl)-3-(4-nitrophenyl)-5-(2,4-disulfophenyl)-2H-tetrazolium, monosodium salt (WST-1) to a colored formezan dye as shown below with the use of phenazine methosulfate as an electron mediator, as shown in Figure 54.
- assays utilizing enzymes such as alkaline phosphatase can be measured using a chromogenic substrate such as p-nitrophenyl phosphate.
- the enzymatic reaction can make p- nitrophenol which is yellow in alkaline conditions.
- Measurements can also be performed on assays that form colored complex, such as between a metal ion a chelating dye which changes color on binding.
- a metal ion a chelating dye which changes color on binding.
- o-Cresolphthalein Complexone shown in Figure 55
- the general scheme of such assays is: Chelating dye (color 1) + M N+ ⁇ -> Chelating dye: M N+ :(Color 2)
- Optical signals can also be measured for metal ion assays using metal-dependant enzymes.
- sodium ions can be determined enzymatically via sodium dependent ⁇ -galactosidase activity with o- nitro-phenyl galactoside (ONPG) as the substrate.
- the absorbance at 405 nm of the product o-nitrophenol is proportional to the sodium concentration.
- Assays can be performed for analytes by color-forming ELISAs.
- Many ELISA methods are known which generate color using enzymes such as horseradish peroxidase, alkaline phosphatase and ⁇ - galactosidase with chromogenic substrates such as o-phenylene diamine, p-nitrophenyl phosphate, and o- nitrophenyl galactoside respectively.
- enzymes such as horseradish peroxidase, alkaline phosphatase and ⁇ - galactosidase with chromogenic substrates such as o-phenylene diamine, p-nitrophenyl phosphate, and o- nitrophenyl galactoside respectively.
- chromogenic substrates such as o-phenylene diamine, p-nitrophenyl phosphate, and o- nitrophenyl galactoside respectively.
- Luminogenic immunoassays can also be performed. Assays can utilize chemiluminogenic entities such as an enzyme with a luminogenic substrate.
- chemiluminescent compounds include dioxetanes, acridinium esters, luciferin, and 2,3-dihydrophthalazinediones, such as luminol.
- suitable chemiluminescent sources include a compound which becomes electronically excited by a chemical reaction and may then emit light which serves as the detectible signal or donates energy to a fluorescent acceptor.
- a diverse number of families of compounds have been found to provide chemiluminescence under a variety of conditions.
- One family of compounds is 2,3-dihydro-l,4- phthalazinedione.
- a frequently used compound is luminol, which is a 5-amino compound.
- Other members of the family include the 5-amino-6, 7, 8-trimethoxy- and the dimethylamino[ca]benz analog. These compounds can be made to luminesce with alkaline hydrogen peroxide or calcium hypochlorite and base.
- Another family of compounds is the 2,4,5-triphenylimidazoles, with lophine as the common name for the parent product.
- Chemiluminescent analogs include para-dimethylamino and -methoxy substituents. Chemiluminescence may also be obtained with oxalates, usually oxalyl active esters, for example, p-nitrophenyl and a peroxide such as hydrogen peroxide, under basic conditions. Other useful chemiluminescent compounds that are also known include N-alkyl acridinum esters and dioxetanes. Alternatively, luciferins may be used in conjunction with luciferase or lucigenins to provide bioluminescence.
- Assays that can be performed also include nucleic acid amplification.
- isothermal amplification and Loop-Mediated Isothermal Amplification Assays are examples.
- Nucleic acid amplification can be used to produce visibly turbid, fluorescent or colored assay reaction products for analytes such as nucleic acid targets (genes etc.).
- Nucleic acid amplification technology can be used for isothermal amplification of specific DNA and RNA targets. Additional information on isothermal nucleic acid amplification is described in Goto et al., "Colorimetric detection of loop-mediated isothermal amplification reaction by using hydroxy naphthol blue", BioTechniques, Vol. 46, No. 3, March 2009, 167-172.
- Nucleic acid amplification can be used to measure DNA and, coupled with the use of reverse transcriptase, RNA. Once the reaction has occurred, the amplified product can be detected optically using intercalating dyes or chromogenic reagents that react with released pyrophosphate generated as a side product of the amplification.
- the reaction can be visualized by changes (increases) in color, fluorescence or turbidity. Very small copy numbers of DNA can be detected in less than one hour.
- This technology can advantageously be read out in the present invention using three-color image analysis.
- images of isothermal nucleic acid amplification assay reaction products can be measured by (1) back lit-illumination (transmission optics) measuring absorbance of light, (2) images captured by a digital camera of light transmitted through a reaction product or (3) fluorescent light images generated by illumination of reaction products with a UV source (or any other appropriate light source) captured by a digital camera.
- the nucleic acid amplification assay is generally performed in a "one -pot" format where sample and reagents are combined in a sealed tube and incubated at elevated temperature. In some formats, the reaction can be monitored in real time by changes in optical properties. In other assay formats the reaction is stopped and reaction products visualized after adding a chromogenic or fluorogenic reagent.
- the present invention allows for the reading of nucleic acid amplification assay products directly in the reaction vessel or after aspiration into the tips described herein.
- the invention also provides for optical turbidimetric assays.
- immunoassays can be set up by measurement of the agglutination of small latex particles (50 - 300 nm).
- the particles can be coated with an antigen and/or antibody and agglutination occurs when a binding counterpart in the sample such as antibody or antigen is added.
- Assays can be set up as direct (e.g. antibody on the particle reacting with a multi-epitope protein or biomarker) or the competitive mode (e.g. drug hapten on particle reacts with anti-drug antibody in competition with free drug in the sample).
- the dispersion of latex becomes more turbid and the turbidity can be measured as decreased transmission of light using 3-color optics.
- assays based on the agglutination of large latex particles (diameter about 1 um) or red blood cells can be measured.
- Assay configuration is similar to turbidimetric assays as disclosed above, but the measurement can be by image analysis (scanner or camera measurement) using software to interpret the number and size of the agglutinates.
- Reagents for performing reaction chemistries can be included in the cartridges described here, such as in pipette tips.
- the reagents can be stored as liquids or in dried, lyophilized, or glassy forms.
- the location and configuration of a reaction site is an important element in an assay device. Most, if not all, disposable immunoassay devices have been configured with their capture surface as an integral part of the device.
- a molded plastic assay unit is either commercially available or can be made by injection molding with precise shapes and sizes.
- the characteristic dimension can be a diameter of 0.05 - 3 mm or can be a length of 3 to 30 mm.
- the units can be coated with capture reagents using method similar to those used to coat microtiter plates but with the advantage that they can be processed in bulk by placing them in a large vessel, adding coating reagents and processing using sieves, holders, and the like to recover the pieces and wash them as needed.
- the assay unit (e.g. encompassing the tip disclosed herein, tips, vessels, or any other containers) can offer a rigid support on which a reactant can be immobilized.
- the assay unit is also chosen to provide appropriate characteristics with respect to interactions with light.
- the assay unit can be made of a material, such as functionalized glass, Si, Ge, GaAs, GaP, Si02, SiN4, modified silicon, or any one of a wide variety of gels or polymers such as (poly)tetrafluoroethylene, (poly)vinylidenedifluoride, polystyrene, polycarbonate, polypropylene, polymethylmethacrylate (PMMA), acrylonitrile-butadiene-styrene (ABS), or combinations thereof.
- an assay unit comprises polystyrene.
- the assay unit may be formed from a homogeneous material, heterogeneous material, clad material, coated material, impregnated material, and/or embedded material. Other appropriate materials may be used in accordance with the present invention.
- a transparent reaction site may be advantageous.
- the surface may be advantageously opaque and/or preferentially light scattering.
- the assay unit may be formed from a transparent material. Alternatively, a portion of the assay unit may be formed from a transparent material.
- the assay unit may have a reagent coated thereon and/or impregnated therein.
- the reagent may be a capture reagent capable of immobilizing a reactant on a capture surface.
- the reactant may be a cell and/or analyte, or any other reactant described elsewhere herein.
- the reagent may be a molecule that may be a cell capture agent.
- a cell capture agent may anchor to the surface of desired cells during fluid transport.
- the capture reagents may be an antibody, peptide, organic molecule (e.g., which may have a lipid chain, lipophilic molecule), polymer matrix, protein, protein composite, glycoprotein, that may interact with the cell membrane.
- Capture reagents may be molecules, cross-linked molecules, nanoparticles, nanostructures, and/or scaffolds.
- microstructures may be provided that may become an analysis mechanism in a vessel.
- Capture reagents (which may include capture structures formed by the assay unit material) may allow cells to be tethered, bound, and/or trapped.
- the capture reagents may immobilize a reactant, such as a cell, during processing. Capture techniques may be chemical, physical, electrical, magnetic, mechanical, size-related, density-related, or any combination thereof. In some embodiments, the capture reagents may be used to concentrate reactants, such as cells, at a desired location. For example, an assay unit may be coated with the capture reagents, which may cause cells to be captured at the assay unit surface, thus concentrating the cells on the captured surface. The capture reagents may keep the captured reactant immobilized on the cell surface. This may aid in keeping the reactants (e.g., cells, analytes) stationary during imaging.
- reactants e.g., cells, analytes
- Immobilizing the reactants may be useful for applications where there may be long acquisition times for reactions and/or detection. For example, a number of imaging applications may require extended exposure times ( ⁇ 1 min) or imaging of small objects ( ⁇ lum) which may have significant Brownian motion.
- the capture reagents may be formed from materials that may provide little or no background for imaging. In some instances, the material of the assay unit may provide little or no background for imaging. The capture reagents may be selected so that they do not interfere with, or only have a small interference with, imaging and/or detection.
- a reactant immobilized at the capture surface can be anything useful for detecting an analyte of interest in a sample of bodily fluid.
- reactants include, without limitation, nucleic acid probes, antibodies, cell membrane receptors, monoclonal antibodies, antisera, and aptamers reactive with a specific analyte.
- Various commercially available reactants such as a host of polyclonal and monoclonal antibodies specifically developed for specific analytes can be used.
- the immobilization may be covalent or noncovalent, via a linker moiety, or tethering them to an immobilized moiety.
- Non-limiting exemplary binding moieties for attaching either nucleic acids or proteinaceous molecules such as antibodies to a solid support include streptavidin or avidin/biotin linkages, carbamate linkages, ester linkages, amide, thiolester, (N)-functionalized thiourea, functionalized maleimide, amino, disulfide, amide, hydrazone linkages, and among others.
- a silyl moiety can be attached to a nucleic acid directly to a substrate such as glass using methods known in the art.
- Surface immobilization can also be achieved via a Poly-L Lysine tether, which provides a charge-charge coupling to the surface.
- the assay units can be dried following the last step of incorporating a capture surface.
- drying can be performed by passive exposure to a dry atmosphere or via the use of a vacuum manifold and/or application of clean dry air through a manifold or by lyophilization.
- a capture surface may be applied to an assay unit using any technique.
- the capture surface may be painted on, printed on, electrosprayed on, embedded in the material, impregnating the material, or any other technique.
- the capture reagents may be coated to the assay unit material, incorporated in the material, co-penetrate the material, or may be formed from the material.
- a reagent such as a capture reagent may be embedded in a polymer matrix that can be used as a sensor.
- one or more small particles such as a nanoparticle, a microparticle, and/or a bead, may be coated and/or impregnated with reagents.
- the capture reagents may be part of the assay unit material itself, or may be something that is added to the material.
- an assay unit is designed to enable the unit to be manufactured in a high volume, rapid manufacturing processes.
- tips can be mounted in large-scale arrays for batch coating of the capture surface into or onto the tip.
- tips can be placed into a moving belt or rotating table for serial processing.
- a large array of tips can be connected to vacuum and/or pressure manifolds for simple processing.
- a capture reagent may be applied to an assay unit during any point in the process.
- the capture reagent may be applied to the assay unit during manufacturing.
- the capture reagent may be applied to the assay unit prior to shipping the assay unit to a destination.
- the capture reagent may be applied to the assay unit after the assay unit has been shipped.
- the capture reagent may be applied to the assay unit at a point of use, such as a point of service location.
- the capture reagent may cover an entire surface or region of the assay unit.
- the capture reagent may be provided on an inner surface of the assay unit.
- the capture reagent may cover portions or sections of an assay unit surface.
- the capture reagent may be provided on a surface in a pattern.
- a unit may have portions of the surface that have a capture reagent applied thereon, and portions of the surface that do not have a capture reagent applied thereon. For example, there may be coated and non-coated regions.
- a capture reagent may be applied in a surface in accordance with a geometric choice of how the capture reagent is to be applied.
- the capture reagent may be applied in dots, rows, columns, arrays, regions, circles, rings, or any other shape or pattern.
- the capture reagents may be applied at desired positions on the surface.
- a plurality of capture reagents may optionally be applied to an assay unit.
- the plurality of capture reagents may be applied so that the different capture reagents do not overlap (e.g., the different capture reagents are not applied to the same region or area). Alternatively, they may overlap (e.g., the different capture reagents may be applied to the same region or area). Space without any capture reagents may or may not be provided between regions with different capture reagents.
- the different capture reagents may be used to immobilize different reactants. For example, different capture reagents may be used to immobilize different cells and/or analytes on the capture surface.
- a plurality of reactants may be detected from the same assay unit.
- two or more, three or more, four or more, five or more, seven or more, ten or more, fifteen or more, twenty or more, thirty or more, forty or more, fifty or more, seventy or more, 100 or more, 150 or more, 200 or more, or 300 or more different capture reagents may be applied to a surface of an assay unit.
- the different capture reagents may be applied in any pattern or shape.
- different capture reagents may be applied as an array or series of rings on an inner surface of an assay unit.
- different capture reagents may be applied on an inner surface of a tip, vessel, container, cuvette, or any other container described elsewhere herein.
- the location of the different capture reagents on the assay unit may be known prior to detection of the captured reactants.
- the assay unit may have an identifier that may indicate the type of assay unit and/or the pattern of capture agents therein.
- the location of the different capture reagents of the assay unit may not be known prior to detection of the captured reactants.
- the location of the different capture reagents may be determined based on detected patterns of captured reactants.
- the capture reagents may be applied using any technique, such as those described elsewhere herein. In some instances, masking or lithographic techniques may be used to apply different capture reagents.
- any description herein of a capture reagent and/or coating applied to an assay unit may apply to any other units or containers described elsewhere herein, including but not limited to tips, vessels, cuvettes, or reagent units.
- the reagent units are modular.
- the reagent unit can be designed to enable the unit to be manufactured in a high volume, rapid manufacturing processes. For example, many reagent units can be filled and sealed in a large-scale process simultaneously.
- the reagent units can be filled according to the type of assay or assays to be run by the device. For example, if one user desires different assays than another user, the reagent units can be manufactured accordingly to the preference of each user, without the need to manufacture an entire device.
- reagent units can be placed into a moving belt or rotating table for serial processing.
- the reagent units are accommodated directly into cavities in the housing of a device.
- a seal can be made onto areas of housing surrounding the units.
- Reagents according to the present invention include without limitation wash buffers, enzyme substrates, dilution buffers, conjugates, enzyme-labeled conjugates, DNA amplifiers, sample diluents, wash solutions, sample pre -treatment reagents including additives such as detergents, polymers, chelating agents, albumin-binding reagents, enzyme inhibitors, enzymes, anticoagulants, red-cell agglutinating agents, antibodies, or other materials necessary to run an assay on a device.
- An enzyme -labeled conjugate can be either a polyclonal antibody or monoclonal antibody labeled with an enzyme that can yield a detectable signal upon reaction with an appropriate substrate.
- the reagents comprise immunoassay reagents.
- reagents especially those that are relatively unstable when mixed with liquid, are confined separately in a defined region (for example, a reagent unit) within the device.
- a reagent unit contains approximately about 5 microliters to about 1 milliliter of liquid. In some embodiments, the unit may contain about 20-200 microliters of liquid. In a further embodiment, the reagent unit contains 100 microliters of fluid. In an embodiment, a reagent unit contains about 40 microliters of fluid.
- the volume of liquid in a reagent unit may vary depending on the type of assay being run or the sample of bodily fluid provided. In an embodiment, the volumes of the reagents do not have to predetermined, but must be more than a known minimum. In some embodiments, the reagents are initially stored dry and dissolved upon initiation of the assay being run on the device.
- the reagent units can be filled using a siphon, a funnel, a pipette, a syringe, a needle, or a combination thereof.
- the reagent units may be filled with liquid using a fill channel and a vacuum draw channel.
- the reagent units can be filled individually or as part of a bulk manufacturing process.
- an individual reagent unit comprises a different reagent as a means of isolating reagents from each other.
- the reagent units may also be used to contain a wash solution or a substrate.
- the reagent units may be used to contain a luminogenic substrate.
- a plurality of reagents are contained within a reagent unit.
- the setup of the device enables the capability of pre-calibration of assay units and the reagent units prior to assembly of disposables of the subject device.
- a binding element is one member of a binding pair capable of specifically and selectively binding to the other member of the binding pair in the presence of a plurality of different molecules.
- binding elements include, but are not limited to, antibodies, antigens, metal-binding ligands, nucleic acid probes and primers, receptors and reactants as described herein, and aptamers.
- a binding element used to detect an analyte is an aptamer.
- aptamer is used to refer to a peptide, nucleic acid, or a combination thereof that is selected for the ability to specifically bind one or more target analytes.
- Peptide aptamers are affinity agents that generally comprise one or more variable loop domains displayed on the surface of a scaffold protein.
- a nucleic acid aptamer is a specific binding oligonucleotide, which is an oligonucleotide that is capable of selectively forming a complex with an intended target analyte. The complexation is target-specific in the sense that other materials, such as other analytes that may accompany the target analyte, do not complex to the aptamer with as great an affinity.
- target-specific means that the aptamer binds to target with a much higher degree of affinity than it binds to contaminating materials.
- the meaning of specificity in this context is thus similar to the meaning of specificity as applied to antibodies, for example.
- the aptamer may be prepared by any known method, including synthetic, recombinant, and purification methods. Further, the term “aptamer” also includes "secondary aptamers” containing a consensus sequence derived from comparing two or more known aptamers to a given target.
- nucleic acid aptamers are about 9 to about 35 nucleotides in length.
- a nucleic acid aptamer is at least 4, 5, 6, 7, 8, 9, 10, 11, 12, 13, 14, 15, 20, 25, 30, 35, 40, 45, 50, 55, 60, 65, 70, 80, 90, 100, or more residues in length.
- the oligonucleotides of the aptamers generally are single-stranded or double-stranded, it is contemplated that aptamers may sometimes assume triple-stranded or quadruple-stranded structures.
- a nucleic acid aptamer is circular, such as in
- the specific binding oligonucleotides of the aptamers should contain the sequence-conferring specificity, but may be extended with flanking regions and otherwise derivatized or modified.
- the aptamers found to bind to a target analyte may be isolated, sequenced, and then re -synthesized as conventional DNA or RNA moieties, or may be modified oligomers. These modifications include, but are not limited to incorporation of: (1) modified or analogous forms of sugars (e.g. ribose and deoxyribose); (2) alternative linking groups; or (3) analogous forms of purine and pyrimidine bases.
- Nucleic acid aptamers can comprise DNA, RNA, functionalized or modified nucleic acid bases, nucleic acid analogues, modified or alternative backbone chemistries, or combinations thereof.
- the oligonucleotides of the aptamers may contain the conventional bases adenine, guanine, cytosine, and thymine or uridine.
- Included within the term aptamers are synthetic aptamers that incorporate analogous forms of purines and pyrimidines. "Analogous" forms of purines and pyrimidines are those generally known in the art, many of which are used as chemotherapeutic agents. Non-limiting examples of analogous forms of purines and pyrimidines (i.e.
- base analogues include aziridinylcytosine, 4-acetylcytosine, 5-fluorouracil, 5 -bromo uracil, 5- carboxymethylaminomethyl-2-thiouracil, 5-carboxymethyl-aminomethyluracil, inosine, N6-isopentenyladenine,
- dU deoxyribonucleic acid
- Aptamer oligonucleotides may contain analogous forms of ribose or deoxyribose sugars that are known in the art, including but not limited to 2' substituted sugars such as 2'-0-methyl-, 2'-0-allyl, 2'-fluoro- or 2'-azido-ribose, carbocyclic sugar analogs, alpha- anomeric sugars, epimeric sugars such as arabinose, xyloses or lyxoses, pyranose sugars, furanose sugars, sedoheptuloses, locked nucleic acids (LNA), peptide nucleic acid (PNA), acyclic analogs and abasic nucleoside analogs such as methyl riboside.
- 2' substituted sugars such as 2'-0-methyl-, 2'-0-allyl, 2'-fluoro- or 2'-azido-ribose
- carbocyclic sugar analogs alpha- anomeric sugar
- Aptamers may also include intermediates in their synthesis.
- any of the hydro xyl groups ordinarily present may be replaced by phosphonate groups, phosphate groups, protected by a standard protecting group, or activated to prepare additional linkages to additional nucleotides or substrates.
- the 5' terminal OH is conventionally free but may be phosphorylated; OH substituents at the 3' terminus may also be phosphorylated.
- the hydroxyls may also be derivatized to standard protecting groups.
- One or more phosphodiester linkages may be replaced by alternative linking groups. These alternative linking groups include, but are not limited to embodiments wherein P(0)0 is replaced by P(0)S ("thioate"), P(S)S
- each R or R' is independently H or substituted or unsubstituted alkyl (1-20C.) optionally containing an ether (— O— ) linkage, aryl, alkenyl, cycloalkyl, cycloalkenyl or aralkyl.
- RNA aptamers that are useful in the present invention is based on RNA aptamers as disclosed in U.S. Pat. Nos. 5,270,163 and 5,475,096, which are incorporated herein by reference.
- the aforementioned patents disclose the SELEX method, which involves selection from a mixture of candidate oligonucleotides and stepwise iterations of binding, partitioning and amplification, using the same general selection scheme, to achieve virtually any desired criterion of binding affinity and selectivity.
- the SELEX method includes steps of contacting the mixture with a target, such as a target analyte, under conditions favorable for binding, partitioning unbound nucleic acids from those nucleic acids which have bound specifically to target molecules, dissociating the nucleic acid-target complexes, amplifying the nucleic acids dissociated from the nucleic acid-target complexes to yield a ligand-enriched mixture of nucleic acids, then reiterating the steps of binding, partitioning, dissociating and amplifying through as many cycles as desired to yield highly specific, high affinity nucleic acid ligands to the target molecule.
- a target such as a target analyte
- negative screening is employed in which a plurality of aptamers are exposed to analytes or other materials likely to be found together with target analytes in a sample to be analyzed, and only aptamers that do not bind are retained.
- the SELEX method encompasses the identification of high-affinity nucleic acid ligands containing modified nucleotides conferring improved characteristics on the ligand, such as improved in vivo stability or improved delivery characteristics. Examples of such modifications include chemical substitutions at the ribose and/or phosphate and/or base positions.
- two or more aptamers are joined to form a single, multivalent aptamer molecule. Multivalent aptamer molecules can comprise multiple copies of an aptamer, each copy targeting the same analyte, two or more different aptamers targeting different analytes, or combinations of these.
- Aptamers can be used as diagnostic and prognostic reagents, as reagents for the discovery of novel therapeutics, as reagents for monitoring drug response in individuals, and as reagents for the discovery of novel therapeutic targets. Aptamers can be used to detect, modify the function of, or interfere with or inhibit the function of one or more target analytes.
- analytes as used herein includes without limitation drugs, prodrugs, pharmaceutical agents, drug metabolites, biomarkers such as expressed proteins and cell markers, antibodies, serum proteins, cholesterol and other metabolites, electrolytes, metal ions, polysaccharides, nucleic acids, biological analytes, biomarkers, genes, proteins, hormones, or any combination thereof.
- Analytes can be combinations of polypeptides, glycoproteins, polysaccharides, lipids, and nucleic acids.
- Aptamers can inhibit the function of gene products by any one of, but not limited to only, the following mechanisms: (i) modulating the affinity of a protein-protein interaction; (ii) modulating the expression of a protein on a transcriptional level; (iii) modulating the expression of a protein on a post-transcriptional level; (iv) modulating the activity of a protein; and (v) modulating the location of a protein.
- the precise mechanism of action of peptide aptamers can be determined by biochemical and genetic means to ascertain their specific function in the context of their interaction with other genes, and gene products.
- Aptamers can be used to detect an analyte in any of the detection schemes described herein.
- apatamers are covalently or non-covalently coupled to a substrate.
- substrates to which aptamers may be coupled include microarrays, microbeads, pipette tips, sample transfer devices, cuvettes, capillary or other tubes, reaction chambers, or any other suitable format compatible with the subject detection system.
- Biochip microarray production can employ various semiconductor fabrication techniques, such as solid phase chemistry, combinatorial chemistry, molecular biology, and robotics.
- One process typically used is a photolithographic manufacturing process for producing microarrays with millions of probes on a single chip.
- the probes are pre-synthesized, they can be attached to an array surface using techniques such as micro-channel pumping, "ink-jet” spotting, template-stamping, or photocrosslinking.
- An exemplary photolithographic process begins by coating a quartz wafer with a light-sensitive chemical compound to prevent coupling between the quartz wafer and the first nucleotide of the DNA probe being created. A lithographic mask is used to either inhibit or permit the transmission of light onto specific locations of the wafer surface. The surface is then contacted with a solution which may contain adenine, thymine, cytosine, or guanine, and coupling occurs only in those regions on the glass that have been deprotected through illumination.
- the coupled nucleotide bears a light-sensitive protecting group, allowing the cycle can be repeated.
- the microarray is created as the probes are synthesized via repeated cycles of deprotection and coupling. The process may be repeated until the probes reach their full length.
- Commercially available arrays are typically manufactured at a density of over 1.3 million unique features per array.
- each wafer can be cut into tens or hundreds of individual arrays.
- the biochip may be a Langmuir-Bodgett film, functionalized glass, germanium, silicon, PTFE, polystyrene, gallium arsenide, gold, silver, membrane, nylon, PVP, or any other material known in the art that is capable of having functional groups such as amino, carboxyl, Diels-Alder reactants, thiol or hydroxyl incorporated on its surface. These groups may then be covalently attached to crosslinking agents, so that the subsequent attachment of the nucleic acid ligands and their interaction with target molecules will occur in solution without hindrance from the biochip. Typical crosslinking groups include ethylene glycol oligomer, diamines, and amino acids. Alternatively, aptamers may be coupled to an array using enzymatic procedures, such as described in US20100240544.
- aptamers are coupled to the surface of a microbead.
- Microbeads useful in coupling to oligonucleotides are known in the art, and include magnetic, magnetizable, and non-magnetic beads. Microbeads can be labeled with 1, 2, 3, 4, 5, 6, 7, 8, 9, 10, or more dyes to facilitate coding of the beads and identification of an aptamer joined thereto.
- Coding of microbeads can be used to distinguish at least 10, 50, 100, 200, 300, 400, 500, 600, 700, 800, 900, 1000, 1500, 2000, 5000, or more different microbeads in a single assay, each microbead corresponding to a different aptamer with specificity for a different analyte.
- reagents are coupled to the surface of a reaction chamber, such as a tip.
- the interior surface of a tip may be coated with an aptamer specific for a single analyte.
- the interior surface of a tip may be coated with two or more different aptamers specific for different analytes.
- each of the different aptamers may be coupled at different known locations, such as forming distinct ordered rings or bands at different positions along the axis of a tip.
- multiple different analytes may be analyzed in the same sample by drawing a sample up a tip and allowing analytes contained in the sample to bind with the aptamers coated at successive positions along the tip. Binding events can then be visualized as described herein, with the location of each band in a banding pattern corresponding to a specific known analyte.
- binding of one or more aptamers to one or more target analytes is detected using an optical feature.
- the optical feature is fluorescence.
- a sample containing analytes to be analyzed is treated with a labeling compound to conjugate the analytes with a fluorescent tag. Binding can then be measured by fluorescence to detect presence and optionally quantity of one or more analytes, such as illustrated in Figure 136 in combination with aptamers coupled to an array, and in Figure 137 in combination with aptamers coupled to coded beads.
- the sample is treated with a labeling compound to conjugate the analytes with a linker.
- the linker Upon binding the linker is functionalized with a fluorescent tag and the positive event is measured by fluorescence.
- the analyte binding domain of an aptamer is partially hybridized to a complentary probe that is fluorescently labeled.
- the complementary probe Upon binding to the analyte, the complementary probe is released, which results in an optically measurable decrease in fluorescent signal.
- an aptamer is fluorescently labeled and is partially hybridized to a complementary probe labeled with a quencher that is in proximity to the fluorescent label. Upon binding to the analyte, the complementary probe is released resulting in a measurable increase in fluorescence of the label conjugated to the aptamer.
- the aptamer is partially hybridized to a complementary probe, which hybridization occludes a domain containing a secondary structure.
- the complementary probe Upon binding to the analyte, the complementary probe is released, and the secondary structure is made available to an intercalating dye used to produce a measurable signal.
- Labels useful in the detection of binding between an apatamer and an analyte in a binding pair can include, for example, fluorescein, tetramethylrhodamine, Texas Red, or any other fluorescent molecule known in the art. The level of label detected at each address on the biochip will then vary with the amount of target analyte in the mixture being assayed.
- the displaced complementary probe is conjugated to one member of an affinity pair, such as bio tin.
- a detectable molecule is then conjugated to the other member of the affinity pair, for example avidin.
- the conjugated detectable molecule is added.
- the amount of detectable molecule at each site on the biochip will vary inversely with the amount of target molecule present in the test mixture.
- the displaced complementary probe will be biotin labeled, and can be detected by addition of fluorescently labeled avidin; the avidin itself will then be linked to another fluorescently labeled, biotin-conjugated compound.
- the biotin group on the displaced oligonucleotide can also be used to bind an avidin-linked reporter enzyme; the enzyme will then catalyze a reaction leading to the deposition of a detectable compound.
- the reporter enzyme will catalyze the production of an insoluble product that will locally quench the fluorescence of an intrinsically- fluorescent biochip.
- the displaced complementary probe will be labeled with an immunologically-detectable probe, such as digoxigenin.
- the displaced complementary probe will then be bound by a first set of antibodies that specifically recognize the probe. These first antibodies will then be recognized and bound by a second set of antibodies that are fluorescently labeled or conjugated to a reporter enzyme.
- Assays analogous to "double-sandwich" ELISAs can also be set up using combinations of antibodies and aptamers as receptors.
- a capture surface can be functionalized with an aptamer and the detection reagent can be an enzyme -labeled antibody.
- the antibody can be on the capture surface and the detection reagent a labeled aptamer.
- a sample containing an anlalyte to be analyzed is dispersed into a three- dimensional hydrogel matrix.
- the hydrogel matrix can be activated to covalenly trap proteins and small molecules.
- fluorescently labeled aptamers can be introduced for the detection of the specific analytes present, such as illustrated in Figure 138.
- the three-dimensional hydrogel matrix is divided in small subsets or microwells to which a single aptamer can be added to undergo a specific analysis of the analyte present.
- aptamers are labeled with a set of coded quantum dots or fluorescent tags corresponding to a unique signature.
- labeled aptamers are added to the three-dimensional matrix simultaneously with the sample.
- an aptamer is used instead of an antibody in an ELISA assay.
- a sample is exposed to a surface and specifically or non-specifically coupled thereto.
- an analyte is specifically coupled to a surface by binding to first antibody that is coupled to the surface.
- the analyte is then detected by binding to a second antibody carrying a label.
- the first antibody, second antibody, or both are replaced with aptamers specific for an analyte.
- analysis of sample and the assay reaction products can be performed using digital imaging.
- the assay cuvettes can be aligned for measurement and scanned or imaged in a single operation. In the instrumented system of the invention this is achieved automatically by mechanical components.
- Assay cuvettes are located at defined locations in a cartridge and moved to the scanner maintaining the same orientation and spacing.
- the graph shown in Figure 92 corresponds to the green channel response over the width of the cuvette. As shown, the edges of the cuvettes are well-defined, as is the location corresponding to the middle of the cuvette.
- the images obtained by scanning or imaging can be a two-dimensional array of pixels, where each pixel comprises a plurality of intensity values corresponding to a distinct detection spectral region (e.g., red, blue, green).
- the images can be interpreted by line-scans, which may correspond to a horizontal portion of a tip. If the tip is circular-shaped, then an effective absorbance can be determined by deconvoluting the line-scan over an appropriate function.
- Example functions include parabolic functions, and functions for circles.
- the images can be data-averaged over multiple images taken of a tip or a sample over a range of physical locations.
- a sensor is provided to locate an assay unit relative to a detector when an assay is detected.
- bromophenol blue solutions were aspirated into a set of conical tips and imaged with front face illumination (light source and detector on the same side of the object). Small volumes (5 uL) of serial dilutions of a 0.78 mg/mL solution were used with the highest concentration at the top of the image.
- tips on the left have the sample located at the widest location in the conical tip whereas tips on the right have the sample at the narrowest.
- the image in Figure 61 was taken using a scanning optical system.
- Figure 62 shows tips that were imaged using a back-lit configuration (light source and detector on opposite sides of the imaged object).
- the back-lit configuration can be preferred because of the higher image quality.
- the effective optical path length of a colored solution can be varied by changing tip design.
- the pathlength can be varied within a single tip to increase sensitivity of measurement of light absorbance (long pathlength) or to increase the dynamic range of the measurement.
- the pathlength can be changed, for example, by changing the diameter of the tip.
- An additional feature of the tip design can be that it enables assays to be read with a very small volume of assay reaction product requiring a very small volume of sample.
- assay reaction mixtures are incubated in a narrow part of a tip which provides a high ratio of liquid/air surface area to volume, thus minimizing evaporation.
- the small volume can then be moved to a wide part of the tip for measurement of the colored product thus maximizing the optical pathlength available (and thereby increasing the absorbance of light) for a given reaction mixture volume.
- Spectroscopic measurements of colored solutes are traditionally measured by recording the fraction of light transmitted through a cuvette at the absorbance wavelength maximum. The data are then transformed to give Absorbance (A) or optical density (OD) values.
- A( max) eM*l*Concentration
- ⁇ is the molar extinction product (L/Mole.cm)
- 1 is the optical pathlength (cm)
- Concentration is in molar units.
- the method of the present invention overcomes these problems to a significant degree by enabling facile measurements of color over a very wide dynamic range (up to 1000-fold):
- pathlengths are at least partially dependent on container (e.g., cuvette, tip, vial) geometry.
- container geometry and/or features in the container, such as scattering features, may affect the optical path and path length in the container.
- Scanners and cameras have detectors that can measure a plurality of different colors channel detection spectrum regions (e.g., red, green, and blue). Because the spectral width of each of these channels is wide and color chemistries produce colored products with wide band widths, colored reaction products can be detected using a plurality of channel detection spectrums.
- Figure 71 shows the response of red (squares), green (diamonds), and blue (triangles) detection channel spectrums as a function of analyte concentration.
- the signals produced by each detector correspond to light intensity within each detection spectrum and are typically expressed as a number from 0 to 255.
- the maximum change in signal is seen at the center of the cuvette.
- signals in the central region of the cuvette were averaged (over the zone shown by the small rectangles for the fourth cuvette from the left) and plotted against the bromophenol blue concentration, the dose-responses shown Figure 68 were observed.
- the signal declined smoothly with concentration.
- the green signal changed most and the blue signal least.
- Corresponding optical densities measured in an M5 spectrometer (Molecular Devices) at the wavelength of maximal absorbance (e.g., 589 nm) are also shown. At the highest concentrations, the spectrophotometer response becomes not linear and changes very little with concentration. A similar effect was noted in the scanner green and red channel responses. The blue channel response in contrast, is very slight until the highest concentrations.
- absorbance of a solution is equal to eM*Concentration*pathlength.
- Absorbance is defined as LoglO(Transmission/Blank Transmission), where blank transmission is that corresponding to that for the solvent.
- Strictly Beer's law applies to a parallel beam of monochromatic light (in practice a band width of a few nm) passing normally through a rectangular cuvette.
- Spectrophotometers respond linearly to concentration up to Absorbance values about 1.5. At higher absorbance, instrument response becomes non-linear due to "stray light” and other effects.
- Optical density is defined as absorbance for a one cm optical pathlength.
- Assay results from reaction setups that would otherwise provide uninterpretable data can be salvaged using the present invention.
- the present invention allows for increased dynamic range and sensitivity of assays by the combination of optical pathlength optimization and three-color analysis.
- the inability to salvage data plagued by reduced dynamic range is a major problem in assay management, especially in the context of samples being evaluated for diagnostic or therapy management purposes is that assays have a limited dynamic range or limited range of analyte values that can be reported with good confidence.
- an assay result may not be available from laboratory-based assay systems or from distributed test situations. Namely the analyte value is too high or too low to be reported.
- the system can respond by:
- [00520] making the measurement with a different pathlength (moving the optical cuvette relative to the optical system such that the pathlength is either bigger or smaller). This can be performed by (a) making a measurement at a standard, first location, (b) reporting the result to the software managing the assay (in instrument and/or on a remote server), (c) recognizing a problem condition, and (d) modifying the read position and making a second measurement; and/or
- the signal responses can be calibrated to allow for computation of the concentration of the colored species from imaging data.
- a data transform predictive of the concentration of the colored solute the following procedure can be used. In other embodiments, other methods may also be used.
- the measured signal is decomposed into Red (R), Green (G), and Blue (B) color channels.
- Calibration equations are computed to optimize the accuracy, precision, and dynamic range according to assay design requirements.
- F p l + p 2 ⁇ G + p 3 ⁇ G 2 + p 4 ⁇ R + p 5 ⁇ R 2 ,
- C is the calculated concentration
- pe and pj are calibration parameters, in this case, representing the intercept and slope parameters of a linear relationship, respectively.
- Blanks are typically constructed by measuring a sample that is equivalent to the sample but does not have any of the component to be measured. The measurement is typically made in the same cuvette as that which will be used for the sample or an optically equivalent cuvette. Thus in a spectrophotometric assay, one would combine all the reagents in the same concentrations using the same protocol substituting a zero analyte solution for the sample.
- Method (2) uses a two step process making measurements against an absolute reference such as air (which will never vary in absorbance) and measuring both sample and blank against the absolute reference. The sample absorbance is then calculated by subtraction of the blank value from that of the sample.
- Method (3) is to collect spectra of the sample or assay reaction product and reference the measured absorbance (or transmission) at an optimal wavelength (usually that for maximum absorbance for the measured species) against the absorbance at a wavelength where the species to be measured is known to have zero absorbance.
- the absorbance is the difference between those recorded at the two wavelengths.
- Digital imaging and three-color analysis can be employed, but in some embodiments can be modified according to the digital (pixilated) character of the assay signal. Namely: [00541] 1. For each pixel in the image and for each color a white standard is imaged and the intensities of the signal adjusted to a value corresponding to no absorbance. This can be done by the following exemplary procedure:
- a preferred approach is a combination of (b) and (c) above. First, adjust the detector in the analog realm, and then fine tune the result in the digital realm.
- the gain and offset of the amplifiers between the light sensors and the analog-to-digital section are adjusted to ensure maximum resolution of the digitization.
- the lower end of the light range of interest will be set to zero and the high end of the range will be set to just below saturation of the sensor.
- the images may be fine-tuned in the digital domain.
- a preferred approach specifically, would be to use what is called the "two-image calibration" for an m x n image.
- the mechanism is to first collect a black image by blocking all light to the detector. We'll call this image BLACK[m,n].
- a second calibration image is recorded consisting of light at the maximum end of the sensitivity range. We'll call this image WHITE[m,n].
- a corrected image a[m,n] could be constructed, pixel-wise, as:
- An image of a physical blank in a tip can be used as a pixel-by-pixel and color by color blank.
- the blank can be:
- the signal from a color channel where there is a zero or weak response can be used to normalize signals from the other channels.
- a further method of controlling and normalizing the optics is to image a set of physical (stable) standards before or during an assay.
- a set of physical (stable) standards For example, an array of printed dyes (shown in Figure 104) can be made corresponding to a set of standard colors with standard intensities (similar to standard color "wheels" used to calibrate cameras and scanners).
- Such standards may be measured using reflectance from an opaque surface or (preferred) by transmission through a clear film.
- calibration and normalization of the optics may be (1) a one-time exercise, (2) performed at regular intervals or (3) performed for each assay.
- Calibrating a digital imager range [00561] In some embodiments, methods may be provided for calibrating a digital imager used for imaging optical densities.
- the setup may comprise a relatively homogenous illuminated white background, the imager and the analyte to be tested in a transparent cuvette between them.
- the test may comprise placing the cuvette between the imager and the white backlight source and measure the amount of light absorbed by the analyte in the cuvette.
- the background may be sensed as the maximum intensity measurable. It may be desirable to take care to not saturate the sensor because then information could be lost since when the sensor is saturated, and attenuation may not be correctly measured.
- the system may be configured to efficiently maximize the measured values of the backlight while minimizing number of saturated pixels.
- the illuminated background may emit white light of equal intensity over its entire surface.
- the light output may vary somewhat, producing a normal distribution of pixel intensities as detected by the imager. This is illustrated by the curves shown in Figure 128.
- the sensor may return a value from 0 to 256 from each pixel as an indicator of the amount of light it receives. Each pixel may saturate at a value of 256. That is, regardless of further increasing of light intensity or sensor sensitivity, only a value of 256 may be recorded.
- Series 1 in Figure 128, the dotted line shows where the light is too intense, cutting off the normal curve.
- Series 3 the dashed line, shows that all pixels are correctly reading intensity, but that the imager sensitivity is lower than it might be for maximum dynamic range. The majority of the pixels are at a value of less than 200.
- Series 2 represents the desired settings, where the mean of the distribution is as high as possible, but that a sufficiently small number of pixels are saturated.
- the intensity of the backlight may be held constant while the imager's settings may be adjusted.
- two controls may be used: exposure time and gain.
- Exposure time may be the amount of time that the sensor pixels are permitted to collect photons before the value is read out. For a given amount of light, the readout value may be larger when the exposure time is made longer.
- This control may be the "coarse" control for the application.
- Gain may be the control adjusting the amount of amplification applied to the sensor signal. Increasing gain may increase the value of the signal from the sensor. Gain may be the "fine" control.
- An exemplary procedure for setting the imager's sensitivity parameters may include one or more of the following steps:
- Binary search starting upwards adjust exposure time to find the setting where not all of the pixels in the region of interest of the image are saturated. This may be detected by observing the point at which the mean pixel value becomes less than 256.
- the white balance may be corrected.
- the white balance control adjusts the relative gains of the red and blue channel. Since the light coming from the backlight is defined as white, the procedure would be to simply adjust the white balance until the channels read the same values.
- the green channel is typically left unadjusted, and the red and blue channels are changed in opposite directions to each other as the control is changed.
- another channel such as the red channel or blue channel may be left unadjusted while the other two channels may be changed.
- the images may be fine-tuned in the digital domain.
- Colors may be quantified using average data for many pixels (typically about 1000).
- a parameter (f) which produces a good fit (e.g., greatest R 2 ) to the dose -response data may be selected.
- the parameter may be first fitted to the form al+bl*R+cl*R 2 +b2*G+c2*G 2 +b3*B+c2*B 2 where a, b, c are constants and R, G and B are color intensity values for red, green and blue channels respectively.
- the parameter f may then be derived by forcing it to have a maximum value of 1 and a minimum value of 0.
- Parameter f is related to transmission of light through the colored reaction product.
- f may be closely related to the parameter optical density (OD) used in spectrophotometry to quantify an absorbing species.
- OD optical density
- the parameter f may be used to calibrate assays measured by 3 -color image analysis.
- a smooth calibration relationship may be shown in Figure 130 for a representative cholesterol assay.
- Also shown in Figure 130 are graphs of assay accuracy and precision. Accuracy is close to 100 % (mean 100.2 %) and imprecision (represented by CV %) is low (less than 10 %, average CV 3.9 %).
- assay elements can be imaged in parallel.
- the elements can be placed at known locations in a cartridge or mounted on a subsystem of the instrument, so that a particular element can be associated with a particular assay. Even if the elements are not perfectly oriented or located, image analysis can be used to rectify any such miss-positioning by locating features of the assay elements.
- Figure 58, Figure 59, and Figure 60 show wells that can be imaged in parallel.
- a set of shallow hemispherical wells was made by machining a block of white opaque plastic.
- Three commercially available color forming assays were performed in these wells and reaction products imaged. As above, the wells to the far right have the highest analyte concentration and each adjacent well has a two-fold lower concentration except the left-most well which has zero analyte. Seven uL of assay reaction product were introduced into each well.
- Reaction products can also be imaged after blotting them onto porous membranes or paper and imaging once the liquid has soaked into the medium. It is also possible to use any of a variety of assay chemistries impregnated into paper or membranes and to image the resulting reaction products following addition of sample.
- Turbidimetry is performed by measuring the reduction in the intensity of the incident light after it passes through the sample being measured. This technique is used where the result of the assay is a dispersed precipitate that increases the opacity of the liquid.
- Turbidimetry can be measured in latex agglutination assays.
- polystyrene latex particles (1 um diameter) were dispersed in buffer at the given (w/v) concentrations and subject to three-color image analysis.
- Figure 72 a good response was found in all three channels and could be used to measure the latex particle concentration and agglutination of latex.
- the system can be used to measure agglutination, hemagglutination, and the inhibition thereof.
- the system can be used to perform blood typing by red blood cell agglutination.
- Blood was diluted and mixed with blood typing reagents (anti-A, anti-B, anti-D) from a commercial typing kit.
- blood typing reagents anti-A, anti-B, anti-D
- the appropriate agglutination responses can easily be seen when the mixtures are imaged.
- a quantitative measure of agglutination could be obtained by measuring the variance of the three-color signals, as shown in Figure 78. Greater variance indicated agglutination and can be detected in each color channel. It is evident that the method can be used to measure the extent of such agglutination reactions.
- Images can be analyzed for shape recognition.
- Shape recognition can be performed at normal magnification and at very high magnification. Under high magnification image analysis may be used to recognize the size and shape of cells. These techniques are commonly used in cell counting to determine relative concentrations of red blood cells, white blood cells and platelets. Under normal magnification, shape recognition is used to observe the state of the sample. Bubble and other defect recognition methods are used to ensure that measured liquid amounts are aspirated and dispensed correctly.
- sample characteristics can render assay results invalid. For example, hemolysis causes potassium ions to leak from red cells into plasma causing the measured plasma or serum potassium ion concentrations to be falsely high. Similarly, icteria and lipemia can interfere with several color-forming chemistries by altering the measured absorbances. In the present invention, we can detect and quantify such interfering substances using image analysis. Assays which would give false results can then be either (1) eliminated from the list of results delivered by the analytical system or (2) optical signals can be corrected to account for the measured level of interferent. An image of different types of serum samples is shown in Figure 99 (from left to right: Hemolyzed, Lipemic, Icteric (yellow) and "normal").
- color-based assays include assays for: Metabolites, Electrolytes, Enzymes, Biomarkers (using immunoassay), Drugs (using immunoassay), and Nucleic acid targets (using "LAMP” technology). The same principles can be applied to assays using fluorescence and/or luminescence.
- the volume of a sample, or any other material, such as a liquid or a solid can be determined optically. This can be performed by imaging a container whose internal dimensions are known and mathematically determining sample volume from observed segment of the container occupied. Solid measurements are primarily used to measure solids that are centrifuged down. The most common case is reading the volume of centrifuged red blood cells to determining hematocrit level. Examples 6-11 and 16 describe the use of imaging analysis to calculate sample volumes and other measurements. This can allow for improved assay results.
- the assay system can correct the results for the volume (in this example, the concentration of analytes calculated on the presumption of a 10 uL sample would be multiplied by 10/8).
- Knowledge of actual sample and reagent volumes can be performed by imaging the sample and reagents and can be used to correct the calculations used to detect and/or quantify analytes in the sample.
- the use of imaging allows samples and assay mixtures to be evaluated for quality and assay response. Additionally, imaging of 'tips" used as reaction vessels and sample acquisition methods enables (1) the accurate and precise measurement of sample and reagent volumes and (2) the use of such data to correct any inaccuracies and or imprecision in assay results due to volume errors.
- tips can have accurately and precisely known geometry (as is the case for tips made by injection molding). Replicate measurements of tips using imaging has demonstrated that their dimensions are precise to better than about 1 %. It is thus possible to measure the volume of liquid samples and reagents in such tips with corresponding precision. If the pipetting of samples and reagents is less accurate and precise, correction of results knowing the actual volumes (by image measurement) is possible.
- the invention provides a variety of advantages over conventional techniques.
- the present invention can detect physical defects in the assay cuvette, defects in the assay mixture (bubbles and the like). Once these defects are identified (image analysis) the assay result can be rejected so that false results do not occur or (preferred) the effect of the defect can be eliminated and an accurate assay signal computed.
- any and all defects can be detected including: incorrect sample type (e.g. blood versus plasma), incorrect sample volume, for a blood sample, failure to separate plasma from formed elements (red and white cells), sample factors that may compromise the quality of the assay result (e.g., lipemia, icteria, hemolysis, presence of precipitates, or other unidentified in-homogeneities), defects in assembly of the assay mixture (e.g., presence of bubbles, failure to mix adequately (non-uniformity of color)), mechanisms for retrospective quality evaluation and preservation of detailed archival information, mechanisms for measuring sample and reagent volumes (and to correct for inaccuracies and/or imprecision in such volumes).
- incorrect sample type e.g. blood versus plasma
- incorrect sample volume for a blood sample
- failure to separate plasma from formed elements red and white cells
- sample factors that may compromise the quality of the assay result e.g., lipemia, icteria, hemolysis, presence of precipitates, or other unidentified in-homogeneities
- a therapeutic agent can include any substances that have therapeutic utility and/or potential.
- substances include but are not limited to biological or chemical compounds such as simple or complex organic or inorganic molecules, peptides, proteins (e.g. antibodies) or a polynucleotides (e.g. anti-sense).
- a vast array of compounds can be synthesized, for example polymers, such as polypeptides and polynucleotides, and synthetic organic compounds based on various core structures, and these can also be included as therapeutic agents.
- agents for screening can provide compounds for screening, such as plant or animal extracts, and the like.
- agent is used alone or in combination with another agent, having the same or different biological activity as the agents identified by the inventive screen.
- the agents and methods also are intended to be combined with other therapies.
- small molecule drugs are often measured by mass-spectrometry which can be imprecise.
- ELISA (antibody-based) assays can be much more accurate and precise.
- Physiological parameters include without limitation parameters such as temperature, heart rate/pulse, blood pressure, and respiratory rate.
- Pharmacodynamic parameters include concentrations of biomarkers such as proteins, nucleic acids, cells, and cell markers. Biomarkers could be indicative of disease or could be a result of the action of a drug.
- Pharmacokinetic (PK) parameters according to the present invention include without limitation drug and drug metabolite concentration. Identifying and quantifying the PK parameters in real time from a sample volume is extremely desirable for proper safety and efficacy of drugs. If the drug and metabolite concentrations are outside a desired range and/or unexpected metabolites are generated due to an unexpected reaction to the drug, immediate action may be necessary to ensure the safety of the patient. Similarly, if any of the pharmacodynamic (PD) parameters fall outside the desired range during a treatment regime, immediate action may have to be taken as well.
- PD pharmacodynamic
- the present invention provides a business method of assisting a clinician in providing an individualized medical treatment.
- a business method can comprise post prescription monitoring of drug therapy by monitoring trends in biomarkers over time.
- the business method can comprise collecting at least one pharmacological parameter from an individual receiving a medication, said collecting step is effected by subjecting a sample of bodily fluid to reactants contained in a fluidic device, which is provided to said individual to yield a detectable signal indicative of said at least one pharmacological parameter; and cross referencing with the aid of a computer medical records of said individual with the at least one pharmacological parameter of said individual, thereby assisting said clinician in providing individualized medical treatment.
- the devices, systems, and methods herein allow for automatic quantification of a pharmacological parameter of a patient as well as automatic comparison of the parameter with, for example, the patient's medical records which may include a history of the monitored parameter, or medical records of another group of subjects.
- Coupling real-time analyte monitoring with an external device which can store data as well as perform any type of data processing or algorithm, for example provides a device that can assist with typical patient care which can include, for example, comparing current patient data with past patient data. Therefore, also provided herein is a business method which effectively performs at least part of the monitoring of a patient that is currently performed by medical personnel.
- Sample and reaction product analysis can be performed using an optical setup.
- the optical setup can includes a light source, an aperture, and a sensor or a detector.
- a schematic for an optical setup is shown in Figure 100 and Figure 101.
- the camera can be a Logitech C600 Webcamera
- the camera sensor can be a 1/3" 2.0 MP (1600x1200) CMOS: (MI-2010-SOC)
- the lens can be glass with a standard object distance webcam lens (Lens-to-Object distance: 35mm).
- the light source can be a Moritex White Edge Illuminator MEBL-Cw25 (white) operating at 9.4 volts.
- Camera images can be taken in a sequence where 1, 2, 3 4, or more tips are moved by an x-y-z stage into the optical path.
- the detector is a reader assembly housing a detection assembly for detecting a signal produced by at least one assay on the device.
- the detection assembly may be above the device or at a different orientation in relation to the device based on, for example, the type of assay being performed and the detection mechanism being employed.
- the detection assembly can be moved into communication with the assay unit or the assay unit can be moved into communication with the detection assembly.
- the sensors can be PMTs, wide range photo diodes, avalanche photodiodes, single frequency photo diodes, image sensors, CMOS chips, and CCDs.
- the illumination sources can be lasers, single color LEDs, broad frequency light from fluorescent lamps or LEDs, LED arrays, mixtures of red, green, and blue light sources, phosphors activated by an LED, fluorescent tubes, incandescent lights, and arc sources, such as a flash tube.
- an optical detector is provided and used as the detection device.
- Non-limiting examples include a photodiode, photomultiplier tube (PMT), photon counting detector, avalanche photo diode, or charge-coupled device (CCD).
- a pin diode may be used.
- a pin diode can be coupled to an amplifier to create a detection device with a sensitivity comparable to a PMT.
- Some assays may generate luminescence as described herein.
- chemiluminescence is detected.
- a detection assembly could include a plurality of fiber optic cables connected as a bundle to a CCD detector or to a PMT array.
- the fiber optic bundle could be constructed of discrete fibers or of many small fibers fused together to form a solid bundle. Such solid bundles are commercially available and easily interfaced to CCD detectors.
- a detector can also comprise a light source, such as a bulb or light emitting diode (LED).
- the light source can illuminate an assay in order to detect the results.
- the assay can be a fluorescence assay or an absorbance assay, as are commonly used with nucleic acid assays.
- the detector can also comprise optics to deliver the light source to the assay, such as a lens or fiber optics.
- the detection system may comprise non-optical detectors or sensors for detecting a particular parameter of a subject.
- sensors may include temperature, conductivity,
- potentiometric signals and amperometric signals, for compounds that are oxidized or reduced, for example, 0 2 , H 2 0 2 , and I 2 , or oxidizable/reducible organic compounds.
- the illumination can be back lit, front lit, and oblique (side) lit.
- Back lighting can be used in general chemistry for the purpose of detecting either light absorption (colorimetry) or scattering (turbidity).
- the arrangement takes two forms, a broad, evenly illuminated rear field, and a specifically shaped beam that is interrupted by the subject.
- Front lit illumination can be used for reflectance and fluorescence excitation.
- reflectance a subject is lit from the front by a light source are measured by observing the light reflected from the subject. The colors absorbed produce the same information as a liquid illuminated by a back light.
- a subject can also be illuminated using oblique lighting.
- Oblique illumination from the side illumination gives the image a 3 -dimensional appearance and can highlight otherwise invisible features.
- a more recent technique based on this method is Hoffmann's modulation contrast, a system found on inverted microscopes for use in cell culture.
- Oblique illumination suffers from the same limitations as bright field microscopy (low contrast of many biological samples; low apparent resolution due to out of focus objects), but may highlight otherwise invisible structures.
- fluorescence excitation subjects can be illuminated from the front for the purpose of fluorescence illumination. These are usually single color lights, most commonly lasers.
- the Confocal Laser Scanning Microscope is a common embodiment of this.
- Oblique lighting can also be used in fluorescence excitation.
- fluorescence cytometry the subjects are often excited at an angle, usually 90 degrees, from which the decay photons will appear. This form of lighting enables scatter detection directly behind the subject (back lit) as well as the fluorescence emissions exiting from the side.
- fluorescent light is imaged at 90 degrees to the excitation beam.
- a photon source typically a high-intensity LED, passes through a beam diffuser (D) and a shaping lens (LI), producing a collimated or slowly diverging excitation beam.
- the excitation beam passes through a band-pass filter (Fl) and illuminates the sample, consisting of a vessel (tube, cuvette, or pipette tip) containing a solution with a fluorescently-labeled sample. Isotropically-emitted fluorescence is spectrally separated from excitation light with a long- or band-pass filter (F2) appropriate to pass Stokes-shifted fluorescence.
- Light is then imaged through a lens (L2) onto a digital camera (C) or other detector. Fluorescence intensity is extracted from the resulting images via image analysis.
- transmitted light is imaged after optical filtering to remove the light at the exciting wavelength.
- a photon source typically a high-intensity LED
- D beam diffuser
- LI shaping lens
- the excitation beam passes through a band-pass filter (Fl) and illuminates the samples, presented as an array of sample vessels (tube, cuvette, or pipette tip), each containing a solution with a fluorescently-labeled sample.
- Isotropically-emitted fluorescence is spectrally separated from excitation light with a long- or band-pass filter (F2) appropriate to pass Stokes-shifted fluorescence.
- the preferred embodiment for sensing is backlighting the subject with white light with the result sensed by an imaging sensor. In this case the transmissive color absorption is measured.
- the preferred embodiment for sensing is backlighting the subject with white light with the result sensed by an imaging sensor. For turbidimetry, the reduction of the intensity of the transmitted light is measured.
- Luminometry utilizes no illumination method as the subject emits its own photons.
- the emitted light can be weak and can be detecting using an extremely sensitive sensor such as a photomultiplier tube (PMT).
- PMT photomultiplier tube
- imaging may occur using fluorescence, darkiield illumination, or brightfield illumination. Such imaging can be used for cytometry or other applications.
- Epi-fluorescence illumination may be achieved by the use of three illumination sources of differing wavelengths. Further, two different sources can be used simultaneously, if required. Consequently, the imaging platform can be used to image a large variety of fluorescent dyes.
- the combination of illumination sources and emission optics can be configured to achieve a plurality of spectrally independent channels of imaging.
- Darkfield illumination may be achieved by the use of a ringlight (located either above or below the sample), a darkfield abbe condenser, a darkfield condenser with a toroidal mirror, an epi-darkfield condenser built within a sleeve around the objective lens, or a combination of ringlight with a stage condenser equipped with a dark stop.
- these optical components create a light cone of numerical aperture (NA) greater than the NA of the objective being used.
- NA numerical aperture
- the choice of the illumination scheme depends upon a number of considerations such as magnification required, mechanical design considerations, size of the imaging sensor etc.
- a ringlight based illumination scheme generally provides uniform darkfield illumination over a wider area while at the same time providing sufficient flexibility in mechanical design of the overall system.
- Brightfield illumination may be achieved by the use of a white light source along with a stage- condenser to create Koehler illumination.
- an automatic filter wheel may be employed.
- the automatic filter wheel allows control of the imaging optical path to enable imaging of multiple fluorophores on the same field of view.
- image based auto-focusing may take place.
- An image -based algorithm may be used to control the z-position (e.g., vertical position) of an objective (i.e., its distance from the sample) to achieve auto-focusing.
- a small image for example, 128x128 pixels
- This image may be analyzed to derive the auto-focus function which is measure of image sharpness.
- the next z-location of the objective is calculated.
- the objective may be moved to the new z-location and another small image may be captured.
- This closed-loop system does not require the use of any other hardware for focusing.
- the microscope stage may be connected to computer- controlled stepper motors to allow translation in the X and Y directions (e.g., horizontal directions). At every location, the desired number of images is captured and the stage is moved to the next XY position.
- a detector can include a camera or other sensing apparatus configured to convert electromagnetic radiation to an electronic signal.
- a camera can be a charge-coupled (CCD) or electron-multiplying CCD (EMCCD) camera.
- CCD charge-coupled
- EMCD electron-multiplying CCD
- a detector may be a sensor, such as an active pixel sensor or CMOS sensor.
- a detector may include a photo -multiplier tube for detecting a signal.
- the detector can be in optical communication with a sample container (e.g., cuvette, tip, vial). In some cases, the detector is in direct line of sight of the sample container. In other cases, the detector is in optical communication with the sample container with the aid of one or more optics, such as lenses, mirrors , collimators, or combinations thereof.
- a sample container e.g., cuvette, tip, vial.
- the detector is in direct line of sight of the sample container.
- the detector is in optical communication with the sample container with the aid of one or more optics, such as lenses, mirrors , collimators, or combinations thereof.
- Cell counting can be performed using imaging and cytometry.
- the preferred embodiment is to illuminate the subjects from the front with a white light and to sense the cells with an imaging sensor. Subsequent digital processing will count the cells. Where the cells are infrequent or are small, the preferred embodiment is to attach a fluorescent marker, and then illuminating the subject field with a laser. Confocal scanning imaging is preferred.
- the subjects are marked with fluorescent markers and flowed past the sensing device. There are two types of sensors, one is position such that the subject is back lit, measuring beam scatter to determine presence of a cell. The other sensor, aligned so that the illumination is from the side, measures the fluorescent light emitted from the marked subjects. Further description is provided below relating to imaging methodology for cytometry.
- a device and system may, after manufacturing, be shipped to the end user, together or individually.
- the device or system of the invention can be packaged with a user manual or instructions for use.
- the system of the invention is generic to the type of assays run on different devices. Because components of the device can be modular, a user may only need one system and a variety of devices or assay units or reagent units to run a multitude of assays in a point-of-care or other distributed testing environment.
- a system can be repeatedly used with multiple devices, and it may be necessary to have sensors on both the device and the system to detect such changes during shipping, for example.
- a sensor located on either the device or system can relay these changes to, for example, the external device so that adjustments can be made during calibration or during data processing on the external device. For example, if the temperature of a fluidic device is changed to a certain level during shipping, a sensor located on the device could detect this change and convey this information to the system when the device is inserted into the system by the user. There may be an additional detection device in the system to perform these tasks, or such a device may be incorporated into another system component. In some embodiments information may be wirelessly transmitted to either the system or the external device, such as a personal computer or a television. Likewise, a sensor in the system can detect similar changes.
- a sensor in the shipping packaging as well, either instead of in the system components or in addition thereto.
- adverse conditions that would render an assay cartridge or system invalid that can be sensed can include exposure to a temperature higher than the maximum tolerable or breach of the cartridge integrity such that moisture penetration.
- the system comprises a communication assembly capable of transmitting and receiving information wirelessly from an external device.
- wireless communication may be Bluetooth or RTM technology.
- Various communication methods can be utilized, such as a dial-up wired connection with a modem, a direct link such as a Tl, ISDN, or cable line.
- a wireless connection is established using exemplary wireless networks such as cellular, satellite, or pager networks, GPRS, or a local data transport system such as Ethernet or token ring over a local area network.
- the information is encrypted before it is transmitted over a wireless network.
- the communication assembly may contain a wireless infrared communication component for sending and receiving information.
- the system may include integrated graphic cards to facilitate display of information.
- the communication assembly can have a memory or storage device, for example localized RAM, in which the information collected can be stored.
- a storage device may be required if information cannot be transmitted at a given time due to, for example, a temporary inability to wirelessly connect to a network.
- the information can be associated with the device identifier in the storage device.
- the communication assembly can retry sending the stored information after a certain amount of time.
- an external device communicates with the communication assembly within the reader assembly.
- An external device can wirelessly or physically communicate with a system, but can also communicate with a third party, including without limitation a patient, medical personnel, clinicians, laboratory personnel, or others in the health care industry.
- the system can comprise an external device such as a computer system, server, or other electronic device capable of storing information or processing information.
- the external device includes one or more computer systems, servers, or other electronic devices capable of storing information or processing information.
- an external device may include a database of patient information, for example but not limited to, medical records or patient history, clinical trial records, or preclinical trial records.
- An external device can store protocols to be run on a system which can be transmitted to the communication assembly of a system when it has received an identifier indicating which device has been inserted in the system.
- a protocol can be dependent on a device identifier.
- the external device stores more than one protocol for each device.
- patient information on the external device includes more than one protocol.
- the external server stores mathematical algorithms to process a photon count sent from a communication assembly and in some embodiments to calculate the analyte concentration in a bodily fluid sample.
- the external device can include one or more servers as are known in the art and commercially available. Such servers can provide load balancing, task management, and backup capacity in the event of failure of one or more of the servers or other components of the external device, to improve the availability of the server.
- a server can also be implemented on a distributed network of storage and processor units, as known in the art, wherein the data processing according to the present invention reside on workstations such as computers, thereby eliminating the need for a server.
- a server can includes a database and system processes.
- a database can reside within the server, or it can reside on another server system that is accessible to the server. As the information in a database may contain sensitive information, a security system can be implemented that prevents unauthorized users from gaining access to the database.
- One advantage of some of the features described herein is that information can be transmitted from the external device back to not only the reader assembly, but to other parties or other external devices, for example without limitation, a PDA or cell phone. Such communication can be accomplished via a wireless network as disclosed herein. In some embodiments a calculated analyte concentration or other patient information can be sent to, for example but not limited to, medical personnel or the patient. [00636] Accordingly, the data generated with the use of the subject devices and systems can be utilized for performing a trend analysis on the concentration of an analyte in a subject which changes over time.
- assay results can be substantially immediately communicated to any third party that may benefit from obtaining the results. For example, once the analyte concentration is determined at the external device, it can be transmitted to a patient or medical personnel who may need to take further action.
- the communication step to a third party can be performed wirelessly as described herein, and by transmitting the data to a third party's hand held device, the third party can be notified of the assay results virtually anytime and anywhere.
- a patient may be contacted immediately anywhere if urgent medical action may be required.
- Imaging may be used for detection. Imaging can be used to detect one or more characteristic of a sample. For example, imaging may be used to detect the presence or absence of a sample. The imaging may be used to detect the location, placement, volume or concentration of a sample. The imaging may be used to detect the presence, absence, and/or concentration of one or more analytes in the sample.
- a single measurement may be used to capture various information about a sample and/or analytes.
- a single measurement may be used to capture information about the volume of a sample and the concentration of an analyte within the sample.
- a single measurement may be used to capture information about the presence and/or concentration of a plurality of analytes and/or types of analytes within the sample.
- a single image may be used to capture information relating to one, two, or more of the information or types of information described herein.
- Such imaging and detection may provide more precise and accurate assays, which may be advantageous in situations with small sample volumes, such as those described elsewhere herein.
- Additional examples of volumes of sample may include 500 ⁇ or less, 250 ⁇ or less, 200 ⁇ or less, 175 ⁇ or less, 150 ⁇ or less, 100 ⁇ or less, 80 ⁇ or less, 70 ⁇ or less, 60 ⁇ or less, 50 ⁇ or less, 30 ⁇ or less, 20 ⁇ or less, 15 ⁇ or less, 10 ⁇ or less, 8 ⁇ or less, 5 ⁇ or less, 1 ⁇ or less, 500 nL or less, 300 nL or less, 100 nL or less, 50 nL or less, 10 nL or less, 1 nL or less, 500 pL or less, 250 pL or less, 100 pL or less, 50 pL or less, 10 pL or less, 5 pL or less, or 1 pL or less.
- the sample volume may include less than or equal to about 3 drops from a fingerstick, less than or equal to about 2 drops from a fingerstick, or less than or equal to about 1 drop from a fingerstick. Such small volumes may be useful in point of service applications.
- Such imaging and/or detection may yield assays with low coefficient of variation.
- a coefficient of variation may be the ratio between the standard deviation and an absolute value of the mean.
- a reaction and/or assay may have a coefficient of variation (CV) (also "relative standard deviation” herein) less than or equal to about 20%, 15%, 12%, 10%, 9%, 8%, 7%, 6%, 5%, 4%, 3%, 2%, 1%, 0.5%, 0.3%, or 0.1%.
- CV coefficient of variation
- a single reaction and/or assay, or a procedure with a plurality of reactions and/or assays may have a coefficient of variation of less than or equal to about 20%, 15%, 12%, 10%, 9%, 8%, 7%, 6%, 5%, 4%, 3%, 2%, 1%, 0.5%, 0.3%, or 0.1%.
- an imaging and/or detection step, or a procedure with a plurality of imaging and/or detection steps may have a coefficient of variation of less than or equal to about 20%, 15%, 12%, 10%, 9%, 8%, 7%, 6%, 5%, 4%, 3%, 2%, 1%, 0.5%, 0.3%, or 0.1%.
- the use of imaging with a device that may be placed at a point of service location may improve the overall performance of the device.
- the accuracy and/or precision may be improved and/or the coefficient of variation may be reduced.
- the performance of the device may be improved when handling small samples, such as those volumes described herein.
- the imaging may be used in combination with other detection systems, in combination with other processes, or as a standalone system. Improvement in performance may include a decrease in the coefficient of variation of about 15%, 12%, 10%, 9%, 8%, 7%, 6%, 5%, 4%, 3%, 2%, 1%, 0.5%, 0.3%, or 0.1%.
- Imaging may be useful for various detection types for one or more types of assays or sample handling procedures.
- assays or sample handling procedures may include centrifugation, separation, cytometry, immunoassay, ELISA, nucleic acid assay, enzymatic assay, colorimetry, or any other type of assay or reaction described elsewhere herein.
- Imaging systems may provide multiple advantages over other methods for data collection, data processing, and results interpretation. Imaging systems may maximize, or increase the efficiency of, the use of small samples and enhancing system-level performance. Imaging systems may be used for detection as standalone systems or may be used in combination with other detection systems or mechanisms.
- sensors and systems may be used (such as photodiodes and photomultiplier tubes and associated optics/devices) that typically do not provide any spatial information about the sample being interrogated. Rather, these systems may collect information about the sample after the information has been spatially integrated, typically losing spatial information related to the sample. While integrating the signal in space from the sample may augment the signal levels being detected by the sensor, advances in sensitivity of optical and other sensors may negate the need for such integration. Imaging for detection may be used in the place of such sensors, or may be used in conjunction with such sensors.
- Imaging systems may be used that may advantageously have one or more of the following features.
- Imaging sensors may have sensitivity and dynamic range that meet and/or exceed that of conventional non-imaging sensors.
- Imaging devices may maintain spatial aspects of the sample being interrogated, providing significant ability for post processing.
- Post processing can include QA/QC (e.g., quality control, such as automated error detection and/or review by pathologist), and/or image analysis to extract specific sample features.
- the imaging device can utilize 3D, 2D, ID (line sensors), and/or point sensors with a means to translate the sample relative to the collection optics/sensor to enable the spatial reconstruction of the sample.
- Data collected from the imaging device can be processed to extract very specific information, such as morphological features of the sample (such as cell counts), data from select regions of the image (peak fluorescence across a sample or in a cell within the image).
- Data collected from the imaging device can be processed to improve the sensitivity and resolution of the measurement.
- Data collected from the imaging device can enable the assessment of signal variation across the sample being imaged.
- the data may be post processed to calculate mean, standard deviation, maximum, minimum, and/or other applicable statistics across the sample or within any regions of interest identified in the sample images.
- Imaging devices enable the exploration of changes in the sample over time by collecting multiple images and comparing changes in the images over time and space, such as would be evident in an aggregation processes (such as for an assay of prothrombin time) or other (e.g., chemical, physical, biologic, electrical, morphological) changes in the sample over time and space. Imaging devices may enable more rapid data acquisition of arrays, tissue sections, and other assay/sample configurations.
- any of the embodiments described herein may be adapted to enable the system to perform cytometry.
- Cytometry e.g., enumeration and function analysis of cells
- Blood can be processed using the pipette and centrifuge as described previously herein.
- a known measured volume of blood (1 - 50 uL) may first be centrifuged and the plasma fraction removed.
- the cell fraction may then be re-suspended into buffer by use of the pipette repeatedly to dispense and aspirate.
- a cocktail of fluorescent antibodies may be directed to selected cell markers (such as CD45, CD4 etc.).
- a reagent which may act as a fixative for the white cells and a lysing agent for red cells can be added.
- white cells may be collected by centrifugation and the supernatant hemolysate removed by aspiration.
- the stained white cells can be re- suspended in a measured volume of buffer (typically less than the original blood volume (say 1 - 20 uL) and dispensed into transparent capillary channels for image analysis.
- a measured volume of buffer typically less than the original blood volume (say 1 - 20 uL) and dispensed into transparent capillary channels for image analysis.
- up to three or even five or more cell types can be imaged using antibodies having different fluorescent labels or and/or antibodies labeled with different fluor/protein ratios.
- more than one reaction mixture can be used.
- a reaction mixture can be used to count or analyze various numbers of cell types.
- the capillary channels are typically about 10 - 100 urn deep, 0.5 - 2 mm wide and 0.5 - 5 cm long.
- the capillary channels may have other dimensions, including but limited to other dimensions described elsewhere herein.
- the stained cell dispersion may fill the channel usually by capillary action and the cells may be allowed to settle on the lower channel surface.
- the channels can be illuminated with one or more lasers or other light sources (e.g., LEDs).
- the optical train may have one or more optical elements, such as dichroic mirrors or lenses, and may or may not magnify the field of view. In some embodiments, the field of view may be magnified 2 - 100 fold.
- a series of images may be collected typically representing a field of view of about 1 mm x 0.5 mm and which contains 1 - 10,000 cells (ideally, 300 cells of interest) imaged onto a sensor having an area of about 1000 x 1000 pixels (1 million total).
- a series of images representing adjacent sections of channel may be collected.
- a mechanical stage can be used to move the channels relative to the light source.
- a servo-mechanism may move the stage in a vertical direction so as to focus the image.
- the light source or one or more optical elements may move relative to the stage to focus the image. Images are usually made using one or more combinations of light sources and optical filters. The light sources may be turned on and off and filters moved into the light path as needed. Preferably up to 1000 cells of any given type may be counted.
- various numbers of cells of any given type may be counted, including but not limited to more than, less than, or equal to about 1 cell, 5 cells, 10 cells, 30 cells, 50 cells, 100 cells, 150 cells, 200 cells, 300 cells, 500 cells, 700 cells, 1000 cells, 1500 cells, 2000 cells, 3000 cells, 5000 cells.
- Cells may be counted using available counting algorithms. Cells can be recognized by their characteristic fluorescence, size and shape. Pattern recognition algorithms may be employed to exclude stained cell debris and in most cases where there are cells which are aggregated these can either be excluded from the analysis or interpreted as aggregates.
- a cytometry platform may be an integrated automated microscopy device capable of the following tasks in a fully automated, controlled environment. One or more of the following tasks may occur in cytometry applications. The following tasks may occur in the order they appear or in alternate orders or other tasks may be substitute as appropriate.
- Blood cells of a desired type may be isolated in accordance with one or more embodiments described elsewhere herein. For example, such isolation may occur as referred to in previous descriptions relating to the cytometry or the centrifuge.
- Specific fluorescent dyes may be employed.
- Cells of interest can be incubated with pre-aliquoted solutions of fluorescently labeled binders (e.g., antibodies, aptamers, etc.) which are specific to markers on these cells.
- fluorescently labeled binders e.g., antibodies, aptamers, etc.
- a key consideration may be pairing 'bright” or high extinction coefficient and high quantum yield fluors with markers for which cells have a lower binding capacity; and vice versa.
- the marker CD22 may be expressed on B-lymphocytes at about one tenth the level as CD45. Given this relative expression, CD22 may be labeled with a "bright” dye and CD45 may be labeled with the "dimmer” dye.
- the markers to be labeled using this technique can be either intracellular or cell-surface markers.
- a primary binder may be conjugated with another molecule which can be specifically recognized by a secondary binder.
- a secondary binder labeled with a higher number of fluorophores can then bind the primary binder in situ and enhance fluorescence signal.
- One scheme for achieving this may be the use of biotin conjugated anti- CD22 antibody which may be in turn recognized by an anti-biotin antibody that is labeled with fluorescein isothiocyanate (FITC).
- FITC fluorescein isothiocyanate
- Figure 123 provides an example of a fluorescence micrograph showing labeled leukocytes.
- the example illustrates a fluorescence micrograph of Alexa-Fluor 647-anti-CD45 labeled human leukocytes in a fixed, lysed blood sample.
- the pseudocolor scheme is used to enhance perception of the different between 'bright' cells (with high CD45 expression) and 'dim' cells (with low CD45 expression).
- Color stains of cell smears may also be employed within the system.
- the manual procedure given in Sto ' wRITETM Wright-Giemsa Stain can be automated and read in the devices of the subject invention.
- non-specific fluorescent dyes can be used.
- the platform can also use fluorescent dyes which may bind to nucleic acids (e.g., SYTO, Hoechst) or lipid membranes (e.g., Dil, DiD, FM-4-64).
- nucleic acids e.g., SYTO, Hoechst
- lipid membranes e.g., Dil, DiD, FM-4-64
- cytometry cuvettes may be designed to confine a pre-labeled cell suspension of fixed volume into a 'channel' fabricated so as to provide an optically clear imaging material above and below the cells.
- Sample may be introduced into the channel via a sample entry port. At some distance from the sample entry port, an air vent may allow the release of air pressure and flow of sample into the channel.
- the channel dimensions may be designed to hold a pre-defined known volume of fluid, regardless of the volume dispensed at the sample entry port.
- Each cuvette may have multiple channels of same and/or different volumes, each with at least one sample entry port and at least one air vent.
- the concentration of cells of interest in the sample can be adjusted during sample preparation such that after confinement in the cuvette, a desired number of cells per field of view in the imaging system can be achieved.
- One method for doing this may be to image a container with the cell dispersion and measure turbidity. Using a pre-established relationship between turbidity and cell count, the cell density can be calculated.
- the cell dispersion will be made in a volume of buffer such that with the lowest likely cell count, and the cell concentration will be greater than optimal for image-based cell counting. More buffer may then be added to bring the dispersion to the optimal level.
- the imaging area of the cuvette may be designed so as to provide a sufficient number of cells for the application of interest. For example, counting the abundant RBCs may require counting of only 1000-2000 cells and hence a diluted sample and only a small imaging area in the cuvette. However, counting rare myeloblasts may require in some cases the ability to image more than 100,000 (total) cells. In such a scenario, the system may concentrate the cell suspension so that 100,000 cells may be imaged with a reasonable number of fields of view. Therefore, the channel on the cuvette dedicated to RBC imaging will be smaller than the one dedicated to imaging myeloblasts.
- the cuvette may be designed to be picked up by a standard pipetting mechanism in an automated fashion to allow the transfer of the cuvette to the imaging platform.
- the pipetting mechanism's tip ejector can eject the cuvette from the pipetting mechanism onto the imaging platform.
- Registration of cuvette to imaging platform may take place in two steps. Upon transfer of the cuvette to the imaging platform, static registration features on the cuvette may interface with mating features on the imaging platform to align the cuvette parallel to the imaging platform's optical axis (X,Y registration). Registration may then be completed by a mechanism located on the imaging platform. This mechanism may bias the cuvette against a planar surface perpendicular to the imaging platform's optical axis (Z registration), thereby constraining the sample within the imaging platform's focal range.
- [00663] Imaging of cells using fluorescence, darkfield illumination, brightfield illumination.
- the method of imaging the cells may also be applied to other applications of the invention described elsewhere herein.
- the imaging techniques, as previously described, can be used for other imaging uses.
- Illumination capabilities The cytometry platform may be designed to have three types of illumination schemes: epi-fluorescence, darkfield and brightfield.
- the modular nature of the setup also allows integration of phase-contrast and differential-interference contrast (DIC).
- DIC differential-interference contrast
- Epi-fluorescence illumination may be achieved by the use of three laser lines (e.g., 488nm, 532nm and 640nm), but the modular nature of the system also allows for integration of other light sources, such as other laser sources, LEDs and standard arc -lamps (e.g. Xenon, Mercury and Halogen). Further, two different sources can be used simultaneously, if required. Consequently, the cytometry platform can be used to image a large variety of fluorescent dyes.
- the combination of illumination sources and emission optics can be configured to achieve various numbers (e.g., 3-5) spectrally independent channels of imaging.
- Darkfield illumination may be achieved by the use of a ringlight (located either above or below the sample), a darkfield abbe condenser, a darkfield condenser with a toroidal mirror, an epi-darkfield condenser built within a sleeve around the objective lens, or a combination of ringlight with a stage condenser equipped with a dark stop.
- these optical components can create a light cone of numerical aperture (NA) greater than the NA of the objective being used.
- NA numerical aperture
- the choice of the illumination scheme depends upon a number of considerations such as magnification required, mechanical design considerations, or size of the imaging sensor.
- a ringlight based illumination scheme generally provides uniform darkfield illumination over a wider area while at the same time providing sufficient flexibility in mechanical design of the overall system.
- Figure 124 provides an example of intracellular patterns using darkfield images. The example shows different intracellular patterns in darkfield images of human leukocytes, (a) A strong scattering pattern due to presence of granules in eosinophils, (b) a polymorphonuclear neutrophil with characteristic nucleolar lobes and (c) cells that do not scatter light to a significant degree (lymphocytes or basophils)
- Brightfield illumination may be achieved by the use of a white light source along with a stage- condenser to create Koehler illumination.
- Figure 126 provides an example of brightfield images of human whole blood. The example shows brightfield images of a human whole blood smear stained with the Wright- Giemsa staining method. Characteristic patterns of staining of human leukocytes are apparent. The characteristically shaped red cells can also be identified in these images.
- An automatic filter wheel may allow control of the imaging optical path to enable imaging of multiple fluorophores on the same field of view.
- the cytometry platform may use an image -based algorithm to control the z-position (e.g., vertical position) of the objective (i.e., its distance from the sample) to achieve auto- focusing.
- a small image for example, 128x128 pixels
- This image may be analyzed to derive the auto-focus function which may be used to measure of image sharpness.
- the next z-location of the objective may be calculated.
- the sample may be moved to the new z-location and another small image may be captured.
- this closed-loop system does not require the use of any other hardware for focusing.
- the microscope stage may be connected to computer-controlled stepper motors to allow translation in the X and Y directions (e.g., horizontal directions). At every location, the desired number of images may be captured and the stage may be moved to the next XY position.
- Imaging sensor A camera with a CCD, EMCCD, CMOS or in some cases a photo -multiplier tube can be used to detect the signal.
- the cytometry platform may use different illumination techniques to acquire images that reveal diverse properties and features of the cells. Labeling with cell-marker specific binders may reveal the degree of expression of that particular marker on the cell surface or in the cell.
- Darkfield image may reveal the light scattering properties of the cell. The internal and external features of the cell which scatter more light appear brighter and the features which scatter lesser amounts of light appear darker in a darkfield image.
- Cells such as granulocytes have internal granules of size range (100-500nm) which can scatter significant amount of light and generally appear brighter in darkfield images.
- the outer boundary of any cell may scatter light and may appear as a ring of bright light. The diameter of this ring may directly give the size of the cell.
- Brightfield images of cells can reveal cell size, phase -dense material within the cells and colored features in the cell if the cells have been previously stained.
- An image processing library may extract one or more of the following information for each cell (but is not limited to the following):
- Shape of the cell as quantified by standard and custom shape attributes such as aspect ratio, Feret diameters, Kurtosis, moment of inertia, circularity, solidity etc.
- Intracellular patterns of staining or scattering or color that are defined as quantitative metrics of a biological feature, for example density of granules within cells in a darkfield image, or the number and size of nucleolar lobes in a Giemsa- Wright stained image of polymorphonuclear
- the image processing algorithms utilized in this step may use combinations of image filtering, edge detection, template matching, automatic thresholding, morphological operations and shape analysis of objects.
- measured attributes of each cell extracted from the images can range from 7-15, thus creating a 7 to 15 dimensional space within which each cell is a point. If n measured attributes are extracted from the images, an n dimensional space may be provided, within which each cell is a point.
- n- dimensional scattered data set Based on data acquired for a large number of cells (e.g., 100-100,000 cells) a complex n- dimensional scattered data set may be generated.
- Statistical methods may be used for clustering cells into individual separate populations in this n- dimensional space. These methods may also use state-of-the-art knowledge from cell biology and hematology to aid in clustering and cell population identification.
- Figure 125 provides an example of multi-parameter acquisition of data from labeled cell samples.
- Human leukocytes were labeled with the pan-leukocyte marker anti-CD45-Alexa Fluor 700 (shown here in green) and the B-cell marker anti-CD22-APC (shown here in red).
- the individual channels show different patterns of CD45, CD22 expression and side scatter.
- Cells which are positive for CD22 and CD45 (B- lymphocytes) show the characteristically low side scatter.
- cells such as neutrophils and eosinophils which have high side scatter do not show labeling for CD22.
- Figure 127 provides an example of quantitative multi-parametric data acquisition and analysis.
- a histrogram may be provided which may show distribution of CD45 intensity on human leukocytes. Any other graphical data distribution techniques may be employed to shows the distribution.
- a scatter plot of side scatter may be provided. The side scatter may be determined by dark- field image analysis versus CD45 fluorescence intensity for a human leukocyte sample. The side scatter plot may show two main populations of granulocytes (top left) and lymphocytes (bottom right).
- an assay for performing a 5-part leukocyte differential may be provided.
- the reportables in this case may be number of cells per microliter of blood for the following types of leukocytes: monocytes, lymphocytes, neutrophils, basophils and eosinophils.
- the basic strategy for development of this assay on the cytometry platform may be to convert this into a problem where some attributes of leukocytes are measured such as side scatter, CD45 fluorescence intensity, or CD20 fluorescence intensity so that leukocytes can be segregated into (e.g., 5) different populations in this n-dimensional space.
- the regions made around a cluster of cells can be positioned on a scatter plot in 2-dimensional space are called "gates" after flow cytometry parlance.
- An example labeling and "gating" strategy is as follows:
- the cytometry platform and analysis system described herein may advantageously permit automated sample preparation and execution based on ordered sample.
- the systems and methods described may also enable specific identification of cells as opposed to VCS (volume, conductivity and scatter), which can increase confidence in identification and reduce instances for confirmatory testing.
- the image analysis described herein may also permit preservation of cell images for later confirmation, analysis as required. There may also advantageously be availability of morphological features of the cell.
- dynamic adjustment of sample prep and imaging parameters to deal with cell samples of wide range of concentrations may be provided.
- the centrifuge may be used to prepare and concentrate cell populations.
- a method may include the use of the centrifuge for cell preparation and the imaging and analysis system described elsewhere herein.
- a combination of dark- field imaging and imaging of cells stained with multiple fluorescent antibodies may be used. Such a combination may give the equivalent of FACS analysis in a much simpler and less expensive device than other techniques.
- the systems and methods described herein may enable one or more of the following features. Such features may be advantageous for various applications.
- automated sample inspection and processing may be enabled. Such sample inspection and processing may include one or more of the following: sample quality, sample volume measurement, dilution (and measurement of dilution factors), and separation of red and white cells from plasma.
- An automated chemical/assay related process may also be employed. This may include precipitation, mixing or sedimentation.
- any and all assays that produce luminescence or change light may include one or more of the following:
- spectrophotometry fluorimetry, luminometry, turbidimetry, nephelometry, refractometry, 3 -color image analysis, polarimetry, measurement of agglutination, image analysis (which may employ one or more of the following: camera, digital camera, scanner, lens-less photography, 3-D photography, video photography), or microscopy.
- Automated quality control and/or calibration of assays may also be provided within the systems and methods described herein.
- two-way communication may be provided. Such communication may enable record keeping of all assay steps. The two-way communication may also enable changes in assay protocols to optimize or increase completion of multiple assays.
- imaging may be used in conjunction with one or more other measurements or detection steps.
- the imaging may be complementary to other techniques, procedures, reactions, and/or assays.
- imaging may be used to perform one or more quality control check or step for any other action, such as a sample preparation, assay, or detection step.
- Imaging may be used for the facilitation of other detections. Imaging may be used to improve the accuracy and/or precision of collected data.
- the imaging may be a quality control aspect to verify data, results, and/or any measurements.
- the imaging may be a control mechanism or improvement mechanism. Imaging may be used to detect one or more condition that may affect collected data and/or the accuracy and/or precision of the data.
- imaging may improve sample preparation, assay, and/or detection procedures. This may be particularly advantageous in situations where there are small sample volumes, such as volumes described elsewhere herein.
- a detection step may occur to determine the presence and/or concentration of an analyte. Detection may occur of one or more signal that may be representative of data that may be useful for subsequent qualitative and/or quantitative evaluation. Detection may or may not include the detection of visible light. Detection may include the measurement of energy from anywhere along the electromagnetic spectrum (e.g., infra-red, microwave, ultraviolet, gamma ray, x-ray, visible light). Detection may occur using any type of sensor, which may include an optical sensor, temperature sensor, motion sensor, pressure sensor, electricity sensor, acoustic sensor, chemical sensor, spectrometer, or any other sensor described elsewhere herein, or any combination thereof. In some embodiments, detection may or may not include a spatial distribution of light and/or energy. In some instances, detection may or may not include an energy density distribution.
- Imaging may be capable of detecting one or more condition under which the detection takes place. Imaging may be used to detect the condition of a sample, reagent, container, portion of the device that may be used in the detection.
- the imaging may be visible imaging.
- imaging may include capturing a snapshot, photo, and/or picture. Imaging may include capturing a spatial distribution of energy along the electromagnetic spectrum. The energy along the electromagnetic spectrum may include visible light, or may include other ranges (e.g., infra-red, ultraviolet, or any other described herein).
- a spatial distribution of visible light may include a two-dimensional image.
- imaging may include the use of an image capture device, which is described in greater detail elsewhere herein.
- image capture devices may include a camera, such as a lens-less (computational) camera (e.g., Frankencamera) or open-source camera.
- An image capture device may be capable of capturing signals that may be capable of generating a one -dimensional, two-dimensional, or three-dimensional representation of the item that is imaged.
- an image capture device may be a motion- sensing input device configured to provide a three-dimensional or pseudo three-dimensional representation of an object.
- the imaging technique may be the same or may be different from the detection mechanism utilized.
- different types of detection mechanisms are used between the detection step and the quality control imaging step.
- detection may include an energy band assessment or energy density distribution, such as from a spectrometer, while quality control imaging may include a spatial distribution of visible light, such as from a camera.
- Sensitive detection may be achieved by imaging.
- an imaging device may be able to capture an image to within 1 mm, 500 micrometer (um), 200 um, 100 um, 75 um, 50 um, 25 um, 15 um, 10 um, 7 um, 5 um, 1 um, 800 nanometer (nm), 700 nm, 500 nm, 300 nm, 100 nm, 50 nm, 30 nm, 10 nm, 5 nm, 1 nm, 500 picometer (pm), 300 pm, or 100 pm.
- the imaging may be achieved by a camera which may have a resolution of greater than or equal to about 2 megapixels, 4 megapixels, 6 megapixels, 8 megapixels, 10 megapixels, 12 megapixels, 15 megapixels, 20 megapixels, 25 megapixels, 30 megapixels, 40 megapixels, or 50 megapixels, or more.
- Imaging may be used to detect an error or other fault state. Imaging may be used to determine a condition that may increase the likelihood of an error and/or result in inaccuracies and/or imprecision. For example, imaging may be used to determine the presence and/or absence of one or more undesirable materials. Examples of undesirable materials may include bubbles, particles, fibers, particulates, debris, precipitates, or other material that may affect a measurement. In another example imaging may be used to determine if a volume of sample, reagent, or other material falls within a desired range, or whether a sample, reagent, or other material is located in a desired location. The imaging may be used to determine the concentration of a sample, reagent or other material, or whether the sample, reagent, or other material falls into a desired concentration range.
- an enzymatic assay may be performed on a small volume of sample. Examples of volume values may be provided elsewhere herein.
- a spectrometer or other detection method or mechanism described herein may be used to perform a detection step for the enzymatic assay.
- An imaging step may occur to determine the conditions under which the detection is occurring. For example, the imaging step may determine whether there are undesired particulates, such as bubbles, or any other undesired conditions.
- the imaging step may verify whether the assay is operating as it should.
- the imaging step may confirm whether the operating conditions under which the assay is occurring and/or detection is being performed falls within desired tolerances or optimized conditions.
- the imaging may include taking a snapshot of a reaction occurring in a container.
- the captured image may be analyzed for any undesirable and/or desirable conditions.
- the captured image may be analyzed automatically in a computer assisted method.
- One or more processor may aid with the analysis of the captured image, in some cases using one or more routines implemented by way of machine -executable code stored in a memory location.
- the imaging may be used for quality control without requiring the intervention of a human.
- the imaging may provide intelligence for a system.
- the imaging step may provide intelligence on the conditions under which sample preparation, assay, and/or detection occurs.
- the detection methods may provide more reliable, accurate, and/or precise measurements from a point of service device or component of the device, when utilizing the imaging in a quality control procedure.
- the quality control may be beneficial when small volumes are utilized.
- dynamic feedback may be provided during a sample processing step.
- dynamic feedback may occur during a sample preparation step, assay step, and/or detection step.
- dynamic feedback may be provided via imaging.
- dynamic feedback may occur via any other detection mechanism, such as those described elsewhere herein.
- a dynamic feedback mechanism may utilize optical detection, electromechanics, impedance, electrochemistry, microfluidics, or any other mechanism or combination thereof.
- Dynamic feedback may optionally utilize imaging or other detection mechanisms.
- the dynamic feedback may be involved in automated decision making for a system. For example, an image may be captured, and data may be captured that may be considered in the determination of a step.
- a sensor such as an imaging sensor, may capture physical information which may be utilized in the determination of a subsequent step or procedure. Such subsequent steps or procedures may be determined on the fly in an automated fashion.
- dynamic dilution may occur.
- a container such as a cuvette or any other container described herein, may have a sample therein.
- a dynamic feedback mechanism e.g., imaging,
- the spectrophotometer may determine the concentration of a sample.
- the determination may be a rough or crude determination.
- the initial determination may be a ballpark determination that may provide feedback that may put the sample into a condition for more precise or fine-tuned detection and/or analysis.
- the dynamic feedback mechanism may be an imaging method that may use an initial fluorescence detection to do the initial estimate for concentration.
- the dynamic feedback mechanism may determine whether the sample concentration falls within an acceptable range.
- the concentration may be a cell concentration.
- a rough cell count may be performed to determine cell concentration.
- One or more signal from the dynamic feedback mechanism may be used for the cell count.
- cells may be provided in a wide range of concentrations.
- the concentrations may vary on over 1, 2, 3, 4, 5, 6, 7 or more orders of magnitude.
- different concentrations may be provided within the same sample.
- the sample may be diluted or concentrated and/or amplified. For example, if the concentration is higher than a desired range, the sample may be diluted. If the concentration is lower than a desired range, the sample may be concentrated and/or amplified. The degree of dilution and/or concentration/amplification may be determined on the fly, based on the estimated concentration.
- the degree of dilution and/or concentration/amplification may be determined in an automated fashion.
- Dynamic feedback may be automated.
- the dynamic feedback mechanism e.g., imaging or other detection mechanism
- the dynamic feedback mechanism may provide data which may be analyzed to determine an operational condition. For example, a sample concentration may be determined based on the dynamic feedback mechanism.
- a processor may be provided, capable of receiving and/or processing one or more signals from the dynamic feedback mechanism. Based on the received signals the processor may determine the concentration and whether the concentration falls within a desired range. If the concentration falls within the desired range, the processor may determine that no further dilution or concentration/amplification is needed. If the concentration is higher than the desired range, the processor may determine that dilution is needed.
- the processor may determine the degree of dilution needed based on how far the concentration falls outside the desired range. If the concentration is lower than the desired range, the processor may determine that concentration (or amplification) is needed. The processor may determine the degree of amplification needed based on how far the concentration falls below the desired range. Such determinations may be based on tangible computer readable media which may include code, logic, or instructions for performing one or more steps. Such determinations may be automated and thus made without requiring the intervention of a human. This may apply to any operational condition, and need not be limited to sample concentration, such as cell concentration.
- concentration/amplification step a more precise measurement may be taken. For example, a more precise measurement of cell counting may occur after the sample is determined to be in a desirable range. In some embodiments, a sample may reach a desirable range after a single dilution and/or concentration/amplification step. In other embodiments, additional feedback steps may occur and additional dilution and/or
- concentration/amplification steps may be provided, as necessary. For example, if an initial determination yields that a sample has a high concentration, a dilution step may occur. Following the dilution step, an additional feedback step may optionally occur. If the sample concentration does not fall into the desired (or otherwise predetermined) range, an additional dilution or concentration/amplification step may occur, depending on whether the measured concentration is above or below the desired range, respectively. This may be repeated as many times as necessary for the sample to fall into the desired range. Alternatively, feedback steps may or may not be repeated, or may be repeated a fixed number of times. In some embodiments, each feedback step may occur with a greater degree of precision. Alternatively, the same degree of precision may be utilized in each of the feedback steps.
- a sample concentration e.g., cell concentration, analyte concentration
- the sample may be analyzed effectively.
- the sample cell concentration may have a desired range that may be beneficial for imaging.
- a desired number of cells per field of view may be provided.
- Cell quantification and enumeration by imaging can enhanced by controlling the cells density during imaging, thus limiting crowding and clustering of cells. Consequently the range of analyte concentration over which the assay is linear can be maximized or increased.
- the dynamic system may perform a prior, non-destructive measurement on the sample using a method which has a high dynamic range to provide determine a rough cell concentration in the sample.
- An algorithm may then calculate the dilution ratio required to bring the cell concentration in the acceptable range for the main measurement. Dilution and/or concentration/amplification may be provided accordingly, thereby providing dynamic dilution and/or concentration.
- a total sample volume may include any of the volumes described elsewhere herein.
- the volumes for a particular portion of a sample to be analyzed may have any of the volumes described elsewhere herein.
- Dynamic dilution may assist with providing low coefficient of variation.
- a coefficient of variation for a sample preparation, assay, and/or detection step may have a coefficient of variation value as described elsewhere herein. This may be advantageous in point of service devices, which may utilize small volumes, and/or have low coefficients of variation.
- Dynamic feedback may advantageously permit non-destructive testing of a sample. This may be advantageous in systems using small volumes.
- the same sample may be used for the initial feedback detection and for subsequent detections.
- the same sample may under initial feedback detection and subsequent detections within the same container (e.g., cuvette, vial, tip).
- a vessel may be provided with a sample that is outside a desired and/or detectable range in its initial state. For example, a concentration of one or more analytes and/or cells may fall outside a desired and/or detectable concentration range initially.
- the same sample may be measured within the range in the same vessel.
- the concentration of the one or more analytes and/or cells may later fall within a desired and/or detectable range in the same vessel.
- one or more intervening steps such as dilution and/or concentration/amplification may be performed on the sample in order to get the sample into the desired and/or detectable range. Such intervening steps may be performed in an automated fashion.
- dilution may be provided to the sample in an automated fashion.
- a diluent may be dispensed into a container holding the sample and mixed with the sample to effect a new sample volume.
- the diluent includes a single diluent.
- the diluent includes a plurality of diluents.
- the diluent can be dispensed into the container with the aid of a pumping system, valves and/or fluid flow channels for facilitating the flow, such as a microfluidic system having one or more microfluidic channels and/or one or more microfluidic pumps.
- the microfluidic system may include one or more mechanical and/or electromechanical components, such as a mechanical pumping system having one or more actuated (e.g., pneumatically actuated) valves for facilitating the flow of a fluid.
- the pumping system in some cases includes a mechanical pump configured to facilitate fluid flow.
- the pumping system can include one or more sensors for measuring and relaying operating parameters, such as fluid flow rate, concentration, temperature and/or pressure, to a control system.
- the diluent is dispensed into the container with the aid of a microfluidic system having a mechanical pump coupled to a microfluidic channel bringing the container in fluid communication with a diluent reservoir.
- a pumping system is provided to release a diluent based on a measured sample dilution.
- the sample dilution can be measured with the aid of a sensor, such as, for example, a light sensor.
- the light sensor is coupled with a light source for directing a beam of light through the sample, and subsequently measuring sample dilution based at least in part on the scattering of light through the sample. If the measured sample (e.g., cell, tissue) concentration is above a predetermined limit (or threshold), then the pumping system directs a diluent (e.g., water) from a diluent reservoir to a container holding the sample.
- a diluent e.g., water
- dynamic dilution is electronically automated with the aid of a fluid flow system having a pump (e.g., microfluidic pump) in fluid communication with a fluid flow channel (e.g., microfluidic channel), and further including one or more valves for regulating fluid flow.
- a pump e.g., microfluidic pump
- a fluid flow channel e.g., microfluidic channel
- the automation of dilution can be used to test and/or adjust calibration settings, such as preset dilution fluid volumes used to effect a desired concentration.
- the pump comprises one or more valves, such as pneumatically-actuated valves.
- the pump, fluid flow channel and one or more valves bring a diluent reservoir in fluid communication with a container configured to hold a sample.
- the one or more valves and/or the pump can be in electrical communication with a control system having a processor for regulating the flow of diluent from the diluent reservoir to the to regulate the concentration of the sample.
- Dynamic feedback advantageously enables the automated regulation of sample concentration while minimizing, if not eliminating, user involvement.
- the concentration of a sample is automatically regulated (e.g., diluted or amplified) without any user involvement.
- Such minimal user involvement can provide low coefficient of variation in imaging and overall system use, as described elsewhere herein.
- dynamic feedback system is used to regulate the concentration of cells in a fluid sample using imaging.
- a sample container such as cuvette
- the imaging is used to measure the concentration of cells in the fluid sample.
- the measured concentration can be a rough (or ballpark) measurement of concentration.
- the dynamic feedback system then dilutes the fluid sample by providing a diluent into the sample container. This may minimize, if not eliminate, any disturbance to (or destruction of) the cells upon dilution.
- An optional measurement of the concentration of cells in the fluid sample can then be made to measure the concentration following dilution. In some situations, following dilution a reaction can take place in the same sample container that was used to dilute the sample. In some situations, the reaction may take place in cases in which the dilution is not optimal.
- a rough measurement of sample concentration is made with the aid of a spectrometer, and a more precise measurement of sample concentration is made with the aid of an imaging device.
- the imaging device can include a light source (e.g., coherent light, such as a laser, or incoherent light) and a camera, such as a charge-coupled device (CCD) camera.
- CCD charge-coupled device
- the dynamic feedback system coarse adjusts the concentration of the sample by providing the diluent, and subsequently makes the more precise measurement.
- the sample concentration can be further adjusted by providing smaller volumes of a diluent (i.e., fine adjustment) in relation to the volume of the diluent provided during coarse adjustment.
- the rough measurement of sample concentration is made with the aid of an imaging device, and the more precise measurement is made with the aid of a spectrometer. Coarse and fine adjustment
- Dynamic feedback systems can be configured to concentrate/amplify (i.e., increase the concentration of) a sample, such as cells in a fluid sample. In some cases, this is accomplished with the aid of centrifugation or field-induced separation (e.g., electric field separation, magnetic separation).
- the concentration of a sample is made using an imaging device, with the location of the imaging device selected to select a desired path length and/or focal point. In some cases, the location of one or more optics associated with the imaging device are adjusted to provide a desired path length and/or focal point. In some cases, a lens-less camera is used for image capture, which can computationally provide image analysis and various focal points.
- Dynamic dilution can be performed on various sample volumes. In some cases, if a sample volume is above a predetermined limit, the sample can be distributed in multiple sample containers (e.g., cuvettes) for sequential or parallel processing and/or imaging.
- sample containers e.g., cuvettes
- the dynamic feedback mechanism may result in self-learning by the system. For example, for a dynamic dilution/concentration system, an initial feedback measurement may be made. Based on the feedback measurement, the sample may have no action, may be diluted, or may be concentrated/amplified. Subsequent measurements and/or detection may occur. The subsequent measurements and/or detection may or may not be additional feedback measurements. Based on the subsequent measurements, a determination may be made whether the action taken (e.g., no action, dilution, concentration/amplification) was correct and/or whether the correct degree of action was taken (e.g., enough dilution or concentration/amplification). For example, an initial feedback mechanism may determine that the sample concentration is high and needs to be diluted.
- the action taken e.g., no action, dilution, concentration/amplification
- the sample may be diluted by a particular amount.
- a subsequent measurement may be taken (e.g., image of the sample may be taken). If the degree of dilution does not bring the sample into the desired range (e.g., dilution was too much or too little), the system may receive an indication that for subsequent dynamic dilutions/concentrations with the same or similar initial feedback mechanisms, a different degree of dilution may be used. If the degree of dilution does bring the sample into the desired range, the system may receive a confirmation that the amount of dilution should be used for subsequent dilutions for the same or similar type of initial feedback measurement.
- Data points may be gathered based on initial conditions and subsequent actions, which may assist with determining appropriate actions to take in subsequent dynamic feedback situations. This may cause the system to self-learn over time on steps to take in particular dynamic situations.
- the self-learning may apply to individualized situations. For example, the self-learning system may learn that a particular individual from whom the sample is drawn, may require different degrees of dilution/concentration than another individual.
- the self-learning may apply to groups of individuals having one or more characteristic. For example, the self- learning system may learn that an individual using a particular type of drug may require different degrees of dilution/concentration than another individual.
- the self- learning system may also be generalized.
- the system may become aware of a pattern that people of a particular demographic or having particular characteristics may or may not required different degrees of dilution and/or concentration.
- the system may draw on past data points, individuals' records, other individuals' records, general health information, public information, medical data and statistics, insurance information, or other information. Some of the information may be publicly available on the Internet (e.g., web sites, articles, journals, databases, medical statistics).
- the system may optionally crawl web sites or databases for updates to information.
- self- learning may occur on the device, the cloud or an external device. As additional data is gathered, it may be uploaded to the cloud or external device, and may be accessible by the self-learning system.
- sample preparation, processing and/or analysis is performed with the aid of image capture and/or manipulation devices, including electromagnetic radiation (or light) capture and/or manipulation devices, such as imaging devices or spectrometers.
- an imaging device can be used in association with a spectrometer.
- a spectrometer can be used to measure properties of light over a select portion of the electromagnetic spectrum, which may be used for spectroscopic analysis, such as materials analysis.
- An imaging (or image capture) device can be used to measure sample concentration, composition, temperature, turbidity, flow rate, and/or viscosity.
- an image capture device may be a digital camera.
- Image capture devices may also include charge coupled devices (CCDs) or photomultipliers and phototubes, or photodetector or other detection device such as a scanning microscope, whether back-lit or forward-lit.
- CCDs charge coupled devices
- CMOS complementary metal-oxide-semiconductor
- CMOS complementary metal-oxide-semiconductor
- an imaging device may include an optical element that may be a lens.
- the optical element is a lens which captures light from the focal plane of a lens on the detector.
- Cameras may include one or more optical elements that may focus light during use, or may capture images that can be later focused.
- imaging devices may employ 2-d imaging, 3-d imaging, and/or 4-d imaging (incorporating changes over time).
- Imaging devices may capture static images or dynamic images (e.g., video). The static images may be captured at one or more points in time.
- the imaging devices may also capture video and/or dynamic images.
- the video images may be captured continuously over one or more periods of time.
- an image capture device is a computational camera that is used to measure the concentration of a plurality of samples within a relatively short period of time, such as at once.
- the computational camera may have an optical which may be different from a lens.
- the computation cameral is a lens-less camera that takes a photograph of a plurality of samples in staggered sample containers (e.g., cuvettes). The concentration of a sample in a particular sample container can then be calculated by, for example, mathematically rendering the image to select a focal point at or adjacent to a portion of the image having the particular sample container, and deriving the sample concentration from the rendered image.
- Such mathematical manipulation of an image can provide other information at various points in space within the field of view of the lens-less camera, which may include points in space that may be extrapolated from scattered light.
- the final signal may be analyzed by complex algorithms.
- One example of such a setup is a computational camera with optical elements which may produce a Fourier-transformed image on the detector. The resulting "image" can be analyzed to extract required information.
- Such a detector would enable one to obtain rich information from the imaged subject. Obtaining different features from the image, for example, information at a different focal length could be done purely through software, simplifying the imaging hardware and providing more rapid and informative data acquisition.
- Electromagnetic radiation capture and/or manipulation devices can be used in various applications provided herein, such as measuring sample concentration, including dynamic dilution.
- a light capture and/or manipulation device includes a light source, such as a coherent light source (e.g., laser), coupled with a light sensor, such as a CCD camera, for capturing scattered light, as may emanate from a sample upon the light source being directed through the sample. This can be used to measure the concentration of the sample.
- the light sensor can be configured to capture (or sense) various wavelengths of light, such as red, green and blue, or other color combinations, such as combinations of red, orange, yellow, green, blue, indigo and violet, to name a few examples.
- the light sensor is configured to sense light having wavelengths at or greater than infrared or near infrared, or less than or equal to ultraviolet, in addition to the visible spectrum of light.
- Light capture and/or manipulation devices can be used to collect information at particular points in time, or at various points in time, which may be used to construct videos having a plurality of still images and/or sound (or other data, such as textual data) associated with the images.
- Light capture and/or manipulation devices including computational (or lens-less) cameras, can be used to capture two-dimensional images or three-dimensional (or pseudo three-dimensional) images and/or video.
- an image capture and/or manipulation device perturbs an object and measures a response in view of the perturbation.
- the perturbation can be by way of light (e.g., x-rays, ultraviolet light), sound, an electromagnetic field, an electrostatic field, or combinations thereof.
- perturbation by sound can be used in acoustic imaging.
- Acoustic imaging may use similar principles to diagnostic ultrasound used in medicine. Acoustic imaging may function similarly to a regular microscope but may use acoustic waves.
- a source of ultrasound may produce waves that can travel through the sample and get reflected/scattered due to heterogeneities in the elastic properties of the sample.
- the reflected waves may be "imaged" by a sensor.
- a variant of this method may include "photo-acoustic imaging" where the acoustic waves traveling through the sample may cause local compression and extension of the sample. This
- compression/extension may cause a change in the refractive index of the sample material which can be detected by measuring/imaging the reflection of a laser beam by the sample.
- an imaging device can be used to measuring the volume of a cell.
- the combination of a light source and CCD camera is used to capture a still image of a cell.
- a computer system digitizes the still image and draws a line across the cell, such as through the center of the cell. The computer system then measures the distance between the points at which the line intersects the boundaries of the cell (or cell wall or membrane) to provide an estimate of the diameter of the cell, which may be used to estimate the volume of the cell.
- the imaging device may utilize line scanning microscopy to enable sample illumination with a thin line or spot of coherent laser light, so that power from the source can be concentrated in a small area giving high power densities.
- the detector geometry may be matched with the line or spot. Then the line/spot may be scanned across the sample so that different parts of it can be imaged. Each scanned line can then be concatenated to form the whole image (e.g., in a similar manner like a document scanner).
- This method may be advantageous as an analytical/imaging method for one or more of the following reasons: (1) high power density of illumination, (2) relatively high speeds can be obtained from line scanning as opposed to spot scanning, (though both may be slower than full-frame or classical imaging), (3) high precision and/or accuracy of analytical measurements on the sample such as fluorescence, absorbance, luminescence, (4) combination with spectral or hyper-spectral imaging such that a complete spectrum of the sample can be acquired for each pixel, (5) on-the-fly adjustment of resolution, (i.e. without changing any elements, a sample can be scanned at low or high lateral resolution as desired), or (6) can provide high depth of field to allow imaging of tissue samples.
- an imaging device is configured to detect light emanating from an ionization (fluorescence or luminescence) event, such as via scintillation.
- a scintillator is coated on or embedded in a material comprising a sample container. Upon a sample binding to (or otherwise interacting with the scintillator), the scintillator emanates light (e.g., fluorescent light) that is detected by a detector of the imaging device. This may be used to measure the radioactive decay (e.g., alpha and/or beta decay) of certain samples.
- an imaging device is a field effect transistor for detecting charged particles, such as ions.
- the imaging device may be a thermal detector for measuring a heat change, which may be used to construct a heat map, for example.
- a sample container comprises one or more wells for immobilizing a sample.
- the sample container may be coupled with an imaging device for imaging a sample immobilized in the one or more wells.
- Sample immobilization can be facilitated with the aid of beads having surface binding agents (e.g., antibodies) or surface binding agents, which may be disposed, for example, at bottom portions of wells.
- the wells can have diameters on the order of nanometers to micrometers or greater.
- sample detection and/or analysis is facilitated with the aid of image enhancement species, such as dyes.
- a dye may bind to a sample provide an optical, electrical or optoelectronic signal that can be detected by a detector of an imaging device.
- a dye binds to a cell and fluoresces, which is recorded by a detector. By measuring fluorescence, the spatial distribution and/or concentration of cells can be measured.
- Image enhancement species can aid in achieving improved signal-to- noise during image acquisition (or capture).
- a dye can bind to a cell with the aid of surface receptors and/or antibodies.
- the use of dyes can generate background fluorescence, which may distort an image—the fluorescence sample may be difficult to resolve from the fluorescing background.
- image acquisition can be enhanced by contacting a sample in a fluid with a fluorescent dye. Unbound dye is removed with the aid of a centrifuge (or magnetic or electric separation), which separates the sample from the unbound dye.
- the centrifuge may be integrated in a point of service device having the imaging device. The sample can then be re-suspended in a fluid and subsequently imaged with the aid of the imaging device.
- image acquisition can be enhanced by using dynamic feedback in addition to, or in place of, the use of image enhancement species.
- concentration of the sample is optimized with the aid of dilution and/or amplification prior to image acquisition.
- Sample separation can be facilitated with the aid of a centrifuge.
- sample separation can be performed with the aid of a magnetic or electric field.
- a magnetic particle can bind to a cell, which in the presence of a magnetic field can be used to attract the cell towards the source of magnetic attraction.
- Systems and methods provided herein can be applied to various types of samples, such as cells as may be derived from tissue (e.g., skin, blood), saliva or urine.
- tissue e.g., skin, blood
- saliva or urine e.g., saliva or urine.
- dynamic feedback and/or imaging can be applied to tissue samples or cell samples derived from such tissue samples. Examples
- Example 1 Nucleic acid amplification by Loop-mediated isothermal amplification (LAMP)
- the LAMP reaction was carried out in a total volume of 25 ⁇ in 500 uL PCR tubes (VWR, West Chester, PA).
- the reaction mixture included 0.8 ⁇ of primer 1 and primer 2, 0.2 ⁇ of primer 3 and primer 4, 400 ⁇ each dNTP (Invitrogen, Carlsbad, CA), 1M betaine (Sigma, St.
- reaction was incubated at 65 °C for 1 hour in sealed tubes.
- the polymerase was then inactivated by heating the reaction product to 80 °C for 5 minutes.
- SYBR Green I stain (Invitrogen, Carlsbad, CA) stock was diluted 100 fold, 5 ⁇ , was mixed with 10 ⁇ . of the completed LAMP reaction product mixed, and incubated for 5 minutes at room temperature. The reaction products were then read out in the following way:
- Fluorescence readout PCR tubes or pipette tips containing the mixture, were illuminated with 302 nm UV light and fluorescent emission ( max ⁇ 524 nm) imaged by a digital camera (Canon EOS Tli, 18-55 mm, Canon, Lake Success, NY).
- Figure 90 shows a comparison of LAMP dose -responses obtained by measurement of "bulk” fluorescence (conventional fluorometry) and responses for two color channels obtained by camera. As is evident, the color method shows a response comparable to that of fluorimetry.
- Example 2 System maximizing sample utilization
- a system for maximizing sample utilization can have the following characteristics:
- Cuvette is conical or has features where the width is wide and narrow
- a point of care assay device can include of single -use disposable cartridges an instrument which processes samples and operates the assays and a server remote from the instrument, the measurement and detection system comprising:
- a light imaging sensor such as a cell-phone camera having a light source (e.g., a flash) and a CCD image collecting device)
- the system can optionally include additional mechanisms for processing and/or imaging of samples acquired by users into a "sample acquisition device (capillary)" comprising: [00782] ⁇ Mechanisms for accepting the capillary in a defined location and moving said capillary to another defined location where an image can be acquired
- Example 4 Analysis of a capillary containing a blood sample
- Samples are acquired by users by touching the distal end of the capillary to a drop of blood (typically as a fingerstick).
- the capillary usually fills by capillary action provided there is sufficient blood.
- the user places the capillary at a latching location on the cartridge then inserts the cartridge onto a slide in the instrument then activates an assay by pressing a screen button on the instrument GUI. All subsequent assay steps are automated.
- the instrument moves the cartridge inside its housing and closes the door through which the cartridge was inserted.
- the instrument moves a component for grasping the capillary and moving it to a location in front of a digital camera equipped with a flash light source a CCD.
- An image of the capillary is taken using flash illumination and sent wirelessly to the server which interprets the image in terms of type, location and quantity of sample. If preset criteria are met the server instructs the instrument to continue the assay. If the sample is not appropriate the capillary is returned to the cartridge which is ejected and the server causes the GUI to display an appropriate prompt. The user may then (1) add more sample or (2) obtain a fresh sample and use a new capillary. Once the user indicates by the GUI that corrective action has been taken and the capillary/cartridge has been re-inserted into the instrument, the server instructs the instrument to resume assay processing.
- the criterion for appropriate volume of sample is usually that the volume is more than the minimum required for the assay. Thus in some assays for example, 10 uL of sample can be used, so typically the sample is regarded as adequate if the measured volume is > 12 uL.
- image acquisition is used to measure the volume of sample taken from the original sample by the instrument.
- sample is ejected from the capillary into a sample well in the cartridge either (1) by the user, or (2) by the instrument.
- an exact volume is taken from sample well using a second tip either by capillary action or (preferred) pneumatic methods.
- the type of the sub-sample and the sub-sample volume is measured (as above) by imaging the tip. If the sample type and volume is acceptable (target +/- ⁇ 5%), the assay proceeds. If not, the assay may be aborted and the user prompted to take remedial action.
- Sample types that may be discriminated are blood and plasma or serum and others.
- the imaging system makes the distinction by observing the much greater contrast between blood (opaque) and the tip (transparent) than is the case for plasma and serum.
- a volume > 5 uL would be acceptable if the target volume is 10 uL.
- Blood can easily be detected and its volume measured by creating a pixel map of the tip and counting the dark pixels then comparing with a previously established number for the target volume. Even though sample types serum and plasma (and other aqueous non-blood samples) are transparent, the imaging system can still detect the presence of sample due to the change in refraction that occurs over the sample meniscus and the difference in refractive index between the tip material and the sample. Alternatively a dye may be added to the sample by providing a dried dye formulation coated within the capillary which is dissolved by the sample
- sample acquisition and delivery in assay devices depends on the liquid handling techniques used.
- Automated devices may use (1) pneumatic aspiration and ejection (as in many laboratory single and multi-channel pipetting devices that use disposable tips; pneumatic methods may use positive or negative pressure (vacuum)), (2) positive displacement (as in a syringe), ink jet-like technology and the like.
- Samples and other liquids such as reagents can be (3) drawn out of reservoirs by capillary action or (4) wicking into porous media.
- Liquids samples and/or reagents
- the sample tip can be dipped into the diluent or displaced into air so as to drop into a dry well or a well containing diluent.
- the performance of all of the above systems and methods may be verified and/or measured using the invention.
- the capillary can be imaged by a user outside the instrument with an external camera. Volume measurements can be scaled to the size of the capillary. Such an externally oriented camera can be used for recognition of the user/patient so that results can more reliably be attributed to the correct patient. The method may also be used to verify appropriate medication is being used (image the pill container or pill or alternatively the bar code reader in the instrument may be used for this purpose).
- the invention may also be used to measure location and volumes of reagent aspirated into assay tips.
- dyes may be added to reagents to make them more easily imaged (improved contrast).
- the invention can be used to verify the effectiveness of red cell removal and the available volume of plasma.
- An alternative to moving the sample containing tip is to move the camera
- Such a system can have the following advantages:
- Figure 18 shows diagrams of tips used to aspirate samples and reagents (dimensions in mm).
- Example 6 Geometry measurements of a cylindrical capillary
- Figure 19 shows dimensions of a cylindrical capillary containing a sample.
- LI distance from lower end of cylinder to lower sample meniscus
- L2 distance from lower end of to lower upper meniscus
- Example 7 Geometry measurements of a conical capillary
- Figure 20 and Figure 21 shows dimensions of a conical capillary.
- Rb radius at base of cone
- Lj distance from (projected) top of the cone to lower sample meniscus
- L 2 distance from (projected) top of the cone to lower upper meniscus
- liquids in capillaries typically have a curved meniscus. Depending on the contact angle the meniscus may be curved inward or outward relative to the liquid. When no net external pressure is applied, if the capillary surface is hydrophilic (contact angle ⁇ nil) the meniscus is inward directed or outward directed if the surface is hydrophobic (contact angle > nil). When net pressure is applied to the liquid column (capillary oriented vertically or pneumatic pressure applied by the instrument) the lower meniscus can project below the lower end of the capillary. In small diameter capillaries, surface tension forces are strong relative to the small gravitational force across a meniscus.
- L2 distance to the top of the lower meniscus
- L3 distance to the bottom of the upper meniscus
- L4 distance to the top of the upper meniscus
- Total volume TT*((R 2 )*L 3 + (L 4 - L 3 )*(3 *(R) 2 + (L 4 - L 3 ) 2 )/6)
- Case 2 Both menisci are within the capillary and curved (as shown in Figure 24)
- Total volume TT*((R 2 )*L 3 - (L 2 - Lj)*(3*(R) 2 + (L 2 - Lj) 2 )/6 + (L 4 - L 3 )*(3 *(R) 2 + (L 4 - L 3 ) 2 )/6
- Case 3 There are two curved menisci. The lower being curved and below the lower end of the capillary (as shown in Figure 25)
- Total volume TT*((R 2 )*L 3 + (Lj)*(3 *(R) 2 + (L 1 ⁇ 2 )/6 + ( L 4 - L 3 )*(3*(R) 2 + (L 4 - L 3 ) 2 )/6)
- Case 1 Pendant blood or reagents outside a vertical capillary can cause major problems in assays since it represents an out-of-control situation. As shown in Figure 28, imaging can easily recognize this situation.
- Residual blood outside the capillary also is problematic since it is a potential source of contamination of reagents and of extra volume. Again imaging can recognize the situation.
- Example 11 Residual blood inside the capillary once sample dispensing has occurred
- Figure 29 shows an example of a capillary with residual blood.
- FIG 30 - Figure 39 show a schematic of one preferred embodiment of red cell removal suited to POC devices of the present invention.
- Magnetizable particles have antibody to red cells mixed with free antibody to red cells are provided as a dried preparation in the well that will receive a blood sample, as shown in Figure 30.
- the red cells agglutinate with the magnetic particles and can be removed by placing the blood-containing well in proximity to a strong magnet (shown in Figure 35).
- the red cells are separated from plasma (shown in Figure 36) which can then be ejected into a receiving well for use in an assay (shown in Figure 37, Figure 38, and Figure 39). It is evident that the imaging analysis can determine how effectively the separation was effected and estimate the volume of plasma available for assay.
- Example 13 Images of liquid samples in capillaries
- Figure 40 shows a high contrast image of a cylindrical tip containing a liquid with low absorbance.
- Figure 41 shows an image of a conical tip containing a liquid with high absorbance.
- Figure 42 shows a tip with a high absorbance liquid showing two menisci within the tip.
- Figure 43 shows a tip with a sample liquid and large bubbles that span the diameter of the tip.
- Figure 44 shows a tip containing water showing a clear upper meniscus in a transparent tip or capillary.
- Figure 41 was analyzed for the length of the liquid column (corresponding to 5 uL) and the resolution of the upper liquid meniscus (Definition of the position of the meniscus with > 90% confidence). The precision of the meniscus location corresponded to ⁇ 1% of the length of the liquid column.
Abstract
Description


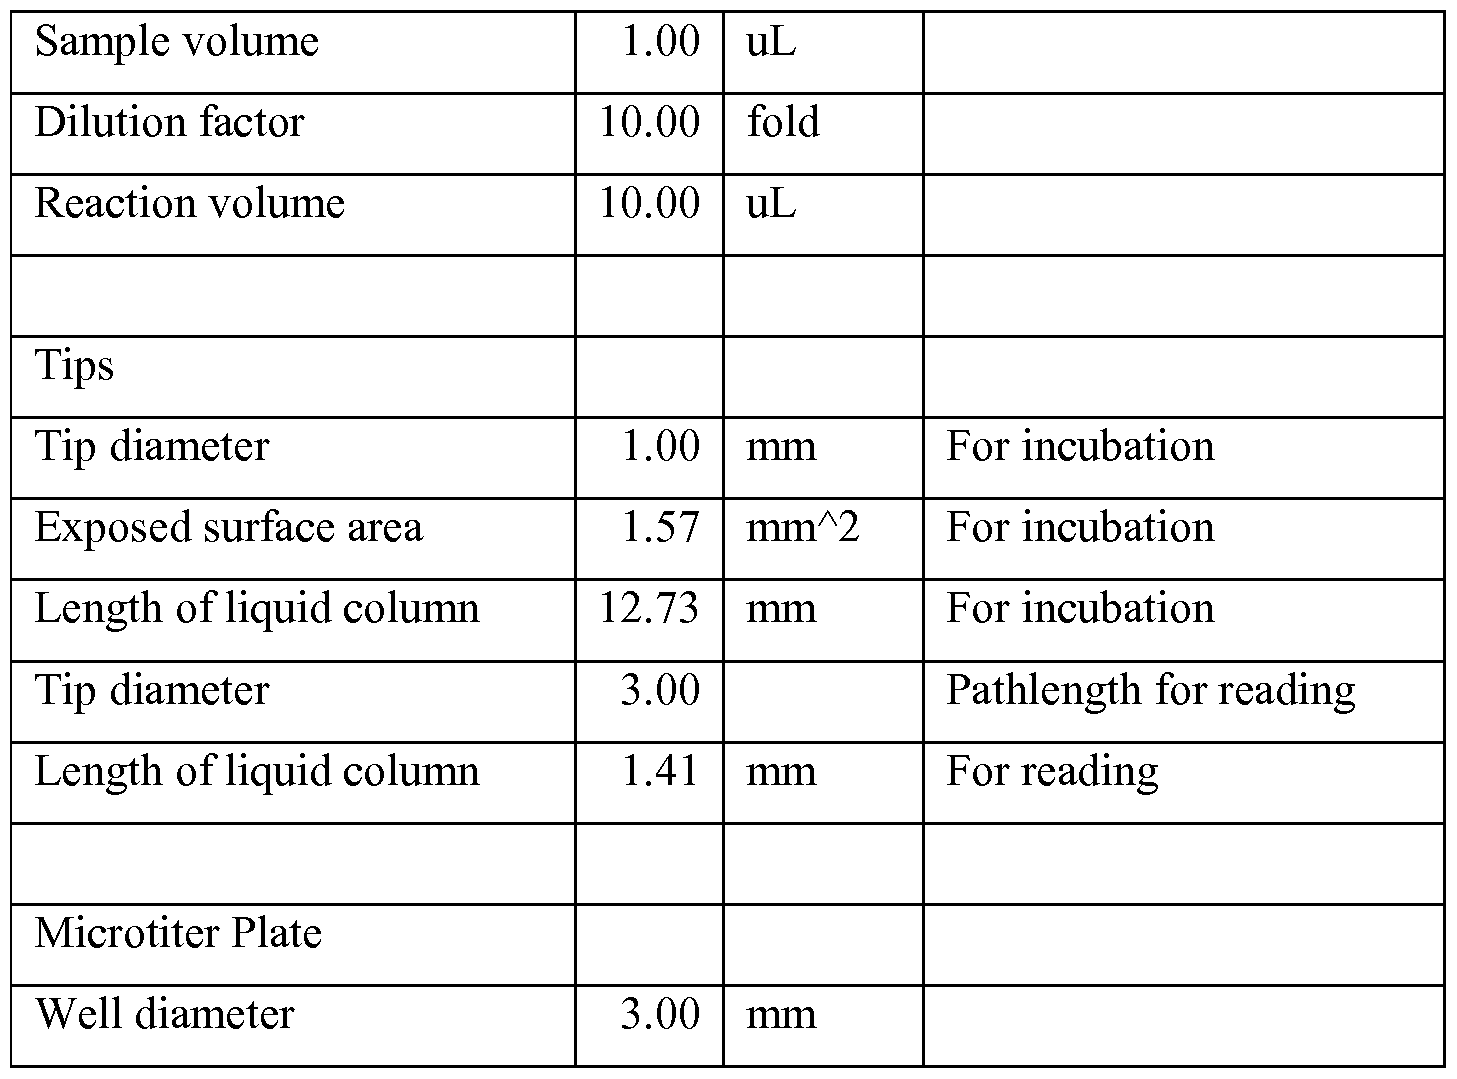


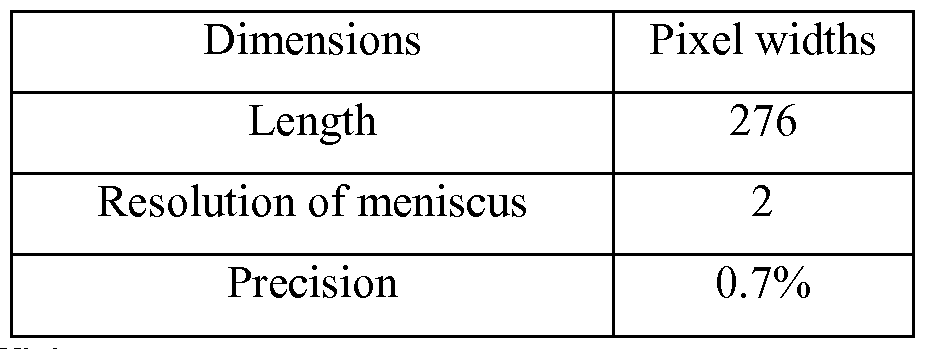


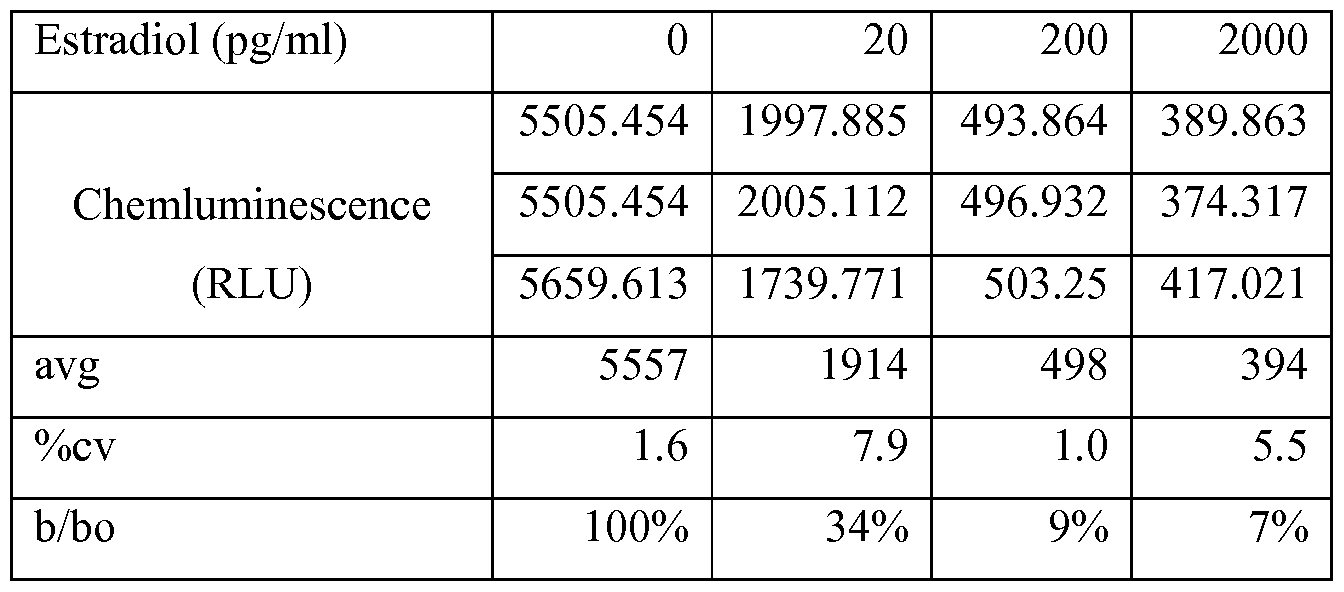


Claims
Priority Applications (16)
| Application Number | Priority Date | Filing Date | Title |
|---|---|---|---|
| CN201280014347.0A CN103477197B (en) | 2011-01-21 | 2012-01-20 | Sample uses maximized system and method |
| EP12737013.8A EP2666008B1 (en) | 2011-01-21 | 2012-01-20 | Systems and methods for sample use maximization |
| BR112013018656-9A BR112013018656B1 (en) | 2011-01-21 | 2012-01-20 | method for detecting the presence or concentration of an analyte in a sample of fluid contained in a container, and, method of measuring the concentration of analyte in a sample of fluid |
| EP21190592.2A EP4024029A3 (en) | 2011-01-21 | 2012-01-20 | Systems and methods for sample use maximization |
| NZ613457A NZ613457B2 (en) | 2011-01-21 | 2012-01-20 | Systems and methods for sample use maximization |
| RU2013137661A RU2620922C2 (en) | 2011-01-21 | 2012-01-20 | Systems and methods for optimization of sample use |
| MX2015015131A MX349288B (en) | 2011-01-21 | 2012-01-20 | Systems and methods for sample use maximization. |
| KR1020137021727A KR101909764B1 (en) | 2011-01-21 | 2012-01-20 | Systems and methods for sample use maximization |
| AU2012207090A AU2012207090B2 (en) | 2011-01-21 | 2012-01-20 | Systems and methods for sample use maximization |
| SG2013055603A SG192069A1 (en) | 2011-01-21 | 2012-01-20 | Systems and methods for sample use maximization |
| JP2013550651A JP5945282B2 (en) | 2011-01-21 | 2012-01-20 | System and method for maximizing sample usage |
| CA2825196A CA2825196C (en) | 2011-01-21 | 2012-01-20 | Systems and methods for sample use maximization |
| ES12737013T ES2895518T3 (en) | 2011-01-21 | 2012-01-20 | Systems and methods for maximizing the use of samples |
| MX2013008339A MX2013008339A (en) | 2011-01-21 | 2012-01-20 | Systems and methods for sample use maximization. |
| ZA2013/05478A ZA201305478B (en) | 2011-01-21 | 2013-07-19 | Systems and methods for sample use maximization |
| IL227579A IL227579B (en) | 2011-01-21 | 2013-07-21 | Systems and methods for sample use maximization |
Applications Claiming Priority (2)
| Application Number | Priority Date | Filing Date | Title |
|---|---|---|---|
| US201161435250P | 2011-01-21 | 2011-01-21 | |
| US61/435,250 | 2011-01-21 |
Publications (2)
| Publication Number | Publication Date |
|---|---|
| WO2012100235A2 true WO2012100235A2 (en) | 2012-07-26 |
| WO2012100235A3 WO2012100235A3 (en) | 2012-10-18 |
Family
ID=46516422
Family Applications (1)
| Application Number | Title | Priority Date | Filing Date |
|---|---|---|---|
| PCT/US2012/022130 WO2012100235A2 (en) | 2011-01-21 | 2012-01-20 | Systems and methods for sample use maximization |
Country Status (18)
| Country | Link |
|---|---|
| US (8) | US20120309636A1 (en) |
| EP (2) | EP2666008B1 (en) |
| JP (4) | JP5945282B2 (en) |
| KR (1) | KR101909764B1 (en) |
| CN (7) | CN111982829A (en) |
| AR (1) | AR085087A1 (en) |
| AU (1) | AU2012207090B2 (en) |
| BR (1) | BR112013018656B1 (en) |
| CA (2) | CA2825196C (en) |
| ES (1) | ES2895518T3 (en) |
| HK (1) | HK1232292A1 (en) |
| IL (1) | IL227579B (en) |
| MX (2) | MX2013008339A (en) |
| RU (1) | RU2620922C2 (en) |
| SG (2) | SG192069A1 (en) |
| TW (4) | TWI690594B (en) |
| WO (1) | WO2012100235A2 (en) |
| ZA (1) | ZA201305478B (en) |
Cited By (26)
| Publication number | Priority date | Publication date | Assignee | Title |
|---|---|---|---|---|
| US8840838B2 (en) | 2011-09-25 | 2014-09-23 | Theranos, Inc. | Centrifuge configurations |
| KR101504819B1 (en) * | 2013-05-03 | 2015-03-23 | 동국대학교 산학협력단 | Tube for centrifugation |
| US9012163B2 (en) | 2007-10-02 | 2015-04-21 | Theranos, Inc. | Modular point-of-care devices, systems, and uses thereof |
| US9250229B2 (en) | 2011-09-25 | 2016-02-02 | Theranos, Inc. | Systems and methods for multi-analysis |
| US9268915B2 (en) | 2011-09-25 | 2016-02-23 | Theranos, Inc. | Systems and methods for diagnosis or treatment |
| US9464981B2 (en) | 2011-01-21 | 2016-10-11 | Theranos, Inc. | Systems and methods for sample use maximization |
| EP3065797A4 (en) * | 2013-11-04 | 2016-11-09 | Siemens Healthcare Diagnostics | Methods and apparatus for determining aspiration and/or dispensing volume and/or pipette positioning |
| JP2016537009A (en) * | 2013-09-06 | 2016-12-01 | セラノス, インコーポレイテッド | System and method for detection of infectious diseases |
| US9592508B2 (en) | 2011-09-25 | 2017-03-14 | Theranos, Inc. | Systems and methods for fluid handling |
| US9619627B2 (en) | 2011-09-25 | 2017-04-11 | Theranos, Inc. | Systems and methods for collecting and transmitting assay results |
| US9632102B2 (en) | 2011-09-25 | 2017-04-25 | Theranos, Inc. | Systems and methods for multi-purpose analysis |
| US9645143B2 (en) | 2011-09-25 | 2017-05-09 | Theranos, Inc. | Systems and methods for multi-analysis |
| US9664702B2 (en) | 2011-09-25 | 2017-05-30 | Theranos, Inc. | Fluid handling apparatus and configurations |
| US10012664B2 (en) | 2011-09-25 | 2018-07-03 | Theranos Ip Company, Llc | Systems and methods for fluid and component handling |
| CN109061016A (en) * | 2018-07-25 | 2018-12-21 | 大连工业大学 | A kind of preparation method and application of the solid-phase extraction column of enriched biological amine |
| FR3067814A1 (en) * | 2017-06-20 | 2018-12-21 | Biomerieux | METHOD FOR APPLYING, ON A SOLID SUPPORT, AT LEAST ONE MOLECULAR BINDING PARTNER |
| CN109799338A (en) * | 2019-01-14 | 2019-05-24 | 湖南达道生物工程有限公司 | A kind of test paper and its application suitable for peripheral blood immunochromatography quantitative detection |
| CN110770572A (en) * | 2017-02-09 | 2020-02-07 | Essenlix公司 | Colorimetric assay |
| WO2020089399A1 (en) * | 2018-10-31 | 2020-05-07 | Foundation For Research And Technology Hellas | Method and apparatus for performing a real-time colorimetric nucleic acid amplification assay |
| US10650527B2 (en) | 2015-09-04 | 2020-05-12 | Qualigen, Inc. | Systems and methods for sample verification |
| CN113188605A (en) * | 2021-05-12 | 2021-07-30 | 郑州大学 | Physical experiment method based on smart phone |
| US11162936B2 (en) | 2011-09-13 | 2021-11-02 | Labrador Diagnostics Llc | Systems and methods for multi-analysis |
| US11263433B2 (en) | 2016-10-28 | 2022-03-01 | Beckman Coulter, Inc. | Substance preparation evaluation system |
| EP4054406A4 (en) * | 2019-11-05 | 2022-12-28 | Siemens Healthcare Diagnostics, Inc. | Systems, apparatus, and methods of analyzing specimens |
| EP4166233A1 (en) * | 2021-10-12 | 2023-04-19 | Holosensor Medical Technology Ltd. | Hand-held lamp detector and system |
| RU2805195C2 (en) * | 2018-10-31 | 2023-10-12 | Байопикс Дна Текнолоджи П.К. | Method and device for implementing colorimetric amplification analysis of nucleic acids in real time |
Families Citing this family (163)
| Publication number | Priority date | Publication date | Assignee | Title |
|---|---|---|---|---|
| WO2008041900A1 (en) * | 2006-10-06 | 2008-04-10 | Boule Medical Ab | Device for extraction of a partial defined sample volume from a lager volume, method for operating the device, set of at least two devices, method of operation the set, an analytical instrument connectable to the device, method for operating the instrument, a system, and a method for operating the system |
| US8493441B2 (en) * | 2009-09-11 | 2013-07-23 | Thonhauser Gmbh | Absorbance measurements using portable electronic devices with built-in camera |
| US9047663B2 (en) | 2011-07-09 | 2015-06-02 | Gauss Surgical | Method for triggering blood salvage |
| US9870625B2 (en) | 2011-07-09 | 2018-01-16 | Gauss Surgical, Inc. | Method for estimating a quantity of a blood component in a fluid receiver and corresponding error |
| US8897523B2 (en) | 2011-07-09 | 2014-11-25 | Gauss Surgical | System and method for counting surgical samples |
| US10426356B2 (en) | 2011-07-09 | 2019-10-01 | Gauss Surgical, Inc. | Method for estimating a quantity of a blood component in a fluid receiver and corresponding error |
| US9646375B2 (en) | 2011-07-09 | 2017-05-09 | Gauss Surgical, Inc. | Method for setting a blood transfusion parameter |
| CN104662559B (en) | 2012-05-14 | 2019-02-05 | 高斯外科公司 | System and method for estimating the amount of the blood constituent in liquid tank |
| WO2013173356A1 (en) | 2012-05-14 | 2013-11-21 | Gauss Surgical | System and methods for managing blood loss of a patient |
| US9506935B2 (en) * | 2012-06-01 | 2016-11-29 | Commissariat à l'énergie atomique et aux énergies alternatives | Method and system for estimating the quantity of an analyte contained in a liquid |
| FR2991457B1 (en) * | 2012-06-01 | 2014-07-18 | Commissariat Energie Atomique | METHOD AND SYSTEM FOR CHARACTERIZING THE SPEED OF DISPLACEMENT OF PARTICLES CONTAINED IN A LIQUID, SUCH AS BLOOD PARTICULATES |
| EP2874754B1 (en) | 2012-07-18 | 2023-01-18 | Labrador Diagnostics LLC | High speed, compact centrifuge for use with small sample volumes |
| US8984932B2 (en) | 2012-07-18 | 2015-03-24 | Theranos, Inc. | Rapid measurement of formed blood component sedimentation rate from small sample volumes |
| JP6336697B2 (en) | 2012-07-18 | 2018-06-06 | セラノス アイピー カンパニー エルエルシー | Rapid measurement of blood component sedimentation rates formed from small sample volumes |
| US9389229B2 (en) * | 2012-07-18 | 2016-07-12 | Theranos, Inc. | Methods for detecting and measuring aggregation |
| US9500639B2 (en) | 2012-07-18 | 2016-11-22 | Theranos, Inc. | Low-volume coagulation assay |
| CA2878957A1 (en) | 2012-07-25 | 2014-01-30 | Theranos, Inc. | Image analysis and measurement of biological samples |
| US9862920B2 (en) | 2012-12-11 | 2018-01-09 | Pocared Diagnostics Ltd. | Optics cup with curved bottom |
| US10401373B1 (en) | 2013-02-18 | 2019-09-03 | Theranos Ip Company, Llc | Systems and methods for analyte testing and laboratory oversight |
| US11008628B1 (en) | 2013-02-18 | 2021-05-18 | Labrador Diagnostics Llc | Systems and methods for analyte testing and laboratory oversight |
| AU2014225907A1 (en) | 2013-03-04 | 2015-09-17 | Theranos Ip Company, Llc | Network connectivity methods and systems |
| WO2014160125A1 (en) * | 2013-03-14 | 2014-10-02 | Centricycle, Inc. | Centrifuge device |
| WO2014186874A1 (en) | 2013-05-23 | 2014-11-27 | Yyz Pharmatech, Inc. | Methods and compositions for enzyme linked immuno and hybridization mass spectrometric assay |
| US10422806B1 (en) | 2013-07-25 | 2019-09-24 | Theranos Ip Company, Llc | Methods for improving assays of biological samples |
| SG11201601608TA (en) | 2013-09-06 | 2016-04-28 | Theranos Inc | Devices, systems, methods and kits for receiving a swab |
| US11545241B1 (en) * | 2013-09-07 | 2023-01-03 | Labrador Diagnostics Llc | Systems and methods for analyte testing and data management |
| US11360107B1 (en) * | 2014-02-25 | 2022-06-14 | Labrador Diagnostics Llc | Systems and methods for sample handling |
| US9959477B2 (en) * | 2014-03-03 | 2018-05-01 | The Board Of Trustees Of The Leland Stanford Junior University | Mapping of blood vessels for biometric authentication |
| US10338004B2 (en) * | 2014-03-27 | 2019-07-02 | KLA—Tencor Corp. | Production sample shaping that preserves re-normalizability |
| CN104289259A (en) * | 2014-03-29 | 2015-01-21 | 浙江清华长三角研究院萧山生物工程中心 | Pipet calibration method based on machine vision |
| WO2015160997A1 (en) | 2014-04-15 | 2015-10-22 | Gauss Surgical, Inc. | Method for estimating a quantity of a blood component in a fluid canister |
| EP3132253B1 (en) | 2014-04-15 | 2019-02-13 | Gauss Surgical, Inc. | Method for estimating a quantity of a blood component in a fluid canister |
| US10226566B2 (en) * | 2014-04-23 | 2019-03-12 | Genadyne Biotechnologies, Inc. | System and process for removing bodily fluids from a body opening |
| JP6637962B2 (en) | 2014-04-24 | 2020-01-29 | ルシラ ヘルス インコーポレイテッド | Colorimetric detection method for nucleic acid amplification |
| WO2015187881A1 (en) | 2014-06-03 | 2015-12-10 | The Regents Of The University Of California | Nanoparticle analyzer |
| EP3175022B1 (en) | 2014-07-28 | 2020-09-16 | Sanofi Pasteur VaxDesign Corporation | Automated imaging and analysis of the hemagglutination inhibition assay (hai) |
| US9547899B1 (en) * | 2014-10-07 | 2017-01-17 | University Of South Florida | Mobile hemolysis detection in whole blood samples |
| US9976881B2 (en) * | 2014-12-04 | 2018-05-22 | Cnh Industrial Canada, Ltd. | System and method for analyzing product flow signal for an agricultural implement |
| US10152519B2 (en) * | 2015-03-05 | 2018-12-11 | Bio-Rad Laboratories, Inc. | Optimized spectral matching and display |
| US10279352B2 (en) * | 2015-03-18 | 2019-05-07 | Optolane Technologies Inc. | PCR module, PCR system having the same, and method of inspecting using the same |
| CN107250789A (en) * | 2015-04-29 | 2017-10-13 | 伊克斯塞拉公司 | Method and apparatus for quantitative blood sample |
| US20160335765A1 (en) * | 2015-05-12 | 2016-11-17 | Justus W. Harris | Three dimensional modeling of health data |
| US10555675B2 (en) | 2015-05-15 | 2020-02-11 | Gauss Surgical, Inc. | Method for projecting blood loss of a patient during a surgery |
| WO2016187072A1 (en) | 2015-05-15 | 2016-11-24 | Gauss Surgical, Inc. | Methods and systems for characterizing fluids from a patient |
| WO2016187071A1 (en) | 2015-05-15 | 2016-11-24 | Gauss Surgical, Inc. | Systems and methods for assessing fluids from a patient |
| CN106248434A (en) * | 2015-05-19 | 2016-12-21 | 亚诺法生技股份有限公司 | Liquid acquisition device and the method making liquid acquisition device |
| US9774838B2 (en) * | 2015-06-12 | 2017-09-26 | Accuray Incorporated | Ambient light suppression using color space information to derive pixel-wise attenuation factors |
| EP3136106A1 (en) * | 2015-08-28 | 2017-03-01 | Siemens Healthcare Diagnostics Products GmbH | Photometric analysis of a sample liquid |
| JP6887599B2 (en) * | 2015-10-14 | 2021-06-16 | ホリバ インスツルメンツ インコーポレイテッドHoriba Instruments Incorporated | Equipment and methods for measuring growth or degradation kinetics of colloidal particles |
| US10012580B2 (en) * | 2015-10-14 | 2018-07-03 | MANTA Instruments, Inc. | Apparatus and method for measurements of growth or dissolution kinetics of colloidal particles |
| CN106885910B (en) * | 2015-12-15 | 2018-12-21 | 上海吉涛生物科技有限公司 | Tumor susceptibility microenvironment detection device and kit |
| JP6934253B2 (en) | 2015-12-23 | 2021-09-15 | ガウス サージカル, インコーポレイテッドGauss Surgical, Inc. | How to assess the amount of blood components in a surgical fabric |
| WO2017112913A1 (en) | 2015-12-23 | 2017-06-29 | Gauss Surgical, Inc. | System and method for estimating an amount of a blood component in a volume of fluid |
| US10311569B1 (en) * | 2015-12-31 | 2019-06-04 | Cerner Innovation, Inc. | Identifying liquid blood components from sensed data to monitor specimen integrity |
| US10267813B1 (en) * | 2015-12-31 | 2019-04-23 | Cerner Innovation, Inc. | Monitoring specimen integrity in automated blood sample processing system |
| US10209267B1 (en) | 2015-12-31 | 2019-02-19 | Cerner Innovation, Inc. | Sample extraction and rotation device for automated blood sample processing systems |
| US10527635B1 (en) | 2015-12-31 | 2020-01-07 | Cerner Innovation, Inc. | Specimen integrity monitoring device for automated blood sample processing systems |
| US10746665B2 (en) * | 2016-01-28 | 2020-08-18 | Siemens Healthcare Diagnostics Inc. | Methods and apparatus for classifying an artifact in a specimen |
| US10816538B2 (en) * | 2016-01-28 | 2020-10-27 | Siemens Healthcare Diagnostics Inc. | Methods and apparatus for detecting an interferent in a specimen |
| JP6870826B2 (en) * | 2016-01-28 | 2021-05-12 | シーメンス・ヘルスケア・ダイアグノスティックス・インコーポレーテッドSiemens Healthcare Diagnostics Inc. | Methods and devices configured to quantify samples from lateral multi-viewpoints |
| US10746753B2 (en) | 2016-01-28 | 2020-08-18 | Siemens Healthcare Diagnostics Inc. | Methods and apparatus for multi-view characterization |
| FR3048505A1 (en) * | 2016-03-04 | 2017-09-08 | Novacyt | COUNTING CELLS PHOTOGRAPHS |
| CA3015378C (en) | 2016-03-14 | 2023-09-26 | Diassess Inc. | Selectively vented biological assay devices and associated methods |
| EP3430372A4 (en) | 2016-03-14 | 2019-10-16 | Lucira Health, Inc. | Devices and methods for biological assay sample preparation and delivery |
| CA3015368A1 (en) | 2016-03-14 | 2017-09-21 | Diassess Inc. | Systems and methods for performing biological assays |
| US10318845B2 (en) * | 2016-04-14 | 2019-06-11 | Research International, Inc. | Coupon reader |
| TWI569861B (en) * | 2016-04-22 | 2017-02-11 | 國立高雄大學 | Blood absorbent isolation material, blood filter device and operation method thereof |
| CN107403220A (en) * | 2016-04-28 | 2017-11-28 | 明达医学科技股份有限公司 | Optical measurement device and its operation method |
| JP6937325B2 (en) * | 2016-05-27 | 2021-09-22 | ビオメリュー・インコーポレイテッド | Methods and equipment for detecting bubbles in specimen containers |
| US10809275B2 (en) * | 2016-06-24 | 2020-10-20 | Kobra Biosolutions, Llc | Verification pipette and vision apparatus |
| US10132958B2 (en) * | 2016-07-14 | 2018-11-20 | Schlumberger Technology Corporation | Determining an optical density linear dynamic range for an optical spectrometer |
| US10989724B1 (en) | 2016-07-29 | 2021-04-27 | Labrador Diagnostics Llc | Systems and methods for multi-analysis |
| JP6860016B2 (en) * | 2016-09-12 | 2021-04-14 | ソニー株式会社 | Fine particle measuring device and fine particle measuring method |
| US10345218B2 (en) * | 2016-12-06 | 2019-07-09 | Abbott Laboratories | Automated slide assessments and tracking in digital microscopy |
| JP7268879B2 (en) | 2017-01-02 | 2023-05-08 | ガウス サージカル,インコーポレイテッド | Tracking Surgical Items Predicting Duplicate Imaging |
| AU2018207099B2 (en) | 2017-01-11 | 2021-05-13 | Cypher Medical, Llc | Method of estimating blood volume |
| US11439310B2 (en) | 2017-01-11 | 2022-09-13 | Cypher Medical, Llc | Method of estimating blood volume |
| US11229368B2 (en) | 2017-01-13 | 2022-01-25 | Gauss Surgical, Inc. | Fluid loss estimation based on weight of medical items |
| US10551320B2 (en) * | 2017-01-30 | 2020-02-04 | Kla-Tencor Corporation | Activation of wafer particle defects for spectroscopic composition analysis |
| US10471425B2 (en) | 2017-02-16 | 2019-11-12 | International Business Machines Corporation | Automated machine for sorting of biological fluids |
| CN110402383B (en) | 2017-03-08 | 2023-01-17 | 奥普图弗卢迪克生物鉴定有限责任公司 | Optical flow control diagnosis system |
| EP3381560A1 (en) | 2017-03-28 | 2018-10-03 | Eppendorf AG | Method and a dosing device for contact dosing of liquids |
| US11080848B2 (en) | 2017-04-06 | 2021-08-03 | Lucira Health, Inc. | Image-based disease diagnostics using a mobile device |
| US10146909B2 (en) * | 2017-04-06 | 2018-12-04 | Diassess Inc. | Image-based disease diagnostics using a mobile device |
| CN110573859B (en) * | 2017-04-13 | 2022-07-26 | 美国西门子医学诊断股份有限公司 | Method and apparatus for HILN characterization using convolutional neural networks |
| CN106932362A (en) * | 2017-04-26 | 2017-07-07 | 上海健康医学院 | A kind of serum urea nitrogen creatinine content near infrared ray method |
| CN106908411A (en) * | 2017-04-26 | 2017-06-30 | 上海健康医学院 | A kind of urea in serum nitrogen content near infrared ray method |
| US11559817B2 (en) | 2017-05-17 | 2023-01-24 | University Of Cincinnati | Using electrokinetic forces to manipulate suspended particles |
| WO2019023376A1 (en) | 2017-07-28 | 2019-01-31 | Siemens Healthcare Diagnostics Inc. | Deep learning volume quantifying methods and apparatus |
| US11207036B2 (en) * | 2017-08-16 | 2021-12-28 | KUB Technologies, Inc. | System and method for cabinet x-ray systems with automatic specimen/sample alert |
| US10549275B2 (en) | 2017-09-14 | 2020-02-04 | Lucira Health, Inc. | Multiplexed biological assay device with electronic readout |
| US11199449B1 (en) * | 2017-09-26 | 2021-12-14 | The United States Of America, As Represented By The Secretary Of The Navy | Automated noncontact method to discriminate whether cooling or heating is occurring |
| JP6519624B2 (en) * | 2017-10-04 | 2019-05-29 | ウシオ電機株式会社 | Management system |
| CA2981726C (en) * | 2017-10-06 | 2018-12-04 | Synaptive Medical (Barbados) Inc. | Surgical optical zoom system |
| WO2019094950A1 (en) * | 2017-11-13 | 2019-05-16 | Cornell University | A multiplexed diagnostic assay for iron and vitamin a deficiency and methods of use thereof |
| EP3710598A1 (en) * | 2017-11-13 | 2020-09-23 | Ricoh Company, Ltd. | Device with specific number of cell(s) and nucleic acids in the wells and testing/calibration method using the device |
| CN107832967B (en) * | 2017-11-23 | 2021-09-14 | 福建农林大学 | Sound scene coordination degree dynamic evaluation method suitable for bamboo forest space |
| EP3737947B1 (en) * | 2018-01-09 | 2024-04-17 | IDEXX Laboratories, Inc. | Methods for measuring analyte and/or protein in biological samples |
| KR102443804B1 (en) * | 2018-01-11 | 2022-09-19 | 도요보 가부시키가이샤 | Measurement sample dilutions, kits and measurement methods |
| US11358148B2 (en) | 2018-03-30 | 2022-06-14 | Idexx Laboratories, Inc. | Point-of-care diagnostic systems and containers for same |
| US11541396B2 (en) | 2018-03-30 | 2023-01-03 | Idexx Laboratories, Inc. | Point-of-care diagnostic systems and containers for same |
| MX2020009199A (en) | 2018-03-30 | 2021-01-20 | Idexx Lab Inc | Quality control for point-of-care diagnostic systems. |
| KR102577993B1 (en) * | 2018-04-06 | 2023-09-18 | 프리시젼바이오 주식회사 | Fluid test cartiridge, fluid test apparatus including the same and method for contotolling thereof |
| JP2019191167A (en) * | 2018-04-23 | 2019-10-31 | ブルカー ジェイヴィ イスラエル リミテッドBruker Jv Israel Ltd. | X ray source optical system for small-angle x-ray scatterometry |
| US11712549B2 (en) | 2018-06-28 | 2023-08-01 | Kinneret Rand | Anti-clogging and anti-adhesive micro-capillary needle with enhanced tip visibility |
| JP7376587B2 (en) * | 2018-07-09 | 2023-11-08 | サンドストーン ダイアグノスティックス インコーポレイテッド | Apparatus and methods for plasma separation and storage |
| WO2020017409A1 (en) * | 2018-07-17 | 2020-01-23 | 国立大学法人神戸大学 | Stirring device and preprocessing device |
| WO2020019001A1 (en) | 2018-07-20 | 2020-01-23 | Cornell University | Magnetic separation of biological entities from fluid sample |
| US11703464B2 (en) | 2018-07-28 | 2023-07-18 | Bruker Technologies Ltd. | Small-angle x-ray scatterometry |
| WO2020033194A1 (en) * | 2018-08-06 | 2020-02-13 | Siemens Healthcare Diagnostics Inc. | Method, device and system for determining the concentration of analytes in a sample |
| EP3614151B1 (en) * | 2018-08-20 | 2023-07-19 | F. Hoffmann-La Roche AG | Method of operating a laboratory instrument |
| US11406981B2 (en) | 2018-08-22 | 2022-08-09 | Biomerieux, Inc. | Detection instruments with automated cell location selection for newly intaken specimen containers and related methods |
| CN109211624B (en) * | 2018-09-10 | 2023-11-28 | 佛山科学技术学院 | Waterproof ammonia volatilizees collection system |
| TWI668425B (en) * | 2018-11-05 | 2019-08-11 | 林瑞陽 | The particles identification counting method and analysis device |
| US11386551B2 (en) * | 2018-11-08 | 2022-07-12 | Perkinelmer Health Sciences, Inc. | Method and apparatus for buffy coat imaging |
| USD910200S1 (en) | 2018-12-21 | 2021-02-09 | Lucira Health, Inc. | Test tube |
| CN111374714B (en) * | 2018-12-29 | 2021-10-08 | 重庆西山科技股份有限公司 | Method for selecting chamber of sample holder and biopsy device |
| EP3908827A4 (en) * | 2019-01-07 | 2022-08-03 | 1866402 Ontario Limited | Blood separation and analysis device and methods |
| US20220099692A1 (en) * | 2019-01-16 | 2022-03-31 | Yantai Ausbio Laboratories Co., Ltd. | Automated liquid handling system and method for depositing biological samples for microscopic examination |
| JP6817549B2 (en) * | 2019-03-06 | 2021-01-20 | ウシオ電機株式会社 | Management system |
| US20200289738A1 (en) * | 2019-03-11 | 2020-09-17 | ABC Med Tech Corp. | Centrifuge and method of use |
| JP7164927B2 (en) * | 2019-03-19 | 2022-11-02 | 株式会社日立製作所 | Digital PCR measuring device |
| TWI696496B (en) * | 2019-05-03 | 2020-06-21 | 國立臺灣大學 | Manual centrifugal separation apparatus and system comprising thereof and method for separating blood |
| EP3751289A1 (en) * | 2019-06-13 | 2020-12-16 | Siemens Healthcare Diagnostics Products GmbH | Device for optically monitoring a dosing of a liquid to be pipetted |
| EP3757547B1 (en) * | 2019-06-28 | 2022-11-23 | ABB Schweiz AG | Turbidity calibration-correction apparatus and method for an automated calibration correction |
| DE102019118171A1 (en) * | 2019-07-04 | 2021-01-07 | Endress+Hauser Conducta Gmbh+Co. Kg | Method of operating an automatic analyzer and an automatic analyzer |
| US11668723B2 (en) | 2019-07-09 | 2023-06-06 | Logan Instruments Corporation | Automated dissolution/permeation testing system |
| US11573179B2 (en) * | 2019-08-22 | 2023-02-07 | Applikate Technologies Llc | Tissue processing |
| US11327084B2 (en) * | 2019-09-19 | 2022-05-10 | Invidx Corp. | Joint hematology and biochemistry point-of-care testing system |
| JP2023502568A (en) * | 2019-10-17 | 2023-01-25 | ノヴァ バイオメディカル コーポレイション | Coagulation assay device and method |
| CN110672525B (en) * | 2019-10-23 | 2022-03-11 | 成都信息工程大学 | Solution concentration measuring device and method and solution sensing sensitivity measuring method |
| WO2021086718A1 (en) * | 2019-10-31 | 2021-05-06 | Siemens Healthcare Diagnostics Inc. | Methods and apparatus providing calibration of background illumination for sample and/or sample container characterization |
| CN110929282A (en) * | 2019-12-05 | 2020-03-27 | 武汉深佰生物科技有限公司 | Protein interaction-based biological characteristic information early warning method |
| FR3104772B1 (en) * | 2019-12-13 | 2023-04-21 | Idemia Identity & Security France | Document analysis terminal and document analysis method |
| CN110879159B (en) * | 2019-12-27 | 2022-11-15 | 长安大学 | High-temperature high-humidity aerosol sampling device and sampling method |
| CN111147775B (en) * | 2020-01-03 | 2022-07-08 | 中国电子科技集团公司第四十四研究所 | Single-chip mixed type CCD structure |
| CN111089953A (en) * | 2020-01-22 | 2020-05-01 | 马新国 | Urine detection device |
| US11520775B2 (en) * | 2020-01-24 | 2022-12-06 | Sartorius Bioanalytical Instruments, Inc. | Adaptive data sub-sampling and computation |
| USD953561S1 (en) | 2020-05-05 | 2022-05-31 | Lucira Health, Inc. | Diagnostic device with LED display |
| CN111521591B (en) * | 2020-05-09 | 2021-04-16 | 艾普拜生物科技(苏州)有限公司 | Counting calibration device for droplet type digital PCR instrument, preparation method and use method |
| WO2021231504A1 (en) * | 2020-05-12 | 2021-11-18 | Rpi Consulting Llc | Systems and methods for isolating and testing blood for biomarkers and genetic material |
| CN111624350A (en) * | 2020-05-25 | 2020-09-04 | 迪瑞医疗科技股份有限公司 | Soluble transferrin receptor chemiluminescence immunoassay kit and preparation method thereof |
| USD962470S1 (en) | 2020-06-03 | 2022-08-30 | Lucira Health, Inc. | Assay device with LCD display |
| US20220020455A1 (en) * | 2020-07-14 | 2022-01-20 | Talis Biomedical Corporation | Point-of-care diagnostic instrument workflow |
| CN112229754B (en) * | 2020-09-29 | 2022-01-28 | 西南石油大学 | Method for calculating adsorption capacity of methane in shale by iterative average method |
| US20230408534A1 (en) * | 2020-10-08 | 2023-12-21 | Essenlix Corporation | Assay Error Reduction |
| EP3995808B1 (en) * | 2020-11-09 | 2023-01-04 | Siltronic AG | Method for classifying unknown particles on a surface of a semiconductor wafer |
| CN112558115B (en) * | 2020-11-30 | 2023-10-10 | 中航机载系统共性技术有限公司 | Satellite RAIM monitoring method based on adaptive BFO-PSO improved particle filtering |
| CA3205123A1 (en) * | 2020-12-15 | 2022-06-23 | Quantum-Si Incorporated | Systems and methods for chip regeneration |
| CN112924421A (en) * | 2021-01-28 | 2021-06-08 | 重庆邮电大学 | Resonance light scattering detection analysis method and detection device of nucleic acid aptamer sensor |
| CN113252852B (en) * | 2021-06-04 | 2021-10-22 | 金科环境股份有限公司 | Flocculant performance evaluation and inspection equipment and method |
| CN113462518A (en) * | 2021-07-06 | 2021-10-01 | 中国人民解放军军事科学院军事医学研究院 | Method for extracting trace amount of fresh peripheral blood nucleated cell protein and special device thereof |
| WO2023288323A2 (en) * | 2021-07-15 | 2023-01-19 | Techcyte, Inc. | Image analysis for classifying hemagglutination and quantifying presence of antibodies |
| US11781999B2 (en) | 2021-09-05 | 2023-10-10 | Bruker Technologies Ltd. | Spot-size control in reflection-based and scatterometry-based X-ray metrology systems |
| WO2023042143A1 (en) * | 2021-09-16 | 2023-03-23 | Thermo Fisher Scientific S.P.A. | Process for analyzing of a liquid sample with bubble detection |
| WO2023053528A1 (en) * | 2021-09-28 | 2023-04-06 | 株式会社島津製作所 | Scanning probe microscope, information processing method, and program |
| CN114279991B (en) * | 2021-12-30 | 2023-05-12 | 宜宾五粮液股份有限公司 | White spirit brand identification method |
| USD1014780S1 (en) | 2022-04-15 | 2024-02-13 | Instrumentation Laboratory Co. | Cuvette |
| WO2023210384A1 (en) * | 2022-04-28 | 2023-11-02 | 富士フイルム株式会社 | Testing device |
| EP4290216A1 (en) * | 2022-06-09 | 2023-12-13 | Usense | Multi-analysis device and method |
| CN115317415B (en) * | 2022-07-07 | 2023-07-07 | 广州巴宝莉化妆品有限公司 | Preparation method of compound of plant fresh flower extract |
| WO2024020240A1 (en) * | 2022-07-22 | 2024-01-25 | Spaero Inc. | System and method for determining dispensing volume for a liquid handler |
| CN117232909B (en) * | 2023-11-15 | 2024-01-12 | 德州市红拳医疗器械有限公司 | Urine test sampling device |
Citations (6)
| Publication number | Priority date | Publication date | Assignee | Title |
|---|---|---|---|---|
| US5270163A (en) | 1990-06-11 | 1993-12-14 | University Research Corporation | Methods for identifying nucleic acid ligands |
| US5475096A (en) | 1990-06-11 | 1995-12-12 | University Research Corporation | Nucleic acid ligands |
| US20050176940A1 (en) | 2001-06-29 | 2005-08-11 | Unisearch Limited | Aptamers and antiaptamers |
| US20080179301A1 (en) | 2006-08-25 | 2008-07-31 | Guy Garty | Systems and methods for etching materials |
| US20090088336A1 (en) | 2007-10-02 | 2009-04-02 | Tammy Burd | Modular point-of-care devices, systems, and uses thereof |
| US20100240544A1 (en) | 2006-09-29 | 2010-09-23 | Liu David J | Aptamer biochip for multiplexed detection of biomolecules |
Family Cites Families (804)
| Publication number | Priority date | Publication date | Assignee | Title |
|---|---|---|---|---|
| US2398234A (en) | 1942-12-11 | 1946-04-09 | Horton & Converse | Adjustable automatic pipette |
| US3640434A (en) | 1970-05-15 | 1972-02-08 | Sherwood Medical Ind Inc | Variable capacity fluid-dispensing device |
| US3696971A (en) | 1970-09-24 | 1972-10-10 | Electro Nucleonics | Mechanism for simultaneously metering and dispensing liquids |
| US3756920A (en) | 1971-04-30 | 1973-09-04 | Nasa | In biological samples my measuring light reactions automatic instrument for chemical processing to dedect microorganisms |
| GB1332207A (en) | 1971-05-07 | 1973-10-03 | Ass Elect Ind | Apparatus for charged particle spectroscopy |
| BE793544A (en) * | 1972-01-31 | 1973-04-16 | American Hospital Supply Corp | CENTRIFUGE |
| CA972183A (en) | 1973-02-23 | 1975-08-05 | Georges Revillet | Microspectrophotometer |
| US3953172A (en) * | 1974-05-10 | 1976-04-27 | Union Carbide Corporation | Method and apparatus for assaying liquid materials |
| NL179870C (en) | 1974-08-16 | 1986-12-01 | Sarstedt Kunststoff | BARREL FOR TAKING BLOOD WITH A CAPILLARY MOUTH. |
| US4010893A (en) | 1975-06-20 | 1977-03-08 | Becton, Dickinson And Company | Triac centrifuge |
| GB1562900A (en) * | 1975-09-24 | 1980-03-19 | Aes Scient Ltd | Preparation of blood plasma and serum samples |
| US4157781A (en) | 1978-07-19 | 1979-06-12 | Hitoshi Maruyama | Self balancing centrifuge |
| US4276383A (en) | 1979-08-02 | 1981-06-30 | The United States Of America As Represented By The Department Of Health, Education & Welfare | Clot lysing timer |
| US4270921A (en) | 1979-09-24 | 1981-06-02 | Graas Joseph E | Microchromatographic device and method for rapid determination of a desired substance |
| US4250830A (en) | 1979-10-03 | 1981-02-17 | Leif Robert C | Swinging buckets |
| US4276258A (en) | 1980-01-28 | 1981-06-30 | Coulter Electronics, Inc. | Sample and stat feeding system and sample tray |
| US4362698A (en) | 1980-03-07 | 1982-12-07 | Sherman-Boosalis Corporation | Closures for fluid sample cups |
| US4327595A (en) | 1980-07-07 | 1982-05-04 | Hamilton Company | Method and apparatus for simultaneous dilution and dispensation |
| US4344563A (en) * | 1980-12-23 | 1982-08-17 | E. I. Du Pont De Nemours And Company | Centrifuge rotor having vertically offset trunnion pins |
| FR2498331A1 (en) | 1981-01-20 | 1982-07-23 | Kadouche Jean | Container for immunological tests e.g. antigen identification - having reagent molecules, e.g. antibodies, fixed to inner face of pipette cone point |
| US4488814A (en) | 1981-09-28 | 1984-12-18 | Miles Laboratories, Inc. | Apparatus for and method of optical absorbance and fluorescent radiation measurement |
| US4486315A (en) * | 1982-03-11 | 1984-12-04 | Ortho Diagnostic Systems Inc. | Immunoassay microparticle washing system and method of use |
| US4437586A (en) | 1982-03-29 | 1984-03-20 | Eastman Kodak Company | Mechanically actuated pipette dispenser |
| US4816567A (en) | 1983-04-08 | 1989-03-28 | Genentech, Inc. | Recombinant immunoglobin preparations |
| US4554839A (en) | 1983-10-14 | 1985-11-26 | Cetus Corporation | Multiple trough vessel for automated liquid handling apparatus |
| US5171534A (en) | 1984-01-16 | 1992-12-15 | California Institute Of Technology | Automated DNA sequencing technique |
| US4545497A (en) | 1984-11-16 | 1985-10-08 | Millipore Corporation | Container cap with frangible septum |
| JPS61202141A (en) | 1985-03-06 | 1986-09-06 | Nec Corp | Absorptiometer |
| JPS61202142A (en) * | 1985-03-06 | 1986-09-06 | Teijin Ltd | Analyzing method and apparatus using absorbance |
| US4593837A (en) | 1985-03-15 | 1986-06-10 | Eastman Kodak Company | Variable volume pipette |
| US4683195A (en) | 1986-01-30 | 1987-07-28 | Cetus Corporation | Process for amplifying, detecting, and/or-cloning nucleic acid sequences |
| JPS61254833A (en) * | 1985-05-08 | 1986-11-12 | Toyo Soda Mfg Co Ltd | Device for taking out fixed quantity of liquid |
| US4756884A (en) | 1985-08-05 | 1988-07-12 | Biotrack, Inc. | Capillary flow device |
| DE3614085A1 (en) | 1985-12-12 | 1987-06-19 | Hirschmann Glasgeraete | PIPETTE |
| CH671526A5 (en) | 1985-12-17 | 1989-09-15 | Hamilton Bonaduz Ag | |
| JPH0652227B2 (en) | 1986-04-25 | 1994-07-06 | 梅谷 陽二 | Micro injection amount measuring device |
| GB2190195A (en) | 1986-05-09 | 1987-11-11 | Cambridge Life Sciences | Microtitre plate reader |
| JPH0727700Y2 (en) | 1986-06-16 | 1995-06-21 | 日本電気株式会社 | Control circuit for PLL synthesizer |
| US4744955A (en) | 1986-08-08 | 1988-05-17 | Shapiro Justin J | Adjustable volume pipette sampler |
| US5310652A (en) | 1986-08-22 | 1994-05-10 | Hoffman-La Roche Inc. | Reverse transcription with thermostable DNA polymerase-high temperature reverse transcription |
| US5322770A (en) | 1989-12-22 | 1994-06-21 | Hoffman-Laroche Inc. | Reverse transcription with thermostable DNA polymerases - high temperature reverse transcription |
| JPH0816675B2 (en) | 1986-09-26 | 1996-02-21 | 株式会社島津製作所 | Gas chromatograph |
| US4933291A (en) | 1986-12-22 | 1990-06-12 | Eastman Kodak Company | Centrifugable pipette tip and pipette therefor |
| JPH0697231B2 (en) | 1987-07-15 | 1994-11-30 | 富士写真フイルム株式会社 | Biochemical analyzer |
| US4822331A (en) | 1987-11-09 | 1989-04-18 | Taylor David C | Centrifuge |
| US5055263A (en) | 1988-01-14 | 1991-10-08 | Cyberlab, Inc. | Automated pipetting system |
| US5130238A (en) | 1988-06-24 | 1992-07-14 | Cangene Corporation | Enhanced nucleic acid amplification process |
| US4925629A (en) | 1988-07-28 | 1990-05-15 | Bioquant, Inc. | Diagnostic device |
| US5320808A (en) | 1988-08-02 | 1994-06-14 | Abbott Laboratories | Reaction cartridge and carousel for biological sample analyzer |
| JPH0275959A (en) | 1988-09-12 | 1990-03-15 | Nittec Co Ltd | Automatic analysis apparatus |
| US5186162A (en) | 1988-09-14 | 1993-02-16 | Interpore Orthopaedics, Inc. | Ultrasonic transducer device for treatment of living tissue and/or cells |
| US4962041A (en) | 1988-10-06 | 1990-10-09 | Medical Automation Specialities, Inc. | Method and apparatus for automatic processing and analyzing of blood serum |
| US4927545A (en) | 1988-10-06 | 1990-05-22 | Medical Automation Specialties, Inc. | Method and apparatus for automatic processing and analyzing of blood serum |
| US5530101A (en) | 1988-12-28 | 1996-06-25 | Protein Design Labs, Inc. | Humanized immunoglobulins |
| WO1990013668A1 (en) | 1989-05-05 | 1990-11-15 | Lifecodes Corporation | Method for genetic analysis of a nucleic acid sample |
| AU650622B2 (en) | 1989-07-11 | 1994-06-30 | Gen-Probe Incorporated | Nucleic acid sequence amplification methods utilizing a transcription complex |
| CA2020958C (en) | 1989-07-11 | 2005-01-11 | Daniel L. Kacian | Nucleic acid sequence amplification methods |
| US5683888A (en) | 1989-07-22 | 1997-11-04 | University Of Wales College Of Medicine | Modified bioluminescent proteins and their use |
| IL94212A0 (en) | 1989-07-24 | 1991-01-31 | Tri Tech Partners And Triton B | Automated analytical apparatus and method |
| US5061449A (en) | 1989-07-25 | 1991-10-29 | Matrix Technologies, Corp. | Expandable multi-channel pipetter |
| US5005981A (en) | 1989-09-08 | 1991-04-09 | Becton, Dickinson And Company | Apparatus for method for causing vortices in a test tube |
| US5072382A (en) | 1989-10-02 | 1991-12-10 | Kamentsky Louis A | Methods and apparatus for measuring multiple optical properties of biological specimens |
| US5089229A (en) | 1989-11-22 | 1992-02-18 | Vettest S.A. | Chemical analyzer |
| JP2731613B2 (en) | 1989-12-12 | 1998-03-25 | 株式会社クラレ | Cartridge for enzyme immunoassay, measuring method and measuring apparatus using the same |
| US5859205A (en) | 1989-12-21 | 1999-01-12 | Celltech Limited | Humanised antibodies |
| US5292658A (en) | 1989-12-29 | 1994-03-08 | University Of Georgia Research Foundation, Inc. Boyd Graduate Studies Research Center | Cloning and expressions of Renilla luciferase |
| US5242606A (en) | 1990-06-04 | 1993-09-07 | Abaxis, Incorporated | Sample metering port for analytical rotor having overflow chamber |
| US5122284A (en) | 1990-06-04 | 1992-06-16 | Abaxis, Inc. | Apparatus and method for optically analyzing biological fluids |
| US5173193A (en) | 1991-04-01 | 1992-12-22 | Schembri Carol T | Centrifugal rotor having flow partition |
| US5061381A (en) | 1990-06-04 | 1991-10-29 | Abaxis, Inc. | Apparatus and method for separating cells from biological fluids |
| US5527670A (en) | 1990-09-12 | 1996-06-18 | Scientific Generics Limited | Electrochemical denaturation of double-stranded nucleic acid |
| EP0478319B1 (en) | 1990-09-28 | 1997-04-02 | Kabushiki Kaisha Toshiba | Gene detection method |
| JP2969935B2 (en) * | 1990-11-30 | 1999-11-02 | 東ソー株式会社 | Liquid metering device |
| DE4041905A1 (en) | 1990-12-27 | 1992-07-02 | Boehringer Mannheim Gmbh | TEST CARRIER ANALYSIS SYSTEM |
| US5455166A (en) | 1991-01-31 | 1995-10-03 | Becton, Dickinson And Company | Strand displacement amplification |
| FR2673183B1 (en) | 1991-02-21 | 1996-09-27 | Asulab Sa | MONO, BIS OR TRIS (2,2'-BIPYRIDINE SUBSTITUTED) COMPLEXES OF A SELECTED METAL AMONG IRON, RUTHENIUM, OSMIUM OR VANADIUM AND THEIR PREPARATION PROCESSES. |
| US5273905A (en) | 1991-02-22 | 1993-12-28 | Amoco Corporation | Processing of slide mounted material |
| WO1992015673A1 (en) | 1991-03-11 | 1992-09-17 | The University Of Georgia Research Foundation, Inc. | Cloning and expression of renilla luciferase |
| US5264184A (en) | 1991-03-19 | 1993-11-23 | Minnesota Mining And Manufacturing Company | Device and a method for separating liquid samples |
| US5230864A (en) | 1991-04-10 | 1993-07-27 | Eastman Kodak Company | Gravity assisted collection device |
| US5112574A (en) | 1991-04-26 | 1992-05-12 | Imanigation, Ltd. | Multititer stopper array for multititer plate or tray |
| US5324481A (en) | 1991-06-03 | 1994-06-28 | Abbott Laboratories | Carousel for assay specimen carrier |
| DE69233254T2 (en) | 1991-06-14 | 2004-09-16 | Genentech, Inc., South San Francisco | Humanized Heregulin antibody |
| WO1994004679A1 (en) | 1991-06-14 | 1994-03-03 | Genentech, Inc. | Method for making humanized antibodies |
| FR2679661B1 (en) | 1991-07-26 | 1994-10-14 | Sfri | APPARATUS FOR AUTOMATIC SAMPLES ANALYSIS. |
| DE69220888T2 (en) | 1991-11-05 | 1998-01-29 | Perkin Elmer Corp | Device and method for producing biopolymers |
| US5270184A (en) | 1991-11-19 | 1993-12-14 | Becton, Dickinson And Company | Nucleic acid target generation |
| US5960160A (en) | 1992-03-27 | 1999-09-28 | Abbott Laboratories | Liquid heater assembly with a pair temperature controlled electric heating elements and a coiled tube therebetween |
| US5507410A (en) | 1992-03-27 | 1996-04-16 | Abbott Laboratories | Meia cartridge feeder |
| US5288390A (en) | 1992-03-30 | 1994-02-22 | Sun Company, Inc. (R&M) | Polycyclic aromatic ring cleavage (PARC) process |
| WO1993019827A1 (en) | 1992-04-02 | 1993-10-14 | Abaxis, Inc. | Analytical rotor with dye mixing chamber |
| JP3558294B2 (en) | 1992-05-01 | 2004-08-25 | トラスティーズ・オブ・ザ・ユニバーシティ・オブ・ペンシルベニア | Polynucleotide amplification analysis using microfabrication equipment |
| US5380487A (en) | 1992-05-05 | 1995-01-10 | Pasteur Sanofi Diagnostics | Device for automatic chemical analysis |
| US5357953A (en) | 1992-05-21 | 1994-10-25 | Puritan-Bennett Corporation | Measurement device and method of calibration |
| US5674698A (en) | 1992-09-14 | 1997-10-07 | Sri International | Up-converting reporters for biological and other assays using laser excitation techniques |
| JP3420765B2 (en) | 1992-09-14 | 2003-06-30 | エス・アール・アイ・インターナシヨナル | Upconvertable reporter for biological and other analysis using laser excitation technology |
| EP0619476B1 (en) * | 1992-12-19 | 1999-09-22 | Boehringer Mannheim Gmbh | Device for detection of a fluidic interface in a transparent measuring tube |
| DE4305581A1 (en) * | 1993-02-24 | 1994-08-25 | Hettich Andreas Fa | Rotor for a swivel cup centrifuge |
| US5416879A (en) | 1993-03-29 | 1995-05-16 | World Precision Instruments, Inc. | Apparatus and method for measuring light absorption in small aqueous fluid samples |
| US5478750A (en) | 1993-03-31 | 1995-12-26 | Abaxis, Inc. | Methods for photometric analysis |
| JP3563140B2 (en) | 1995-01-19 | 2004-09-08 | 株式会社日立製作所 | Capillary array electrophoresis device |
| DK0702728T3 (en) | 1993-06-09 | 1998-06-02 | Gamera Bioscience Corp | Magnetic cycle reaction |
| US5578269A (en) | 1993-06-11 | 1996-11-26 | Ortho Diagnostic Systems Inc. | Automated blood analysis system with an integral centrifuge |
| DE69430152T2 (en) | 1993-06-25 | 2002-10-31 | Edward W Stark | Method and device for measuring glucose-related substances |
| JP3343156B2 (en) | 1993-07-14 | 2002-11-11 | アークレイ株式会社 | Optical component concentration measuring apparatus and method |
| GB9315671D0 (en) | 1993-07-29 | 1993-09-15 | Dow Corning Sa | Foam control agents and their use |
| ITMI931761A1 (en) | 1993-08-03 | 1995-02-03 | Healtech Sa | INFORMATION SUPPORT DEVICE THAT CAN BE ASSOCIATED WITH OUTPATIENT OR HOSPITAL PATIENTS FOR THEIR AUTOMATIC IDENTIFICATION AND |
| TW265262B (en) * | 1993-08-13 | 1995-12-11 | Nat Science Committee | Mother-and-child interconnected centrifuge tube used for solution separation |
| KR960704064A (en) | 1993-08-13 | 1996-08-31 | 죠나단 에스. 도르딕 | Biocatalytic Methods for Synthesizing and ldentifying Biologically Active Compounds |
| US5397709A (en) | 1993-08-27 | 1995-03-14 | Becton Dickinson And Company | System for detecting bacterial growth in a plurality of culture vials |
| CA2129787A1 (en) | 1993-08-27 | 1995-02-28 | Russell G. Higuchi | Monitoring multiple amplification reactions simultaneously and analyzing same |
| US5591643A (en) | 1993-09-01 | 1997-01-07 | Abaxis, Inc. | Simplified inlet channels |
| US6235531B1 (en) | 1993-09-01 | 2001-05-22 | Abaxis, Inc. | Modified siphons for improved metering precision |
| EP0759170B1 (en) | 1993-09-10 | 2008-07-09 | The Trustees Of Columbia University In The City Of New York | Uses of green fluorescent protein |
| JPH0783936A (en) | 1993-09-10 | 1995-03-31 | Taitetsuku Kk | Method of physical and chemical experiment |
| ES2259277T3 (en) | 1993-09-24 | 2006-10-01 | Abbott Laboratories | METHOD OF OPERATING AN AUTOMATIC ANALYTICAL SYSTEM OF CONTINUOUS RANDOM ACCESS ABLE TO SIMULTANEOUSLY MULTIPLE TESTS IN A PLURALITY OF LIQUID SAMPLES. |
| JP3391862B2 (en) | 1993-10-05 | 2003-03-31 | 株式会社日立製作所 | Chromatogram analysis method |
| JPH07120393A (en) | 1993-10-13 | 1995-05-12 | Nippon Tectron Co Ltd | Fluorescence detection method |
| US5525300A (en) | 1993-10-20 | 1996-06-11 | Stratagene | Thermal cycler including a temperature gradient block |
| EP0892444B1 (en) | 1993-11-02 | 2004-04-21 | Matsushita Electric Industrial Co., Ltd | Semiconductor device comprising an aggregate of semiconductor micro-needles |
| US5403415A (en) | 1993-11-17 | 1995-04-04 | Abaxis, Inc. | Method and device for ultrasonic welding |
| US6252980B1 (en) * | 1993-11-24 | 2001-06-26 | Nira Schwartz | Additional dynamic fluid level and bubble inspection for quality and process control |
| JPH07151101A (en) | 1993-11-29 | 1995-06-13 | Kazuo Sugimura | Vessel having spiral diaphragm contact surface |
| JPH07196314A (en) | 1993-12-28 | 1995-08-01 | Maruo Calcium Co Ltd | Tubular synthetic inorganic fine particle |
| WO1995021191A1 (en) | 1994-02-04 | 1995-08-10 | William Ward | Bioluminescent indicator based upon the expression of a gene for a modified green-fluorescent protein |
| EP0750680B1 (en) | 1994-03-15 | 1999-01-13 | Scientific Generics Ltd | Electrochemical denaturation of double-stranded nucleic acid |
| US5590052A (en) | 1994-04-14 | 1996-12-31 | Abaxis, Inc. | Error checking in blood analyzer |
| US5648211A (en) | 1994-04-18 | 1997-07-15 | Becton, Dickinson And Company | Strand displacement amplification using thermophilic enzymes |
| CA2147560A1 (en) | 1994-04-22 | 1995-10-23 | Donald H. Devaughn | Aerosol and liquid transfer resistant pipette tip apparatus and method |
| US5483799A (en) | 1994-04-29 | 1996-01-16 | Dalto; Michael | Temperature regulated specimen transporter |
| JP3584990B2 (en) | 1994-05-09 | 2004-11-04 | タカラバイオ株式会社 | Anti-human influenza virus antibody |
| US5976896A (en) | 1994-06-06 | 1999-11-02 | Idexx Laboratories, Inc. | Immunoassays in capillary tubes |
| JP2637695B2 (en) | 1994-07-12 | 1997-08-06 | 株式会社バイオセンサー研究所 | Solution suction device and suction type trace substance measuring device in solution |
| US5639428A (en) | 1994-07-19 | 1997-06-17 | Becton Dickinson And Company | Method and apparatus for fully automated nucleic acid amplification, nucleic acid assay and immunoassay |
| WO1996003637A1 (en) | 1994-07-25 | 1996-02-08 | Molecular Devices Corporation | Determination of light absorption pathlength in a vertical-beam photometer |
| US5891734A (en) | 1994-08-01 | 1999-04-06 | Abbott Laboratories | Method for performing automated analysis |
| US5527257A (en) | 1994-09-14 | 1996-06-18 | Piramoon Technologies, Inc. | Rotor having endless straps for mounting swinging buckets |
| JP3652424B2 (en) | 1994-10-27 | 2005-05-25 | 日本政策投資銀行 | Automatic analyzer and method |
| JP3403839B2 (en) | 1994-10-27 | 2003-05-06 | プレシジョン・システム・サイエンス株式会社 | Cartridge container |
| US5777079A (en) | 1994-11-10 | 1998-07-07 | The Regents Of The University Of California | Modified green fluorescent proteins |
| US6484897B1 (en) | 1995-02-13 | 2002-11-26 | Amcad Holdings Limited | Containers with variable volume |
| US5557596A (en) | 1995-03-20 | 1996-09-17 | Gibson; Gary | Ultra-high density storage device |
| US5578270A (en) | 1995-03-24 | 1996-11-26 | Becton Dickinson And Company | System for nucleic acid based diagnostic assay |
| US6352854B1 (en) | 1995-04-25 | 2002-03-05 | Discovery Partners International, Inc. | Remotely programmable matrices with memories |
| US5874214A (en) | 1995-04-25 | 1999-02-23 | Irori | Remotely programmable matrices with memories |
| US6340588B1 (en) | 1995-04-25 | 2002-01-22 | Discovery Partners International, Inc. | Matrices with memories |
| US5582705A (en) | 1995-05-19 | 1996-12-10 | Iowa State University Research Foundation, Inc. | Multiplexed capillary electrophoresis system |
| US5772962A (en) | 1995-05-29 | 1998-06-30 | Hitachi, Ltd. | Analyzing apparatus using disposable reaction vessels |
| US5518923A (en) | 1995-06-06 | 1996-05-21 | Becton Dickinson And Company | Compact blood culture apparatus |
| JP3839524B2 (en) | 1995-06-07 | 2006-11-01 | アジレント・テクノロジーズ・インク | Miniaturized total analysis system |
| US6274288B1 (en) * | 1995-06-12 | 2001-08-14 | California Institute Of Technology | Self-trapping and self-focusing of optical beams in photopolymers |
| US6168948B1 (en) | 1995-06-29 | 2001-01-02 | Affymetrix, Inc. | Miniaturized genetic analysis systems and methods |
| JP3927570B2 (en) | 1995-07-31 | 2007-06-13 | プレシジョン・システム・サイエンス株式会社 | container |
| JP3985872B2 (en) | 1995-07-31 | 2007-10-03 | プレシジョン・システム・サイエンス株式会社 | container |
| JPH0968533A (en) | 1995-08-31 | 1997-03-11 | Brother Ind Ltd | Biochemical substrate measuring device displaying chemical dose |
| JP3515646B2 (en) | 1995-09-18 | 2004-04-05 | 大塚電子株式会社 | Multi-capillary electrophoresis device |
| DE19535046C2 (en) | 1995-09-21 | 1998-04-16 | Eppendorf Geraetebau Netheler | Handheld device for pipetting and photometric measurement of samples |
| US5628890A (en) | 1995-09-27 | 1997-05-13 | Medisense, Inc. | Electrochemical sensor |
| JPH09113511A (en) | 1995-10-18 | 1997-05-02 | Kdk Corp | Dry test piece for measuring glyco-albumin |
| US5687716A (en) | 1995-11-15 | 1997-11-18 | Kaufmann; Peter | Selective differentiating diagnostic process based on broad data bases |
| US5854033A (en) | 1995-11-21 | 1998-12-29 | Yale University | Rolling circle replication reporter systems |
| US20060074063A1 (en) | 1995-12-29 | 2006-04-06 | Fernandez-Pol Jose A | Pharmacological agent and method of treatment |
| JPH09192218A (en) | 1996-01-16 | 1997-07-29 | Hitachi Ltd | Blood-sugar level control system |
| US5874304A (en) | 1996-01-18 | 1999-02-23 | University Of Florida Research Foundation, Inc. | Humanized green fluorescent protein genes and methods |
| US5863502A (en) | 1996-01-24 | 1999-01-26 | Sarnoff Corporation | Parallel reaction cassette and associated devices |
| CN1096185C (en) | 1996-01-27 | 2002-12-11 | 三星电子株式会社 | Interlaced-to-progressive conversion apparatus and method using motion and spatial correlation |
| US5804387A (en) | 1996-02-01 | 1998-09-08 | The Board Of Trustees Of The Leland Stanford Junior University | FACS-optimized mutants of the green fluorescent protein (GFP) |
| US5876995A (en) | 1996-02-06 | 1999-03-02 | Bryan; Bruce | Bioluminescent novelty items |
| US5670375A (en) | 1996-02-21 | 1997-09-23 | Biomerieux Vitek, Inc. | Sample card transport method for biological sample testing machine |
| JP2988362B2 (en) | 1996-03-11 | 1999-12-13 | 株式会社日立製作所 | Multi-sample analysis system |
| JPH09244055A (en) | 1996-03-14 | 1997-09-19 | Hitachi Ltd | Liquid crystal display device |
| DE19610538A1 (en) | 1996-03-18 | 1997-09-25 | Deutsches Krebsforsch | Radiation detection device |
| US6114122A (en) | 1996-03-26 | 2000-09-05 | Affymetrix, Inc. | Fluidics station with a mounting system and method of using |
| JP2783277B2 (en) | 1996-03-27 | 1998-08-06 | 日本電気株式会社 | Patient monitoring device and patient monitoring system |
| EP0801309A3 (en) | 1996-04-08 | 1998-08-12 | SANYO ELECTRIC Co., Ltd. | Pipetting apparatus |
| JPH09281078A (en) | 1996-04-09 | 1997-10-31 | Hitachi Electron Eng Co Ltd | Dna base sequence determining apparatus |
| US5896297A (en) | 1996-04-15 | 1999-04-20 | Valerino, Sr.; Fred M. | Robotube delivery system |
| US5942443A (en) | 1996-06-28 | 1999-08-24 | Caliper Technologies Corporation | High throughput screening assay systems in microscale fluidic devices |
| US5885470A (en) | 1997-04-14 | 1999-03-23 | Caliper Technologies Corporation | Controlled fluid transport in microfabricated polymeric substrates |
| US6399023B1 (en) | 1996-04-16 | 2002-06-04 | Caliper Technologies Corp. | Analytical system and method |
| JP3213566B2 (en) | 1996-04-26 | 2001-10-02 | アークレイ株式会社 | Sample analysis tool, sample analysis method and sample analyzer using the same |
| US5851170A (en) * | 1996-04-30 | 1998-12-22 | Dade Behring Inc. | Centrifuge with cam selectable rotational angles and method for unloading same |
| BR9702250A (en) * | 1996-05-02 | 1999-02-17 | Sankyo Manufacturing Co Ltd | Non-contact inspection system |
| US5879628A (en) | 1996-05-06 | 1999-03-09 | Helena Laboratories Corporation | Blood coagulation system having a bar code reader and a detecting means for detecting the presence of reagents in the cuvette |
| US5980830A (en) | 1996-05-20 | 1999-11-09 | Sendx Medical, Inc. | Portable modular blood analyzer with simplified fluid handling sequence |
| US6509193B1 (en) | 1996-05-20 | 2003-01-21 | Precision System Science Co., Ltd. | Method and apparatus for controlling magnetic particles by pipetting machine |
| IL118432A (en) | 1996-05-27 | 1999-12-31 | Yissum Res Dev Co | Electrochemical and photochemical electrodes and their use |
| ES2215230T3 (en) | 1996-06-04 | 2004-10-01 | University Of Utah Research Foundation | SYSTEM AND METHOD FOR CARRYING OUT AND SUPERVISING CHAIN POLYMERASE REACTIONS. |
| US5939291A (en) | 1996-06-14 | 1999-08-17 | Sarnoff Corporation | Microfluidic method for nucleic acid amplification |
| NZ333346A (en) | 1996-06-28 | 2000-03-27 | Caliper Techn Corp | High-throughput screening assay systems in microscale fluidic devices |
| US5797898A (en) | 1996-07-02 | 1998-08-25 | Massachusetts Institute Of Technology | Microchip drug delivery devices |
| US5807523A (en) | 1996-07-03 | 1998-09-15 | Beckman Instruments, Inc. | Automatic chemistry analyzer |
| US6060022A (en) | 1996-07-05 | 2000-05-09 | Beckman Coulter, Inc. | Automated sample processing system including automatic centrifuge device |
| EP0818547A1 (en) | 1996-07-10 | 1998-01-14 | Autoliv ASP, Inc. | Recovery of metals values from air bag inflators |
| US5925558A (en) | 1996-07-16 | 1999-07-20 | The Regents Of The University Of California | Assays for protein kinases using fluorescent protein substrates |
| US6145688A (en) | 1996-07-17 | 2000-11-14 | Smith; James C. | Closure device for containers |
| US5915284A (en) | 1996-07-22 | 1999-06-22 | Cyberlab, Inc. | Multiple channel pipetting device |
| US6101488A (en) | 1996-09-04 | 2000-08-08 | Fujitsu Limited | Intelligent information program generation and retrieval system |
| US5854684A (en) | 1996-09-26 | 1998-12-29 | Sarnoff Corporation | Massively parallel detection |
| JP3270722B2 (en) * | 1996-09-27 | 2002-04-02 | オルガノ株式会社 | Bacteria detection method and detection device |
| GB9620209D0 (en) | 1996-09-27 | 1996-11-13 | Cemu Bioteknik Ab | Method of sequencing DNA |
| US5976796A (en) | 1996-10-04 | 1999-11-02 | Loma Linda University | Construction and expression of renilla luciferase and green fluorescent protein fusion genes |
| US5874046A (en) | 1996-10-30 | 1999-02-23 | Raytheon Company | Biological warfare agent sensor system employing ruthenium-terminated oligonucleotides complementary to target live agent DNA sequences |
| GB9624096D0 (en) | 1996-11-20 | 1997-01-08 | Microbial Systems Ltd | Apparatus and method of use thereof |
| US6379929B1 (en) | 1996-11-20 | 2002-04-30 | The Regents Of The University Of Michigan | Chip-based isothermal amplification devices and methods |
| US6027459A (en) | 1996-12-06 | 2000-02-22 | Abbott Laboratories | Method and apparatus for obtaining blood for diagnostic tests |
| CA2271717A1 (en) | 1996-12-12 | 1998-06-18 | Prolume, Ltd. | Apparatus and method for detecting and identifying infectious agents |
| KR100233283B1 (en) | 1996-12-24 | 1999-12-01 | 김영환 | Repair fuse initialzing circuit using a flash memory cell |
| JPH10239240A (en) | 1997-02-25 | 1998-09-11 | Hitachi Ltd | Automatic dna probing apparatus |
| US8293064B2 (en) | 1998-03-02 | 2012-10-23 | Cepheid | Method for fabricating a reaction vessel |
| HUP0003152A3 (en) | 1997-02-28 | 2002-09-30 | Burstein Lab Inc Irvine | Laboratory in a disk |
| US6565815B1 (en) | 1997-02-28 | 2003-05-20 | Cepheid | Heat exchanging, optically interrogated chemical reaction assembly |
| US5846492A (en) * | 1997-03-11 | 1998-12-08 | Johnson & Johnson Clinical Diagnostics, Inc. | Sample quality measurement and/or analyte measurement in the dispensing tip of an analyzer |
| US6013528A (en) * | 1997-03-11 | 2000-01-11 | Ortho-Clinical Diagnostis, Inc. | Analyzer throughput featuring through-the-tip analysis |
| JP3393361B2 (en) | 1997-03-24 | 2003-04-07 | 国立身体障害者リハビリテーションセンター総長 | Biosensor |
| GB9706654D0 (en) | 1997-04-02 | 1997-05-21 | Scient Generics Ltd | Disassociation of interacting molecules |
| US6235471B1 (en) | 1997-04-04 | 2001-05-22 | Caliper Technologies Corp. | Closed-loop biochemical analyzers |
| US6277605B1 (en) | 1997-04-04 | 2001-08-21 | Innogenetics N.V. | Isothermal polymerase chain reaction by cycling the concentration of divalent metal ions |
| US5961451A (en) | 1997-04-07 | 1999-10-05 | Motorola, Inc. | Noninvasive apparatus having a retaining member to retain a removable biosensor |
| EP0871034B1 (en) | 1997-04-10 | 2007-03-07 | Hitachi, Ltd. | Automatic analyzer and support system therefor |
| DE19717023C2 (en) | 1997-04-23 | 2003-02-06 | Micronas Gmbh | Device for treating malignant, tumorous tissue areas |
| WO1998049548A1 (en) | 1997-04-25 | 1998-11-05 | Caliper Technologies Corporation | Microfluidic devices incorporating improved channel geometries |
| US6429007B1 (en) | 1997-05-02 | 2002-08-06 | BIOMéRIEUX, INC. | Nucleic acid amplification reaction station for disposable test devices |
| US6406845B1 (en) | 1997-05-05 | 2002-06-18 | Trustees Of Tuft College | Fiber optic biosensor for selectively detecting oligonucleotide species in a mixed fluid sample |
| JPH10305016A (en) | 1997-05-08 | 1998-11-17 | Casio Comput Co Ltd | Behavior information providing system |
| US5985214A (en) | 1997-05-16 | 1999-11-16 | Aurora Biosciences Corporation | Systems and methods for rapidly identifying useful chemicals in liquid samples |
| ES2249818T3 (en) | 1997-06-09 | 2006-04-01 | F. Hoffmann-La Roche Ag | DISPOSABLE DEVICE AFTER ITS USE IN A PROCESS. |
| US6115545A (en) | 1997-07-09 | 2000-09-05 | Hewlett-Packard Company | Automatic internet protocol (IP) address allocation and assignment |
| WO1999004043A1 (en) | 1997-07-14 | 1999-01-28 | Abbott Laboratories | Telemedicine |
| US6589789B1 (en) | 1997-07-21 | 2003-07-08 | Quest Diagnostics Incorporated | Automated centrifuge loading device |
| JPH1137845A (en) | 1997-07-22 | 1999-02-12 | Matsushita Electric Ind Co Ltd | Equipment for measuring quantity of serum |
| US5876675A (en) | 1997-08-05 | 1999-03-02 | Caliper Technologies Corp. | Microfluidic devices and systems |
| US6294331B1 (en) | 1997-08-08 | 2001-09-25 | The United States Of America As Represented By The Department Of Health And Human Services | Methods for assessing genetic and phenotypic markers by simultaneous multicolor visualization of chromogenic dyes using brightfield microscopy and spectral imaging |
| US6368871B1 (en) | 1997-08-13 | 2002-04-09 | Cepheid | Non-planar microstructures for manipulation of fluid samples |
| JPH1157560A (en) | 1997-08-27 | 1999-03-02 | Shin Meiwa Ind Co Ltd | Sprinkler truck |
| US6042909A (en) | 1997-09-03 | 2000-03-28 | Circe Biomedical, Inc. | Encapsulation device |
| EP0902290B1 (en) | 1997-09-11 | 2008-11-05 | Hitachi, Ltd. | Sample handling system for automatic analysers |
| US6597450B1 (en) | 1997-09-15 | 2003-07-22 | Becton, Dickinson And Company | Automated Optical Reader for Nucleic Acid Assays |
| US6825921B1 (en) | 1999-11-10 | 2004-11-30 | Molecular Devices Corporation | Multi-mode light detection system |
| US6982431B2 (en) * | 1998-08-31 | 2006-01-03 | Molecular Devices Corporation | Sample analysis systems |
| US6902703B2 (en) | 1999-05-03 | 2005-06-07 | Ljl Biosystems, Inc. | Integrated sample-processing system |
| US5842787A (en) | 1997-10-09 | 1998-12-01 | Caliper Technologies Corporation | Microfluidic systems incorporating varied channel dimensions |
| DE19745373A1 (en) | 1997-10-14 | 1999-04-15 | Bayer Ag | Optical measuring system for the detection of luminescence or fluorescence signals |
| US6121054A (en) | 1997-11-19 | 2000-09-19 | Trega Biosciences, Inc. | Method for separation of liquid and solid phases for solid phase organic syntheses |
| US6174675B1 (en) | 1997-11-25 | 2001-01-16 | Caliper Technologies Corp. | Electrical current for controlling fluid parameters in microchannels |
| AUPP058197A0 (en) | 1997-11-27 | 1997-12-18 | A.I. Scientific Pty Ltd | Pathology sample tube distributor |
| US6083682A (en) | 1997-12-19 | 2000-07-04 | Glaxo Group Limited | System and method for solid-phase parallel synthesis of a combinatorial collection of compounds |
| AU758407B2 (en) | 1997-12-24 | 2003-03-20 | Cepheid | Integrated fluid manipulation cartridge |
| US6074616A (en) | 1998-01-05 | 2000-06-13 | Biosite Diagnostics, Inc. | Media carrier for an assay device |
| US5993417A (en) | 1998-01-06 | 1999-11-30 | Yerfino; Daniel Alberto | Disposable syringe with an automatically retractable hypodermic needle |
| WO1999039829A1 (en) | 1998-02-04 | 1999-08-12 | Merck & Co., Inc. | Virtual wells for use in high throughput screening assays |
| US6420143B1 (en) | 1998-02-13 | 2002-07-16 | Caliper Technologies Corp. | Methods and systems for performing superheated reactions in microscale fluidic systems |
| US6369893B1 (en) | 1998-05-19 | 2002-04-09 | Cepheid | Multi-channel optical detection system |
| US6030582A (en) | 1998-03-06 | 2000-02-29 | Levy; Abner | Self-resealing, puncturable container cap |
| US20110130740A1 (en) | 1998-03-06 | 2011-06-02 | Abner Levy | Medication Bottle for Use with Oral Syringe |
| US6752965B2 (en) | 1998-03-06 | 2004-06-22 | Abner Levy | Self resealing elastomeric closure |
| US6929953B1 (en) * | 1998-03-07 | 2005-08-16 | Robert A. Levine | Apparatus for analyzing biologic fluids |
| US6235536B1 (en) * | 1998-03-07 | 2001-05-22 | Robert A. Levine | Analysis of quiescent anticoagulated whole blood samples |
| US6127184A (en) * | 1998-03-07 | 2000-10-03 | Robert A. Levine | Calibration of a whole blood sample analyzer |
| US6979424B2 (en) | 1998-03-17 | 2005-12-27 | Cepheid | Integrated sample analysis device |
| US7188001B2 (en) | 1998-03-23 | 2007-03-06 | Cepheid | System and method for temperature control |
| WO1999049019A2 (en) | 1998-03-27 | 1999-09-30 | Prolume, Ltd. | Luciferases, fluorescent proteins, nucleic acids encoding the luciferases and fluorescent proteins and the use thereof in diagnostics |
| US6235534B1 (en) * | 1998-04-27 | 2001-05-22 | Ronald Frederich Brookes | Incremental absorbance scanning of liquid in dispensing tips |
| US6175752B1 (en) | 1998-04-30 | 2001-01-16 | Therasense, Inc. | Analyte monitoring device and methods of use |
| ATE363339T1 (en) | 1998-05-01 | 2007-06-15 | Gen Probe Inc | STIRRING DEVICE FOR THE FLUID CONTENTS OF A CONTAINER |
| ES2229465T3 (en) | 1998-05-04 | 2005-04-16 | F. Hoffmann-La Roche Ag | TREMO-VARIATOR THAT HAS A COVER THAT IS AUTOMATICALLY PLACED IN POSITION. |
| US6200531B1 (en) | 1998-05-11 | 2001-03-13 | Igen International, Inc. | Apparatus for carrying out electrochemiluminescence test measurements |
| US7394363B1 (en) | 1998-05-12 | 2008-07-01 | Bahador Ghahramani | Intelligent multi purpose early warning system for shipping containers, components therefor and methods of making the same |
| US7498164B2 (en) | 1998-05-16 | 2009-03-03 | Applied Biosystems, Llc | Instrument for monitoring nucleic acid sequence amplification reaction |
| US6287765B1 (en) | 1998-05-20 | 2001-09-11 | Molecular Machines, Inc. | Methods for detecting and identifying single molecules |
| EP0962773A1 (en) | 1998-06-03 | 1999-12-08 | Mark Howard Jones | Electrochemical based assay processes instrument and labels |
| JP3389106B2 (en) | 1998-06-11 | 2003-03-24 | 松下電器産業株式会社 | Electrochemical analysis element |
| US6743605B1 (en) | 1998-06-24 | 2004-06-01 | Enzo Life Sciences, Inc. | Linear amplification of specific nucleic acid sequences |
| AU1399499A (en) | 1998-07-06 | 2000-01-24 | Coca-Cola Company, The | Basket with integrally-formed receptacle |
| GB9816088D0 (en) | 1998-07-23 | 1998-09-23 | Axis Biochemicals Asa | System |
| US6091490A (en) | 1998-07-30 | 2000-07-18 | The United States Of America As Represented By The Secretary Of The Navy | Fiber-optic pipette (FOP) for rapid long pathlength capillary spectroscopy |
| DE19835833A1 (en) | 1998-08-07 | 2000-02-17 | Max Planck Gesellschaft | Dosing head for parallel processing of a large number of fluid samples |
| US6562300B2 (en) | 1998-08-28 | 2003-05-13 | Becton, Dickinson And Company | Collection assembly |
| US6517475B1 (en) | 1998-09-25 | 2003-02-11 | Baldwin Filters, Inc. | Centrifugal filter for removing soot from engine oil |
| US6159368A (en) | 1998-10-29 | 2000-12-12 | The Perkin-Elmer Corporation | Multi-well microfiltration apparatus |
| EP2287338B1 (en) | 1998-11-09 | 2012-09-05 | Eiken Kagaku Kabushiki Kaisha | Process for synthesizing nucleic acid |
| US20100262432A1 (en) | 1998-11-13 | 2010-10-14 | Anuthep Benja-Athon | Computer-created-consensus-based health-care system |
| US6309828B1 (en) | 1998-11-18 | 2001-10-30 | Agilent Technologies, Inc. | Method and apparatus for fabricating replicate arrays of nucleic acid molecules |
| US20030012699A1 (en) | 1998-11-18 | 2003-01-16 | Thomas Moore | Simultaneous handling of magnetic beads in a two-dimensional arrangement |
| RU2147123C1 (en) | 1998-12-16 | 2000-03-27 | Боев Сергей Федотович | Method for examining cellular blood composition using a smear |
| US6887693B2 (en) | 1998-12-24 | 2005-05-03 | Cepheid | Device and method for lysing cells, spores, or microorganisms |
| US7914994B2 (en) | 1998-12-24 | 2011-03-29 | Cepheid | Method for separating an analyte from a sample |
| CA2702148C (en) | 1999-01-06 | 2014-03-04 | Genenews Inc. | Method of profiling gene expression in a human subject having an infectious disease |
| US8005314B2 (en) | 2005-12-09 | 2011-08-23 | Amnis Corporation | Extended depth of field imaging for high speed object analysis |
| US7450229B2 (en) | 1999-01-25 | 2008-11-11 | Amnis Corporation | Methods for analyzing inter-cellular phenomena |
| JP3330929B2 (en) | 1999-01-25 | 2002-10-07 | 浜松ホトニクス株式会社 | Pipette adapter, pipette for absorbance measurement, tip, absorbance measurement device and absorbance measurement method |
| US8885913B2 (en) * | 1999-01-25 | 2014-11-11 | Amnis Corporation | Detection of circulating tumor cells using imaging flow cytometry |
| US6348176B1 (en) | 1999-02-11 | 2002-02-19 | Careside, Inc. | Cartridge-based analytical instrument using centrifugal force/pressure for metering/transport of fluids |
| GB9903906D0 (en) | 1999-02-19 | 1999-04-14 | Microbiological Res Authority | Method and apparatus for nucleic acid strand separation |
| US6215894B1 (en) | 1999-02-26 | 2001-04-10 | General Scanning, Incorporated | Automatic imaging and analysis of microarray biochips |
| US8636648B2 (en) | 1999-03-01 | 2014-01-28 | West View Research, Llc | Endoscopic smart probe |
| US6291249B1 (en) | 1999-03-02 | 2001-09-18 | Qualigen, Inc. | Method using an apparatus for separation of biological fluids |
| EP1129772A3 (en) | 1999-03-03 | 2001-11-07 | Symyx Technologies, Inc. | Fluid distribution for chemical processing microsystems |
| JP3524419B2 (en) * | 1999-03-08 | 2004-05-10 | アロカ株式会社 | Absorbance measurement device |
| US20020176801A1 (en) | 1999-03-23 | 2002-11-28 | Giebeler Robert H. | Fluid delivery and analysis systems |
| US6305804B1 (en) | 1999-03-25 | 2001-10-23 | Fovioptics, Inc. | Non-invasive measurement of blood component using retinal imaging |
| US6699669B2 (en) | 1999-04-09 | 2004-03-02 | Space Hardware Optimization Technology, Inc. | Multistage electromagnetic separator for purifying cells, chemicals and protein structures |
| US6143252A (en) | 1999-04-12 | 2000-11-07 | The Perkin-Elmer Corporation | Pipetting device with pipette tip for solid phase reactions |
| US20040053290A1 (en) | 2000-01-11 | 2004-03-18 | Terbrueggen Robert Henry | Devices and methods for biochip multiplexing |
| US20020177135A1 (en) | 1999-07-27 | 2002-11-28 | Doung Hau H. | Devices and methods for biochip multiplexing |
| JP4085514B2 (en) | 1999-04-30 | 2008-05-14 | 株式会社島津製作所 | Electrophoresis chip |
| WO2000067776A1 (en) | 1999-05-11 | 2000-11-16 | Ortho-Mcneil Pharmaceuticals, Inc. | Pharmacokinetic and pharmacodynamic modeling of erythropoietin administration |
| US6582964B1 (en) | 1999-05-12 | 2003-06-24 | Cme Telemetrix Inc. | Method and apparatus for rapid measurement of HbA1c |
| US6716396B1 (en) | 1999-05-14 | 2004-04-06 | Gen-Probe Incorporated | Penetrable cap |
| US7056661B2 (en) | 1999-05-19 | 2006-06-06 | Cornell Research Foundation, Inc. | Method for sequencing nucleic acid molecules |
| US6544732B1 (en) | 1999-05-20 | 2003-04-08 | Illumina, Inc. | Encoding and decoding of array sensors utilizing nanocrystals |
| WO2000073413A2 (en) | 1999-05-28 | 2000-12-07 | Cepheid | Apparatus and method for cell disruption |
| US7068361B2 (en) | 1999-06-03 | 2006-06-27 | Baxter International | Apparatus, systems and methods for processing and treating a biological fluid with light |
| US6056661A (en) | 1999-06-14 | 2000-05-02 | General Motors Corporation | Multi-range transmission with input split planetary gear set and continuously variable transmission unit |
| JP2003502655A (en) | 1999-06-22 | 2003-01-21 | アジレント・テクノロジーズ・インコーポレーテッド | Equipment for operating microfluidic devices |
| US7195670B2 (en) | 2000-06-27 | 2007-03-27 | California Institute Of Technology | High throughput screening of crystallization of materials |
| US7951612B2 (en) | 1999-07-08 | 2011-05-31 | Lee H. Angros | In situ heat induced antigen recovery and staining apparatus and method |
| US6244119B1 (en) | 1999-08-03 | 2001-06-12 | Wallac Oy | Multichannel pipette system and pipette tips therefor |
| EP1250602A2 (en) | 1999-08-06 | 2002-10-23 | Thermo Biostar, Inc. | An automated point of care detection system including complete sample processing capabilities |
| DE60035199T2 (en) | 1999-08-11 | 2008-02-14 | Asahi Kasei Kabushiki Kaisha | ANALYSIS CASSETTE AND LIQUID CONVEYOR CONTROLLER |
| JP2001065458A (en) | 1999-08-25 | 2001-03-16 | Matsushita Electric Ind Co Ltd | Compressor |
| US6858185B1 (en) | 1999-08-25 | 2005-02-22 | Caliper Life Sciences, Inc. | Dilutions in high throughput systems with a single vacuum source |
| AU5976699A (en) | 1999-09-09 | 2001-04-10 | Nokia Corporation | Determination of data rate, based on power spectral density estimates |
| US20030175993A1 (en) | 1999-09-10 | 2003-09-18 | Anthony Toranto | Ketone assay |
| CA2384838C (en) | 1999-09-13 | 2006-07-18 | Nugen Technologies, Inc. | Methods and compositions for linear isothermal amplification of polynucleotide sequences |
| DE19944516B4 (en) | 1999-09-16 | 2006-08-17 | Brainlab Ag | Three-dimensional shape detection with camera images |
| US6835184B1 (en) | 1999-09-24 | 2004-12-28 | Becton, Dickinson And Company | Method and device for abrading skin |
| WO2001023610A2 (en) | 1999-09-29 | 2001-04-05 | Solexa Ltd. | Polynucleotide sequencing |
| US6675037B1 (en) | 1999-09-29 | 2004-01-06 | Regents Of The University Of Minnesota | MRI-guided interventional mammary procedures |
| US6368275B1 (en) | 1999-10-07 | 2002-04-09 | Acuson Corporation | Method and apparatus for diagnostic medical information gathering, hyperthermia treatment, or directed gene therapy |
| JP3481578B2 (en) | 1999-10-12 | 2003-12-22 | 松下電器産業株式会社 | Electron-emitting device, electron source using the same, field-emission-type image display device, fluorescent lamp, and manufacturing method thereof |
| US6471916B1 (en) | 1999-11-09 | 2002-10-29 | Packard Instrument Company | Apparatus and method for calibration of a microarray scanning system |
| US6361958B1 (en) | 1999-11-12 | 2002-03-26 | Motorola, Inc. | Biochannel assay for hybridization with biomaterial |
| US6750053B1 (en) | 1999-11-15 | 2004-06-15 | I-Stat Corporation | Apparatus and method for assaying coagulation in fluid samples |
| US6491666B1 (en) | 1999-11-17 | 2002-12-10 | Microchips, Inc. | Microfabricated devices for the delivery of molecules into a carrier fluid |
| JP3441058B2 (en) | 1999-12-03 | 2003-08-25 | 理化学研究所 | Microchip for capillary gel electrophoresis and method for producing the same |
| JP2001165752A (en) | 1999-12-06 | 2001-06-22 | Hitachi Ltd | Instrument and method for measuring serum quantity |
| GB9930000D0 (en) | 1999-12-21 | 2000-02-09 | Phaeton Research Ltd | An ingestible device |
| JP4497335B2 (en) | 1999-12-22 | 2010-07-07 | ベックマン・コールター・インコーポレーテッド | Analysis equipment |
| US7747312B2 (en) | 2000-01-04 | 2010-06-29 | George Mason Intellectual Properties, Inc. | System and method for automatic shape registration and instrument tracking |
| EP1246699B1 (en) | 2000-01-11 | 2007-01-03 | Clinical Micro Sensors, Inc. | Cartridge comprising a biochip |
| WO2001064344A2 (en) | 2000-03-02 | 2001-09-07 | Microchips, Inc. | Microfabricated devices for the storage and selective exposure of chemicals and devices |
| US7041206B2 (en) | 2000-03-09 | 2006-05-09 | Clinical Analysis Corporation | Medical diagnostic system |
| EP1297478A2 (en) | 2000-03-15 | 2003-04-02 | Emedicalfiles, Inc. | Web-hosted healthcare medical information management system |
| DE10013511A1 (en) | 2000-03-20 | 2001-10-11 | Brand Gmbh & Co Kg | Multiple channel pipetting arrangement used for microtitration plates has pipette shafts each having a sealing receiver on the upper end with a plunger seal arranged in it |
| US6488827B1 (en) | 2000-03-31 | 2002-12-03 | Lifescan, Inc. | Capillary flow control in a medical diagnostic device |
| US6413213B1 (en) | 2000-04-18 | 2002-07-02 | Roche Diagnostics Corporation | Subscription based monitoring system and method |
| NZ521840A (en) | 2000-04-28 | 2004-11-26 | St | Development of a multi-plasmid pol I - pol II based system for the generation of infectious influenza RNA viruses from cloned DNA |
| DE10022693C1 (en) | 2000-05-05 | 2001-10-11 | Cybio Instr Gmbh | Automatic pipetting system for filling microtiter plates has single row, multichannel head with mechanism for stripping nozzles from pipettes |
| US20020052761A1 (en) | 2000-05-11 | 2002-05-02 | Fey Christopher T. | Method and system for genetic screening data collection, analysis, report generation and access |
| US7006858B2 (en) | 2000-05-15 | 2006-02-28 | Silver James H | Implantable, retrievable sensors and immunosensors |
| JP2003533682A (en) | 2000-05-15 | 2003-11-11 | テカン・トレーディング・アクチェンゲゼルシャフト | Bidirectional flow centrifugal microfluidic device |
| US6917726B2 (en) | 2001-09-27 | 2005-07-12 | Cornell Research Foundation, Inc. | Zero-mode clad waveguides for performing spectroscopy with confined effective observation volumes |
| US6943035B1 (en) | 2000-05-19 | 2005-09-13 | Genetix Limited | Liquid dispensing apparatus and method |
| IL163684A0 (en) | 2000-05-31 | 2005-12-18 | Given Imaging Ltd | Measurement of electrical characteristics of tissue |
| AU2001265012B2 (en) | 2000-06-01 | 2006-07-13 | Georgetown University | Systems and methods for monitoring health and delivering drugs transdermally |
| WO2001093743A2 (en) | 2000-06-07 | 2001-12-13 | Healthetech, Inc. | Breath ketone analyzer |
| US7276158B1 (en) | 2000-06-09 | 2007-10-02 | Ashok K Shukla | Incision-based filtration/separation pipette tip |
| JP3638503B2 (en) | 2000-06-12 | 2005-04-13 | アークレイ株式会社 | Measuring apparatus, measuring method and recording medium using cartridge type container |
| US6465953B1 (en) | 2000-06-12 | 2002-10-15 | General Electric Company | Plastic substrates with improved barrier properties for devices sensitive to water and/or oxygen, such as organic electroluminescent devices |
| FR2810407B1 (en) | 2000-06-16 | 2002-08-02 | Philippe Escal | APPARATUS FOR THE ANALYSIS OF SAMPLES |
| US6859830B1 (en) | 2000-06-23 | 2005-02-22 | Microsoft Corporation | Method and system for detecting a dead server |
| US6468474B2 (en) | 2000-07-06 | 2002-10-22 | Varian, Inc. | Saliva testing and confirmation device |
| US6603987B2 (en) | 2000-07-11 | 2003-08-05 | Bayer Corporation | Hollow microneedle patch |
| JP2002031055A (en) | 2000-07-14 | 2002-01-31 | Matsushita Electric Ind Co Ltd | Hermetic compressor |
| WO2002007064A2 (en) | 2000-07-17 | 2002-01-24 | Labnetics, Inc. | Method and apparatus for the processing of remotely collected electronic information characterizing properties of biological entities |
| WO2002007598A1 (en) | 2000-07-24 | 2002-01-31 | Motorola, Inc. | Ingestible electronic capsule |
| JP2002044007A (en) | 2000-07-26 | 2002-02-08 | Ricoh Elemex Corp | Portable telephone |
| US20040005582A1 (en) | 2000-08-10 | 2004-01-08 | Nanobiodynamics, Incorporated | Biospecific desorption microflow systems and methods for studying biospecific interactions and their modulators |
| US6905886B2 (en) | 2000-08-11 | 2005-06-14 | Quest Diagnostics Investments Incorporated | Preservative solutions |
| US6797518B1 (en) | 2000-09-11 | 2004-09-28 | Ortho-Clinical Diagnostics, Inc. | Analysis method with sample quality measurement |
| DE10046110B8 (en) | 2000-09-18 | 2006-07-06 | Siemens Ag | Medical diagnostic device with patient recognition |
| AU2002211821A1 (en) | 2000-09-27 | 2002-04-08 | Cobe Cardiovascular, Inc. | Disposable cartridge for a blood perfusion system |
| US6689615B1 (en) | 2000-10-04 | 2004-02-10 | James Murto | Methods and devices for processing blood samples |
| CA2360194C (en) | 2000-10-25 | 2008-10-07 | Micronix, Inc. | A solid state microcuvette using dry films |
| WO2002079762A2 (en) | 2000-10-27 | 2002-10-10 | Dumas David P | Apparatus for fluorescence detection on arrays |
| US20020142483A1 (en) | 2000-10-30 | 2002-10-03 | Sequenom, Inc. | Method and apparatus for delivery of submicroliter volumes onto a substrate |
| US6929636B1 (en) | 2000-11-08 | 2005-08-16 | Hewlett-Packard Development Company, L.P. | Internal drug dispenser capsule medical device |
| WO2002040161A1 (en) | 2000-11-17 | 2002-05-23 | Tecan Trading Ag | Method and device for determining the volume of a sample of a liquid |
| US7026131B2 (en) | 2000-11-17 | 2006-04-11 | Nagaoka & Co., Ltd. | Methods and apparatus for blood typing with optical bio-discs |
| US6905816B2 (en) | 2000-11-27 | 2005-06-14 | Intelligent Medical Devices, Inc. | Clinically intelligent diagnostic devices and methods |
| JP2002161856A (en) | 2000-11-28 | 2002-06-07 | Matsushita Electric Ind Co Ltd | Shaft and manufacturing method therefor |
| US6783649B2 (en) | 2000-12-01 | 2004-08-31 | Cetek Corporation | High throughput capillary electrophoresis system |
| NZ526300A (en) * | 2000-12-12 | 2004-12-24 | Australian Inst Marine Science | Detecting the presence of toxins (PSTs) in marine organisms by biochemical, physiological or chemical assays |
| EP1363736B1 (en) | 2000-12-18 | 2011-03-02 | Protedyne Corporation | Extruding gel material for gel electrophoresis |
| GB0030929D0 (en) | 2000-12-19 | 2001-01-31 | Inverness Medical Ltd | Analyte measurement |
| US6312929B1 (en) | 2000-12-22 | 2001-11-06 | Cepheid | Compositions and methods enabling a totally internally controlled amplification reaction |
| AU2002243360A1 (en) | 2000-12-26 | 2002-08-06 | C. Frederick Battrell | Microfluidic cartridge with integrated electronics |
| US6870797B2 (en) | 2001-01-04 | 2005-03-22 | Hewlett-Packard Development Company, L.P. | Media storage system using a transponder for transmitting data signal |
| US7205157B2 (en) * | 2001-01-08 | 2007-04-17 | Becton, Dickinson And Company | Method of separating cells from a sample |
| CA2366802A1 (en) | 2001-01-17 | 2002-07-17 | Bayer Corporation | Method and apparatus for using infrared readings to detect misidentification of a diagnostic test strip in a reflectance spectrometer |
| US7315784B2 (en) | 2001-02-15 | 2008-01-01 | Siemens Aktiengesellschaft | Network for evaluating data obtained in a biochip measurement device |
| US6484104B2 (en) | 2001-02-15 | 2002-11-19 | Klaus Abraham-Fuchs | Network for evaluating data obtained in a biochip measurement device |
| US7567913B2 (en) | 2001-02-16 | 2009-07-28 | Quest Diagnostics Inc. | Method and system for ordering a laboratory test for a patient and obtaining results thereof |
| US6612985B2 (en) | 2001-02-26 | 2003-09-02 | University Of Rochester | Method and system for monitoring and treating a patient |
| US6899848B1 (en) | 2001-02-27 | 2005-05-31 | Hamilton Company | Automated sample treatment system: apparatus and method |
| US6341490B1 (en) | 2001-03-03 | 2002-01-29 | Gilson, Inc. | Heat transfer apparatus for sample containing well plates |
| US6949377B2 (en) | 2001-03-05 | 2005-09-27 | Ho Winston Z | Chemiluminescence-based microfluidic biochip |
| JP2002266762A (en) | 2001-03-07 | 2002-09-18 | Matsushita Electric Ind Co Ltd | Refrigerating cycle device |
| ZA200210369B (en) | 2001-03-09 | 2004-07-08 | Nugen Technologies Inc | Methods and compositions for amplification or RNA sequences. |
| US6893612B2 (en) | 2001-03-09 | 2005-05-17 | Gen-Probe Incorporated | Penetrable cap |
| JP2002263185A (en) | 2001-03-12 | 2002-09-17 | Sanyo Electric Co Ltd | Medicine administration system and method and medicine administration device |
| US6748337B2 (en) | 2001-03-14 | 2004-06-08 | Wardlaw Partners, Lp | Method and apparatus for providing quality control in an instrument for medical analysis |
| JP2002282217A (en) | 2001-03-27 | 2002-10-02 | Sysmex Corp | Measuring device and result of measurement management system including the device |
| US7010391B2 (en) | 2001-03-28 | 2006-03-07 | Handylab, Inc. | Methods and systems for control of microfluidic devices |
| JP2002291954A (en) | 2001-04-02 | 2002-10-08 | Ntk:Kk | Pin device in driving range |
| US20040044560A1 (en) | 2001-04-05 | 2004-03-04 | Joe Giglio | Kiosk with body fat analyzer |
| US7458483B2 (en) | 2001-04-24 | 2008-12-02 | Abbott Laboratories, Inc. | Assay testing diagnostic analyzer |
| WO2002089767A1 (en) | 2001-05-03 | 2002-11-14 | Massachusetts Eye And Ear Infirmary | Implantable drug delivery device and use thereof |
| US20030211618A1 (en) | 2001-05-07 | 2003-11-13 | Patel Gordhandhai Nathalal | Color changing steam sterilization indicator |
| BR0209540B1 (en) | 2001-05-09 | 2014-01-21 | Examination apparatus, cartridge and device and use of the examination apparatus | |
| US6591124B2 (en) | 2001-05-11 | 2003-07-08 | The Procter & Gamble Company | Portable interstitial fluid monitoring system |
| US20050009101A1 (en) | 2001-05-17 | 2005-01-13 | Motorola, Inc. | Microfluidic devices comprising biochannels |
| US6919046B2 (en) | 2001-06-07 | 2005-07-19 | Nanostream, Inc. | Microfluidic analytical devices and methods |
| JP2002371955A (en) | 2001-06-15 | 2002-12-26 | Sanuki Kogyo Kk | Reciprocating drive unit and liquid transfer pump using the reciprocating drive unit |
| CA2764307C (en) | 2001-06-29 | 2015-03-03 | Meso Scale Technologies, Llc. | Assay plates, reader systems and methods for luminescence test measurements |
| US20030208113A1 (en) | 2001-07-18 | 2003-11-06 | Mault James R | Closed loop glycemic index system |
| US6833441B2 (en) | 2001-08-01 | 2004-12-21 | Abmaxis, Inc. | Compositions and methods for generating chimeric heteromultimers |
| JP3775263B2 (en) | 2001-08-10 | 2006-05-17 | ニプロ株式会社 | Recording medium and blood glucose measurement system using the recording medium |
| WO2003014381A1 (en) | 2001-08-10 | 2003-02-20 | Ahram Biosystems Inc. | System for detecting protease |
| US20030190690A1 (en) * | 2001-08-10 | 2003-10-09 | Mie Takahashi | Biosensor and method for analyzing blood components using it |
| US6636623B2 (en) * | 2001-08-10 | 2003-10-21 | Visiongate, Inc. | Optical projection imaging system and method for automatically detecting cells with molecular marker compartmentalization associated with malignancy and disease |
| US6751491B2 (en) | 2001-09-01 | 2004-06-15 | M Biotech Inc | Analyte measuring biosensor chip using image scanning system |
| US20030052074A1 (en) | 2001-09-17 | 2003-03-20 | Chang Min Shuan | Closure for container for holding biological samples |
| US7854896B2 (en) | 2001-09-25 | 2010-12-21 | Becton, Dickinson And Company | Closed system storage plates |
| JP4754746B2 (en) | 2001-09-28 | 2011-08-24 | オリンパス株式会社 | Rod-shaped carrier and cylinder reaction vessel equipped with the same |
| US6805842B1 (en) | 2001-10-12 | 2004-10-19 | Mds Sciex | Repuncturable self-sealing sample container with internal collapsible bag |
| US20060121502A1 (en) | 2001-11-09 | 2006-06-08 | Robert Cain | Microfluidics apparatus for cantilevers and methods of use therefor |
| JP2003222611A (en) | 2001-11-20 | 2003-08-08 | Nec Corp | Separating apparatus and method therefor, and manufacturing method thereof |
| US7635588B2 (en) | 2001-11-29 | 2009-12-22 | Applied Biosystems, Llc | Apparatus and method for differentiating multiple fluorescence signals by excitation wavelength |
| JP2003166910A (en) | 2001-11-30 | 2003-06-13 | Asahi Kasei Corp | Liquid-feeding mechanism and analyzer provided with the same |
| JP2003167960A (en) | 2001-12-04 | 2003-06-13 | Ikuo Kondo | Health control system |
| US20050027182A1 (en) | 2001-12-27 | 2005-02-03 | Uzair Siddiqui | System for monitoring physiological characteristics |
| US6583879B1 (en) | 2002-01-11 | 2003-06-24 | X-Rite, Incorporated | Benchtop spectrophotometer with improved targeting |
| JP2003207454A (en) | 2002-01-15 | 2003-07-25 | Minolta Co Ltd | Transmission light-detecting apparatus |
| US7133547B2 (en) * | 2002-01-24 | 2006-11-07 | Tripath Imaging, Inc. | Method for quantitative video-microscopy and associated system and computer software program product |
| WO2003065030A1 (en) | 2002-01-25 | 2003-08-07 | Irm, Llc | Fluid handling methods and systems |
| FI112093B (en) | 2002-01-30 | 2003-10-31 | Boreal Plant Breeding Ltd | Method and test kit for demonstrating genetic identity |
| US20040109793A1 (en) | 2002-02-07 | 2004-06-10 | Mcneely Michael R | Three-dimensional microfluidics incorporating passive fluid control structures |
| US7004928B2 (en) | 2002-02-08 | 2006-02-28 | Rosedale Medical, Inc. | Autonomous, ambulatory analyte monitor or drug delivery device |
| US20030212379A1 (en) | 2002-02-26 | 2003-11-13 | Bylund Adam David | Systems and methods for remotely controlling medication infusion and analyte monitoring |
| CA2419200C (en) | 2002-03-05 | 2015-06-30 | Bayer Healthcare Llc | Fluid collection apparatus having an integrated lance and reaction area |
| JP2003315348A (en) | 2002-04-22 | 2003-11-06 | Hitachi High-Technologies Corp | Specimen processing system and specimen inspection automating system using it |
| WO2003090614A1 (en) | 2002-04-25 | 2003-11-06 | Matsushita Electric Industrial Co., Ltd. | Dosage determination supporting device, injector, and health management supporting system |
| JP2003322653A (en) | 2002-05-07 | 2003-11-14 | Toshiba Corp | Support and carrier for fixing probe |
| US20030143113A2 (en) | 2002-05-09 | 2003-07-31 | Lifescan, Inc. | Physiological sample collection devices and methods of using the same |
| JP3839349B2 (en) | 2002-05-15 | 2006-11-01 | 株式会社堀場製作所 | Chemiluminescent enzyme immunoassay device |
| WO2003097808A2 (en) | 2002-05-17 | 2003-11-27 | Becton, Dickinson And Company | Automated system for isolating, amplyifying and detecting a target nucleic acid sequence |
| US7055368B2 (en) | 2002-05-21 | 2006-06-06 | Kendro Laboratory Products, Inc. | Automatic calibration of an imbalance detector |
| CA2489177C (en) | 2002-06-11 | 2013-08-13 | Chempaq A/S | A disposable cartridge for characterizing particles suspended in a liquid |
| US7272252B2 (en) | 2002-06-12 | 2007-09-18 | Clarient, Inc. | Automated system for combining bright field and fluorescent microscopy |
| FR2841249A1 (en) | 2002-06-19 | 2003-12-26 | Genfit S A | COMPOSITIONS AND METHODS FOR THE ASSAY OF APO B48 AND APO B100 |
| JP4106977B2 (en) | 2002-06-21 | 2008-06-25 | 株式会社日立製作所 | Analysis chip and analyzer |
| US6730510B2 (en) | 2002-07-02 | 2004-05-04 | Organogenesis, Inc. | Culture dish and bioreactor system |
| AU2002344910A1 (en) * | 2002-07-12 | 2004-02-02 | Abb Research Ltd | High-resolution absorption spectrometer and corresponding measuring method |
| US7438857B2 (en) | 2002-07-23 | 2008-10-21 | Protedyne Corporation | Liquid handling tool having porous plunger |
| FR2842912B1 (en) | 2002-07-25 | 2004-09-10 | Junior Instruments | PROCESS AND DEVICE FOR THE PRETREATMENT BY CENTRIFUGAL OF SAMPLES. |
| US20040029266A1 (en) | 2002-08-09 | 2004-02-12 | Emilio Barbera-Guillem | Cell and tissue culture device |
| US8200438B2 (en) | 2002-08-19 | 2012-06-12 | Escreen, Inc. | Method and computer program for creating electronic custody and control forms for human assay test samples |
| US6780645B2 (en) | 2002-08-21 | 2004-08-24 | Lifescan, Inc. | Diagnostic kit with a memory storing test strip calibration codes and related methods |
| CN2559986Y (en) | 2002-08-23 | 2003-07-09 | 上海博昇微晶科技有限公司 | Integrated microfluid and microchip of microarray probe |
| US20040038385A1 (en) | 2002-08-26 | 2004-02-26 | Langlois Richard G. | System for autonomous monitoring of bioagents |
| US20070166725A1 (en) | 2006-01-18 | 2007-07-19 | The Regents Of The University Of California | Multiplexed diagnostic platform for point-of care pathogen detection |
| US7188731B2 (en) | 2002-08-26 | 2007-03-13 | The Regents Of The University Of California | Variable flexure-based fluid filter |
| JP2004101381A (en) * | 2002-09-10 | 2004-04-02 | Nittec Co Ltd | Double path cell for automatic analyzer, and analysis method using the double path cell |
| ATE414792T1 (en) | 2002-09-20 | 2008-12-15 | New England Biolabs Inc | HELICASE-DEPENDENT AMPLIFICATION OF NUCLEIC ACIDS |
| US7177767B2 (en) | 2002-10-18 | 2007-02-13 | Abaxis, Inc. | Systems and methods for the detection of short and long samples |
| US7390457B2 (en) | 2002-10-31 | 2008-06-24 | Agilent Technologies, Inc. | Integrated microfluidic array device |
| US20040086872A1 (en) | 2002-10-31 | 2004-05-06 | Childers Winthrop D. | Microfluidic system for analysis of nucleic acids |
| US20040115720A1 (en) | 2002-11-08 | 2004-06-17 | Mcwilliams Diana R. | High throughput automatic nucleic acid isolation and quantitation methods |
| US6915919B2 (en) | 2002-11-21 | 2005-07-12 | American Bio Medica Corporation | Container closure cap with self-sealing slot |
| JP3799323B2 (en) | 2002-11-29 | 2006-07-19 | Necインフロンティア株式会社 | Information terminal device and PC card |
| WO2004055198A2 (en) | 2002-12-12 | 2004-07-01 | Chiron Corporation | Device and method for in-line blood testing using biochips |
| CN1173182C (en) | 2002-12-18 | 2004-10-27 | 陕西超英生物医学研究开发有限公司 | Albumen chip for detecting autoimmunity antibody of diabetes, as well as preparation and detection method |
| US20060094108A1 (en) | 2002-12-20 | 2006-05-04 | Karl Yoder | Thermal cycler for microfluidic array assays |
| US7648678B2 (en) | 2002-12-20 | 2010-01-19 | Dako Denmark A/S | Method and system for pretreatment of tissue slides |
| US20040120848A1 (en) | 2002-12-20 | 2004-06-24 | Maria Teodorczyk | Method for manufacturing a sterilized and calibrated biosensor-based medical device |
| WO2004059312A1 (en) | 2002-12-20 | 2004-07-15 | Corning Incorporated | Capillary assay device and method |
| CA2941139C (en) | 2002-12-26 | 2021-07-20 | Meso Scale Technologies, Llc. | Assay cartridges and methods of using the same |
| DE10307030A1 (en) | 2003-02-20 | 2004-09-09 | Eppendorf Ag | dosing |
| GB0303913D0 (en) * | 2003-02-21 | 2003-03-26 | Sophion Bioscience As | Robot centrifugation device |
| DE10312197A1 (en) | 2003-03-19 | 2004-09-30 | Roche Diagnostics Gmbh | Sample treatment device, in particular automatic analysis device |
| JP4464172B2 (en) | 2003-03-31 | 2010-05-19 | キヤノン株式会社 | Biochemical reaction cartridge and method of using the same |
| CN1767899A (en) | 2003-04-04 | 2006-05-03 | 皇家飞利浦电子股份有限公司 | Fluid partitioning in multiple microchannels |
| US20050010098A1 (en) | 2003-04-11 | 2005-01-13 | Sigmund Frigstad | Method and apparatus for knowledge based diagnostic imaging |
| JP4260541B2 (en) | 2003-05-12 | 2009-04-30 | 旭化成ファーマ株式会社 | Test piece for measuring glycated protein |
| US20040230400A1 (en) | 2003-05-13 | 2004-11-18 | Tomasso David Angelo | Analyzer having concentric rotors |
| US20040228766A1 (en) | 2003-05-14 | 2004-11-18 | Witty Thomas R. | Point of care diagnostic platform |
| AU2003902422A0 (en) | 2003-05-19 | 2003-06-05 | Intellirad Solutions Pty. Ltd | Access security system |
| US7185551B2 (en) | 2003-05-22 | 2007-03-06 | Schwartz H Donald | Pipetting module |
| US20040241048A1 (en) | 2003-05-30 | 2004-12-02 | Applera Corporation | Thermal cycling apparatus and method for providing thermal uniformity |
| WO2004108270A2 (en) | 2003-06-05 | 2004-12-16 | Bioprocessors Corp. | System and method for process automation |
| US7258673B2 (en) | 2003-06-06 | 2007-08-21 | Lifescan, Inc | Devices, systems and methods for extracting bodily fluid and monitoring an analyte therein |
| US7604592B2 (en) | 2003-06-13 | 2009-10-20 | Pelikan Technologies, Inc. | Method and apparatus for a point of care device |
| US7702524B1 (en) | 2003-06-16 | 2010-04-20 | Scheduling.Com, Inc. | Method and system for online secure patient referral system |
| KR20060024808A (en) * | 2003-06-20 | 2006-03-17 | 유니바사루 바이오 리사치 가부시키가이샤 | Sample arraying/assembling device, its method, and apparatus using sample assembly |
| JP3566277B1 (en) * | 2003-06-23 | 2004-09-15 | 株式会社日立製作所 | Blood glucose meter |
| JP3918178B2 (en) | 2003-06-23 | 2007-05-23 | 大阪瓦斯株式会社 | Manufacturing method of high purity nanoscale carbon tube containing carbonaceous material |
| US7824623B2 (en) | 2003-06-24 | 2010-11-02 | Millipore Corporation | Multifunctional vacuum manifold |
| US20050009191A1 (en) | 2003-07-08 | 2005-01-13 | Swenson Kirk D. | Point of care information management system |
| JP2005030983A (en) | 2003-07-09 | 2005-02-03 | Matsushita Electric Ind Co Ltd | Measuring instrument |
| JP4087302B2 (en) | 2003-07-10 | 2008-05-21 | 日本電子株式会社 | Inspection device |
| WO2005008255A1 (en) | 2003-07-17 | 2005-01-27 | Mitsubishi Kagaku Iatron, Inc. | Cartridge for automatic measurement and measuring device using the same |
| US7860727B2 (en) | 2003-07-17 | 2010-12-28 | Ventana Medical Systems, Inc. | Laboratory instrumentation information management and control network |
| US7381370B2 (en) | 2003-07-18 | 2008-06-03 | Dade Behring Inc. | Automated multi-detector analyzer |
| JP3888342B2 (en) | 2003-08-29 | 2007-02-28 | ブラザー工業株式会社 | Network equipment |
| US9133024B2 (en) | 2003-09-03 | 2015-09-15 | Brigitte Chau Phan | Personal diagnostic devices including related methods and systems |
| US20060292039A1 (en) | 2003-09-05 | 2006-12-28 | Kazuhiro Iida | Measuring system |
| EP2489437A1 (en) | 2003-09-09 | 2012-08-22 | BioGenex Laboratories | Sample processing system |
| US20050074873A1 (en) | 2003-09-09 | 2005-04-07 | Shanler Michael S. | Tissue culture vessel |
| US7682833B2 (en) | 2003-09-10 | 2010-03-23 | Abbott Point Of Care Inc. | Immunoassay device with improved sample closure |
| EP3851030B1 (en) | 2003-09-11 | 2024-01-17 | Labrador Diagnostics LLC | Medical device for analyte monitoring |
| US20060115384A1 (en) | 2003-09-16 | 2006-06-01 | Vici Gig Harbor Group, Inc. | Pipette tip surface sorption extraction |
| US7570443B2 (en) | 2003-09-19 | 2009-08-04 | Applied Biosystems, Llc | Optical camera alignment |
| US20050225751A1 (en) | 2003-09-19 | 2005-10-13 | Donald Sandell | Two-piece high density plate |
| DE10344700A1 (en) | 2003-09-26 | 2005-04-14 | Hirschmann Laborgeräte GmbH & Co. KG | Multichannel pipetting |
| JP2005104750A (en) | 2003-09-29 | 2005-04-21 | Matsushita Electric Ind Co Ltd | Method for refining nanotube |
| EP1520514A1 (en) * | 2003-10-02 | 2005-04-06 | Matsushita Electric Industrial Co., Ltd. | Optical biological information measuring apparatus and method |
| JP4441618B2 (en) | 2003-10-06 | 2010-03-31 | 独立行政法人産業技術総合研究所 | How to detect influenza virus |
| WO2005037293A1 (en) | 2003-10-16 | 2005-04-28 | Univ Monash | Immunomodulating compositions and uses therefor |
| PT1678509E (en) | 2003-10-28 | 2008-06-20 | Diesse Diagnostica Senese Spa | Device for performing analyses on biological fluids and related method |
| JP4073023B2 (en) | 2003-11-07 | 2008-04-09 | 財団法人新産業創造研究機構 | Microchannel device and manufacturing method thereof |
| EP1694210B1 (en) | 2003-11-26 | 2012-03-28 | Koninklijke Philips Electronics N.V. | Workflow optimization for high throughput imaging environment |
| WO2005121780A2 (en) | 2003-12-09 | 2005-12-22 | Board Of Regents, The University Of Texas System | Methods and apparatus for characterizing, measuring, and dispensing fluids |
| WO2005065157A2 (en) | 2003-12-23 | 2005-07-21 | Fastraq, Inc. | Point of care diagnostic platform |
| US20070148759A1 (en) | 2003-12-26 | 2007-06-28 | Yoshinori Amano | Biological sample discrimination device, biological sample discriminating method, and biological sample discriminating plate |
| JP4057539B2 (en) * | 2004-01-09 | 2008-03-05 | 浜松ホトニクス株式会社 | Sheath flow cell cuvette and manufacturing method thereof |
| US7150995B2 (en) | 2004-01-16 | 2006-12-19 | Metrika, Inc. | Methods and systems for point of care bodily fluid analysis |
| PL1709750T3 (en) | 2004-01-27 | 2015-03-31 | Altivera L L C | Diagnostic radio frequency identification sensors and applications thereof |
| US20050164204A1 (en) | 2004-01-27 | 2005-07-28 | Reed Thomas D. | Single use lyophilized rnase reagents, and kits and methods for using same |
| US20050227370A1 (en) | 2004-03-08 | 2005-10-13 | Ramel Urs A | Body fluid analyte meter & cartridge system for performing combined general chemical and specific binding assays |
| JP2005291954A (en) | 2004-03-31 | 2005-10-20 | Olympus Corp | Disposable reagent pack and analyzer using the reagent pack |
| EP1582874B1 (en) | 2004-03-31 | 2008-07-09 | Roche Diagnostics GmbH | Modular analysing apparatus |
| WO2005100980A2 (en) | 2004-04-06 | 2005-10-27 | Bio/Data Corporation | Disposable test device with sample volume measurement and mixing methods |
| US20080166753A1 (en) | 2004-04-12 | 2008-07-10 | University Technologies International Inc. | Microbial Growth Assay |
| US20050236317A1 (en) | 2004-04-23 | 2005-10-27 | Millipore Corporation | Pendant drop control in a multiwell plate |
| US7887750B2 (en) | 2004-05-05 | 2011-02-15 | Bayer Healthcare Llc | Analytical systems, devices, and cartridges therefor |
| EP1751314B1 (en) | 2004-05-13 | 2019-09-18 | Nanobiosym, Inc. | Nano-pcr: methods and devices for nucleic acid amplification and detection |
| US8323564B2 (en) | 2004-05-14 | 2012-12-04 | Honeywell International Inc. | Portable sample analyzer system |
| FR2871150B1 (en) | 2004-06-04 | 2006-09-22 | Univ Lille Sciences Tech | DROP HANDLING DEVICE FOR BIOCHEMICAL ANALYSIS, DEVICE MANUFACTURING METHOD, AND MICROFLUIDIC ANALYSIS SYSTEM |
| US8211386B2 (en) | 2004-06-08 | 2012-07-03 | Biokit, S.A. | Tapered cuvette and method of collecting magnetic particles |
| TWI356036B (en) * | 2004-06-09 | 2012-01-11 | Smithkline Beecham Corp | Apparatus and method for pharmaceutical production |
| EP1766417B1 (en) | 2004-06-14 | 2013-04-03 | Parker-Hannifin Corporation | Robotic handling system and method with independently operable detachable tools |
| JP4416579B2 (en) | 2004-06-23 | 2010-02-17 | 株式会社日立ハイテクノロジーズ | Automatic analyzer |
| US20060057559A1 (en) | 2004-06-23 | 2006-03-16 | Rigel Pharmaceuticals, Inc. | High-throughput cell migration screening assay |
| US7609654B2 (en) | 2004-07-01 | 2009-10-27 | Mcdata Corporation | Method of evaluating network connectivity between network resources |
| CN1981189B (en) | 2004-07-02 | 2010-10-06 | 皇家飞利浦电子股份有限公司 | Spectroscopic system with multiple probes |
| US8886272B2 (en) | 2004-07-13 | 2014-11-11 | Dexcom, Inc. | Analyte sensor |
| US7196719B2 (en) | 2004-07-16 | 2007-03-27 | Vision Robotics Corporation | Angled axis machine vision system and method |
| EP1775574B1 (en) | 2004-07-27 | 2018-03-14 | LSI Medience Corporation | Method for automatic determination of sample |
| US20060026040A1 (en) | 2004-07-28 | 2006-02-02 | Reeves Anthony P | System and method for providing remote analysis of medical data |
| EP1626281A1 (en) | 2004-08-03 | 2006-02-15 | The Automation Partnership (Cambridge) Limited | Pipetting device |
| US7690275B1 (en) | 2004-08-26 | 2010-04-06 | Elemental Scientific, Inc. | Automated sampling device |
| JP4943334B2 (en) | 2004-09-02 | 2012-05-30 | バイオニア コーポレイション | Compact real-time monitoring device |
| CN1311239C (en) | 2004-09-07 | 2007-04-18 | 李人 | Immune chromatograph testing strip and production thereof |
| US7170050B2 (en) | 2004-09-17 | 2007-01-30 | Pacific Biosciences Of California, Inc. | Apparatus and methods for optical analysis of molecules |
| US7744821B2 (en) | 2004-09-21 | 2010-06-29 | Andreas Hettich Gmbh & Co. Kg | Blood bag cup for centrifuges |
| AT500882A3 (en) | 2004-10-06 | 2009-12-15 | Greiner Bio One Gmbh | IN-VITRO DIAGNOSTICS FOR STORAGE VOLUME DETERMINATION |
| JP2006125855A (en) | 2004-10-26 | 2006-05-18 | Kusano Kagaku:Kk | Dispenser |
| US20060095429A1 (en) | 2004-10-29 | 2006-05-04 | Eastman Kodak Company | Networked system for routing medical images |
| JP4424158B2 (en) * | 2004-11-04 | 2010-03-03 | ソニー株式会社 | Bioassay device and bioassay method |
| US7604985B2 (en) | 2004-11-10 | 2009-10-20 | Becton, Dickinson And Company | System and method for determining fill volume in a container |
| US20120053068A1 (en) | 2004-11-18 | 2012-03-01 | Eppendorf Array Technologies | Real-time pcr of targets on a micro-array |
| US20060111620A1 (en) | 2004-11-23 | 2006-05-25 | Squilla John R | Providing medical services at a kiosk |
| WO2006057768A2 (en) * | 2004-11-24 | 2006-06-01 | Battelle Memorial Institute | Optical system for cell imaging |
| KR100601974B1 (en) | 2004-11-25 | 2006-07-18 | 삼성전자주식회사 | Apparatus and method for the purification of nucleic acids by different laser absorption of beads |
| KR100581356B1 (en) | 2004-11-25 | 2006-05-17 | 재단법인서울대학교산학협력재단 | Microchips for use in cytometry, velocimetry and cell sorting using polyelectrolytic salt bridges |
| US20060121491A1 (en) | 2004-12-02 | 2006-06-08 | Wolber Paul K | Partially degenerate oligonucleotide standards and methods for generating the same |
| US7479391B2 (en) * | 2004-12-10 | 2009-01-20 | Tecan Trading Ag | Pipetting apparatus with integrated liquid level and/or gas bubble detection |
| RU2400733C2 (en) * | 2004-12-13 | 2010-09-27 | Байер Хелткэр Ллк | Transmission spectroscopy system for use in determining analysed substances in body fluids |
| US7978665B1 (en) | 2004-12-13 | 2011-07-12 | Verizon Laboratories Inc. | Systems and methods for providing connection status and location information in a wireless networking environment |
| ITMI20042434A1 (en) | 2004-12-21 | 2005-03-21 | Paolo Giordano | METHOD AND DEVICE FOR QUICK EXTRACTION OF ANTIGENS |
| JP4203469B2 (en) | 2004-12-24 | 2009-01-07 | アロカ株式会社 | Liquid sample stirring device |
| US20080206751A1 (en) | 2005-01-26 | 2008-08-28 | Enigma Diagnostics Ltd | Method For Carrying Out A Multi-Step Reaction, Breakable Container For Storing Reagents And Method For Transferring Solid Reagent Using An Electrostatically Charged Wand |
| US8614101B2 (en) | 2008-05-20 | 2013-12-24 | Rapid Pathogen Screening, Inc. | In situ lysis of cells in lateral flow immunoassays |
| US20060195045A1 (en) | 2005-02-14 | 2006-08-31 | Gable Jennifer H | Fluid handling cassette having a fluid transport network |
| WO2006087574A2 (en) | 2005-02-19 | 2006-08-24 | Geneform Technologies Limited | Isothermal nucleic acid amplification |
| GB0503836D0 (en) | 2005-02-24 | 2005-04-06 | Axis Shield Asa | Method |
| JP2006276003A (en) | 2005-03-03 | 2006-10-12 | Juki Corp | Dispensing device |
| CA2600934A1 (en) | 2005-03-07 | 2006-09-14 | Novx Systems Inc. | Automated analyzer |
| US7932081B2 (en) | 2005-03-10 | 2011-04-26 | Gen-Probe Incorporated | Signal measuring system for conducting real-time amplification assays |
| US7650395B2 (en) | 2005-03-18 | 2010-01-19 | Microsoft Corporation | Network connectivity management |
| US20060223178A1 (en) | 2005-04-05 | 2006-10-05 | Tom Barber | Devices and methods for magnetic enrichment of cells and other particles |
| EP3827747A1 (en) | 2005-04-28 | 2021-06-02 | Otsuka Pharmaceutical Co., Ltd. | Pharma-informatics system |
| GB2425974A (en) | 2005-05-09 | 2006-11-15 | Orion Diagnostica Oy | Sonication of a medium |
| US20060264783A1 (en) | 2005-05-09 | 2006-11-23 | Holmes Elizabeth A | Systems and methods for monitoring pharmacological parameters |
| WO2006121997A2 (en) | 2005-05-09 | 2006-11-16 | Idaho Technology, Inc. | Self-contained biological analysis |
| IES20050304A2 (en) | 2005-05-11 | 2006-11-15 | Haemoglobal Biotech Ltd | A mobile chemistry and haematology analyser with an intergrated diagnostic databank |
| JP4520359B2 (en) | 2005-05-13 | 2010-08-04 | 日立ソフトウエアエンジニアリング株式会社 | Particle capturing device, particle arranging method and particle arranging device |
| JP4657803B2 (en) | 2005-05-19 | 2011-03-23 | 富士フイルム株式会社 | Liquid feeding system, liquid feeding method and flow path unit. |
| GB0510362D0 (en) * | 2005-05-20 | 2005-06-29 | Univ Greenwich | Device for detecting mycotoxins |
| US20070031283A1 (en) | 2005-06-23 | 2007-02-08 | Davis Charles Q | Assay cartridges and methods for point of care instruments |
| EP2508867A1 (en) | 2005-06-24 | 2012-10-10 | Board Of Regents, The University Of Texas System | Systems and methods including self-contained cartridges with detection systems and fluid delivery systems |
| US20070004577A1 (en) | 2005-06-29 | 2007-01-04 | Gabor Lederer | Centrifuge assembly |
| US7663750B2 (en) | 2005-06-30 | 2010-02-16 | Applied Biosystems, Llc | Two-dimensional spectral imaging system |
| JP2007017354A (en) | 2005-07-08 | 2007-01-25 | Sumitomo Bakelite Co Ltd | Chemical reaction detecting system |
| JP2007024851A (en) | 2005-07-16 | 2007-02-01 | Adobic:Kk | Analyte assay chip and its usage |
| US7422554B2 (en) | 2005-08-10 | 2008-09-09 | The Drucker Company, Inc. | Centrifuge with aerodynamic rotor and bucket design |
| BRPI0621957A2 (en) | 2005-08-24 | 2011-12-27 | Telechemistry Oy | Method for testing a liquid sample, test unit and an automated system of a plurality of test units |
| JPWO2007037410A1 (en) * | 2005-09-30 | 2009-04-16 | パルスイムノテック株式会社 | Method for measuring affinity substance in sample including step of destroying blood cell component |
| FR2891625B1 (en) | 2005-10-03 | 2007-12-21 | Francois Melet | COMPACT DRY BIOCHEMISTRY ANALYZER FOR ANALYSIS OF BLOOD SAMPLES. |
| US7733224B2 (en) | 2006-06-30 | 2010-06-08 | Bao Tran | Mesh network personal emergency response appliance |
| US8652421B2 (en) | 2005-11-03 | 2014-02-18 | Emd Millipore Corporation | Immunoassay product and process |
| US7581660B2 (en) | 2005-11-09 | 2009-09-01 | Hamilton Bonaduz Ag | Drip-resistant pipetting device and drip-resistant pipetting method |
| GB0523231D0 (en) * | 2005-11-15 | 2005-12-21 | Redfern Jonathan | Liquid photometer using disposable pipette tip vessel |
| US20070118399A1 (en) | 2005-11-22 | 2007-05-24 | Avinash Gopal B | System and method for integrated learning and understanding of healthcare informatics |
| WO2007064597A2 (en) | 2005-11-28 | 2007-06-07 | Pacific Biosciences Of California, Inc. | Uniform surfaces for hybrid material substrates and methods for making and using same |
| GB2432660A (en) | 2005-11-29 | 2007-05-30 | Bacterioscan Ltd | System for counting bacteria and determining their susceptibility to antibiotics |
| JP2007152157A (en) | 2005-11-30 | 2007-06-21 | Hitachi Koki Co Ltd | Centrifuge |
| US20070125677A1 (en) | 2005-12-06 | 2007-06-07 | Neil Oronsky | Thermal and/or light protective container assemblies and their methods of use |
| CN101389960B (en) | 2005-12-21 | 2013-03-27 | 梅索斯卡莱科技公司 | Assay modules having assay reagents and methods of making and using same |
| CN101379404A (en) * | 2005-12-22 | 2009-03-04 | 霍尼韦尔国际公司 | Haematology analyzer system with mobile case |
| JP2007178328A (en) | 2005-12-28 | 2007-07-12 | Shimadzu Corp | Reaction container kit and reaction container treatment apparatus |
| EP1966366A4 (en) | 2005-12-29 | 2011-06-15 | I Stat Corp | Molecular diagnostics amplification system and methods |
| US8030080B2 (en) | 2006-01-18 | 2011-10-04 | Argos Therapeutics, Inc. | Systems and methods for processing samples in a closed container, and related devices |
| US7876935B2 (en) | 2006-01-30 | 2011-01-25 | Protedyne Corporation | Sample processing apparatus with a vision system |
| US7711800B2 (en) | 2006-01-31 | 2010-05-04 | Microsoft Corporation | Network connectivity determination |
| WO2007092713A2 (en) | 2006-02-02 | 2007-08-16 | Trustees Of The University Of Pennsylvania | Microfluidic system and method for analysis of gene expression in cell-containing samples and detection of disease |
| US20070192138A1 (en) | 2006-02-16 | 2007-08-16 | Motoaki Saito | Medical record system in a wide-area network environment |
| CN101400297A (en) | 2006-03-10 | 2009-04-01 | 哈达斯·莱维 | Method and system for automated sampling and analysis using a personal sampler device |
| JP5053256B2 (en) | 2006-03-14 | 2012-10-17 | 株式会社根本杏林堂 | Medical imaging system |
| JP5415253B2 (en) | 2006-03-24 | 2014-02-12 | ハンディラブ・インコーポレーテッド | Integrated system for processing microfluidic samples and methods of use thereof |
| US8741230B2 (en) | 2006-03-24 | 2014-06-03 | Theranos, Inc. | Systems and methods of sample processing and fluid control in a fluidic system |
| CA2645065A1 (en) | 2006-04-24 | 2007-11-08 | Richard Fuisz | Bodily fluid analyzer, and system including same and method for programming same |
| CA2643767A1 (en) | 2006-05-03 | 2007-11-08 | Ncl New Concept Lab Gmbh | Device and method for chemical, biochemical, biological and physical analysis, reaction, assay and more |
| US8007999B2 (en) | 2006-05-10 | 2011-08-30 | Theranos, Inc. | Real-time detection of influenza virus |
| CA2657970A1 (en) | 2006-05-17 | 2007-11-29 | Luminex Corporation | Chip-based flow cytometer type systems for analyzing fluorescently tagged particles |
| US8232091B2 (en) | 2006-05-17 | 2012-07-31 | California Institute Of Technology | Thermal cycling system |
| JP2007309889A (en) | 2006-05-22 | 2007-11-29 | Olympus Corp | Foreign matter detector and foreign matter detecting method |
| JP2007322324A (en) | 2006-06-02 | 2007-12-13 | Olympus Corp | Analyzer |
| EP2030013B1 (en) | 2006-06-06 | 2009-12-16 | Roche Diagnostics GmbH | Ready-to-use whole blood collection vessel |
| KR100772969B1 (en) * | 2006-06-08 | 2007-11-02 | 양현진 | Centrifuge and centrifuging method |
| US20080026483A1 (en) | 2006-06-14 | 2008-01-31 | Oldenburg Kevin R | Thermal-cycling devices and methods of using the same |
| JP2008002897A (en) * | 2006-06-21 | 2008-01-10 | Olympus Corp | Distributor and autoanalyzer |
| ATE552505T1 (en) * | 2006-06-30 | 2012-04-15 | Univ Southern California | QUANTIFIABLE INTERNAL REFERENCE STANDARDS FOR IMMUNOHISTOCHEMISTRY AND USE |
| US7972786B2 (en) | 2006-07-07 | 2011-07-05 | Brandeis University | Detection and analysis of influenza virus |
| JP2009544083A (en) | 2006-07-13 | 2009-12-10 | アイ−スタット コーポレイション | System and method for medical data acquisition and patient management |
| SE531041C2 (en) * | 2006-07-17 | 2008-11-25 | Hemocue Ab | Platelet count |
| SE530192C2 (en) | 2006-07-19 | 2008-03-25 | Hemocue Ab | Apparatus for imaging samples where the sample holder is removable by magnetic interaction |
| DE102006034245C5 (en) | 2006-07-21 | 2014-05-28 | Stratec Biomedical Systems Ag | Positioning device for positioning pipettes |
| EP1882948A2 (en) | 2006-07-28 | 2008-01-30 | Qiagen GmbH | Sample processing device |
| ES2629330T3 (en) * | 2006-08-22 | 2017-08-08 | Sysmex Corporation | Sample Analyzer |
| JP4979305B2 (en) | 2006-08-22 | 2012-07-18 | シスメックス株式会社 | Analysis equipment |
| JP2008064701A (en) | 2006-09-11 | 2008-03-21 | Matsushita Electric Ind Co Ltd | A device for rotational analysis, measurement method, and testing method |
| JP5221549B2 (en) | 2006-10-12 | 2013-06-26 | コーニンクレッカ フィリップス エレクトロニクス エヌ ヴィ | High-speed biosensor with reagent layer |
| US7662344B2 (en) | 2006-10-24 | 2010-02-16 | Viaflo Corporation | Locking pipette tip and mounting shaft |
| US7312042B1 (en) | 2006-10-24 | 2007-12-25 | Abbott Diabetes Care, Inc. | Embossed cell analyte sensor and methods of manufacture |
| US7662343B2 (en) | 2006-10-24 | 2010-02-16 | Viaflo Corporation | Locking pipette tip and mounting shaft |
| US20110001036A1 (en) | 2006-10-24 | 2011-01-06 | Koninklijke Philips Electronics N.V. | system for imaging an object |
| US7910354B2 (en) | 2006-10-27 | 2011-03-22 | Complete Genomics, Inc. | Efficient arrays of amplified polynucleotides |
| WO2008055257A2 (en) | 2006-11-02 | 2008-05-08 | Vectrant Technologies Inc. | Cartridge for conducting diagnostic assays |
| DE102006057300A1 (en) | 2006-12-05 | 2008-06-19 | Siemens Ag | Arrangement for processing a plurality of samples for analysis |
| WO2008077007A1 (en) * | 2006-12-19 | 2008-06-26 | Cytyc Corporation | Method for analyzing blood content of cytological specimens |
| GB0625595D0 (en) | 2006-12-21 | 2007-01-31 | Oxford Gene Tech Ip Ltd | Sample analyser |
| US7955867B2 (en) | 2007-01-31 | 2011-06-07 | Millipore Corporation | High throughput cell-based assays, methods of use and kits |
| US20100323404A1 (en) | 2007-02-09 | 2010-12-23 | Richard Lathrop | Method for recombining dna sequences and compositions related thereto |
| US20090137047A1 (en) | 2007-03-02 | 2009-05-28 | John Frederick Regan | Automated Diagnostic Kiosk for Diagnosing Diseases |
| US20080228107A1 (en) | 2007-03-12 | 2008-09-18 | Venkateshwara N Reddy | Bio-testing booth |
| US8143554B2 (en) | 2007-03-16 | 2012-03-27 | Amerigon Incorporated | Air warmer |
| US20090227005A1 (en) | 2007-03-27 | 2009-09-10 | Searete Llc, A Limited Liability Corporation Of The State Of Delaware | Methods for pathogen detection |
| US20080243394A1 (en) | 2007-03-27 | 2008-10-02 | Theranostics Llc | System, method and computer program product for manipulating theranostic assays |
| US8557588B2 (en) * | 2007-03-27 | 2013-10-15 | Schlumberger Technology Corporation | Methods and apparatus for sampling and diluting concentrated emulsions |
| GB0706281D0 (en) | 2007-03-30 | 2007-05-09 | Guy S And St Thomas Nhs Founda | Apparatus and method for recovering fluid from a fluid absorbing element |
| US8877507B2 (en) | 2007-04-06 | 2014-11-04 | Qiagen Gaithersburg, Inc. | Ensuring sample adequacy using turbidity light scattering techniques |
| US8387811B2 (en) | 2007-04-16 | 2013-03-05 | Bd Diagnostics | Pierceable cap having piercing extensions |
| CN101681455A (en) | 2007-04-23 | 2010-03-24 | 三星电子株式会社 | Remote medical-diagnosis system and method |
| US20100174181A1 (en) | 2007-05-30 | 2010-07-08 | Nemoto Kyorindo Co., Ltd. | Liquid injector, fluoroscopic imaging system, and computer program |
| JP4876027B2 (en) | 2007-05-30 | 2012-02-15 | 株式会社日立ハイテクノロジーズ | Dispensing device |
| EP2000528A1 (en) | 2007-06-04 | 2008-12-10 | The Automation Partnership (Cambridge) Limited | Shaking apparatus for cell culture incubator or the like |
| AU2008265610B2 (en) | 2007-06-21 | 2012-08-23 | Gen-Probe Incorporated | Instrument and receptacles for performing processes |
| JP4982266B2 (en) | 2007-06-22 | 2012-07-25 | 株式会社日立ハイテクノロジーズ | Dispensing processing device |
| US20090004754A1 (en) | 2007-06-26 | 2009-01-01 | Oldenburg Kevin R | Multi-well reservoir plate and methods of using same |
| US9186677B2 (en) | 2007-07-13 | 2015-11-17 | Handylab, Inc. | Integrated apparatus for performing nucleic acid extraction and diagnostic testing on multiple biological samples |
| US8287820B2 (en) | 2007-07-13 | 2012-10-16 | Handylab, Inc. | Automated pipetting apparatus having a combined liquid pump and pipette head system |
| US8133671B2 (en) | 2007-07-13 | 2012-03-13 | Handylab, Inc. | Integrated apparatus for performing nucleic acid extraction and diagnostic testing on multiple biological samples |
| US20090148941A1 (en) | 2007-07-30 | 2009-06-11 | Peter Florez | Disposable mini-bioreactor device and method |
| GB0715171D0 (en) | 2007-08-03 | 2007-09-12 | Enigma Diagnostics Ltd | Sample processor |
| US8158430B1 (en) | 2007-08-06 | 2012-04-17 | Theranos, Inc. | Systems and methods of fluidic sample processing |
| EP2860247A1 (en) | 2007-08-21 | 2015-04-15 | Nodality, Inc. | Methods for diagnosis, prognosis and methods of treatment |
| US7843560B2 (en) | 2007-08-31 | 2010-11-30 | Dow Global Technologies Inc. | Stable turbidity calibration standards |
| US8783484B2 (en) | 2007-08-31 | 2014-07-22 | Saint-Gobain Performance Plastics Corporation | Septa |
| JP5451623B2 (en) * | 2007-10-03 | 2014-03-26 | スリーエム イノベイティブ プロパティズ カンパニー | Microbial concentration process |
| US9083722B2 (en) | 2007-10-05 | 2015-07-14 | Qualcomm Incorporated | Session initiation protocol registration with ping |
| CN104777291B (en) | 2007-10-10 | 2017-09-12 | 普凯尔德诊断技术有限公司 | System for identifying bacterium in urine |
| US7947234B2 (en) | 2007-10-17 | 2011-05-24 | Rainin Instrument, Llc | Liquid end assembly for a handheld multichannel pipette with adjustable nozzle spacing |
| CA2703526A1 (en) | 2007-10-23 | 2009-04-30 | Lotus Bio (Nymphaea) Ltd. | Biologic sample assay device |
| AU2008317329B2 (en) | 2007-10-24 | 2014-10-02 | Biomarker Strategies, Llc | Improved methods and devices for cellular analysis |
| US20090117009A1 (en) | 2007-11-02 | 2009-05-07 | Richard Cote | Multi-channel electronic pipettor |
| US20090124284A1 (en) | 2007-11-14 | 2009-05-14 | Shimon Scherzer | System and method for providing seamless broadband internet access to web applications |
| US8057376B2 (en) * | 2007-12-18 | 2011-11-15 | Caridianbct, Inc. | Blood processing apparatus with sealed diffuser in optical control apparatus |
| CN101925821B (en) | 2008-01-22 | 2014-09-24 | 株式会社岛津制作所 | Measurement device and liquid collection/measurement system provided therewith |
| US20090204435A1 (en) | 2008-01-31 | 2009-08-13 | Brian Gale | System for automating medical imaging diagnostic service delivery |
| WO2009099512A2 (en) * | 2008-02-04 | 2009-08-13 | Micropoint Biosciences, Inc. | Centrifugal fluid analyzer rotor |
| CN110967298A (en) | 2008-02-05 | 2020-04-07 | 普凯尔德诊断技术有限公司 | System for identifying bacteria in biological samples |
| US8034568B2 (en) | 2008-02-12 | 2011-10-11 | Nugen Technologies, Inc. | Isothermal nucleic acid amplification methods and compositions |
| WO2009111316A2 (en) | 2008-02-29 | 2009-09-11 | Northwestern University | Barriers for facilitating biological reactions |
| JP5198094B2 (en) | 2008-03-07 | 2013-05-15 | シスメックス株式会社 | Analysis equipment |
| US7850917B2 (en) | 2008-03-11 | 2010-12-14 | Ortho-Clinical Diagnostics, Inc. | Particle agglutination in a tip |
| JP5511095B2 (en) | 2008-03-20 | 2014-06-04 | アバクシス, インコーポレイテッド | Multiwavelength analysis of sol particle specific binding assays |
| KR101806432B1 (en) | 2008-03-26 | 2017-12-07 | 테라노스, 인코포레이티드 | Methods and systems for assessing clinical outcomes |
| WO2009120372A2 (en) | 2008-03-28 | 2009-10-01 | Pacific Biosciences Of California, Inc. | Compositions and methods for nucleic acid sequencing |
| EP2261632B1 (en) * | 2008-03-31 | 2019-09-11 | Sysmex Corporation | Sample preparation device, and cell analyzing device with the same |
| JP5749156B2 (en) | 2008-04-05 | 2015-07-15 | シングル セル テクノロジー, インコーポレイテッドSingle Cell Technology, Inc. | Method for selecting single cells for production of bioactive substances |
| EP2112514A1 (en) * | 2008-04-24 | 2009-10-28 | bioMérieux BV | Method and apparatus for checking the fluid in a pipet tip |
| US20090274348A1 (en) | 2008-04-30 | 2009-11-05 | Ortho-Clinical Diagnostics, Inc. | Immunodiagnostic test apparatus having at least one imager to provide agglutination evaluations during centrifugration cycle |
| US8029742B2 (en) | 2008-05-05 | 2011-10-04 | Integra Biosciences Corp. | Multi-channel pipettor with repositionable tips |
| JP2010133924A (en) * | 2008-10-28 | 2010-06-17 | Sysmex Corp | Liquid aspirating mechanism and sample analyzer |
| WO2010006291A1 (en) | 2008-07-10 | 2010-01-14 | Nodality, Inc. | Methods for diagnosis, prognosis and treatment |
| US20100015690A1 (en) | 2008-07-16 | 2010-01-21 | Ortho-Clinical Diagnostics, Inc. | Use of fluid aspiration/dispensing tip as a microcentrifuge tube |
| EP2313767B1 (en) * | 2008-07-16 | 2014-02-26 | International Technidyne Corporation | Cuvette-based apparatus for blood coagulation measurement and testing |
| US9779213B2 (en) | 2008-07-25 | 2017-10-03 | Fundacao D. Anna Sommer Champalimaud E Dr. Carlos Montez Champalimaud | System for evaluating a pathological stage of prostate cancer |
| EP2214011B1 (en) * | 2008-08-01 | 2019-01-02 | Sysmex Corporation | Blood sample analyzing apparatus |
| US9034257B2 (en) | 2008-10-27 | 2015-05-19 | Nodality, Inc. | High throughput flow cytometry system and method |
| WO2010053587A2 (en) | 2008-11-07 | 2010-05-14 | Mlc Dx Incorporated | Methods of monitoring conditions by sequence analysis |
| US8309306B2 (en) | 2008-11-12 | 2012-11-13 | Nodality, Inc. | Detection composition |
| WO2010057081A1 (en) * | 2008-11-14 | 2010-05-20 | The Scripps Research Institute | Image analysis platform for identifying artifacts in samples and laboratory consumables |
| US8900878B2 (en) | 2008-11-28 | 2014-12-02 | Roche Molecular Systems Inc. | Pipetting device, modular pipetting unit, pipetting system and method for pipetting of fluid samples |
| WO2010063834A2 (en) | 2008-12-05 | 2010-06-10 | F. Hoffmann-La Roche Ag | Method for manufacturing a reagent container collective and reagent container collective |
| JP2010145252A (en) * | 2008-12-18 | 2010-07-01 | Nippon Soken Inc | Apparatus for detection of liquid fuel property |
| US9290731B2 (en) | 2008-12-19 | 2016-03-22 | Stemcell Technologies Inc. | Filter apparatus and filter plate system |
| JP2012515534A (en) | 2009-01-21 | 2012-07-12 | バーテックス ファーマシューティカルズ インコーポレイテッド | Method for amplifying hepatitis C virus nucleic acid |
| JP2010175342A (en) * | 2009-01-28 | 2010-08-12 | Hitachi High-Technologies Corp | Automatic analyzer and reaction vessel |
| US20100215644A1 (en) | 2009-02-25 | 2010-08-26 | Nodality, Inc. A Delaware Corporation | Analysis of nodes in cellular pathways |
| US20100246416A1 (en) | 2009-03-25 | 2010-09-30 | Amit Sinha | Systems and methods for remote testing of wireless lan access points |
| US8320985B2 (en) | 2009-04-02 | 2012-11-27 | Empire Technology Development Llc | Touch screen interfaces with pulse oximetry |
| CN102414554B (en) | 2009-04-22 | 2014-11-26 | 威斯康星校友研究基金会 | Analyte detection using liquid crystals |
| GB2473868A (en) | 2009-09-28 | 2011-03-30 | Invitrogen Dynal As | Apparatus and method of automated processing of biological samples |
| EP2253958B1 (en) | 2009-05-18 | 2013-04-17 | F. Hoffmann-La Roche AG | Centrifugal force based microfluidic system and method for the automated analysis of samples |
| JP2010281604A (en) * | 2009-06-02 | 2010-12-16 | Aoi Seiki Kk | Specimen processor and specimen processing method |
| US8426214B2 (en) * | 2009-06-12 | 2013-04-23 | University Of Washington | System and method for magnetically concentrating and detecting biomarkers |
| US20110143947A1 (en) | 2009-07-27 | 2011-06-16 | Meso Scale Technologies, Llc | Assay Apparatuses, Consumables and Methods |
| EP2311563A1 (en) | 2009-08-07 | 2011-04-20 | F. Hoffmann-La Roche AG | Processing units and methods for the processing of liquid samples |
| US7982201B2 (en) * | 2009-09-08 | 2011-07-19 | Jadak, Llc | System and method for detection of liquid level in a vessel |
| BR112012009196B1 (en) | 2009-10-19 | 2021-03-30 | Labrador Diagnostics Llc | SYSTEM FOR MODELING THE PROGRESSION OF A DISEASE WITHIN A POPULATION |
| US8372657B2 (en) | 2009-10-20 | 2013-02-12 | Agency For Science, Technology, And Research | Microfluidic system for detecting a biological entity in a sample |
| DK2490814T3 (en) | 2009-10-22 | 2015-04-20 | Brian Page | Pipettes, apparatus and kit for metering and procedure |
| US9521055B2 (en) | 2009-11-13 | 2016-12-13 | Verizon Patent And Licensing Inc. | Network connectivity management |
| US20120206587A1 (en) | 2009-12-04 | 2012-08-16 | Orscan Technologies Ltd | System and method for scanning a human body |
| CA3157087A1 (en) | 2009-12-07 | 2011-06-16 | Meso Scale Technologies, Llc | Assay cartridges and methods of using the same |
| US8748186B2 (en) | 2009-12-22 | 2014-06-10 | Abbott Laboratories | Method for performing a blood count and determining the morphology of a blood smear |
| US9486803B2 (en) | 2010-01-22 | 2016-11-08 | Biotix, Inc. | Pipette tips |
| JP5564980B2 (en) | 2010-02-23 | 2014-08-06 | 日本電気株式会社 | Security screening system and security screening method |
| JP6058399B2 (en) | 2010-02-23 | 2017-01-11 | レオニックス,インコーポレイテッド | Self-contained biological assay device, method and application |
| US20110213619A1 (en) | 2010-02-26 | 2011-09-01 | Henke Tom L | Method and system for online medical diagnosis |
| WO2011106512A1 (en) | 2010-02-26 | 2011-09-01 | Quickcheck Health, Inc. | Method and apparatus for code verified testing |
| US20110213579A1 (en) | 2010-02-26 | 2011-09-01 | Henke Tom L | Method and apparatus for verifying test results |
| US20110213564A1 (en) | 2010-02-26 | 2011-09-01 | Henke Tom L | Method and apparatus for code verified testing |
| US20110218428A1 (en) | 2010-03-04 | 2011-09-08 | Medical Scan Technologies, Inc. | System and Method for Three Dimensional Medical Imaging with Structured Light |
| US8588807B2 (en) | 2010-04-28 | 2013-11-19 | Palm, Inc. | System and method for dynamically managing connections using a coverage database |
| CN103551212B (en) | 2010-07-23 | 2016-01-20 | 贝克曼考尔特公司 | Kit |
| US20120059664A1 (en) | 2010-09-07 | 2012-03-08 | Emil Markov Georgiev | System and method for management of personal health and wellness |
| TW201219400A (en) | 2010-09-24 | 2012-05-16 | Array Biopharma Inc | Compounds for treating neurodegenerative diseases |
| US8804114B2 (en) * | 2010-11-03 | 2014-08-12 | Pocared Diagnostics Ltd. | Optical cup |
| EP2453233A1 (en) * | 2010-11-16 | 2012-05-16 | Roche Diagnostics GmbH | Method and apparatus for detecting foam on a liquid surface in a vessel |
| US9821306B2 (en) | 2010-11-23 | 2017-11-21 | Andrew Alliance S.A. | Devices and methods for programmable manipulation of pipettes |
| US20130243794A1 (en) | 2010-12-03 | 2013-09-19 | Beth Israel Deaconess Medical Center, Inc. | Methods for predicting and treating infection-induced illnesses and predicting the severity of infection-induced illnesses |
| WO2012075256A2 (en) | 2010-12-03 | 2012-06-07 | Abbott Point Of Care Inc. | Sample metering device and assay device with integrated sample dilution |
| EP2661485A4 (en) | 2011-01-06 | 2018-11-21 | Meso Scale Technologies, LLC | Assay cartridges and methods of using the same |
| AR085087A1 (en) | 2011-01-21 | 2013-09-11 | Theranos Inc | SYSTEMS AND METHODS TO MAXIMIZE THE USE OF SAMPLES |
| WO2012158997A1 (en) | 2011-05-18 | 2012-11-22 | 3M Innovative Properties Company | Systems and methods for detecting the presence of a selected volume of material in a sample processing device |
| EP2710385B1 (en) | 2011-05-20 | 2016-10-19 | PerkinElmer Health Sciences, Inc. | Liquid handling systems and methods including same |
| JP5299981B1 (en) | 2011-09-08 | 2013-09-25 | 独立行政法人理化学研究所 | Primer set, target nucleic acid sequence amplification method and mutant nucleic acid detection method using the same |
| US8380541B1 (en) | 2011-09-25 | 2013-02-19 | Theranos, Inc. | Systems and methods for collecting and transmitting assay results |
| US20130080071A1 (en) | 2011-09-25 | 2013-03-28 | Theranos, Inc., a Delaware Corporation | Systems and methods for sample processing and analysis |
| US8475739B2 (en) | 2011-09-25 | 2013-07-02 | Theranos, Inc. | Systems and methods for fluid handling |
| US8435738B2 (en) | 2011-09-25 | 2013-05-07 | Theranos, Inc. | Systems and methods for multi-analysis |
| US8840838B2 (en) | 2011-09-25 | 2014-09-23 | Theranos, Inc. | Centrifuge configurations |
| US9268915B2 (en) | 2011-09-25 | 2016-02-23 | Theranos, Inc. | Systems and methods for diagnosis or treatment |
| US9619627B2 (en) | 2011-09-25 | 2017-04-11 | Theranos, Inc. | Systems and methods for collecting and transmitting assay results |
| US9632102B2 (en) | 2011-09-25 | 2017-04-25 | Theranos, Inc. | Systems and methods for multi-purpose analysis |
| US20140170735A1 (en) | 2011-09-25 | 2014-06-19 | Elizabeth A. Holmes | Systems and methods for multi-analysis |
| WO2013043203A2 (en) | 2011-09-25 | 2013-03-28 | Theranos, Inc. | Systems and methods for multi-purpose analysis |
| US9664702B2 (en) | 2011-09-25 | 2017-05-30 | Theranos, Inc. | Fluid handling apparatus and configurations |
| US20130074614A1 (en) | 2011-09-25 | 2013-03-28 | Theranos, Inc., a Delaware Corporation | Container configurations |
| US9250229B2 (en) | 2011-09-25 | 2016-02-02 | Theranos, Inc. | Systems and methods for multi-analysis |
| US9810704B2 (en) | 2013-02-18 | 2017-11-07 | Theranos, Inc. | Systems and methods for multi-analysis |
| CN103946364B (en) | 2011-09-25 | 2018-04-24 | 赛拉诺斯知识产权有限责任公司 | System and method for multiple analysis |
| US11249799B2 (en) | 2011-09-26 | 2022-02-15 | Labrador Diagnostics Llc | Methods, systems, and devices for real time execution and optimization of concurrent test protocols on a single device |
| US10012664B2 (en) | 2011-09-25 | 2018-07-03 | Theranos Ip Company, Llc | Systems and methods for fluid and component handling |
| US20160069919A1 (en) | 2011-09-25 | 2016-03-10 | Theranos, Inc. | Systems and methods for multi-analysis |
| US20140308661A1 (en) | 2011-09-25 | 2014-10-16 | Theranos, Inc. | Systems and methods for multi-analysis |
| US20160320381A1 (en) | 2011-09-25 | 2016-11-03 | Theranos, Inc. | Systems and methods for multi-analysis |
| US8392585B1 (en) | 2011-09-26 | 2013-03-05 | Theranos, Inc. | Methods and systems for facilitating network connectivity |
| US20140335505A1 (en) | 2011-09-25 | 2014-11-13 | Theranos, Inc. | Systems and methods for collecting and transmitting assay results |
| US20160084863A1 (en) | 2011-09-25 | 2016-03-24 | Theranos, Inc. | Systems and methods for multi-analysis |
| US9994891B2 (en) | 2011-10-11 | 2018-06-12 | Qiagen Gmbh | Sample processing method and sample processing cartridge |
| WO2013083822A1 (en) * | 2011-12-08 | 2013-06-13 | Biosurfit S.A. | Sequential aliqoting and determination of an indicator of sedimentation rate |
| US9073052B2 (en) | 2012-03-30 | 2015-07-07 | Perkinelmer Health Sciences, Inc. | Lab members and liquid handling systems and methods including same |
| EP2874754B1 (en) | 2012-07-18 | 2023-01-18 | Labrador Diagnostics LLC | High speed, compact centrifuge for use with small sample volumes |
| US9389229B2 (en) | 2012-07-18 | 2016-07-12 | Theranos, Inc. | Methods for detecting and measuring aggregation |
| EP2895622A4 (en) | 2012-09-11 | 2016-05-18 | Theranos Inc | Information management systems and methods using a biological signature |
| US20140342371A1 (en) | 2012-12-05 | 2014-11-20 | Theranos, Inc. | Bodily Fluid Sample Collection and Transport |
| US9051599B2 (en) | 2012-12-10 | 2015-06-09 | Theranos, Inc. | Rapid, low-sample-volume cholesterol and triglyceride assays |
| US20140170678A1 (en) | 2012-12-17 | 2014-06-19 | Leukodx Ltd. | Kits, compositions and methods for detecting a biological condition |
| EP4220120A3 (en) | 2013-02-18 | 2024-01-10 | Labrador Diagnostics LLC | Systems and methods for multi-analysis |
| US20160054343A1 (en) | 2013-02-18 | 2016-02-25 | Theranos, Inc. | Systems and methods for multi-analysis |
| EP2970961B1 (en) | 2013-03-15 | 2019-04-24 | Theranos IP Company, LLC | Nucleic acid amplification |
| US9359632B2 (en) | 2013-03-15 | 2016-06-07 | Theranos, Inc. | Devices, systems and methods for sample preparation |
| WO2014145296A2 (en) | 2013-03-15 | 2014-09-18 | Theranos, Inc. | Nuclei acid amplification |
| CN111378568A (en) | 2013-09-06 | 2020-07-07 | 赛拉诺斯知识产权有限责任公司 | Systems and methods for detecting infectious diseases |
| SG11201601608TA (en) | 2013-09-06 | 2016-04-28 | Theranos Inc | Devices, systems, methods and kits for receiving a swab |
| TWI502067B (en) | 2013-12-10 | 2015-10-01 | Nat Univ Tsing Hua | Clinical specimen sampler and method thereof |
| US10828636B2 (en) | 2016-10-25 | 2020-11-10 | Fannin Partners Llc | Automated remotely instructed driving of an assay |
| DE102018007614B4 (en) | 2018-09-25 | 2023-04-27 | Otto-Von-Guericke-Universität Magdeburg | Injector and method for injecting fuel and an auxiliary liquid, and use of the injector |
-
2012
- 2012-01-20 AR ARP120100204A patent/AR085087A1/en active IP Right Grant
- 2012-01-20 AU AU2012207090A patent/AU2012207090B2/en active Active
- 2012-01-20 CN CN202010031526.1A patent/CN111982829A/en active Pending
- 2012-01-20 ES ES12737013T patent/ES2895518T3/en active Active
- 2012-01-20 JP JP2013550651A patent/JP5945282B2/en active Active
- 2012-01-20 MX MX2013008339A patent/MX2013008339A/en active IP Right Grant
- 2012-01-20 TW TW106128102A patent/TWI690594B/en active
- 2012-01-20 EP EP12737013.8A patent/EP2666008B1/en active Active
- 2012-01-20 CN CN201610651749.1A patent/CN106323875B/en active Active
- 2012-01-20 CA CA2825196A patent/CA2825196C/en active Active
- 2012-01-20 SG SG2013055603A patent/SG192069A1/en unknown
- 2012-01-20 BR BR112013018656-9A patent/BR112013018656B1/en not_active IP Right Cessation
- 2012-01-20 WO PCT/US2012/022130 patent/WO2012100235A2/en active Application Filing
- 2012-01-20 CN CN201610650067.9A patent/CN106290159A/en active Pending
- 2012-01-20 CA CA3097861A patent/CA3097861A1/en active Pending
- 2012-01-20 KR KR1020137021727A patent/KR101909764B1/en active IP Right Grant
- 2012-01-20 TW TW101102769A patent/TWI639703B/en active
- 2012-01-20 MX MX2015015131A patent/MX349288B/en unknown
- 2012-01-20 CN CN201280014347.0A patent/CN103477197B/en active Active
- 2012-01-20 SG SG10201600463YA patent/SG10201600463YA/en unknown
- 2012-01-20 TW TW109107870A patent/TWI748368B/en active
- 2012-01-20 US US13/355,458 patent/US20120309636A1/en not_active Abandoned
- 2012-01-20 CN CN201610652305.XA patent/CN106248582B/en active Active
- 2012-01-20 TW TW110118200A patent/TW202208825A/en unknown
- 2012-01-20 CN CN201610651801.3A patent/CN106290160A/en active Pending
- 2012-01-20 EP EP21190592.2A patent/EP4024029A3/en active Pending
- 2012-01-20 RU RU2013137661A patent/RU2620922C2/en not_active IP Right Cessation
- 2012-01-20 CN CN201610651960.3A patent/CN106323876B/en active Active
-
2013
- 2013-07-19 ZA ZA2013/05478A patent/ZA201305478B/en unknown
- 2013-07-21 IL IL227579A patent/IL227579B/en active IP Right Grant
-
2014
- 2014-12-05 US US14/562,066 patent/US9464981B2/en active Active
-
2015
- 2015-07-01 US US14/789,967 patent/US9677993B2/en active Active
- 2015-08-20 US US14/831,838 patent/US11199489B2/en active Active
-
2016
- 2016-05-19 US US15/159,501 patent/US10557786B2/en active Active
- 2016-05-27 JP JP2016106082A patent/JP6400630B2/en active Active
-
2017
- 2017-05-02 US US15/584,974 patent/US10876956B2/en active Active
- 2017-06-14 HK HK17105896.5A patent/HK1232292A1/en unknown
-
2018
- 2018-04-17 JP JP2018079074A patent/JP2018141798A/en active Pending
-
2020
- 2020-12-28 US US17/135,437 patent/US11644410B2/en active Active
-
2021
- 2021-07-27 JP JP2021122425A patent/JP2021175982A/en active Pending
- 2021-12-13 US US17/549,665 patent/US20220252503A1/en active Pending
Patent Citations (6)
| Publication number | Priority date | Publication date | Assignee | Title |
|---|---|---|---|---|
| US5270163A (en) | 1990-06-11 | 1993-12-14 | University Research Corporation | Methods for identifying nucleic acid ligands |
| US5475096A (en) | 1990-06-11 | 1995-12-12 | University Research Corporation | Nucleic acid ligands |
| US20050176940A1 (en) | 2001-06-29 | 2005-08-11 | Unisearch Limited | Aptamers and antiaptamers |
| US20080179301A1 (en) | 2006-08-25 | 2008-07-31 | Guy Garty | Systems and methods for etching materials |
| US20100240544A1 (en) | 2006-09-29 | 2010-09-23 | Liu David J | Aptamer biochip for multiplexed detection of biomolecules |
| US20090088336A1 (en) | 2007-10-02 | 2009-04-02 | Tammy Burd | Modular point-of-care devices, systems, and uses thereof |
Non-Patent Citations (1)
| Title |
|---|
| See also references of EP2666008A4 |
Cited By (66)
| Publication number | Priority date | Publication date | Assignee | Title |
|---|---|---|---|---|
| US11137391B2 (en) | 2007-10-02 | 2021-10-05 | Labrador Diagnostics Llc | Modular point-of-care devices, systems, and uses thereof |
| US10634667B2 (en) | 2007-10-02 | 2020-04-28 | Theranos Ip Company, Llc | Modular point-of-care devices, systems, and uses thereof |
| US10670588B2 (en) | 2007-10-02 | 2020-06-02 | Theranos Ip Company, Llc | Modular point-of-care devices, systems, and uses thereof |
| US9121851B2 (en) | 2007-10-02 | 2015-09-01 | Theranos, Inc. | Modular point-of-care devices, systems, and uses thereof |
| US10900958B2 (en) | 2007-10-02 | 2021-01-26 | Labrador Diagnostics Llc | Modular point-of-care devices, systems, and uses thereof |
| US11366106B2 (en) | 2007-10-02 | 2022-06-21 | Labrador Diagnostics Llc | Modular point-of-care devices, systems, and uses thereof |
| US11199538B2 (en) | 2007-10-02 | 2021-12-14 | Labrador Diagnostics Llc | Modular point-of-care devices, systems, and uses thereof |
| US9285366B2 (en) | 2007-10-02 | 2016-03-15 | Theranos, Inc. | Modular point-of-care devices, systems, and uses thereof |
| US9435793B2 (en) | 2007-10-02 | 2016-09-06 | Theranos, Inc. | Modular point-of-care devices, systems, and uses thereof |
| US9581588B2 (en) | 2007-10-02 | 2017-02-28 | Theranos, Inc. | Modular point-of-care devices, systems, and uses thereof |
| US9012163B2 (en) | 2007-10-02 | 2015-04-21 | Theranos, Inc. | Modular point-of-care devices, systems, and uses thereof |
| US11899010B2 (en) | 2007-10-02 | 2024-02-13 | Labrador Diagnostics Llc | Modular point-of-care devices, systems, and uses thereof |
| US11061022B2 (en) | 2007-10-02 | 2021-07-13 | Labrador Diagnostics Llc | Modular point-of-care devices, systems, and uses thereof |
| US9588109B2 (en) | 2007-10-02 | 2017-03-07 | Theranos, Inc. | Modular point-of-care devices, systems, and uses thereof |
| US11143647B2 (en) | 2007-10-02 | 2021-10-12 | Labrador Diagnostics, LLC | Modular point-of-care devices, systems, and uses thereof |
| US11092593B2 (en) | 2007-10-02 | 2021-08-17 | Labrador Diagnostics Llc | Modular point-of-care devices, systems, and uses thereof |
| US11199489B2 (en) | 2011-01-20 | 2021-12-14 | Labrador Diagnostics Llc | Systems and methods for sample use maximization |
| US10557786B2 (en) | 2011-01-21 | 2020-02-11 | Theranos Ip Company, Llc | Systems and methods for sample use maximization |
| US9464981B2 (en) | 2011-01-21 | 2016-10-11 | Theranos, Inc. | Systems and methods for sample use maximization |
| US11644410B2 (en) | 2011-01-21 | 2023-05-09 | Labrador Diagnostics Llc | Systems and methods for sample use maximization |
| US9677993B2 (en) | 2011-01-21 | 2017-06-13 | Theranos, Inc. | Systems and methods for sample use maximization |
| US10876956B2 (en) | 2011-01-21 | 2020-12-29 | Labrador Diagnostics Llc | Systems and methods for sample use maximization |
| US11162936B2 (en) | 2011-09-13 | 2021-11-02 | Labrador Diagnostics Llc | Systems and methods for multi-analysis |
| US9632102B2 (en) | 2011-09-25 | 2017-04-25 | Theranos, Inc. | Systems and methods for multi-purpose analysis |
| US11054432B2 (en) | 2011-09-25 | 2021-07-06 | Labrador Diagnostics Llc | Systems and methods for multi-purpose analysis |
| US10018643B2 (en) | 2011-09-25 | 2018-07-10 | Theranos Ip Company, Llc | Systems and methods for multi-analysis |
| US9128015B2 (en) | 2011-09-25 | 2015-09-08 | Theranos, Inc. | Centrifuge configurations |
| US11524299B2 (en) | 2011-09-25 | 2022-12-13 | Labrador Diagnostics Llc | Systems and methods for fluid handling |
| US9250229B2 (en) | 2011-09-25 | 2016-02-02 | Theranos, Inc. | Systems and methods for multi-analysis |
| US9268915B2 (en) | 2011-09-25 | 2016-02-23 | Theranos, Inc. | Systems and methods for diagnosis or treatment |
| US10371710B2 (en) | 2011-09-25 | 2019-08-06 | Theranos Ip Company, Llc | Systems and methods for fluid and component handling |
| US10518265B2 (en) | 2011-09-25 | 2019-12-31 | Theranos Ip Company, Llc | Systems and methods for fluid handling |
| US10534009B2 (en) | 2011-09-25 | 2020-01-14 | Theranos Ip Company, Llc | Systems and methods for multi-analysis |
| US9592508B2 (en) | 2011-09-25 | 2017-03-14 | Theranos, Inc. | Systems and methods for fluid handling |
| US9952240B2 (en) | 2011-09-25 | 2018-04-24 | Theranos Ip Company, Llc | Systems and methods for multi-analysis |
| US10557863B2 (en) | 2011-09-25 | 2020-02-11 | Theranos Ip Company, Llc | Systems and methods for multi-analysis |
| US10627418B2 (en) | 2011-09-25 | 2020-04-21 | Theranos Ip Company, Llc | Systems and methods for multi-analysis |
| US9619627B2 (en) | 2011-09-25 | 2017-04-11 | Theranos, Inc. | Systems and methods for collecting and transmitting assay results |
| US8840838B2 (en) | 2011-09-25 | 2014-09-23 | Theranos, Inc. | Centrifuge configurations |
| US9645143B2 (en) | 2011-09-25 | 2017-05-09 | Theranos, Inc. | Systems and methods for multi-analysis |
| US10012664B2 (en) | 2011-09-25 | 2018-07-03 | Theranos Ip Company, Llc | Systems and methods for fluid and component handling |
| US9719990B2 (en) | 2011-09-25 | 2017-08-01 | Theranos, Inc. | Systems and methods for multi-analysis |
| US9664702B2 (en) | 2011-09-25 | 2017-05-30 | Theranos, Inc. | Fluid handling apparatus and configurations |
| US11009516B2 (en) | 2011-09-25 | 2021-05-18 | Labrador Diagnostics Llc | Systems and methods for multi-analysis |
| US9810704B2 (en) | 2013-02-18 | 2017-11-07 | Theranos, Inc. | Systems and methods for multi-analysis |
| KR101504819B1 (en) * | 2013-05-03 | 2015-03-23 | 동국대학교 산학협력단 | Tube for centrifugation |
| JP2016537009A (en) * | 2013-09-06 | 2016-12-01 | セラノス, インコーポレイテッド | System and method for detection of infectious diseases |
| US9915675B2 (en) | 2013-11-04 | 2018-03-13 | Siemens Healthcare Diagnostics Inc. | Methods and apparatus for determining aspiration and/or dispensing volume and/or pipette positioning |
| EP3065797A4 (en) * | 2013-11-04 | 2016-11-09 | Siemens Healthcare Diagnostics | Methods and apparatus for determining aspiration and/or dispensing volume and/or pipette positioning |
| US10650527B2 (en) | 2015-09-04 | 2020-05-12 | Qualigen, Inc. | Systems and methods for sample verification |
| US11263433B2 (en) | 2016-10-28 | 2022-03-01 | Beckman Coulter, Inc. | Substance preparation evaluation system |
| EP3662259A4 (en) * | 2017-02-09 | 2021-08-25 | Essenlix Corporation | Colorimetric assays |
| CN110770572A (en) * | 2017-02-09 | 2020-02-07 | Essenlix公司 | Colorimetric assay |
| US11604148B2 (en) | 2017-02-09 | 2023-03-14 | Essenlix Corporation | Colorimetric assays |
| CN110770572B (en) * | 2017-02-09 | 2023-08-18 | Essenlix公司 | Colorimetric assay |
| WO2018234682A1 (en) * | 2017-06-20 | 2018-12-27 | bioMérieux | Method for applying, on a solid support, at least one binding partner to a molecule |
| FR3067814A1 (en) * | 2017-06-20 | 2018-12-21 | Biomerieux | METHOD FOR APPLYING, ON A SOLID SUPPORT, AT LEAST ONE MOLECULAR BINDING PARTNER |
| CN109061016A (en) * | 2018-07-25 | 2018-12-21 | 大连工业大学 | A kind of preparation method and application of the solid-phase extraction column of enriched biological amine |
| RU2805195C2 (en) * | 2018-10-31 | 2023-10-12 | Байопикс Дна Текнолоджи П.К. | Method and device for implementing colorimetric amplification analysis of nucleic acids in real time |
| WO2020089399A1 (en) * | 2018-10-31 | 2020-05-07 | Foundation For Research And Technology Hellas | Method and apparatus for performing a real-time colorimetric nucleic acid amplification assay |
| CN109799338B (en) * | 2019-01-14 | 2022-02-11 | 湖南达道生物工程有限公司 | Test paper suitable for peripheral blood immunochromatographic quantitative detection and application thereof |
| CN109799338A (en) * | 2019-01-14 | 2019-05-24 | 湖南达道生物工程有限公司 | A kind of test paper and its application suitable for peripheral blood immunochromatography quantitative detection |
| EP4054406A4 (en) * | 2019-11-05 | 2022-12-28 | Siemens Healthcare Diagnostics, Inc. | Systems, apparatus, and methods of analyzing specimens |
| CN113188605B (en) * | 2021-05-12 | 2022-06-21 | 郑州大学 | Physical experiment method based on smart phone |
| CN113188605A (en) * | 2021-05-12 | 2021-07-30 | 郑州大学 | Physical experiment method based on smart phone |
| EP4166233A1 (en) * | 2021-10-12 | 2023-04-19 | Holosensor Medical Technology Ltd. | Hand-held lamp detector and system |
Also Published As
Similar Documents
| Publication | Publication Date | Title |
|---|---|---|
| US11644410B2 (en) | Systems and methods for sample use maximization | |
| AU2018204311A1 (en) | Systems and methods for sample use maximization | |
| NZ706352B2 (en) | Systems and methods for sample use maximization | |
| NZ613457B2 (en) | Systems and methods for sample use maximization |
Legal Events
| Date | Code | Title | Description |
|---|---|---|---|
| 121 | Ep: the epo has been informed by wipo that ep was designated in this application |
Ref document number: 12737013 Country of ref document: EP Kind code of ref document: A2 |
|
| ENP | Entry into the national phase |
Ref document number: 2012207090 Country of ref document: AU Date of ref document: 20120120 Kind code of ref document: A |
|
| ENP | Entry into the national phase |
Ref document number: 2825196 Country of ref document: CA |
|
| WWE | Wipo information: entry into national phase |
Ref document number: MX/A/2013/008339 Country of ref document: MX |
|
| ENP | Entry into the national phase |
Ref document number: 2013550651 Country of ref document: JP Kind code of ref document: A |
|
| NENP | Non-entry into the national phase |
Ref country code: DE |
|
| WWE | Wipo information: entry into national phase |
Ref document number: 2012737013 Country of ref document: EP |
|
| ENP | Entry into the national phase |
Ref document number: 20137021727 Country of ref document: KR Kind code of ref document: A |
|
| ENP | Entry into the national phase |
Ref document number: 2013137661 Country of ref document: RU Kind code of ref document: A |
|
| REG | Reference to national code |
Ref country code: BR Ref legal event code: B01A Ref document number: 112013018656 Country of ref document: BR |
|
| ENP | Entry into the national phase |
Ref document number: 112013018656 Country of ref document: BR Kind code of ref document: A2 Effective date: 20130722 |