EP2605018A1 - Diagnostic and prognostic methods for lung disorders using gene expression profiles from nose epithelial cells - Google Patents
Diagnostic and prognostic methods for lung disorders using gene expression profiles from nose epithelial cells Download PDFInfo
- Publication number
- EP2605018A1 EP2605018A1 EP20120170635 EP12170635A EP2605018A1 EP 2605018 A1 EP2605018 A1 EP 2605018A1 EP 20120170635 EP20120170635 EP 20120170635 EP 12170635 A EP12170635 A EP 12170635A EP 2605018 A1 EP2605018 A1 EP 2605018A1
- Authority
- EP
- European Patent Office
- Prior art keywords
- genes
- group
- expression
- unigene
- gene
- Prior art date
- Legal status (The legal status is an assumption and is not a legal conclusion. Google has not performed a legal analysis and makes no representation as to the accuracy of the status listed.)
- Pending
Links
Images


Classifications
-
- G—PHYSICS
- G01—MEASURING; TESTING
- G01N—INVESTIGATING OR ANALYSING MATERIALS BY DETERMINING THEIR CHEMICAL OR PHYSICAL PROPERTIES
- G01N33/00—Investigating or analysing materials by specific methods not covered by groups G01N1/00 - G01N31/00
- G01N33/48—Biological material, e.g. blood, urine; Haemocytometers
- G01N33/50—Chemical analysis of biological material, e.g. blood, urine; Testing involving biospecific ligand binding methods; Immunological testing
- G01N33/53—Immunoassay; Biospecific binding assay; Materials therefor
- G01N33/574—Immunoassay; Biospecific binding assay; Materials therefor for cancer
- G01N33/57407—Specifically defined cancers
- G01N33/57423—Specifically defined cancers of lung
-
- C—CHEMISTRY; METALLURGY
- C12—BIOCHEMISTRY; BEER; SPIRITS; WINE; VINEGAR; MICROBIOLOGY; ENZYMOLOGY; MUTATION OR GENETIC ENGINEERING
- C12Q—MEASURING OR TESTING PROCESSES INVOLVING ENZYMES, NUCLEIC ACIDS OR MICROORGANISMS; COMPOSITIONS OR TEST PAPERS THEREFOR; PROCESSES OF PREPARING SUCH COMPOSITIONS; CONDITION-RESPONSIVE CONTROL IN MICROBIOLOGICAL OR ENZYMOLOGICAL PROCESSES
- C12Q1/00—Measuring or testing processes involving enzymes, nucleic acids or microorganisms; Compositions therefor; Processes of preparing such compositions
- C12Q1/68—Measuring or testing processes involving enzymes, nucleic acids or microorganisms; Compositions therefor; Processes of preparing such compositions involving nucleic acids
- C12Q1/6876—Nucleic acid products used in the analysis of nucleic acids, e.g. primers or probes
- C12Q1/6883—Nucleic acid products used in the analysis of nucleic acids, e.g. primers or probes for diseases caused by alterations of genetic material
- C12Q1/6886—Nucleic acid products used in the analysis of nucleic acids, e.g. primers or probes for diseases caused by alterations of genetic material for cancer
-
- C—CHEMISTRY; METALLURGY
- C12—BIOCHEMISTRY; BEER; SPIRITS; WINE; VINEGAR; MICROBIOLOGY; ENZYMOLOGY; MUTATION OR GENETIC ENGINEERING
- C12Q—MEASURING OR TESTING PROCESSES INVOLVING ENZYMES, NUCLEIC ACIDS OR MICROORGANISMS; COMPOSITIONS OR TEST PAPERS THEREFOR; PROCESSES OF PREPARING SUCH COMPOSITIONS; CONDITION-RESPONSIVE CONTROL IN MICROBIOLOGICAL OR ENZYMOLOGICAL PROCESSES
- C12Q2600/00—Oligonucleotides characterized by their use
- C12Q2600/158—Expression markers
Definitions
- the present invention is directed to methods for diagnosing lung diseases from nasal epithelial cells using gene expression analysis. More specifically, the invention is directed to diagnostic and prognostic methods for detecting from nasal epithelial cell samples lung diseases, particularly lung cancer in subjects, preferably humans. The invention also provides genes the expression of which can be used to analyze lung diseases from the nasal epithelial cell samples.
- Lung disorders represent a serious health problem in the modem society. For example, lung cancer claims more than 150,000 lives every year in the United States, exceeding the combined mortality from breast, prostate and colorectal cancers. Cigarette smoking is the most predominant cause of lung cancer. Presently, 25% of the U.S. population smokes, but only 10% to 15% of heavy smokers develop lung cancer. There are also other disorders associated with smoking such as emphysema. There are also health questions arising from people exposed to smokers, for example, second hand smoke. Former smokers remain at risk for developing such disorders including cancer and now constitute a large reservoir of new lung cancer cases. In addition to cigarette smoke, exposure to other air pollutants such as asbestos, and smog, pose a serious lung disease risk to individuals who have been exposed to such pollutants.
- the methods that are currently employed to diagnose lung cancer include chest X-ray analysis, bronchoscopy or sputum cytological analysis, computer tomographic analysis of the chest, and positron electron tomographic (PET) analysis.
- chest X-ray analysis e.g., chest X-ray analysis
- bronchoscopy or sputum cytological analysis e.g., computer tomographic analysis of the chest
- PET positron electron tomographic
- the method of sampling epithelial cells from bronchial tissue while less invasive than many other methods has some drawbacks.
- the patient may not eat or drink for about 6-12 hours prior to the test.
- the procedure is performed using a rigid bronchoscope the patient needs general anesthesia involving related risks to the patient.
- the procedure is performed using a flexible bronchoscope, the procedure is performed using local anesthesia.
- uncomfortable sensations such as a sensation of suffocating during such a procedure and thus are relatively resistant for going through the procedure more than once.
- the throat may feel uncomfortably scratchy for several days.
- RNA can be isolated from mouth epithelial cells for gene expression analysis ( U.S.S.N. 10/579,376 ), it has not been clear if such samples routinely reflect the same gene expression changes as bronchial samples that can be used in accurate diagnostic and prognostic methods.
- the present invention provides a much less invasive method for diagnosing lung diseases, such as lung cancer based on analysis of gene expression in nose epithelial cells.
- the invention provides methods for diagnosis, prognosis and follow up of progression or success of treatment for lung diseases using gene expression analysis from nose epithelial cells.
- the method provides an optimal means for screening for changes indicating malignancies in individuals who, for example are at risk of developing lung diseases, particularly lung cancers because they have been exposed to pollutants, such as cigarette or cigar smoke or asbestos or any other known pollutant.
- the method allows screening at a routine annual medical examination because it does not need to be performed by an expert trained in bronchoscopy and it does not require sophisticated equipment needed for bronchoscopy.
- the gene expression analysis can be performed using genes and/or groups of genes as described in tables 8, 9 and 10 and, for example, in PCT/US2006/014132 . Naturally, other diagnostic genes may also be used, as they are identified.
- the invention provides a substantially less invasive method for diagnosis, prognosis, and follow-up of lung diseases using samples from nasal epithelial cells.
- one preferably uses gene expression analysis.
- the analysis and discoveries presented herein allow us to conclude that those gene expression changes can also be analyzed from nasal epithelial cells thus providing a much less invasive and more accurate method for diagnosing lung diseases in general.
- any lung disease that results in detectable gene expression changes including, but not limited to acute pulmonary eosinophilia (Loeffler's syndrome), CMV pneumonia, chronic pulmonary coccidioidomycosis, cryptococcosis, disseminated tuberculosis (infectious), chronic pulmonary histoplasmosis, pulmonary actinomycosis, pulmonary aspergilloma (mycetoma), pulmonary aspergillosis (invasive type), pulmonary histiocytosis X (eosinophilic granuloma), pulmonary nocardiosis, pulmonary tuberculosis, and sarcoidosis.
- acute pulmonary eosinophilia Lieffler's syndrome
- CMV pneumonia chronic pulmonary coccidioidomycosis
- cryptococcosis disseminated tuberculosis (infectious)
- chronic pulmonary histoplasmosis pulmonary acti
- Our preferred groups are the groups of 361 (Table 8), 107 (Table 9), 70 (Table 10), 96 (Table 1), 84 (Table 2), 50 (Table 3), 36 (Table 4), 80 (Table 5), 535 (Table 6) and 20 (Table 7).
- control groups can be individuals who have not been exposed to a particular airway irritant, such as non-smokers, smokers, or former smokers, or individuals not exposed to viruses or other substance that can cause a "filed effect" in the airways thus resulting in potential for lung disease.
- the control sample should be from an individual who does not have the diseases and alternatively include one or more samples with individuals who have similar or different lung diseases.
- comparing can be performed in the biological sample from a smoker against a control group of smokers who do not have lung cancer.
- the transcripts or expression products against the control for increased expression or decreased expression, which depends upon the particular gene and is set forth in the tables - not all the genes surveyed will show an increase or decrease. However, at least 50% of the genes surveyed must provide the described pattern.
- the nasal epithelial cell sample is analyzed for a group of genes the expression of which is altered in individuals who are at risk of developing lung diseases, such as lung cancer, because of the exposure to air pollutants or other airway irritant such as microbes that occur in the air and are inhaled.
- lung diseases such as lung cancer
- air pollutant air pollutant
- the method can also be used for analysis of groups of genes the expression of which is consistently altered as a group in individuals who are at risk of developing lung diseases because of the exposure to such air pollutants including microbes and viruses present in the air.
- the invention provides a method of diagnosing a lung disease such as lung cancer using a combination of nasal epithelial cells and the analysis of gene expression pattern of the gene groups as described in the present invention.
- the invention provides methods for analyzing gene groups from nasal epithelial cells, wherein the gene expression pattern that can be directly used in diagnosis and prognosis of lung diseases.
- the invention provides analysis from nasal epithelial cells groups of genes the expression profile of which provides a diagnostic and or prognostic test to determine lung disease in an individual exposed to air pollutants.
- the invention provides analysis from nasal epithelial cells, groups of genes the expression profile of which can distinguish individuals with lung cancer from individuals without lung cancer.
- the invention provides an early asymptomatic screening system for lung cancer by using the analysis of nasal epithelial cells for the disclosed gene expression profiles. Such screening can be performed, for example, in similar age groups as colonoscopy for screening colon cancer. Because early detection in lung cancer is crucial for efficient treatment, the gene expression analysis system of the present invention provides an improved method to detect tumor cells. Thus, the analysis can be made at various time intervals, such as once a year, once every other year for screening purposes. Alternatively, one can use a more frequent sampling if one wishes to monitor disease progression or regression in response to a therapeutic intervention. For example, one can take samples from the same patient once a week, once or two times a month, every 3, 4, 5, or 6 months.
- the probes that can be used to measure expression of the gene groups of the invention can be nucleic acid probes capable of hybridizing to the individual gene/transcript sequences identified in the present invention, or antibodies targeting the proteins encoded by the individual gene group gene products of the invention.
- the probes are preferably immobilized on a surface, such as a gene or protein chip so as to allow diagnosis and prognosis of lung diseases in an individual.
- the invention provides a group of genes that can be used in diagnosis of lung diseases from the nasal epithelial cells. These genes were identified using
- the invention provides a group of genes that can be used as individual predictors of lung disease. These genes were identified using probabilities with a t-test analysis and show differential expression in smokers as opposed to non-smokers.
- the group of genes comprise ranging from 1 to 96, and all combinations in between, for example 5, 10, 15, 20, 25, 30, for example at least 36, at least about, 40, 45, 50, 60, 70, 80, 90, or 96 gene transcripts, selected from the group consisting of genes identified by the following GenBank sequence identification numbers (the identification numbers for each gene are separated by ";” while the alternative GenBank ID numbers are separated by "///"): NM_003335; NM_000918; NM_006430.1; NM_001416.1; NM_004090; NM_006406.1; NM_003001.2; NM_001319; NM_006545.1; NM_021145.1; NM_002437.1; NM_006286; NM_001003698 //
- the gene/transcript analysis comprises a group of about 10-20, 20-30, 30-40, 40-50, 50-60, 60-70, 70-80, 80, 80-90, 90-100, 100-120, 120-140, 140-150, 150-160, 160-170, 170-180, 180-190, 190-200, 200-210, 210-220, 220-230, 230-240, 240-250, 250-260, 260-270, 270-280, 280-290, 290-300, 300-310, 310-320, 320-330, 330-340, 340-350, 350-360, 360-370, 370-380, 380-390, 390-400, 400-410, 410-420, 420-430, 430-440, 440-450, 450-460, 460-470, 470-480, 480-490, 490-500, 500-510, 510-520, 520-530, and up to about 535 genes selected from the group consisting of genes or transcripts
- the genes are selected from the group consisting of genes or transcripts as shown in Table 5.
- the genes are selected from the genes or transcripts as shown in Table 7.
- the transcript analysis gene group comprises a group of individual genes the change of expression of which is predictive of a lung disease either alone or as a group, the gene transcripts selected from the group consisting of NM_007062.1; NM_001281.1; BC002642.1; NM_000346.1; NM_006545.1; BG034328; NM_019067.1; NM_017925.1; NM_017932.1; NM_030757.1; NM_030972.1; NM_002268 /// NM_032771; NM_007048 /// NM_194441; NM_006694; U85430.1; NM_004691; AB014576.1; BF218804; BE467941; R83000; AL161952.1; AK023843.1; AK021571.1; AK023783.1; AL080112.1; AW971983; AI683552; NM_024006.1; AK026565.1
- the gene group comprises a probe set capable of specifically hybridizing to at least all of the 36 gene products.
- Gene product can be mRNA which can be recognized by an oligonucleotide or modified oligonucleotide probe, or protein, in which case the probe can be, for example an antibody specific to that protein or an antigenic epitope of the protein.
- the invention provides a gene group, wherein the expression pattern of the group of genes provides diagnostic for a lung disease.
- the gene group comprises gene transcripts encoded by a gene group consisting of at least for example 5, 10, 15, 20, 25, 30, preferably at least 36, still more preferably 40, still more preferably 45, and still more preferably 46, 47, 48, 49, or all 50 of the genes selected from the group consisting of and identified by their GenBank identification numbers: NM_007062.1; NM_001281.1; BC000120.1; NM_014255.1; BC002642.1; NM_000346.1; NM_006545.1; BG034328; NM_021822.1; NM_021069.1; NM_019067.1; NM_017925.1; NM_017932.1; NM_030757.1; NM_030972.1; AF126181.1; U 93240.1; U90552.1; AF151056.1; U85430.1; U51007.1; BC
- the invention provides a group of about 30-180, preferably, a group of about 36-150 genes, still more preferably a group of about 36-100, and still more preferably a group of about 36-50 genes, the expression profile of which is diagnostic of lung cancer in individuals who smoke.
- the invention provides a group of genes the expression of which is decreased in an individual having lung cancer.
- the group of genes comprises at least 5-10, 10-15, 15-20, 20-25 genes selected from the group consisting of NM_000918; NM_006430.1; NM_001416.1; NM_004090; NM_006406.1; NM_003001.2; NM_006545.1; NM_002437.1; NM_006286; NM_001123 /// NM_006721; NM_024824; NM_004935.1; NM_001696; NM_005494 /// NM_058246; NM_006368; NM_002268 /// NM_032771; NM_006694; NM_004691; NM_012394; NM_021800; NM_016049; NM_138387; NM_024531; and NM_018509.
- One or more other genes can be added
- the group of genes comprises genes selected from the group consisting of NM_014182.1; NM_001281.1; NM_024006.1; AF135421.1; L76200.1; NM_000346.1; BC008710.1; BC000423.2; BC008710.1; NM_007062; BC075839.1 /// BC073760.1; BC072436.1 /// BC004560.2; BC001016.2; BC005023.1; BC000360.2; BC007455.2; BC*023528.2 /// BC047680.1; BC064957.1; BC008710.1; BC066329.1; BC023976.2; BC008591.2 /// BC050440.1 /// BC048096.1; and BC028912.1.
- the group of genes comprises genes selected from the group consisting of NM_007062.1; NM_001281.1; BC000120.1; NM_014255.1; BC002642.1; NM_000346.1; NM_006545.1; BG034328; NM_021822.1; NM_021069.1; NM_019067.1; NM_017925.1; NM_017932.1; NM_030757.1; NM_030972.1; AF126181.1; U93240.1; U90552.1; AF151056.1; U85430.1; U51007.1; BC005969.1; NM 002271.1; AL566172; and AB014576.1.
- the invention provides a group of genes the expression of which is increased in an individual having lung cancer.
- the group of genes comprises genes selected from the group consisting of NM_003335; NM_001319; NM_021145.1; NM_001003698 /// NM_001003699 ///; NM_002955; NM_002853.1; NM_019067.1; NM_024917.1; NM_020979.1; NM_005597.1; NM_007031.1; NM_009590.1; NM_020217.1; NM_025026.1; NM_014709.1; NM_014896.1; AF010144; NM_005374.1; NM_006534 /// NM_181659; NM_014033; NM_016138; NM_007048 /// NM_194441; NM_000051 /// NM_138292 /// NM_13
- the group of genes comprises genes selected from the group consisting of NM_030757.1; R83000; AK021571.1; NM_17932.1; U85430.1; AI683552; BC002642.1; AW024467; NM_030972.1; BC021135.1; AL161952.1; AK026565.1; AK023783.1; BF218804; AK023843.1; BC001602.1; BC034707.1; BC064619.1; AY280502.1; BC059387.1; BC061522.1; U50532.1; BC006547.2; BC008797.2; BC000807.1; AL080112.1; BC033718.1 /// BC046176.1 ///; BC038443.1; Hs.288575 (UNIGENE ID); AF020591.1; BC002503.2; BC009185.2; Hs.528304 (UNIGENE ID); U50532.1; BC013923.2; BC031091; Hs.249591
- the group of genes comprises genes selected from the group consisting of BF218804; AK022494.1; AA114843; BE467941; NM_003541.1; R83000; AL161952.1; AK023843.1; AK021571.1; AK023783.1; AU147182; AL080112.1; AW971983; AI683552; NM_024006.1; AK026565.1; NM_014182.1; NM_021800.1; NM_016049.1; NM_019023.1; NM_021971.1; NM_014128.1; AK025651.1; AA133341; and AF 198444.1.
- the invention provides a method for diagnosing a lung disease comprising obtaining a nucleic acid sample from lung, airways or mouth of an individual exposed to an air pollutant, analyzing the gene transcript levels of one or more gene groups provided by the present invention in the sample, and comparing the expression pattern of the gene group in the sample to an expression pattern of the same gene group in an individual, who is exposed to similar air pollutant but not having lung disease, such as lung cancer or emphysema, wherein the difference in the expression pattern is indicative of the test individual having or being at high risk of developing a lung disease.
- the decreased expression of one or more of the genes is indicative of the person having a lung disease or being at high risk of developing a lung disease, preferably lung cancer, in the near future and needing frequent follow ups to allow early treatment of the disease.
- the lung disease is lung cancer.
- the air pollutant is tobacco or tobacco smoke.
- the diagnosis can separate the individuals, such as smokers, who are at lesser risk of developing lung diseases, such as lung cancer by analyzing from the nasal epithelial cells the expression pattern of the gene groups of the invention provides a method of excluding individuals from invasive and frequent follow ups.
- the invention provides methods for prognosis, diagnosis and therapy designs for lung diseases comprising obtaining an nasal epithelial cell sample from an individual who smokes and analyzing expression profile of the gene groups of the present invention, wherein an expression pattern of the gene group that deviates from that in a healthy age, race, and gender matched smoker, is indicative of an increased risk of developing a lung disease.
- Tables 1-4 indicate the expression pattern differences as either being down or up as compared to a control, which is an individual exposed to similar airway pollutant but not affected with a lung disease.
- the invention also provides methods for prognosis, diagnosis and therapy designs for lung diseases comprising obtaining an nasal epithelial cell sample from a non-smoker individual and analyzing expression profile of the gene groups of the present invention, wherein an expression pattern of the gene group that deviates from that in a healthy age, race, and gender matched smoker, is indicative of an increased risk of developing a lung disease.
- the analysis is performed using nucleic acids, preferably RNA, in the biological sample.
- the analysis is performed analyzing the amount of proteins encoded by the genes of the gene groups of the invention present in the sample.
- the analysis is performed using DNA by analyzing the gene expression regulatory regions of the groups of genes of the present invention using nucleic acid polymorphisms, such as single nucleic acid polymorphisms or SNPs, wherein polymorphisms known to be associated with increased or decreased expression are used to indicate increased or decreased gene expression in the individual. For example, methylation patterns of the regulatory regions of these genes can be analyzed.
- the present invention provides a minimally invasive sample procurement method for obtaining nasal epithelial cell RNA that can be analyzed by expression profiling of the groups of genes, for example, by array-based gene expression profiling.
- expression profiling of the groups of genes for example, by array-based gene expression profiling.
- array-based gene expression profiling can be used to diagnose individuals who are already affected with a lung disease, such as lung cancer, or who are at high risk of developing lung disease, such as lung cancer, as a consequence of being exposed to air pollutants.
- These methods can also be used to identify further patterns of gene expression that are diagnostic of lung disorders/diseases, for example, cancer or emphysema, and to identify subjects at risk for developing lung disorders.
- the invention further provides a method of analyzing nasal epithelial cells using gene group microarray consisting of one or more of the gene groups provided by the invention, specifically intended for the diagnosis or prediction of lung disorders or determining susceptibility of an individual to lung disorders.
- the invention relates to a method of diagnosing a disease or disorder of the lung comprising obtaining a sample from nasal epithelial cells, wherein the sample is a nucleic acid or protein sample, from an individual to be diagnosed; and determining the expression of group of identified genes in said sample, wherein changed expression of such gene compared to the expression pattern of the same gene in a healthy individual with similar life style and environment is indicative of the individual having a disease of the lung.
- the invention relates to a method of diagnosing a disease or disorder of the lung comprising obtaining at least two nasal epithelial samples, wherein the samples are either nucleic acid or protein samples, in at least one, two, 3, 4, 5, 6, 7, 8, 9, or more time intervals from an individual to be diagnosed; and determining the expression of the group of identified genes in said sample, wherein changed expression of at least about for example 5, 10, 15, 20, 25, 30, preferably at least about 36, 40, 50, 60, 70, 80, 90, 100, 110, 120, 130, 140, 150, 160, 170, or 180 of such genes in the sample taken later in time compared to the sample taken earlier in time is diagnostic of a lung disease.
- the disease of the lung is selected from the group consisting of asthma, chronic bronchitis, emphysema, primary pulmonary hypertension, acute respiratory distress syndrome, hypersensitivity pneumonitis, eosinophilic pneumonia, persistent fungal infection, pulmonary fibrosis, systemic sclerosis, idiopathic pulmonary hemosiderosis, pulmonary alveolar proteinosis, and lung cancer, such as adenocarcinoma, squamous cell carcinoma, small cell carcinoma, large cell carcinoma, and benign neoplasm of the lung (e.g., bronchial adenomas and hamartomas).
- asthma chronic bronchitis
- emphysema primary pulmonary hypertension
- acute respiratory distress syndrome hypersensitivity pneumonitis
- eosinophilic pneumonia persistent fungal infection
- pulmonary fibrosis systemic sclerosis
- idiopathic pulmonary hemosiderosis pulmonary alveolar proteinosis
- lung cancer such as a
- the nucleic acid sample is RNA.
- individual to be diagnosed is an individual who has been exposed to tobacco smoke, an individual who has smoked, or an individual who currently smokes.
- the invention also provides analysis of nasal epithelial cells using an array, for example, a microarray for diagnosis of a disease of the lung having immobilized thereon a plurality of oligonucleotides which hybridize specifically to genes of the gene groups which are differentially expressed in airways exposed to air pollutants, such as cigarette smoke, and have or are at high risk of developing lung disease, as compared to those individuals who are exposed to similar air pollutants and airways which are not exposed to such pollutants.
- the oligonucleotides hybridize specifically to one allelic form of one or more genes which are differentially expressed for a disease of the lung.
- the differentially expressed genes are selected from the group consisting of the genes shown in tables 1-4; preferably the group of genes comprises genes selected from the Table 3. In one preferred embodiment, the group of genes comprises the group of at least 20 genes selected from Table 3 and additional 5-10 genes selected from Tables 1 and 2. In one preferred embodiment, at least about 10 genes are selected from Table 4.
- Figure 1 shows hierarchical clustering of bronchial airway epithelial samples from current (striped box) and never (white box) smokers according to the expression of 60 genes whose expression levels are altered by smoking in the nasal epithelium. Airway samples tend to group with their appropriate class. Dark grey indicates higher level of expression and light grey lower level of expression.
- Figure 3 shows smoking related genes in mouth, nose and bronchus.
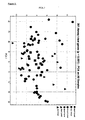
- Principal component analysis shows the variation in expression of genes affected by tobacco exposure in current smokers (dark grey) and never smokers (black).
- Airway epithelium type is indicated by the symbol shape: bronchial (circle), nasal (triangle) and mouth (square). Samples largely separate by smoking status across the first principal component, with the exception of samples from mouth. This indicates a common gene expression host response that can be seen both in the bronchial epithelial tissue and the nasal epithelial tissue.
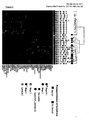
- Figure 4 shows a supervised hierarchical clustering analysis of cancer samples. Individuals with sarcoidosis and individuals with no sarcoids were sampled from both lung tissues and nasal tissues. Gene expression analysis showed that expression of 37 genes can be used to differentiate the cancer samples and non-cancer sampled either from bronchial or nasal epithelial cells. Light grey in the clustering analysis indicates low level of expression and dark grey high level of expression. Asterisk next to the circles indicates that these samples were from an individual with stage 0-1 sarcoidosis. The dot next to the circle indicates that these samples were from an individual with a stage 4 sarcoidosis.
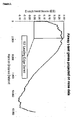
- Figure 5 shows airway t-test genes projected on nose data including the 107 leading edge genes as shown in Table 9. Enrichment of differentially expressed bronchial epithelial genes among genes highly changed in the nasal epithelium in response to smoking. Results from GSEA analysis shows the leading edge of the set of 361 differentially expressed bronchial epithelial genes being overrepresented among the top ranked list of genes differentially expressed in nasal epithelium cells in response to smoking. There are 107 genes that comprise the "leading edge subset" (p ⁇ 0.001).
- Figure 6 shows 107 Leading Edge Genes from Airway - PCA on Nose Samples. Asterisk next to the circle indicates current smokers. Dark circles represent samples from never smokers. Principal component analysis of 107 "leading edge” genes from bronchial epithelial cells enriched in the nasal epithelial gene expression profile. Two dimensional PCA of the 107 "leading edge” genes from the bronchial epithelial signature that are enriched in the nasal epithelial cell expression profile.
- Figure 7 shows a Bronch projection from 10 tissues. From this figure one can see, that the samples from bronchial epithelial cells (dotted squares) and the samples from nose epithelial cells (crossed squares) overlapped closely and were clearly distinct from samples from other tissues, including mouth. Principal component analysis of 2382 genes from normal airway transcriptome across 10 tissues. Principal component analysis (PCA) of 2382 genes from the normal airway transcriptome across 10 different tissue types. Samples separate based on expression of transcriptome genes.
- PCA Principal component analysis
- Figure 8 shows a hierarchical clustering of 51 genes across epithelial cell functional categories.
- the 51 genes were clustered across the 10 tissue types separately for each functional group.
- the present invention describes a novel method for prognosis and diagnosis and follow-up for lung diseases.
- the method is based on detecting gene expression changes of nose epithelial cells which we have discovered closely mirror the gene expression changes in the lung.
- the invention provides a substantially less invasive method for diagnosis, prognosis and follow-up of lung diseases using gene expression analysis of samples from nasal epithelial cells.
- nasal brushing For example, one can collect the nasal epithelial cells by brushing the inferior turbinate and/or the adjacent lateral nasal wall.
- a CYROBRUSH® MedScand Medical, Malmö, Sweden
- the brush is turned a couple of times, for example 1, 2, 3, 4, 5 times, to collect epithelial cells.
- the cells can be placed immediately into a solution that prevents nucleic acids from degradation.
- a solution that prevents nucleic acids from degradation For example, if the cells are collected using the CYTOBRUSH, and one wishes to isolate RNA, the brush is placed immediately into an RNA stabilizer solution, such as RNALATER®, AMBION®, Inc.
- PBS phosphate buffered saline
- nucleic acids are then subjected to gene expression analysis.
- the nucleic acids are isolated and purified.
- cells may be placed into such device as whole cells without substantial purification.
- one analyzes gene expression from nasal epithelial cells using gene/transcript groups and methods of using the expression profile of these gene/transcript groups in diagnosis and prognosis of lung diseases.
- the method provided herein not only significantly increases the diagnostic accuracy of lung diseases, such as lung cancer, but also make the analysis much less invasive and thus much easier for the patients and doctors to perform.
- lung diseases such as lung cancer
- the diagnosis of lung cancer is dramatically better by detecting the cancer in an earlier stage than any other available method to date, and by providing far fewer false negatives and/or false positives than any other available method.
- the invention provides a group of genes useful for lung disease diagnosis from a nasal epithelial cell sample as listed in Tables 8, 9, and/or 10.
- the invention provides genes
- Table 6 One example of the gene transcript groups useful in the diagnostic/prognostic tests of the invention is set forth in Table 6. We have found that taking any group that has at least 20 of the Table 6 genes provides a much greater diagnostic capability than chance alone and that these changes are substantially the same in the nasal epithelial cells than they are in the bronchial samples as described in PCT/US2006/014132 .
- Our preferred groups are the groups of 96 (Table 1), 84 (Table 2), 50 (Table 3), 36 (Table 4), 80 (Table 5), 535 (Table 6) and 20 (Table 7). In some instances, we have found that one can enhance the accuracy of the diagnosis by adding additional genes to any of these specific groups.
- any one or more genes and or transcripts from Table 7 may be added as a lung cancer marker for a gene expression analysis.
- the genes in the group are compared to a control or a control group.
- the control groups can be non-smokers, smokers, or former smokers.
- comparing can be performed in the nasal epithelial cell sample from a smoker against a control group of smokers who do not have lung cancer.
- At least 50% of the genes surveyed must provide the described pattern. Greater reliability if obtained as the percent approaches 100%.
- the presently described gene expression profile can also be used to screen for individuals who are susceptible for lung cancer.
- a smoker who is over a certain age, for example over 40 years old, or a smoker who has smoked, for example, a certain number of years, may wish to be screened for lung cancer.
- the gene expression analysis from nasal epithelial cells as described herein can provide an accurate very early diagnosis for lung cancer. This is particularly useful in diagnosis of lung cancer, because the earlier the cancer is detected, the better the survival rate is.
- the group of 80 genes as presented in Table 5 are part of the most frequently chosen genes across 1000 statistical test runs (see Examples below for more details regarding the statistical testing).
- the 535 genes of Table 6 in our data show up more than 67 times out of 1000.
- All the 80 genes in Table 5 form a subset of the 535 genes.
- Table 7 shows the top 20 genes which are subset of the 535 list. The direction of change in expression is shown using signal to noise ratio.
- a negative number in Tables 5, 6, and 7 means that expression of this gene or transcript is up in lung cancer samples. Positive number in Table 5, 6, and 7, indicates that the expression of this gene or transcript is down in lung cancer.
- any combination of the genes and/or transcripts of Table 6 can be used.
- Table 7 provides 20 of the most frequently variably expressed genes in lung cancer when compared to samples without cancer. Accordingly, in one embodiment, any combination of about 3-5, 5-10, 11, 12, 13, 14, 15, 16, 17, 18, 19, or all 20 genes and/or transcripts of Table 7, or any sub-combination thereof are used.
- the invention provides a gene group the expression profile of nasal epithelial cells which is useful in diagnosing lung diseases and which comprises probes that hybridize ranging from 1 to 96 and all combinations in between for example 5, 10, 15, 20, 25, 30, 35, at least about 36, at least to 40, at lest to 50, at least to 60, to at least 70, to at least 80, to at least 90, or all of the following 96 gene sequences: NM_003335; NM_000918; NM_006430.1; NM_001416.1; NM_004090; NM_006406.1; NM_003001.2; NM_001319; NM_006545.1; NM_021145.1; NM_002437.1; NM_006286; NM_001003698 /// NM_001003699 /// NM_002955; NM_001123 /// NM_006721; NM_024824; NM_004935.1; NM_002853.1;
- the invention provides a gene group the expression profile of nasal epithelial cells of which is useful in diagnosing lung diseases and comprises probes that hybridize to at least, for example, 5, 10, 15, 20, 25, 30, 35, at least about 36, at least to 40, at least to 50, at least to 60, to at least 70, to at least 80, to all of the following 84 gene sequences: NM_030757.1; R83000; AK021571.1; NM_014182.1; NM_17932.1; U85430.1; AI683552; BC002642.1; AW024467; NM_030972.1; BC021135.1; AL161952.1; AK026565.1; AK023783.1; BF218804; NM_001281.1; NM_024006.1; AK023843.1; BC001602.1; BC034707.1; BC064619.1; AY280502.1; BC059387.1; AF135421.1; BC061522.1; L76200.1; U5053
- the invention provides a gene group the expression profile of nasal epithelial cells which is useful in diagnosing lung diseases and comprises probes that hybridize to at least, for example 5, 10, 15, 20, 25, 30, preferably at least about 36, still more preferably at least to 40, still more preferably at lest to 45, still more preferably all of the following 50 gene sequences, although it can include any and all members, for example, 20, 21, 22, up to and including 36: NM_007062.1; NM_001281.1; BC000120.1; NM_014255.1; BC002642.1; NM_000346.1; NM_006545.1; BG034328; NM_021822.1; NM_021069.1; NM_019067.1; NM_017925.1; NM_017932.1; NM_030757.1; NM_030972.1; AF126181.1; U93240.1; U90552.1; AF151056.1; U85430.1; U51007.1; BC005969.
- the invention provides a gene group the expression profile of nasal epithelial cells which is useful in diagnosing lung diseases and comprises probes that hybridize to at least for example 5, 10, 15, 20, preferably at least about 25, still more preferably at least to 30, still more preferably all of the following 36 gene sequences: NM_007062.1; NM_001281.1; BC002642.1; NM_000346.1; NM_006545.1; BG034328; NM_019067.1; NM_017925.1; NM_017932.1; NM_030757.1; NM_030972.1; NM_002268 /// NM_032771; NM_007048 /// NM_194441; NM_006694; U85430.1; NM_004691; AB014576.1; BF218804; BE467941; R83000; AL161952.1; AK023843.1; AK021571.1; AK023783.1; AL080112.1;
- a probe set useful in the methods of the present invention is selected from the nucleic acid probes of between 10-15, 15-20, 20-180, preferably between 30-180, still more preferably between 36-96, still more preferably between 36-84, still more preferably between 36-50 probes, included in the Affymetrix Inc.
- Sequences for the Affymetrix probes are available from Affymetrix. Other probes and sequences that recognize the genes of interest can be easily prepared using, e.g. synthetic oligonucleotides recombinant oligonucleotides. These sequences can be selected from any, preferably unique part of the gene based on the sequence information publicly available for the genes that are indicated by their HUGO ID, GenBank No. or Unigene No.
- diseases caused by exposure to air pollutants such as cigarette smoke, asbestos or any other pollutant.
- the analysis can be performed as follows.
- samples of non-smokers and smokers, non-asbestos exposed individuals and asbestos-exposed individuals, non-smog exposed individuals and smog-exposed individuals, smokers without a lung disease and smokers with lung disease to obtain the differentially expressed gene groups between individuals with no lung disease and individuals with lung disease.
- the obtained expression analysis such as microarray or microbead raw data consists of signal strength and detection p-value.
- One normalizes or scales the data, and filters the poor quality chips/bead sets based on images of the expression data, control probes, and histograms.
- One filters contaminated specimens which contain non-epithelial cells.
- one filters the genes of importance using detection p-value.
- This results in identification of transcripts present in normal airways (normal airway transcriptome). Variability and multiple regression analysis can be used. This also results in identification of effects of smoking on airway epithelial cell transcription.
- T-test and Pearson correlation analysis One can also identify a group or a set of transcripts that are differentially expressed in samples with lung disease, such as lung cancer and samples without cancer. This analysis was performed using class prediction models.
- a weighted voting method For analysis of the data, one can use, for example, a weighted voting method.
- Committees of variable sizes of the top ranked genes are used to evaluate test samples, but genes with more significant p-values can be more heavily weighed.
- the accuracy can be validated using cross-validation
- Table 1 shows 96 genes that were identified as a group distinguishing smokers with cancer from smokers without cancer. The difference in expression is indicated at the column on the right as either “down”, which indicates that the expression of that particular transcript was lower in smokers with cancer than in smokers without cancer, and “up”, which indicates that the expression of that particular transcript was higher in smokers with cancer than smokers without cancer.
- the exemplary probes shown in the column " Affymetrix Id in the Human Genome U133 chip” can be used.
- Table 1 96 Gene Group Affymetrix ID for an example probe identifying the gene GenBank ID Gene Name Expression in cancer compared to a sample with no cancer.
- Table 2 shows one preferred 84 gene group that has been identified as a group distinguishing smokers with cancer from smokers without cancer. The difference in expression is indicated at the column on the right as either “down”, which indicates that the expression of that particular transcript was lower in smokers with cancer than in smokers without cancer, and “up”, which indicates that the expression of that particular transcript was higher in smokers with cancer than smokers without cancer.
- the exemplary probes shown in the column " Affymetrix Id in the Human Genome U133 chip” can be used in the expression analysis.
- Table 2 84 Gene Group GenBank ID (unless otherwise mentioned) Gene Name Abbreviation Direction in Cancer compared to a non-cancer sample Affymetrix ID NM_030757.1 MKRN4 down 208082_x_at R83000 BTF3 down 214800_x_at AK021571.1 MUC20 down 215208_x_at NM_014182.1 ORMDL2 up 218556_at NM_17932.1 FLJ20700 down 207730_x_at U85430.1 NFATC3 down 210556_at AI683552 --- down 217679_x_at BC002642.1 CTSS down 202901_x_at AW024467 RIPX down 213939_s_at NM_030972.1 MGC5384 down 208137_x_at BC021135.1 INADL down 214705_at AL161952.1
- Table 3 shows one preferred 50 gene group that was identified as a group distinguishing smokers with cancer from smokers without cancer. The difference in expression is indicated at the column on the right as either “down”, which indicates that the expression of that particular transcript was lower in smokers with cancer than in smokers without cancer, and “up”, which indicates that the expression of that particular transcript was higher in smokers with cancer than smokers without cancer.
- This gene group was identified using the GenePattern server from the Broad Institute, which includes the Weighted Voting algorithm. The default settings, i.e., the signal to noise ratio and no gene filtering, were used.
- the exemplary probes shown in the column " Affymetrix Id in the Human Genome U133 chip” can be used in the expression analysis.
- Table 3 50 Gene Group GenBank ID Gene Name Direction in Cancer Affymetrix ID NM_007062.1 PWP1 up in cancer 201608_s_at NM_001281.1 CKAP1 up in cancer 201804_x_at BC000120.1 up in cancer 202355_s_at NM_014255.1 TMEM4 up in cancer 202857_at BC002642.1 CTSS up in cancer 202901_x_at NM_000346.1 SOX9 up in cancer 202936_s_at NM_006545.1 NPR2L up in cancer 203246_s_at BG034328 up in cancer 203588_s_at NM_021822.1 APOBEC3G up in cancer 204205_at NM_021069.1 ARGBP2 up in cancer 204288_s_at NM_019067.1 FLJ10613 up in cancer
- Table 4 shows one preferred 36 gene group that was identified as a group distinguishing smokers with cancer from smokers without cancer. The difference in expression is indicated at the column on the right as either “down”, which indicates that the expression of that particular transcript was lower in smokers with cancer than in smokers without cancer, and “up”, which indicates that the expression of that particular transcript was higher in smokers with cancer than smokers without cancer.
- the exemplary probes shown in the column " Affymetrix Id in the Human Genome U133 chip” can be used in the expression analysis.
- the gene group of the present invention comprises at least, for example, 5, 10, 15, 20, 25, 30, more preferably at least 36, still more preferably at least about 40, still more preferably at least about 50, still more preferably at least about 60, still more preferably at least about 70, still more preferably at least about 80, still more preferably at least about 86, still more preferably at least about 90, still more preferably at least about 96 of the genes as shown in Tables 1-4.
- the gene group comprises 36-180 genes selected from the group consisting of the genes listed in Tables 1-4.
- the invention provides group of genes the expression of which is lower in individuals with cancer.
- the invention provides of a group of genes useful in diagnosing lung diseases, wherein the expression of the group of genes is lower in individuals exposed to air pollutants with cancer as compared to individuals exposed to the same air pollutant who do not have cancer, the group comprising probes that hybridize at least 5, preferably at least about 5-10, still more preferably at least about 10-20, still more preferably at least about 20-30, still more preferably at least about 30-40, still more preferably at least about 40-50, still more preferably at least about 50-60, still more preferably at least about 60-70, still more preferably about 72 genes consisting of transcripts (transcripts are identified using their GenBank ID or Unigene ID numbers and the corresponding gene names appear in Table 1): NM_003335; NM_001319; NM_021 145.1; NM_001003698 /// NM 001003699 ///; NM_002955; NM_002853.1; NM_019067.1; NM_024917.1;
- the invention provides of a group of genes useful in diagnosing lung diseases wherein the expression of the group of genes is lower in individuals exposed to air pollutants with cancer as compared to individuals exposed to the same air pollutant who do not have cancer, the group comprising probes that hybridize at least 5, preferably at least about 5-10, still more preferably at least about 10-20, still more preferably at least about 20-30, still more preferably at least about 30-40, still more preferably at least about 40-50, still more preferably at least about 50-60, still more preferably about 63 genes consisting of transcripts (transcripts are identified using their GenBank ID or Unigene ID numbers and the corresponding gene names appear in Table 2): NM_030757.1; R83000; AK021571.1; NM_17932.1; U85430.1; AI683552; BC002642.1; AW024467; NM_030972.1; BC021135.1; AL161952.1; AK026565.1; AK023783.1; BF218804; AK0
- the invention provides of a group of genes useful in diagnosing lung diseases wherein the expression of the group of genes is lower in individuals exposed to air pollutants with cancer as compared to individuals exposed to the same air pollutant who do not have cancer, the group comprising probes that hybridize at least 5, preferably at least about 5-10, still more preferably at least about 10-20, still more preferably at least about 20-25, still more preferably about 25 genes consisting of transcripts (transcripts are identified using their GenBank ID or Unigene ID numbers and the corresponding gene names appear in Table 3):BF218804; AK022494.1; AA114843; BE467941; NM_003541.1; R83000; AL161952.1; AK023843.1; AK021571.1; AK023783.1; AU147182; AL080112.1; AW971983; AI683552; NM_024006.1; AK026565.1; NM_014182.1; NM_021800.1; NM_0160
- the invention provides of a group of genes useful in diagnosing lung diseases wherein the expression of the group of genes is higher in individuals exposed to air pollutants with cancer as compared to individuals exposed to the same air pollutant who do not have cancer, the group comprising probes that hybridize at least to 5, preferably at least about 5-10, still more preferably at least about 10-20, still more preferably at least about 20-25, still more preferably about 25 genes consisting of transcripts (transcripts are identified using their GenBank ID or Unigene ID numbers and the corresponding gene names appear in Table 1): NM_000918; NM_006430.1; NM_001416.1; NM_004090; NM_006406.1; NM_003001.2; NM_006545.1; NM_002437.1; NM_006286; NM_001123 /// NM_006721; NM_024824; NM_004935.1; NM_001696; NM_005494 /// NM_058246;
- the invention provides of a group of genes useful in diagnosing lung diseases wherein the expression of the group of genes is higher in individuals exposed to air pollutants with cancer as compared to individuals exposed to the same air pollutant who do not have cancer, the group comprising probes that hybridize at least to 5, preferably at least about 5-10, still more preferably at least about 10-20, still more preferably at least about 20-23, still more preferably about 23 genes consisting of transcripts (transcripts are identified using their GenBank ID or Unigene ID numbers and the corresponding gene names appear in Table 2): NM_014182.1; NM_001281.1; NM_024006.1; AF135421.1; L76200.1; NM_000346.1; BC008710.1; BC000423.2; BC008710.1; NM_007062; BC075839.1 /// BC073760.1; BC072436.1 /// BC004560.2; BC001016.2; BC005023.1; BC000360.2; BC007455.2; BC023528.
- the invention provides of a group of genes useful in diagnosing lung diseases wherein the expression of the group of genes is higher in individuals exposed to air pollutants with cancer as compared to individuals exposed to the same air pollutant who do not have cancer, the group comprising probes that hybridize at least to 5, preferably at least about 5-10, still more preferably at least about 10-20, still more preferably at least about 20-25, still more preferably about 25 genes consisting of transcripts (transcripts are identified using their GenBank ID or Unigene ID numbers and the corresponding gene names appear in Table 3): NM_007062.1; NM_001281.1; BC000120.1; NM_014255.1; BC002642.1; NM_000346.1; NM_006545.1; BG034328; NM_021822.1; NM_021069.1; NM_019067.1; NM_017925.1; NM_017932.1; NM_030757.1; NM_030972.1; AF126181.1;
- the invention provides a method of diagnosing lung disease comprising the steps of measuring the expression profile of a gene group in an individual suspected of being affected or being at high risk of a lung disease (i.e. test individual), and comparing the expression profile (i.e. control profile) to an expression profile of an individual without the lung disease who has also been exposed to similar air pollutant than the test individual (i.e.
- Groups of about 36 genes as shown in table 4, about 50 genes as shown in table 3, about 84 genes as shown in table 2 and about 96 genes as shown in table 1 are preferred.
- the different gene groups can also be combined, so that the test individual can be screened for all, three, two, or just one group as shown in tables 1-4.
- the expression profile of a test individual exposed to cigarette smoke is compared to the expression profile of the 50 genes shown in table 3, using the Affymetrix Inc. probe set on a gene chip as shown in table 3, the expression profile that is similar to the one shown in Figure 10 for the individuals with cancer, is indicative that the test individual has cancer.
- the expression profile is more like the expression profile of the individuals who do not have cancer in Figure 10, the test individual likely is not affected with lung cancer.
- the group of 50 genes was identified using the GenePattern server from the Broad Institute, which includes the Weighted Voting algorithm. The default settings, i.e., the signal to noise ratio and no gene filtering, were used. GenePattern is available through the World Wide Wed at location broad.mit.edu/cancer/software/genepattern. This program allows analysis of data in groups rather than as individual genes. Thus, in one preferred embodiment, the expression of substantially all 50 genes of Table 3, are analyzed together.
- the expression pattern of all the genes in the Table 3 is analyzed.
- 1, 2, 3, 4, 5, 6, 7, 8, 9, 10-15, 15-20, 20-30, or more of the individual predictor genes identified using the t-test analysis are analyzed. Any combination of, for example, 5-10 or more of the group predictor genes and 5-10, or more of the individual genes can also be used.
- expression profile refers to the amount of the gene product of each of the analyzed individual genes in the sample.
- the "expression profile” is like a signature expression map, like the one shown for each individual in Figure 10, on the Y-axis.
- lung disease refers to disorders including, but not limited to, asthma, chronic bronchitis, emphysema, bronchietasis, primary pulmonary hypertension and acute respiratory distress syndrome.
- the methods described herein may also be used to diagnose or treat lung disorders that involve the immune system including, hypersensitivity pneumonitis, eosinophilic pneumonias, and persistent fungal infections, pulmonary fibrosis, systemic sclerosis, idiopathic pulmonary hemosiderosis, pulmonary alveolar proteinosis, cancers of the lung such as adenocarcinoma, squamous cell carcinoma, small cell and large cell carcinomas, and benign neoplasm of the lung including bronchial adenomas and hamartomas.
- the lung disease is lung cancer.
- air pollutants refers to any air impurities or environmental airway stress inducing agents, such as cigarette smoke, cigar smoke, smog, asbestos, and other air pollutants that have suspected or proven association to lung diseases.
- laboratory test animals preferably animals that have lungs, such as non-human primates, murine species, including, but not limited to rats and mice, dogs, sheep, pig, guinea pigs, and other model animals.
- laboratory tests can be used, for example in pre-clinical animal testing of drugs intended to be used to treat or prevent lung diseases.
- altered expression refers to either increased or decreased expression in an individual exposed to air pollutant, such as a smoker, with cancer when compared to an expression pattern of the lung cells from an individual exposed to similar air pollutant, such as smoker, who does not have cancer.
- Tables 1 and 2 show the preferred expression pattern changes of the invention.
- the terms “up” and “down” in the tables refer to the amount of expression in a smoker with cancer to the amount of expression in a smoker without cancer. Similar expression pattern changes are likely associated with development of cancer in individuals who have been exposed to other airway pollutants.
- the group of genes the expression of which is analyzed in diagnosis and/or prognosis of lung cancer are selected from the group of 80 genes as shown in Table 5. Any combination of genes can be selected from the 80 genes. In one embodiment, the combination of 20 genes shown in Table 7 is selected. In one embodiment, a combination of genes from Table 6 is selected. Table 5: Group of 80 genes for prognostic and diagnostic testing of lung cancer.
- Affymetrix ID Gene symbol (HUGO ID) Number of runs* Signal to noise in a cancer sample** 200729_s_at ACTR2 736 -0.22284 200760_s_at ARL6IP5 483 -0.21221 201399_s_at TRAM1 611 -0.21328 201444_s_at ATP6AP2 527 -0.21487 201635_s_at FXR1 458 -0.2162 201689_s_at TPD52 565 -0.22292 201925_s_at DAF 717 -0.25875 201926_s_at DAF 591 -0.23228 20l946_s_at CCT2 954 -0.24592 202118_s_at CPNE3 334 -0.21273 202704_at TOB1 943 -0.25724 202833_s_at SERPINA1 576 -0.20583 202935_s_at SOX9 750 -0.25574 203413_at NELL2 629
- Affymetrix ID Gene symbol (HUGO ID) Number of runs* Signal to noise in a cancer sample** 200729_s_at ACTR2 736 -0.22284 200760_s_at ARL6IP5 483 -0.21221 201399_s_at TRAM1 611 -0.21328 201444_s_at ATP6AP2 527 -0.21487 201635_s_at FXR1 458 -0.2162 201689_s_at TPD52 565 -0.22292 201925_s_at DAF 717 -0.25875 201926_s_at DAF 591 -0.23228 201946_s_at CCT2 954 -0.24592 202118_s_at CPNE3 334 -0.21273 202704_at TOB1 943 -0.25724 202833_s_at SERPINA1 576 -0.20583 202935_s at SOX9 750 -0.25574 203413_at NELL2 629 -0.235
- one uses at least one, preferably at least 2, 3, 4, 5, 6, 7, 8, 9, 10 or more, of the genes as listed in Tables 8, 9 and/or 10. In one embodiment, one uses maximum of 500, 400, 300, 200, 100, or 50 of the gene that include at least 5, 6, 7, 8, 9, 10-20, 20-30, 30-40, 40-50, 50-60, 60-70, 1-70, of the genes listed in Tables 8-10.
- Table 8 361 Airway t-test gene list AffyID GeneName (HUGO ID) 202437_s_at CYP1B1 206561_s_at AKR1B10 202436_s_at CYP1B1 205749_at CYP1A1 202435_s_at CYP1B1 201884_at CEACAM5 205623_at ALDH3A1 217626_at --- 209921_at SLC7A11 209699_x_at AKR1C2 201467_s_at NQO1 201468_s_at NQO1 202831_at GPX2 214303_x_at MUC5AC 211653_x_at AKR1C2 214385_s_at MUC5AC 216594_x_at AKR1C1 205328_at CLDN10 209160_at AKR1C3 210519_s_at NQO1 217678_at SLC7A11 205221_
- the analysis of the gene expression of one or more genes and/or transcripts of the groups or their subgroups of the present invention can be performed using any gene expression method known to one skilled in the art. Such methods include, but are not limited to expression analysis using nucleic acid chips (e.g. Affymetrix chips) and quantitative RT-PCR based methods using, for example real-time detection of the transcripts. Analysis of transcript levels according to the present invention can be made using total or messenger RNA or proteins encoded by the genes identified in the diagnostic gene groups of the present invention as a starting material.
- nucleic acid chips e.g. Affymetrix chips
- quantitative RT-PCR based methods using, for example real-time detection of the transcripts.
- Analysis of transcript levels according to the present invention can be made using total or messenger RNA or proteins encoded by the genes identified in the diagnostic gene groups of the present invention as a starting material.
- the analysis is an immunohistochemical analysis with an antibody directed against proteins comprising at least about 10-20, 20-30, preferably at least 36, at least 36-50, 50, about 50-60, 60-70, 70-80, 80-90, 96, 100-180, 180-200, 200-250, 250-300, 300-350, 350-400, 400-450, 450-500, 500-535 proteins encoded by the genes and/or transcripts as shown in Tables 1-7.
- the methods of analyzing transcript levels of the gene groups in an individual include Northern-blot hybridization, ribonuclease protection assay, and reverse transcriptase polymerase chain reaction (RT-PCR) based methods.
- RT-PCR reverse transcriptase polymerase chain reaction
- the different RT-PCR based techniques are the most suitable quantification method for diagnostic purposes of the present invention, because they are very sensitive and thus require only a small sample size which is desirable for a diagnostic test.
- a number of quantitative RT-PCR based methods have been described and are useful in measuring the amount of transcripts according to the present invention.
- RNA quantification using PCR and complementary DNA (cDNA) arrays Shalon et al., Genome Research 6(7):639-45, 1996 ; Bernard et al., Nucleic Acids Research 24(8):1435-42, 1996
- real competitive PCR using a MALDI-TOF Mass spectrometry based approach Ding et al, PNAS, 100: 3059-64, 2003
- solid-phase mini-sequencing technique which is based upon a primer extension reaction
- U.S. Patent No. 6,013,431 Suomalainen et al. Mol. Biotechnol.
- the samples are preferably obtained from bronchial airways using, for example, endoscopic cytobrush in connection with a fiber optic bronchoscopy.
- the cells are obtained from the individual's mouth buccal cells, using, for example, a scraping of the buccal mucosa.
- the invention provides a prognostic and/or diagnostic immunohistochemical approach, such as a dip-stick analysis, to determine risk of developing lung disease.
- Antibodies against proteins, or antigenic epitopes thereof, that are encoded by the group of genes of the present invention, are either commercially available or can be produced using methods well know to one skilled in the art.
- the invention contemplates either one dipstick capable of detecting all the diagnostically important gene products or alternatively, a series of dipsticks capable of detecting the amount proteins of a smaller sub-group of diagnostic proteins of the present invention.
- Antibodies can be prepared by means well known in the art.
- the term "antibodies” is meant to include monoclonal antibodies, polyclonal antibodies and antibodies prepared by recombinant nucleic acid techniques that are selectively reactive with a desired antigen.
- Antibodies against the proteins encoded by any of the genes in the diagnostic gene groups of the present invention are either known or can be easily produced using the methods well known in the art. Internet sites such as Biocompare through the World Wide Web at biocompare.com at abmatrix to provide a useful tool to anyone skilled in the art to locate existing antibodies against any of the proteins provided according to the present invention.
- Antibodies against the diagnostic proteins according to the present invention can be used in standard techniques such as Western blotting or immunohistochemistry to quantify the level of expression of the proteins of the diagnostic airway proteome. This is quantified according to the expression of the gene transcript, i.e. the increased expression of transcript corresponds to increased expression of the gene product, i.e. protein. Similarly decreased expression of the transcript corresponds to decreased expression of the gene product or protein.
- Tables 5 and 6 describe a group of genes the expression of which is altered in lung cancer.
- Immunohistochemical applications include assays, wherein increased presence of the protein can be assessed, for example, from a saliva or sputum sample.
- the immunohistochemical assays according to the present invention can be performed using methods utilizing solid supports.
- the solid support can be a any phase used in performing immunoassays, including dipsticks, membranes, absorptive pads, beads, microtiter wells, test tubes, and the like.
- test devices which may be conveniently used by the testing personnel or the patient for self-testing, having minimal or no previous training.
- Such preferred test devices include dipsticks, membrane assay systems as described in U.S. Pat. No. 4,632,901 .
- the preparation and use of such conventional test systems is well described in the patent, medical, and scientific literature.
- the anti-protein antibody is bound to one end of the stick such that the end with the antibody can be dipped into the solutions as described below for the detection of the protein.
- the samples can be applied onto the antibody-coated dipstick or membrane by pipette or dropper or the like.
- the antibody against proteins encoded by the diagnostic airway transcriptome can be of any isotype, such as IgA, IgG or IgM, Fab fragments, or the like.
- the antibody may be a monoclonal or polyclonal and produced by methods as generally described, for example, in Harlow and Lane, Antibodies, A Laboratory Manual, Cold Spring Harbor Laboratory, 1988 , incorporated herein by reference.
- the antibody can be applied to the solid support by direct or indirect means. Indirect bonding allows maximum exposure of the protein binding sites to the assay solutions since the sites are not themselves used for binding to the support.
- polyclonal antibodies are used since polyclonal antibodies can recognize different epitopes of the protein thereby enhancing the sensitivity of the assay.
- the solid support is preferably non-specifically blocked after binding the protein antibodies to the solid support.
- Non-specific blocking of surrounding areas can be with whole or derivatized bovine serum albumin, or albumin from other animals, whole animal serum, casein, non-fat milk, and the like.
- the sample is applied onto the solid support with bound protein-specific antibody such that the protein will be bound to the solid support through said antibodies. Excess and unbound components of the sample are removed and the solid support is preferably washed so the antibody-antigen complexes are retained on the solid support.
- the solid support may be washed with a washing solution which may contain a detergent such as Tween-20, Tween-80 or sodium dodecyl sulfate.
- the second antibody which reacts with protein is applied.
- the second antibody may be labeled, preferably with a visible label.
- the labels may be soluble or particulate and may include dyed immunoglobulin binding substances, simple dyes or dye polymers, dyed latex beads, dye-containing liposomes, dyed cells or organisms, or metallic, organic, inorganic, or dye solids.
- the labels may be bound to the protein antibodies by a variety of means that are well known in the art.
- the labels may be enzymes that can be coupled to a signal producing system.
- visible labels examples include alkaline phosphatase, beta-galactosidase, horseradish peroxidase, and biotin. Many enzyme-chromogen or enzyme-substrate-chromogen combinations are known and used for enzyme-linked assays. Dye labels also encompass radioactive labels and fluorescent dyes.
- corresponding steps may be carried out with a known amount or amounts of the protein and such a step can be the standard for the assay.
- a sample from a healthy individual exposed to a similar air pollutant such as cigarette smoke, can be used to create a standard for any and all of the diagnostic gene group encoded proteins.
- the solid support is washed again to remove unbound labeled antibody and the labeled antibody is visualized and quantified.
- the accumulation of label will generally be assessed visually. This visual detection may allow for detection of different colors, for example, red color, yellow color, brown color, or green color, depending on label used. Accumulated label may also be detected by optical detection devices such as reflectance analyzers, video image analyzers and the like.
- the visible intensity of accumulated label could correlate with the concentration of protein in the sample.
- the correlation between the visible intensity of accumulated label and the amount of the protein may be made by comparison of the visible intensity to a set of reference standards.
- the standards have been assayed in the same way as the unknown sample, and more preferably alongside the sample, either on the same or on a different solid support.
- the concentration of standards to be used can range from about 1 mg of protein per liter of solution, up to about 50 mg of protein per liter of solution.
- concentrations of an airway gene group encoded proteins are used so that quantification of the unknown by comparison of intensity of color is more accurate.
- the present invention provides a method for detecting risk of developing lung cancer in a subject exposed to cigarette smoke comprising measuring the transcription profile in a nasal epithelial cell sample of the proteins encoded by one or more groups of genes of the invention in a biological sample of the subject.
- a biological sample of the subject Preferably at least about 30, still more preferably at least about 36, 40, 50, 60, 70, 80, 90, 100, 110, 120, 130, 140, 150, 160, 170, or about 180 of the proteins encoded by the airway transcriptome in a biological sample of the subject are analyzed.
- the method comprises binding an antibody against each protein encoded by the gene in the gene group (the "protein") to a solid support chosen from the group consisting of dip-stick and membrane; incubating the solid support in the presence of the sample to be analyzed under conditions where antibody-antigen complexes form; incubating the support with an anti-protein antibody conjugated to a detectable moiety which produces a signal; visually detecting said signal, wherein said signal is proportional to the amount of protein in said sample; and comparing the signal in said sample to a standard, wherein a difference in the amount of the protein in the sample compared to said standard of the same group of proteins, is indicative of diagnosis of or an increased risk of developing lung cancer.
- the standard levels are measured to indicate expression levels in an airway exposed to cigarette smoke where no cancer has been detected.
- the assay reagents, pipettes/dropper, and test tubes may be provided in the form of a kit. Accordingly, the invention further provides a test kit for visual detection of the proteins encoded by the airway gene groups, wherein detection of a level that differs from a pattern in a control individual is considered indicative of an increased risk of developing lung disease in the subject.
- the test kit comprises one or more solutions containing a known concentration of one or more proteins encoded by the airway transcriptome (the "protein") to serve as a standard; a solution of a anti-protein antibody bound to an enzyme; a chromogen which changes color or shade by the action of the enzyme; a solid support chosen from the group consisting of dip-stick and membrane carrying on the surface thereof an antibody to the protein. Instructions including the up or down regulation of the each of the genes in the groups as provided by the Tables 1 and 2 are included with the kit.
- the practice of the present invention may employ, unless otherwise indicated, conventional techniques and descriptions of organic chemistry, polymer technology, molecular biology (including recombinant techniques), cell biology, biochemistry, and immunology, which are within the skill of the art.
- Such conventional techniques include polymer array synthesis, hybridization, ligation, and detection of hybridization using a label. Specific illustrations of suitable techniques can be had by reference to the example herein below. However, other equivalent conventional procedures can, of course, also be used.
- Such conventional techniques and descriptions can be found in standard laboratory manuals such as Genome Analysis: A Laboratory Manual Series (Vols.
- the methods of the present invention can employ solid substrates, including arrays in some preferred embodiments.
- Methods and techniques applicable to polymer (including protein) array synthesis have been described in U.S.S.N 09/536,841 , WO 00/58516 , U.S. Patents Nos.
- Patents that describe synthesis techniques in specific embodiments include U.S. Patents Nos. 5,412,087 , 6,147,205 , 6,262,216 , 6,310,189 , 5,889,165 , and 5,959,098 .
- Nucleic acid arrays are described in many of the above patents, but the same techniques are applied to polypeptide and protein arrays.
- Nucleic acid arrays that are useful in the present invention include, but are not limited to those that are commercially available from Affymetrix (Santa Clara, CA) under the brand name GeneChip7. Example arrays are shown on the website at affymetrix.com.
- the present invention also contemplates sample preparation methods in certain preferred embodiments.
- the nucleic acid sample may be amplified by a variety of mechanisms, some of which may employ PCR. See, e.g., PCR Technology: Principles and Applications for DNA Amplification (Ed. H.A. Erlich, Freeman Press, NY, NY, 1992 ); PCR Protocols: A Guide to Methods and Applications (Eds. Innis, et al., Academic Press, San Diego, CA, 1990 ); Mattila et al., Nucleic Acids Res. 19, 4967 (1991 ); Eckert et al., PCR Methods and Applications 1, 17 (1991); PCR (Eds.
- LCR ligase chain reaction
- amplification methods include the ligase chain reaction (LCR) (e.g., Wu and Wallace, Genomics 4, 560 (1989 ), Landegren et al., Science 241, 1077 (1988 ) and Barringer et al. Gene 89:117 (1990 )), transcription amplification ( Kwoh et al., Proc. Natl. Acad. Sci. USA 86, 1173 (1989 ) and WO88/10315 ), self-sustained sequence replication ( Guatelli et al., Proc. Nat. Acad. Sci. USA, 87, 1874 (1990 ) and WO90/06995 ), selective amplification of target polynucleotide sequences ( U.S.
- LCR ligase chain reaction
- Genomics 4 e.g., Wu and Wallace, Genomics 4, 560 (1989 ), Landegren et al., Science 241, 1077 (1988 ) and Barringer et
- Patent No 6,410,276 consensus sequence primed polymerase chain reaction (CP-PCR) ( U.S. Patent No 4,437,975 ), arbitrarily primed polymerase chain reaction (AP-PCR) ( U.S. Patent No 5, 413,909 , 5,861,245 ) and nucleic acid based sequence amplification (NABSA).
- CP-PCR consensus sequence primed polymerase chain reaction
- AP-PCR arbitrarily primed polymerase chain reaction
- NABSA nucleic acid based sequence amplification
- Other amplification methods that may be used are described in, U.S. Patent Nos. 5,242,794 , 5,494,810 , 4,988,617 and in USSN 09/854,317 , each of which is incorporated herein by reference.
- Hybridization assay procedures and conditions will vary depending on the application and are selected in accordance with the general binding methods known including those referred to in: Maniatis et al. Molecular Cloning: A Laboratory Manual (2nd Ed. Cold Spring Harbor, N.Y, 1989 ); Berger and Kimmel Methods in Enzymology, Vol. 152, Guide to Molecular Cloning Techniques (Academic Press, Inc., San Diego, CA, 1987 ); Young and Davism, P.N.A.S, 80: 1194 (1983 ).
- the present invention also contemplates signal detection of hybridization between the sample and the probe in certain embodiments. See, for example, U.S. Pat. Nos. 5,143,854 , 5,578,832 ; 5,631,734 ; 5,834,758 ; 5,936,324 ; 5,981,956 ; 6,025,601 ; 6,141,096 ; 6,185,030 ; 6,201,639 ; 6,218,803 ; and 6,225,625 , in provisional U.S. Patent application 60/364,731 and in PCT Application PCT/US99/06097 (published as WO99/47964 ).
- Computer software products of the invention typically include computer readable medium having computer-executable instructions for performing the logic steps of the method of the invention.
- Suitable computer readable medium include floppy disk, CD-ROM/DVD/DVD-ROM, hard-disk drive, flash memory, ROM/RAM, magnetic tapes and etc.
- the computer executable instructions may be written in a suitable computer language or combination of several languages. Basic computational biology methods are described in, e.g.
- the present invention also makes use of various computer program products and software for a variety of purposes, such as probe design, management of data, analysis, and instrument operation. See, for example, U.S. Patent Nos. 5,593,839 , 5,795,716 , 5,733,729 , 5,974,164 , 6,066,454 , 6,090,555 , 6,185,561 , 6,188,783 , 6,223,127 , 6,229,911 and 6,308,170 .
- the present invention may have embodiments that include methods for providing gene expression profile information over networks such as the Internet as shown in, for example, U.S. Patent applications 10/063,559, 60/349,546 , 60/376,003 , 60/394,574 , 60/403,381 .
- fractional ranges are also included in the exemplified amounts that are described. Therefore, for example, a range of 1-3 includes fractions such as 1.1, 1.2, 1.3, 1.4, 1.5, 1.6, etc. This applies particularly to the amount of increase or decrease of expression of any particular gene or transcript.
- RNA/DNA nucleic acid samples from nose epithelial cells.
- nucleic acids from blood to provide one control.
- PCT/US2006/014132 we used our findings in the PCT/US2006/014132 to compare the gene expression profile in the bronchial epithelial cells as disclosed in the PCT/US2006/014132 to the gene expression pattern discovered in this example from the nasal epithelial cells.
- allelic loss occurs throughout the intra-pulmonary airways in smokers with lung cancer, on the side of the cancer as well as the opposite side from the cancer. Allelic loss also occurs, but to a lesser extent, in airway epithelial cells of smokers without cancer ( Clinical Cancer Research 5:2025,1999 ).
- epithelial cells obtained by brushing the nasal mucosa could be used as a diagnostic and prognostic tool for lung disorders.
- Preliminary results show that we can obtain abundant amounts of high quality RNA and DNA from the nose with ease (see protocol below), that we can measure gene expression using this RNA and high density microarrays and that many of the genes that change with smoking in the bronchial epithelium also change in the nose (see Figure 1 ).
- gene expression in nasal epithelium can be used to define a potentially diagnostic and clinical stage-specific pattern of gene expression in subjects with sarcoidosis, even when the sarcoidosis does not clinically involve the lung (see Figure 2 ).
- We can also obtain DNA from these same specimens allowing us to assess gene methylation patterns and genetic polymorphisms that explain changes in gene expression.
- a Cytosoft brush is inserted into the right nare and under the inferior turbinate using a nasal speculum for visualization.
- the brush is turned 3 times to collect epithelial cells and immediately placed into RNA Later. Repeat brushing is performed and the 2nd brush is placed in PBS for DNA isolation.
- buccal mucosa epithelial samples from 10 subjects (5 never smokers, 5 current smokers) using a scraping device that we have described previously [38] (see Appendix). All samples were run on Affymetrix HG-U133A arrays. Due to the small amounts (1-2ug) of partially degraded RNA obtained from the mouth, samples were collected serially on each subject monthly and pooled to yield sufficient RNA (6-8ug), Low transcript detection rates were observed for mouth samples, likely as a result of lower levels of intact full-length mRNA in the mouth samples
- GSEA Gene Set Enrichment Analysis
- Cigarette smoking has been found to induce a number of changes in both the upper and lower respiratory tract epithelia including cellular atypia (3, 4), aberrant gene expression, loss of heterozygosity (3, 5) and promoter hypermethylation.
- cellular atypia 3, 4
- aberrant gene expression 3, 5
- promoter hypermethylation 3, 5
- molecular and genetic changes such as LOH or microsatellitle alterations dispersed throughout the airway epithelium of smokers including areas that are histologically normal (4, 6).
- Oral and nasal mucosa are attractive candidates for a biomarkers since they are exposed to high concentrations of inhaled carcinogens and are definitively linked to smoking-related diseases(8).
- RNA for cDNA microarrays found approximately 100 genes that could distinguish the two groups in training and test sets. While the study provided encouraging evidence that buccal gene expression changes with smoking, many of these genes were undefined ESTs, and the study did not address any potential relationship between genetic responses in the upper and lower airways.
- Spivak et. al. found a qualitative relationship via PCR (i.e. detected or not detected) between patient matched buccal mucosa and laser-dissected lung epithelial cells across nine carcinogen or oxidant-metabolizing genes (13) in 11 subjects being evaluated for lung cancer.
- Microarrays were performed on total of 25 subjects and mass spectrometry validation on 14 additional subjects. Demographic data for the microarray and mass spectrometry validation groups are presented in Table 11.
- Microarray analysis of normal tissue samples was performed on previously published datasets collected from the Gene Expression Omnibus (GEO). Ninety two samples spanning 10 different tissues types were analyzed altogether, including 12 nasal and buccal epithelial samples of non-smokers collected for this study. Additional microarray data from normal nasal epithelial samples were also collected to determine the reproducibility of gene expression patterns in nasal tissue collected from a different study. A detailed breakdown of the different tissues analyzed and number of samples within each tissue type are shown in Table 12.
- GEO Gene Expression Omnibus
- PCA Principal component analysis
- genes from functional groups commonly expressed in airway epithelium were selected from among the normal airway transcriptome.
- Genes from the mucin, dynein, microtubule, keratin, glutathione, cytochrome P450, and aldehyde dehydrogenase functional groups were selected from among the 2382 genes in the normal airway transcriptome, based on their gene annotations.
- Fifty-nine genes from these functional groups were present among the normal airway transcriptome and analyzed using supervised hierarchical clustering, as shown in Figure 8 . Bronchial and nasal epithelial samples clustered together based on the expression of these 59 genes, with many being expressed at higher levels in these two tissues.
- mucin genes with MUC4, MUC5AC, and MUC16 being expressed primarily in bronchial and nasal epithelium, while MUC1 was expressed in other epithelial tissues.
- Glutathione genes were expressed highly in bronchial and nasal epithelium as well as other tissues. Microtubule expression was fairly even across all tissues.
- a metagene was created by selected a subset of the 59 functionally relevant normal transcriptome genes with highly correlated expression in between bronchial and nasal samples. All genes which were highly correlated to the metagene (R>.6, p ⁇ .001) were selected and analyzed using EASE to determine sets functionally overrepresented categories. The microtubule and cytoskeletal complex functional set was significantly enriched among the genes most highly correlated with the expression pattern of the metagene.
- This separate nasal epithelial dataset consisted of 11 normal epithelial samples run on Affymetrix HG133A microarrays. These samples were first examined with the 92 normal tissue samples from previous analysis. A correlation matrix was created to determine the average pearson correlation of each set of samples within a tissue type with samples from other tissue types. The two nasal epithelial datasets had the highest correlation with each other, with the next highest correlation being between nasal and bronchial epithelial samples.
- These 11 nasal epithelial samples also clustered together with bronchial epithelial samples across the entire normal transcriptome and the subset of 59 functionally relevant genes from the transcriptome when used in place of our original 8 nasal epithelial samples.
- the 361 genes as shown in Table 8 most differently expressed in the airway epithelial cells of current and never smokers were generally able to distinguish bronchial, nasal, and buccal epithelial samples based on smoking status using principal component analysis, with few exceptions among buccal mucosa samples ( Figure 3 ). This finding suggests a relationship between gene expression profiles in epithelial cells in the bronchus and upper airway epithelium in response to cigarette smoke. To further establish this connection across airway epithelial cells, gene set enrichment analysis (GSEA) was performed to determine if genes most differentially expressed in bronchial epithelium based on smoking status were overrepresented among the genes that change with smoking in both nasal and buccal epithelium.
- GSEA gene set enrichment analysis
- the leading edge subset consists of the genes that contribute most to the enrichment of airway genes in buccal mucosa samples.
- Figure 6 similarly shows that the genes differing most across the bronchial epithelium of smokers were also significantly enriched among the genes most affected by smoking in nasal epithelial cell samples, with 107 genes comprising the leading edge subset (p ⁇ .001).
- PCA of the leading edge genes show that they are able to separate buccal mucosa samples and nasal epithelial samples ( Figure 7 ) based on smoking status, suggesting a global relationship in gene expression across airway epithelial cells in response to smoking.
- EASE analysis of the leading edge subsets from figure 5 reveals that overrepresented functional categories from these gene lists include oxidoreductase activity, metal-ion binding, and electron transport activity (see Table 13).
- Buccal epithelial cells were collected on 25 subjects (11 for the buccal microarray study, 14 for the mass spectrometry validation) as previously reported ( Spira et. al. 2004, Biotechniques ). Briefly, we developed a non-invasive method for obtaining small amounts of RNA from the mouth using a concave plastic tool with serrated edges. Using gentle pressure, the serrated edge was scraped 5 times against the buccal mucosa on the inside left cheek and placed immediately into 1mL of RNALATER (Qiagen, Valencia, CA). The procedure was repeated for the inside right cheek and the cellular material was combined into one tube.
- RNALATER Qiagen, Valencia, CA
- RNA was isolated from the cell pellet using TRIZOL® reagent (Invitrogen, Carlsbad, CA) according to the manufacturer's protocol. The integrity of the RNA was confirmed on an RNA denaturing gel. Epithelial cell content was quantified by cytocentrifugation at 700 x g (Cytospin, ThermoShandon, Pittsburgh, PA) of the cell pellet and staining with a cytokeratin antibody (Signet, Dedham, MA). Using this protocol, we were able to obtain an average of 1823ng +/- 1243ng of total RNA per collection. Buccal epithelial cells were collected serially over 6 weeks in order to obtain a minimum of 8ug of RNA per subject. For the 14 subjects included in the mass spectrometry validation, a single collection was sufficient.
- Nasal epithelial cells were collected by first anesthesizing the right nare with 1cc of 1% lidocaine.
- a nasal.speculum Bionix, Toledo OH
- a standard cytology brush Cytosoft Brush, Medical Packaging Corporation, Camarillo CA
- the brush was rotated in place once, removed, and immediately placed in 1mL RNA Later (Qiagen, Valencia, CA). After storage at 4 degrees overnight, RNA was isolated via Qiagen RNEASY® Mini Kits per manufacturer's protocol. As above, the integrity of RNA was confirmed with an RNA denaturing gel and epithelial cell content was quantified by cytocentrifugation.
- a single weighted mean expression level for each gene was derived using MICROARRAY SUITE 5.0 (MAS 5.0) software (Affymetrix, Santa Clara, CA).
- the MAS 5.0 software also generated a detection P value [P(detection)] using a one-sided Wilcoxon sign-ranked test, which indicated whether the transcript was reliably detected.
- One buccal mucosa microarray sample was excluded from further analysis based on the percentage of genes detected being lower than two standard deviations from the median percentage detected across all buccal mucosa microarray samples, leaving 10 samples for further analysis. All 15 nasal epithelial cell microarray samples contained sufficiently high percentages of genes detected based on the same criteria, and were all included for further analysis. Microarray data from 57 bronchial epithelial cell samples was obtained from previously published data ( Spira et. al, 2004, PNAS ).
- Microarray data from 7 additional normal human tissues was obtained from datasets in the Gene Expression Omnibus (GEO). The samples were selected from normal, non-diseased tissue, where there were at least 5 samples per tissue type. All samples were run on either Affymetrix HGU133A or HGU133 Plus 2.0 microarrays. Array data from normal tissue samples from the following 7 tissues were used (GEO accession number included): lung (GSE1650), skin (GSE5667), esophagus (GSE1420), kidney (GSE3526), bone marrow (GSE3526), heart (GSE2240), and brain (GSE5389). A detailed breakdown of the array data obtained for these tissues can be seen in Table 12.
- Microarray data from buccal mucosa, nasal epithelium, and bronchial epithelial cell samples, as well at normal tissue samples from the 8 datasets listed above were each normalized using MAS 5.0, where the mean intensity for each array (excluding the top and bottom 2% of genes) was corrected using a scaling factor to set the average target intensity of all probes on the chip to 100.
- tissue samples run on the HGU133 Plus 2.0 arrays only those probe sets in common with the HGU133A array were selected and normalized using MATLAB Student Version 7.1 (The Mathworks, Inc.), where the mean intensity of the selected probes (excluding the top and bottom 2% of genes) was corrected using a scaling factor to set the average target intensity of the remaining probes to 100.
- Clinical information, array data, and gene annotations are stored in an interactive MYSQL database coded in PERL (37). All statistical analyses described below and within the database were performed using the R v. 2.2.0 software (38). The gene annotations used for each probe set were from the December 2004 NetAffx HG-U133A annotation files.
- PCA Principal component analysis
- Functional annotation clustering was performed using the EASE software package (40) to determine overrepresented sets of functional groups ("functional sets") among the normal airway transcriptome. Each functional group within a cluster was given a p-value, determined by a Fisher-Exact test. The significance of the functional cluster was then determined by taking the geometric mean of the p-values of each functional group in the cluster. To limit the number of functional sets returned by EASE, only functional groups from the Gene Ontology (GO) database below the 5th hierarchical node were used.
- GO Gene Ontology
- V X - 1 ... i ⁇ COV ⁇ X - G ⁇ 1 ... X - Gk )
- Gk is the expression of gene G across all the samples in tissue type k
- i is the total number of genes in a functional cluster
- COV is the coefficient of variation (standard deviation divided by mean) of the average expression of gene G across all tissue types. This produced one variability metric (V) for each functional cluster. All the genes in each functional cluster were then analyzed using 2D hierarchical clustering performed by using log-transformed z-score normalized data with a Pearson correlation (uncentered) similarity metric and average linkage clustering with CLUSTER and TREEVIEW software (41).
- genes from the normal airway transcriptome included in functional categories commonly expressed in airway epithelial cells were examined.
- the functional categories explored were mucin, dynein, microtubule, cytochrome p450, glutathione, aldehyde dehydrogenase, and keratin. Genes from these categories were determined by selecting all those genes from the normal airway transcriptome that were also included in any of these functional groups based on their gene annotation. Fifty-nine genes from the normal airway transcriptome which also spanned the functional categories of interest were further analyzed across the 10 tissues types using supervised hierarchical clustering.
- a second nasal epithelial dataset ( Wright et. al, 2006, Am J Respir Cell Mol Biol. ) was included for further analysis to determine the reproducibility of the expression patterns observed in nasal epithelium compared to other tissues.
- 11 nasal epithelial samples from this second dataset (GSE2395) which were used in place of our original 8 nasal samples to determine the reproducibility of gene expression patterns and relationships between nasal epithelium and other tissues.
- PCA was performed across 82 smoker and non-smoker samples (57 bronchial, 10 buccal, 15 nasal) using 361 genes differentially expressed between smokers and non-smokers in bronchial epithelial cells (p ⁇ .001), as determined from a prior study ( Spira et. al, 2004, PNAS ).
- GSEA Gene set enrichment analysis
- Table 12 below shows breakdown of all microarray datasets analyzed in this study.
- Category Tissue # Samples Platform GEO reference Sample Description epithelial Mouth 5 U133A n/a 5 never smokers epithelial Bronch 23 U133A GSE994 23 never smokers epithelial Nose 8 U133A n/a 8 never smokers epithelial Nose 11 U133A GSE2395 normal nasal epithelium, from cystic fibrosis study epithelial Lung 14 U133A GSE1650 from COPD study, no/mild emphezyma patients epithelial Skin 5 U133A GSE5667 normal skin tissue Epithelial Esophagus 8 U133A GSE1420 normal esophageal epithelium mostly epithelial Kidney 8 U133+2.0 GSE3526 4 kidney cortex, 4 kidney medulla (post-mortem) non epithelial Bone marrow 5 U133+2.0 GSE3526 5 bone marrow (post-mortem) non epi
- Table 14 below shows Common overrepresented functional categories among "leading edge subsets” from GSEA analysis. Common EASE molecular functions of leading edge genes from GSEA analysis. P-values were calculated using EASE software. Molecular Function P-value (calculated in EASE) Oxidoreductase activity p ⁇ 1.36 x 10⁻⁶ Electron transporter activity p ⁇ 4.67 x 10⁻⁵ Metal ion binding p ⁇ .02 Monooxygenase activity p ⁇ .02
- Ding, C, Cantor, CR A high-throughput gene expression analysis technique using competitive PCR and matrix-assisted laser desorption ionization time-of-flight MS. PNAS, 2003, 100(6):3059-3064 .
Abstract
a) measuring a biological sample comprising nasal epithelial tissue from the individual for the expression of at least 20 gene transcripts from Table 6;
b) comparing the expression of the at least 20 gene transcripts to a control sample of those transcripts from individuals without cancer,
wherein increased expression of the gene transcripts as indicated by a negative score in the last column of Table 6 and/or decreased expression of the gene transcripts as indicated by a positive score in the last column of Table 6 is indicative of the individual having lung cancer.
Description
- The present invention was made, in part, by support from the National Institutes of Health grant No. HL077498. The United States Government has certain rights to the invention.
- The present application claims the benefit under 35 U.S.C. 119(e) from
U.S. provisional application Serial Number 60/780,552, filed on March 9, 2006 - The present invention is directed to methods for diagnosing lung diseases from nasal epithelial cells using gene expression analysis. More specifically, the invention is directed to diagnostic and prognostic methods for detecting from nasal epithelial cell samples lung diseases, particularly lung cancer in subjects, preferably humans. The invention also provides genes the expression of which can be used to analyze lung diseases from the nasal epithelial cell samples.
- Lung disorders represent a serious health problem in the modem society. For example, lung cancer claims more than 150,000 lives every year in the United States, exceeding the combined mortality from breast, prostate and colorectal cancers. Cigarette smoking is the most predominant cause of lung cancer. Presently, 25% of the U.S. population smokes, but only 10% to 15% of heavy smokers develop lung cancer. There are also other disorders associated with smoking such as emphysema. There are also health questions arising from people exposed to smokers, for example, second hand smoke. Former smokers remain at risk for developing such disorders including cancer and now constitute a large reservoir of new lung cancer cases. In addition to cigarette smoke, exposure to other air pollutants such as asbestos, and smog, pose a serious lung disease risk to individuals who have been exposed to such pollutants.
- Approximately 85% of all subjects with lung cancer die within three years of diagnosis. Unfortunately survival rates have not changed substantially over the past several decades. This is largely because there are no effective methods for identifying smokers who are at highest risk for developing lung cancer and no effective tools for early diagnosis.
- The methods that are currently employed to diagnose lung cancer include chest X-ray analysis, bronchoscopy or sputum cytological analysis, computer tomographic analysis of the chest, and positron electron tomographic (PET) analysis. However, none of these methods provide a combination of both sensitivity and specificity needed for an optimal diagnostic test.
- We have previously found that a gene group expression pattern analysis from biological samples taken from bronchial epithelial cells permits accurate method for diagnosis and prognosis for development of lung diseases, such as lung cancer (
PCT/US2006/014132 ). - However, the method of sampling epithelial cells from bronchial tissue while less invasive than many other methods has some drawbacks. For example, the patient may not eat or drink for about 6-12 hours prior to the test. Also, if the procedure is performed using a rigid bronchoscope the patient needs general anesthesia involving related risks to the patient. When the method is performed using a flexible bronchoscope, the procedure is performed using local anesthesia. However, several patients experience uncomfortable sensations, such as a sensation of suffocating during such a procedure and thus are relatively resistant for going through the procedure more than once. Also, after the bronchoscopy procedure, the throat may feel uncomfortably scratchy for several days.
- While it has been previously described, that RNA can be isolated from mouth epithelial cells for gene expression analysis (
U.S.S.N. 10/579,376 - Thus, there is significant interest and need in developing simple non-invasive screening methods for assessing an individual's lung disease, such as lung cancer or risk for developing lung cancer, including primary lung malignancies. It would be preferable if such a method would be more accurate than the traditional chest x-ray or PET analysis or cytological analysis, for example by identifying marker genes which have their expression altered at various states of disease progression.
- Therefore, the development of non-invasive tests would be very helpful.
- The present invention provides a much less invasive method for diagnosing lung diseases, such as lung cancer based on analysis of gene expression in nose epithelial cells.
- We have found surprisingly that the gene expression changes in nose epithelial cells closely mirrors the gene expression changes in the lung epithelial cells. Accordingly, the invention provides methods for diagnosis, prognosis and follow up of progression or success of treatment for lung diseases using gene expression analysis from nose epithelial cells.
- We have also found that the gene expression pattern in the bronchial epithelial cells and nasal epithelial cells very closely correlated. This is in contrast with epithelial cell expression pattern in any other tissue we have studies thus far. The genes the expression of which is particularly closely correlated between the lung and the nose are listed in tables 8, 9 and 10.
- The method provides an optimal means for screening for changes indicating malignancies in individuals who, for example are at risk of developing lung diseases, particularly lung cancers because they have been exposed to pollutants, such as cigarette or cigar smoke or asbestos or any other known pollutant. The method allows screening at a routine annual medical examination because it does not need to be performed by an expert trained in bronchoscopy and it does not require sophisticated equipment needed for bronchoscopy.
- We discovered that there is a significant correlation between the epithelial cell gene expression in the brinchial tissue and in the nasal passages. We discovered this by analyzing samples from individuals with cancer as well as by analyzing samples from smokers compared to non-smokers.
- We discovered a strong correlation between the gene expression profile in the bronchial and nasal epithelial cell samples when we analyzed genes that distinguish individuals with known sarcoidosis from individuals who do not have sarcoidosis.
- We also discovered that the same is true, when one compares the changes in the gene expression pattern between smokers and individuals who have never smoked.
- Accordingly, we have found a much less invasive method of sampling for prognostic, diagnostic and follow-up purposes by taking epithelial samples from the nasal passages as opposed to bronchial tissue, and that the same genes that have proven effective predictors for lung diseases, such as lung cancer, in smokers and non-smokers, can be used in analysis of epithelial cells from the nasal passages.
- The gene expression analysis can be performed using genes and/or groups of genes as described in tables 8, 9 and 10 and, for example, in
PCT/US2006/014132 . Naturally, other diagnostic genes may also be used, as they are identified. - Accordingly, the invention provides a substantially less invasive method for diagnosis, prognosis, and follow-up of lung diseases using samples from nasal epithelial cells. To provide an improved analysis, one preferably uses gene expression analysis.
- One can use analysis of gene transcripts individually and in groups or subsets for enhanced diagnosis for lung diseases, such as lung cancer.
- Similarly, as the art continues to identify the gene expression changes associated with other lung diseases wherein the disease causes a field effect, namely, wherein the disease-causing agent, i.e. a pollutant, or a microbe or other airway irritant, the analysis and discoveries presented herein allow us to conclude that those gene expression changes can also be analyzed from nasal epithelial cells thus providing a much less invasive and more accurate method for diagnosing lung diseases in general. For example, using the methods as described, one can diagnose any lung disease that results in detectable gene expression changes, including, but not limited to acute pulmonary eosinophilia (Loeffler's syndrome), CMV pneumonia, chronic pulmonary coccidioidomycosis, cryptococcosis, disseminated tuberculosis (infectious), chronic pulmonary histoplasmosis, pulmonary actinomycosis, pulmonary aspergilloma (mycetoma), pulmonary aspergillosis (invasive type), pulmonary histiocytosis X (eosinophilic granuloma), pulmonary nocardiosis, pulmonary tuberculosis, and sarcoidosis. In fact, one of the examples shows a group of genes the expression of which changes when the individual is affected with sarcoidosis.
- One example of the gene transcript groups useful in the diagnostic/prognostic tests of the invention using nasal epithelial cells are set forth in Table 6. We have found that taking groups of at least 20 of the Table 6 genes provides a much greater diagnostic capability than chance alone.
- Preferably one would use more than 20 of these gene transcript, for example about 20-100 and any combination between, for example, 21, 22, 23, 24, 25, 26, 27, 28, 29, 30, and so on. Our preferred groups are the groups of 361 (Table 8), 107 (Table 9), 70 (Table 10), 96 (Table 1), 84 (Table 2), 50 (Table 3), 36 (Table 4), 80 (Table 5), 535 (Table 6) and 20 (Table 7).
- In some instances, we have found that one can enhance the accuracy of the diagnosis by adding certain additional genes to any of these specific groups. When one uses these groups, the genes in the group are compared to a control or a control group. The control groups can be individuals who have not been exposed to a particular airway irritant, such as non-smokers, smokers, or former smokers, or individuals not exposed to viruses or other substance that can cause a "filed effect" in the airways thus resulting in potential for lung disease. Typically, when one wishes to diagnose a disease, the control sample should be from an individual who does not have the diseases and alternatively include one or more samples with individuals who have similar or different lung diseases. Thus, one can match the sample one wishes to diagnose with a control wherein the expression pattern most closely resembles the expression pattern in the sample. Preferably, one compares the gene transcripts or their expression product in the biological sample of an individual against a similar group, except that the members of the control groups do not have the lung disorder, such as emphysema or lung cancer. For example, comparing can be performed in the biological sample from a smoker against a control group of smokers who do not have lung cancer. When one compares the transcripts or expression products against the control for increased expression or decreased expression, which depends upon the particular gene and is set forth in the tables - not all the genes surveyed will show an increase or decrease. However, at least 50% of the genes surveyed must provide the described pattern. Greater reliability is obtained as the percent approaches 100%. Thus, in one embodiment, one wants at least 55%, 60%, 65%, 70%, 75%, 80%, 85%, 90%, 95%, 98%, or 99% of the genes surveyed to show the altered pattern indicative of lung disease, such as lung cancer, as set forth in the tables, infra.
- In one embodiment, the nasal epithelial cell sample is analyzed for a group of genes the expression of which is altered in individuals who are at risk of developing lung diseases, such as lung cancer, because of the exposure to air pollutants or other airway irritant such as microbes that occur in the air and are inhaled. This is because we have discovered that air pollutant The method can also be used for analysis of groups of genes the expression of which is consistently altered as a group in individuals who are at risk of developing lung diseases because of the exposure to such air pollutants including microbes and viruses present in the air.
- One can analyze the nasal epithelial cells according to the methods of the present invention using gene groups the expression pattern or profile of which can be used to diagnose lung diseases, such as lung cancer and even the type of lung cancer, in more than 60%, preferably more than 65%, still more preferably at least about 70%, still more preferably about 75%, or still more preferably about 80%-95% accuracy from a sample taken from airways of an individual screened for a lung disease, such as lung cancer.
- In one embodiment, the invention provides a method of diagnosing a lung disease such as lung cancer using a combination of nasal epithelial cells and the analysis of gene expression pattern of the gene groups as described in the present invention.
- Accordingly, the invention provides methods for analyzing gene groups from nasal epithelial cells, wherein the gene expression pattern that can be directly used in diagnosis and prognosis of lung diseases. Particularly, the invention provides analysis from nasal epithelial cells groups of genes the expression profile of which provides a diagnostic and or prognostic test to determine lung disease in an individual exposed to air pollutants. For example, the invention provides analysis from nasal epithelial cells, groups of genes the expression profile of which can distinguish individuals with lung cancer from individuals without lung cancer.
- In one embodiment, the invention provides an early asymptomatic screening system for lung cancer by using the analysis of nasal epithelial cells for the disclosed gene expression profiles. Such screening can be performed, for example, in similar age groups as colonoscopy for screening colon cancer. Because early detection in lung cancer is crucial for efficient treatment, the gene expression analysis system of the present invention provides an improved method to detect tumor cells. Thus, the analysis can be made at various time intervals, such as once a year, once every other year for screening purposes. Alternatively, one can use a more frequent sampling if one wishes to monitor disease progression or regression in response to a therapeutic intervention. For example, one can take samples from the same patient once a week, once or two times a month, every 3, 4, 5, or 6 months.
- The probes that can be used to measure expression of the gene groups of the invention can be nucleic acid probes capable of hybridizing to the individual gene/transcript sequences identified in the present invention, or antibodies targeting the proteins encoded by the individual gene group gene products of the invention. The probes are preferably immobilized on a surface, such as a gene or protein chip so as to allow diagnosis and prognosis of lung diseases in an individual.
- In one preferred embodiment, the invention provides a group of genes that can be used in diagnosis of lung diseases from the nasal epithelial cells. These genes were identified using
- In one embodiment, the invention provides a group of genes that can be used as individual predictors of lung disease. These genes were identified using probabilities with a t-test analysis and show differential expression in smokers as opposed to non-smokers. The group of genes comprise ranging from 1 to 96, and all combinations in between, for example 5, 10, 15, 20, 25, 30, for example at least 36, at least about, 40, 45, 50, 60, 70, 80, 90, or 96 gene transcripts, selected from the group consisting of genes identified by the following GenBank sequence identification numbers (the identification numbers for each gene are separated by ";" while the alternative GenBank ID numbers are separated by "///"): NM_003335; NM_000918; NM_006430.1; NM_001416.1; NM_004090; NM_006406.1; NM_003001.2; NM_001319; NM_006545.1; NM_021145.1; NM_002437.1; NM_006286; NM_001003698 /// NM_001003699 ///NM_002955; NM_001123 /// NM_006721; NM_024824; NM_004935.1; NM_002853.1; NM_019067.1; NM_024917.1; NM_020979.1; NM_005597.1; NM_007031.1; NM_009590.1; NM_020217.1; NM_025026.1; NM_014709.1; NM_014896.1; AF010144; NM_005374.1; NM_001696; NM_005494 /// NM_058246; NM_006534 /// NM_181659; NM_006368; NM_002268 /// NM_032771; NM_014033; NM_016138; NM_007048 /// NM_194441; NM_006694; NM_000051 /// NM_138292 /// NM_138293; NM_000410 /// NM_139002 /// NM_139003 /// NM_139004 /// NM_139005 /// NM_139006 /// NM_139007 /// NM_139008 /// NM_139009 /// NM_139010 /// NM_139011; NM_004691; NM_012070 /// NM_139321 /// NM_139322; NM_006095; AI632181; AW024467; NM_021814; NM_005547.1; NM_203458; NM_015547 /// NM_147161; AB007958.1; NM_207488; NM_005809 /// NM_181737 /// NM_181738; NM_016248 /// NM_144490; AK022213.1; NM_005708; NM_207102; AK023895; NM_144606 /// NM_144997; NM_018530; AK021474; U43604.1; AU147017; AF222691.1; NM_015116; NM_00I005375 /// NM_001005785 /// NM_001005786 /// NM_004081 /// NM_020363 /// NM_020364 /// NM_020420; AC004692; NM_001014; NM_000585 /// NM_172174 /// NM_172175; NM_054020 /// NM_172095 /// NM_172096 /// NM_172097; BE466926; NM_018011; NM_024077; NM_012394; NM_019011 /// NM_207111 /// NM_207116; NM_017646; NM_021800; NM_016049; NM_014395; NM_014336; NM_018097; NM_019014; NM_024804; NM_018260; NM_018118; NM_014128; NM_024084; NM_005294; AF077053; NM_138387; NM_024531; NM_000693; NM_018509; NM_033128; NM_020706; AI523613; and NM_014884, the expression profile of which can be used to diagnose lung disease, for example lung cancer, in lung cell sample from a smoker, when the expression pattern is compared to the expression pattern of the same group of genes in a smoker who does not have or is not at risk of developing lung cancer.
- In another embodiment, the gene/transcript analysis comprises a group of about 10-20, 20-30, 30-40, 40-50, 50-60, 60-70, 70-80, 80, 80-90, 90-100, 100-120, 120-140, 140-150, 150-160, 160-170, 170-180, 180-190, 190-200, 200-210, 210-220, 220-230, 230-240, 240-250, 250-260, 260-270, 270-280, 280-290, 290-300, 300-310, 310-320, 320-330, 330-340, 340-350, 350-360, 360-370, 370-380, 380-390, 390-400, 400-410, 410-420, 420-430, 430-440, 440-450, 450-460, 460-470, 470-480, 480-490, 490-500, 500-510, 510-520, 520-530, and up to about 535 genes selected from the group consisting of genes or transcripts as shown in the Table 6.
- In one embodiment, the genes are selected from the group consisting of genes or transcripts as shown in Table 5.
- In another embodiment, the genes are selected from the genes or transcripts as shown in Table 7.
- In one embodiment, the transcript analysis gene group comprises a group of individual genes the change of expression of which is predictive of a lung disease either alone or as a group, the gene transcripts selected from the group consisting of NM_007062.1; NM_001281.1; BC002642.1; NM_000346.1; NM_006545.1; BG034328; NM_019067.1; NM_017925.1; NM_017932.1; NM_030757.1; NM_030972.1; NM_002268 /// NM_032771; NM_007048 /// NM_194441; NM_006694; U85430.1; NM_004691; AB014576.1; BF218804; BE467941; R83000; AL161952.1; AK023843.1; AK021571.1; AK023783.1; AL080112.1; AW971983; AI683552; NM_024006.1; AK026565.1; NM_014182.1; NM_021800.1; NM_016049.1; NM_021971.1; NM_014128.1; AA133341; AF198444.1.
- In one embodiment, the gene group comprises a probe set capable of specifically hybridizing to at least all of the 36 gene products. Gene product can be mRNA which can be recognized by an oligonucleotide or modified oligonucleotide probe, or protein, in which case the probe can be, for example an antibody specific to that protein or an antigenic epitope of the protein.
- In yet another embodiment, the invention provides a gene group, wherein the expression pattern of the group of genes provides diagnostic for a lung disease. The gene group comprises gene transcripts encoded by a gene group consisting of at least for example 5, 10, 15, 20, 25, 30, preferably at least 36, still more preferably 40, still more preferably 45, and still more preferably 46, 47, 48, 49, or all 50 of the genes selected from the group consisting of and identified by their GenBank identification numbers: NM_007062.1; NM_001281.1; BC000120.1; NM_014255.1; BC002642.1; NM_000346.1; NM_006545.1; BG034328; NM_021822.1; NM_021069.1; NM_019067.1; NM_017925.1; NM_017932.1; NM_030757.1; NM_030972.1; AF126181.1; U 93240.1; U90552.1; AF151056.1; U85430.1; U51007.1; BC005969.1; NM_002271.1; AL566172; AB014576.1; BF218804; AK022494.1; AA114843; BE467941; NM_003541.1; R83000; AL161952.1; AK023843.1; AK021571.1; AK023783.1; AU147182; AL080112.1; AW971983; AI683552; NM_024006.1; AK026565.1; NM_014182.1; NM_021800.1; NM_016049.1; NM_019023.1; NM_021971.1; NM_014128.1; AK025651.1; AA133341; and AF198444.1. In one preferred embodiment, one can use at least 20 of the 36 genes that overlap with the individual predictors and, for example, 5-9 of the non-overlapping genes and combinations thereof.
- In another embodiment, the invention provides a group of about 30-180, preferably, a group of about 36-150 genes, still more preferably a group of about 36-100, and still more preferably a group of about 36-50 genes, the expression profile of which is diagnostic of lung cancer in individuals who smoke.
- In one embodiment, the invention provides a group of genes the expression of which is decreased in an individual having lung cancer. In one embodiment, the group of genes comprises at least 5-10, 10-15, 15-20, 20-25 genes selected from the group consisting of NM_000918; NM_006430.1; NM_001416.1; NM_004090; NM_006406.1; NM_003001.2; NM_006545.1; NM_002437.1; NM_006286; NM_001123 /// NM_006721; NM_024824; NM_004935.1; NM_001696; NM_005494 /// NM_058246; NM_006368; NM_002268 /// NM_032771; NM_006694; NM_004691; NM_012394; NM_021800; NM_016049; NM_138387; NM_024531; and NM_018509. One or more other genes can be added to the analysis mixtures in addition to these genes.
- In another embodiment, the group of genes comprises genes selected from the group consisting of NM_014182.1; NM_001281.1; NM_024006.1; AF135421.1; L76200.1; NM_000346.1; BC008710.1; BC000423.2; BC008710.1; NM_007062; BC075839.1 /// BC073760.1; BC072436.1 /// BC004560.2; BC001016.2; BC005023.1; BC000360.2; BC007455.2; BC*023528.2 /// BC047680.1; BC064957.1; BC008710.1; BC066329.1; BC023976.2; BC008591.2 /// BC050440.1 /// BC048096.1; and BC028912.1.
- In yet another embodiment, the group of genes comprises genes selected from the group consisting of NM_007062.1; NM_001281.1; BC000120.1; NM_014255.1; BC002642.1; NM_000346.1; NM_006545.1; BG034328; NM_021822.1; NM_021069.1; NM_019067.1; NM_017925.1; NM_017932.1; NM_030757.1; NM_030972.1; AF126181.1; U93240.1; U90552.1; AF151056.1; U85430.1; U51007.1; BC005969.1; NM 002271.1; AL566172; and AB014576.1.
- In one embodiment, the invention provides a group of genes the expression of which is increased in an individual having lung cancer. In one embodiment, the group of genes comprises genes selected from the group consisting of NM_003335; NM_001319; NM_021145.1; NM_001003698 /// NM_001003699 ///; NM_002955; NM_002853.1; NM_019067.1; NM_024917.1; NM_020979.1; NM_005597.1; NM_007031.1; NM_009590.1; NM_020217.1; NM_025026.1; NM_014709.1; NM_014896.1; AF010144; NM_005374.1; NM_006534 /// NM_181659; NM_014033; NM_016138; NM_007048 /// NM_194441; NM_000051 /// NM_138292 /// NM_138293; NM_000410 /// NM_139002 /// NM_139003 /// NM_139004 /// NM_139005 /// NM_139006 /// NM_139007 /// NM_139008 /// NM_139009 /// NM_139010 /// NM_139011; NM_012070 /// NM_139321 /// NM_139322; NM_006095; AI632181; AW024467; NM_021814; NM_005547.1; NM_203458; NM_015547 /// NM_147161; AB007958.1; NM_207488; NM_005809 /// NM_181737 /// NM_181738; NM_016248 /// NM_144490; AK022213.1; NM_005708; NM_207102; AK023895; NM_144606 /// NM_144997; NM_018530; AK021474; U43604.1; AU147017; AF222691.1; NM_015116; NM_001005375 /// NM_001005785 /// NM_001005786 /// NM_004081 /// NM_020363 /// NM_020364 /// NM_020420; AC004692; NM_001014; NM_000585 /// NM_172174 /// NM_172175; NM_054020 /// NM_172095 /// NM_172096 /// NM_172097; BE466926; NM_018011; NM_024077; NM_019011 /// NM_207111 /// NM_207116; NM_017646; NM_014395; NM_014336; NM_018097; NM_019014; NM_024804; NM_018260; NM_018118; NM_014128; NM_024084; NM_005294; AF077053; NM_000693; NM-033128; NM_020706; AI523613; and NM_014884.
- In one embodiment, the group of genes comprises genes selected from the group consisting of NM_030757.1; R83000; AK021571.1; NM_17932.1; U85430.1; AI683552; BC002642.1; AW024467; NM_030972.1; BC021135.1; AL161952.1; AK026565.1; AK023783.1; BF218804; AK023843.1; BC001602.1; BC034707.1; BC064619.1; AY280502.1; BC059387.1; BC061522.1; U50532.1; BC006547.2; BC008797.2; BC000807.1; AL080112.1; BC033718.1 /// BC046176.1 ///; BC038443.1; Hs.288575 (UNIGENE ID); AF020591.1; BC002503.2; BC009185.2; Hs.528304 (UNIGENE ID); U50532.1; BC013923.2; BC031091; Hs.249591 (Unigene ID); Hs.286261 (Unigene ID); AF348514.1; BC066337.1 /// BC058736.1 /// BC050555.1; Hs.216623 (Unigene ID); BC072400.1; BC041073.1; U43965.1; BC021258.2; BC016057.1; BC016713.1 /// BC014535.1 /// AF237771.1; BC000701.2; BC010067.2; Hs.156701 (Unigene ID); BC030619.2; U43965.1; Hs.438867 (Unigene ID); BC035025.2 /// BC050330.1; BC074852.2 /// BC074851.2; Hs.445885 (Unigene ID); AF365931.1; and AF257099.1.
- In one embodiment, the group of genes comprises genes selected from the group consisting of BF218804; AK022494.1; AA114843; BE467941; NM_003541.1; R83000; AL161952.1; AK023843.1; AK021571.1; AK023783.1; AU147182; AL080112.1; AW971983; AI683552; NM_024006.1; AK026565.1; NM_014182.1; NM_021800.1; NM_016049.1; NM_019023.1; NM_021971.1; NM_014128.1; AK025651.1; AA133341; and AF 198444.1.
- In another embodiment, the invention provides a method for diagnosing a lung disease comprising obtaining a nucleic acid sample from lung, airways or mouth of an individual exposed to an air pollutant, analyzing the gene transcript levels of one or more gene groups provided by the present invention in the sample, and comparing the expression pattern of the gene group in the sample to an expression pattern of the same gene group in an individual, who is exposed to similar air pollutant but not having lung disease, such as lung cancer or emphysema, wherein the difference in the expression pattern is indicative of the test individual having or being at high risk of developing a lung disease. The decreased expression of one or more of the genes, preferably all of the genes including the genes listed on Tables 1-4 as "down" when compared to a control, and/or increased expression of one or more genes, preferably all of the genes listed on Tables 1-4 as "up" when compared to an individual exposed to similar air pollutants who does not have a lung disease, is indicative of the person having a lung disease or being at high risk of developing a lung disease, preferably lung cancer, in the near future and needing frequent follow ups to allow early treatment of the disease.
- In one preferred embodiment, the lung disease is lung cancer. In one embodiment, the air pollutant is tobacco or tobacco smoke.
- Alternatively, the diagnosis can separate the individuals, such as smokers, who are at lesser risk of developing lung diseases, such as lung cancer by analyzing from the nasal epithelial cells the expression pattern of the gene groups of the invention provides a method of excluding individuals from invasive and frequent follow ups.
- Accordingly, in one embodiment, the invention provides methods for prognosis, diagnosis and therapy designs for lung diseases comprising obtaining an nasal epithelial cell sample from an individual who smokes and analyzing expression profile of the gene groups of the present invention, wherein an expression pattern of the gene group that deviates from that in a healthy age, race, and gender matched smoker, is indicative of an increased risk of developing a lung disease. Tables 1-4 indicate the expression pattern differences as either being down or up as compared to a control, which is an individual exposed to similar airway pollutant but not affected with a lung disease.
- The invention also provides methods for prognosis, diagnosis and therapy designs for lung diseases comprising obtaining an nasal epithelial cell sample from a non-smoker individual and analyzing expression profile of the gene groups of the present invention, wherein an expression pattern of the gene group that deviates from that in a healthy age, race, and gender matched smoker, is indicative of an increased risk of developing a lung disease.
- In one embodiment, the analysis is performed using nucleic acids, preferably RNA, in the biological sample.
- In one embodiment, the analysis is performed analyzing the amount of proteins encoded by the genes of the gene groups of the invention present in the sample.
- In one embodiment the analysis is performed using DNA by analyzing the gene expression regulatory regions of the groups of genes of the present invention using nucleic acid polymorphisms, such as single nucleic acid polymorphisms or SNPs, wherein polymorphisms known to be associated with increased or decreased expression are used to indicate increased or decreased gene expression in the individual. For example, methylation patterns of the regulatory regions of these genes can be analyzed.
- In one embodiment, the present invention provides a minimally invasive sample procurement method for obtaining nasal epithelial cell RNA that can be analyzed by expression profiling of the groups of genes, for example, by array-based gene expression profiling. These methods can be used to diagnose individuals who are already affected with a lung disease, such as lung cancer, or who are at high risk of developing lung disease, such as lung cancer, as a consequence of being exposed to air pollutants. These methods can also be used to identify further patterns of gene expression that are diagnostic of lung disorders/diseases, for example, cancer or emphysema, and to identify subjects at risk for developing lung disorders.
- The invention further provides a method of analyzing nasal epithelial cells using gene group microarray consisting of one or more of the gene groups provided by the invention, specifically intended for the diagnosis or prediction of lung disorders or determining susceptibility of an individual to lung disorders.
- In one embodiment, the invention relates to a method of diagnosing a disease or disorder of the lung comprising obtaining a sample from nasal epithelial cells, wherein the sample is a nucleic acid or protein sample, from an individual to be diagnosed; and determining the expression of group of identified genes in said sample, wherein changed expression of such gene compared to the expression pattern of the same gene in a healthy individual with similar life style and environment is indicative of the individual having a disease of the lung.
- In one embodiment, the invention relates to a method of diagnosing a disease or disorder of the lung comprising obtaining at least two nasal epithelial samples, wherein the samples are either nucleic acid or protein samples, in at least one, two, 3, 4, 5, 6, 7, 8, 9, or more time intervals from an individual to be diagnosed; and determining the expression of the group of identified genes in said sample, wherein changed expression of at least about for example 5, 10, 15, 20, 25, 30, preferably at least about 36, 40, 50, 60, 70, 80, 90, 100, 110, 120, 130, 140, 150, 160, 170, or 180 of such genes in the sample taken later in time compared to the sample taken earlier in time is diagnostic of a lung disease.
- In one embodiment, the disease of the lung is selected from the group consisting of asthma, chronic bronchitis, emphysema, primary pulmonary hypertension, acute respiratory distress syndrome, hypersensitivity pneumonitis, eosinophilic pneumonia, persistent fungal infection, pulmonary fibrosis, systemic sclerosis, idiopathic pulmonary hemosiderosis, pulmonary alveolar proteinosis, and lung cancer, such as adenocarcinoma, squamous cell carcinoma, small cell carcinoma, large cell carcinoma, and benign neoplasm of the lung (e.g., bronchial adenomas and hamartomas).
- In a particular embodiment, the nucleic acid sample is RNA.
- In one embodiment, individual to be diagnosed is an individual who has been exposed to tobacco smoke, an individual who has smoked, or an individual who currently smokes.
- The invention also provides analysis of nasal epithelial cells using an array, for example, a microarray for diagnosis of a disease of the lung having immobilized thereon a plurality of oligonucleotides which hybridize specifically to genes of the gene groups which are differentially expressed in airways exposed to air pollutants, such as cigarette smoke, and have or are at high risk of developing lung disease, as compared to those individuals who are exposed to similar air pollutants and airways which are not exposed to such pollutants. In one embodiment, the oligonucleotides hybridize specifically to one allelic form of one or more genes which are differentially expressed for a disease of the lung. In a particular embodiment, the differentially expressed genes are selected from the group consisting of the genes shown in tables 1-4; preferably the group of genes comprises genes selected from the Table 3. In one preferred embodiment, the group of genes comprises the group of at least 20 genes selected from Table 3 and additional 5-10 genes selected from Tables 1 and 2. In one preferred embodiment, at least about 10 genes are selected from Table 4.
-
Figure 1 shows hierarchical clustering of bronchial airway epithelial samples from current (striped box) and never (white box) smokers according to the expression of 60 genes whose expression levels are altered by smoking in the nasal epithelium. Airway samples tend to group with their appropriate class. Dark grey indicates higher level of expression and light grey lower level of expression. -
Figure 2 shows hierarchical clustering of nasal epithelial samples from patients with sarcoid (stiped box) and normal healthy volunteers (white box) according to the expression of top 20 t-test genes that differ between the 2 groups (P < .00005). With few exceptions, samples group into their appropriate classes. Light grey= low level of expression, black=mean level of expression, dark grey= high level of expression. -
Figure 3 shows smoking related genes in mouth, nose and bronchus. Principal component analysis (PCA) shows the variation in expression of genes affected by tobacco exposure in current smokers (dark grey) and never smokers (black). Airway epithelium type is indicated by the symbol shape: bronchial (circle), nasal (triangle) and mouth (square). Samples largely separate by smoking status across the first principal component, with the exception of samples from mouth. This indicates a common gene expression host response that can be seen both in the bronchial epithelial tissue and the nasal epithelial tissue. -
Figure 4 shows a supervised hierarchical clustering analysis of cancer samples. Individuals with sarcoidosis and individuals with no sarcoids were sampled from both lung tissues and nasal tissues. Gene expression analysis showed that expression of 37 genes can be used to differentiate the cancer samples and non-cancer sampled either from bronchial or nasal epithelial cells. Light grey in the clustering analysis indicates low level of expression and dark grey high level of expression. Asterisk next to the circles indicates that these samples were from an individual with stage 0-1 sarcoidosis. The dot next to the circle indicates that these samples were from an individual with astage 4 sarcoidosis. -
Figure 5 shows airway t-test genes projected on nose data including the 107 leading edge genes as shown in Table 9. Enrichment of differentially expressed bronchial epithelial genes among genes highly changed in the nasal epithelium in response to smoking. Results from GSEA analysis shows the leading edge of the set of 361 differentially expressed bronchial epithelial genes being overrepresented among the top ranked list of genes differentially expressed in nasal epithelium cells in response to smoking. There are 107 genes that comprise the "leading edge subset" (p < 0.001). -
Figure 6 shows 107 Leading Edge Genes from Airway - PCA on Nose Samples. Asterisk next to the circle indicates current smokers. Dark circles represent samples from never smokers. Principal component analysis of 107 "leading edge" genes from bronchial epithelial cells enriched in the nasal epithelial gene expression profile. Two dimensional PCA of the 107 "leading edge" genes from the bronchial epithelial signature that are enriched in the nasal epithelial cell expression profile. -
Figure 7 shows a Bronch projection from 10 tissues. From this figure one can see, that the samples from bronchial epithelial cells (dotted squares) and the samples from nose epithelial cells (crossed squares) overlapped closely and were clearly distinct from samples from other tissues, including mouth. Principal component analysis of 2382 genes from normal airway transcriptome across 10 tissues. Principal component analysis (PCA) of 2382 genes from the normal airway transcriptome across 10 different tissue types. Samples separate based on expression of transcriptome genes. -
Figure 8 shows a hierarchical clustering of 51 genes across epithelial cell functional categories. Supervised hierarchical clustering of 51 genes spanning mucin, dynein/microtubule, cytochrome P450, glutathione, and keratin functional gene categories. The 51 genes were clustered across the 10 tissue types separately for each functional group. - The present invention describes a novel method for prognosis and diagnosis and follow-up for lung diseases. The method is based on detecting gene expression changes of nose epithelial cells which we have discovered closely mirror the gene expression changes in the lung.
- Specifically, we have discovered that similar patterns of gene expression changes can be found in the nose epithelial cells when compared to lung epithelial changes in two model systems. In one experiment, we showed that a host gene expression in response to tobacco smoke is similar whether it is measured from the lung epithelial cells or from the nasal epithelial cells (
Figure 3 ). Accordingly, we have discovered that we can rely on the results and data obtained woith bronchial epithelial cells. This correlation is similar, typically better than 75%, even if it is not identical. Thus, by looking at the same gene groups that are diagnostic and/or prognostic for bronchial epithelial cells those groups are also diagnostic and/or prognostic for nasal epithelial cells. We also showed that gene expression changes distinguishing between individuals affected with a lung diseases, such as sarcoidosis, and from individuals not affected with that diseases. - Accordingly, the invention provides a substantially less invasive method for diagnosis, prognosis and follow-up of lung diseases using gene expression analysis of samples from nasal epithelial cells.
- One can take the nose epithelial cell sample from an individual using a brush or a swab. One can collect the nose epithelial cells in any way known to one skilled in the art. For example one can use nasal brushing. For example, one can collect the nasal epithelial cells by brushing the inferior turbinate and/or the adjacent lateral nasal wall. For example, following local anesthesia with 2% lidocaine solution, a CYROBRUSH® (MedScand Medical, Malmö, Sweden) or a similar device, is inserted into the nare, for example the right nare, and under the inferior turbinate using a nasal speculum for visualization. The brush is turned a couple of times, for example 1, 2, 3, 4, 5 times, to collect epithelial cells.
- To isolate nucleic acids from the cell sample, the cells can be placed immediately into a solution that prevents nucleic acids from degradation. For example, if the cells are collected using the CYTOBRUSH, and one wishes to isolate RNA, the brush is placed immediately into an RNA stabilizer solution, such as RNALATER®, AMBION®, Inc.
- One can also isolate DNA. After brushing, the device can be placed in a buffer, such as phosphate buffered saline (PBS) for DNA isolation.
- The nucleic acids are then subjected to gene expression analysis. Preferably, the nucleic acids are isolated and purified. However, if one uses techniques such as microfluidic devises, cells may be placed into such device as whole cells without substantial purification.
- In one preferred embodiment, one analyzes gene expression from nasal epithelial cells using gene/transcript groups and methods of using the expression profile of these gene/transcript groups in diagnosis and prognosis of lung diseases.
- We provide a method that is much less invasive than analysis of bronchial samples. The method provided herein not only significantly increases the diagnostic accuracy of lung diseases, such as lung cancer, but also make the analysis much less invasive and thus much easier for the patients and doctors to perform. When one combines the gene expression analysis of the present invention with bronchoscopy, the diagnosis of lung cancer is dramatically better by detecting the cancer in an earlier stage than any other available method to date, and by providing far fewer false negatives and/or false positives than any other available method.
- In one embodiment, one analyzes the nasal epithelial calls for a group of gene transcripts that one can use individually and in groups or subsets for enhanced diagnosis for lung diseases, such as lung cancer, using gene expression analysis.
- On one embodiment, the invention provides a group of genes useful for lung disease diagnosis from a nasal epithelial cell sample as listed in Tables 8, 9, and/or 10.
- In one embodiment, one would analyze the nasal epithelial cells using at least one and no more than 361 of the genes listed in Table 8. For example, one can analyze 1, 2, 3, 4, 5, 6, 7, 8, 9, 10, 10-15, 15-20, 20-30, 30-40, 40-50, at least 10, at least 20, at least 30, at least 40 at least 50, at least 60, at least 70, at least 80, at least 90, at least 100, at least 110, at least 120, at least 130, at least 140, at least 150, at least 160, at least or at maximum of 170, at least or at maximum of 180, at least or at maximum of 190, at least or at maximum of 200, 210, 220, 230, 240, 250, 260, 270, 280, 290, 300, 310, 320, 330, 340, 350, 360, or at least 361 or at maximum of the 361 genes of genes as listed on Table 8.
- In one embodiment, the invention provides genes
- One example of the gene transcript groups useful in the diagnostic/prognostic tests of the invention is set forth in Table 6. We have found that taking any group that has at least 20 of the Table 6 genes provides a much greater diagnostic capability than chance alone and that these changes are substantially the same in the nasal epithelial cells than they are in the bronchial samples as described in
PCT/US2006/014132 . - Preferably one would analyze the nasal epithelial cells using more than 20 of these gene transcript, for example about 20-100 and any combination between, for example, 21, 22, 23, 24, 25, 26, 27, 28, 29, 30, and so on. Our preferred groups are the groups of 96 (Table 1), 84 (Table 2), 50 (Table 3), 36 (Table 4), 80 (Table 5), 535 (Table 6) and 20 (Table 7). In some instances, we have found that one can enhance the accuracy of the diagnosis by adding additional genes to any of these specific groups.
- Naturally, following the teachings of the present invention, one may also include one or more of the genes and/or transcripts presented in Tables 1-7 into a kit or a system for a multicancer screening kit. For example, any one or more genes and or transcripts from Table 7 may be added as a lung cancer marker for a gene expression analysis.
- When one uses these groups, the genes in the group are compared to a control or a control group. The control groups can be non-smokers, smokers, or former smokers. Preferably, one compares the gene transcripts or their expression product in the nasal epithelial cell sample of an individual against a similar group, except that the members of the control groups do not have the lung disorder, such as emphysema or lung cancer. For example, comparing can be performed in the nasal epithelial cell sample from a smoker against a control group of smokers who do not have lung cancer. When one compares the transcripts or expression products against the control for increased expression or decreased expression, which depends upon the particular gene and is set forth in the tables - not all the genes surveyed will show an increase or decrease. However, at least 50% of the genes surveyed must provide the described pattern. Greater reliability if obtained as the percent approaches 100%. Thus, in one embodiment, one wants at least 55%, 60%, 65%, 70%, 75%, 80%, 85%, 90%, 95%, 98%, 99% of the genes surveyed to show the altered pattern indicative of lung disease, such as lung cancer, as set forth in the tables as shown below.
- The presently described gene expression profile can also be used to screen for individuals who are susceptible for lung cancer. For example, a smoker, who is over a certain age, for example over 40 years old, or a smoker who has smoked, for example, a certain number of years, may wish to be screened for lung cancer. The gene expression analysis from nasal epithelial cells as described herein can provide an accurate very early diagnosis for lung cancer. This is particularly useful in diagnosis of lung cancer, because the earlier the cancer is detected, the better the survival rate is.
- For example, when we analyzed the gene expression results, we found, that if one applies a less stringent threshold, the group of 80 genes as presented in Table 5 are part of the most frequently chosen genes across 1000 statistical test runs (see Examples below for more details regarding the statistical testing). Using random data, we have shown that no random gene shows up more than 67 times out of 1000. Using such a cutoff, the 535 genes of Table 6 in our data show up more than 67 times out of 1000. All the 80 genes in Table 5 form a subset of the 535 genes. Table 7 shows the top 20 genes which are subset of the 535 list. The direction of change in expression is shown using signal to noise ratio. A negative number in Tables 5, 6, and 7 means that expression of this gene or transcript is up in lung cancer samples. Positive number in Table 5, 6, and 7, indicates that the expression of this gene or transcript is down in lung cancer.
- Accordingly, any combination of the genes and/or transcripts of Table 6 can be used. In one embodiment, any combination of at least 5-10, 10-20, 20-30, 30-40, 40-50, 50-60, 60-70, 70-80, 80, 80-90, 90-100, 100-120, 120-140, 140-150, 150-160, 160-170, 170-180, 180-190, 190-200, 200-210, 210-220, 220-230, 230-240, 240-250, 250-260, 260-270, 270-280, 280-290, 290-300, 300-310, 310-320, 320-330, 330-340, 340-350, 350-360, 360-370, 370-380, 380-390, 390-400, 400-410, 410-420, 420-430, 430-440, 440-450, 450-460, 460-470, 470-480, 480-490, 490-500, 500-510, 510-520, 520-530, and up to about 535 genes selected from the group consisting of genes or transcripts as shown in the Table 6.
- Table 7 provides 20 of the most frequently variably expressed genes in lung cancer when compared to samples without cancer. Accordingly, in one embodiment, any combination of about 3-5, 5-10, 11, 12, 13, 14, 15, 16, 17, 18, 19, or all 20 genes and/or transcripts of Table 7, or any sub-combination thereof are used.
- In one embodiment, the invention provides a gene group the expression profile of nasal epithelial cells which is useful in diagnosing lung diseases and which comprises probes that hybridize ranging from 1 to 96 and all combinations in between for example 5, 10, 15, 20, 25, 30, 35, at least about 36, at least to 40, at lest to 50, at least to 60, to at least 70, to at least 80, to at least 90, or all of the following 96 gene sequences: NM_003335; NM_000918; NM_006430.1; NM_001416.1; NM_004090; NM_006406.1; NM_003001.2; NM_001319; NM_006545.1; NM_021145.1; NM_002437.1; NM_006286; NM_001003698 /// NM_001003699 /// NM_002955; NM_001123 /// NM_006721; NM_024824; NM_004935.1; NM_002853.1; NM_019067.1; NM_024917.1; NM_020979.1; NM_005597.1; NM_007031.1; NM_009590.1; NM_020217.1; NM_025026.1; NM_014709.1; NM_014896.1; AF010144; NM_005374.1; NM_001696; NM_005494 /// NM_058246; NM_006534 /// NM_181659; NM_006368; NM_002268 /// NM_032771; NM_014033; NM_016138; NM_007048 /// NM_194441; NM_006694; NM_000051 /// NM_138292 /// NM_138293; NM_000410 /// NM_139002 /// NM_139003 /// NM_139004 /// NM_139005 /// NM_139006 /// NM_139007 /// NM_139008 /// NM_139009 /// NM_139010 /// NM_139011; NM_004691; NM_012070 /// NM_139321 /// NM_139322; NM_006095; AI632181; AW024467; NM_021814; NM_005547.1; NM_203458; NM_015547 /// NM_147161; AB007958.1; NM_207488; NM_005809 /// NM_181737 /// NM_181738; NM_016248 /// NM_144490; AK022213.1; NM_005708; NM_207102; AK023895; NM_144606 /// NM_144997; NM_018530; AK021474; U43604.1; AU147017; AF222691.1; NM_015116; NM_001005375 /// NM_001005785 /// NM_001005786 /// NM_004081 /// NM_020363 /// NM_020364 /// NM_020420; AC004692; NM_001014; NM_000585 /// NM_172174 /// NM_172175; NM_054020 /// NM_172095 /// NM_172096 /// NM_172097; BE466926; NM_018011; NM_024077; NM_012394; NM_019011 /// NM_207111 /// NM_207116; NM_017646; NM_021800; NM_016049; NM_014395; NM_014336; NM_018097; NM_019014; NM_024804; NM_018260; NM_018118; NM_014128; NM_024084; NM_005294; AF077053; NM_138387; NM_024531; NM_000693; NM_018509; NM_033128; NM_020706; AI523613; and NM_014884
- In one embodiment, the invention provides a gene group the expression profile of nasal epithelial cells of which is useful in diagnosing lung diseases and comprises probes that hybridize to at least, for example, 5, 10, 15, 20, 25, 30, 35, at least about 36, at least to 40, at least to 50, at least to 60, to at least 70, to at least 80, to all of the following 84 gene sequences: NM_030757.1; R83000; AK021571.1; NM_014182.1; NM_17932.1; U85430.1; AI683552; BC002642.1; AW024467; NM_030972.1; BC021135.1; AL161952.1; AK026565.1; AK023783.1; BF218804; NM_001281.1; NM_024006.1; AK023843.1; BC001602.1; BC034707.1; BC064619.1; AY280502.1; BC059387.1; AF135421.1; BC061522.1; L76200.1; U50532.1; BC006547.2; BC008797.2; BC000807.1; AL080112.1; BC033718.1 /// BC046176.1 /// BC038443.1; NM_000346.1; BC008710.1; Hs.288575 (UNIGENE ID); AF020591.1; BC000423.2; BC002503.2; BC008710.1; BC009185.2; Hs.528304 (UNIGENE ID); U50532.1; BC013923.2; BC031091; NM_007062; Hs.249591 (Unigene ID); BC075839.1 /// BC073760.1; BC072436.1 /// BC004560.2; BC001016.2; Hs.286261 (Unigene ID); AF348514.1; BC005023.1; BC066337.1 /// BC058736.1 /// BC050555.1; Hs.216623 (Unigene ID); BC072400.1; BC041073.1; U43965.1; BC021258.2; BC016057.1; BC016713.1 /// BC014535.1 /// AF237771.1; BC000360.2; BC007455.2; BC000701.2; BC010067.2; BC023528.2 /// BC047680.1; BC064957.1; Hs.156701 (Unigene ID); BC030619.2; BC008710.1; U43965.1; BC066329.1; Hs.438867 (Unigene ID); BC035025.2 /// BC050330.1; BC023976.2; BC074852.2 /// BC074851.2; Hs.445885 (Unigene ID); BC008591.2 /// BC050440.1 ///; BC048096.1; AF365931.1; AF257099.1; and BC028912.1.
- In one embodiment, the invention provides a gene group the expression profile of nasal epithelial cells which is useful in diagnosing lung diseases and comprises probes that hybridize to at least, for example 5, 10, 15, 20, 25, 30, preferably at least about 36, still more preferably at least to 40, still more preferably at lest to 45, still more preferably all of the following 50 gene sequences, although it can include any and all members, for example, 20, 21, 22, up to and including 36: NM_007062.1; NM_001281.1; BC000120.1; NM_014255.1; BC002642.1; NM_000346.1; NM_006545.1; BG034328; NM_021822.1; NM_021069.1; NM_019067.1; NM_017925.1; NM_017932.1; NM_030757.1; NM_030972.1; AF126181.1; U93240.1; U90552.1; AF151056.1; U85430.1; U51007.1; BC005969.1; NM_002271.1; AL566172; AB014576.1; BF218804; AK022494.1; AA114843; BE467941; NM_003541.1; R83000; AL161952.1; AK023843.1; AK021571.1; AK023783.1; AU147182; AL080112.1; AW971983; AI683552; NM_024006.1; AK026565.1; NM_014182.1; NM_021800.1; NM_016049.1; NM_019023.1; NM_021971.1; NM_014128.1; AK025651.1; AA133341; and AF198444.1. In one preferred embodiment, one can use at least 20-30, 30-40, of the 50 genes that overlap with the individual predictor genes identified in the analysis using the t-test, and, for example, 5-9 of the non-overlapping genes, identified using the t-test analysis as individual predictor genes, and combinations thereof.
- In one embodiment, the invention provides a gene group the expression profile of nasal epithelial cells which is useful in diagnosing lung diseases and comprises probes that hybridize to at least for example 5, 10, 15, 20, preferably at least about 25, still more preferably at least to 30, still more preferably all of the following 36 gene sequences: NM_007062.1; NM_001281.1; BC002642.1; NM_000346.1; NM_006545.1; BG034328; NM_019067.1; NM_017925.1; NM_017932.1; NM_030757.1; NM_030972.1; NM_002268 /// NM_032771; NM_007048 /// NM_194441; NM_006694; U85430.1; NM_004691; AB014576.1; BF218804; BE467941; R83000; AL161952.1; AK023843.1; AK021571.1; AK023783.1; AL080112.1; AW971983; AI683552; NM_024006.1; AK026565.1; NM_014182.1; NM_021800.1; NM_016049.1; NM_021971.1; NM_014128.1; AA133341; and AF198444.1. In one preferred embodiment, one can use at least 20 of the 36 genes that overlap with the individual predictors and, for example, 5-9 of the non-overlapping genes, and combinations thereof.
- The expression of the gene groups in an individual sample can be analyzed using any probe specific to the nucleic acid sequences or protein product sequences encoded by the gene group members. For example, in one embodiment, a probe set useful in the methods of the present invention is selected from the nucleic acid probes of between 10-15, 15-20, 20-180, preferably between 30-180, still more preferably between 36-96, still more preferably between 36-84, still more preferably between 36-50 probes, included in the Affymetrix Inc. gene chip of the Human Genome U133 Set and identified as probe ID Nos: 208082_x_at, 214800_x_at, 215208_x_at, 218556_at, 207730_x_at, 210556_at, 217679_x_at, 202901_x_at, 213939_s_at, 208137_x_at, 214705_at, 215001_s_at, 218155_x_at, 215604_x_at, 212297_at, 201804_x_at, 217949_s_at, 215179_x_at, 211316_x_at, 217653_x_at, 266_s_at, 204718_at, 211916_s_at, 215032_at, 219920_s_at, 211996_s_at, 200075_s_at, 214753_at, 204102_s_at, 202419_at, 214715_x_at, 216859_x_at, 215529_x_at, 202936_s_at, 212130_x_at, 215204_at, 218735_s_at, 200078_s_at, 203455_s_at, 212227_x_at, 222282_at, 219678_x_at, 208268_at, 221899_at, 213721_at, 214718_at, 201608_s_at, 205684_s_at, 209008_x_at, 200825_s_at, 218160_at, 57739_at, 211921_x_at, 218074_at, 200914_x_at, 216384_x_at, 214594_x_at, 222122_s_at, 204060_s_at, 215314_at, 208238_x_at, 210705_s_at, 211184_s_at, 215418_at, 209393_s_at, 210101_x_at, 212052_s_at, 215011_at, 221932_s_at, 201239_s_at, 215553_x_at, 213351_s_at, 202021_x_at, 209442_x_at, 210131_x_at, 217713_x_at, 214707_x_at, 203272_s_at, 206279_at, 214912_at, 201729_s_at, 205917_at, 200772_x_at, 202842_s_at, 203588_s_at, 209703_x_at, 217313_at, 217588_at, 214153_at, 222155_s_at, 203704_s_at, 220934_s_at, 206929_s_at, 220459_at, 215645_at, 217336_at, 203301_s_at, 207283_at, 222168_at, 222272_x_at, 219290_x_at, 204119_s_at, 215387_x_at, 222358_x_at, 205010_at, 1316_at, 216187_x_at, 208678_art, 222310_at, 210434_x_at, 220242_x_at, 207287_at, 207953_at, 209015_s_at, 221759_at, 220856_x_at, 200654_at, 220071_x_at, 216745_x_at, 218976_at, 214833_at, 202004_x_at, 209653_at, 210858_x_at, 212041_at, 221294_at, 207020_at, 204461_x_at, 205367_at, 219203_at, 215067_x_at, 212517_at, 220215_at, 201923_at, 215609_at, 207984_s_at, 215373_x_at, 216110_x_at, 215600_x_at, 216922_x_at, 215892_at, 201530_x_at, 217371_s_at, 222231_s_at, 218265_at, 201537_s_at, 221616_s_at, 213106_at, 215336_at, 209770_at, 209061_at, 202573_at, 207064_s_at, 64371_at, 219977_at, 218617_at, 214902_x_at, 207436_x_at, 215659_at, 204216_s_at, 214763_at, 200877_at, 218425_at, 203246_s_at, 203466_at, 204247_s_at, 216012_at, 211328_x_at, 218336_at, 209746_s_at, 214722_at, 214599_at, 220113_x_at, 213212_x_at, 217671_at, 207365_x_at, 218067_s_at, 205238_at, 209432_s_at, and 213919_at. In one preferred embodiment, one can use at least, for example, 10-20, 20-30, 30-40, 40-50, 50-60, 60-70, 70-80, 80-90, 90-100, 110, 120, 130, 140, 150, 160, or 170 of the 180 genes that overlap with the individual predictors genes and, for example, 5-9 of the non-overlapping genes and combinations thereof.
- Sequences for the Affymetrix probes are available from Affymetrix. Other probes and sequences that recognize the genes of interest can be easily prepared using, e.g. synthetic oligonucleotides recombinant oligonucleotides. These sequences can be selected from any, preferably unique part of the gene based on the sequence information publicly available for the genes that are indicated by their HUGO ID, GenBank No. or Unigene No.
- One can analyze the expression data to identify expression patters associated with any lung disease. For example, one can analyze diseases caused by exposure to air pollutants, such as cigarette smoke, asbestos or any other pollutant. For example, the analysis can be performed as follows. One first scans a gene chip or mixture of beads comprising probes that are hybridized with a study group samples. For example, one can use samples of non-smokers and smokers, non-asbestos exposed individuals and asbestos-exposed individuals, non-smog exposed individuals and smog-exposed individuals, smokers without a lung disease and smokers with lung disease, to obtain the differentially expressed gene groups between individuals with no lung disease and individuals with lung disease. One must, of course select appropriate groups, wherein only one air pollutant can be selected as a variable. So, for example, one can compare non-smokers exposed to asbestos but not smog and non-smokers not exposed to asbestos or smog.
- The obtained expression analysis, such as microarray or microbead raw data consists of signal strength and detection p-value. One normalizes or scales the data, and filters the poor quality chips/bead sets based on images of the expression data, control probes, and histograms. One also filters contaminated specimens which contain non-epithelial cells. Lastly, one filters the genes of importance using detection p-value. This results in identification of transcripts present in normal airways (normal airway transcriptome). Variability and multiple regression analysis can be used. This also results in identification of effects of smoking on airway epithelial cell transcription. For this analysis, one can use T-test and Pearson correlation analysis. One can also identify a group or a set of transcripts that are differentially expressed in samples with lung disease, such as lung cancer and samples without cancer. This analysis was performed using class prediction models.
- For analysis of the data, one can use, for example, a weighted voting method. The weighted voting method ranks, and gives a weight "p" to all genes by the signal to noise ration of gene expression between two classes: P = mean(class 1)- mean(class 2)/sd(class 1) = sd(class 2). Committees of variable sizes of the top ranked genes are used to evaluate test samples, but genes with more significant p-values can be more heavily weighed. Each committee genes in test sample votes for one class or the other, based on how close that gene expression level is to the
class 1 mean or theclass 2 mean. V(gene A)=P(gene A), i.e. level of expression in test sample less the average of the mean expression values in the two classes. Votes for each class are tallied and the winning class is determined along with prediction strength as PS = Vwin - Vlose/Vwin + Vlose. Finally, the accuracy can be validated using cross-validation +/independent samples. - Table 1 shows 96 genes that were identified as a group distinguishing smokers with cancer from smokers without cancer. The difference in expression is indicated at the column on the right as either "down", which indicates that the expression of that particular transcript was lower in smokers with cancer than in smokers without cancer, and "up", which indicates that the expression of that particular transcript was higher in smokers with cancer than smokers without cancer. In one embodiment, the exemplary probes shown in the column " Affymetrix Id in the Human Genome U133 chip" can be used.
Table 1: 96 Gene Group Affymetrix ID for an example probe identifying the gene GenBank ID Gene Name Expression in cancer compared to a sample with no cancer. 1316_at NM_003335 UBE1L down 200654_at NM_000918 P4HB up 200877_at NM_006430.1 CCT4 up 201530_x_at NM_001416.1 EIF4A1 up 201537_s_at NM_004090 DUSP3 up 201923_at NM_006406.1 PRDX4 up 202004_x_at NM_003001.2 SDHC up 202573_at NM_001319 CSNK1G2 down 203246_s_at NM_006545.1 TUSC4 up 203301_s_at NM_021145.1 DMTF1 down 203466_at NM_002437.1 MPV17 up 203588_s at NM_006286 TFDP2 up 203704_s_at NM_001003698 /// NM_001003699 /// NM_002955 RREB1 down 204119_s_at NM_001123 /// NM_006721 ADK up 204216_s_at NM_024824 FLJ11806 up 204247_s_at NM_004935.1 CDK5 up 204461_x_at NM_002853.1 RAD1 down 205010_at NM_019067.1 FLJ10613 down 205238_at NM_024917.1 CXorf34 down 205367_at NM_020979.1 APS down 206929_s_at NM_005597.1 NFIC down 207020_at NM_007031.1 HSF2BP down 207064_s_at NM_009590.1 AOC2 down 207283_at NM_020217.1 DKFZp547I01 4 down 207287_at NM_025026.1 FLJ14107 down 207365_x_at NM_014709.1 USP34 down 207436_x_at NM_014896.1 KIAA0894 down 207953_at AF010144 --- down 207984_s_at NM_005374.1 MPP2 down 208678_at NM_001696 ATP6V1E1 up 209015_s_at NM_005494 /// DNAJB6 up NM_058246 209061_at NM_006534 /// NM_181659 NCOA3 down 209432_s_at NM_006368 CREB3 up 209653_at NM_002268 /// NM_032771 KPNA4 up 209703_x_at NM_014033 DKFZP586A0 522 down 209746_s_at NM_016138 COQ7 down 209770_at NM_007048 /// NM_194441 BTN3A1 down 210434_x_at NM_006694 JTB up 210858_x_at NM_000051 /// NM_138292 /// ATM down NM_138293 211328_x_at NM_000410 /// NM_139002 /// NM_139003 /// NM_139004 /// NM_139005 /// NM_139006 /// NM_139007 /// NM_139008 /// NM_139009 /// NM_139010 /// HFE down NM_139011 212041_at NM_004691 ATP6V0D1 up 212517_at NM_012070 /// NM_139321 /// ATRN down NM_139322 213106_at NM_006095 ATP8A1 down 213212_x_at AI632181 --- down 213919_at AW024467 --- down 214153_at NM_021814 ELOVL5 down 214599_at NM_005547.1 IVL down 214722_at NM_203458 N2N down 214763_at NM_015547 /// NM_147161 THEA down 214833_at AB007958.1 KIAA0792 down 214902_x_at NM_207488 FLJ42393 down 215067_x_at NM_005809 /// NM_181737 /// NM_181738 PRDX2 down 215336_at NM_016248 /// NM_144490 AKAP11 down 215373_x_at AK022213.1 FLJ12151 down 215387_x_at NM_005708 GPC6 down 215600_x_at NM_207102 FBXW12 down 215609_at AK023895 --- down 215645_at NM_144606 /// NM_144997 FLCN down 215659_at NM_018530 GSDML down 215892_at AK021474 --- down 216012_at U43604.1 --- down 216110_x_at AU147017 --- down 216187_x_at AF222691.1 LNX1 down 216745_x_at NM_015116 LRCH1 down 216922_x_at NM_001005375 /// NM_001005785 /// NM_001005786 /// NM_004081 /// NM_020363 /// NM_020364 /// NM_020420 DAZ2 down 217313_at AC004692 --- down 217336_at NM_001014 RPS10 down 217371_s_at NM_000585 /// NM_172174 /// NM_172175 IL15 down 217588_at NM_054020 /// NM_172095 /// NM_172096 /// NM_172097 CATSPER2 down 217671_at BE466926 --- down 218067_s_at NM_018011 FLJ10154 down 218265_at NM_024077 SECISBP2 down 218336_at NM_012394 PFDN2 up 218425_at NM_019011 /// NM_207111 /// NM_207116 TRIAD3 down 218617_at NM_017646 TRIT1 down 218976_at NM_021800 DNAJC12 up 219203_at NM_016049 C14orf122 up 219290_x_at NM_014395 DAPP1 down 219977_at NM_014336 AIPL1 down 220071_x_at NM_018097 C15orf25 down 220113_x_at NM_019014 POLR1B down 220215_at NM_024804 FLJ12606 down 220242_x_at NM_018260 FLJ10891 down 220459_at NM_018118 MCM3APAS down 220856_x_at NM_014128 down 220934_s_at NM_024084 MGC3196 down 221294_at NM_005294 GPR21 down 221616_s_at AF077053 PGK1 down 221759_at NM_138387 G6PC3 up 222155_s_at NM_024531 GPR172A up 222168_at NM_000693 ALDH1A3 down 222231_s_at NM_018509 PRO1855 up 222272_x_at NM_033128 SCIN down 222310_at NM_020706 SFRS15 down 222358_x_at AI523613 --- down 64371_at NM_014884 SFRS14 down - Table 2 shows one preferred 84 gene group that has been identified as a group distinguishing smokers with cancer from smokers without cancer. The difference in expression is indicated at the column on the right as either "down", which indicates that the expression of that particular transcript was lower in smokers with cancer than in smokers without cancer, and "up", which indicates that the expression of that particular transcript was higher in smokers with cancer than smokers without cancer. These genes were identified using traditional Student's t-test analysis.
- In one embodiment, the exemplary probes shown in the column " Affymetrix Id in the Human Genome U133 chip" can be used in the expression analysis.
Table 2: 84 Gene Group GenBank ID (unless otherwise mentioned) Gene Name Abbreviation Direction in Cancer compared to a non-cancer sample Affymetrix ID NM_030757.1 MKRN4 down 208082_x_at R83000 BTF3 down 214800_x_at AK021571.1 MUC20 down 215208_x_at NM_014182.1 ORMDL2 up 218556_at NM_17932.1 FLJ20700 down 207730_x_at U85430.1 NFATC3 down 210556_at AI683552 --- down 217679_x_at BC002642.1 CTSS down 202901_x_at AW024467 RIPX down 213939_s_at NM_030972.1 MGC5384 down 208137_x_at BC021135.1 INADL down 214705_at AL161952.1 GLUL down 215001_s_at AK026565.1 FLJ10534 down 218155_x_at AK023783.1 --- down 215604_x_at BF218804 AFURS1 down 212297_at NM_001281.1 CKAP1 up 201804_x_at NM_024006.1 IMAGE3455200 up 217949_s_at AK023843.1 PGF down 215179_x_at BC001602.1 CFLAR down 211316_x_at BC034707.1 --- down 217653_x_at BC064619.1 CD24 down 266_s_at AY280502.1 EPHB6 down 204718_at BC059387.1 MYO1A down 211916_s_at --- down 215032_at AF135421.1 GMPPB up 219920_s_at BC061522.1 MGC70907 down 211996_s_at L76200.1 GUK1 up 200075_s_at U50532.1 CG005 down 214753_at BC006547.2 EEF2 down 204102-s_at BC008797.2 FVT1 down 202419_at BC000807.1 ZNF160 down 214715_x_at AL080112.1 --- down 216859_x_at BC033718.1 /// BC046176.1 /// BC038443.1 C21orf106 down 215529_x_at NM_000346.1 SOX9 up 202936_s_at BC008710.1 SUI1 up 212130_x_at Hs.288575 (Unigene ID) --- down 215204_at AF020591.1 AF020591 down 218735_s_at BC000423.2 ATP6V0B up 200078_s_at BC002503.2 SAT down 203455_s_at BC008710.1 SUI1 up 212227_x_at --- down 222282_at BC009185.2 DCLRE1C down 219678_x_at Hs.528304 (UNIGENE ID) ADAM28 down 208268_at U50532.1 CG005 down 221899_at BC013923.2 SOX2 down 213721_at BC031091 ODAG down 214718_at NM_007062 PWP1 up 201608_s_at Hs.249591 (Unigene ID) FLJ20686 down 205684_s_at BC075839.1 /// BC073760.1 KRT8 up 209008_x at BC072436.1 /// BC004560.2 HYOU1 up 200825_s_at BC001016.2 NDUFA8 up 218160_at Hs.286261 (Unigene ID) FLJ20195 down 57739_at AF348514.1 --- down 211921_x_at BC005023.1 CGI-128 up 218074_at BC066337.1 /// BC058736.1 /// BCO50555.1 KTN1 down 200914_x_at --- down 216384_x_at Hs.216623 (Unigene ID) ATPB1 down 214594_x_at BC072400.1 THOC2 down 222122_s_at BC041073.1 PRKX down 204060_s_at U43965.1 ANK3 down 215314_at --- down 208238_x_at BC021258.2 TRIM5 down 210705_s_at BC016057.1 USH1C down 211184_s_at BC016713.1 /// PARVA down 215418_at BC014535.1 /// AF237771.1 BC000360.2 EIF4EL3 up 209393_s_at BC007455.2 SH3GLB1 up 210101_x_at BC000701.2 KIAA0676 down 2t20S2_s_at BC010067.2 CHC1 down 215011_at BC023528.2 /// BC047680.1 C14orf87 up 221932_s_at BC064957.1 KIAA0102 up 201239_s_at Hs.156701 (Unigene ID) --- down 215553_x_at BC030619.2 KIAA0779 down 213351_s_at BC008710.1 SUI1 up 202021_x_at U43965.1 ANK3 down 209442_x_at BC066329.1 SDHC up 210131_x_at Hs.438867 (Unigene ID) --- down 217713_x_at BC035025.2 /// BC050330.1 ALMAS1 down 214707_x_at BC023976.2 PDAP2 up 203272_s_at BC074852.2 /// BC074851.2 PRXY down 206279_at Hs.445885 (Unigene ID) KIAA1217 down 214912_at BC008591.2 /// BC050440.1 /// BC048096.1 KIAA0100 up 201729_s_at AF365931.1 ZNF264 down 205917_at AF257099.1 PTMA down 200772_x_at BC028912.1 DNAJB9 up 202842_s_at - Table 3 shows one preferred 50 gene group that was identified as a group distinguishing smokers with cancer from smokers without cancer. The difference in expression is indicated at the column on the right as either "down", which indicates that the expression of that particular transcript was lower in smokers with cancer than in smokers without cancer, and "up", which indicates that the expression of that particular transcript was higher in smokers with cancer than smokers without cancer.
- This gene group was identified using the GenePattern server from the Broad Institute, which includes the Weighted Voting algorithm. The default settings, i.e., the signal to noise ratio and no gene filtering, were used.
- In one embodiment, the exemplary probes shown in the column " Affymetrix Id in the Human Genome U133 chip" can be used in the expression analysis.
Table 3: 50 Gene Group GenBank ID Gene Name Direction in Cancer Affymetrix ID NM_007062.1 PWP1 up in cancer 201608_s_at NM_001281.1 CKAP1 up in cancer 201804_x_at BC000120.1 up in cancer 202355_s_at NM_014255.1 TMEM4 up in cancer 202857_at BC002642.1 CTSS up in cancer 202901_x_at NM_000346.1 SOX9 up in cancer 202936_s_at NM_006545.1 NPR2L up in cancer 203246_s_at BG034328 up in cancer 203588_s_at NM_021822.1 APOBEC3G up in cancer 204205_at NM_021069.1 ARGBP2 up in cancer 204288_s_at NM_019067.1 FLJ10613 up in cancer 205010_at NM_017925.1 FLJ20686 up in cancer 205684_s_at NM_017932.1 FLJ20700 up in cancer 207730_x_at NM_030757.1 MKRN4 up in cancer 208082_x_at NM_030972.1 MGC5384 up in cancer 208137_x_at AF126181.1 BCG1 up in cancer 208682_s_at U93240.1 up in cancer 209653_at U90552.1 up in cancer 209770_at AF151056.1 up in cancer 210434_x_at U85430.1 NFATC3 up in cancer 210556_at U51007.1 up in cancer 211609_x_at BC005969.1 up in cancer 211759_x_at NM_002271.1 up in cancer 211954_s_at AL566172 up in cancer 212041_at AB014576.1 KIAA0676 up in cancer 212052_s_at BF218804 AFURS1 down in cancer 212297_at AK022494.1 down in cancer 212932_at AA114843 down in cancer 213884_s_at BE467941 down in cancer 214153_at NM_003541.1 HIST1H4K down in cancer 214463_x_at R83000 BTF3 down in cancer 214800_x_at AL161952.1 GLUL down in cancer 215001_s_at AK023843.1 PGF down in cancer 215179_x_at AK021571.1 MUC20 down in cancer 215208_x_at AK023783.1 --- down in cancer 215604_x_at AU147182 down in cancer 215620_at AL080112.1 --- down in cancer 216859_x_at AW971983 down in cancer 217588_at AI683552 --- down in cancer 217679_x_at NM_024006.1 IMAGE3455200 down in cancer 217949_s_at AK026565.1 FLJ10534 down in cancer 218155_x_at NM_014182.1 ORMDL2 down in cancer 218556_at NM_021800.1 DNAJC12 down in cancer 218976_at NM_016049.1 CGI-112 down in cancer 219203_at NM_019023.1 PRMT7 down in cancer 219408_at NM_021971.1 GMPPB down in cancer 219920_s_at NM_014128.1 --- down in cancer 220856_x_at AK025651.1 down in cancer 221648_s_at AA133341 C14orf87 down in cancer 221932_s_at AF198444.1 down in cancer 222168_at - Table 4 shows one preferred 36 gene group that was identified as a group distinguishing smokers with cancer from smokers without cancer. The difference in expression is indicated at the column on the right as either "down", which indicates that the expression of that particular transcript was lower in smokers with cancer than in smokers without cancer, and "up", which indicates that the expression of that particular transcript was higher in smokers with cancer than smokers without cancer.
- In one embodiment, the exemplary probes shown in the column " Affymetrix Id in the Human Genome U133 chip" can be used in the expression analysis.
Table 4: 36 Gene Group GenBank ID Gene Name Affymetrix ID NM_007062.1 PWP1 201608_s_at NM_001281.1 CKAP1 201804_x_at BC002642.1 CTSS 202901_x_at NM_000346.1 SOX9 202936_s_at NM_006545.1 NPR2L 203246_s_at BG034328 203588_s_at NM_019067.1 FLJ10613 205010_at NM_017925.1 FLJ20686 205684_s_at NM_017932.1 FLJ20700 207730_x_at NM_030757.1 MKRN4 208082_x_at NM_030972.1 MGC5384 208137_x_at NM_002268 /// NM 032771 KPNA4 209653_at NM_007048 /// NM 194441 BTN3A1 209770_at NM_006694 JBT 210434_x_at U85430.1 NFATC3 210556_at NM_004691 ATP6VOD1 212041_at AB014576.1 KIAA0676 212052_s_at BF218804 AFURS1 212297 at BE467941 214153 at R83000 BTF3 214800_x_at AL161952.1 GLUL 215001_s_at AK023843.1 PGF 215179_x_at AK021571.1 MUC20 215208_x_at AK023783.1 --- 215604_x_at AL080112.1 --- 216859_x_at AW971983 217588 at AI683552 --- 217679_x_at NM_024006.1 IMAGE3455200 217949_s_at AK026565.1 FLJ10534 218155_x_at NM_014182.1 ORMDL2 218556_at NM_021800.1 DNAJC12 218976_at NM_016049.1 CGI-112 219203_at NM_021971.1 GMPPB 2t9920_s_at NM_014128.1 --- 220856_x_at AA133341 C14orf87 221932_s_at AF198444.1 222168_at - In one embodiment, the gene group of the present invention comprises at least, for example, 5, 10, 15, 20, 25, 30, more preferably at least 36, still more preferably at least about 40, still more preferably at least about 50, still more preferably at least about 60, still more preferably at least about 70, still more preferably at least about 80, still more preferably at least about 86, still more preferably at least about 90, still more preferably at least about 96 of the genes as shown in Tables 1-4.
- In one preferred embodiment, the gene group comprises 36-180 genes selected from the group consisting of the genes listed in Tables 1-4.
- In one embodiment, the invention provides group of genes the expression of which is lower in individuals with cancer.
- Accordingly, in one embodiment, the invention provides of a group of genes useful in diagnosing lung diseases, wherein the expression of the group of genes is lower in individuals exposed to air pollutants with cancer as compared to individuals exposed to the same air pollutant who do not have cancer, the group comprising probes that hybridize at least 5, preferably at least about 5-10, still more preferably at least about 10-20, still more preferably at least about 20-30, still more preferably at least about 30-40, still more preferably at least about 40-50, still more preferably at least about 50-60, still more preferably at least about 60-70, still more preferably about 72 genes consisting of transcripts (transcripts are identified using their GenBank ID or Unigene ID numbers and the corresponding gene names appear in Table 1): NM_003335; NM_001319; NM_021 145.1; NM_001003698 /// NM 001003699 ///; NM_002955; NM_002853.1; NM_019067.1; NM_024917.1; NM_020979.1; NM_005597.1; NM_007031.1; NM_009590.1; NM_020217.1; NM_025026.1; NM_014709.1; NM_014896.1; AF010144; NM_005374.1; NM_006534 /// NM_181659; NM_014033; NM_016138; NM_007048 /// NM_194441; NM_000051 /// NM_138292 /// NM_138293; NM_000410 /// NM_139002 /// NM_139003 /// NM_139004 /// NM_139005 /// NM_139006 /// NM_139007 /// NM_139008 /// NM_139009 /// NM_139010 /// NM_139011; NM_012070 /// NM_139321 /// NM_139322; NM_006095; A1632181; AW024467; NM_021814; NM_005547.1; NM_203458; NM_015547 /// NM_147161; AB007958.1; NM_207488; NM_005809 /// NM_181737 /// NM_181738; NM_016248 /// NM_144490; AK022213.1; NM_005708; NM_207102; AK023895; NM_144606 /// NM_144997; NM_018530; AK021474; U43604.1; AU147017; AF222691.1; NM_015116; NM_001005375 /// NM_001005785 /// NM_001005786 /// NM_004081 /// NM_020363 /// NM_020364 /// NM_020420; AC004692; NM_001014; NM_000585 /// NM_172174 /// NM_172175; NM_054020 /// NM_I72095 /// NM_172096 /// NM_172097; BE466926; NM_018011; NM_024077; NM_019011 /// NM_207111 /// NM_207116; NM_017646; NM_014395; NM_014336; NM_018097; NM_019014; NM_024804; NM_018260; NM_018118; NM_014128; NM_024084; NM_005294; AF077053; NM_000693; NM_033128; NM_020706; AI523613; and NM_014884.
- In another embodiment, the invention provides of a group of genes useful in diagnosing lung diseases wherein the expression of the group of genes is lower in individuals exposed to air pollutants with cancer as compared to individuals exposed to the same air pollutant who do not have cancer, the group comprising probes that hybridize at least 5, preferably at least about 5-10, still more preferably at least about 10-20, still more preferably at least about 20-30, still more preferably at least about 30-40, still more preferably at least about 40-50, still more preferably at least about 50-60, still more preferably about 63 genes consisting of transcripts (transcripts are identified using their GenBank ID or Unigene ID numbers and the corresponding gene names appear in Table 2): NM_030757.1; R83000; AK021571.1; NM_17932.1; U85430.1; AI683552; BC002642.1; AW024467; NM_030972.1; BC021135.1; AL161952.1; AK026565.1; AK023783.1; BF218804; AK023843.1; BC001602.1; BC034707.1; BC064619.1; AY280502.1; BC059387.1; BC061522.1; U50532.1; BC006547.2; BC008797.2; BC000807.1; AL080112.1; BC033718.1 /// BC046176.1 ///; BC038443.1; Hs.288575 (UNIGENE ID); AF020591.1; BC002503.2; BC009185.2; Hs.528304 (UNIGENE ID); U50532.1; BC013923.2; BC031091; Hs.249591 (Unigene ID); Hs.286261 (Unigene ID); AF348514.1; BC066337.1 /// BC058736.1 /// BC050555.1; Hs.216623 (Unigene ID); BC072400.1; BC041073.1; U43965.1; BC021258.2; BC01C057.1; BC016713.1 /// BC014535.1 /// AF237771.1; BC000701.2; BC010067.2; Hs.156701 (Unigene ID); BC030619.2; U43965.1; Hs.438867 (Unigene ID); BC035025.2 /// BC050330.1; BC074852.2 /// BC074851.2; Hs.445885 (Unigene ID); AF365931.1; and AF257099.1
- In another embodiment, the invention provides of a group of genes useful in diagnosing lung diseases wherein the expression of the group of genes is lower in individuals exposed to air pollutants with cancer as compared to individuals exposed to the same air pollutant who do not have cancer, the group comprising probes that hybridize at least 5, preferably at least about 5-10, still more preferably at least about 10-20, still more preferably at least about 20-25, still more preferably about 25 genes consisting of transcripts (transcripts are identified using their GenBank ID or Unigene ID numbers and the corresponding gene names appear in Table 3):BF218804; AK022494.1; AA114843; BE467941; NM_003541.1; R83000; AL161952.1; AK023843.1; AK021571.1; AK023783.1; AU147182; AL080112.1; AW971983; AI683552; NM_024006.1; AK026565.1; NM_014182.1; NM_021800.1; NM_016049.1; NM_019023.1; NM_021971.1; NM_014128.1; AK025651.1; AA133341; and AF198444.1.
- In another embodiment, the invention provides of a group of genes useful in diagnosing lung diseases wherein the expression of the group of genes is higher in individuals exposed to air pollutants with cancer as compared to individuals exposed to the same air pollutant who do not have cancer, the group comprising probes that hybridize at least to 5, preferably at least about 5-10, still more preferably at least about 10-20, still more preferably at least about 20-25, still more preferably about 25 genes consisting of transcripts (transcripts are identified using their GenBank ID or Unigene ID numbers and the corresponding gene names appear in Table 1): NM_000918; NM_006430.1; NM_001416.1; NM_004090; NM_006406.1; NM_003001.2; NM_006545.1; NM_002437.1; NM_006286; NM_001123 /// NM_006721; NM_024824; NM_004935.1; NM_001696; NM_005494 /// NM_058246; NM_006368; NM_002268 /// NM_032771; NM_006694; NM_004691; NM_012394; NM_021800; NM_016049; NM_138387; NM_024531; and NM_018509.
- In another embodiment, the invention provides of a group of genes useful in diagnosing lung diseases wherein the expression of the group of genes is higher in individuals exposed to air pollutants with cancer as compared to individuals exposed to the same air pollutant who do not have cancer, the group comprising probes that hybridize at least to 5, preferably at least about 5-10, still more preferably at least about 10-20, still more preferably at least about 20-23, still more preferably about 23 genes consisting of transcripts (transcripts are identified using their GenBank ID or Unigene ID numbers and the corresponding gene names appear in Table 2): NM_014182.1; NM_001281.1; NM_024006.1; AF135421.1; L76200.1; NM_000346.1; BC008710.1; BC000423.2; BC008710.1; NM_007062; BC075839.1 /// BC073760.1; BC072436.1 /// BC004560.2; BC001016.2; BC005023.1; BC000360.2; BC007455.2; BC023528.2 /// BC047680.1; BC064957.1; BC008710.1; BC066329.1; BC023976.2; BC008591.2 /// BC050440.1 /// BC048096.1; and BC028912.1.
- In another embodiment, the invention provides of a group of genes useful in diagnosing lung diseases wherein the expression of the group of genes is higher in individuals exposed to air pollutants with cancer as compared to individuals exposed to the same air pollutant who do not have cancer, the group comprising probes that hybridize at least to 5, preferably at least about 5-10, still more preferably at least about 10-20, still more preferably at least about 20-25, still more preferably about 25 genes consisting of transcripts (transcripts are identified using their GenBank ID or Unigene ID numbers and the corresponding gene names appear in Table 3): NM_007062.1; NM_001281.1; BC000120.1; NM_014255.1; BC002642.1; NM_000346.1; NM_006545.1; BG034328; NM_021822.1; NM_021069.1; NM_019067.1; NM_017925.1; NM_017932.1; NM_030757.1; NM_030972.1; AF126181.1; U93240.1; U90552.1; AF151056.1; U85430.1; U51007.1; BC005969.1; NM_002271.1; AL566172; and AB014576.1.
- In one embodiment, the invention provides a method of diagnosing lung disease comprising the steps of measuring the expression profile of a gene group in an individual suspected of being affected or being at high risk of a lung disease (i.e. test individual), and comparing the expression profile (i.e. control profile) to an expression profile of an individual without the lung disease who has also been exposed to similar air pollutant than the test individual (i.e. control individual), wherein differences in the expression of genes when compared between the afore mentioned test individual and control individual of at least 10, more preferably at least 20, still more preferably at least 30, still more preferably at least 36, still more preferably between 36-180, still more preferably between 36-96, still more preferably between 36-84, still more preferably between 36-50, is indicative of the test individual being affected with a lung disease. Groups of about 36 genes as shown in table 4, about 50 genes as shown in table 3, about 84 genes as shown in table 2 and about 96 genes as shown in table 1 are preferred. The different gene groups can also be combined, so that the test individual can be screened for all, three, two, or just one group as shown in tables 1-4.
- For example, if the expression profile of a test individual exposed to cigarette smoke is compared to the expression profile of the 50 genes shown in table 3, using the Affymetrix Inc. probe set on a gene chip as shown in table 3, the expression profile that is similar to the one shown in Figure 10 for the individuals with cancer, is indicative that the test individual has cancer. Alternatively, if the expression profile is more like the expression profile of the individuals who do not have cancer in Figure 10, the test individual likely is not affected with lung cancer.
- The group of 50 genes was identified using the GenePattern server from the Broad Institute, which includes the Weighted Voting algorithm. The default settings, i.e., the signal to noise ratio and no gene filtering, were used. GenePattern is available through the World Wide Wed at location broad.mit.edu/cancer/software/genepattern. This program allows analysis of data in groups rather than as individual genes. Thus, in one preferred embodiment, the expression of substantially all 50 genes of Table 3, are analyzed together. The expression profile of lower that normal expression of genes selected from the group consisting of BF218804; AK022494.1; AA114843; BE467941; NM_003541.1; R83000; AL161952.1; AK023843.1; AK021571.1; AK023783.1; AU147182; AL080112.1; AW971983; AI683552; NM_024006.1; AK026565.1; NM_014182.1; NM_021800.1; NM_016049.1; NM_019023.1; NM_021971.1; NM_014128.1; AK025651.1; AA133341; and AF198444.1, and the gene expression profile of higher than normal expression of genes selected from the group consisting of NM_007062.1; NM_001281.l; BC000120.1; NM_014255.1; BC002642.1; NM_000346.1; NM_006545.1; BG034328; NM_021822.1; NM_021069.1; NM_019067.1; NM_017925.1; NM_017932.1; NM_030757.1; NM_030972.1; AF126181.1; U93240.1; U90552.1; AF151056.1; U85430.1; U51007.1; BC005969.1; NM_002271.l; AL566172; and AB014576.1, is indicative of the individual having or being at high risk of developing lung disease, such as lung cancer. In one preferred embodiment, the expression pattern of all the genes in the Table 3 is analyzed. In one embodiment, in addition to analyzing the group of predictor genes of Table 3, 1, 2, 3, 4, 5, 6, 7, 8, 9, 10-15, 15-20, 20-30, or more of the individual predictor genes identified using the t-test analysis are analyzed. Any combination of, for example, 5-10 or more of the group predictor genes and 5-10, or more of the individual genes can also be used.
- The term "expression profile" as used herein, refers to the amount of the gene product of each of the analyzed individual genes in the sample. The "expression profile" is like a signature expression map, like the one shown for each individual in Figure 10, on the Y-axis.
- The term "lung disease", as used herein, refers to disorders including, but not limited to, asthma, chronic bronchitis, emphysema, bronchietasis, primary pulmonary hypertension and acute respiratory distress syndrome. The methods described herein may also be used to diagnose or treat lung disorders that involve the immune system including, hypersensitivity pneumonitis, eosinophilic pneumonias, and persistent fungal infections, pulmonary fibrosis, systemic sclerosis, idiopathic pulmonary hemosiderosis, pulmonary alveolar proteinosis, cancers of the lung such as adenocarcinoma, squamous cell carcinoma, small cell and large cell carcinomas, and benign neoplasm of the lung including bronchial adenomas and hamartomas. In one preferred embodiment, the lung disease is lung cancer.
- The term "air pollutants", as used herein, refers to any air impurities or environmental airway stress inducing agents, such as cigarette smoke, cigar smoke, smog, asbestos, and other air pollutants that have suspected or proven association to lung diseases.
- The term "individual", as used herein, preferably refers to human. However, the methods are not limited to humans, and a skilled artisan can use the diagnostic/prognostic gene groupings of the present invention in, for example, laboratory test animals, preferably animals that have lungs, such as non-human primates, murine species, including, but not limited to rats and mice, dogs, sheep, pig, guinea pigs, and other model animals. Such laboratory tests can be used, for example in pre-clinical animal testing of drugs intended to be used to treat or prevent lung diseases.
- The phrase "altered expression" as used herein, refers to either increased or decreased expression in an individual exposed to air pollutant, such as a smoker, with cancer when compared to an expression pattern of the lung cells from an individual exposed to similar air pollutant, such as smoker, who does not have cancer. Tables 1 and 2 show the preferred expression pattern changes of the invention. The terms "up" and "down" in the tables refer to the amount of expression in a smoker with cancer to the amount of expression in a smoker without cancer. Similar expression pattern changes are likely associated with development of cancer in individuals who have been exposed to other airway pollutants.
- In one embodiment, the group of genes the expression of which is analyzed in diagnosis and/or prognosis of lung cancer are selected from the group of 80 genes as shown in Table 5. Any combination of genes can be selected from the 80 genes. In one embodiment, the combination of 20 genes shown in Table 7 is selected. In one embodiment, a combination of genes from Table 6 is selected.
Table 5: Group of 80 genes for prognostic and diagnostic testing of lung cancer. Affymetrix ID Gene symbol (HUGO ID) Number of runs* Signal to noise in a cancer sample** 200729_s_at ACTR2 736 -0.22284 200760_s_at ARL6IP5 483 -0.21221 201399_s_at TRAM1 611 -0.21328 201444_s_at ATP6AP2 527 -0.21487 201635_s_at FXR1 458 -0.2162 201689_s_at TPD52 565 -0.22292 201925_s_at DAF 717 -0.25875 201926_s_at DAF 591 -0.23228 20l946_s_at CCT2 954 -0.24592 202118_s_at CPNE3 334 -0.21273 202704_at TOB1 943 -0.25724 202833_s_at SERPINA1 576 -0.20583 202935_s_at SOX9 750 -0.25574 203413_at NELL2 629 -0.23576 203881_s_at DMD 850 -0.24341 203908_at SLC4A4 887 -0.23167 204006_s_at FCGR3A /// FCGR3B 207 -0.20071 204403_x_at KIAA0738 923 0.167772 204427_s_at RNP24 725 -0.2366 206056_x_at SPN 976 0.196398 206169_x_at RoXaN 984 0.259637 207730_x_at HDGF2 969 0.169108 207756_at --- 855 0.161708 207791_s_at RAB1A 823 -0.21704 207953_at AD7C-NTP 1000 0.218433 208137_x_at --- 996 0.191938 208246_x_at TK2 982 0.179058 208654_s_at CD164 388 -0.21228 208892_s_at DUSP6 878 -0.25023 209189_at FOS 935 -0.27446 209204_at LMO4 78 0.158674 209267_s_at SLC39A8 228 -0.24231 209369_at ANXA3 384 -0.19972 209656_s_at TMEM47 456 -0.23033 209774_x_at CXCL2 404 -0.2117 210145_at PLA2G4A 475 -0.26146 210168_at C6 458 -0.24157 210317_s_at YWHAE 803 -0.29542 210397_at DEFB1 176 -0.22512 210679_x_at --- 970 0.181718 211506_s_at IL8 270 -0.3105 212006_at UBXD2 802 -0.22094 213089_at LOC153561 649 0.164097 213736_at COX5B 505 0.155243 213813_x_at --- 789 0.178643 214007_s_at PTK9 480 -0.21285 214146_s_at PPBP 593 -0.24265 214594_x_at ATP8B1 962 0.284039 214707_x_at ALMS1 750 0.164047 214715_x_at ZNF160 996 0.198532 215204_at SENP6 211 0.169986 215208_x_at RPL35A 999 0.228485 215385_at FTO 164 0.187634 215600_x at FBXW12 960 0.17329 215604_x_at UBE2D2 998 0.224878 215609_at STARD7 940 0.191953 215628_x_at PPP2CA 829 0.16391 215800_at DUOX1 412 0.160036 215907_at BACH2 987 0.178338 215978_x_at LOC152719 645 0.163399 216834_at --- 633 -0.25508 216858_x_at --- 997 0.232969 217446_x_at --- 942 0.182612 217653_x_at --- 976 0.270552 217679_x_at --- 987 0.265918 217715_x_at ZNF354A 995 0.223881 217826_s_at UBE2J1 812 -0.23003 218155_x_at FLJ10534 998 0.186425 218976_at DNAJC12 486 -0.22866 219392_x_at FLJ11029 867 0.169113 219678_x_at DCLRE1C 877 0.169975 220199_s_at FLJ12806 378 -0.20713 220389_at FLJ23514 102 0.239341 220720_x_at FLJ14346 989 0.17976 221191_at DKFZP434A0131 616 0.185412 221310_at FGF14 511 -0.19965 221765_at --- 319 -0.25025 222027_at NUCKS 547 0.171954 222104_x_at GTF2H3 981 0.186025 222358_x_at --- 564 0.194048 Table 6: Group of 535 genes useful in prognosis or diagnosis of lung cancer. Affymetrix ID Gene symbol (HUGO ID) Number of runs* Signal to noise in a cancer sample** 200729_s_at ACTR2 736 -0.22284 200760_s_at ARL6IP5 483 -0.21221 201399_s_at TRAM1 611 -0.21328 201444_s_at ATP6AP2 527 -0.21487 201635_s_at FXR1 458 -0.2162 201689_s_at TPD52 565 -0.22292 201925_s_at DAF 717 -0.25875 201926_s_at DAF 591 -0.23228 201946_s_at CCT2 954 -0.24592 202118_s_at CPNE3 334 -0.21273 202704_at TOB1 943 -0.25724 202833_s_at SERPINA1 576 -0.20583 202935_s at SOX9 750 -0.25574 203413_at NELL2 629 -0.23576 203881_s_at DMD 850 -0.24341 203908_at SLC4A4 887 -0.23167 204006_s_at FCGR3A /// FCGR3B 207 -0.20071 204403_x_at KIAA0738 923 0.167772 204427_s_at RNP24 725 -0.2366 206056_x_at SPN 976 0.196398 206169_x_at RoXaN 984 0.259637 207730_x_at HDGF2 969 0.169108 207756_at --- 855 0.161708 207791_s_at RAB1A 823 -0.21704 207953_at AD7C-NTP 1000 0.218433 208137_x_at --- 996 0.191938 208246_x_at TK2 982 0.179058 208654_s_at CD164 388 -0.21228 208892_s_at DUSP6 878 -0.25023 209189_at FOS 935 -0.27446 209204_at LMO4 78 0.158674 209267_s_at SLC39A8 228 -0.24231 209369_at ANXA3 384 -0.19972 209656_s_at TMEM47 456 -0.23033 209774_x_at CXCL2 404 -0.2117 210145_at PLA2G4A 475 -0.26146 210168_at C6 458 -0.24157 210317_s_at YWHAE 803 -0.29542 210397_at DEFB1 176 -0.22512 210679_x_at --- 970 0.181718 2H506_s_at IL8 270 -0.3105 212006_at UBXD2 802 -0.22094 213089_at LOC153561 649 0.164097 213736_at COX5B 505 0.155243 213813_x_at --- 789 0.178643 214007_s_at PTK9 480 -0.21285 214146_s_at PPBP 593 -0.24265 214594_x_at ATP8B1 962 0.284039 214707_x_at ALMS1 750 0.164047 214715_x_at ZNF160 996 0.198532 215204_at SENP6 211 0.169986 215208_x_at RPL35A 999 0.228485 215385_at FTO 164 0.187634 215600_x_at FBXW12 960 0.17329 215604_x_at UBE2D2 998 0.224878 215609_at STARD7 940 0.191953 215628_x_at PPP2CA 829 0.16391 215800_at DUOX1 412 0.160036 215907_at BACH2 987 0.178338 215978_x_at LOC 152719 645 0.163399 216834_at --- 633 -0.25508 216858_x_at --- 997 0.232969 217446_x_at --- 942 0.182612 217653_x_at --- 976 0.270552 217679_x_at --- 987 0.265918 217715_x_at ZNF354A 995 0.223881 217826_s_at UBE2J1 812 -0.23003 218155_x_at FLJ10534 998 0.186425 218976_at DNAJC12 486 -0.22866 219392_x_at FLJ11029 867 0.169113 219678_x_at DCLRE1C 877 0.169975 220199_s_at FLJ12806 378 -0.20713 220389_at FLJ23514 102 0.239341 220720_x_at FLJ14346 989 0.17976 221191_at DKFZP434A0131 616 0.185412 221310_at FGF14 511 -0.19965 221765_at --- 319 -0.25025 222027_at NUCKS 547 0.171954 222104_x_at GTF2H3 981 0.186025 222358_x_at --- 564 0.194048 202113_s_at SNX2 841 -0.20503 207133_x_at ALPK1 781 0.155812 218989_x_at SLC30A5 765 -0.198 200751_s_at HNRPC 759 -0.19243 220796_x_at SLC35E1 691 0.158199 209362_at SURB7 690 -0.18777 216248_s_at NR4A2 678 -0.19796 203138_at HAT1 669 -0.18115 221428_s_at TBL1XR1 665 -0.19331 218172_s_at DERL1 665 -0.16341 215861_at FLJ14031 651 0.156927 209288_s_at CDC42EP3 638 -0.20146 214001_x_at RPS10 634 0.151006 209116_x_at HBB 626 -0.12237 215595_x_at GCNT2 625 0.136319 208891_at DUSP6 617 -0.17282 215067_x_at PRDX2 616 0.160582 202918_s_at PREI3 614 -0.17003 211985_s_at CALM1 1 614 -0.20103 212019_at RSL1D1 601 0.152717 216187_x_at KNS2 591 0.14297 215066_at PTPRF 587 0.143323 212192_at KCTD12 581 -0.17535 217586_x_at --- 577 0.147487 203582_s_at RAB4A 567 -0.18289 220113_x_at POLR1B 563 0.15764 217232_x_at HBB 561 -0.11398 201041_s_at DUSP1 560 -0.18661 211450_s_at MSH6 544 -0.15597 202648_at RPS19 533 0.150087 202936_s_at SOX9 533 -0.17714 204426_at RNP24 526 -0.18959 206392_s_at RARRES1 517 -0.18328 208750_s_at ARF1 515 -0.19797 202089_s_at SLC39A6 512 -0.19904 211297_s_at CDK7 510 -0.15992 215373_x_at FLJ12151 509 0.146742 213679_at FLJ13946 492 -0.10963 201694_s_at EGR1 490 -0.19478 209142_s_at UBE2G1 487 -0.18055 217706_at LOC220074 483 0.11787 212991_at FBXO9 476 0.148288 201289_at CYR61 465 -0.19925 206548_at FLJ23556 465 0.141583 202593_s_at MIR16 462 -0.17042 202932_at YES1 461 -0.17637 220575_at FLJ11800 461 0.116435 217713_x_at DKFZP566N034 452 0.145994 211953_s_at RANBP25 447 -0.17838 203827_at WIPI49 447 -0.17767 221997_s_at MRPL52 444 0.132649 217662_x_at BCAP29 434 0.116886 218519_at SLC35A5 428 -0.15495 214833_at KIAA0792 428 0.132943 201339_s_at SCP2 426 -0.18605 203799_at CD302 422 -0.16798 211090_s_at PRPF4B 421 -0.1838 220071_x_at C15orf25 420 0.138308 203946_s_at ARG2 415 -0.14964 213544_at ING1L 415 0.137052 209908_s_at --- 414 0.131346 201688_s_at TPD52 410 -0.18965 215587_x_at BTBD14B 410 0.139952 201699_at PSMC6 409 -0.13784 214902_x_at FLJ42393 409 0.140198 214041_x_at RPL37A 402 0.106746 203987_at FZD6 392 -0.19252 211696_x_at HBB 392 -0.09508 218025_s_at PECI 389 -0.18002 215852_x_at KIAA0889 382 0.12243 209458_x_at HBA1 /// HBA2 380 -0.09796 219410_at TMEM45A 379 -0.22387 215375_x_at --- 379 0.148377 206302_s_at NUDT4 376 -0.18873 208783_s_at MCP 372 -0.15076 211374_x_at --- 364 0.131101 220352_x_at MGC4278 364 0.152722 216609_at TXN 363 0.15162 201942_s_at CPD 363 -0.1889 202672_s_at ATF3 361 -0.12935 204959_at MNDA 359 -0.21676 211996_s_at KIAA0220 358 0.144358 222035_s_at PAPOLA 353 -0.14487 208808_s_at HMGB2 349 -0.15222 203711_s_at HIBCH 347 -0.13214 Affymetrix ID Gene symbol (HUGO ID) Number of runs* Signal to noise in a cancer sample** 215179_x_at PGF 347 0.146279 213562_s_at SQLE 345 -0.14669 203765_at GCA 340 -0.1798 214414_x_at HBA2 336 -0.08492 217497_at ECGF1 336 0.123255 220924_s_at SLC38A2 333 -0.17315 218139_s_at C14orf108 332 -0.15021 201096_s_at ARF4 330 -0.18887 220361_at FLJ12476 325 -0.15452 202169_s_at AASDHPPT 323 -0.15787 202527_s_at SMAD4 322 -0.18399 202166_s_at PPP1R2 320 -0.16402 204634_at NEK4 319 -0.15511 215504_x_at --- 319 0.145981 202388_at RGS2 315 -0.14894 215553_x_at WDR45 315 0.137586 200598_s_at TRA1 314 -0.19349 202435_s_at CYP1B1 313 0.056937 216206_x_at MAP2K7 313 0.10383 212582_at OSBPL8 313 -0.17843 216509_x_at MLLT10 312 0.123961 200908_s_at RPLP2 308 0.136645 215108_x_at TNRC9 306 -0.1439 213872_at C6orf62 302 -0.19548 214395_x_at EEF1D 302 0.128234 222156_x_at CCPG1 301 -0.14725 201426_s_at VIM 301 -0.17461 221972_s_at Cab45 299 -0.1511 219957_at --- 298 0.130796 215123_at --- 295 0.125434 212515_s_at DDX3X 295 -0.14634 203357_s_at CAPN7 295 -0.17109 211711_s_at PTEN 295 -0.12636 Affymetrix ID Gene symbol (HUGO ID) Number of runs* Signal to noise in a cancer sample** 206165_s_at CLCA2 293 -0.17699 213959_s_at KIAA1005 289 -0.16592 215083_at PSPC1 289 0.147348 219630_at PDZK1IP1 287 -0.15086 204018_x_at HBA1 /// HBA2 286 -0.08689 208671 at TDE2 286 -0.17839 203427_at ASF1A 286 -0.14737 215281_x_at POGZ 286 0.142825 205749_at CYP1A1 285 0.107118 212585_at OSBPL8 282 -0.13924 211745_x_at HBB1 /// HBA2 281 -0.08437 208078_s_at SNF1LK 278 -0.14395 218041_x_at SLC38A2 276 -0.17003 212588_at PTPRC 270 -0.1725 212397_at RDX 270 -0.15613 208268_at ADAM28 269 0.114996 207194_s_at ICAM4 269 0.127304 222252_x_at --- 269 0.132241 217414_x_at HBA2 266 -0.08974 207078_at MED6 261 0.1232 215268_at KIAA0754 261 0.13669 221387_at GPR147 261 0.128737 201337_s_at VAMP3 259 -0.17284 220218_at C9orf68 259 0.125851 222356_at TBL1Y 259 0.126765 208579_x_at H2BFS 258 -0.16608 219161_s_at CKLF 257 -0.12288 202917_s_at S100A8 256 -0.19869 204455_at DST 255 -0.13072 211672_s_at ARPC4 254 -0.17791 201132_at HNRPH2 254 -0.12817 218313_s_at GALNT7 253 -0.179 218930_s_at FLJ11273 251 -0.15878 Affymetrix ID Gene symbol (HUGO ID) Number of runs* Signal to noise in a cancer sample** 219166_at C14orf104 250 -0.14237 212805_at KIAA0367 248 -0.16649 201551_s_at LAMP1 247 -0.18035 202599_s_at NRIP1 247 -0.16226 203403_s_at RNF6 247 -0.14976 214261_s_at ADH6 242 -0.1414 202033_s_at RB1CC1 240 -0.18105 203896_s_at PLCB4 237 -0.20318 209703 x at DKFZP586A0522 234 0.140153 211699_x_at HBA1 /// HBA2 232 -0.08369 210764_s_at CYR61 231 -0.13139 206391_at RARRES1 230 -0.16931 201312_s_at SH3BGRL 225 -0.12265 200798_x_at MCL1 221 -0.13113 214912_at --- 221 0.116262 204621_s_at NR4A2 217 -0.10896 217761_at MTCBP-1 217 -0.17558 205830_at CLGN 216 -0.14737 218438_s_at MED28 214 -0.14649 207475_at FABP2 214 0.097003 208621_s_at VIL2 213 -0.19678 202436_s_at CYP1B1 212 0.042216 202539_s_at HMGCR 210 -0.15429 210830_s_at PON2 209 -0.17184 211906_s_at SERPINB4 207 -0.14728 202241_at TRIB1 207 -0.10706 203594_at RTCD1 207 -0.13823 215863_at TFR2 207 0.095157 221992_at LOC283970 206 0.126744 221872_at RARRES1 205 -0.11496 219564_at KCNJ16 205 -0.13908 201329_s_at ETS2 205 -0.14994 214188_at HIS1 203 0.1257 Affymetrix ID Gene symbol (HUGO ID) Number of runs* Signal to noise in a cancer sample** 201667_at GJA1 199 -0.13848 201464_x_at JUN 199 -0.09858 215409_at LOC254531 197 0.094182 202583_s_at RANBP9 197 -0.13902 215594_at --- 197 0.101007 214326_x_at JUND 196 -0.1702 217140_s_at VDAC1 196 -0.14682 215599_at SMA4 195 0.133438 209896_s_at PTPN11 195 -0.16258 204846_at CP 195 -0.14378 222303_at --- 193 -0.10841 218218_at DIP13B 193 -0.12136 211015_s_at HSPA4 192 -0.13489 208666_s_at ST13 191 -0.13361 203191_at ABCB6 190 0.096808 202731_at PDCD4 190 -0.1545 209027_s_at AB11 190 -0.15472 205979_at SCGB2A1 189 -0.15091 216351_x_at DAZ1 /// DAZ3 /// DAZ2 /// DAZ4 189 0.106368 220240_s_at C13orf11 188 -0.16959 204482_at CLDN5 187 0.094134 217234_s_at VIL2 186 -0.16035 214350_at SNTB2 186 0.095723 201693_s_at EGR1 184 -0.10732 212328_at KIAA1102 182 -0.12113 220168_at CASC1 181 -0.1105 203628_at IGF1R 180 0.067575 204622_x_at NR4A2 180 -0.11482 213246_at C14orf109 180 -0.16143 218728_s_at HSPC163 180 -0.13248 214753_at PFAAP5 179 0.130184 206336_at CXCL6 178 -0.05634 Affymetrix ID Gene symbol (HUGO ID) Number of runs* Signal to noise in a cancer sample** 201445_at CNN3 178 -0.12375 209886_s_at SMAD6 176 0.079296 213376_at ZBTB1 176 -0.17777 213887_s_at POLR2E 175 -0.16392 204783_at MLF1 174 -0.13409 218824_at FLJ10781 173 0.1394 212417_at SCAMP1 173 -0.17052 202437_s_at CYP1B1 171 0.033438 217528_at CLCA2 169 -0.14179 218170_at ISOC1 169 -0.14064 206278_at PTAFR 167 0.087096 201939_at PLK2 167 -0.11049 200907_s_at KIAA0992 166 -0.18323 207480_s_at MEIS2 166 -0.15232 201417_at SOX4 162 -0.09617 213826_s_at --- 160 0.097313 214953_s_at APP 159 -0.1645 204897_at PTGER4 159 -0.08152 201711_x_at RANBP2 158 -0.17192 202457_s_at PPP3CA 158 -0.18821 206683_at ZNF165 158 -0.08848 214581_x_at TNFRSF21 156 -0.14624 203392_s_at CTBP1 155 -0.16161 212720_at PAPOLA 155 -0.14809 207758_at PPM1F 155 0.090007 220995_at STXBP6 155 0.106749 213831_at HLA-DQA1 154 0.193368 212044_s_at --- 153 0.098889 202434_s_at CYP1B1 153 0.049744 206166_s_at CLCA2 153 -0.1343 218343_s_at GTF3C3 153 -0.13066 202557_at STCH 152 -0.14894 201133_s_at PJA2 152 -0.18481 Affymetrix ID Gene symbol (HUGO ID) Number of runs* Signal to noise in a cancer sample** 213605_s_at MGC22265 151 0.130895 210947_s_at MSH3 151 -0.12595 208310_s_at C7orf28A /// C7orf28B 151 -0.15523 209307 at --- 150 -0.1667 215387_x_at GPC6 148 0.114691 213705 at MAT2A 147 0.104855 213979_s_at --- 146 0.121562 212731_at LOC157567 146 -0.1214 210117_at SPAG1 146 -0.11236 200641_s_at YWHAZ 145 -0.14071 210701_at CFDP1 145 0.151664 217152_at NCOR1 145 0.130891 204224_s_at GCH1 144 -0.14574 202028_s_at --- 144 0.094276 201735_s_at CLCN3 144 -0.1434 208447_s_at PRPS1 143 -0.14933 220926_s_at C1orf22 142 -0.17477 211505_s_at STAU 142 -0.11618 221684_s_at NYX 142 0.102298 206906_at ICAM5 141 0.076813 213228_at PDE8B 140 -0.13728 217202_s_at GLUL 139 -0.15489 211713_x_at KIAA0101 138 0.108672 215012_at ZNF451 138 0.13269 200806_s_at HSPD1 137 -0.14811 201466_s_at JUN 135 -0.0667 211564_s_at PDLIM4 134 -0.12756 207850_at CXCL3 133 -0.17973 221841_s_at KLF4 133 -0.1415 200605_s_at PRKAR1A 132 -0.15642 221198_at SCT 132 0.08221 201772_at AZIN1 131 -0.16639 205009_at TFF1 130 -0.17578 Affymetrix ID Gene symbol (HUGO ID) Number of runs* Signal to noise in a cancer sample** 205542_at STEAP1 129 -0.08498 218195_at C6orf211 129 -0.14497 213642_at --- 128 0.079657 212891_s_at GADD45GIP1 128 -0.09272 202798_at SEC24B 127 -0.12621 222207_x_at --- 127 0.10783 202638_s_at ICAM1 126 0.070364 200730_s_at PTP4A1 126 -0.15289 219355_at FLJ10178 126 -0.13407 220266_s_at KLF4 126 -0.15324 201259_s_at SYPL 124 -0.16643 209649_at STAM2 124 -0.1696 220094_s_at C6orf79 123 -0.12214 221751_at PANK3 123 -0.1723 200008_s_at GDI2 123 -0.15852 205078_at PIGF 121 -0.13747 218842_at FLJ21908 121 -0.08903 202536_at CHMP2B 121 -0.14745 220184_at NANOG 119 0.098142 201117_s_at CPE 118 -0.20025 219787_s_at ECT2 117 -0.14278 206628_at SLC5A1 117 -0.12838 204007_at FCGR3B 116 -0.15337 209446_s_at --- 116 0.100508 211612_s_at IL13RA1 115 -0.17266 220992_s_at C1orf25 115 -0.11026 221899_at PFAAP5 115 0.11698 221719_s_at LZTS1 115 0.093494 201473_at JUNB 114 -0.10249 221193_s_at ZCCHC10 112 -0.08003 215659_at GSDML 112 0.118288 205157_s_at KRT17 111 -0.14232 201001_s_at UBE2V 1 /// Kua-UEV 111 -0.16786 Affymetrix ID Gene symbol (HUGO ID) Number of runs* Signal to noise in a cancer sample** 216789_at --- 111 0.105386 205506_at VIL1 111 0.097452 204875_s_at GMDS 110 -0.12995 207191_s_at ISLR 110 0.100627 202779_s_at UBE2S 109 -0.11364 210370_s_at LY9 109 0.096323 202842_s_at DNAJB9 108 -0.15326 201082_s_at DCTN1 107 -0.10104 215588_x_at RIOK3 107 0.135837 211076_x_at DRPLA 107 0.102743 210230_at --- 106 0.115001 206544_x_at SMARCA2 106 -0.12099 208852_s_at CANX 105 -0.14776 215405_at MYO1E 105 0.086393 208653_s_at CD164 104 -0.09185 206355_at GNAL 103 0.1027 210793_s_at NUP98 103 -0.13244 215070_x_at RABGAP1 103 0.125029 203007_x_at LYPLA1 102 -0.17961 203841_x_at MAPRE3 102 -0.13389 206759_at FCER2 102 0.081733 202232_s_at GA17 102 -0.11373 215892_at --- 102 0.13866 214359_s_at HSPCB 101 -0.12276 215810_x_at DST 101 0.098963 208937_s_at ID1 100 -0.06552 213664_at SLC1A1 100 -0.12654 219338_s_at FLJ20156 100 -0.10332 206595_at CST6 99 -0.10059 207300_s_at F7 99 0.082445 213792_s_at INSR 98 0.137962 209674_at CRY1 98 -0.13818 40665_at FMO3 97 -0.05976 Affymetrix ID Gene symbol (HUGO ID) Number of runs* Signal to noise in a cancer sample** 217975_at WBP5 97 -0.12698 210296_s_at PXMP3 97 -0.13537 215483_at AKAP9 95 0.125966 212633_at KIAA0776 95 -0.16778 206164 at CLCA2 94 -0.13117 216813_at --- 94 0.089023 208925_at C3orf4 94 -0.1721 219469_at DNCH2 94 -0.12003 206016_at CXorf37 93 -0.11569 216745_x_at LRCH1 93 0.117149 212999_x_at HLA-DQB1 92 0.110258 216859_x_at --- 92 0.116351 201636_at --- 92 -0.13501 204272_at LGALS4 92 0.110391 215454_x_at SFTPC 91 0.064918 215972_at --- 91 0.097654 220593_s_at FLJ20753 91 0.095702 222009_at CGI-14 91 0.070949 207115_x_at MBTD1 91 0.107883 216922_x_at DAZ 1 /// DAZ3 /// DAZ2 /// DAZ4 91 0.086888 217626_at AKRIC1 /// AKR1C2 90 0.036545 211429_s_at SERPINA1 90 -0.11406 209662_at CETN3 90 -0.10879 201629_s_at ACP1 90 -0.14441 201236_s_at BTG2 89 -0.09435 217137_x_at --- 89 0.070954 212476_at CENTB2 89 -0.1077 218545_at FLJ11088 89 -0.12452 208857_s_at PCMT1 89 -0.14704 221931_s_at SEH1L 88 -0.11491 215046_at FLJ23861 88 -0.14667 220222_at PRO1905 88 0.081524 Affymetrix ID Gene symbol (HUGO ID) Number of runs* Signal to noise in a cancer sample** 209737_at AIP1 87 -0.07696 203949_at MPO 87 0.113273 219290_x_at DAPP1 87 0.111366 205116_at LAMA2 86 0.05845 222316_at VDP 86 0.091505 203574_at NFIL3 86 -0.14335 207820_at ADH1A 86 0.104444 203751_x_at JUND 85 -0.14118 202930_s_at SUCLA2 85 -0.14884 215404_x_at FGFR1 85 0.119684 216266_s_at ARFGEF1 85 -0.12432 212806_at KIAA0367 85 -0.13259 219253_at --- 83 -0.14094 214605_x_at GPR1 83 0.114443 205403_at IL1R2 82 -0.19721 222282_at PAPD4 82 0.128004 214129_at PDE4DIP 82 -0.13913 209259_s_at CSPG6 82 -0.12618 216900_s_at CHRNA4 82 0.105518 221943_x_at RPL38 80 0.086719 215386_at AUTS2 80 0.129921 201990_s_at CREBL2 80 -0.13645 220145_at FLJ21159 79 -0.16097 221173_at USH1C 79 0.109348 214900_at ZKSCAN1 79 0.075517 203290_at HLA-DQA1 78 -0.20756 215382_x_at TPSAB1 78 -0.09041 201631_s_at IER3 78 -0.12038 212188_at KCTD12 77 -0.14672 220428_at CD207 77 0.101238 215349_at --- 77 0.10172 213928_s_at HRB 77 0.092136 221228_s_at --- 77 0.0859 Affymetrix ID Gene symbol (HUGO ID) Number of runs* Signal to noise in a cancer sample** 202069_s_at IDH3A 76 -0.14747 208554_at POU4F3 76 0.107529 209504_s_at PLEKHB1 76 -0.13125 212989_at TMEM23 75 -0.11012 216197_at ATF7IP 75 0.115016 204748_at PTGS2 74 -0.15194 205221_at HGD 74 0.096171 214705_at INADL 74 0.102919 213939_s_at RIPX 74 0.091175 203691_at PI3 73 -0.14375 220532_s_at LR8 73 -0.11682 209829_at C6orf32 73 -0.08982 206515_at CYP4F3 72 0.104171 218541_s_at C8orf4 72 -0.09551 210732_s_at LGALS8 72 -0.13683 202643_s_at TNFAIP3 72 -0.16699 218963_s_at KRT23 72 -0.10915 213304_at KIAA0423 72 -0.12256 202768_at FOSB 71 -0.06289 205623_at ALDH3A1 71 0.045457 206488_s_at CD36 71 -0.15899 204319_s_at RGS10 71 -0.10107 217811_at SELT 71 -0.16162 202746_at ITM2A 70 -0.06424 221127_s_at RIG 70 0.110593 209821_at C9orf26 70 -0.07383 220957_at CTAGE1 70 0.092986 215577_at UBE2E1 70 0.10305 214731_at DKFZp547A023 70 0.102821 210512_s_at VEGF 69 -0.11804 205267_at POU2AF1 69 0.101353 216202_s_at SPTLC2 69 -0.11908 220477_s_at C20orf30 69 -0.16221 Affymetrix ID Gene symbol (HUGO ID) Number of runs* Signal to noise in a cancer sample** 205863_at S100A12 68 -0.10353 215780_s_at SET /// LOC389168 68 -0.10381 218197_s_at OXR1 68 -0.14424 203077_s_at SMAD2 68 -0.11242 222339_x_at --- 68 0.121585 200698_at KDELR2 68 -0.15907 210540_s_at B4GALT4 67 -0.13556 217725_x_at PAI-RBP1 67 -0.14956 217082_at --- 67 0.086098 Table 7: Group of 20 genes useful in prognosis and/or diagnosis of lung cancer. Gene symbol Affymetrix ID HUGO ID Number of runs* Signal to noise in a cancer sample* 207953_at AD7C-NTP 1000 0.218433 215208_x_at RPL35A 999 0.228485 215604_x_at UBE2D2 998 0.224878 218155_x_at FLJ10534 998 0.186425 216858_x_at --- 997 0.232969 208137_x_at --- 996 0.191938 214715_x_at ZNF160 996 0.198532 217715_x_at ZNF354A 995 0.223881 220720_x_at FLJ14346 989 0.17976 215907_at BACH2 987 0.178338 217679_x_at --- 987 0.265918 206169_x_at RoXaN 984 0.259637 208246_x_at TK2 982 0.179058 222104_x_at GTF2H3 981 0.186025 206056_x_at SPN 976 0.196398 217653_x_at --- 976 0.270552 210679_x_at --- 970 0.181718 207730_x_at HDGF2 969 0.169108 214594_x_at ATP8B1 962 0.284039 - * The number of runs when the gene is indicated in cancer samples as differentially expressed out of 1000 test runs.
- ** Negative values indicate increase of expression in lung cancer, positive values indicate decrease of expression in lung cancer.
- One can use the above tables to correlate or compare the expression of the transcript to the expression of the gene product, i.e. protein. Increased expression of the transcript as shown in the table corresponds to increased expression of the gene product. Similarly, decreased expression of the transcript as shown in the table corresponds to decreased expression of the gene product.
- In one preferred embodiment, one uses at least one, preferably at least 2, 3, 4, 5, 6, 7, 8, 9, 10 or more, of the genes as listed in Tables 8, 9 and/or 10. In one embodiment, one uses maximum of 500, 400, 300, 200, 100, or 50 of the gene that include at least 5, 6, 7, 8, 9, 10-20, 20-30, 30-40, 40-50, 50-60, 60-70, 1-70, of the genes listed in Tables 8-10.
Table 8: 361 Airway t-test gene list AffyID GeneName (HUGO ID) 202437_s_at CYP1B1 206561_s_at AKR1B10 202436_s_at CYP1B1 205749_at CYP1A1 202435_s_at CYP1B1 201884_at CEACAM5 205623_at ALDH3A1 217626_at --- 209921_at SLC7A11 209699_x_at AKR1C2 201467_s_at NQO1 201468_s_at NQO1 202831_at GPX2 214303_x_at MUC5AC 211653_x_at AKR1C2 214385_s_at MUC5AC 216594_x_at AKR1C1 205328_at CLDN10 209160_at AKR1C3 210519_s_at NQO1 217678_at SLC7A11 205221_at HGD /// LOC642252 204151_x_at AKR1C1 207469_s_at PIR 206153_at CYP4F11 205513_at TCN1 209386_at TM4SF1 209351_at KRT14 204059_s_at ME1 209213_at CBR1 210505_at ADH7 214404_x_at SPDEF .204058_at ME1 218002_s_at CXCL14 205499_at SRPX2 210065_s_at UPK1B 204341_at TRIM16 /// TRIM16L /// LOC653524 221841_s_at KLF4 208864_s_at TXN 208699_x_at TKT 210397_at DEFB1 204971_at CSTA 211657_at CEACAM6 201463_s_at TALDO1 214164_x_at CA12 203925_at GCLM 201118_at PGD 201266_at TXNRD1 203757_s_at CEACAM6 202923_s_at GCLC 214858_at GPC1 205009_at TFF1 219928_s_at CABYR 203963_at CA12 210064_s_at UPK1B 219956_at GALNT6 208700_s_at TKT 203824_at TSPAN8 207126_x_at UGT1A10 /// UGT1A8 /// UGT1A7 /// UGT1A6 /// UGT1A 213441_x_at SPDEF 207430_s_at MSMB 209369_at ANXA3 217187_at MUC5AC 209101_at CTGF 212221_x_at IDS 215867_x_at CA12 214211_at FTH1 217755_at HN1 201431_s_at DPYSL3 204875_s_at GMDS 215125_s_at UGT1A10 /// UGT1A8 /// UGT1A7 /// UGT1A6 /// UGT1A 63825_at ABHD2 202922 at GCLC 218313_s_at GALNT7 210297_s_at MSMB 209448 at HTATIP2 204532_x_at UGT1A10 /// UGT1A8 /// UGTIA7 /// UGT1A6 /// UGT1A 200872_at S100A10 216351_x_at DAZ1 /// DAZ3 /// DAZ2 /// DAZ4 212223_at IDS 208680_at PRDX1 206515_at CYP4F3 208596_s_at UGTIA10 /// UGT1A8 /// UGTIA7 /// UGT1A6 /// UGT1A 209173_at AGR2 204351_at S100P 202785_at NDUFA7 204970_s_at MAFG 222016_s_at ZNF323 200615_s_at AP2B1 206094_x_at UGT1A6 209706_at NKX3-1 217977_at SEPX1 201487_at CTSC 219508_at GCNT3 204237_at GULP1 213455 at LOC283677 213624 at SMPDL3A 206770_s_at SLC35A3 217975_at WBP5 201263_at TARS 218696_at EIF2AK3 212560_at C11orf32 218885_s_at GALNT12 212326_at VPS13D 217955_at BCL2L13 203126_at IMPA2 214106_s_at GMDS 209309_at AZGP1 205112_at PLCE1 215363_x_at FOLH1 206302_s_at NUDT4 /// NUDT4P1 200916_at TAGLN2 205042_at GNE 217979_at TSPAN13 203397_s_at GALNT3 209786_at HMGN4 211733_x_at SCP2 207222_at PLA2G10 204235_s_at GULP1 205726_at DIAPH2 203911_at RAP1GAP 200748_s_at FTH1 212449_s_at LYPLA1 213059_at CREB3L1 201272_at AKR1B1 208731_at RAB2 205979_at SCGB2A1 212805_at KIAA0367 202804_at ABCC1 218095_s_at TPARL 205566_at ABHD2 209114_at TSPAN1 202481_at DHRS3 202805_s_at ABCC1 219117_s_at FKBP11 213172_at TTC9 202554_s_at GSTM3 218677_at S100A14 203306_s_at SLC35A1 204076_at ENTPD4 200654_at P4HB 204500_s_at AGTPBP1 208918_s_at NADK 221485_at B4GALT5 221511_x_at CCPG1 200733_s_at PTP4A1 217901_at DSG2 202769_at CCNG2 202119_s_at CPNE3 200945_s_at SEC31L1 200924_s_at SLC3A2 208736_at ARPC3 221556_at CDC14B 221041_s_at SLC17A5 215071_s_at HIST1H2AC 209682_at CBLB 209806_at HIST1H2BK 204485_s_at TOM1L1 201666_at TIMP1 203192_at ABCB6 202722_s_at GFPT1 213135_at TIAM1 203509_at SORL1 214620_x_at PAM 208919_s_at NADK 212724_at RND3 212160_at XPOT 212812_at SERINC5 200696_s_at GSN 217845_x_at HIGD1A 208612_at PDIA3 219288_at C3orf14 201923_at PRDX4 211960_s_at RAB7 64942_at GPR153 201659__s_at ARL1 202439_s_at IDS 209249_s_at GHITM 218723_s_at RGC32 200087_s_at TMED2 209694_at PTS 202320_at GTF3C1 201193_at IDH1 212233 at --- 213891_s_at --- 203041_s_at LAMP2 202666_s_at ACTL6A 200863_s_at RAB11A 203663_s_at COX5A 211404_s_at APLP2 201745_at PTK9 217823_s_at UBE2J1 202286_s_at TACSTD2 212296_at PSMD14 211048_s_at PDIA4 214429_at MTMR6 219429_at FA2H 212181_s_at NUDT4 222116 s at TBC1D16 221689_s_at PIGP 209479_at CCDC28A 218434_s_at AACS 214665_s_at CHP 202085_at TJP2 217992_s_at EFHD2 203162_s_at KATNB1 205406_s_at SPA17 203476_at TPBG 201724_s_at GALNT1 200599_s_at HSP90B1 200929_at TMED10 200642_at SOD1 208946_s_at BECN1 202562_s_at C14orf1 201098_at COPB2 221253_s_at TXNDC5 201004_at SSR4 203221_at TLE1 201588_at TXNL1 218684_at LRRC8D 208799_at PSMB5 201471_s_at SQSTM1 204034_at ETHE1 208689_s_at RPN2 212665 at TIPARP 200625_s_at CAP1 213220_at LOC92482 200709_at FKBP1A 203279_at EDEM1 200068_s_at CANX 200620_at TMEM59 200075_s_at GUK1 209679_s_at LOC57228 210715_s_at SPINT2 209020_at C20orf111 208091_s_at ECOP 200048_s_at JTB 218194_at REXO2 209103_s_at UFD1L 208718_at DDX17 219241_x_at SSH3 216210_x_at TRIOBP 50277_at GGA1 218023_s_at FAM53C 32540_at PPP3CC 43511_s_at --- 212001_at SFRS14 208637_x_at ACTN1 201997_s_at SPEN 205073_at CYP2J2 40837_at TLE2 204447_at ProSAPiP1 204604_at PFTK1 210273_at PCDH7 208614_s_at FLNB 206510_at SIX2 200675_at CD81 219228_at ZNF331 209426_s_at AMACR 204000_at GNB5 221742_at CUGBP1 208883_at EDD1 210166_at TLR5 211026_s_at MGLL 220446_s_at CHST4 207636_at SERPINI2 212226_s_at PPAP2B 210347_s_at BCL11A 218424_s_at STEAP3 204287_at SYNGR1 205489_at CRYM 36129_at RUTBC1 215418_at PARVA 213029_at NFIB 221016_s_at TCF7L1 209737_at MAGI2 220389_at CCDC81 213622_at COL9A2 204740_at CNKSR1 212126_at --- 207760_s_at NCOR2 205258_at INHBB 213169_at --- 33760_at PEX14 220968_s_at TSPAN9 221792_at RAB6B 205752_s_at GSTM5 218974_at FLJ10159 221748_s_at TNS1 212185_x_at MT2A 209500_x_at TNFSF13 /// TNFSF12-TNFSF13 215445_x_at 1-Mar 220625_s_at ELF5 32137_at JAG2 219747_at FLJ23191 201397_at PHGDH 207913_at CYP2F1 217853_at TNS3 1598_g_at GAS6 203799_at CD302 203329 at PTPRM 208712_at CCND1 210314_x_at TNFSF13 /// TNFSF12-TNFSF13 213217_at ADCY2 200953_s_at CCND2 204326_x_at MT1X 213488_at SNED1 213505_s_at SFRS14 200982_s_at ANXA6 211732_x_at HNMT 202587_s_at AK1 396_f_at EPOR 200878_at EPAS1 213228_at PDE8B 215785_s_at CYFIP2 213601_at SLIT1 37953_s_at ACCN2 205206_at KAL1 212859_x_at MT1E 217165_x_at MT1F 204754_at HLF 218225_at SITPEC 209784_s_at JAG2 211538_s_at HSPA2 211456_x_at LOC650610 204734_at KRT15 201563_at SORD 202746_at ITM2A 218025_s_at PECI 203914_x_at HPGD 200884_at CKB 204753_s_at HLF 207718_x_at CYP2A6 /// CYP2A7 /// CYP2A7P1 /// CYP2A13 218820_at C14orf132 204745_x_at MT1G 204379_s_at FGFR3 207808_s_at PROS1 207547_s_at FAM107A 208581_x_at MT1X 205384_at FXYD1 213629_x_at MT1F 823_at CX3CL1 203687_at CX3CL1 211295_x_at CYP2A6 204755_x_at HLF 209897_s_at SLIT2 40093_at BCAM 211726_s_at FMO2 206461_x_at MT1H 219250_s_at FLRT3 210524_x_at --- 220798_x_at PRG2 219410_at TMEM45A 205680_at MMP10 217767_at C3 /// LOC653879 220562_at CYP2W1 210445_at FABP6 205725_at SCGB1A1 213432_at MUC5B /// LOC649768 209074_s_at FAM107A 216346_at SEC14L3 Table 9: 107 Nose Leading Edge Genes AffxID Hugo ID 203369_x_at --- 218434_s_at AACS 205566_at ABHD2 217687_at ADCY2 210505_at ADH7 205623_at ALDH3A1 200615_s_at AP2B1 214875_x_at APLP2 212724 at ARHE 201659_s_at ARL1 208736_at ARPC3 213624_at ASM3A 209309_at AZGP1 217188_s_at C14orfl 200620_at C1orf8 200068_s_at CANX 213798_s_at CAP1 200951_s_at CCND2 202769_at CCNG2 201884_at CEACAM5 203757_s_at CEACAM6 214665_s_at CHP 205328_at CLDN10 203663_s_at COX5A 202119_s_at CPNE3 221156_x_at CPR8 201487_at CTSC 205749_at CYP1A1 207913_at CYP2F1 206153 at CYP4F11 206514_s_at CYP4F3 216351_x_at DAZ4 203799_at DCL-1 212665_at DKFZP434J214 201430_s_at DPYSL3 211048_s_at ERP70 219118_at FKBP11 Table 9: 107 Nose Leading Edge Genes 214119_s_at FKBP1A 208918_s_at FLJ13052 217487_x_at FOLH1 200748_s_at FTH1 201723_s_at GALNT1 218885_s_at GALNT12 203397_s_at GALNT3 218313_s_at GALNT7 203925_at GCLM 219508_at GCNT3 202722_s_at GFPT1 204875_s_at GMDS 205042_at GNE 208612_at GRP58 214040_s_at GSN 214307_at HGD 209806_at HIST1H2BK 202579_x_at HMGN4 207180_s_at HTATIP2 206342_x_at IDS 203126_at IMPA2 210927_x_at JTB 203163_at KATNB1 204017_at KDELR3 213174_at KIAA0227 212806_at KIAA0367 210616_s_at KIAA0905 221841_s_at KLF4 203041_s_at LAMP2 213455_at LOC92689 218684_at LRRC5 204059_s_at ME1 Table 9: 107 Nose Leading Edge Genes 207430_s_at MSMB 210472_at MT1G 213432_at MUC5B 211498_s_at NKX3-1 201467_s_at NQO1 206303_s_at NUDT4 213498_at OASIS 200656_s_at P4HB 213441_x_at PDEF 207469_s_at PIR 207222_at PLA2G10 209697_at PPP3CC 201923_at PRDX4 200863_s_at RAB11A 208734_x_at RAB2 203911_at RAP1GA1 218723_s_at RGC32 200087_s_at RNP24 200872_at S100A10 205979_at SCGB2A1 202481_at SDR1 217977_at SEPX1 221041_s_at SLC17A5 203306_s_at SLC35A1 207528_s_at SLC7A11 202287_s_at TACSTD2 210978_s_at TAGLN2 20S513_at TCN1 201666_at TIMP1 208699_x_at TKT 217979-at TM4SF13 203824_at TM4SF3 Table 9: 107 Nose Leading Edge Genes 200929_at TMP21 221253_s_at TXNDC5 217825_s_at UBE2J1 215125_s_at UGT1A10 210064_s_at UPK1B 202437_s_at CYP1B1 Table 10: 70 gene list AFFYID Gene Name (HUGO ID) 213693_s_at MUC1 211695_x_at MUC1 207847_s_at MUC1 208405_s_at CD 164 220196_at MUC16 217109_at MUC4 217110_s_at MUC4 204895_x_at MUC4 214385_s_at MUC5AC 1494_f_at CYP2A6 210272_at CYP2B7P1 206754_s_at CYP2B7P1 210096_at CYP4B1 208928_at POR 207913_at CYP2F1 220636_at DNAI2 201999_s_at DYNLT1 205186_at DNALI1 220125_at DNAI1 210345_s_at DNAH9 214222_at DNAH7 211684_s_at DYNC1I2 211928_at DYNC1H1 200703_at DYNLL1 217918_at DYNLRB1 217917_s_at DYNLRB1 209009_at ESD 204418_x_at GSTM2 215333_x_at GSTM1 217751_at GSTK1 203924_at GSTA1 201106_at GPX4 200736_s_at GPX1 204168_at MGST2 200824_at GSTP1 211630_s_at GSS 201470_at GSTO1 201650_at KRT19 209016_s_at KRT7 209008_x_at KRT8 201596_x_at KRT18 210633_x_at KRT10 207023_x_at KRT10 212236 x_at KRT17 201820_at KRT5 204734_at KRT15 203151 at MAP1A 200713_s_at MAPRE1 204398_s at EML2 40016_g_at MAST4 208634_s_at MACF1 205623_at ALDH3A1 212224_at ALDH1A1 205640_at ALDH3B1 211004_s_at ALDH3B1 202054_s_at ALDH3A2 205208_at ALDH1L1 201612_at ALDH9A1 201425_at ALDH2 201090_x_at K-ALPHA-1 202154_x_at TUBB3 202477_s_at TUBGCP2 203667_at TBCA 204141_at TUBB2A 207490_at TUBA4 208977_x_at TUBB2C 209118_s_at TUBA3 209251_x_at TUBA6 211058_x_at K-ALPHA-1 211072_x_at K-ALPHA-1 211714_x_at TUBB 211750_x_at TUBA6 212242_at TUBA1 212320_at TUBB 212639_x_at K-ALPHA-1 213266_at 76P 213476_x_at TUBB3 213646_x_at K-ALPHA-1 213726_x_at TUBB2C - Additionally, one can use any one or a combination of the genes listed in Table 9.
- The analysis of the gene expression of one or more genes and/or transcripts of the groups or their subgroups of the present invention can be performed using any gene expression method known to one skilled in the art. Such methods include, but are not limited to expression analysis using nucleic acid chips (e.g. Affymetrix chips) and quantitative RT-PCR based methods using, for example real-time detection of the transcripts. Analysis of transcript levels according to the present invention can be made using total or messenger RNA or proteins encoded by the genes identified in the diagnostic gene groups of the present invention as a starting material. In the preferred embodiment the analysis is an immunohistochemical analysis with an antibody directed against proteins comprising at least about 10-20, 20-30, preferably at least 36, at least 36-50, 50, about 50-60, 60-70, 70-80, 80-90, 96, 100-180, 180-200, 200-250, 250-300, 300-350, 350-400, 400-450, 450-500, 500-535 proteins encoded by the genes and/or transcripts as shown in Tables 1-7.
- The methods of analyzing transcript levels of the gene groups in an individual include Northern-blot hybridization, ribonuclease protection assay, and reverse transcriptase polymerase chain reaction (RT-PCR) based methods. The different RT-PCR based techniques are the most suitable quantification method for diagnostic purposes of the present invention, because they are very sensitive and thus require only a small sample size which is desirable for a diagnostic test. A number of quantitative RT-PCR based methods have been described and are useful in measuring the amount of transcripts according to the present invention. These methods include RNA quantification using PCR and complementary DNA (cDNA) arrays (Shalon et al., Genome Research 6(7):639-45, 1996; Bernard et al., Nucleic Acids Research 24(8):1435-42, 1996), real competitive PCR using a MALDI-TOF Mass spectrometry based approach (Ding et al, PNAS, 100: 3059-64, 2003), solid-phase mini-sequencing technique, which is based upon a primer extension reaction (
U.S. Patent No. 6,013,431 , Suomalainen et al. Mol. Biotechnol. Jun; 15(2):123-31, 2000), ion-pair high-performance liquid chromatography (Doris et al. J. Chromatogr. A May 8;806(1):47-60, 1998), and 5' nuclease assay or real-time RT-PCR (Holland et al. Proc Natl Acad Sci USA 88: 7276-7280, 1991). - Methods using RT-PCR and internal standards differing by length or restriction endonuclease site from the desired target sequence allowing comparison of the standard with the target using gel electrophoretic separation methods followed by densitometric quantification of the target have also been developed and can be used to detect the amount of the transcripts according to the present invention (see, e.g.,
U.S. Patent Nos. 5,876,978 ;5,643,765 ; and5,639,606 . - The samples are preferably obtained from bronchial airways using, for example, endoscopic cytobrush in connection with a fiber optic bronchoscopy. In one embodiment, the cells are obtained from the individual's mouth buccal cells, using, for example, a scraping of the buccal mucosa.
- In one preferred embodiment, the invention provides a prognostic and/or diagnostic immunohistochemical approach, such as a dip-stick analysis, to determine risk of developing lung disease. Antibodies against proteins, or antigenic epitopes thereof, that are encoded by the group of genes of the present invention, are either commercially available or can be produced using methods well know to one skilled in the art.
- The invention contemplates either one dipstick capable of detecting all the diagnostically important gene products or alternatively, a series of dipsticks capable of detecting the amount proteins of a smaller sub-group of diagnostic proteins of the present invention.
- Antibodies can be prepared by means well known in the art. The term "antibodies" is meant to include monoclonal antibodies, polyclonal antibodies and antibodies prepared by recombinant nucleic acid techniques that are selectively reactive with a desired antigen. Antibodies against the proteins encoded by any of the genes in the diagnostic gene groups of the present invention are either known or can be easily produced using the methods well known in the art. Internet sites such as Biocompare through the World Wide Web at biocompare.com at abmatrix to provide a useful tool to anyone skilled in the art to locate existing antibodies against any of the proteins provided according to the present invention.
- Antibodies against the diagnostic proteins according to the present invention can be used in standard techniques such as Western blotting or immunohistochemistry to quantify the level of expression of the proteins of the diagnostic airway proteome. This is quantified according to the expression of the gene transcript, i.e. the increased expression of transcript corresponds to increased expression of the gene product, i.e. protein. Similarly decreased expression of the transcript corresponds to decreased expression of the gene product or protein. Detailed guidance of the increase or decrease of expression of preferred transcripts in lung disease, particularly lung cancer, is set forth in the tables. For example, Tables 5 and 6 describe a group of genes the expression of which is altered in lung cancer.
- Immunohistochemical applications include assays, wherein increased presence of the protein can be assessed, for example, from a saliva or sputum sample.
- The immunohistochemical assays according to the present invention can be performed using methods utilizing solid supports. The solid support can be a any phase used in performing immunoassays, including dipsticks, membranes, absorptive pads, beads, microtiter wells, test tubes, and the like. Preferred are test devices which may be conveniently used by the testing personnel or the patient for self-testing, having minimal or no previous training. Such preferred test devices include dipsticks, membrane assay systems as described in
U.S. Pat. No. 4,632,901 . The preparation and use of such conventional test systems is well described in the patent, medical, and scientific literature. If a stick is used, the anti-protein antibody is bound to one end of the stick such that the end with the antibody can be dipped into the solutions as described below for the detection of the protein. Alternatively, the samples can be applied onto the antibody-coated dipstick or membrane by pipette or dropper or the like. - The antibody against proteins encoded by the diagnostic airway transcriptome (the "protein") can be of any isotype, such as IgA, IgG or IgM, Fab fragments, or the like. The antibody may be a monoclonal or polyclonal and produced by methods as generally described, for example, in Harlow and Lane, Antibodies, A Laboratory Manual, Cold Spring Harbor Laboratory, 1988, incorporated herein by reference. The antibody can be applied to the solid support by direct or indirect means. Indirect bonding allows maximum exposure of the protein binding sites to the assay solutions since the sites are not themselves used for binding to the support. Preferably, polyclonal antibodies are used since polyclonal antibodies can recognize different epitopes of the protein thereby enhancing the sensitivity of the assay.
- The solid support is preferably non-specifically blocked after binding the protein antibodies to the solid support. Non-specific blocking of surrounding areas can be with whole or derivatized bovine serum albumin, or albumin from other animals, whole animal serum, casein, non-fat milk, and the like.
- The sample is applied onto the solid support with bound protein-specific antibody such that the protein will be bound to the solid support through said antibodies. Excess and unbound components of the sample are removed and the solid support is preferably washed so the antibody-antigen complexes are retained on the solid support. The solid support may be washed with a washing solution which may contain a detergent such as Tween-20, Tween-80 or sodium dodecyl sulfate.
- After the protein has been allowed to bind to the solid support, a second antibody which reacts with protein is applied. The second antibody may be labeled, preferably with a visible label. The labels may be soluble or particulate and may include dyed immunoglobulin binding substances, simple dyes or dye polymers, dyed latex beads, dye-containing liposomes, dyed cells or organisms, or metallic, organic, inorganic, or dye solids. The labels may be bound to the protein antibodies by a variety of means that are well known in the art. In some embodiments of the present invention, the labels may be enzymes that can be coupled to a signal producing system. Examples of visible labels include alkaline phosphatase, beta-galactosidase, horseradish peroxidase, and biotin. Many enzyme-chromogen or enzyme-substrate-chromogen combinations are known and used for enzyme-linked assays. Dye labels also encompass radioactive labels and fluorescent dyes.
- Simultaneously with the sample, corresponding steps may be carried out with a known amount or amounts of the protein and such a step can be the standard for the assay. A sample from a healthy individual exposed to a similar air pollutant such as cigarette smoke, can be used to create a standard for any and all of the diagnostic gene group encoded proteins.
- The solid support is washed again to remove unbound labeled antibody and the labeled antibody is visualized and quantified. The accumulation of label will generally be assessed visually. This visual detection may allow for detection of different colors, for example, red color, yellow color, brown color, or green color, depending on label used. Accumulated label may also be detected by optical detection devices such as reflectance analyzers, video image analyzers and the like. The visible intensity of accumulated label could correlate with the concentration of protein in the sample. The correlation between the visible intensity of accumulated label and the amount of the protein may be made by comparison of the visible intensity to a set of reference standards. Preferably, the standards have been assayed in the same way as the unknown sample, and more preferably alongside the sample, either on the same or on a different solid support.
- The concentration of standards to be used can range from about 1 mg of protein per liter of solution, up to about 50 mg of protein per liter of solution. Preferably, two or more different concentrations of an airway gene group encoded proteins are used so that quantification of the unknown by comparison of intensity of color is more accurate.
- For example, the present invention provides a method for detecting risk of developing lung cancer in a subject exposed to cigarette smoke comprising measuring the transcription profile in a nasal epithelial cell sample of the proteins encoded by one or more groups of genes of the invention in a biological sample of the subject. Preferably at least about 30, still more preferably at least about 36, 40, 50, 60, 70, 80, 90, 100, 110, 120, 130, 140, 150, 160, 170, or about 180 of the proteins encoded by the airway transcriptome in a biological sample of the subject are analyzed. The method comprises binding an antibody against each protein encoded by the gene in the gene group (the "protein") to a solid support chosen from the group consisting of dip-stick and membrane; incubating the solid support in the presence of the sample to be analyzed under conditions where antibody-antigen complexes form; incubating the support with an anti-protein antibody conjugated to a detectable moiety which produces a signal; visually detecting said signal, wherein said signal is proportional to the amount of protein in said sample; and comparing the signal in said sample to a standard, wherein a difference in the amount of the protein in the sample compared to said standard of the same group of proteins, is indicative of diagnosis of or an increased risk of developing lung cancer. The standard levels are measured to indicate expression levels in an airway exposed to cigarette smoke where no cancer has been detected.
- The assay reagents, pipettes/dropper, and test tubes may be provided in the form of a kit. Accordingly, the invention further provides a test kit for visual detection of the proteins encoded by the airway gene groups, wherein detection of a level that differs from a pattern in a control individual is considered indicative of an increased risk of developing lung disease in the subject. The test kit comprises one or more solutions containing a known concentration of one or more proteins encoded by the airway transcriptome (the "protein") to serve as a standard; a solution of a anti-protein antibody bound to an enzyme; a chromogen which changes color or shade by the action of the enzyme; a solid support chosen from the group consisting of dip-stick and membrane carrying on the surface thereof an antibody to the protein. Instructions including the up or down regulation of the each of the genes in the groups as provided by the Tables 1 and 2 are included with the kit.
- The practice of the present invention may employ, unless otherwise indicated, conventional techniques and descriptions of organic chemistry, polymer technology, molecular biology (including recombinant techniques), cell biology, biochemistry, and immunology, which are within the skill of the art. Such conventional techniques include polymer array synthesis, hybridization, ligation, and detection of hybridization using a label. Specific illustrations of suitable techniques can be had by reference to the example herein below. However, other equivalent conventional procedures can, of course, also be used. Such conventional techniques and descriptions can be found in standard laboratory manuals such as Genome Analysis: A Laboratory Manual Series (Vols. I-IV), Using Antibodies: A Laboratory Manual, Cells: A Laboratory Manual, PCR Primer: A Laboratory Manual, and Molecular Cloning: A Laboratory Manual (all from Cold Spring Harbor Laboratory Press), Stryer, L. (1995) Biochemistry (4th Ed.) Freeman, New York, Gait, "Oligonucleotide Synthesis: A Practical Approach" 1984, IRL Press, Lond on, Nelson and Cox (2000), Lehninger, Principles of Biochemistry 3rd Ed., W.H. Freeman Pub., New York, NY and Berg et al. (2002) Biochemistry, 5th Ed., W.H. Freeman Pub., New York, NY, all of which are herein incorporated in their entirety by reference for all purposes.
- The methods of the present invention can employ solid substrates, including arrays in some preferred embodiments. Methods and techniques applicable to polymer (including protein) array synthesis have been described in
U.S.S.N 09/536,841 WO 00/58516 U.S. Patents Nos. 5,143,854 ,5,242,974 ,5,252,743 ,5,324,633 ,5,384,261 ,5,405,783 ,5,424,186 ,5,451,683 ,5,482,867 ,5,491,074 ,5,527,681 ,5,550,215 ,5,571,639 ,5,578,832 ,5,593,839 ,5,599,695 ,5,624,711 ,5,631,734 ,5,795,716 ,5,831,070 ,5,837,832 ,5,856,101 ,5,858,659 ,5,936,324 ,5,968,740 ,5,974,164 ,5,981,185 ,5,981,956 ,6,025,601 ,6,033,860 ,6,040,193 ,6,090,555 ,6,136,269 ,6,269,846 and6,428,752 , in PCT Applications Nos.PCT/US99/00730 WO 99/36760 PCT/US01/04285 , which are all incorporated herein by reference in their entirety for all purposes. - Patents that describe synthesis techniques in specific embodiments include
U.S. Patents Nos. 5,412,087 ,6,147,205 ,6,262,216 ,6,310,189 ,5,889,165 , and5,959,098 . Nucleic acid arrays are described in many of the above patents, but the same techniques are applied to polypeptide and protein arrays. - Nucleic acid arrays that are useful in the present invention include, but are not limited to those that are commercially available from Affymetrix (Santa Clara, CA) under the brand name GeneChip7. Example arrays are shown on the website at affymetrix.com.
- Examples of gene expression monitoring, and profiling methods that are useful in the methods of the present invention are shown in
U.S. Patents Nos. 5,800,992 ,6,013,449 ,6,020,135 ,6,033,860 ,6,040,138 ,6,177,248 and6,309,822 . Other examples of uses are embodied inU.S. Patents Nos. 5,871,928 ,5,902,723 ,6,045,996 ,5,541,061 , and6,197,506 : - The present invention also contemplates sample preparation methods in certain preferred embodiments. Prior to or concurrent with expression analysis, the nucleic acid sample may be amplified by a variety of mechanisms, some of which may employ PCR. See, e.g., PCR Technology: Principles and Applications for DNA Amplification (Ed. H.A. Erlich, Freeman Press, NY, NY, 1992); PCR Protocols: A Guide to Methods and Applications (Eds. Innis, et al., Academic Press, San Diego, CA, 1990); Mattila et al., Nucleic Acids Res. 19, 4967 (1991); Eckert et al., PCR Methods and ); and
U.S. Patent Nos. 4,683,202 ,4,683,195 ,4,800,159 4,965,188 , and5,333,675 , and each of which is incorporated herein by reference in their entireties for all purposes. The sample may be amplified on the array. See, for example,U.S. Patent No 6,300,070 andU.S. patent application 09/513,300 , which are incorporated herein by reference. - Other suitable amplification methods include the ligase chain reaction (LCR) (e.g., Wu and Wallace, ), Landegren et al., Science 241, 1077 (1988) and Barringer et al. Gene 89:117 (1990)), transcription amplification (Kwoh et al., Proc. Natl. Acad. Sci. USA 86, 1173 (1989) and
WO88/10315 WO90/06995 U.S. Patent No 6,410,276 ), consensus sequence primed polymerase chain reaction (CP-PCR) (U.S. Patent No 4,437,975 ), arbitrarily primed polymerase chain reaction (AP-PCR) (U.S. Patent No 5, 413,9095,861,245 ) and nucleic acid based sequence amplification (NABSA). (US patents nos. 5,409,818 ,5,554,517 , and6,063,603 ). Other amplification methods that may be used are described in,U.S. Patent Nos. 5,242,794 ,5,494,810 ,4,988,617 and inUSSN 09/854,317 - Additional methods of sample preparation and techniques for reducing the complexity of a nucleic sample are described, for example, in Dong et al., Genome Research 11, 1418 (2001), in
U.S. Patent No 6,361,947 ,6,391,592 andU.S. Patent application Nos. 09/916,135 ,09/920,491 09/910,292 10/013,598 - Methods for conducting polynucleotide hybridization assays have been well developed in the art. Hybridization assay procedures and conditions will vary depending on the application and are selected in accordance with the general binding methods known including those referred to in: Maniatis et al. Molecular Cloning: A Laboratory Manual (2nd Ed. Cold Spring Harbor, N.Y, 1989); Berger and Kimmel Methods in Enzymology, Vol. 152, Guide to Molecular Cloning Techniques (Academic Press, Inc., San Diego, CA, 1987); Young and Davism, P.N.A.S, 80: 1194 (1983). Methods and apparatus for carrying out repeated and controlled hybridization reactions have been described, for example, in
US patent 5,871,928 ,5,874,219 ,6,045,996 and6,386,749 ,6,391,623 each of which are incorporated herein by reference - The present invention also contemplates signal detection of hybridization between the sample and the probe in certain embodiments. See, for example,
U.S. Pat. Nos. 5,143,854 ,5,578,832 ;5,631,734 ;5,834,758 ;5,936,324 ;5,981,956 ;6,025,601 ;6,141,096 ;6,185,030 ;6,201,639 ;6,218,803 ; and6,225,625 , in provisionalU.S. Patent application 60/364,731 and inPCT Application PCT/US99/06097 WO99/47964 - Examples of methods and apparatus for signal detection and processing of intensity data are disclosed in, for example,
U.S. Patents Numbers 5,143,854 ,5,547,839 ,5,578,832 ,5,631,734 ,5,800,992 ,5,834,758 ;5,856,092 ,5,902,723 ,5,936,324 ,5,981,956, 6,025,601 ,6,090,555 ,6,141,096 ,6,185,030 ,6,201,639 ;6,218,803 ; and6,225,625 , inU.S. Patent application 60/364,731 and in PCT ApplicationPCT/US99/06097 WO99/47964 - The practice of the present invention may also employ conventional biology methods, software and systems. Computer software products of the invention typically include computer readable medium having computer-executable instructions for performing the logic steps of the method of the invention. Suitable computer readable medium include floppy disk, CD-ROM/DVD/DVD-ROM, hard-disk drive, flash memory, ROM/RAM, magnetic tapes and etc. The computer executable instructions may be written in a suitable computer language or combination of several languages. Basic computational biology methods are described in, e.g. Setubal and Meidanis et al., Introduction to Computational Biology Methods (PWS Publishing Company, Boston, 1997); Salzberg, Searles, Kasif, (Ed.), Computational Methods in Molecular Biology, (Elsevier, Amsterdam, 1998); Rashidi and Buehler, Bioinformatics Basics: Application in Biological Science and Medicine (CRC Press, London, 2000) and Ouelette and Bzevanis Bioinformatics: A Practical Guide for Analysis of Gene and Proteins (Wiley & Sons, Inc., 2nd ed., 2001).
- The present invention also makes use of various computer program products and software for a variety of purposes, such as probe design, management of data, analysis, and instrument operation. See, for example,
U.S. Patent Nos. 5,593,839 ,5,795,716 ,5,733,729 ,5,974,164 ,6,066,454 ,6,090,555 ,6,185,561 ,6,188,783 ,6,223,127 ,6,229,911 and6,308,170 . - Additionally, the present invention may have embodiments that include methods for providing gene expression profile information over networks such as the Internet as shown in, for example,
U.S. Patent applications 10/063,559,60/349,546 60/376,003 60/394,574 60/403,381 - Throughout this specification, various aspects of this invention are presented in a range format. It should be understood that the description in range format is merely for convenience and brevity and should not be construed as an inflexible limitation on the scope of the invention. Accordingly, the description of a range should be considered to have specifically disclosed all the possible sub-ranges as well as individual numerical values within that range. For example, description of a range such as from 10-20 should be considered to have specifically disclosed sub-ranges such as from 10-13, from 10-14, from 10-15, from 11-14, from 11-16, etc., as well as individual numbers within that range, for example, 10, 11, 12, 13, 14, 15, 16, 17, 18, 19, and 20. This applies regardless of the breadth of the range. In addition, the fractional ranges are also included in the exemplified amounts that are described. Therefore, for example, a range of 1-3 includes fractions such as 1.1, 1.2, 1.3, 1.4, 1.5, 1.6, etc. This applies particularly to the amount of increase or decrease of expression of any particular gene or transcript.
- The present invention has many preferred embodiments and relies on many patents, applications and other references for details known to those of the art. Therefore, when a reference, for example a patent application is cited in the specification, it should be understood that it is incorporated by reference in its entirety for all purposes as well as for the proposition that is recited.
- In this study, we obtained nucleic acid samples (RNA/DNA) from nose epithelial cells. We also obtained nucleic acids from blood to provide one control. We used our findings in the
PCT/US2006/014132 to compare the gene expression profile in the bronchial epithelial cells as disclosed in thePCT/US2006/014132 to the gene expression pattern discovered in this example from the nasal epithelial cells. - We have explored the concept that inhaled toxic substances create a epithelial cell "field of injury" that extends throughout the respiratory tract. We have developed the hypothesis that this "field of injury", measured most recently in our laboratory with high density gene expression arrays, provides information about the degree of airway exposure to a toxin and the way in which an individual has responded to that toxin. Our studies have been focused on cigarette smoke, the major cause of lung cancer and of COPD, although it is likely that most inhaled toxins result in a change in gene expression of airway epithelial cells.
- We began our studies by examining allelic loss in bronchial epithelial cells brushed from airways during diagnostic bronchcoscopy. We showed, as have others, that allelic loss occurs throughout the intra-pulmonary airways in smokers with lung cancer, on the side of the cancer as well as the opposite side from the cancer. Allelic loss also occurs, but to a lesser extent, in airway epithelial cells of smokers without cancer (Clinical Cancer Research 5:2025,1999). We expended these studies to adenocarcinomas from smokers and non-smokers and showed that there was a "field of injury" in non-cancerous lung tissue of smokers, but not in non-smokers (Lung Cancer. 39:23,2003, Am.J.Respir.Cell.Mol.Biol. 29:157,2003).
- We have progressed to using high density arrays to explore patterns of gene expression that occur in large airway epithelial cells of smokers and non-smokers. We have defined the types of genes that are induced by cigarette smoke, the relation to the amount smoked, racial differences (ATS) in how individuals respond to cigarette smoke, the changes that are reversible and not reversible in individuals who stop smoking (PNAS. 101:10143-10148,2004).. In addition, we have recently documented changes that occur in smokers who develop lung cancer (submitted and AACR), and changes that occur in smokers who develop COPD (Am. J. Respir. Cell Mol. Biol. 31: 601, 2004). All of these studies are ongoing in our laboratory and all depend on obtaining large airway epithelial cells at bronchoscopy, a process that does not lend itself to surveying large populations in epidemiologic studies.
- In order to develop a tool that could assay airway epithelial gene expression without bronchoscopy in large numbers of smokers, we begun to explore the potential of using epithelial cells obtained from the oral mucosa. We developed a method of obtaining RNA from mouth epithelial cells and could measure expression levels of a few genes that changed in the bronchial epithelium of smokers, but problems with the quality and quantity of RNA obtained from the mouth has limited widespread application of this method (Biotechniques 36:484-87,2004).
- We have now shown that epithelial cells obtained by brushing the nasal mucosa could be used as a diagnostic and prognostic tool for lung disorders. Preliminary results show that we can obtain abundant amounts of high quality RNA and DNA from the nose with ease (see protocol below), that we can measure gene expression using this RNA and high density microarrays and that many of the genes that change with smoking in the bronchial epithelium also change in the nose (see
Figure 1 ). We have further shown that gene expression in nasal epithelium can be used to define a potentially diagnostic and clinical stage-specific pattern of gene expression in subjects with sarcoidosis, even when the sarcoidosis does not clinically involve the lung (seeFigure 2 ). We can also obtain DNA from these same specimens allowing us to assess gene methylation patterns and genetic polymorphisms that explain changes in gene expression. - These studies show that gene expression in nasal epithelial cells, obtained in a non-invasive fashion, can indicate individual responses to a variety of inhaled toxins such as cigarette smoke, and can provide diagnostic, and possibly prognostic and pathogenetic information about a variety of diseases that involve the lung.
- Accordingly, based on our studies we have now developed the method of analyzing nasal epithelial cells as a technique and as a screening tool that can be used to evaluate individual and population responses to a variety of environmental toxins and as a diagnostic/prognostic tool for a variety of lung diseases, including lung cancer. While our initial studies utilize "discovery-based" genome-wide expression profiling, it is likely that initial studies will ultimately lead to a simpler "defined-gene" platform that will be less complicated and costly and might be used in the field.
- Following local anesthesia with 2% lidocaine solution, a Cytosoft brush is inserted into the right nare and under the inferior turbinate using a nasal speculum for visualization. The brush is turned 3 times to collect epithelial cells and immediately placed into RNA Later. Repeat brushing is performed and the 2nd brush is placed in PBS for DNA isolation.
- While we have demonstrated gene expression differences in bronchial epithelium associated with current, cumulative and past tobacco exposure, the relatively invasive nature of bronchoscopy makes the collection of these tissue samples challenging for large scale population studies and for studies of low-disease-risk individuals. Given our hypothesis that the field of tobacco injury extends to epithelial cells lining the entire respiratory tract, we performed a pilot study to explore the relationship between bronchial, mouth and nasal gene expression in response to tobacco exposure as nasal and oral buccal epithelium are exposed to cigarette smoke and can be obtained using noninvasive methods. In our pilot study, we collected 15 nasal epithelial samples (8 never smokers, 7 current smokers) via brushing the right inferior turbinate as described in our Research Methods and Design section. In addition, we collected buccal mucosa epithelial samples from 10 subjects (5 never smokers, 5 current smokers) using a scraping device that we have described previously [38] (see Appendix). All samples were run on Affymetrix HG-U133A arrays. Due to the small amounts (1-2ug) of partially degraded RNA obtained from the mouth, samples were collected serially on each subject monthly and pooled to yield sufficient RNA (6-8ug), Low transcript detection rates were observed for mouth samples, likely as a result of lower levels of intact full-length mRNA in the mouth samples
- A relationship between the tobacco-smoke induced pattern of gene expression in all three tissues was first identified by Gene Set Enrichment Analysis (GSEA; [39]) which demonstrates that genes differentially expressed in the bronchus are similarly changed in both the mouth and nose (GSEA p<0.01). We next performed a 2 way ANOVA to identify 365 genes are differentially expressed with smoking across all three tissues at p<0.001. PCA of all samples normalized within each tissue for these 365 genes is shown in
Figure 5 . - Finally, while this pilot study in the nose and mouth was not well powered for class prediction, we explored the possibility of using these tissues to identify biomarkers for smoke exposure. The genes with the 20 highest and 20 lowest signal-to-noise ratios between smokers and never-smokers were identified in both the nose and mouth. A classifier was then trained using these genes in bronchial epithelial samples (15 current and 15 never smokers), and tested on an independent test set of 41 samples. Genes selected from mouth and nose classify bronchial epithelium of current vs. never-smokers with high accuracy:
Genes selected from Nose Genes selected from Mouth Genes selected from Bronch Random sselected Genes Bronchus Classification Accuracy 82.8% 79.2% 93.2% 64.2 ± 8.1 - This pilot study established the feasibility of obtaining significant quantities of good quality RNA from brushings of the nasal mucosa suitable for DNA microarray studies and has demonstrated a relationship between previously defined smoking-related changes in the bronchial airway and those occurring in the nasal epithelium. While the quality and quantity of RNA obtained from buccal mucosa complicates analysis on the U133A platform, pooled studies suggest a gene-expression relationship to the bronchial airway in the setting of tobacco exposure. These results support the central hypothesis that gene expression profiles in the upper airway reflect host response to exposure. By using a novel array platform with the potential to measure gene expression in setting of partially degraded RNA, we propose to more fully explore the ability to create biomarkers of tobacco exposure with samples from nose and mouth epithelium.
- Approximately 1.3 billion people smoke cigarettes worldwide which accounts for almost 5 million preventable deaths per year (1). Smoking is a significant risk factor for lung cancer, the leading cause of cancer-related death in the United States, and chronic obstructive pulmonary disease (COPD), the fourth leading cause of death overall. Approximately 90% of lung cancer can be attributed to cigarette smoking, yet only 10-15% of smokers actually develop this disease (2). Despite the well-established causal role of cigarette smoke in lung cancer and COPD, the molecular epidemiology explaining why only a minority of smokers develop them is still poorly understood.
- Cigarette smoking has been found to induce a number of changes in both the upper and lower respiratory tract epithelia including cellular atypia (3, 4), aberrant gene expression, loss of heterozygosity (3, 5) and promoter hypermethylation. Several authors have reported molecular and genetic changes such as LOH or microsatellitle alterations dispersed throughout the airway epithelium of smokers including areas that are histologically normal (4, 6). We previously have characterized the effect of smoking on the normal human airway epithelial transcriptome and found that smoking induces expression of airway genes involved in regulation of oxidant stress, xenobiotic metabolism, and oncogenesis while suppressing those involved in regulation of inflammation and tumor suppression (7). While this bronchoscopy-based study elucidated some potential candidates for biomarkers of smoking related lung damage, there is currently a significant impetus to develop less invasive clinical specimens to serve as surrogates for smoking related lung damage.
- Oral and nasal mucosa are attractive candidates for a biomarkers since they are exposed to high concentrations of inhaled carcinogens and are definitively linked to smoking-related diseases(8). We have previously shown that it is feasible to obtain sufficient RNA from both nasal (9) and buccal mucosa for gene expression analysis (10) despite the high level of RNAses in saliva and nasal secretions (11,12). Few studies have characterized global gene expression in either of these tissues, and none has attempted to establish a link between upper and lower airway gene expression changes that occur with smoking. A pilot study by Smith et. al. used brush biopsies of buccal mucosa from smokers and nonsmokers to obtain RNA for cDNA microarrays and found approximately 100 genes that could distinguish the two groups in training and test sets. While the study provided encouraging evidence that buccal gene expression changes with smoking, many of these genes were undefined ESTs, and the study did not address any potential relationship between genetic responses in the upper and lower airways. Spivak et. al. found a qualitative relationship via PCR (i.e. detected or not detected) between patient matched buccal mucosa and laser-dissected lung epithelial cells across nine carcinogen or oxidant-metabolizing genes (13) in 11 subjects being evaluated for lung cancer. However, quantitative real-time PCR of these genes in buccal mucosa was not able to reliably predict lung cancer vs. control cases. While global gene expression profiling on nasal brushing has been done recently on children with asthma(14) and cystic fibrosis(15), we are unaware of any studies addressing the effects of smoking on nasal epithelial gene expression.
- In the current study, we report for the first time, a genome wide expression assay of buccal and nasal mucosa on normal healthy individuals, which herein are referred to as the "normal buccal and nasal transcriptomes". We then evaluate the effects of smoking on these transcriptomes and compare them to a previous bronchial epithelial gene expression dataset. By comparing these smoking-induced changes in the mouth, nose , and bronchus we establish a relationship between the lower and upper airway genetic responses to cigarette smoke and further advance the concept of a smoking-induced "field defect" on a global gene expression level. Lastly, we validate the use of mass spectrometry as a feasible method for multiplexed gene expression studies using small amounts of degraded RNA from buccal mucosa scrapings.
- Microarrays were performed on total of 25 subjects and mass spectrometry validation on 14 additional subjects. Demographic data for the microarray and mass spectrometry validation groups are presented in Table 11.
- Microarray analysis of normal tissue samples was performed on previously published datasets collected from the Gene Expression Omnibus (GEO). Ninety two samples spanning 10 different tissues types were analyzed altogether, including 12 nasal and buccal epithelial samples of non-smokers collected for this study. Additional microarray data from normal nasal epithelial samples were also collected to determine the reproducibility of gene expression patterns in nasal tissue collected from a different study. A detailed breakdown of the different tissues analyzed and number of samples within each tissue type are shown in Table 12.
- Principal component analysis (PCA) of the normal tissue samples spanning 10 tissue types (n=92 total samples) was performed across the 2382 genes comprising the normal airway transcriptome, which has been previously characterized (Spira et. al, 2004, PNAS).
Figure 7 shows bronchial and nasal epithelial samples clearly grouped together based on the expression of these 2382 genes. - Overrepresented sets of functional gene categories ("functional sets") among the 2382 normal airway transcriptome genes were determined by EASE analysis. Table 13 lists the 16 functional sets that were significantly overrepresented among the normal airway transcriptome. On average there were approximately 109 probe sets per functional cluster. A variability metric was used to determine those functional sets that were most different across the 10 tissue types. Ahdehyde dehydrogenase, antigen processing and presentation, and microtubule and cytoskeletal complex were the most variable functional sets. The least variable sets included ribosomal subunits, and nuclear and protein transport. Two dimensional hierarchical clustering was also performed on each of these 16 functional sets to determine which tissues showed similar expression patterns across all the genes in each set. Among the top three most variable functional sets listed above, bronchial and nasal epithelial samples always grouped together (data not shown).
- To further examine the relationship between bronchial epithial tissues and other tissues, genes from functional groups commonly expressed in airway epithelium were selected from among the normal airway transcriptome. Genes from the mucin, dynein, microtubule, keratin, glutathione, cytochrome P450, and aldehyde dehydrogenase functional groups were selected from among the 2382 genes in the normal airway transcriptome, based on their gene annotations. Fifty-nine genes from these functional groups were present among the normal airway transcriptome and analyzed using supervised hierarchical clustering, as shown in
Figure 8 . Bronchial and nasal epithelial samples clustered together based on the expression of these 59 genes, with many being expressed at higher levels in these two tissues. Genes highly expressed in bronchial and nasal epithelium were generally evenly distributed among the five functional groups. Several dynein, cytochrome P450, and aldehyde dehydrogenase genes were expressed highly in bronchial and nasal epithelium compared to other tissues. Buccal mucosa samples clustered mainly with lung tissue, with specific keratin genes being highly expressed. While some keratins were expressed specifically in skin and esophageal epithelium, other keratins, such as KRT7, KRT8, KRT18, and KRT19 were expressed primarily in bronchial and nasal epithelium. The same pattern was seen with mucin genes, with MUC4, MUC5AC, and MUC16 being expressed primarily in bronchial and nasal epithelium, while MUC1 was expressed in other epithelial tissues. Glutathione genes were expressed highly in bronchial and nasal epithelium as well as other tissues. Microtubule expression was fairly even across all tissues. - To explore the similar expression pattern between bronchial and nasal epithelium, a metagene was created by selected a subset of the 59 functionally relevant normal transcriptome genes with highly correlated expression in between bronchial and nasal samples. All genes which were highly correlated to the metagene (R>.6, p<.001) were selected and analyzed using EASE to determine sets functionally overrepresented categories. The microtubule and cytoskeletal complex functional set was significantly enriched among the genes most highly correlated with the expression pattern of the metagene.
- A separate set of normal nasal epithelial samples run on the same microarray platform (16) was used in place of our nasal epithelial dataset to determine the reproducibility of the relationships in gene expression between bronchial and nasal epithelium. This separate nasal epithelial dataset consisted of 11 normal epithelial samples run on Affymetrix HG133A microarrays. These samples were first examined with the 92 normal tissue samples from previous analysis. A correlation matrix was created to determine the average pearson correlation of each set of samples within a tissue type with samples from other tissue types. The two nasal epithelial datasets had the highest correlation with each other, with the next highest correlation being between nasal and bronchial epithelial samples. These 11 nasal epithelial samples also clustered together with bronchial epithelial samples across the entire normal transcriptome and the subset of 59 functionally relevant genes from the transcriptome when used in place of our original 8 nasal epithelial samples.
- To examine the effect of cigarette smoke on airway epithelial cells, current and never smokers samples from buccal and nasal epithelial cell samples were analyzed together with current and never smokers from bronchial epithelial samples published previously (Spira et. al, 2004, PNAS). In total there were 82 samples across these three tissue types (57 bronch, 10 buccal, 15 nasal). To determine the relationship in the response to cigarette smoke between these three tissues, expression of 361 genes previously reported to distinguish smokers from non-smokers in bronchial epithelial cells (Spira et. al, 2004, PNAS) was examined across all 82 samples from bronchial, nasal, and buccal epithelium.
- The 361 genes as shown in Table 8 most differently expressed in the airway epithelial cells of current and never smokers were generally able to distinguish bronchial, nasal, and buccal epithelial samples based on smoking status using principal component analysis, with few exceptions among buccal mucosa samples (
Figure 3 ). This finding suggests a relationship between gene expression profiles in epithelial cells in the bronchus and upper airway epithelium in response to cigarette smoke. To further establish this connection across airway epithelial cells, gene set enrichment analysis (GSEA) was performed to determine if genes most differentially expressed in bronchial epithelium based on smoking status were overrepresented among the genes that change with smoking in both nasal and buccal epithelium. We showed that smoking-induced airway genes are significantly enriched among the genes most affected by smoking in buccal mucosa, with 101 genes composing the "leading edge subset" (p<.001). The leading edge subset consists of the genes that contribute most to the enrichment of airway genes in buccal mucosa samples.Figure 6 similarly shows that the genes differing most across the bronchial epithelium of smokers were also significantly enriched among the genes most affected by smoking in nasal epithelial cell samples, with 107 genes comprising the leading edge subset (p<.001). PCA of the leading edge genes show that they are able to separate buccal mucosa samples and nasal epithelial samples (Figure 7 ) based on smoking status, suggesting a global relationship in gene expression across airway epithelial cells in response to smoking. EASE analysis of the leading edge subsets fromfigure 5 reveals that overrepresented functional categories from these gene lists include oxidoreductase activity, metal-ion binding, and electron transport activity (see Table 13). - We recruited current and never smoker volunteers from Boston Medical Center for a buccal microarray study (n=11), nasal microarray study (n=15) and subsequent prospective buccal epithelial cell mass spectrometry validation (n=14). Current smokers in each group had smoked at least 10 cigarettes per day in the past month, with at least a cumulative 10 pack-year history. Non-smoking volunteers with significant environmental cigarette exposure and subjects with respiratory symptoms, known respiratory, nasal or oral diseases or regular use of inhaled medications were excluded. For each subject, a detailed smoking history was obtained including number of pack-years, number of packs per day, age started, and environmental tobacco exposure. Current and never smokers were matched for age, race and sex. The study was approved by the Institutional Review Board of Boston Medical Center and all subjects provided written informed consent.
- Buccal epithelial cells were collected on 25 subjects (11 for the buccal microarray study, 14 for the mass spectrometry validation) as previously reported (Spira et. al. 2004, Biotechniques). Briefly, we developed a non-invasive method for obtaining small amounts of RNA from the mouth using a concave plastic tool with serrated edges. Using gentle pressure, the serrated edge was scraped 5 times against the buccal mucosa on the inside left cheek and placed immediately into 1mL of RNALATER (Qiagen, Valencia, CA). The procedure was repeated for the inside right cheek and the cellular material was combined into one tube. After storage at room temperature for up to 24 hours, total RNA was isolated from the cell pellet using TRIZOL® reagent (Invitrogen, Carlsbad, CA) according to the manufacturer's protocol. The integrity of the RNA was confirmed on an RNA denaturing gel. Epithelial cell content was quantified by cytocentrifugation at 700 x g (Cytospin, ThermoShandon, Pittsburgh, PA) of the cell pellet and staining with a cytokeratin antibody (Signet, Dedham, MA). Using this protocol, we were able to obtain an average of 1823ng +/- 1243ng of total RNA per collection. Buccal epithelial cells were collected serially over 6 weeks in order to obtain a minimum of 8ug of RNA per subject. For the 14 subjects included in the mass spectrometry validation, a single collection was sufficient.
- Nasal epithelial cells were collected by first anesthesizing the right nare with 1cc of 1% lidocaine. A nasal.speculum (Bionix, Toledo OH) was use to spread the nare while a standard cytology brush (Cytosoft Brush, Medical Packaging Corporation, Camarillo CA) was inserted underneath the inferior nasal turbinate. The brush was rotated in place once, removed, and immediately placed in 1mL RNA Later (Qiagen, Valencia, CA). After storage at 4 degrees overnight, RNA was isolated via Qiagen RNEASY® Mini Kits per manufacturer's protocol. As above, the integrity of RNA was confirmed with an RNA denaturing gel and epithelial cell content was quantified by cytocentrifugation.
- Bronchial epithelial cells were also obtained on a subset of patients in the mass spectrometry study (N=6 of the 14) from brushings of the right mainstem during fibertoptic bronchoscopy with three endoscopic cytobrushes (Cellebrity Endoscopic Cytobrush, Boston Scientific, Boston). After removal of the brush, it was immediately placed in TRIZOL® reagent (Invitrogen), and kept at -80°C until RNA isolation was performed. RNA was extracted from the brush using the TRIZOL® reagent (Invitrogen, Carlsbad, CA) according to the manufacturer's protocol with an average yield of 8-15ug of RNA per patient. Integrity of RNA was confirmed by running an RNA-denaturing gel and epithelial cell content was quantified by cytocentrifugation and cytokeratin staining.
- Eight micrograms of total RNA from buccal epithelial cells (N=11) and nasal epithelial cells (N=15) was processed, labelled, and hybridized to Affymetrix HG-U133A GeneChips containing 22,215 probe sets as previously described (Spira et. al, 2004, PNAS). A single weighted mean expression level for each gene was derived using MICROARRAY SUITE 5.0 (MAS 5.0) software (Affymetrix, Santa Clara, CA). The MAS 5.0 software also generated a detection P value [P(detection)] using a one-sided Wilcoxon sign-ranked test, which indicated whether the transcript was reliably detected. One buccal mucosa microarray sample was excluded from further analysis based on the percentage of genes detected being lower than two standard deviations from the median percentage detected across all buccal mucosa microarray samples, leaving 10 samples for further analysis. All 15 nasal epithelial cell microarray samples contained sufficiently high percentages of genes detected based on the same criteria, and were all included for further analysis. Microarray data from 57 bronchial epithelial cell samples was obtained from previously published data (Spira et. al, 2004, PNAS).
- Microarray data from 7 additional normal human tissues was obtained from datasets in the Gene Expression Omnibus (GEO). The samples were selected from normal, non-diseased tissue, where there were at least 5 samples per tissue type. All samples were run on either Affymetrix HGU133A or HGU133 Plus 2.0 microarrays. Array data from normal tissue samples from the following 7 tissues were used (GEO accession number included): lung (GSE1650), skin (GSE5667), esophagus (GSE1420), kidney (GSE3526), bone marrow (GSE3526), heart (GSE2240), and brain (GSE5389). A detailed breakdown of the array data obtained for these tissues can be seen in Table 12.
- Microarray data from buccal mucosa, nasal epithelium, and bronchial epithelial cell samples, as well at normal tissue samples from the 8 datasets listed above were each normalized using MAS 5.0, where the mean intensity for each array (excluding the top and bottom 2% of genes) was corrected using a scaling factor to set the average target intensity of all probes on the chip to 100. For tissue samples run on the HGU133 Plus 2.0 arrays, only those probe sets in common with the HGU133A array were selected and normalized using MATLAB Student Version 7.1 (The Mathworks, Inc.), where the mean intensity of the selected probes (excluding the top and bottom 2% of genes) was corrected using a scaling factor to set the average target intensity of the remaining probes to 100.
- Clinical information, array data, and gene annotations are stored in an interactive MYSQL database coded in PERL (37). All statistical analyses described below and within the database were performed using the R v. 2.2.0 software (38). The gene annotations used for each probe set were from the December 2004 NetAffx HG-U133A annotation files.
- Principal component analysis (PCA) was performed using the Spotfire DecisionSite software package (39) on the following normal non-smoker tissue samples from 10 different tissue types: bronchial (n=23), nasal (n=8), buccal mucosa (n=5), lung (n=14), skin (n=5), esophagus (n=8), kidney (n=8), bone marrow (n=5), heart (n=5), and brain (n=11). PCA analysis was used to determine relationships in the gene expression of these tissue types across the normal airway transcriptome, which has been previously characterized (Spira et. al, 2004, PNAS).
- Functional annotation clustering was performed using the EASE software package (40) to determine overrepresented sets of functional groups ("functional sets") among the normal airway transcriptome. Each functional group within a cluster was given a p-value, determined by a Fisher-Exact test. The significance of the functional cluster was then determined by taking the geometric mean of the p-values of each functional group in the cluster. To limit the number of functional sets returned by EASE, only functional groups from the Gene Ontology (GO) database below the 5th hierarchical node were used.
- To determine the variability of the functional sets across the 10 different tissue types, the following formula was used:
-

- Where Gk is the expression of gene G across all the samples in tissue type k, i is the total number of genes in a functional cluster, and COV is the coefficient of variation (standard deviation divided by mean) of the average expression of gene G across all tissue types. This produced one variability metric (V) for each functional cluster. All the genes in each functional cluster were then analyzed using 2D hierarchical clustering performed by using log-transformed z-score normalized data with a Pearson correlation (uncentered) similarity metric and average linkage clustering with CLUSTER and TREEVIEW software (41).
- To further analyze the relationship between airway epithelium and other tissue types, genes from the normal airway transcriptome included in functional categories commonly expressed in airway epithelial cells were examined. The functional categories explored were mucin, dynein, microtubule, cytochrome p450, glutathione, aldehyde dehydrogenase, and keratin. Genes from these categories were determined by selecting all those genes from the normal airway transcriptome that were also included in any of these functional groups based on their gene annotation. Fifty-nine genes from the normal airway transcriptome which also spanned the functional categories of interest were further analyzed across the 10 tissues types using supervised hierarchical clustering.
- To assess whether genes outside of the normal airway transcriptome were expressed at similar levels in bronchial and nasal epithelium, we created a metagene by taking a subset of the 59 genes from the normal airway transcriptome spanning the specified functional categories which were highly expressed in bronchial and nasal epithelial samples, based on the Pearson correlation similarity metric for these genes. A correlation matrix was then generated between the average expression of the metagene across all 10 tissues and each probe set on the HGU133A array (22215 total probe sets) across all 10 tissues, to determine genes with a similar expression pattern to bronchial and nasal epithelium (a detailed protocol for this analysis can be found in the supplement).
- A second nasal epithelial dataset (Wright et. al, 2006, Am J Respir Cell Mol Biol.) was included for further analysis to determine the reproducibility of the expression patterns observed in nasal epithelium compared to other tissues. In all there were 11 nasal epithelial samples from this second dataset (GSE2395) which were used in place of our original 8 nasal samples to determine the reproducibility of gene expression patterns and relationships between nasal epithelium and other tissues.
- To determine the relationship in the response to cigarette smoke by bronchial, buccal, and nasal epithelial cells, PCA was performed across 82 smoker and non-smoker samples (57 bronchial, 10 buccal, 15 nasal) using 361 genes differentially expressed between smokers and non-smokers in bronchial epithelial cells (p<.001), as determined from a prior study (Spira et. al, 2004, PNAS). Gene set enrichment analysis (GSEA) (42) was then used to further establish a global relationship between gene expression profiles from these three tissue types in response to cigarette smoke. Our goal was to determine if the genes most differentially expressed with smoking in bronchial epithelial cells were significantly enriched among the top smoking-induced buccal and nasal epithelial genes based on signal-to-noise ratios. P-values were generated in GSEA by permuting ranked gene labels and generating empirical p-values to determine significant enrichment. The airway genes most significantly enriched among ranked lists of nasal epithelial and buccal mucosa samples (leading edge subsets), were further analyzed using PCA to determine the ability of the leading edge subsets to distinguish samples in the nasal and buccal epithelial datasets based on smoking status.
-
Table 11 below shows Patient demographic data. Demographic data for patient samples used for microarray analysis (n=10) and mass spectrometry analysis (n=14). * P-values calculated by Fisher Extact test Buccal Microarray (N=10) Nasal Microarray (N=15) MS Validation (N=14) Smoke rs Never P-Value Smoke rs Never P-Value Smoker s Never P-Value Sex 1M, 4F 2M, 3F (p=0.42* ) 6M, 1F 5 M, 2F, 1 U (P=.58) 6 M, 1 F 4 M, 3 F ( p=.24") Age 36 (+/-8) 31 (+/-9) (p=0.36) 47 +/-12 43 +/- 18 59 (+/-15) 41 (+/-17) ( p=0.06) Race 3 CAU, 2 AFA 2 CAU, 3 AFA (p=0.40* ) 3 CAU, 3 AFA, 1 HIS 5 CAU, 2 AFA, 1 HIS 5 CAU, 2 AFA 4 CAU, 3AFA ( p=.37*) -
Table 12 below shows breakdown of all microarray datasets analyzed in this study. Category Tissue # Samples Platform GEO reference Sample Description epithelial Mouth 5 U133A n/a 5 never smokers epithelial Bronch 23 U133A GSE994 23 never smokers epithelial Nose 8 U133A n/a 8 never smokers epithelial Nose 11 U133A GSE2395 normal nasal epithelium, from cystic fibrosis study epithelial Lung 14 U133A GSE1650 from COPD study, no/mild emphezyma patients epithelial Skin 5 U133A GSE5667 normal skin tissue Epithelial Esophagus 8 U133A GSE1420 normal esophageal epithelium mostly epithelial Kidney 8 U133+2.0 GSE3526 4 kidney cortex, 4 kidney medulla (post-mortem) non epithelial Bone marrow 5 U133+2.0 GSE3526 5 bone marrow (post-mortem) non epithelial Heart 5 U133A GSE2240 left ventricular myocardium, non-failing non epithelial Brain 11 U133A GSE5389 postmortem orbitofrontal cortex -
Table 13 below shows Significantly overrepresented "functional sets" among the normal airway transcriptome. Sixteen functional sets significantly overrepresented among the normal airway transcriptome, ranked by the variability of each cluster across 10 tissue types. Functional Category Average COV P-value Aldehyde Dehydrogenase 108.7083218 0.052807847 Antigen processing and presentation 83.83536768 0.003259035 Microtubule and Cytoskeletal complex 74.77767675 0.018526945 Carbohydrate and Alcohol catabolism/metabolism 67.69528886 0.025158044 Oxidative phosphorylation, protein/ion transport, metabolism 66.99814067 4.53E-07 ATPase Activity 62.97844577 7.96E-08 Apoptosis 61.75272195 0.005467272 Mitochondrial components and activity 61.34998026 3.65E-09 NADH Dehydrogenase 58.28368171 4.77E-11 Regulation of protein synthesis and metabolism 55.93424773 0.002257705 NF-kB 55.70796256 0.011130609 Protein/macromolecule catabolism 55.62842326 6.74E-05 Intracellular and protein transport 53.51411018 8.10E-09 Protein/Macromolecule Biosynthesis 52.28818306 1.62E-25 Vesicular Transport 49.6560062 0.019136042 Nuclear Transport 44.88736037 0.003807797 Ribosomal Subunits 42.57469554 5.42E-15 -
Table 14 below shows Common overrepresented functional categories among "leading edge subsets" from GSEA analysis. Common EASE molecular functions of leading edge genes from GSEA analysis. P-values were calculated using EASE software. Molecular Function P-value (calculated in EASE) Oxidoreductase activity p < 1.36 x 10⁻⁶ Electron transporter activity p < 4.67 x 10⁻⁵ Metal ion binding p < .02 Monooxygenase activity p < .02 - All references cited herein and throughout the specification are herein incorporated by reference in their entirety.
- 1. WHO: The Facts About Smoking and Health, 30 May 2006 [http://www.wpro.who.int/media_centre/fact_sheets/fs_20060530.htm]
- . Shields, P. G.: Molecular Epidemiology of lung cancer. Ann. Oncol, 1999, Suppl. 5:7-11.
- 2. Franklin WA, Gazdar AF, Haney J, Wistuba II, LaRosa FG, Kennedy T, Ritchey DM, and Miller YE.: Widely Dispersed p53 mutation in respiratory epithelium. A Novel mechanism for field carcinogenesis. Journal of Clinical Investigation, 1997, 100:2133-2137.
- 3. Wistuba II, Lam S, Behrens C, Virmani AK, Fong KM, LeRiche J, Samet JM, Srivastava S, Minna JD, and Gazdar AF: Molecular damage in the bronchial epithelium of current and former smokers. Journal of the National Cancer Institute, 1997, 89:1366-1373.
- 4. Powell CA, Klares S, O'Connor G, Brody JS: Loss of Heterozygosity in Epithelial Cells Obtained by Bronchial Brushing: Clinical Utility in Lung Cancer. Clinical Cancer Research, 1999, 5: 2025-2034.
- 5. Thiberville L, Payne P, Vielkinds J, LeRiche J, Horsman D, Nouvet G, Palcic B, Lam S: Evidence of cumulative gene losses with progression of premalignant epithelial lesions to carcinoma of the bronchus. Cancer Res, 1995, 55: 5133-9.
- 6. Spira AS, Beane J, Shah V, Schembri F, Yang X, Palma J and Brody JS: Effects of cigarette smoke on the human airway epithelial transcriptome. PNAS, 2004, 101:10143-10148.
- 7. Phillips DE, Hill L, Weller M, Willett M, and Bakewell R. R Tobacco smoke and the upper airway. Clin. Otoloaryngol. 2003, 28, 492-496.
- 8. 7.5 Immunophenotype of the Nasal Mucosa in Sarcoidosis, [Publication Page: A795]
- 9. D.M. Serlin, MD, X.F. Li, PhD, J. Spiegel, MD, K. Steiling, MD, C.J. O'Hara, MD, A. Spira, MD, A.W. O'Regan, MD, J.S. Berman, MD, Boston, MA, Galway, Ireland. Abrstact, ATS 2006
- 10. Spira A, Beane J, Schembri F, Liu G, Ding C, Gilman S, Yang X, Cantor C and Brody JS: Noninvasive method for obtaining RNA from buccal mucosa epithelial cells for gene expression profiling. Biotechniques, 2004, 36:484-497.
- 11. Kharchenko SV, Shpakov AA: Regulation of the RNase activity of saliva in healthy subjects and in stomach cancer. Inz Akad Nauk SSSR Biol, 1989, 1:58-63.
- 12. Ceder O, van Dijken J, Ericson T, Kollberg J: Ribonuclease in different types of saliva from cystic fibrosis patients. Acta Paediatr. Scand, 1985, 74:102-104.
- 13. Spivak S, Hurteau G, Jain R, Kumar S, Aldous K, Gierthy J, Kaminsky LS: Gene-Environment Interaction Signatures by Quantitative mRNA Profiling of Exfoliated Buccal Mucosal Cells. Cancer Research, 2004, 64:6805-6813.
- 14. Guajardo JR, Schleifer KW, Daines MO, Ruddy RM, Aronow BJ, Wills-Karp M, Hershey GK, Altered gene expression profiles in nasal respiratory epithelium reflext stable versus acute childhood asthma. J Allergy Clin Immunol. 2005,
- 15. Wright JM, Merlo CA, Reynolds JB, Zeitlin PL, Garcia JN, Guggino WB, Boyle MP. Respiratory epithelial gene expression in patients with mild and severe cystic fibrosis lung disease. Am. J. Resp. Cell Biology, 2006, 35: 327-336.
- 16. Wright JM, Merlo CA, Reynolds JB, Zeitlin PL, Garcia JGN, Guggino WB, Boyle MP. Respiratory Epithelial Gene Expression in Patients with Mild and Severe Cystic Fibrosis Lung Disease. Am J Respir Cell Mol Biol, 2006, 35(3):327-336.
- 17. Slaughter DP, Southwick HW, Smejkal W: Field cancerization in oral stratified squamous epithelium; clinical implications of multicentric origin. Cancer, 1953, 6:963-968.
- 18. Wistuba I, Lam S, Behrens C, Virmani A, Fong KW, LeRiche J, Samet J, Srivastava S, Minna J, Gazdar A. Molecular damage in the bronchial epithelium of current and former smokers. JNCI. 89: 18. 1366-1373.
- 19. Partridge M, Emilion G, Pateromichelakis S, Phillips E, Langdon J: Field cancerisation of the oral cavity: Comparison of the spectrum of molecular alterations in cases presenting with both dysplastic and malignant lesions. Oral Oncol, 1997, 33:332-337.
- 20. Bosatra A, Bussani R, Silvestri F: From epithelial dysplasia to squamous carcinoma in the head and neck region: an epidemiological assessment. Acta Otolaryngol Suppl, 1997, 527:49-51.
- 21. Sudbo J, Kildal W, Risberg B, Koppang HS, Danielsen HE, Reith A: DNA content as a prognostic marker in patients with oral leukoplakia. N Engl J Med, 2001, 344(17):1270-1278.
- 22. Demedts IK, Demoor T, Bracke KR, Joos GF, Brusselle GG: Role of apoptosis in the pathogenesis of COPD and pulmonary emphysema. Respir Res., 2006, 7:53.
- 23. Loro LL, Johannessen AC, Vintermyr OK: Decreased expression of bcl-2 in moderate and severe oral epithelia dysplasias. Oral Oncol., 2002, 38(7):691-698.
- 24. Yang SR, Chida AS, Bauter MR, Shafiq N, Seweryniak K, Maggirwar SB, Kilty I, Rahman I: Cigarette smoke induces proinflammatory cytokine release by activation of NF-kappaB and posttranslational modifications of histone deacetylase in macrophages. Am J Physiol Lung Cell Mol Physiol., 2006, 291(1):L46-57.
- 25. Sasaki H, Moriyama S, Nakashima Y, Kobayashi Y, Kiriyama M, Fukai I, Yamakawa Y, Fujii Y: Histone deacetylase 1 mRNA expression in lung cancer. Lung Cancer, 2004, 46(2):171-178.
- 26. Balciunaite E, Spektor A, Lents NH, Cam H, Te Riele H, Scime A, Rudnicki MA, Young R, Dynlacht BD: Pocket protein complexes are recruited to distinct targets in quiescent and proliferating cells. Mol Cell Biol, 2005, 25(18):8166-8178.
- 27. Soni S, Kaur J, Kumar A, Chakravarti N, Mathur M, Bahadur S, Shukla NK, Deo SV, Ralhan R: Alterations of rb pathway components are frequent events in patients with oral epithelial dysplasia and predict clinical outcome in patients with squamous cell carcinoma. Oncology, 2005, 68(4-6):314-325.
- 28. Xue Jun H, Gemma A, Hosoya Y, Matsuda K, Nara M, Hosomi Y, Okano T, Kurimoto F, Seike M, Takenaka K, Yoshimura A, Toyota M, Kudoh S. Reduced transcription of the RB2/p130 gene in human lung cancer. Mol Carcinog, 2003, 38(3):124-129.
- 29. Mishina T, Dosaka-Akita H, Hommura F, Nishi M, Kojima T, Ogura S, Shimizu M, Katoh H, Kawakami Y: Cyclin E expression, a potential prognostic marker for non-small cell lung cancers. Clin Cancer Res, 2000, 6(1):11-16.
- 30. Shintani S, Mihara M, Nakahara Y, Kiyota A, Ueyama Y, Matsumura T, Wong DT. Expression of cell cycle control proteins in normal epithelium, premalignant and malignant lesions of oral cavity. Oral Oncol, 2002, 38(3):235-243.
- 31. Kim JH, Sherman ME, Curriero FC, Guengerich FP, Strickland PT, Sutter TR: Expression of cytochromes P450 1A1 and 1B1 in human lung from smokers, non-smokers, and ex-smokers. Toxicol Appl Pharmacol, 2004, 299:210-219
- 32. Rusznak C, Mills P, Devalia J, Sapsford R, Davies R Lozewicz S: Effect of cigarette smoke on the permeability and IL-1beta and sICAM-1 release from cultured human bronchial epithelial cells of never-smokers, smokers, and patients with chronic obstructive pulmonary disease. American Journal of Respiratory and Molecular Cell Biology, 2000, 23:530-536.
- 33. Katsuragi H, Hasegawa A, Saito K: Distribution of metallothionein in cigarette smokers and nonsmokers in advanced periodontitis patients. Journal of Periodontology, 1997, 68(10):1005-9
- 34. Cardosa SV, Barbosa HM, Candellori IM, Loyola AM, Aguiar MC: Prognostic impact of metallothionein on oral squamous cell cancer. Virchows Archive, 2002, 441 (2):174-178.
- 35. Li Y, Maie A, Zhou X, Kim Y, Sinha U, Jordan R, Eisele D, Abemayor E, Elashoff D, Park N, Wong D: Salivary Transcriptome Diagnostics for Oral Cancer Detection. Clinical Cancer Research, 2004, 10:8442-8450.
- 36. Li Y, Zhou X, St. John MAR, Wong DTW: RNA profiling of cell-free saliva using microarray technology. J Dent Res, 2004, 83(3):199-203.
- 37. The Mouth Database at the World Wide Web address pulm.bumc.bu.edu/MouthDB/index.
- 38. The R-project for Statistical Computing at the World Wide Web address r-project.org.
- 39. Spotfire at the World Wide Web address spotfire.com.
- 40. EASE at the World Wide Web address david.abcc.ncifcrf.gov/tools.jsp.
- 41. CLUSTER, TREVIEW at the World Wide Web address rana.lbl.gov/EisenSoftware.
- 43. Subramanian A, Tamayo P, Mootha VK, Mukherjee S, Ebert BL, Gillette MA, Paulovich A, Pomeroy SL, Golub TR, Lander ES, Mesirov JP: Gene set enrichment analysis: A knowledge-based approach for interpreting genome-wide expression profiles. PNAS, 2005, 102(43):15545-15550.
- 44. Ding, C, Cantor, CR: A high-throughput gene expression analysis technique using competitive PCR and matrix-assisted laser desorption ionization time-of-flight MS. PNAS, 2003, 100(6):3059-3064.
- 45. Vandesompele J, De Preter K, Pattyn F, Poppe B, Van Roy N, De Paepe A, Speleman F: Accurate normalization of real-time quantitative RT-PCR data by geometric averaging of multiple internal control genes. Genome Biol, 2002, 3(7).
Claims (16)
- A method of diagnosing lung cancer in an individual comprising the steps of:a) measuring a biological sample comprising nasal epithelial tissue from the individual for the expression of at least 20 gene transcripts from Table 6;b) comparing the expression of the at least 20 gene transcripts to a control sample of those transcripts from individuals without cancer,
wherein increased expression of the gene transcripts as indicated by a negative score in the last column of Table 6 and/or decreased expression of the gene transcripts as indicated by a positive score in the last column of Table 6 is indicative of the individual having lung cancer. - The method of claim 1, wherein: a) at least 40 gene transcripts are measured; or b)
wherein at least 60 gene transcripts are measured. - The method of claim 1, wherein: a) at least 70 gene transcripts are measured; or b)
the gene transcript measured is set forth in Table 5; or c) the gene transcript measured is set forth in Table 7. - The method of claim 1, wherein the gene transcript measured is set forth in Table 1 wherein the measurement of the gene transcript relative to the control uses the third column of Table 1 setting forth direction of expression in lung cancer to determine if the individual has lung cancer.
- The method of claim 4, wherein: a) the transcript measured is at least Table 3; or b) the transcript used is at least the transcripts set forth in Table 4.
- A method of diagnosing a lung disease in an individual exposed to air pollutant comprising the steps ofa) measuring expression profile of a gene group in a nasal epithelial sample from a test individual; andb) comparing the expression profile of the test individual to an expression profile of a first control individual exposed to similar air pollutant who does not have the lung disease and the expression profile of a second control individual exposed to similar air pollutants who has the lung disease,
wherein similarity of the expression profile of the test individual with the expression profile of the first control rather than that of the second control is indicative of the test individual being not affected with the lung disease and wherein similarity of the expression profile of the test individual with the expression profile of the second control individual rather than that of the first control individual is indicative of the test individual being affected or at high risk of developing the lung disease. - The method of claim 4, wherein the gene group comprises at least 30, sequences of genes selected from the group consisting with GenBank identification Nos. NM_003335; NM_000918; NM_006430.1; NM_001416.1; NM_004090; NM_006406.1; NM_003001.2; NM_001319; NM_006545.1; NM_021145.1; NM_002437.1; NM_006286; NM_001003698 /// NM_001003699 /// NM_002955; NM_001123 /// NM_006721; NM_024824; NM_004935.1; NM_002853.1; NM_019067.1; NM_024917.1; NM_020979.1; NM_005597.1; NM_007031.1; NM_009590.1; NM_020217.1; NM_025026.1; NM_014709.1; NM_014896.1; AF010144; NM_005374.1; NM_001696; NM_005494 /// NM_058246; NM_006534 /// NM_181659; NM_006368; NM_002268 /// NM_032771; NM_014033; NM_016138; NM_007048 /// NM_194441; NM_006694; NM_000051 /// NM_138292 /// NM_138293; NM_000410 /// NM_139002 /// NM_139003 /// NM_139004 /// NM_139005 /// NM_139006 /// NM_139007 /// NM_139008 /// NM_139009 /// NM_139010 /// NM_139011; NM_004691; NM_012070 /// NM_139321 /// NM_139322; NM_006095; AI632181; AW024467; NM_021814; NM_005547.1; NM_203458; MM_015547 /// NM_147161; AB007958.1; NM_207488; NM_005809 /// NM_181737 /// NM_181738; NM_016248 /// NM_144490; AK022213.1; NM_005708; NM_207102; AK023895; NM_144606 /// NM_144997; NM_018530; AK021474; U43604.1; AU147017; AF222691.1; NM 015116; NM_001005375 /// NM_001005785 /// NM_001005786 /// NM_004081 /// NM_020363 /// NM_020364 /// NM_020420; AC004692; NM_001014; NM_000585 /// NM_172174 /// NM_172175; NM_054020 /// NM_172095 /// NM_172096 /// NM_172097; BE466926; NM_018011; NM_024077; NM_012394; NM_019011 /// NM_207111 /// NM_207116; NM_017646; NM_021800; NM_016049; NM_014395; NM_014336; NM_018097; NM_019014; NM_024804; NM_018260; NM_018118; NM_014128; NM_024084; NM_005294; AF077053; NM_138387; NM_024531; NM_000693; NM_018509; NM_033128; NM_020706; AI523613; and NM_014884.
- The method of claim 1, wherein the gene group comprises sequences of genes selected from: a) the group consisting of genes with GenBank identification Nos. NM_007062.1; NM_001281.1; BC000124.1; NM_014255.1; BC002642.1; NM_000346.1; NM_006545.1; BG034328; NM_021822.1; NM_021069.1; NM_019067.1; NM_017925.1; NM_017932.1; NM_030757.1; NM_030972.1; AF126181.1; U93240.1; U90552.1; AF151056.1; U85430.1; U51007.1; BC005969.1; NM_002271.1; AL566172; AB014576.1; BF218804; AK022494.1; AA114843; BE467941; NM_003541.1; R83000; AL161952.1; AK023843.1; AK021571.1; AK023783.1; AU147182; AL080112.1; AW971983; AI683552; NM_024006.1; AK026565.1; NM_014182.1; NM_021800.1; NM_016049.1; NM_019023.1; NM_021971.1; NM_014128.1; AK025651.1; AA133341; and AF198444.1; or b)
the group consisting of genes with GenBank identification Nos. NM_007062.1; NM_001281.1 ; BC002642.1; NM_000346.1; NM_006545.1; BG034328; NM_019067.1; NM_017925.1; NM_017932.1; NM_030757.1; NM_030972.1; NM_002268 /// NM_032771; NM_007048 /// NM_194441; NM_006694; U8S430.1; NM_004691; AB014576.1; BF218804; BE467941; R83000; AL161952.1; AK023843.1; AK021571.1; AK023783.1; AL080112.1; AW971983; AI683552; NM_024006.1; AK026565.1; NM_014182.1; NM_021800.1; NM_016049.1; NM_021971.1; NM_014128.1; AA133341; and AF198444.1 - The method of claim 1, wherein the group comprises sequences of genes selected from: a) the group consisting of genes with GenBank or Unigene identification Nos. NM_030757.1; R83000; AK021571.1; NM_014182.1, NM_17932.1; U85430.1; AI683552; BC002642.1; AW024467; NM_030972.1; BC021135.1; AL161952.1; AK026565.1; AK023783.1; BF218804; NM_001281.1; NM_024006.1; AK023843.1; BC001602.1; BC034707.1; BC064619.1; AY280502.1; BC059387.1; AF135421.1; BC061522.1; L76200.1; U50532.1; BC006547.2; BC008797.2; BC000807.1; AL080112.1; BC033718.1 /// BC046176.1 /// BC038443.1; NM_000346.1; BC008710.1; Hs.288575 (UNIGENE ID); AF020S91.1; BC000423.2; BC002503.2; BC008710.1; BC009185.2; Hs.528304 (UNIGENE ID); U50532.1; BC013923.2; BC031091; NM_007062; Hs.249591 (Unigene ID); BC075839.1 /// BC073760.1; BC072436.1 /// BC004560.2; BC001016.2; Hs.286261 (Unigene ID); AF348514.1; BC005023.1; BC066337.1 /// BC058736.1 /// BC050555.1; Hs.216623 (Unigene ID); BC072400.1; BC041073.1; U43965.1; BC021258.2; BC016057.1; BC016713.1 /// BC014535.1 /// AF237771.1; BC000360.2; BC007455.2; BC000701.2; BC010067.2; BC023528.2 /// BC047680.1; BC064957.1; Hs.156701 (Unigene ID); BC030619.2; BC008710.1; U43965.1; BC066329.1; Hs.438867 (Unigene ID); BC035025.2 /// BC050330.1; BC023976.2; BC074852.2 /// BC074851.2; Hs.445885 (Unigene ID); BC008591.2 /// BC050440.1 ///; BC048096.1; AF36S931.1; AF257099.1; and BC028912.1; or b)
the group consisting of genes with GenBank or Unigene identification Nos: NM_003335; NM_001319; NM_021145.1; NM_001003698 /// NM_001003699 ///; NM_002955; NM_002853.1; NM_019067.1; NM_024917.1; NM_020979.1; NM_005597.1; NM_007031.1; NM_009590.1; NM_020217.1; NM_025026.1; NM 014709.1; NM_014896.1; AF010144; NM_005374.1; NM_006534 /// NM_181659; NM_014033; NM_016138; NM_007048 /// NM_194441; NM_000051 /// NM_138292 /// NM_138293; NM_000410 /// NM_139002 /// NM_139003 /// NM_139004 /// NM_139005 /// NM_139006 /// NM_139007 /// NM_139008 /// NM_139009 /// NM_139010 /// NM_139011; NM_012070 /// NM_139321 /// NM_139322; NM_006095; AI632181; AW024467; NM_021814; NM_005547.1; NM_203458; NM_015547 /// NM_147161; AB007958.1; NM_207488; NM_005809 /// NM_181737 /// NM_181738; NM_016248 /// NM_144490; AK022213.1; NM_005708; NM_207102; AK023895; NM_144606 /// NM_144997; NM_018530; AK021474; U43604.1; AU147017; AF222691.1; NM_015116; NM_001005375 /// NM_001005785 /// NM_001005786 /// NM_004081 /// NM_020363 /// NM_020364 /// NM_020420; AC004692; NM_001014; NM_000585 /// NM_172174 /// NM_172175; NM_054020 /// NM_172095 /// NM_172096 /// NM_172097; BE466926; NM_018011; NM_024077; NM_019011 /// NM_207111 /// NM_207116; NM_017646; NM_014395; NM_014336; NM_018097; NM_019014; NM_024804; NM_018260; NM_018118; NM_014128; NM_024084; NM_005294; AF077053; NM_000693; NM_033128; NM_020706; AI523613; and NM_014884, and wherein decrease in expression of at least 5 of these genes is indicative of the individual being affected with a lung disease; or c) the
group consisting of genes with GenBank or Unigene identification Nos NM_030757.1; R83000; AK021571.1; NM_17932.1; U85430.1; AI683552; BC002642.1; AW024467; NM_030972.1; BC021135.1; AL161952.1; AK026565.1; AK023783.1; BF218804; AK023843.1; BC001602.1; BC034707.1; BC064619.1; AY280502.1; BC059387.1; BC061522.1; U50532.1; BC006547.2; BC008797.2; BC000807.1; AL080112.1; BC033718.1 /// BC046176.1 ///; BC038443.1; Hs.288575 (UNIGENE ID); AF020591.1; BC002503.2; BC009185.2; Hs.528304 (UNIGENE ID); U50532.1; BC013923.2; BC031091; Hs.249591 (Unigene ID); Hs.286261 (Unigene ID); AF348514.1; BC066337.1 ///BC058736.1 ///BC050555.1; Hs.216623 (Unigene ID); BC072400.1; BC041073.1; U43965.1; BC021258.2; BC016057.1; BC016713.1 /// BC014535.1 /// AF237771.1; BC000701.2; BC010067.2; Hs.156701 (Unigene ID); BC030619.2; U43965.1; Hs.438867 (Unigene ID); BC035025.2 /// BC050330.1; BC074852.2 /// BC074851.2; Hs.445885 (Unigene ID); AF365931.1; and AF257099.1, and wherein decrease in expression of at least 5 of these genes is indicative of the individual being affected with a lung disease; or d)
the group consisting of genes with GenBank or Unigene identification Nos BF218804; AK022494.1; AA114843; BE467941; NM_003541.1; R83000; AL161952.1; AK023843.1; AK021571.1; AK023783.1; AU147182; AL080112.1; AW971983; AI683552; NM_024006.1; AK026565.1; NM_014182.1; NM_021800.1; NM_016049.1; NM_019023.1; NM_021971.1; NM_014128.1;
AK025651.1; AA133341; and AF198444.1, and wherein decrease in expression of at least 5 of these genes is indicative of the individual being affected with a lung disease; e)
the group consisting of genes with GenBank or Unigene identification Nos NM_000918; NM_006430.1; NM_001416.1; NM_004090; NM_006406.1; NM_003001.2; NM_006545.1; NM_002437.1; NM_006286; NM_001123 /// NM_006721; NM_024824; NM_004935.1; NM_001696; NM_005494 /// NM_058246; NM_006368; NM_002268 lll NM_032771; NM_006694; NM_004691; NM_012394; NM_021800; NM_016049; NM_138387; NM_024531; and NM_018509, and wherein increase in expression of at least 5 of these genes is indicative of the individual being affected with a lung disease; or f)
the group consisting of genes with GenBank or Unigene identification Nos NM_014182.1; NM_001281.1; NM_024006.1; AF135421.1; L76200.1; NM_000346.1; BC008710.1; BC000423.2; BC008710.1; NM_007062; BC075839.1 /// BC073760. 1; BC072436.1 /// BC004560.2; BC001016.2; BC005023.1; BC000360.2; BC007455.2; BC023528.2 /// BC047680.1; BC064957.1; BC008710.1; BC066329.1; BC023976.2; BC008591.2 /// BC050440.1 /// BC048096.1; and BC028912.1, and wherein increase in expression of at least 5 of these genes is indicative of the individual being affected with a lung disease. - The method of claims 3 or 4 wherein the group comprises sequences of genes selected from the group consisting of genes with GenBank or Unigene identification Nos NM_007062.1; NM_001281.1: BC000120.1; NM_014255.1; BC002642.1; NM_000346.1; NM_006545.1; BG034328; NM_021822.1; NM_021069.1; NM_019067.1; NM_017925.1; NM_017932.1; NM_030757.I; NM_030972.1; AF126181.1; U93240.1; U90S52.1; AF151056.1; U85430.1; U51007.1; BC005969.1; NM_002271.1; AL566172; and AB014576.1. and wherein increase in expression of at least 5 of these genes is indicative of the individual being affected with a lung disease.
- The method of claim 1, wherein the group comprises 5-9 sequences of genes selected from group 1 and group 2, group 1 consisting of genes with GenBank or Unigene identification Nos. NM_003335; MM_001319; NM_021145.1; NM_001003698 /// NM_001003699 ///; NM_002955; NM_M2853.1; NM_019067.1; NM_024917.1; NM_020979.1; NM_005597.1; NM_007031.1; NM_009590.1; NM_020217.1; NM_025026.1; NM_014709.1; NM_014896.1; AF010144; NM_005374.1; NM_006534 /// NM_181659; NM_014033; NM_016138; NM_007048 /// NM_194441; NM_000051 /// NM_138292 /// NM_138293; NM_000410 /// NM_139002 /// NM_139003 /// NM_139004 /// NM_139005 /// NM_139006 /// NM_139007 /// NM_139008 /// NM_139009 /// NM_139010 /// NM_139011; NM_012070 /// NM_139321 /// NM_139322; NM_006095; AI632181; AW024467; NM_021814; NM_005547.1; NM_203458; NM_015547 /// NM_147161; AB007958.1; NM_207488; NM_005809 /// NM_181737 /// NM_181738; NM_016248 /// NM_144490; AK022213.1; NM_005708; NM_207102; AK023895; NM_144606/11 NM_144997; NM_018530; AK021474; U43604.1; AU147017; AF222691.1; NM_015116; NM_001005375 /// NM_001005785 /// NM_001005786 /// NM_004081 /// NM_020363 /// NM_020364 /// NM_020420; AC004692; NM_001014; NM_000585 /// NM_172174 lll NM_172175; NM_054020 /// NM_172095 /// NM_172096 /// NM_172097; BE466926; NM_018011; NM_024077; NM_019011 /// NM_207111 /// NM_207116; NM_017646; NM_014395; NM_014336; NM_018097; NM_019014; NM_024804; NM_018260; NM_018118; NM_014128; NM_024084; NM_005294; AF077053; NM_000693; NM_033128; NM_020706; AI523613; and NM_014884, and group 2 consisting of genes with GenBank or Unigene identification Nos. NM_000918; NM_006430.1; NM_001416.1; NM_004090; NM_006406.1; NM_003001.2; NM_006545.1; NM_002437.1; NM_006286; NM_001123 /// NM 00672I; NM_024824; NM_004935.1; NM_001696; NM_005494///NM_058246; NM_006368; NM_002268 /// NM_032771; NM_006694; NM_004691; NM_012394; NM_021800; NM_016049; NM_138387; NM_024531; and NM_018509, and a group of at least 20 genes selected from group 3 and group 4, group 3 consisting of genes with GenBank or Unigene identification Nos BF218804; AK022494.1; AA114843; BE467941; NM_003541.1; R83000; AL161952.1; AK023843.1; AK021571.1; AK023783.1; AU147182; AL080112.1; AW971983; AI683552; NM_024006.1; AK026565.1; NM_014182.1; NM_021800.1; NM_016049.1; NM_019023.1; NM_021971.1; NM_014128.1; AK025651.1; AA133341; and AF198444.1 and group 4 consisting of genes with GenBank or Unigene identification Nos. NM_007062.1; NM_001281.1; BC000120.1; NM_014255.1; BC002642.1; NM_000346.1; NM_006545.1; BG034328; NM_021822.1; NM_021069.1; NM_019067.1; NM_017925.1; NM_017932.1; NM_030757.1; NM_030972.1; AF126181.1; U93240.1; U90552.1; AF151056.1; U85430.1; U51007.1; BC005969.1; NM_002271.1; AL566172; and AB014576.1.
- The method of claim 10, wherein decrease in the expression of any one of the group 1 genes and increase in the expression of any one of the group 2 genes, and decrease of the group 3 genes and increase of the group 4 genes is indicative of the individual being affected with a lung disease.
- The method of claim 1, wherein the group comprises 5-9 sequences of genes selected from group 5 and group 6, group 5 consisting of genes with GenBank or Unigene identification Nos. NM_030757.1; R83000; AK021571.1; NM_17932.1; U85430.1; AI683552; BC002642.1; AW024467; NM_030972.1; BC021135.1; AL161952.1; AK026565.1; AK023783.1; BF218804; AK023843.1; BC001602.1; BC034707.1; BC064619.1; AY280502.1; BC059387.1; BC061522.1; U50532.1; BC006547.2; BC008797.2; BC000807.1; AL080112.1; BC033718.1 /// BC046176.1 ///; BC038443.1; Hs.288575 (UNIGENE ID); A020591.1; BC002503.2; BC009185.2; Hs.528304 (UNIGENE ID); U50532.1; BC013923.2; BC031091; Hs.249591 (Unigene ID); Hs.286261 (Unigene ID); AF348514.1; BC066337.1 /// BC058736.1 /// BC050555.1; Hs.216623 (Unigene ID); BC072400.1; BC041073.1; U43965.1; BC021258.2; BC016057.1; BC016713.1 /// BC014535.1 /// AF237771.1; BC000701.2; BC010067.2; Hs.156701 (Unigene ID); BC030619.2; U43965.1; Hs.438867 (Unigene ID); BC035025.2 /// BC050330.1; BC074852.2 /// BC074851.2; Hs.445885 (Unigene ID); AF365931.1; and AF257099.1, and group 6 consisting of genes with GenBank or Unigene identification Nos. NM_014182.1; NM_001281.1; NM_024006.1; AF135421.1; L76200.1; NM_000346.1; BC008710.1; BC000423.2; BC008710.1; NM_007062; BC075839.1 /// BC073760.1; BC072436.1 /// BC004560.2; BC001016.2; BC005023.1; BC000360.2; BC007455.2; BC023528.2 /// BC047680.1; BC064957.1; BC008710.1; BC066329.1; BC023976.2; BC008591.2 /// BC050440.1 ///; BC048096.1; and BC028912.1, and a group of at least 20 genes selected from group 3 and group 4, group 3 consisting of genes with GenBank or Unigene identification Nos BF218804; AK022494.1; AA114843; BE467941; NM_003541.1; R83000; AL161952.1; AK023843.1; AK021571.1; AK023783.1; AU147182; AL080112.1; AW971983; AI683552; NM_024006.1; AK026565.1; NM_014182.1; NM_021800.1; NM_016049.i; NM_019023.1; NM_021971.1; NM_014128.1; AK025651.1; AA133341; and AF198444.1 and group 4 consisting of genes with GenBank or Unigene identification Nos. NM_007062.1; NM_001281.1; BC000120.1; NM_014255.1; BC002642.1; NM_000346.1; NM_006545.1; BG034328; NM_021822.1; NM_021069.1; NM_019067.1; NM_017925.1; NM_017932.1; NM_030757.1; NM_030972.1; AF126181.1; U93240.1; U90552.1; AF151056.1; U85430.1; U51007.1; BC005969.1; NM_002271.1; AL566172; and AB014576.1, wherein decrease in the expression of the group 5 genes and increase in the expression of the group 6 genes, and decrease the group 3 genes and increase of the group 4 genes is indicative of the individual being affected with a lung disease.
- The method of claim 1, wherein :a) the transcripts are selected from the group consisting of transcripts encoding CYP1B1; AKR1B10; CYP1B1; CYP1A1; CYP1B1; CEACAM5; ALDH3A1; SLC7A11; AKR1C2; NQO1; NQO1; GPX2; MUC5AC; AKR1C2; MUC5AC; AKR1C1; CLDN10; AKR1C3; NQO1; SLC7A11; HGD /// LOC642252; AKR1C1; PIR; CYP4F11; TCN1; TM4SF1; KRT 14; ME1; CBR1; ADH7; SPDEF; ME1; CXCL 14; SRPX2; UPK1B; TRIM16 /// TR1M16L /// LOC653524; KLF4; TXN; TKT; DEFB1; CSTA; CEACAM6; TALDO1; CA12; GCLM; PGD; TXNRD1; CEACAM6; GCLC; GPC1; TFF1; CABYR; CA12; UPK1B; GALNT6; TKT; TSPAN8; UGT1A10 /// UGT1A8 /// UGT1A7 /// UGT1A6 /// UGT1A; SPDEF; MSMB; ANXA3; MUC5AC; CTGF; IDS; CA12; FTH1; HN1; DPYSL3; GMDS; UGT1A10 /// UGT1A8 /// UGT1A7 /// UGT1A6 /// UGT1A; ABHD2; GCLC; GALNT7; MSMB; HTATIP2; UGT1A10 /// UGT1A8 /// UGT1A7 /// UGTIA6 /// UGT1A; S100A10; DAZ1 /// DAZ3 /// DAZ2 /// DAZ4; IDS; PRDX1; CYP4F3; UGT1A10 /// UGT1A8 /// UGT1A7 /// UGT1A6 /// UGT1A; AGR2; S100P; NDUFA7; MAFG; ZNF323; AP2B1; UGT1A6; NKX3-1; SEPX1; CTSC; GCNT3; GULP1; LOC283677; SMPDL3A; SLC35A3; WBP5; TARS; EIF2AK3; C11orf32; GALNT12; VPS13D; BCLZL13; IMPA2; GMDS; AZGP1; PLCE1; FOLH1; NUDT4 /// NUDT4P1; TAGLN2; GNE; TSPAN13; GALNT3; HMGN4; SCP2; PLA2G10; GULP1; DIAPH2; RAP1GAP; FTH1; LYPLA1; CREB3L1; AKR1B1; RAB2; SCGB2A1; KIAA0367; ABCC1; TPARL; ABHD2; TSPAN1; DHRS3; ABCC1; FKBP11; TTC9; GSTM3; S100A14; SLC35A1; ENTPD4; P4HB; AGTPBP1; NADK; B4GALT5; CCPG1; PTP4A1; DSG2; CCNG2; CPNE3; SEC31L1; SLC3A2; ARPC3; CDC14B; SLC17A5; HIST1H2AC; CBLB; HIST1H2BK; TOM1L1; TIMP1; ABCB6; GFPT1; TIAM1; SOL1; PAM; NADK; RND3; XPOT; SERINC5; GSN; HIGD1A; PDIA3; C3orf14; PRDX4; RAB7; GPR153; ARL1; IDS; GHITM; RGC32; TMED2; PTS; GTF3C1; IDH1; LAMP2; ACTL6A; RAB11A; COX5A; APLP2; PTK9; UBE2J1; TACSTD2; PSMD14; PDIA4; MTMR6; FA2H; NUDT4; TBC1D16; PIGP; CCDC28A; AACS; CHP; TJP2; EFHD2; KATNB1; SPA17; TPBG; GALNT1; HSP90B1; TMED10; SOD1; BECN1; C14orf1; COPB2; TXNDC5; SSR4; TLE1; TXNL1; LRRC8D; PSMB5; SQSTM1; ETHEI; RPN2; TIPARP; CAP 1; LOC92482; FKBP1A; EDEM1; CANX; TMEM59; GUK1; LOC57228; SPINT2; C20orfl11; ECOP; JTB; REXO2; UFD1L; DDX17; SSH3; TRIOBP; GGA1; FAM53C; PPP3CC; SFRS14; ACTN1; SPEN; CYP2J2; TLE2; ProSAPiP1; PFTKL1; PCDH7; FLNB; SIX2; CD81; ZNF331; AMACR; GNB5; CUGBP1; EDD1; TLR5; MGLL; CHST4; SERPINI2; PPAP2B; BCL11A; STEAP3; SYNGR1; CRYM; RUTBC1; PARVA; NFIB; TCF7L1; MAGI2; CCDC81; COL9A2; CNKSR1; NCOR2; INHBB; PEX14; TSPAN9; RAB6B; GSTM5; FLJ10159; TNSI; MT2A; TNFSF13 /// TNFSF12-TNFSF13; 1-Mar; ELF5; JAG2; FLJ23191; PHGDH; CYP2F1; TNS3; GAS6; CD302; PTPRM; CCND1; TNFSF13 /// TNFSF12-TNFSF13; ADCY2; CCND2; MT1X; SNED1; SFRS14; ANXA6; HNMT; AK1; EPOR; EPAS1; PDE8B; CYFIP2; SLIT1; ACCN2; KAL1; MT1E; MT1F; HLF; SITPEC; JAG2; HSPA2; LOC650610; KRT15; SORD; ITM2A; PECI; HPGD; CKB; HLF; CYP2A6 /// CYP2A7 /// CYP2A7P1 /// CYP2A13; C14orf132; MT1G; FGFR3; PROS1; FAM107A; MT1X; FXYD1; MT1F; CX3CL1; CX3CL1; CYP2A6; HLF; SLIT2; BCAM; FMO2; MT1H; FLRT3; PRG2; TMEM45A; MMP10; C3 /// LOC653879; CYP2W1; FABP6; SCGB1A1; MUC5B /// LOC649768; FAM107A; SEC14L3; 210524_x_at; 213169_at; 212126_at; 43511_s_at; 213891_s_at; 212233_at; and 217626_at; or b)
the transcripts are selected from the group consisting of AACS; ABHD2; ADCY2; ADH7; ALDH3A1; AP2B1; APLP2; ARHE; ARL1; ARPC3; ASM3A; AZGP1; C14orf1; C1orf8; CANX; CAP1; CCND2; CCNG2; CEACAM5; CEACAM6; CHP; CLDN10; COX5A; CPNE3; CPR8; CTSC; CYP1A1; CYP2F1; CYP4F11; CYP4F3; DAZ4; DCL-1; DKFZP434J214; DPYSL3; ERP70; FKBP11; FKBP1A; FLJ13052; FOLH1; FTH1; GALNT1; GALNT 12; GALNT3; GALNT7; GCLM; GCNT3; GFPT1; GMDS; GNE; GRP58; GSN; HGD; HIST1H2BK; HMGN4; HTATIP2; IDS; IMPA2; JTB; KATNB1; KDELR3; KIAA0227; KIAA0367; KIAA0905; KLF4; LAMP2; LOC92689; LRRC5; ME1; MSMB; MT1G; MUC5B; NKX3-1; NQO1; NUDT4; OASIS; P4HB; PDEF; PIR; PLA2G10; PPP3CC; PRDX4; RAB11A; RAB2; RAP1GA1; RGC32; RNP24; S100A10; SCGB2A1; SDR1; SEPX1; SLC17A5; SLC35A1; SLC7A11; TACSTD2; TAGLN2; TCN1; TIMP1; TKT; TM4SF 13; TM4SF3; TMP21; TXNDC5; UBE2J1; UGT1A10; UPK1B; CYP1B1 and 203369_x_at. - The method of claim 1, wherein the transcripts are selected from the group consisting of transcripts encoding for AACS; ABHD2; ADCY2; ADH7; ALDH3A1; AP2B1; APLP2; ARHE; ARL1; ARPC3; ASM3A; AZGP1; C14orf1; C1orf8; CANX; CAP1; CCND2; CCNG2; CEACAM5; CEACAM6; CHP; CLDN10; COX5A; CPNE3; CPR8; CTSC; CYP1A1; CYP2F1; CYP4F11; CYP4F3; DAZ4; DCL-1; DKFZP4341214; DPYSL3; ERP70; FKBP11; FKBP1A; FLJ13052; FOLH1; FTH1; GALNT1; GALNT12; GALNT3; GALNT7; GCLM; GCNT3; GFPT1; GMDS; GNE; GRP58; GSN; HGD; HIST1H2BK; HMGN4; HTATIP2; IDS; IMPA2; JTB; KATNB1; KDELR3; KIAA0227; KIAA0367; KIAA0905; KLF4; LAMP2; LOC92689; LRRC5; ME1; MSMB; MT1G; MUC5B; NKX3-1; NQO1; NUDT4; OASIS; P4HB; PDEF; PIR; PLA2G10; PPP3CC; PRDX4; RAB11A; RAB2; RAP1GA1; RGC32; RNP24; S100A10; SCGB2A1; SDR1; SEPX1; SLC17A5; SLC35A1; SLC7A11; TACSTD2; TAGLN2; TCN1; TIMP1; TKT; TM4SF13; TM4SF3; TMP21; TXNDC5; UBE2J1; UGTIA10; UPK1B; CYP1B1 and 203369_x_at.
- The method of claim 1, wherein the transcripts are selected from the group consisting of transcripts encoding for MUC1; CD164; MUC16; MUC4; MUC5AC; CYP2A6; CYP2B7P1; CYP4B1; POR; CYP2F1; DNAI2; DYNLT1; DNALI1; DNAI1; DNAH9; DNAH7; DYNC1I2; DYNC1H1; DYNLL1; DYNLRB1; ESD; GSTM2; GSTM1; GSTK1; GSEA1; GPX4; GPX1; MGST2; GSTP1; GSS; GSTO1; KRT19; KRT7; KRT8; KRT18; KRT10; KRT10; KRT17; KRT5; KRT15; MAP1A; MAPRE1; EML2; MAST4; MACF1; ALDH3A1; ALDH1A1; ALDH3B1; ALDH3B1; ALDH3A2; ALDH1L1; ALDH9A1; ALDH2; K-ALPHA-1; TUBB3; TUBGCP2; TBCA; TUBB2A; TUBA4; TUBB2C; TUBA3; TUBA6; K-ALPHA-1; TUBB; TUBA6; TUBA1; TUBB; K-ALPHA-1; 76P; TUBB3; and TUBB2C.
Applications Claiming Priority (2)
| Application Number | Priority Date | Filing Date | Title |
|---|---|---|---|
| US78055206P | 2006-03-09 | 2006-03-09 | |
| EP07752688A EP1999472A2 (en) | 2006-03-09 | 2007-03-08 | Diagnostic and prognostic methods for lung disorders using gene expression profiles from nose epithelial cells |
Related Parent Applications (2)
| Application Number | Title | Priority Date | Filing Date |
|---|---|---|---|
| WOPCT/US2007/006006 Previously-Filed-Application | 2007-03-08 | ||
| EP07752688.7 Division | 2007-03-08 |
Publications (1)
| Publication Number | Publication Date |
|---|---|
| EP2605018A1 true EP2605018A1 (en) | 2013-06-19 |
Family
ID=38328561
Family Applications (2)
| Application Number | Title | Priority Date | Filing Date |
|---|---|---|---|
| EP20120170635 Pending EP2605018A1 (en) | 2006-03-09 | 2007-03-08 | Diagnostic and prognostic methods for lung disorders using gene expression profiles from nose epithelial cells |
| EP07752688A Withdrawn EP1999472A2 (en) | 2006-03-09 | 2007-03-08 | Diagnostic and prognostic methods for lung disorders using gene expression profiles from nose epithelial cells |
Family Applications After (1)
| Application Number | Title | Priority Date | Filing Date |
|---|---|---|---|
| EP07752688A Withdrawn EP1999472A2 (en) | 2006-03-09 | 2007-03-08 | Diagnostic and prognostic methods for lung disorders using gene expression profiles from nose epithelial cells |
Country Status (6)
| Country | Link |
|---|---|
| US (5) | US20090061454A1 (en) |
| EP (2) | EP2605018A1 (en) |
| JP (2) | JP2009529329A (en) |
| AU (1) | AU2007223788B2 (en) |
| CA (1) | CA2645310A1 (en) |
| WO (1) | WO2007103541A2 (en) |
Families Citing this family (37)
| Publication number | Priority date | Publication date | Assignee | Title |
|---|---|---|---|---|
| WO2005000098A2 (en) * | 2003-06-10 | 2005-01-06 | The Trustees Of Boston University | Detection methods for disorders of the lung |
| US20070148650A1 (en) * | 2003-11-12 | 2007-06-28 | Trustees Of Boston University | Isolation of nucleic acid from mouth epithelial cells |
| US20100035244A1 (en) * | 2005-04-14 | 2010-02-11 | The Trustees Of Boston University | Diagnostic for lung disorders using class prediction |
| US20100113299A1 (en) * | 2008-10-14 | 2010-05-06 | Von Hoff Daniel D | Gene and gene expressed protein targets depicting biomarker patterns and signature sets by tumor type |
| MX2008014608A (en) | 2006-05-18 | 2009-03-31 | Molecular Profiling Inst Inc | System and method for determining individualized medical intervention for a disease state. |
| US8768629B2 (en) * | 2009-02-11 | 2014-07-01 | Caris Mpi, Inc. | Molecular profiling of tumors |
| US8822153B2 (en) * | 2007-06-01 | 2014-09-02 | The University Of North Carolina At Chapel Hill | Molecular diagnosis and typing of lung cancer variants |
| CN101990577A (en) * | 2007-09-19 | 2011-03-23 | 波士顿大学理事会 | Identification of novel pathways for drug development for lung disease |
| US8114593B2 (en) * | 2008-03-12 | 2012-02-14 | University Of Medicine And Dentistry Of New Jersey | Cancer biomarker genes and gene products and methods for using the same |
| JP2011516046A (en) * | 2008-03-28 | 2011-05-26 | トラスティーズ オブ ボストン ユニバーシティ | Plural methods for detection of lung injury |
| US7897356B2 (en) * | 2008-11-12 | 2011-03-01 | Caris Life Sciences | Methods and systems of using exosomes for determining phenotypes |
| US9495515B1 (en) | 2009-12-09 | 2016-11-15 | Veracyte, Inc. | Algorithms for disease diagnostics |
| US20120053112A1 (en) * | 2009-05-05 | 2012-03-01 | Children's Hospital Medical Center | Methods and compositions related to the regulation of goblet cell differentiation, mucus production and mucus secretion |
| US8993347B2 (en) | 2009-12-17 | 2015-03-31 | Cornell University | Methods for detecting antibodies in mucosal samples and device for sampling mucosal material |
| CN103237901B (en) | 2010-03-01 | 2016-08-03 | 卡里斯生命科学瑞士控股有限责任公司 | For treating the biomarker of diagnosis |
| BR112012025593A2 (en) | 2010-04-06 | 2019-06-25 | Caris Life Sciences Luxembourg Holdings | circulating biomarkers for disease |
| JP5854346B2 (en) * | 2010-07-21 | 2016-02-09 | 公立大学法人秋田県立大学 | Transcriptome analysis method, disease determination method, computer program, storage medium, and analysis apparatus |
| WO2012129237A2 (en) * | 2011-03-20 | 2012-09-27 | Trustees Of Boston University | Therapeutic agent for emphysema and copd |
| EP2702173A1 (en) | 2011-04-25 | 2014-03-05 | OSI Pharmaceuticals, LLC | Use of emt gene signatures in cancer drug discovery, diagnostics, and treatment |
| CA2846837A1 (en) * | 2011-08-29 | 2013-03-07 | Cardiodx, Inc. | Methods and compositions for determining smoking status |
| WO2013049152A2 (en) * | 2011-09-26 | 2013-04-04 | Allegro Diagnostics Corp. | Methods for evaluating lung cancer status |
| WO2013177060A2 (en) * | 2012-05-20 | 2013-11-28 | Trustees Of Boston University | Methods and systems for monitoring, diagnosing, and treating chronic obstructive polmonary disease |
| KR101495275B1 (en) | 2012-06-07 | 2015-02-24 | 한양대학교 산학협력단 | Target protein for both diagnosis and treatment of lung cancer |
| WO2014186036A1 (en) | 2013-03-14 | 2014-11-20 | Allegro Diagnostics Corp. | Methods for evaluating copd status |
| EP3044713A1 (en) | 2013-09-13 | 2016-07-20 | Philip Morris Products S.A. | Systems and methods for evaluating perturbation of xenobiotic metabolism |
| US20160130656A1 (en) | 2014-07-14 | 2016-05-12 | Allegro Diagnostics Corp. | Methods for evaluating lung cancer status |
| CN104198722A (en) * | 2014-08-11 | 2014-12-10 | 广东药学院 | Novel tumor marker GSTA1 for lung caner as well as screening method and application thereof |
| EP3770274A1 (en) | 2014-11-05 | 2021-01-27 | Veracyte, Inc. | Systems and methods of diagnosing idiopathic pulmonary fibrosis on transbronchial biopsies using machine learning and high dimensional transcriptional data |
| WO2016183414A1 (en) * | 2015-05-14 | 2016-11-17 | The Arizona Board Of Regents On Behalf Of The University Of Arizona | Systems and methods for characterizing granulomatous diseases |
| JP6232689B2 (en) * | 2015-06-25 | 2017-11-22 | 株式会社国際電気通信基礎技術研究所 | Prediction device and prediction program based on multi-organ linkage system |
| CN114778845A (en) | 2016-03-29 | 2022-07-22 | 无限生物制药公司 | Pharmaceutical or food composition and method for evaluating in vivo effect of active ingredient |
| EP4180531A3 (en) * | 2016-05-12 | 2023-08-23 | Trustees of Boston University | Nasal epithelium gene expression signature and classifier for the prediction of lung cancer |
| WO2018009915A1 (en) | 2016-07-08 | 2018-01-11 | Trustees Of Boston University | Gene expression-based biomarker for the detection and monitoring of bronchial premalignant lesions |
| WO2018050299A1 (en) * | 2016-09-14 | 2018-03-22 | Philip Morris Products S.A. | Systems, methods, and gene signatures for predicting a biological status of an individual |
| KR102130032B1 (en) * | 2018-12-21 | 2020-07-03 | 순천향대학교 산학협력단 | Biomarker for identifying exposure to air pollutants and method for identifying exposure to air pollutants using the same |
| CN111635944A (en) * | 2020-07-03 | 2020-09-08 | 南方医科大学南方医院 | Specific primer, kit and PCR method for detecting liver cancer susceptibility locus rs73613962 |
| EP4314323A1 (en) * | 2021-03-29 | 2024-02-07 | Veracyte, Inc. | Methods and systems to identify a lung disorder |
Citations (83)
| Publication number | Priority date | Publication date | Assignee | Title |
|---|---|---|---|---|
| US1359801A (en) | 1920-03-03 | 1920-11-23 | Goldner Joe | Combination mattress and pillow |
| US4437975A (en) | 1977-07-20 | 1984-03-20 | Mobil Oil Corporation | Manufacture of lube base stock oil |
| US4632901A (en) | 1984-05-11 | 1986-12-30 | Hybritech Incorporated | Method and apparatus for immunoassays |
| US4683202A (en) | 1985-03-28 | 1987-07-28 | Cetus Corporation | Process for amplifying nucleic acid sequences |
| US4683195A (en) | 1986-01-30 | 1987-07-28 | Cetus Corporation | Process for amplifying, detecting, and/or-cloning nucleic acid sequences |
| WO1988010315A1 (en) | 1987-06-19 | 1988-12-29 | Siska Diagnostics, Inc. | Transcription-based nucleic acid amplification/detection systems |
| US4800159A (en) | 1986-02-07 | 1989-01-24 | Cetus Corporation | Process for amplifying, detecting, and/or cloning nucleic acid sequences |
| WO1990006995A1 (en) | 1988-12-16 | 1990-06-28 | Siska Diagnostics, Inc. | Self-sustained sequence replication system |
| US4965188A (en) | 1986-08-22 | 1990-10-23 | Cetus Corporation | Process for amplifying, detecting, and/or cloning nucleic acid sequences using a thermostable enzyme |
| US4988617A (en) | 1988-03-25 | 1991-01-29 | California Institute Of Technology | Method of detecting a nucleotide change in nucleic acids |
| US5143854A (en) | 1989-06-07 | 1992-09-01 | Affymax Technologies N.V. | Large scale photolithographic solid phase synthesis of polypeptides and receptor binding screening thereof |
| US5242794A (en) | 1984-12-13 | 1993-09-07 | Applied Biosystems, Inc. | Detection of specific sequences in nucleic acids |
| US5242974A (en) | 1991-11-22 | 1993-09-07 | Affymax Technologies N.V. | Polymer reversal on solid surfaces |
| US5252743A (en) | 1989-11-13 | 1993-10-12 | Affymax Technologies N.V. | Spatially-addressable immobilization of anti-ligands on surfaces |
| US5324633A (en) | 1991-11-22 | 1994-06-28 | Affymax Technologies N.V. | Method and apparatus for measuring binding affinity |
| US5333675A (en) | 1986-02-25 | 1994-08-02 | Hoffmann-La Roche Inc. | Apparatus and method for performing automated amplification of nucleic acid sequences and assays using heating and cooling steps |
| US5384261A (en) | 1991-11-22 | 1995-01-24 | Affymax Technologies N.V. | Very large scale immobilized polymer synthesis using mechanically directed flow paths |
| US5409818A (en) | 1988-02-24 | 1995-04-25 | Cangene Corporation | Nucleic acid amplification process |
| US5412087A (en) | 1992-04-24 | 1995-05-02 | Affymax Technologies N.V. | Spatially-addressable immobilization of oligonucleotides and other biological polymers on surfaces |
| US5413909A (en) | 1990-08-24 | 1995-05-09 | The University Of Tennessee Research Corp. | Method for profiling nucleic acids of unknown sequence using arbitrary oligonucleotide primers |
| US5424186A (en) | 1989-06-07 | 1995-06-13 | Affymax Technologies N.V. | Very large scale immobilized polymer synthesis |
| US5491074A (en) | 1993-04-01 | 1996-02-13 | Affymax Technologies Nv | Association peptides |
| US5494810A (en) | 1990-05-03 | 1996-02-27 | Cornell Research Foundation, Inc. | Thermostable ligase-mediated DNA amplifications system for the detection of genetic disease |
| US5527681A (en) | 1989-06-07 | 1996-06-18 | Affymax Technologies N.V. | Immobilized molecular synthesis of systematically substituted compounds |
| US5541061A (en) | 1992-04-29 | 1996-07-30 | Affymax Technologies N.V. | Methods for screening factorial chemical libraries |
| US5547839A (en) | 1989-06-07 | 1996-08-20 | Affymax Technologies N.V. | Sequencing of surface immobilized polymers utilizing microflourescence detection |
| US5550215A (en) | 1991-11-22 | 1996-08-27 | Holmes; Christopher P. | Polymer reversal on solid surfaces |
| US5554517A (en) | 1988-02-24 | 1996-09-10 | Akzo Nobel N.V. | Nucleic acid amplification process |
| US5571639A (en) | 1994-05-24 | 1996-11-05 | Affymax Technologies N.V. | Computer-aided engineering system for design of sequence arrays and lithographic masks |
| US5578832A (en) | 1994-09-02 | 1996-11-26 | Affymetrix, Inc. | Method and apparatus for imaging a sample on a device |
| US5599695A (en) | 1995-02-27 | 1997-02-04 | Affymetrix, Inc. | Printing molecular library arrays using deprotection agents solely in the vapor phase |
| US5624711A (en) | 1995-04-27 | 1997-04-29 | Affymax Technologies, N.V. | Derivatization of solid supports and methods for oligomer synthesis |
| US5631734A (en) | 1994-02-10 | 1997-05-20 | Affymetrix, Inc. | Method and apparatus for detection of fluorescently labeled materials |
| US5639606A (en) | 1993-04-06 | 1997-06-17 | The University Of Rochester | Method for quantitative measurement of gene expression using multiplex competitive reverse transcriptase-polymerase chain reaction |
| US5643765A (en) | 1993-04-06 | 1997-07-01 | University Of Rochester | Method for quantitative measurement of gene expression using multiplex competitive reverse transcriptase-polymerase chain reaction |
| US5733729A (en) | 1995-09-14 | 1998-03-31 | Affymetrix, Inc. | Computer-aided probability base calling for arrays of nucleic acid probes on chips |
| US5795716A (en) | 1994-10-21 | 1998-08-18 | Chee; Mark S. | Computer-aided visualization and analysis system for sequence evaluation |
| US5800992A (en) | 1989-06-07 | 1998-09-01 | Fodor; Stephen P.A. | Method of detecting nucleic acids |
| US5837832A (en) | 1993-06-25 | 1998-11-17 | Affymetrix, Inc. | Arrays of nucleic acid probes on biological chips |
| US5856092A (en) | 1989-02-13 | 1999-01-05 | Geneco Pty Ltd | Detection of a nucleic acid sequence or a change therein |
| US5858659A (en) | 1995-11-29 | 1999-01-12 | Affymetrix, Inc. | Polymorphism detection |
| US5861245A (en) | 1990-10-15 | 1999-01-19 | Stratagene & California Institute Of Biological Research | Arbitrarily primed polymerase chain reaction method for fingerprinting genomes |
| US5871928A (en) | 1989-06-07 | 1999-02-16 | Fodor; Stephen P. A. | Methods for nucleic acid analysis |
| US5874219A (en) | 1995-06-07 | 1999-02-23 | Affymetrix, Inc. | Methods for concurrently processing multiple biological chip assays |
| US5876978A (en) | 1993-04-06 | 1999-03-02 | Medical College Of Ohio | Method for quantitative measurement of gene expression using multiplex competitive reverse transcriptase-polymerase chain reaction |
| US5889165A (en) | 1989-06-07 | 1999-03-30 | Affymetrix, Inc. | Photolabile nucleoside protecting groups |
| WO1999036760A1 (en) | 1998-01-13 | 1999-07-22 | Genetic Microsystems, Inc. | Depositing fluid specimens on substrates, resulting ordered arrays, techniques for analysis of deposited arrays |
| US5936324A (en) | 1998-03-30 | 1999-08-10 | Genetic Microsystems Inc. | Moving magnet scanner |
| WO1999047964A1 (en) | 1998-03-20 | 1999-09-23 | Genetic Microsystems, Inc. | Wide field of view and high speed scanning microscopy |
| US5959098A (en) | 1996-04-17 | 1999-09-28 | Affymetrix, Inc. | Substrate preparation process |
| US5968740A (en) | 1995-07-24 | 1999-10-19 | Affymetrix, Inc. | Method of Identifying a Base in a Nucleic Acid |
| US5981185A (en) | 1994-05-05 | 1999-11-09 | Beckman Coulter, Inc. | Oligonucleotide repeat arrays |
| US5981956A (en) | 1996-05-16 | 1999-11-09 | Affymetrix, Inc. | Systems and methods for detection of labeled materials |
| US6013449A (en) | 1997-11-26 | 2000-01-11 | The United States Of America As Represented By The Department Of Health And Human Services | Probe-based analysis of heterozygous mutations using two-color labelling |
| US6013431A (en) | 1990-02-16 | 2000-01-11 | Molecular Tool, Inc. | Method for determining specific nucleotide variations by primer extension in the presence of mixture of labeled nucleotides and terminators |
| US6020135A (en) | 1998-03-27 | 2000-02-01 | Affymetrix, Inc. | P53-regulated genes |
| US6033860A (en) | 1997-10-31 | 2000-03-07 | Affymetrix, Inc. | Expression profiles in adult and fetal organs |
| US6040193A (en) | 1991-11-22 | 2000-03-21 | Affymetrix, Inc. | Combinatorial strategies for polymer synthesis |
| US6040138A (en) | 1995-09-15 | 2000-03-21 | Affymetrix, Inc. | Expression monitoring by hybridization to high density oligonucleotide arrays |
| US6045996A (en) | 1993-10-26 | 2000-04-04 | Affymetrix, Inc. | Hybridization assays on oligonucleotide arrays |
| US6090555A (en) | 1997-12-11 | 2000-07-18 | Affymetrix, Inc. | Scanned image alignment systems and methods |
| WO2000058516A2 (en) | 1999-03-26 | 2000-10-05 | Whitehead Institute For Biomedical Research | Universal arrays |
| US6147205A (en) | 1995-12-15 | 2000-11-14 | Affymetrix, Inc. | Photocleavable protecting groups and methods for their use |
| US6177248B1 (en) | 1999-02-24 | 2001-01-23 | Affymetrix, Inc. | Downstream genes of tumor suppressor WT1 |
| US6185561B1 (en) | 1998-09-17 | 2001-02-06 | Affymetrix, Inc. | Method and apparatus for providing and expression data mining database |
| US6188783B1 (en) | 1997-07-25 | 2001-02-13 | Affymetrix, Inc. | Method and system for providing a probe array chip design database |
| US6201639B1 (en) | 1998-03-20 | 2001-03-13 | James W. Overbeck | Wide field of view and high speed scanning microscopy |
| US6218803B1 (en) | 1999-06-04 | 2001-04-17 | Genetic Microsystems, Inc. | Position sensing with variable capacitance transducers |
| US6223127B1 (en) | 1997-08-15 | 2001-04-24 | Affymetrix, Inc. | Polymorphism detection utilizing clustering analysis |
| US6262216B1 (en) | 1998-10-13 | 2001-07-17 | Affymetrix, Inc. | Functionalized silicon compounds and methods for their synthesis and use |
| US6300070B1 (en) | 1999-06-04 | 2001-10-09 | Mosaic Technologies, Inc. | Solid phase methods for amplifying multiple nucleic acids |
| US6309822B1 (en) | 1989-06-07 | 2001-10-30 | Affymetrix, Inc. | Method for comparing copy number of nucleic acid sequences |
| US6310189B1 (en) | 1989-06-07 | 2001-10-30 | Affymetrix, Inc. | Nucleotides and analogs having photoremoveable protecting groups |
| US6355902B2 (en) | 1996-11-14 | 2002-03-12 | Tokyo Electron Limited | Plasma film forming method and plasma film forming apparatus |
| US6361947B1 (en) | 1998-10-27 | 2002-03-26 | Affymetrix, Inc. | Complexity management and analysis of genomic DNA |
| US6386749B1 (en) | 2000-06-26 | 2002-05-14 | Affymetrix, Inc. | Systems and methods for heating and mixing fluids |
| US6391592B1 (en) | 2000-12-14 | 2002-05-21 | Affymetrix, Inc. | Blocker-aided target amplification of nucleic acids |
| US6391623B1 (en) | 1996-03-26 | 2002-05-21 | Affymetrix, Inc. | Fluidics station injection needles with distal end and side ports and method of using |
| US6410276B1 (en) | 1987-07-31 | 2002-06-25 | The Board Of Trustees Of The Leland Stanford Junior University | Selective amplification of target polynucleotide sequences |
| US6428752B1 (en) | 1998-05-14 | 2002-08-06 | Affymetrix, Inc. | Cleaning deposit devices that form microarrays and the like |
| US20040063120A1 (en) * | 2002-07-10 | 2004-04-01 | The Regents Of The University Of Michigan | Expression profile of lung cancer |
| WO2005000098A2 (en) * | 2003-06-10 | 2005-01-06 | The Trustees Of Boston University | Detection methods for disorders of the lung |
| US20050266409A1 (en) * | 2003-02-04 | 2005-12-01 | Wyeth | Compositions and methods for diagnosing, preventing, and treating cancers |
Family Cites Families (20)
| Publication number | Priority date | Publication date | Assignee | Title |
|---|---|---|---|---|
| US3640268A (en) * | 1965-10-23 | 1972-02-08 | Hugh J Davis | Method and device for biopsy specimen collecting and handling |
| US4641662A (en) * | 1984-09-28 | 1987-02-10 | Jaicks John R | Endocervical curette system |
| US4800896A (en) * | 1985-11-08 | 1989-01-31 | Jalowayski Alfredo A | Cell sample collector probe |
| US5726060A (en) * | 1991-09-17 | 1998-03-10 | Bridges; Michael Anthony | Method for culturing mammalian respiratory epithelial cells |
| US5422273A (en) * | 1993-03-23 | 1995-06-06 | Baal Medical Products, Inc. | Cell collection apparatus |
| US5477863A (en) * | 1993-04-14 | 1995-12-26 | Grant; Michael A. | Collection kit with a sample collector |
| US5440942A (en) * | 1994-02-02 | 1995-08-15 | Hubbard; Stephen H. | Biological sample collecting and holding device |
| US6085907A (en) * | 1998-05-08 | 2000-07-11 | Institute Of Legal Medicine, University Of Bern | Foldable cardboard box for contact-free drying and long-term storage of biological evidence recovered on cotton swabs and forensic evidence collection kit including same |
| US20040241728A1 (en) * | 1999-01-06 | 2004-12-02 | Chondrogene Limited | Method for the detection of lung disease related gene transcripts in blood |
| US6746846B1 (en) * | 1999-06-30 | 2004-06-08 | Corixa Corporation | Methods for diagnosing lung cancer |
| EP1346043A2 (en) * | 2000-11-20 | 2003-09-24 | Diadexus, Inc. | Compositions and methods relating to lung specific genes and proteins |
| US6995013B2 (en) * | 2002-07-08 | 2006-02-07 | Biomed Solutions, Llc | Cell-scaffold composition containing five layers |
| EP1373896A2 (en) * | 2001-03-12 | 2004-01-02 | MonoGen, Inc. | Cell-based detection and differentiation of disease states |
| AU2002343443A1 (en) * | 2001-09-28 | 2003-04-14 | Whitehead Institute For Biomedical Research | Classification of lung carcinomas using gene expression analysis |
| US20040241725A1 (en) * | 2003-03-25 | 2004-12-02 | Wenming Xiao | Lung cancer detection |
| US20070148650A1 (en) * | 2003-11-12 | 2007-06-28 | Trustees Of Boston University | Isolation of nucleic acid from mouth epithelial cells |
| US7862995B2 (en) * | 2004-12-10 | 2011-01-04 | Targeted Molecular Diagnostics | Methods and materials for predicting responsiveness to treatment with dual tyrosine kinase inhibitor |
| US20100035244A1 (en) * | 2005-04-14 | 2010-02-11 | The Trustees Of Boston University | Diagnostic for lung disorders using class prediction |
| CN101990577A (en) * | 2007-09-19 | 2011-03-23 | 波士顿大学理事会 | Identification of novel pathways for drug development for lung disease |
| JP2011516046A (en) * | 2008-03-28 | 2011-05-26 | トラスティーズ オブ ボストン ユニバーシティ | Plural methods for detection of lung injury |
-
2007
- 2007-03-08 US US12/282,320 patent/US20090061454A1/en not_active Abandoned
- 2007-03-08 AU AU2007223788A patent/AU2007223788B2/en active Active
- 2007-03-08 WO PCT/US2007/006006 patent/WO2007103541A2/en active Application Filing
- 2007-03-08 EP EP20120170635 patent/EP2605018A1/en active Pending
- 2007-03-08 JP JP2008558410A patent/JP2009529329A/en active Pending
- 2007-03-08 CA CA 2645310 patent/CA2645310A1/en not_active Abandoned
- 2007-03-08 EP EP07752688A patent/EP1999472A2/en not_active Withdrawn
-
2010
- 2010-11-05 US US12/940,840 patent/US20110217717A1/en not_active Abandoned
-
2011
- 2011-12-12 US US13/323,655 patent/US20120190567A1/en not_active Abandoned
-
2013
- 2013-03-26 JP JP2013063949A patent/JP2013126427A/en active Pending
-
2015
- 2015-04-17 US US14/690,182 patent/US20170328908A1/en not_active Abandoned
-
2019
- 2019-09-23 US US16/579,798 patent/US20200096513A1/en active Pending
Patent Citations (106)
| Publication number | Priority date | Publication date | Assignee | Title |
|---|---|---|---|---|
| US1359801A (en) | 1920-03-03 | 1920-11-23 | Goldner Joe | Combination mattress and pillow |
| US4437975A (en) | 1977-07-20 | 1984-03-20 | Mobil Oil Corporation | Manufacture of lube base stock oil |
| US4632901A (en) | 1984-05-11 | 1986-12-30 | Hybritech Incorporated | Method and apparatus for immunoassays |
| US5242794A (en) | 1984-12-13 | 1993-09-07 | Applied Biosystems, Inc. | Detection of specific sequences in nucleic acids |
| US4683202A (en) | 1985-03-28 | 1987-07-28 | Cetus Corporation | Process for amplifying nucleic acid sequences |
| US4683202B1 (en) | 1985-03-28 | 1990-11-27 | Cetus Corp | |
| US4683195A (en) | 1986-01-30 | 1987-07-28 | Cetus Corporation | Process for amplifying, detecting, and/or-cloning nucleic acid sequences |
| US4683195B1 (en) | 1986-01-30 | 1990-11-27 | Cetus Corp | |
| US4800159A (en) | 1986-02-07 | 1989-01-24 | Cetus Corporation | Process for amplifying, detecting, and/or cloning nucleic acid sequences |
| US5333675A (en) | 1986-02-25 | 1994-08-02 | Hoffmann-La Roche Inc. | Apparatus and method for performing automated amplification of nucleic acid sequences and assays using heating and cooling steps |
| US5333675C1 (en) | 1986-02-25 | 2001-05-01 | Perkin Elmer Corp | Apparatus and method for performing automated amplification of nucleic acid sequences and assays using heating and cooling steps |
| US4965188A (en) | 1986-08-22 | 1990-10-23 | Cetus Corporation | Process for amplifying, detecting, and/or cloning nucleic acid sequences using a thermostable enzyme |
| WO1988010315A1 (en) | 1987-06-19 | 1988-12-29 | Siska Diagnostics, Inc. | Transcription-based nucleic acid amplification/detection systems |
| US6410276B1 (en) | 1987-07-31 | 2002-06-25 | The Board Of Trustees Of The Leland Stanford Junior University | Selective amplification of target polynucleotide sequences |
| US6063603A (en) | 1988-02-24 | 2000-05-16 | Akzo Nobel N.V. | Nucleic acid amplification process |
| US5409818A (en) | 1988-02-24 | 1995-04-25 | Cangene Corporation | Nucleic acid amplification process |
| US5554517A (en) | 1988-02-24 | 1996-09-10 | Akzo Nobel N.V. | Nucleic acid amplification process |
| US4988617A (en) | 1988-03-25 | 1991-01-29 | California Institute Of Technology | Method of detecting a nucleotide change in nucleic acids |
| WO1990006995A1 (en) | 1988-12-16 | 1990-06-28 | Siska Diagnostics, Inc. | Self-sustained sequence replication system |
| US5856092A (en) | 1989-02-13 | 1999-01-05 | Geneco Pty Ltd | Detection of a nucleic acid sequence or a change therein |
| US5143854A (en) | 1989-06-07 | 1992-09-01 | Affymax Technologies N.V. | Large scale photolithographic solid phase synthesis of polypeptides and receptor binding screening thereof |
| US6309822B1 (en) | 1989-06-07 | 2001-10-30 | Affymetrix, Inc. | Method for comparing copy number of nucleic acid sequences |
| US5871928A (en) | 1989-06-07 | 1999-02-16 | Fodor; Stephen P. A. | Methods for nucleic acid analysis |
| US5424186A (en) | 1989-06-07 | 1995-06-13 | Affymax Technologies N.V. | Very large scale immobilized polymer synthesis |
| US5889165A (en) | 1989-06-07 | 1999-03-30 | Affymetrix, Inc. | Photolabile nucleoside protecting groups |
| US5902723A (en) | 1989-06-07 | 1999-05-11 | Dower; William J. | Analysis of surface immobilized polymers utilizing microfluorescence detection |
| US5800992A (en) | 1989-06-07 | 1998-09-01 | Fodor; Stephen P.A. | Method of detecting nucleic acids |
| US6197506B1 (en) | 1989-06-07 | 2001-03-06 | Affymetrix, Inc. | Method of detecting nucleic acids |
| US5527681A (en) | 1989-06-07 | 1996-06-18 | Affymax Technologies N.V. | Immobilized molecular synthesis of systematically substituted compounds |
| US6225625B1 (en) | 1989-06-07 | 2001-05-01 | Affymetrix, Inc. | Signal detection methods and apparatus |
| US5547839A (en) | 1989-06-07 | 1996-08-20 | Affymax Technologies N.V. | Sequencing of surface immobilized polymers utilizing microflourescence detection |
| US6310189B1 (en) | 1989-06-07 | 2001-10-30 | Affymetrix, Inc. | Nucleotides and analogs having photoremoveable protecting groups |
| US5405783A (en) | 1989-06-07 | 1995-04-11 | Affymax Technologies N.V. | Large scale photolithographic solid phase synthesis of an array of polymers |
| US5252743A (en) | 1989-11-13 | 1993-10-12 | Affymax Technologies N.V. | Spatially-addressable immobilization of anti-ligands on surfaces |
| US5451683A (en) | 1989-11-13 | 1995-09-19 | Affymax Technologies N.V. | Spatially-addressable immobilization of anti-ligands on surfaces |
| US5482867A (en) | 1989-11-13 | 1996-01-09 | Affymax Technologies N.V. | Spatially-addressable immobilization of anti-ligands on surfaces |
| US6013431A (en) | 1990-02-16 | 2000-01-11 | Molecular Tool, Inc. | Method for determining specific nucleotide variations by primer extension in the presence of mixture of labeled nucleotides and terminators |
| US5494810A (en) | 1990-05-03 | 1996-02-27 | Cornell Research Foundation, Inc. | Thermostable ligase-mediated DNA amplifications system for the detection of genetic disease |
| US5413909A (en) | 1990-08-24 | 1995-05-09 | The University Of Tennessee Research Corp. | Method for profiling nucleic acids of unknown sequence using arbitrary oligonucleotide primers |
| US5861245A (en) | 1990-10-15 | 1999-01-19 | Stratagene & California Institute Of Biological Research | Arbitrarily primed polymerase chain reaction method for fingerprinting genomes |
| US6040193A (en) | 1991-11-22 | 2000-03-21 | Affymetrix, Inc. | Combinatorial strategies for polymer synthesis |
| US5384261A (en) | 1991-11-22 | 1995-01-24 | Affymax Technologies N.V. | Very large scale immobilized polymer synthesis using mechanically directed flow paths |
| US6136269A (en) | 1991-11-22 | 2000-10-24 | Affymetrix, Inc. | Combinatorial kit for polymer synthesis |
| US5324633A (en) | 1991-11-22 | 1994-06-28 | Affymax Technologies N.V. | Method and apparatus for measuring binding affinity |
| US5242974A (en) | 1991-11-22 | 1993-09-07 | Affymax Technologies N.V. | Polymer reversal on solid surfaces |
| US5550215A (en) | 1991-11-22 | 1996-08-27 | Holmes; Christopher P. | Polymer reversal on solid surfaces |
| US5412087A (en) | 1992-04-24 | 1995-05-02 | Affymax Technologies N.V. | Spatially-addressable immobilization of oligonucleotides and other biological polymers on surfaces |
| US5541061A (en) | 1992-04-29 | 1996-07-30 | Affymax Technologies N.V. | Methods for screening factorial chemical libraries |
| US5491074A (en) | 1993-04-01 | 1996-02-13 | Affymax Technologies Nv | Association peptides |
| US5876978A (en) | 1993-04-06 | 1999-03-02 | Medical College Of Ohio | Method for quantitative measurement of gene expression using multiplex competitive reverse transcriptase-polymerase chain reaction |
| US5639606A (en) | 1993-04-06 | 1997-06-17 | The University Of Rochester | Method for quantitative measurement of gene expression using multiplex competitive reverse transcriptase-polymerase chain reaction |
| US5643765A (en) | 1993-04-06 | 1997-07-01 | University Of Rochester | Method for quantitative measurement of gene expression using multiplex competitive reverse transcriptase-polymerase chain reaction |
| US5837832A (en) | 1993-06-25 | 1998-11-17 | Affymetrix, Inc. | Arrays of nucleic acid probes on biological chips |
| US6045996A (en) | 1993-10-26 | 2000-04-04 | Affymetrix, Inc. | Hybridization assays on oligonucleotide arrays |
| US5631734A (en) | 1994-02-10 | 1997-05-20 | Affymetrix, Inc. | Method and apparatus for detection of fluorescently labeled materials |
| US6141096A (en) | 1994-02-10 | 2000-10-31 | Affymetrix, Inc. | Method and apparatus for detection of fluorescently labeled materials |
| US5981185A (en) | 1994-05-05 | 1999-11-09 | Beckman Coulter, Inc. | Oligonucleotide repeat arrays |
| US5571639A (en) | 1994-05-24 | 1996-11-05 | Affymax Technologies N.V. | Computer-aided engineering system for design of sequence arrays and lithographic masks |
| US5593839A (en) | 1994-05-24 | 1997-01-14 | Affymetrix, Inc. | Computer-aided engineering system for design of sequence arrays and lithographic masks |
| US5856101A (en) | 1994-05-24 | 1999-01-05 | Affymetrix, Inc. | Computer-aided engineering system for design of sequence arrays and lithographic masks |
| US6025601A (en) | 1994-09-02 | 2000-02-15 | Affymetrix, Inc. | Method and apparatus for imaging a sample on a device |
| US5834758A (en) | 1994-09-02 | 1998-11-10 | Affymetrix, Inc. | Method and apparatus for imaging a sample on a device |
| US5578832A (en) | 1994-09-02 | 1996-11-26 | Affymetrix, Inc. | Method and apparatus for imaging a sample on a device |
| US5974164A (en) | 1994-10-21 | 1999-10-26 | Affymetrix, Inc. | Computer-aided visualization and analysis system for sequence evaluation |
| US5795716A (en) | 1994-10-21 | 1998-08-18 | Chee; Mark S. | Computer-aided visualization and analysis system for sequence evaluation |
| US5599695A (en) | 1995-02-27 | 1997-02-04 | Affymetrix, Inc. | Printing molecular library arrays using deprotection agents solely in the vapor phase |
| US5831070A (en) | 1995-02-27 | 1998-11-03 | Affymetrix, Inc. | Printing oligonucleotide arrays using deprotection agents solely in the vapor phase |
| US5624711A (en) | 1995-04-27 | 1997-04-29 | Affymax Technologies, N.V. | Derivatization of solid supports and methods for oligomer synthesis |
| US5874219A (en) | 1995-06-07 | 1999-02-23 | Affymetrix, Inc. | Methods for concurrently processing multiple biological chip assays |
| US5968740A (en) | 1995-07-24 | 1999-10-19 | Affymetrix, Inc. | Method of Identifying a Base in a Nucleic Acid |
| US6066454A (en) | 1995-09-14 | 2000-05-23 | Affymetrix, Inc. | Computer-aided probability base calling for arrays of nucleic acid probes on chips |
| US5733729A (en) | 1995-09-14 | 1998-03-31 | Affymetrix, Inc. | Computer-aided probability base calling for arrays of nucleic acid probes on chips |
| US6040138A (en) | 1995-09-15 | 2000-03-21 | Affymetrix, Inc. | Expression monitoring by hybridization to high density oligonucleotide arrays |
| US5858659A (en) | 1995-11-29 | 1999-01-12 | Affymetrix, Inc. | Polymorphism detection |
| US6147205A (en) | 1995-12-15 | 2000-11-14 | Affymetrix, Inc. | Photocleavable protecting groups and methods for their use |
| US6391623B1 (en) | 1996-03-26 | 2002-05-21 | Affymetrix, Inc. | Fluidics station injection needles with distal end and side ports and method of using |
| US5959098A (en) | 1996-04-17 | 1999-09-28 | Affymetrix, Inc. | Substrate preparation process |
| US5981956A (en) | 1996-05-16 | 1999-11-09 | Affymetrix, Inc. | Systems and methods for detection of labeled materials |
| US6355902B2 (en) | 1996-11-14 | 2002-03-12 | Tokyo Electron Limited | Plasma film forming method and plasma film forming apparatus |
| US6308170B1 (en) | 1997-07-25 | 2001-10-23 | Affymetrix Inc. | Gene expression and evaluation system |
| US6188783B1 (en) | 1997-07-25 | 2001-02-13 | Affymetrix, Inc. | Method and system for providing a probe array chip design database |
| US6229911B1 (en) | 1997-07-25 | 2001-05-08 | Affymetrix, Inc. | Method and apparatus for providing a bioinformatics database |
| US6223127B1 (en) | 1997-08-15 | 2001-04-24 | Affymetrix, Inc. | Polymorphism detection utilizing clustering analysis |
| US6033860A (en) | 1997-10-31 | 2000-03-07 | Affymetrix, Inc. | Expression profiles in adult and fetal organs |
| US6013449A (en) | 1997-11-26 | 2000-01-11 | The United States Of America As Represented By The Department Of Health And Human Services | Probe-based analysis of heterozygous mutations using two-color labelling |
| US6090555A (en) | 1997-12-11 | 2000-07-18 | Affymetrix, Inc. | Scanned image alignment systems and methods |
| WO1999036760A1 (en) | 1998-01-13 | 1999-07-22 | Genetic Microsystems, Inc. | Depositing fluid specimens on substrates, resulting ordered arrays, techniques for analysis of deposited arrays |
| US6269846B1 (en) | 1998-01-13 | 2001-08-07 | Genetic Microsystems, Inc. | Depositing fluid specimens on substrates, resulting ordered arrays, techniques for deposition of arrays |
| US6185030B1 (en) | 1998-03-20 | 2001-02-06 | James W. Overbeck | Wide field of view and high speed scanning microscopy |
| US6201639B1 (en) | 1998-03-20 | 2001-03-13 | James W. Overbeck | Wide field of view and high speed scanning microscopy |
| WO1999047964A1 (en) | 1998-03-20 | 1999-09-23 | Genetic Microsystems, Inc. | Wide field of view and high speed scanning microscopy |
| US6020135A (en) | 1998-03-27 | 2000-02-01 | Affymetrix, Inc. | P53-regulated genes |
| US5936324A (en) | 1998-03-30 | 1999-08-10 | Genetic Microsystems Inc. | Moving magnet scanner |
| US6428752B1 (en) | 1998-05-14 | 2002-08-06 | Affymetrix, Inc. | Cleaning deposit devices that form microarrays and the like |
| US6185561B1 (en) | 1998-09-17 | 2001-02-06 | Affymetrix, Inc. | Method and apparatus for providing and expression data mining database |
| US6262216B1 (en) | 1998-10-13 | 2001-07-17 | Affymetrix, Inc. | Functionalized silicon compounds and methods for their synthesis and use |
| US6361947B1 (en) | 1998-10-27 | 2002-03-26 | Affymetrix, Inc. | Complexity management and analysis of genomic DNA |
| US6177248B1 (en) | 1999-02-24 | 2001-01-23 | Affymetrix, Inc. | Downstream genes of tumor suppressor WT1 |
| WO2000058516A2 (en) | 1999-03-26 | 2000-10-05 | Whitehead Institute For Biomedical Research | Universal arrays |
| US6300070B1 (en) | 1999-06-04 | 2001-10-09 | Mosaic Technologies, Inc. | Solid phase methods for amplifying multiple nucleic acids |
| US6218803B1 (en) | 1999-06-04 | 2001-04-17 | Genetic Microsystems, Inc. | Position sensing with variable capacitance transducers |
| US6386749B1 (en) | 2000-06-26 | 2002-05-14 | Affymetrix, Inc. | Systems and methods for heating and mixing fluids |
| US6391592B1 (en) | 2000-12-14 | 2002-05-21 | Affymetrix, Inc. | Blocker-aided target amplification of nucleic acids |
| US20040063120A1 (en) * | 2002-07-10 | 2004-04-01 | The Regents Of The University Of Michigan | Expression profile of lung cancer |
| US20050266409A1 (en) * | 2003-02-04 | 2005-12-01 | Wyeth | Compositions and methods for diagnosing, preventing, and treating cancers |
| WO2005000098A2 (en) * | 2003-06-10 | 2005-01-06 | The Trustees Of Boston University | Detection methods for disorders of the lung |
Non-Patent Citations (79)
| Title |
|---|
| "Using Antibodies: A Laboratory Manual, Cells: A Laboratory Manual, PCR Primer: A Laboratory Manual, and Molecular Cloning: A Laboratory Manual", vol. I-IV, COLD SPRING HARBOR LABORATORY PRESS, article "Genome Analysis: A Laboratory Manual Series" |
| 7.5 IMMUNOPHENOTYPE OF THE NASAL MUCOSA IN SARCOIDOSIS, pages A795 |
| AM. J. RESPIR. CELL MOL. BIOL., vol. 31, 2004, pages 601 |
| BALCIUNAITE E; SPEKTOR A; LENTS NH; CAM H; TE RIELE H; SCIME A; RUDNICKI MA; YOUNG R; DYNLACHT BD: "Pocket protein complexes are recruited to distinct targets in quiescent and proliferating cells", MOL CELL BIOL, vol. 25, no. 18, 2005, pages 8166 - 8178 |
| BARRINGER ET AL., GENE, vol. 89, 1990, pages 117 |
| BERG ET AL.: "Biochemistry, 51h Ed.,", 2002, W.H. FREEMAN PUB. |
| BERGER; KIMMEL: "Guide to Molecular Cloning Techniques", vol. 152, 1987, ACADEMIC PRESS, INC., article "Methods in Enzymology" |
| BERNARD ET AL., NUCLEIC ACIDS RESEARCH, vol. 24, no. 8, 1996, pages 1435 - 42 |
| BOSATRA A; BUSSANI R; SILVESTRI F: "From epithelial dysplasia to squamous carcinoma in the head and neck region: an epidemiological assessment", ACTA OTOLARYNGOL, vol. 527, 1997, pages 49 - 51 |
| CARDOSA SV; BARBOSA HM; CANDELLORI IM; LOYOLA AM; AGUIAR MC: "Prognostic impact of metallothionein on oral squamous cell cancer", VIRCHOWS ARCHIVE, vol. 441, no. 2, 2002, pages 174 - 178 |
| CEDER 0; VAN DIJKEN J; ERICSON T; KOLLBERG J: "Ribonuclease in different types of saliva from cystic fibrosis patients", ACTA PAEDIATR. SCAND, vol. 74, 1985, pages 102 - 104 |
| CLINICAL CANCER RESEARCH, vol. 5, 1999, pages 2025 |
| D.M. SERLIN; MD, X.F.; LI, PHD; J. SPIEGEL; MD, K.; STEILING, MD; C.J. O'HARA, MD; A. SPIRA, MD; A.W. O'REGAN, MD; J.S. BERMAN, MD, ATS, 2006 |
| DEMEDTS INGEL K; DEMOOR TINE; BRACKE KEN R; JOOS GUY F; BRUSSELLE GUY G: "Role of apoptosis in the pathogenesis of COPD and pulmonary emphysema", RESPIRATORY RESEARCH, BIOMED CENTRAL LTD., LONDON, GB, vol. 7, no. 1, 30 March 2006 (2006-03-30), GB, pages 53, XP021013332, ISSN: 1465-9921, DOI: 10.1186/1465-9921-7-53 |
| DING CHUNMING , CANTOR CHARLES R: "A high-throughput gene expression analysis technique using competitive PCR and matrix-assisted laser desorption ionization time-of-flight MS.", PROCEEDINGS OF THE NATIONAL ACADEMY OF SCIENCES OF THE UNITED STATES OF AMERICA, NATIONAL ACADEMY OF SCIENCES, US, vol. 100, no. 6, 18 March 2003 (2003-03-18), US, pages 3059 - 3064, XP002556773, ISSN: 0027-8424, DOI: 10.1073/pnas.0630494100 |
| DING ET AL., PNAS, vol. 100, 2003, pages 3059 - 64 |
| DONG ET AL., GENOME RESEARCH, vol. 11, 2001, pages 1418 |
| DORIS ET AL., J. CHROMATOGR. A, vol. 806, no. 1, 8 May 1998 (1998-05-08), pages 47 - 60 |
| ECKERT ET AL.: "PCR Methods and Applications 1", 1991, pages: 17 |
| FRANKLIN WILBUR A, ET AL: "Widely dispersed p53 mutation in respiratory epithelium. A novel mechanism for field carcinogenesis", JOURNAL OF CLINICAL INVESTIGATION, B M J GROUP, GB, vol. 100, no. 8, 1 January 1997 (1997-01-01), GB, pages 2133 - 2137, XP002628922, ISSN: 0021-9738, DOI: 10.1172/JCI119748 |
| GAIT: "Oligonucleotide Synthesis: A Practical Approach", 1984, IRL PRESS |
| GEBEL STEPHAN ET AL: "Gene expression profiling in respiratory tissues from rats exposed to mainstream cigarette smoke.", CARCINOGENESIS FEB 2004, vol. 25, no. 2, February 2004 (2004-02-01), pages 169 - 178, XP002454389, ISSN: 0143-3334 * |
| GUAJARDO JR; SCHLEIFER KW; DAINES MO; RUDDY RM; ARONOW BJ; WILLS-KARP M; HERSHEY GK: "Altered gene expression profiles in nasal respiratory epithelium reflext stable versus acute childhood asthma", J ALLERGY CLIN IMMUNOL., 2005 |
| GUATELLI ET AL., PROC. NAT. ACAD. SCI. USA, vol. 87, 1990, pages 1874 |
| H.A. ERLICH,: "PCR Technology: Principles and Applications for DNA Amplification", 1992, FREEMAN PRESS |
| HARLOW; LANE: "Antibodies, A Laboratory Manual", 1988, COLD SPRING HARBOR LABORATORY |
| HOLLAND ET AL., PROC NATL ACAD SCI USA, vol. 88, 1991, pages 7276 - 7280 |
| INNIS, ET AL.,: "PCR Protocols: A Guide to Methods and Applications", 1990, ACADEMIC PRESS |
| JUN HU XUE; GEMMA AKIHIKO; HOSOYA YOKO; MATSUDA KUNIKO; NARA MICHIYA; HOSOMI YUKIO; OKANO TETSUYA; KURIMOTO FUTOSHI; SEIKE MASAHIR: "Reduced transcription of the RB2/p130 gene in human lung cancer.", MOLECULAR CARCINOGENESIS, JOHN WILEY & SONS, INC., US, vol. 38, no. 3, 1 November 2003 (2003-11-01), US, pages 124 - 129, XP002548119, ISSN: 0899-1987, DOI: 10.1002/mc.10152 |
| KATSURAGI H; HASEGAWA A; SAITO K: "Distribution ofmetallothionein in cigarette smokers and nonsmokers in advanced periodontitis patients", JOURNAL OF PERIODONTOLOGY, vol. 68, no. 10, 1997, pages 1005 - 9 |
| KHARCHENKO SV; SHPAKOV AA: "Regulation of the RNase activity of saliva in healthy subjects and in stomach cancer", INZ AKAD NAUK SSSR BIOL, vol. 1, 1989, pages 58 - 63 |
| KIM, J.H. SHERMAN, M.E. CURRIERO, F.C. GUENGERICH, F.P. STRICKLAND, P.T. SUTTER, T.R.: "Expression of cytochromes P450 1A1 and 1B1 in human lung from smokers, non-smokers, and ex-smokers", TOXICOLOGY AND APPLIED PHARMACOLOGY, ACADEMIC PRESS, AMSTERDAM, NL, vol. 199, no. 3, 15 September 2004 (2004-09-15), AMSTERDAM, NL, pages 210 - 219, XP004566322, ISSN: 0041-008X, DOI: 10.1016/j.taap.2003.11.015 |
| KWOH ET AL., PROC. NATL. ACAD. SCI. USA, vol. 86, 1989, pages 1173 |
| LANDEGREN ET AL., SCIENCE, vol. 241, 1988, pages 1077 |
| LI Y, ET AL: "Salivary transcriptome diagnostics for oral cancer detection", CLINICAL CANCER RESEARCH, & MEETING OF THE AMERICAN-ASSOCIATION-FOR-CANCER-RESEARCH (AACR) PRECISION MEDICINE SERIES - INTEGRATI; SALT LAKE, UT, USA; JUNE 13 -16, 2015, vol. 10, no. 24, 15 December 2004 (2004-12-15), & MEETING OF THE AMERICAN-ASSOCIATION-FOR-CANCER-RESEARCH (AACR) PRECISION MEDICINE SERIES - INTEGRATI; SALT LAKE, UT, USA; JUNE 13 -16, 2015, pages 8442 - 8450, XP002448846, ISSN: 1078-0432, DOI: 10.1158/1078-0432.CCR-04-1167 |
| LI Y; ZHOU X; ST JOHN M A R; WONG D T W: "RNA profiling of cell-free saliva using microarray technology.", JOURNAL OF DENTAL RESEARCH, INTERNATIONAL ASSOCIATION FOR DENTAL RESEARCH, US, vol. 83, no. 3, 1 March 2004 (2004-03-01), US, pages 199 - 203, XP009119522, ISSN: 0022-0345, DOI: 10.1177/154405910408300303 |
| LORO, L.L. JOHANNESSEN, A.C. VINTERMYR, O.K.: "Decreased expression of bcl-2 in moderate and severe oral epithelia dysplasias", ORAL ONCOLOGY, ELSEVIER SCIENCE, OXFORD, GB, vol. 38, no. 7, 1 October 2002 (2002-10-01), GB, pages 691 - 698, XP004375949, ISSN: 1368-8375, DOI: 10.1016/S1368-8375(02)00002-7 |
| M. PELUSO: "Comparison of DNA adduct levels in nasal mucosa, lymphocytes and bronchial mucosa of cigarette smokers and interaction with metabolic gene polymorphisms", CARCINOGENESIS, vol. 25, no. 12, 24 June 2004 (2004-06-24), pages 2459 - 2465, XP055060529, DOI: 10.1093/carcin/bgh259 * |
| MANIATIS ET AL.: "Molecular Cloning: A Laboratory Manual (2nd Ed.", 1989, COLD SPRING HARBOR |
| MATTILA ET AL., NUCLEIC ACIDS RES., vol. 19, 1991, pages 4967 |
| MCPHERSON ET AL.,: "PCR", IRL PRESS |
| MISHINA T , DOSAKA-AKITA H, HOMMURA F, ET AL: "Cyclin E expression, a potential prognostic marker for non-small cell lung cancers.", CLINICAL CANCER RESEARCH, & MEETING OF THE AMERICAN-ASSOCIATION-FOR-CANCER-RESEARCH (AACR) PRECISION MEDICINE SERIES - INTEGRATI; SALT LAKE, UT, USA; JUNE 13 -16, 2015, vol. 6, no. 1, 1 January 2000 (2000-01-01), & MEETING OF THE AMERICAN-ASSOCIATION-FOR-CANCER-RESEARCH (AACR) PRECISION MEDICINE SERIES - INTEGRATI; SALT LAKE, UT, USA; JUNE 13 -16, 2015, pages 11 - 16, XP002619173, ISSN: 1078-0432 |
| NELSON; COX: "Lehninger, Principles of Biochemistry 3d Ed.,", 2000, W.H. FREEMAN PUB. |
| OUELETTE; BZEVANIS: "Bioinformatics: A Practical Guide for Analysis of Gene and Proteins, 2nd ed.,", 2001, WILEY & SONS, INC. |
| PARTRIDGE, M. EMILION, G. PATEROMICHELAKIS, S. PHILLIPS, E. LANGDON, J.: "Field Cancerisation of the Oral Cavity: Comparison of the Spectrum of Molecular Alterations in Cases Presenting with Both Dysplastic and Malignant Lesions", ORAL ONCOLOGY, ELSEVIER SCIENCE, OXFORD, GB, vol. 33, no. 5, 1 September 1997 (1997-09-01), GB, pages 332 - 337, XP004286429, ISSN: 1368-8375 |
| PHILLIPS DE; HILL L; WELLER M; WILLETT M; BAKEWELL R.: "R Tobacco smoke and the upper airway", CLIN. OTOLOARYNGOL., vol. 28, 2003, pages 492 - 496 |
| POWELL CA; KLARES S; O'CONNOR G; BRODY JS: "Loss of Heterozygosity in Epithelial Cells Obtained by Bronchial Brushing: Clinical Utility in Lung Cancer", CLINICAL CANCER RESEARCH, vol. 5, 1999, pages 2025 - 2034 |
| RASHIDI; BUEHLER: "Bioinformatics Basics: Application in Biological Science and Medicine", 2000, CRC PRESS |
| RUSZNAK C; MILLS P; DEVALIA J; SAPSFORD R; DAVIES R LOZEWICZ S: "Effect of cigarette smoke on the permeability and IL-lbeta and sICAM-1 release from cultured human bronchial epithelial cells of never-smokers, smokers, and patients with chronic obstructive pulmonary disease", AMERICAN JOURNAL OF RESPIRATORY AND MOLECULAR CELL BIOLOGY, vol. 23, 2000, pages 530 - 536 |
| SALZBERG, SEARLES, KASIF,: "Computational Methods in Molecular Biology", 1998, ELSEVIER |
| SASAKI, H. MORIYAMA, S. NAKASHIMA, Y. KOBAYASHI, Y. KIRIYAMA, M. FUKAI, I. YAMAKAWA, Y. FUJII, Y.: "Histone deacetylase 1 mRNA expression in lung cancer", LUNG CANCER., ELSEVIER, AMSTERDAM., NL, vol. 46, no. 2, 1 November 2004 (2004-11-01), NL, pages 171 - 178, XP004594550, ISSN: 0169-5002, DOI: 10.1016/j.lungcan.2004.03.021 |
| SETUBAL; MEIDANIS ET AL.: "Introduction to Computational Biology Methods", 1997, PWS PUBLISHING COMPANY |
| SHALON ET AL., GENOME RESEARCH, vol. 6, no. 7, 1996, pages 639 - 45 |
| SHIELDS, P. G., MOLECULAR EPIDEMIOLOGY OF LUNG CANCER. ANN. ONCOL, vol. 5, 1999, pages 7 - 11 |
| SHINTANI, S. MIHARA, M. NAKAHARA, Y. KIYOTA, A. UEYAMA, Y. MATSUMURA, T. WONG, D.T.W.: "Expression of cell cycle control proteins in normal epithelium, premalignant and malignant lesions of oral cavity", ORAL ONCOLOGY, ELSEVIER SCIENCE, OXFORD, GB, vol. 38, no. 3, 1 April 2002 (2002-04-01), GB, pages 235 - 243, XP004350453, ISSN: 1368-8375, DOI: 10.1016/S1368-8375(01)00048-3 |
| SLAUGHTER D P; SOUTHWICK H W; SMEJKAL W: "Field cancerization in oral stratified squamous epithelium; clinical implications of multicentric origin.", CANCER., AMERICAN CANCER SOCIETY, PHILADELPHIA, PA, US, vol. 6, no. 5, 1 January 1953 (1953-01-01), US, pages 963 - 968, XP009074014, ISSN: 0008-543X, DOI: 10.1002/1097-0142(195309)6:5<963::AID-CNCR2820060515>3.0.CO;2-Q |
| SONI S; KAUR J; KUMAR A; CHAKRAVARTI N; MATHUR M; BAHADUR S; SHUKLA NK; DEO SV; RALHAN R: "Alterations of rb pathway components are frequent events in patients with oral epithelial dysplasia and predict clinical outcome in patients with squamous cell carcinoma", ONCOLOGY, vol. 68, no. 4-6, 2005, pages 314 - 325 |
| SPIRA A; BEANE J; SCHEMBRI F; LIU G; DING C; GILMAN S; YANG X; CANTOR C; BRODY JS: "Noninvasive method for obtaining RNA from buccal mucosa epithelial cells for gene expression profiling", BIOTECHNIQUES, vol. 36, 2004, pages 484 - 497 |
| SPIRA AVRUM ET AL: "Effects of cigarette smoke on the human airway epithelial cell transcriptome", PROCEEDINGS OF THE NATIONAL ACADEMY OF SCIENCES OF THE UNITED STATES OF AMERICA, NATIONAL ACADEMY OF SCIENCES, US, vol. 101, no. 27, 6 July 2004 (2004-07-06), US, pages 10143 - 10148, XP002430521, ISSN: 0027-8424, DOI: 10.1073/pnas.0401422101 |
| SPIRA AVRUM ET AL: "Effects of cigarette smoke on the human airway epithelial cell transcriptome", PROCEEDINGS OF THE NATIONAL ACADEMY OF SCIENCES OF USA, NATIONAL ACADEMY OF SCIENCE, WASHINGTON, DC, US, vol. 101, no. 27, 6 July 2004 (2004-07-06), pages 10143 - 10148, XP002430521, ISSN: 0027-8424 * |
| SPIRA, BIOTECHNIQUES, 2004 |
| SPIRA, PNAS, 2004 |
| SPIVACK SIMON D ET AL: "Gene-environment interaction signatures by quantitative mRNA profiling in exfoliated buccal mucosal cells", CANCER RESEARCH, PROCEEDINGS: AACR 107TH ANNUAL MEETING 2016; APRIL 16-20, 2016; NEW ORLEANS, LA, vol. 64, no. 18, 15 September 2004 (2004-09-15), pages 6805 - 6813, XP002454390, ISSN: 0008-5472, DOI: 10.1158/0008-5472.CAN-04-1771 |
| SPIVACK SIMON D ET AL: "Gene-environment interaction signatures by quantitative mRNA profiling in exfoliated buccal mucosal cells", CANCER RESEARCH, vol. 64, no. 18, 15 September 2004 (2004-09-15), pages 6805 - 6813, XP002454390, ISSN: 0008-5472 * |
| STRYER, L.: "Biochemistry(4th Ed.)", 1995, FREEMAN |
| SUBRAMANIAN ARAVIND ET AL: "Gene set enrichment analysis: a knowledge-based approach for interpreting genome-wide expression profiles.", PROCEEDINGS OF THE NATIONAL ACADEMY OF SCIENCES OF THE UNITED STATES OF AMERICA, NATIONAL ACADEMY OF SCIENCES, US, vol. 102, no. 43, 25 October 2005 (2005-10-25), US, pages 15545 - 15550, XP002464143, ISSN: 0027-8424, DOI: 10.1073/pnas.0506580102 |
| SUDBO J; KILDAL W; RISBERG B; KOPPANG HS; DANIELSEN HE; REITH A: "DNA content as a prognostic marker in patients with oral leukoplakia", N ENGL J MED, vol. 344, no. 17, 2001, pages 1270 - 1278 |
| SUOMALAINEN ET AL., MOL. BIOTECHNOL., vol. 15, no. 2, June 2000 (2000-06-01), pages 123 - 31 |
| THIBERVILLE L; PAYNE P; VIELKINDS J; LERICHE J; HORSMAN D; NOUVET G; PALCIC B; LAM S: "Evidence of cumulative gene losses with progression of premalignant epithelial lesions to carcinoma of the bronchus", CANCER RES, vol. 55, 1995, pages 5133 - 9 |
| VANDESOMPELE JO; DE PRETER KATLEEN; PATTYN FILIP; POPPE BRUCE; VAN ROY NADINE; DE PAEPE ANNE; SPELEMAN FRANK: "Accurate normalization of real-time quantitative RT-PCR data by geometric averaging of multiple internal control genes", GENOME BIOLOGY, BIOMED CENTRAL LTD., LONDON, GB, vol. 3, no. 7, 18 June 2002 (2002-06-18), GB, pages research0034.1 - research0034.11, XP021021149, ISSN: 1465-6906, DOI: 10.1186/gb-2002-3-7-research0034 |
| WHO: THE FACTS ABOUT SMOKING AND HEALTH, 30 May 2006 (2006-05-30), Retrieved from the Internet <URL:http://www.wpro.who.int/media_centre/fact_sheets/fs_20060530.htm> |
| WISTUBA I; LAM S; BEHRENS C; VIRMANI A; FONG KW; LERICHE J; SAMET J; SRIVASTAVA S; MINNA J; GAZDAR A.: "Molecular damage in the bronchial epithelium of current and former smokers", JNCI., vol. 89, no. 18, pages 1366 - 1373 |
| WISTUBA II; LAM S; BEHRENS C; VIRMANI AK; FONG KM; LERICHE J; SAMET JM; SRIVASTAVA S; MINNA JD; GAZDAR AF: "Molecular damage in the bronchial epithelium of current and former smokers", JOURNAL OF THE NATIONAL CANCER INSTITUTE, vol. 89, 1997, pages 1366 - 1373 |
| WRIGHT JM; MERLO CA; REYNOLDS JB; ZEITLIN PL; GARCIA JGN; GUGGINO WB; BOYLE MP.: "Respiratory Epithelial Gene Expression in Patients with Mild and Severe Cystic Fibrosis Lung Disease", AM J RESPIR CELL MOL BIOL, vol. 35, no. 3, 2006, pages 327 - 336 |
| WRIGHT JM; MERLO CA; REYNOLDS JB; ZEITLIN PL; GARCIA JN; GUGGINO WB; BOYLE MP.: "Respiratory epithelial gene expression in patients with mild and severe cystic fibrosis lung disease", AM. J. RESP. CELL BIOLOGY, vol. 35, 2006, pages 327 - 336 |
| WRIGHT, AM J RESPIR CELL MOL BIOL., 2006 |
| WU; WALLACE, GENOMICS, vol. 4, 1989, pages 560 |
| YANG SR; CHIDA AS; BAUTER MR; SHAFIQ N; SEWERYNIAK K; MAGGIRWAR SB; KILTY I; RAHMAN I: "Cigarette smoke induces proinflammatory cytokine release by activation ofNF- kappaB and posttranslational modifications of histone deacetylase in macrophages", AM J PHYSIOL LUNG CELL MOL PHYSIOL., vol. 291, no. 1, 2006, pages 46 - 57 |
| YOUNG; DAVISM, P.N.A.S, vol. 80, 1983, pages 1194 |
Also Published As
| Publication number | Publication date |
|---|---|
| WO2007103541A3 (en) | 2008-01-10 |
| JP2013126427A (en) | 2013-06-27 |
| AU2007223788A1 (en) | 2007-09-13 |
| JP2009529329A (en) | 2009-08-20 |
| US20090061454A1 (en) | 2009-03-05 |
| CA2645310A1 (en) | 2007-09-13 |
| US20110217717A1 (en) | 2011-09-08 |
| EP1999472A2 (en) | 2008-12-10 |
| US20120190567A1 (en) | 2012-07-26 |
| US20200096513A1 (en) | 2020-03-26 |
| US20170328908A1 (en) | 2017-11-16 |
| WO2007103541A2 (en) | 2007-09-13 |
| AU2007223788B2 (en) | 2012-11-29 |
Similar Documents
| Publication | Publication Date | Title |
|---|---|---|
| US20200096513A1 (en) | Diagnostic and prognostic methods for lung disorders using gene expression profiles from nose epithelial cells | |
| US10808285B2 (en) | Diagnostic for lung disorders using class prediction | |
| US20200248274A1 (en) | Diagnostic for lung disorders using class prediction | |
| Kantola et al. | Prognostic factors in tongue cancer–relative importance of demographic, clinical and histopathological factors | |
| Borczuk et al. | Molecular signatures in biopsy specimens of lung cancer | |
| Geisler et al. | p16 and p53 Protein expression as prognostic indicators of survival and disease recurrence from head and neck cancer | |
| EP2327795B1 (en) | Detection methods for disorders of the lung | |
| US20200405225A1 (en) | Methods and systems for identifying or monitoring lung disease | |
| JP6696974B2 (en) | Method for detecting early lung cancer by determining DNA methylation phenotype of sputum-derived cells | |
| US20150275307A1 (en) | Compositions and methods for detecting sessile serrated adenomas/polyps | |
| Laudanski et al. | Prognostic significance of p53 and bcl-2 abnormalities in operable non-small cell lung cancer | |
| US20020004206A1 (en) | Methods of screening for disease | |
| Kennedy et al. | Using molecular markers in sputum for the early detection of lung cancer: a review | |
| Mohammed et al. | Evaluation of Methylation Panel in the Promoter Region of p16INK4a, RASSF1A, and MGMT as a Biomarker in Sputum for Lung Cancer | |
| Nishii et al. | Discrepancy Between Clinical Diagnosis and Whole-exome Sequencing-based Clonality Analysis of Synchronous Multiple Oral Cancers | |
| Mohammed et al. | Evaluation of Methylation Panel in the Promoter Region of as a Biomarker p 16INK4a, RASSF1A, and MGMT in Sputum for Lung Cancer. | |
| CN108588223A (en) | The quantitatively primer and probe of detection S100A16 gene expressions and its application | |
| WO2004108953A1 (en) | Method of diagnosing cancer and method of judging cancer risk | |
| Spiral | Scientific Symposium Screening and prevention of lung cancer |
Legal Events
| Date | Code | Title | Description |
|---|---|---|---|
| PUAI | Public reference made under article 153(3) epc to a published international application that has entered the european phase |
Free format text: ORIGINAL CODE: 0009012 |
|
| AC | Divisional application: reference to earlier application |
Ref document number: 1999472 Country of ref document: EP Kind code of ref document: P |
|
| AK | Designated contracting states |
Kind code of ref document: A1 Designated state(s): AT BE BG CH CY CZ DE DK EE ES FI FR GB GR HU IE IS IT LI LT LU LV MC MT NL PL PT RO SE SI SK TR |
|
| 17P | Request for examination filed |
Effective date: 20131219 |
|
| RBV | Designated contracting states (corrected) |
Designated state(s): AT BE BG CH CY CZ DE DK EE ES FI FR GB GR HU IE IS IT LI LT LU LV MC MT NL PL PT RO SE SI SK TR |
|
| 17Q | First examination report despatched |
Effective date: 20140422 |
|
| STAA | Information on the status of an ep patent application or granted ep patent |
Free format text: STATUS: EXAMINATION IS IN PROGRESS |
|
| STAA | Information on the status of an ep patent application or granted ep patent |
Free format text: STATUS: EXAMINATION IS IN PROGRESS |
|
| APBK | Appeal reference recorded |
Free format text: ORIGINAL CODE: EPIDOSNREFNE |
|
| APBN | Date of receipt of notice of appeal recorded |
Free format text: ORIGINAL CODE: EPIDOSNNOA2E |
|
| APBR | Date of receipt of statement of grounds of appeal recorded |
Free format text: ORIGINAL CODE: EPIDOSNNOA3E |
|
| APAF | Appeal reference modified |
Free format text: ORIGINAL CODE: EPIDOSCREFNE |
|
| APAF | Appeal reference modified |
Free format text: ORIGINAL CODE: EPIDOSCREFNE |
|
| P01 | Opt-out of the competence of the unified patent court (upc) registered |
Effective date: 20230524 |